| Newer Posts | Older Posts |
Is the current surge in home sales a (dangerous) repeat of the past? |
|
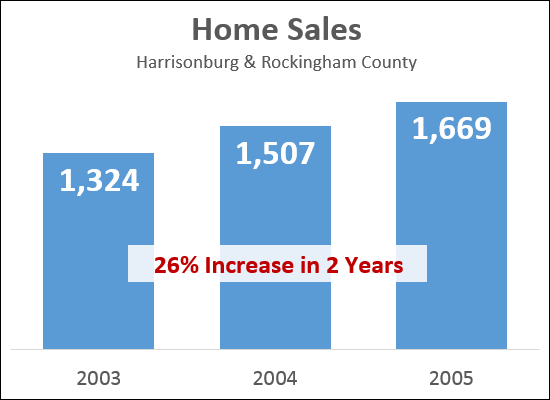 We saw a surge in home sales back in 2003-2005 (and beyond) with a 26% increase in the pace of sales in a two year period. Let's see how that compares to more recent years.... 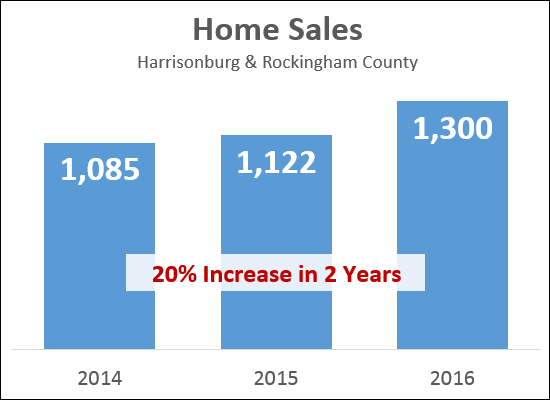 As shown above, if we finish out 2016 with 1300 home sales (which seems likely) we will have seen a (somewhat) similar surge in home sales with a 20% increase over a two year period. Hmmmm --- should we be worried? After the real estate boom of the early 2000's, we saw a significant bust. Let's look further.... 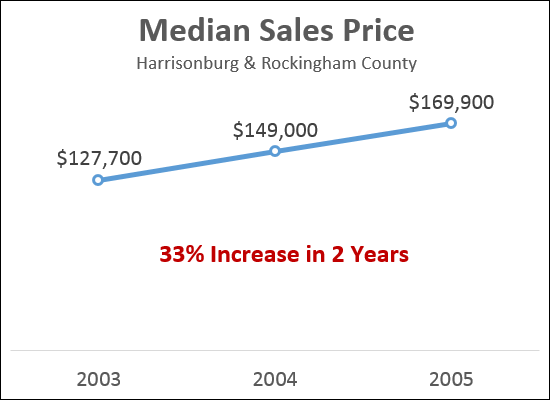 As shown above, between 2003 and 2005, home prices were increasing RAPIDLY -- with a 33% increase in a two year period. This, it turned out (surprise, surprise) was NOT sustainable. Family income was not increasing by 33% in that same two year period, so families (and individuals) were spending a greater and greater share of their income on housing. This rapid increase in prices was a large contributing factor to why prices (and the pace of sales) then started to decline in 2007 +/-. So, are we seeing that same rapid run up in prices? 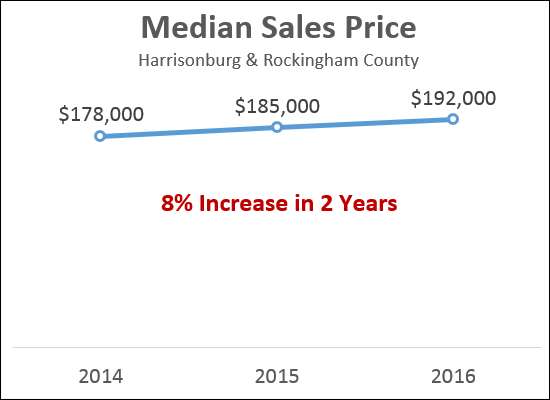 And --- no! Which is GOOD news! We have only seen a 8% increase in the median sales price over the past two years, which I believe means that the recent increase in the pace of sales is not an indicator that this is a boom that will be followed by a bust. What's your take on this data? Email me at scott@HarrisonburgHousingToday.com with your thoughts or questions. | |
Are home sales increasing (too?) quickly, or just catching up? |
|
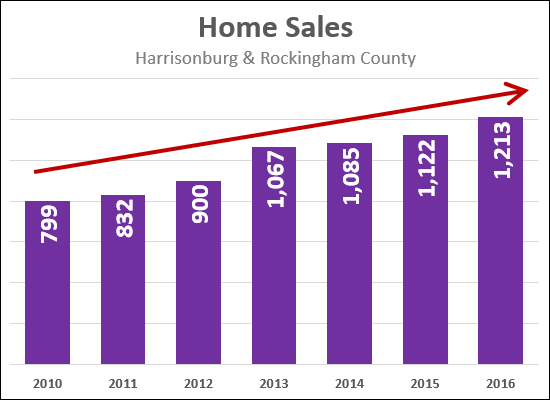 Some folks would look at home sales over the past seven years (shown above) and comment that home sales are increasing at a very fast pace -- showing a 52% increase since 2010 -- or around 9% per year. Of note -- this is not even including December 2016 home sales, so the rate of increase would be even a bit higher. 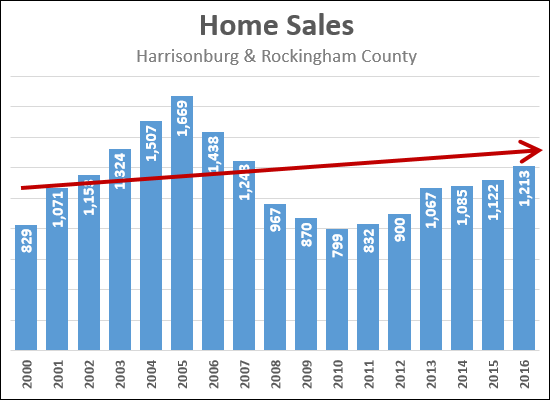 Others would look at home sales over the past 16 years (shown above) and comment that home sales have only had a small net increase over time -- and that the increases we have seen over the past seven years have been catching us back up to a normal amount of buyers buying in any given year. I tend to fall into the second group. I believe that a "normal" (or "typical"?) number of buyers were buying in 2001/2002 -- and that we started to see the housing boom (loose lending standards, irrational buying craze) starting in 2003. If that is the case, then we have barely seen a net increase between 2001/2002 and 2016. If we round this year (2016) up to 1300 home sales (to include December), and we average 2001/2002 to come up with 1112 home sales, then we have seen a 17% increase in sales over the past 14 years -- or an average of a 1.2% increase per year. Then, let's put it in the context of population growth.... 2001 Population Estimates per the Weldon Cooper Center....
2015 Population Estimates per the Weldon Cooper Center....
As shown above, we've seen a 20.7% increase in population in this 14 years timespan, or an average of 1.5% per year. So, in a 14 year timespan, we've seen a 1.5% average annual increase in population as well as a 1.2% average annual increase in home sales. That seems to be a reasonable growth in home sales -- perhaps even with some further upside potential for further increases. As such, if we do see 1300 home sales this year, I think we are likely to see at least the same number next year. | |
How do higher mortgage interest rates affect monthly payments? |
|
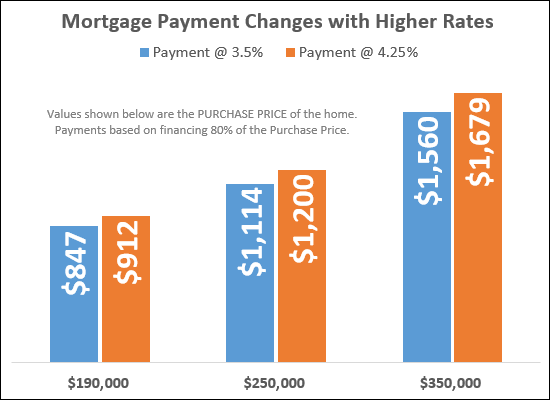 Just after the election, mortgage interest rates started rising. They started around 3.5%, and have since climbed to somewhere between 4.25% and 4.3%. It seems unlikely that they will come back own anytime soon -- if ever. So, what do these new mortgage interest rates mean for home buyers? Well, higher mortgage payments, naturally. The graph above shows the potential change in a monthly mortgage payment for a median priced home ($190K) as well as a home priced at $250K and $350K. The payment scenarios above assume that you are financing 80% of the purchase price -- and yes, I know, plenty of folks are really financing 90% or 95% of the purchase price. If you are financing a greater portion of the purchase price, the monthly payment will be higher, and the increase in the monthly payment will be greater. As you can see above.....
As always -- for actual payment scenarios, you'll need to consult a mortgage lender. Shoot me an email (scott@HarrisonburgHousingToday.com) and I can make some recommendations. | |
More than half of buyers in our area spend less than $200K on a home |
|
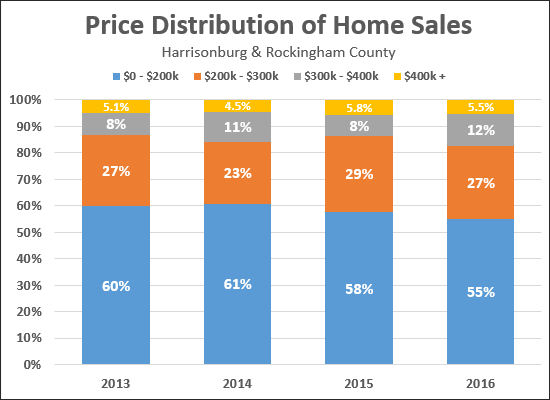 I thought we might actually see more change in these figures over time than we do see when looking at the data. The graph above shows the percentage of buyers (for this year and the three prior years) who purchase in each of the four main price ranges that I analyze each month. A few observations....
You can find out more about the Harrisonburg and Rockingham County real estate market by visiting.... | |
Have all price ranges seen equivalent changes in inventory levels? |
|
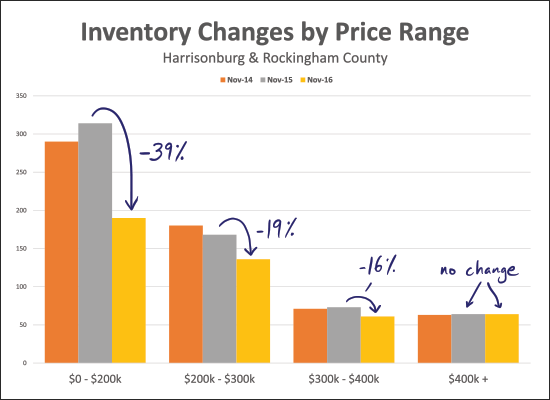 Indeed -- inventory levels are falling -- there aren't nearly as many homes on the market now as there were a year ago. In fact, over the past year, we have seen a 27% decline in the number of homes for sale in Harrisonburg and Rockingham County. However -- not all price ranges are created equal. As shown above, the most significant declines in inventory levels has been in the "under $200K" market, where there has been a 39% decline over the past year. The "over $400K" market, in contrast, has seen no change in the past year in the number of homes for sale. You can find out more about the Harrisonburg and Rockingham County real estate market by visiting....  | |
New home sales are increasing, but is it happening fast enough? |
|
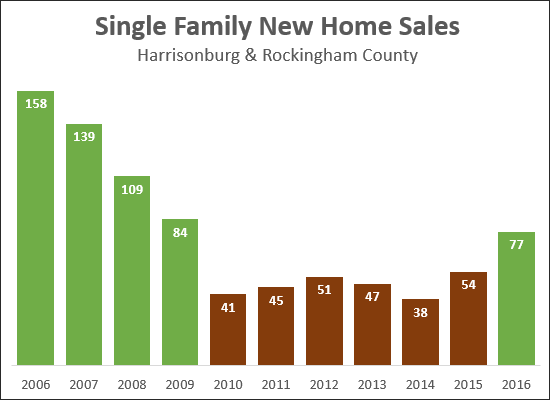 After six years of rather stagnant new home sales (41-54 per year) between 2010 and 2015, we are finally starting to see more new home sales in 2016. The graph above shows the number of new single family homes are sold through the MLS for each of the past 10 years. As you can see, we may get close to returning to 2009 sales levels depending on how many closings take place this December. Beyond being excited that these sales are increasing, I am also wondering if they are increasing "fast enough" relative to the inventory shortages we are experiencing. The pace of home sales is increasing, the inventory of homes available for sale is decreasing. One of the only ways for our market to meet this increasing demand for homes is for more home builders to start building spec homes again. I am hopeful we will see more (reasonably priced) spec homes being built in Harrisonburg and Rockingham County during 2017. You can find out more about the Harrisonburg and Rockingham County real estate market by visiting....  | |
After three years of stagnation, single family home sales are increasing again |
|
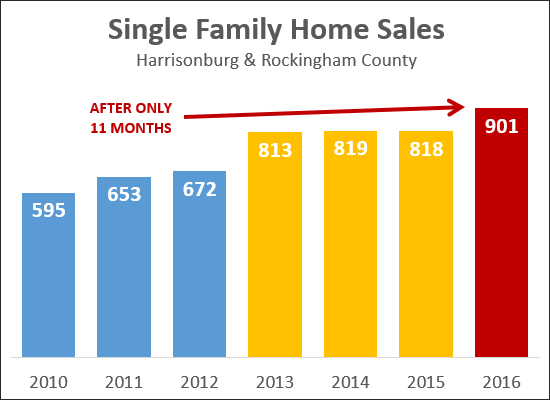 Single family home sales are often one of the best indications of the health of a local real estate market, as compared to analyzing ALL home sales, because almost all of them are being purchased by owner occupants. When viewing trends for ALL residential properties, we are including townhouses and condos -- some of which are being purchased by investors -- which means that trends in overall residential sales can be unduly affected by how many investors are buying investment properties. All that said, if the pace of ALL residential sales is increasing, largely due to investor involvement, it can still mean that a market is healthy -- but we must remember that those investor purchasers may not be present in future years, which could lower the pace of overall residential sales. So, with that as the context, it is interesting (exciting?) to notice that the pace of single family home sales were stagnant over the past three years (2013, 2014, 2015), but has now started to increase in 2016. And in fact, the 901 sales shown above only includes the first 11 months of the year. Bottom line -- more owner occupants seem to be purchasing on an annual basis, which is the sign of a healthy and growing local real estate market! You can find out more about the Harrisonburg and Rockingham County real estate market by visiting....  | |
When was the last time we saw more than 1300 home sales in a year? |
|
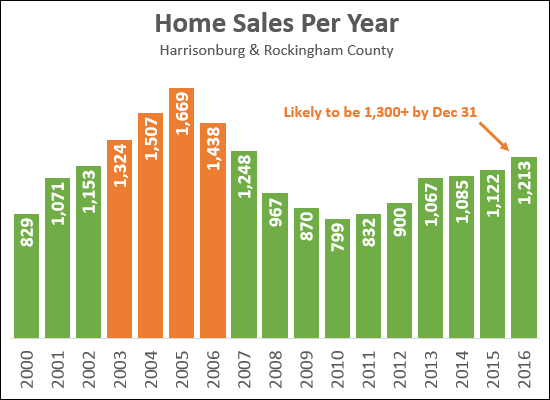 So.....it seems that we'll likely see a total of 1300 (!!!) home sales in 2016. That is based on the 1213 sales we've seen thus far in the first eleven months of 2016 -- and the fact that 93 properties that went under contract in November. If we do, in fact, hit that 1300 number -- it will be the first time that we've seen that many home sales in a single year since waaaaay back in 2006. In fact, as far as I can tell (I only have data since 2000, but I'm thinking 1999 and prior were slower) there have only been four years, ever, when we have seen 1300+ home sales in Harrisonburg and Rockingham County. We saw those figures in 2003, 2004, 2005 and 2006, as shown above. In coming days, I'll take a look at why we should (or should not) be worried about another real estate "boom" locally. Until then, you can find out more about the Harrisonburg and Rockingham County real estate market by visiting....  | |
Just how crazy were November 2016 home sales? |
|
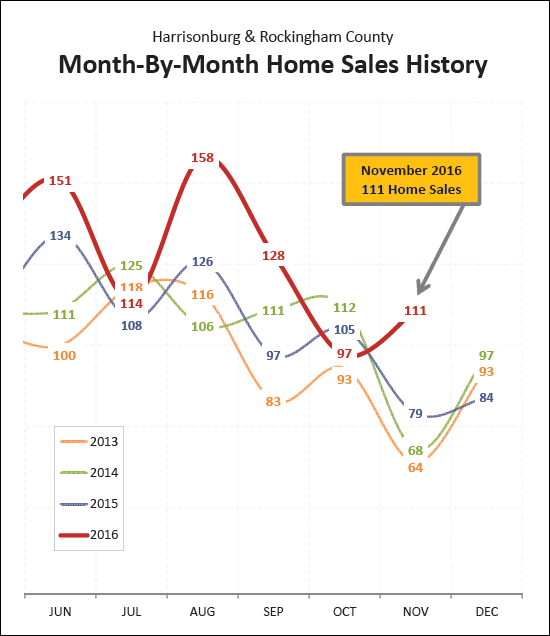
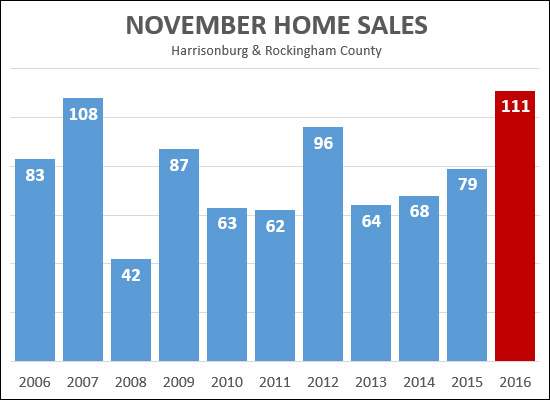 Let's go with "super-crazy" or "like-never-seen-before-in-the-past-10-years-crazy".... There were 111 home sales in November 2016. That is well more than seen in the three most recent months of November (2013, 2014, 2015) when we saw an average of 70 sales per month. In fact, if we look back over the past 10 (!!) years, there isn't even a month of November when there were 111 (or more) home sales in Harrisonburg and Rockingham County. The closest we came was in 2007 (real estate boom) when there were 108 home sales. In coming days, I'll take a look at why we should (or should not) be worried about another real estate "boom" locally. Until then, you can find out more about the Harrisonburg and Rockingham County real estate market by visiting....  | |
Home Sales Surge, Prices Rise, Inventory Drops in November 2016 |
|
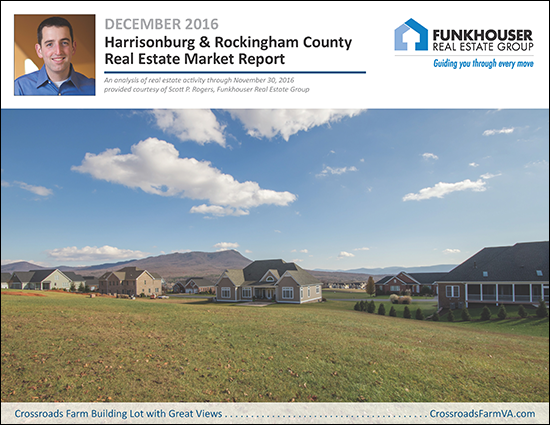 Learn more about this month's featured property: 130 Bedford Place I just published my monthly report on the Harrisonburg and Rockingham County real estate market. Jump to the full online market report, download the PDF, or read on for highlights.... First, let's take a look at the overall market performance in November.... 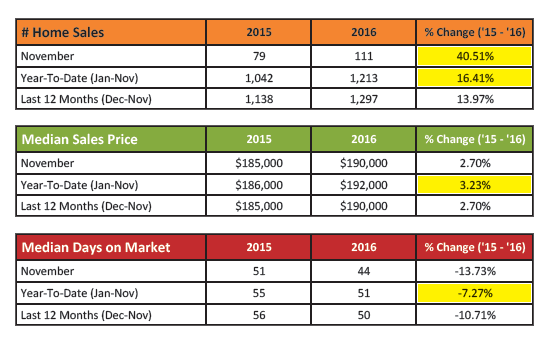 As shown above, it was a very strong month of sales performance in November. Here are a few highlights....
So, how is the overall year doing compared to previous years.... 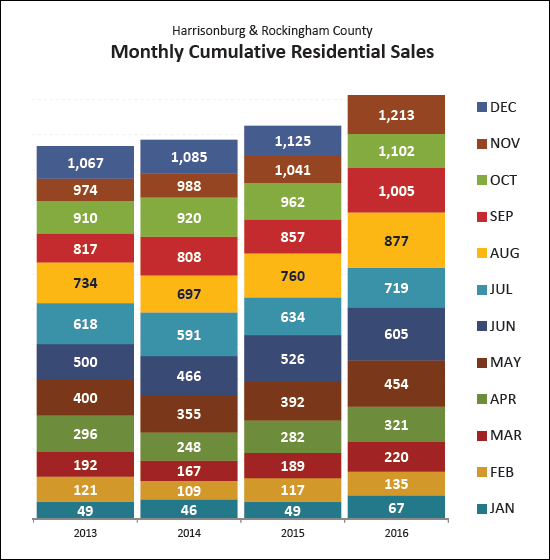 We have already seen more home sales in the first eleven months of 2016 than we saw in the full year of 2013, 2014 and 2015. At this point, we seem likely to finish out 2016 with more than 1,300 home sales! 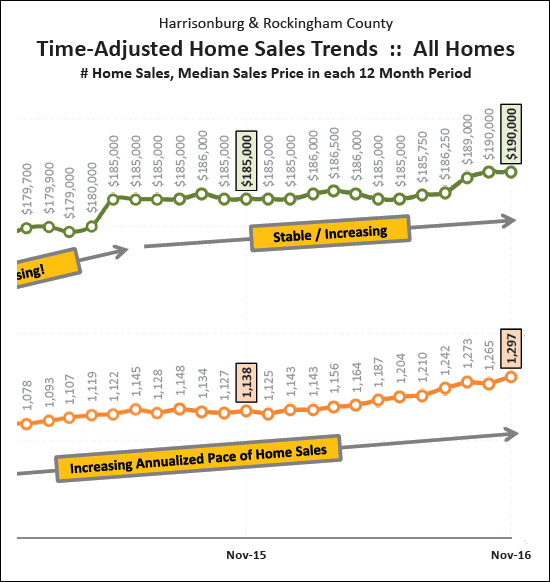 The graph above looks at a rolling 12-month window of sales data, showing the slow and steady progress we have made climbing to almost 1300 sales per year, and increasing (very recently) to a median sales price of $190,000. As demand increases (more buyers) prices start to increase if there is not more supply (more sellers) to meet that demand. Speaking of the supply of homes for sale.... 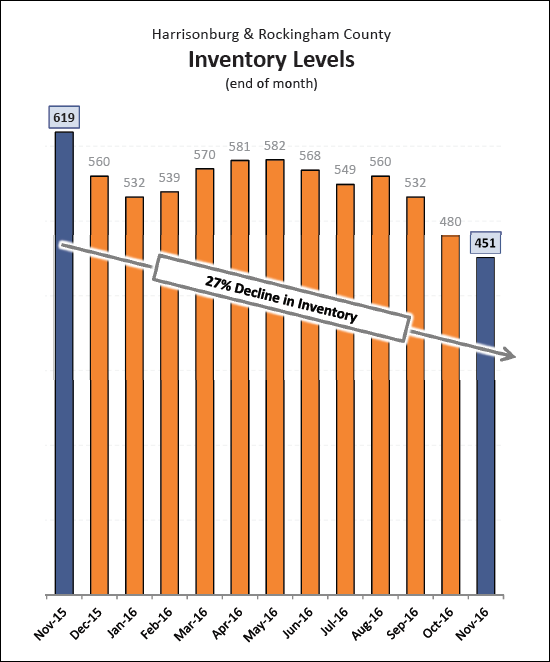 As mentioned above, increased demand (buyers) without increased supply (sellers) leads to increases in prices. Well, as shown directly above, we have certainly not been seeing an increasing supply of homes for sale -- in fact, we have seen a 27% decline in home sellers over the past year! To meet the increasing supply, we need more current homeowners to be selling, as well as more new construction to take place. 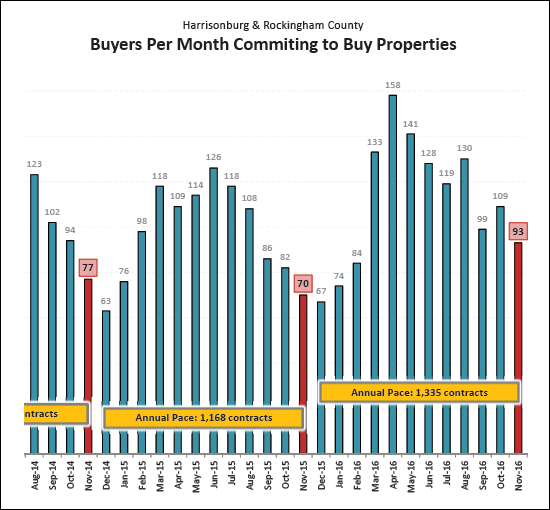 And -- guess what -- home sales are not likely to slow down much in December 2016, based on the 93 contracts signed during November 2016 -- which marks a 33% increase over the 70 contracts signed in November 2015. OK, there is plenty more to explore, such as....
But -- I'll let you read all about those tidbits via my full online market report, or by downloading the PDF, or by clicking here to sign up to receive my real estate blog by email. And -- as is always my encouragement -- if you will be buying or selling a home in the near future, start learning about our local housing market sooner rather than later! Being informed will allow you to make better real estate decisions. | |
Inventory Declines 38% YOY Under $200K |
|
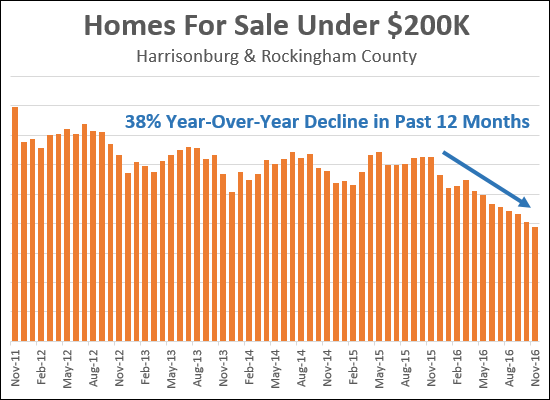 We have established that there aren't many homes for sale right now, but the under $200K market has seen some of the largest changes in inventory levels. As shown above, the 194 homes for sale under $200K right now marks a 38% decline over the 314 homes that were sale at this same time one year ago. I think we need to see some further new construction under $200K (and in some other price ranges) to help with these low inventory levels. Re-sale homes alone are not going to cure declining inventory levels. | |
Impressive Contract Pace in November 2016 |
|
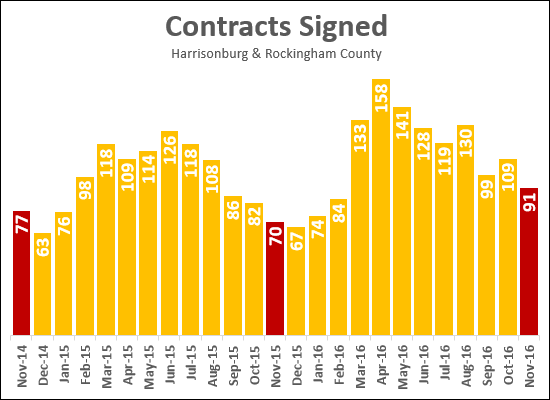 Here's a bit of a sneak peak at my upcoming market report which will be published next week. The graph above shows the number of contracts signed per month over the past two years. As you can see, there were 91 contracts signed this November -- as compared to only 70 and 77 in the two previous Novembers. This bodes well for continued strong sales (closings) into December 2016. | |
Fewer and Fewer Homes for Sale in Harrisonburg, Rockingham County |
|
 I am not kidding around when I tell my buyer clients that there have never been fewer options of homes to buy than RIGHT NOW! I have been tracking housing inventory since February 2008, and we have never (NEVER) seen inventory levels this low. There are currently only 468 homes for sale. Oh, and the pace of buying activity is increasing. Oh, and the population is increasing. I'd say that we have a shortage of housing supply -- and some further new construction is needed in this area! Find out more about the Harrisonburg and Rockingham County real estate market by visiting....  | |
Investing in College Student Housing Offers Risks as well as Rewards |
|
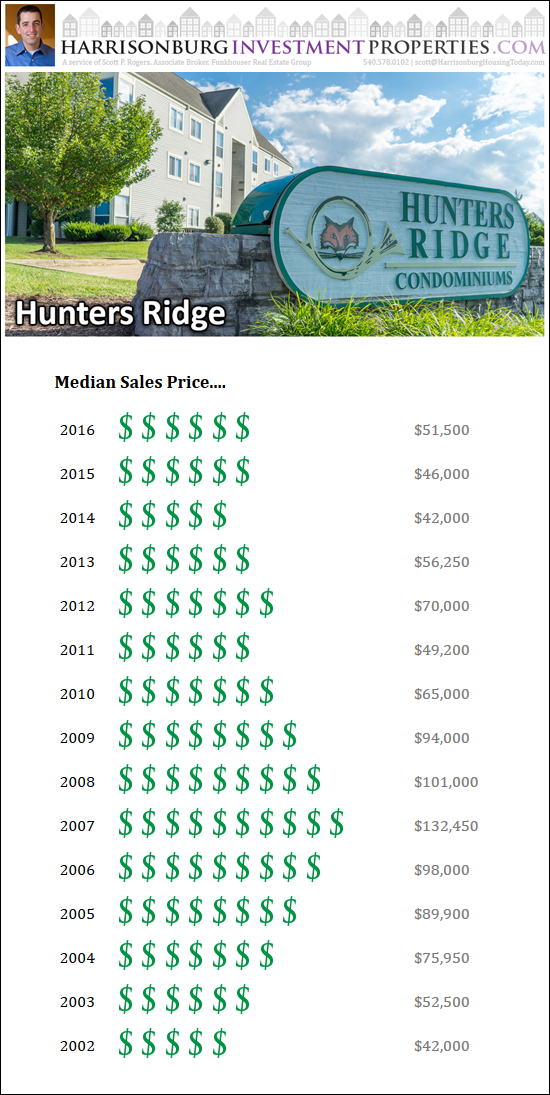 As I commented to a potential investor this past week -- investing in student rentals can offer a higher return than other non-student properties, but there are also higher risks associated with such an investment. These include....
Again -- investing in student housing can provide a great return on your investment, but it comes with risks that you should full understand before you make an investment. Learn more about investing at Hunters Ridge here. | |
54% of Homes (that sell) are Under Contract within 60 Days |
|
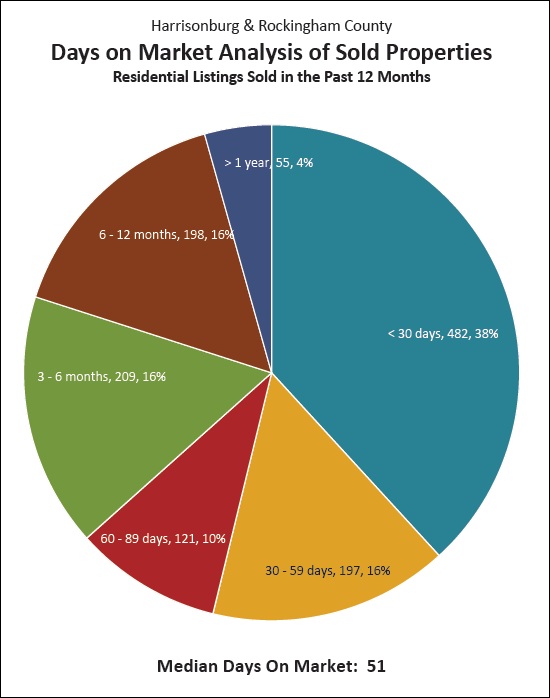 Every home that goes on the market does not necessarily sell. Every home that goes on the market does not necessarily sell quickly. That said, 54% of the homes that do sell (in the past 12 months) are going under contract within 60 days of being listed for sale. As I always discuss with my clients, it's all about price, condition and marketing. Are we doing everything that we can to prepare your home to be presented well and to sell quickly, in the areas of pricing, condition and marketing? Find out more about the Harrisonburg and Rockingham County real estate market by visiting....  | |
Local New Home Sales Hit 7 Year High in 2016 |
|
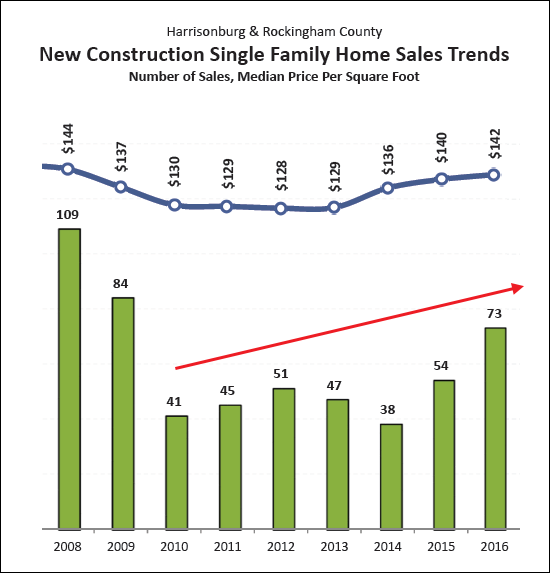 After six years in a row of 54 sales or less of new single family homes in the Harrisonburg/Rockingham MLS, we have seen 73 such sales in the first ten months of 2016. This is an indication that local builders are starting to have a bit more confidence in speculatively building homes in Harrisonburg and Rockingham County. Of note -- these numbers do not include the new homes that are built by home builders for individuals who own a lot or piece of land, and thus that never show up in the MLS as a home for sale. With increasing sales, and declining inventory, this seems like an ideal time for local builders to begin more speculative building to help meet local buyer demand. Find out more about the Harrisonburg and Rockingham County real estate market by visiting....  | |
Sellers Selling for 98% of (Last) List Price |
|
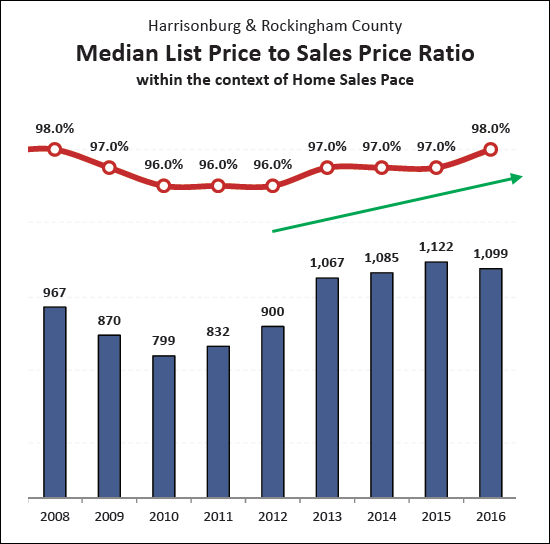 This graph shows the average list price to sales price ratio (red line) in recent years as compared to the overall pace of home sales. Over the past several years, the amount that buyers have been able to negotiate sellers down on price has diminished significantly. Between 2010 and 2012, sellers were negotiating down to a median of 4% off of their (last) list price. Now, sellers are only negotiating down 2%. Of note --- 1. This is a median calculation -- so half of sellers are negotiating more than 2%, and half are negotiating even less than 2%. 2. This is a comparison of the sales price to the LAST list price. If a home is worth $200K and is listed for $300K, it is not likely to sell for 2% less than $300K. The seller is likely to have to continue to reduce the price until it is at a reasonable place -- perhaps 2% or 5% above $200K, and then they will likely negotiate somewhere around 2% to their final sales price. Find out more about the Harrisonburg and Rockingham County real estate market by visiting....  | |
4.6% Increase in Median Price Per Square Foot in 2016 |
|
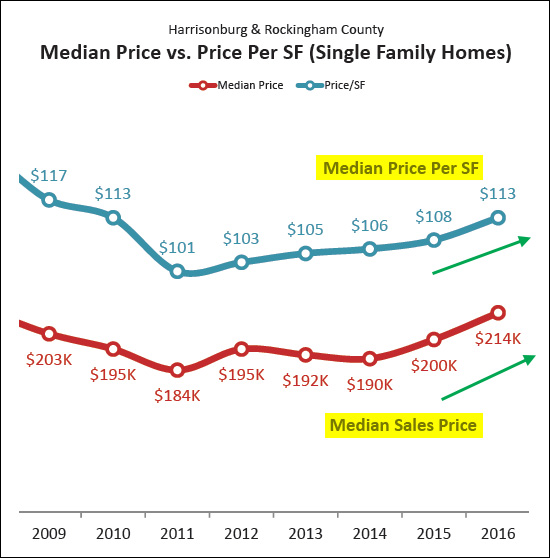 In addition to monitoring home values by overall median sales prices in our market, it can be insightful to examine the median price per square foot of homes that are selling. The graph above shows the median price per square foot of all single family homes sold in the last few years. The value trend captured by this graph is quite similar to the trend shown in the single family home median sales price during the same time, which validates that assumed set of changes in home values. Over the past year (2015 to 2016) we have seen increases in both the median sales price as well as the median price per square foot of single family homes. The median sales price has increased 7% over the past year. The median price per square foot has increased 4.6% over the past year. Find out more about the Harrisonburg and Rockingham County real estate market by visiting....  | |
Local Homes Sales Up 14% YTD Despite Slower Sales in October 2016 |
|
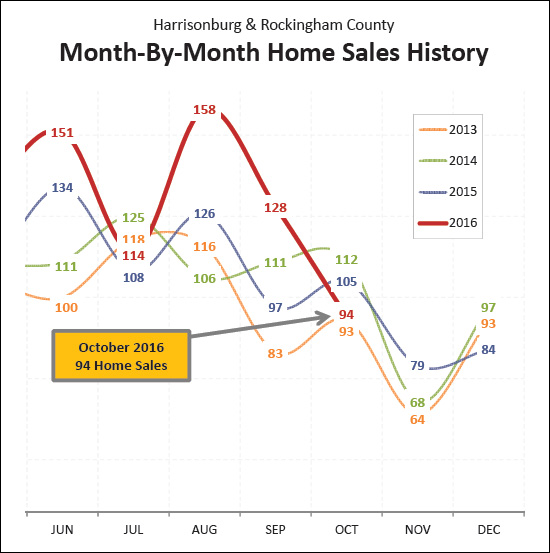
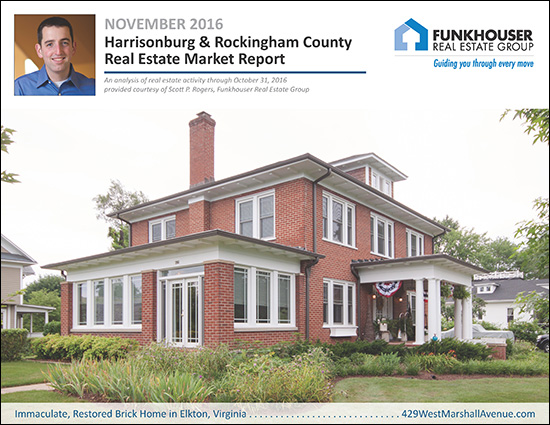 Learn more about this month's featured property: 429 West Marshall Avenue I just published my monthly report on the Harrisonburg and Rockingham County real estate market. Jump to the full online market report, download the PDF, or read on for highlights.... First, let's take a look at the overall market performance in October.... 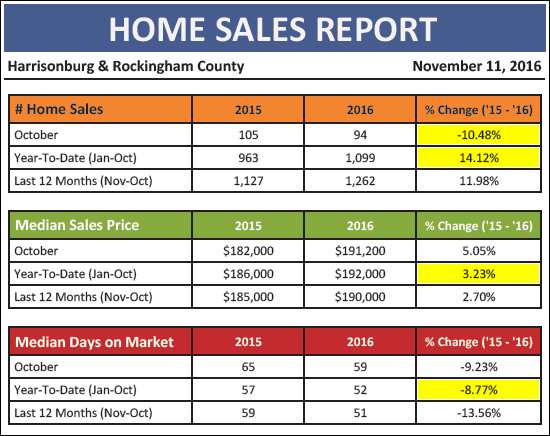 A few highlights from the quick snapshot above....
OK -- as noted above, the 94 homes sales seen in October 2016 mark a 10% decline as compared to the 105 home sales in October 2015, and that was even lower than the 112 home sales seen in October 2014. But before you get overly depressed about a slower October, remember....
So, it seems that the timing of home sales during the year can vary significantly from year to year. Looking at the past three months together can help put things in perspective in some ways....
There, not so bad now, right? That's a 16% improvement over last year when looking at these three months -- and as noted above, when looking at January through October, the pace of home sales in 2016 is 14% higher than it was last year. OK, on to some other items....
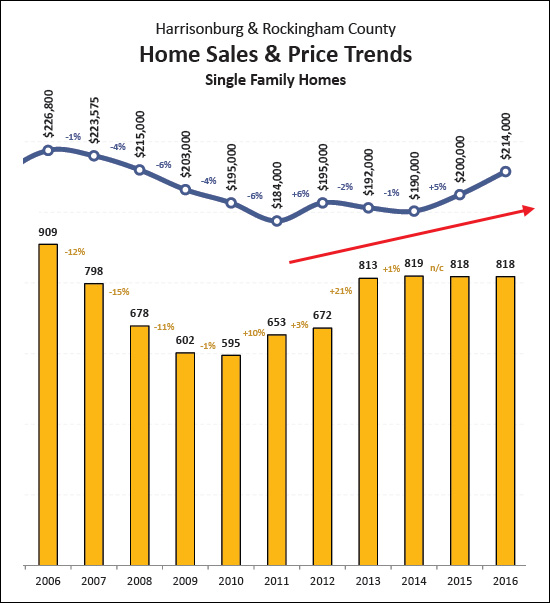
The median value of single family (detached) homes is often the best indicator of trends in home values in a local housing market. As shown above, we have been seeing those values increase over the past five years, most notably over the past two years. Also of note, as shown above, after hovering between 810 and 820 home sales per year for the past three years, it seems we are finally poised to break through that invisible barrier this year, as we are likely to see at least 900 and perhaps 950 single family home sales.
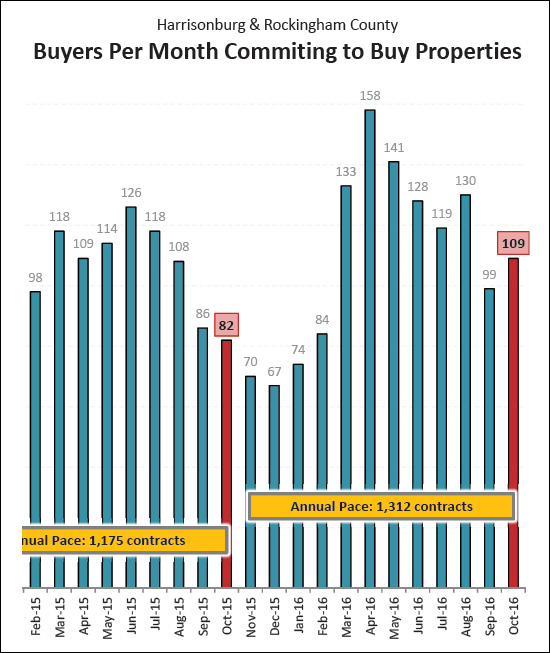
If my consoling notes above about why slower October home sales weren't so bad didn't help, then perhaps the graph above will help. Slower home sales in October 2016 does not mean that the fast and furious pace of 2016 home sales has come to an end. As shown above, buyers (and sellers) signed 109 home sales in October 2016 -- a 33% increase over the 82 contracts signed last October. So -- we might be in for another month of stronger sales in November.
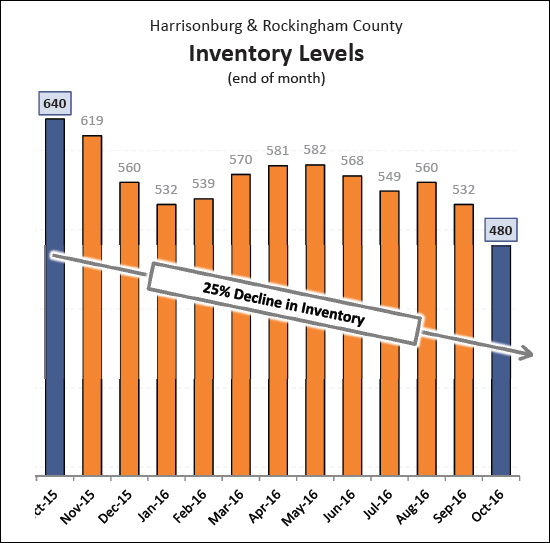
If you are trying to buy a home right now, it is quite possible that you are frustrated by not having many options to choose from. The graph above might explain why you are having this experience. Inventory levels continue to fall -- to where we now only have 480 homes on the market!?!?! This is as compared to a year ago when there were 640 homes on the market at this time -- showing a 25% year-over-year decline. This lack of inventory is slowly starting to tip the market in the favor of sellers, though not in all price ranges and not in all locations. OK, there is plenty more to say, such as....
But -- I'll let you read all about those tidbits via my full online market report, or by downloading the PDF, or by clicking here to sign up to receive my real estate blog by email. And -- as is always my encouragement -- if you will be buying or selling a home in the near future, start learning about our local housing market sooner rather than later! Being informed will allow you to make better real estate decisions. | |
Home Buyers Continue Fast Pace of Contract Signing in October 2016 |
|
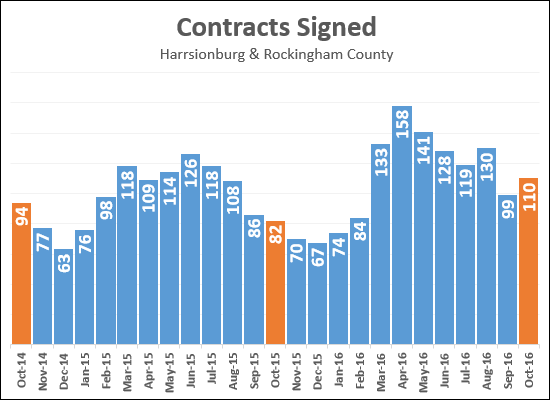 An early look at home buying activity (contracts being signed) in October 2016 indicates that the local real estate market is still not showing any signs of slowing down. After a decline to 99 signed contracts in September 2016, buyers signed 110 contracts in October 2016. This marks a 34% improvement over last October's 82 contracts. Looking back to the start of the main home buying season, there have been 1,018 contracts signed since March 2016 --- compared to only 861 contracts during the same time frame last year. Stay tuned for my full real estate market report next week with plenty of additional details on our local housing market. If you want to receive that monthly market report by email, click here to sign up. | |
| Newer Posts | Older Posts |
Scott Rogers
Funkhouser Real
Estate Group
540-578-0102
scott@funkhousergroup.com
Licensed in the
Commonwealth of Virginia
Home Search
Housing Market Report
Harrisonburg Townhouses
Walk Through This Home
Investment Properties
Harrisonburg Foreclosures
Property Transfers
New Listings

