| Newer Posts | Older Posts |
Just how low are housing inventory levels right now? |
|
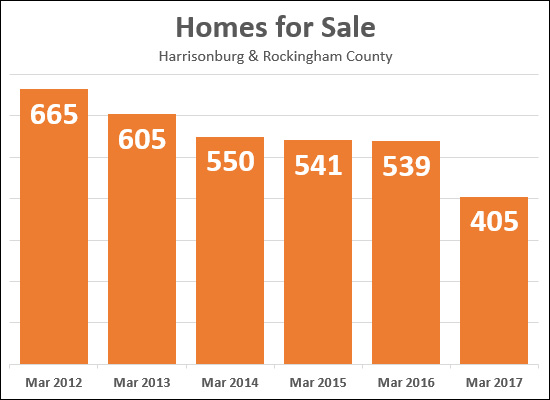 Low, low, super low! I talk with some regularity about how low inventory levels are right now This is not just a seasonal thing. Inventory levels don't get this low every year at this time and then rise again in the Spring and Summer. In fact, as shown above, for the past there years at this time there have always been between 539 and 550 homes for sale -- that is a pretty consistent track record. This year, however, there are only 405 homes for sale -- marking a 25% decline in the number of homes for sale. it gets worse by price range, by the way. There are 44% fewer homes on the market in the "under $200K" price range right now as compared to a year ago. | |
Will the Median Sales Price of Townhouses Perk Up in 2017? |
|
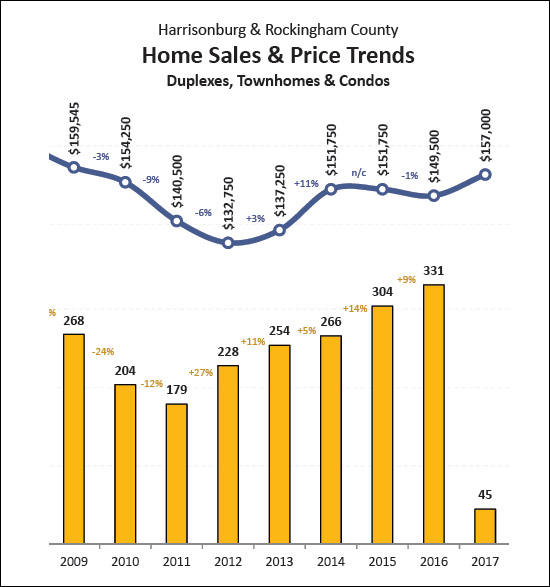 Despite increases in the pace of sales over the past five (!!) years, we have not seen increases in the median sales price of these properties over the past two years. In fact, the median sales prices of townhouses (and duplexes and condos) actually declined by 1% in 2016. So -- what might 2017 have in store for us? So far, it seems that we might see an overall increase in the median sales price, but it is still early in the year. Stay tuned, and until then, feel free to peruse my full market report by clicking on the image below. 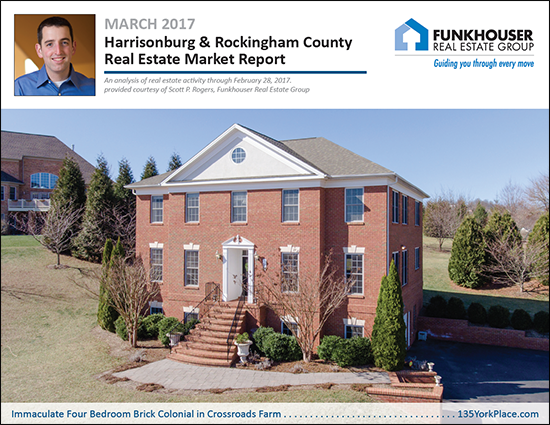 | |
February Home Sales (and temperatures) Higher Than Expected |
|
 The beautiful home on the cover of my market report is 135 York Place - check it out here! Yes, yes, I know. Within mere hours of sending this market report that mentions are area's unseasonably warm temperatures of late -- it will be snowing -- but I am not going to believe it is really happening until I see the snowflakes myself. If it does snow, feel free to take a break from clearing the driveway to sit by the fire, drinking hot cocoa, reading my full monthly market report. Now, on with the news of our local housing market.... As you'd guess from the header image above, I have published my monthly market report, which you can download as a PDF, or read online. For the abridged version of the most important things for you to know, read on.... First -- for those that would rather hear me talk about this -- tune in to my monthly video overview of our local housing market....  Next, some basic stats that we keep up with on a monthly basis.... 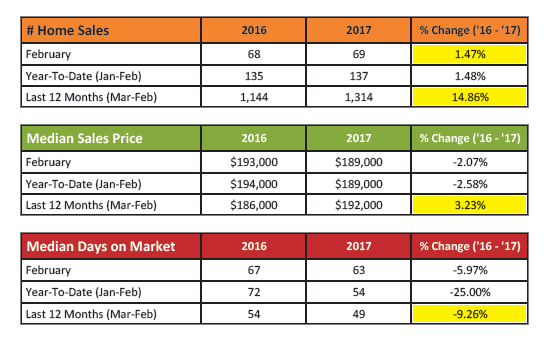 OK -- a few things to note here, based on the data table above.... First, so far, it is looking like one of my 2017 predictions might be wildly incorrect. I have had some concerns about whether there would be enough housing inventory to support the same sales levels as we experienced last year. So far, it has not been a problem. Even though there are now 25% fewer homes on the market as compared to a year ago, we have actually seen a net gain (small as it may be) of two more sales (137) in the first two months of 2017 as compared to (135) last year. Also referencing the data table above, when looking at the rolling 12-month median sales price, we are still seeing a 3-ish percent increase in median sales price as compared to a year ago. Finally, homes have been selling 9% faster in the past 12 months as compared to the previous 12 months. 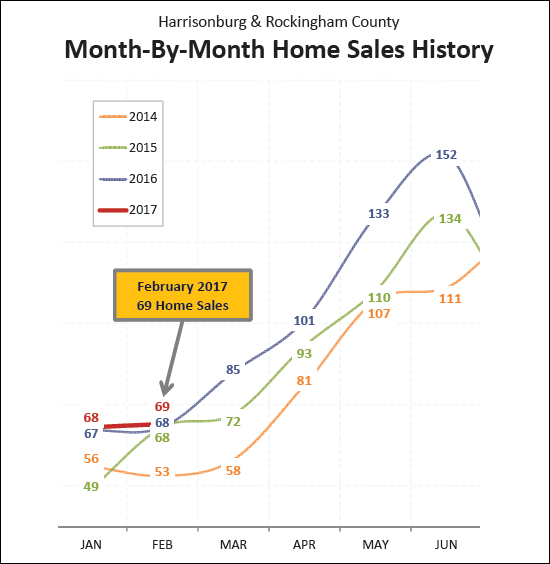 Looking at the graph above, you might note the extraordinarily high home sales seen last year in the months of March through June, as well August and September. The mystery this year is whether our local housing market can stay on pace with that aggressive pace of home sales. So far, so good! This January and February both barely edged out the same month last year -- so we are seeing a year-to-date increase in the number of homes sold in this local market. 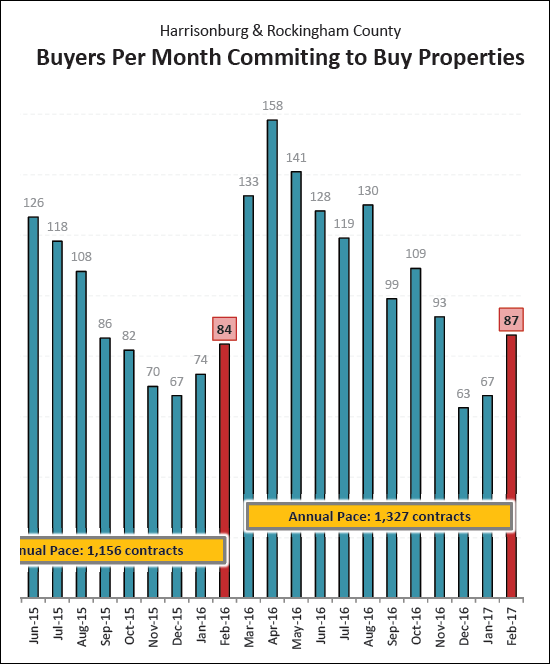 Next, looking at the graph above we note that February 2017 saw 87 buyers signing contracts to buy homes -- as compared to only 84 last February. This small jump is reassuring after having seen a decline from 74 contracts to 67 contracts when comparing the past to months of January. All-in-all, the annual increase in contract activity (from 1156 to 1327) make sense in the light of the 15% increase in the pace of home sales that we have seem over the past year. 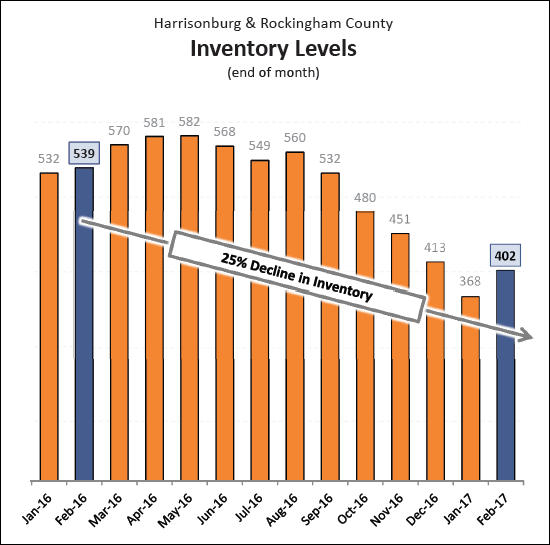 So -- how about those inventory levels? We have seen a 25% year-over-year decline in our market's overall inventory levels. Buyers today only have 402 homes to choose from as compared to 539 a year ago -- though that masks the super-limited choices buyers ACTUALLY have once they introduce their overlays of price, location, size, age, etc. All that said, we are finally starting to see the normal, seasonal increases in listing inventory we'd expect to see at this time of year. Inventory has climbed from 368 homes to 402 homes over the past month. OK -- I'm going to pause there for now and go try to find my snow boots. I'll look further at trends in our local housing market in coming days on my blog. Until then, feel free to read my full online market report, or download the PDF, or click here to sign up to receive my real estate blog by email. And -- as is always my encouragement -- if you will be buying or selling a home in the near future, start learning about our local housing market sooner rather than later! Being informed will allow you to make better real estate decisions.
| |
Predicting Home Values Based On Purchase Date |
|
 The chart above is calculated based on comparing the 2016 median sales price to the median sales price in each of the prior 15 years. Several key points to take away from this chart....
| |
Low Inventory Levels Not (yet?) Affecting Pace of Home Sales |
|
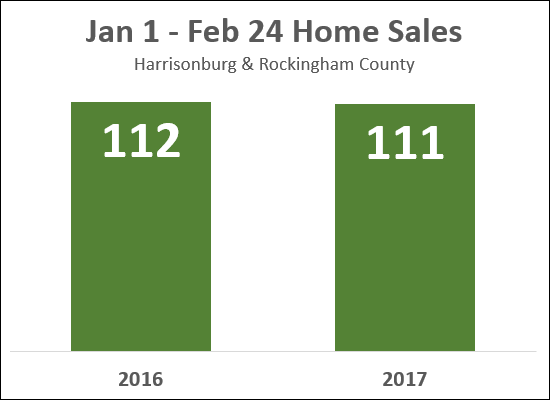 Home sales have increased 15% over the past year -- while at the same time, inventory levels have dropped 31%. This has left me with at least some lingering concerns about whether extraordinarily low inventory levels could limit the pace of home sales in 2017. So far, my concerns are unfounded. As shown above, when examining January 1 through February 24 home sales, there has not been a noticeable change in the pace of home sales. Stay tuned to see how these dynamics continue to adjust as we progress through the year. | |
How does Price Per Square Foot vary based on the age of a home? |
|
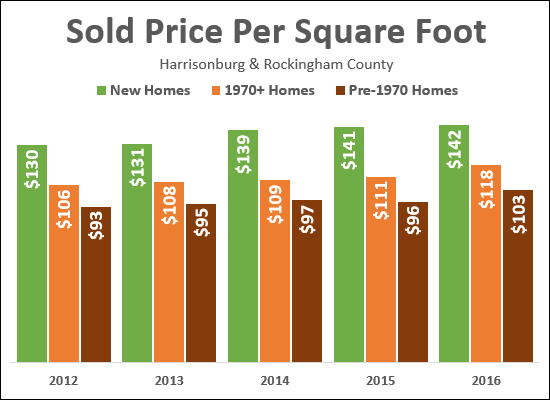 As you'd expect, newer homes sell at a higher price per square foot. As shown above, the Median Price Per Square Foot of single family homes varies based on the age of the home.
| |
Median Price Per Square Foot is On The Rise |
|
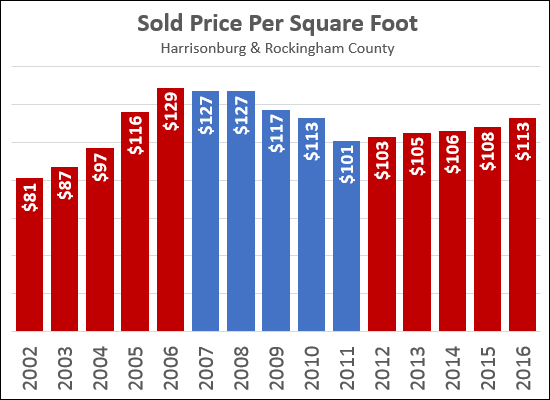 In addition to watching how the median sales price changes over time, it can be quite insightful to see how the median price per square foot of sold homes changes over time. The graph above tracks the median price per square foot of single family homes (not townhouses, duplexes or condos) in Harrisonburg and Rockingham County over the past 14 years. Price per square foot increased 59% between 2002 and 2006 during the housing boom, but then fell 22% between 2006 and 2011 as the market cooled back off. Since that time, however, we have seen a slow and steady increase in this metric -- from $101/SF in 2011 to $113/SF last year -- which marks a 12% increase over the past five years. I do not expect that we will see any drastic increases in this metric in the next few years, though an increasing number of buyers (more demand) and significantly fewer sellers (less supply) does make you wonder if we will start to see more rapid increases in sales prices, and thus in price per square foot. | |
Easy Access to Archived Harrisonburg Housing Market Reports |
|
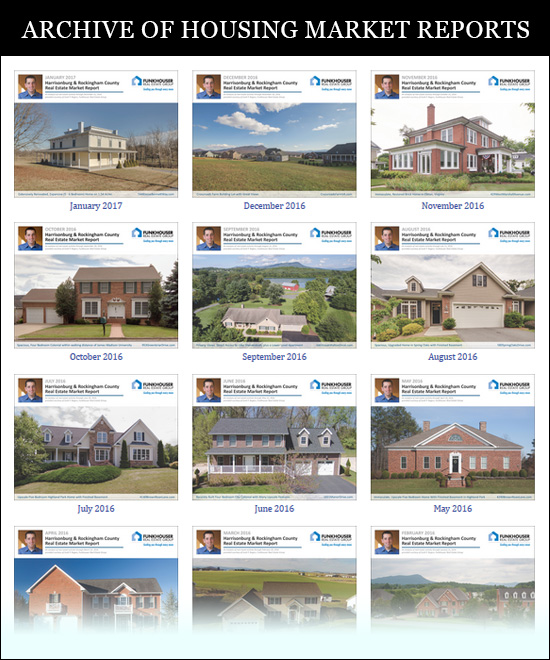 You can now access market reports back to 2013 by visiting HarrisonburgHousingMarket.com. Whether you are looking for the most recent report, or if you are interested to see how things were looking a few years ago, you are welcome to explore them all. Also of note, the best ideas for additions to my monthly market reports come from YOU! If you have further questions about our local housing market that are not covered by my monthly market reports, let me know! | |
Sales Prices Rising Faster in County Than in City |
|
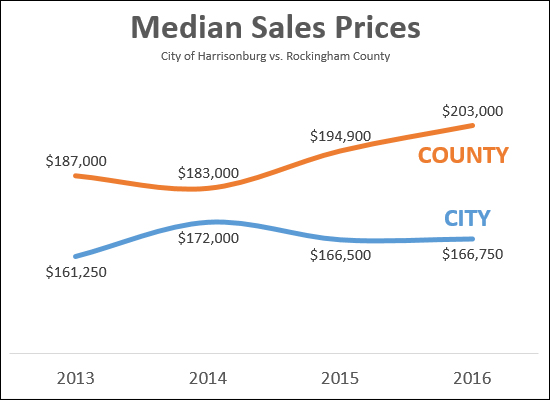 Sometimes I have more questions than answers. Or more observations than explanations. As shown above, the median sales price of homes in Rockingham County has increased 4.2% over the past year -- from $194,900 to $203,000. During the same time frame, the median sales price of homes in the City of Harrisonburg has only increased 0.15%. So -- why are home prices increasing more in the County than in the City? Perhaps it is based on what homes are actually selling in the City and County? Maybe we are seeing larger or newer homes selling more frequently in the County, where as smaller or older homes are selling more frequently in the City? Maybe there is more buyer demand in the County, driving prices up more quickly in the City? Theories are welcome! I'll let you know if I have any magical insights. Until then, you can find out more about the Harrisonburg and Rockingham County real estate market by visiting....  | |
Sales Up, Prices Up, Inventory Declining Drastically |
|
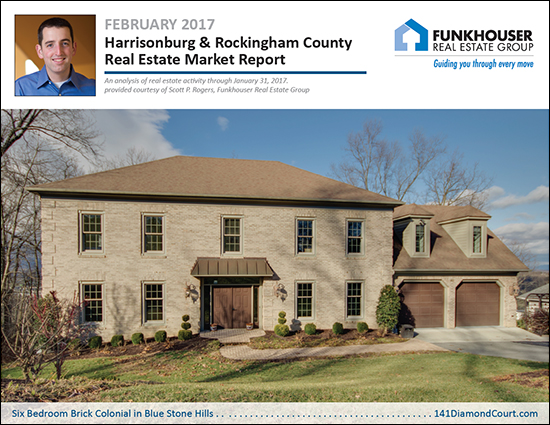 Learn more about this month's Featured Property: 141 Diamond Court I just published my monthly report on the Harrisonburg and Rockingham County real estate market. Jump to the full online market report, watch the video overview below, download the PDF, or read on for highlights.... First, a video overview....  Now, let's take a look at the overall market performance in January 2017.... 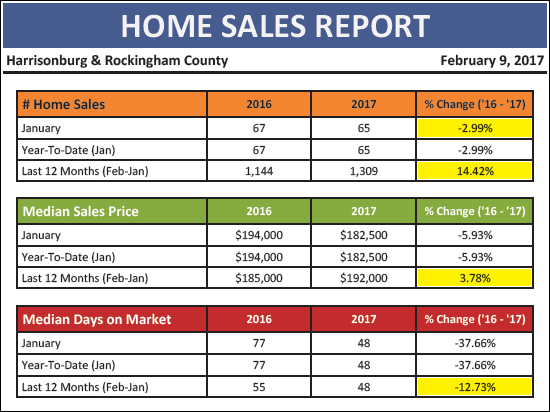 As shown above, home sales were slightly (3%) slower in January 2017 -- but added to recent strong months of sales to show a 14% year-over-year improvement in the annual pace of home sales. Furthermore, median sales prices have increased 3.78% over the past year -- and days on market has declined by 13%. Next, taking a look at buyer activity in the way of signed contracts.... 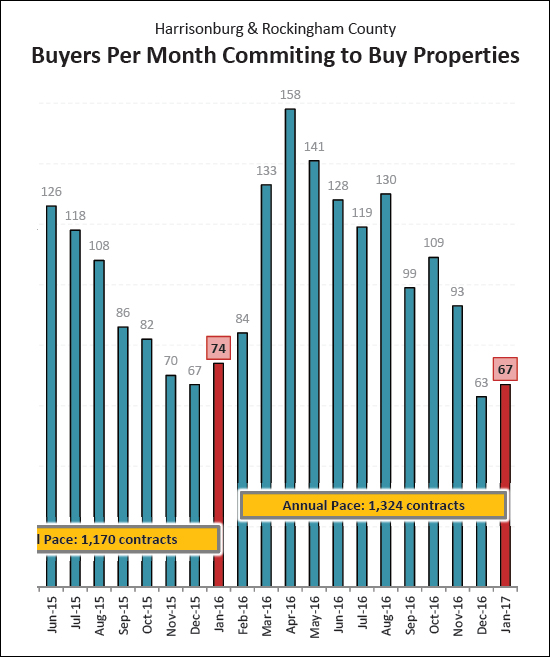 As shown above, buyers signed contracts at a slightly slower pace (67 contracts) in January 2017, as compared to in January 2016 -- when 74 buyers signed contracts. That said -- the annual pace of contract activity (1,324 in the past year) is still markedly above the prior year when there were 1,170 contracts signed. We are likely to see a bit more contract activity in February 2017 -- but really see things take off in March if last year is any indication. BUT NOW -- THE BIG STORY.... 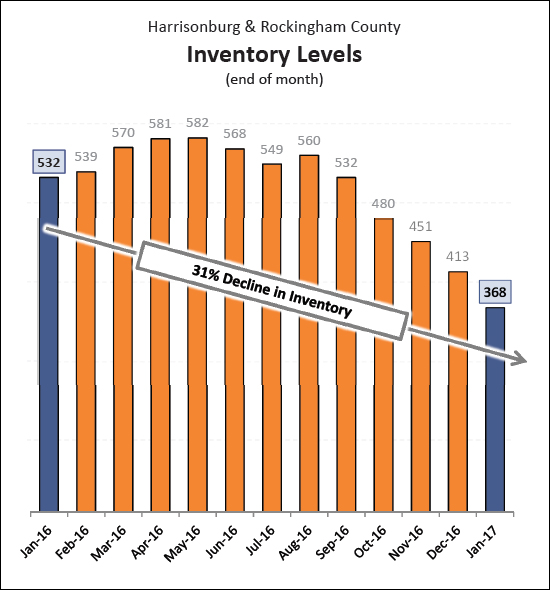 As shown above, we are seeing a DRASTIC decline in the number of homes for sale in our local market. One year ago, buyers in the market for a new home would be selecting from 532 homes (in all price ranges and locations) but now they would only have 368 options. This is a drastic reduction in the number of homes available for sale, which could lead to increases in sales prices, or reductions in the number of homes that actually sell this year -- due to not having enough homes on the market for buyers to purchase. BUT IT GETS EVEN MORE EXTREME.... 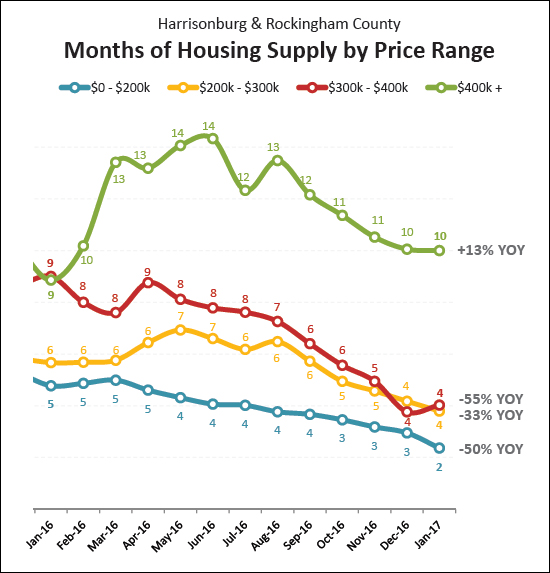 Many housing market analysts consider a six month supply of homes to be a balanced market between buyers and sellers. That is to say that if 100 homes are selling per month, then the market would be balanced if there were 600 homes for sale. As shown above, the market is out of balance in several price ranges. There are only four months of homes for sale in the $200K-$300K price range and the $300K-$400K price range -- but even more significant -- there are only TWO MONTHS of homes for sale under $200K. That is to say that if no other properties were put on the market under $200K, then in two months time, we could be all the way down to no inventory at all on the market. So, as is likely evident, we need more homes to be listed for sale in the next few months to have any chance at having a normal Spring and Summer market in Harrisonburg and Rockingham County. There is plenty more to learn and consider in this month's market report, such as....
I will explore many of these topics in coming days on my blog. Until then, feel free to read my full online market report, or download the PDF, or click here to sign up to receive my real estate blog by email. And -- as is always my encouragement -- if you will be buying or selling a home in the near future, start learning about our local housing market sooner rather than later! Being informed will allow you to make better real estate decisions. | |
January Inventory vs. Past Year of Home Sales |
|
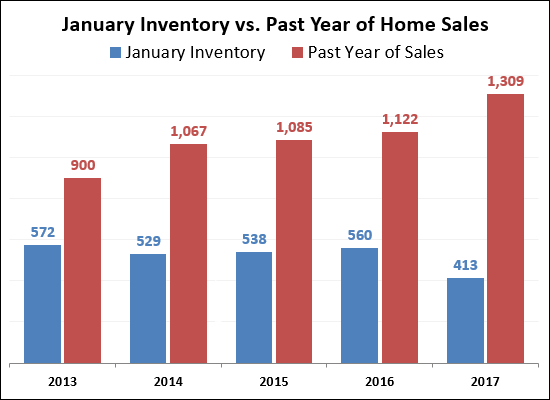 For the past four years (2013, 2014, 2015, 2016) and even some before that, we started off the year with enough homes actively listed for sale to last us for right around six months -- or a bit longer. This balance (a six month supply of housing inventory) is considered by many analysts to be an indicator of a balanced housing market. Well, this year (2017) is quite a bit different. Inventory dropped 26% over the past year, and sales rose 17%. As you would, thus, expect - we're starting off the year in a slightly different spot, as shown above. This year, the amount of homes actively listed for sale (413) will only last us 3.8 months based on last year's pace of sales -- which is quite a bit different than the balance we have seen at the start of the year for the past four years. So -- this year will be interesting. Will sales decline because there aren't enough homes for buyers to consider? Will prices rise as many buyers fight over a small number of listings? Will we see just as many home sales last year, but with an even lower "days on market" as each new listing gets snapped right up by a buyer? Stay tuned! | |
Which price range of homes have been hit the hardest with reduced inventory levels? |
|
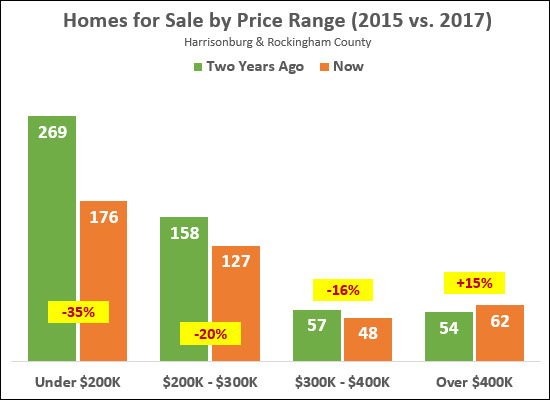 As shown above -- all price ranges have not been affected in the same way with inventory changes over the past two years. The most affordable price range (under $200K) has been the hardest hit -- with a 35% decline in the number of homes for sale. Part of this is an inventory issue (homes not being on the market) but part of it is also an appreciation issue. Homes have increased in value over the past two years, pushing some under $200K homes up into the $200K-$300K price range. We are also seeing declines in the $200K-$300K price range (-20%) and the $300K-$400K price range (-16%). In fact, the only segment of the market where we have seen an increase in the number of homes for sale is in the $400K+ market. In 2017, I believe that the under $200K buyers will have the most challenging time finding a home that works well for them. You can find out more about the Harrisonburg and Rockingham County real estate market by visiting....  And here are two handy references to prepare yourself to buy or sell a home.... | |
Have increased sales been spread evenly across all price range? |
|
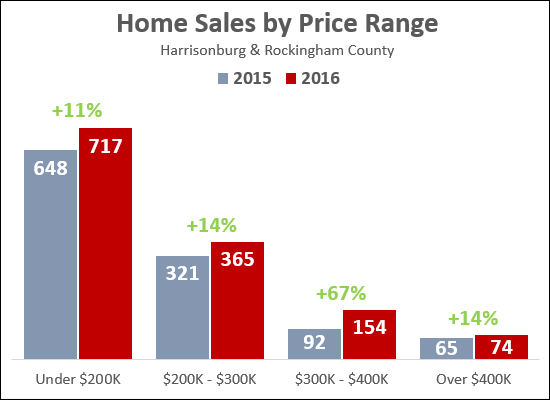 Not all price range were created equal this past year, it seems. As shown above, all price ranges except $300K-$400K showed 11% to 14% growth in home sales. That middle/high price range ($300K-$400K) on the other hand, had a massive increase of 67% growth in the pace of home sales! Looking forward, I am not clear how long we will continue to see increases in the "under $200K" price range. If the median sales price continues to increase, at some point, there will likely be a slight decline in the number of homes in this price range. You can find out more about the Harrisonburg and Rockingham County real estate market by visiting....  And here are two handy references to prepare yourself to buy or sell a home.... | |
The startling 2016 recovery of single family home sales |
|
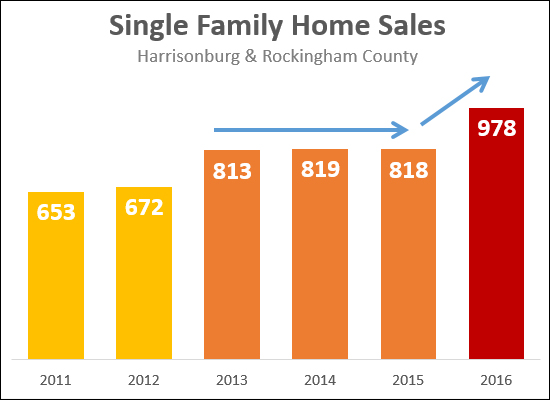 SINGLE FAMILY HOME SALES are BACK! OK -- but really, it is rather remarkable to look at 2016 single family home sales. And who could have seen this coming? At best, I thought we might see 850 of these sales in 2016 -- or MAYBE (possibly, but not likely) 875 sales. But we ended up seeing 978 sales!?! Let's look a bit closer....
You can find out more about the Harrisonburg and Rockingham County real estate market by visiting....  And here are two handy references to prepare yourself to buy or sell a home.... | |
When should we expect to see buyer activity start in earnest in 2017? |
|
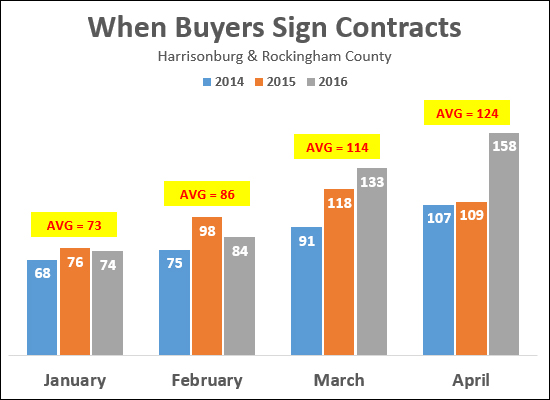 If you are planning to sell a home early in 2017, you might be wondering when buyers start coming out in full force. As shown above, the month when buyers really start showing up at the table seems to be March. The average number of contracts per month jumps up from 86 in February to 114 in March. Last year it was especially dramatic, when we jumped from 84 contracts in February to 133 contracts in March. There will certainly be buyers signing contracts in January and February, so it is not a terrible time to put your house on the market -- but March is when we start seeing a significant number of buyers ready to sign contracts. Of note, in the first 16 days of January 2017, we have seen 26 contracts signed -- so, we are off to a somewhat slow start, but things should pick up as we continue through the month. You can find out more about the Harrisonburg and Rockingham County real estate market by visiting....  And here are two handy references to prepare yourself to buy or sell a home.... | |
How has the pace of home sales in the City and County changed over the years? |
|
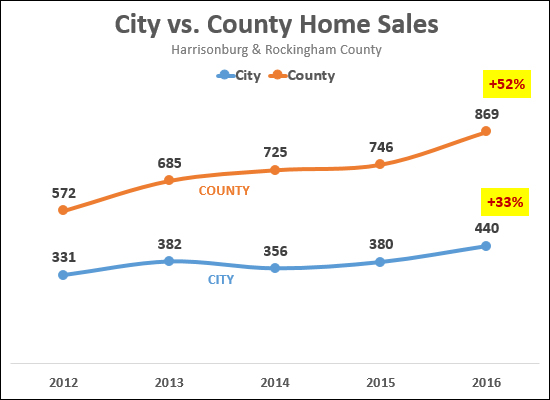 Now, for the annual showdown between the City of Harrisonburg and Rockingham County, though first noting that:
There are any number of factors that affect whether buyers end up buying in the City or County, including what type of property they are seeking, how much land they desires, school systems, employer locations, and much more. | |
Year End Home Sales Report Shows Rising Prices, Soaring Sales in 2016 |
|
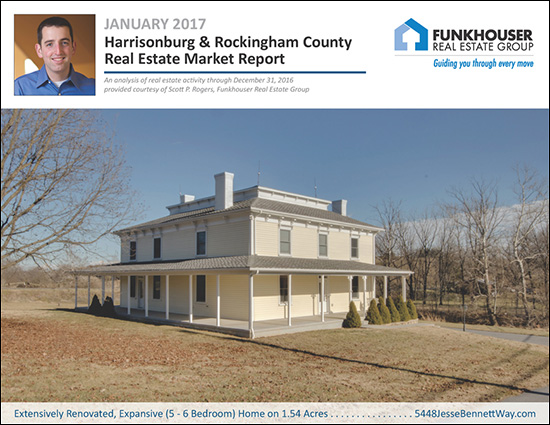 Learn more about this month's Featured Property: 5448 Jesse Bennett Way I just published my monthly report on the Harrisonburg and Rockingham County real estate market. Jump to the full online market report, watch the video overview below, download the PDF, or read on for highlights.... First, a video overview....  Now, let's take a look at the overall market performance in 2016.... 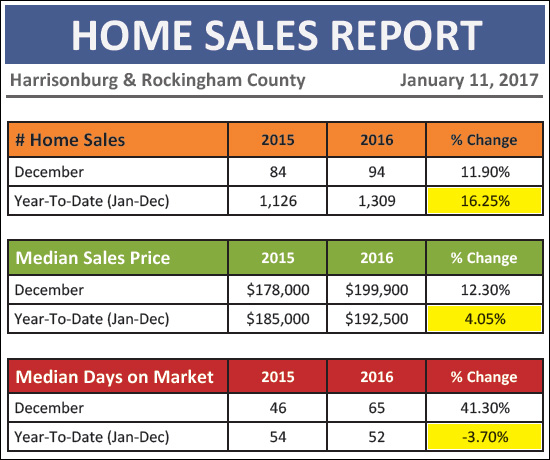 Home sales increased 12% in December 2016 to add to the overall excitement of the year and we now, finally have a full year of data to work with -- and my oh my, what a year it was in the Harrisonburg and Rockingham County residential real estate market! With all of the data in, we find....
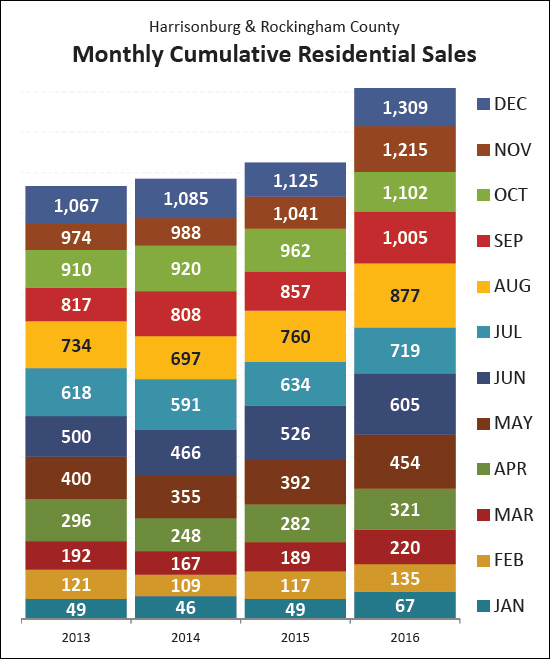 As you can see, above, home sales started quickly in 2016 and never slowed down -- finishing the year out well above the pace of home sales in any recent year. Now, let's take a closer look at the trends we have seen over the past two years.... 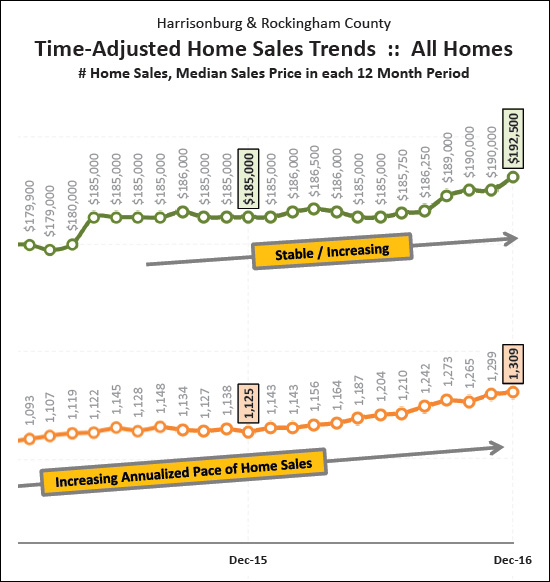 The graph above shows a rolling 12 months of the number of home sales in the Harrisonburg and Rockingham County area, as well as the median price of the homes that sold during these time frames. Each data point shows one year's worth of home sales, which eliminates the volatility of evaluating sales figures on a monthly basis. What jumps out to me is that....
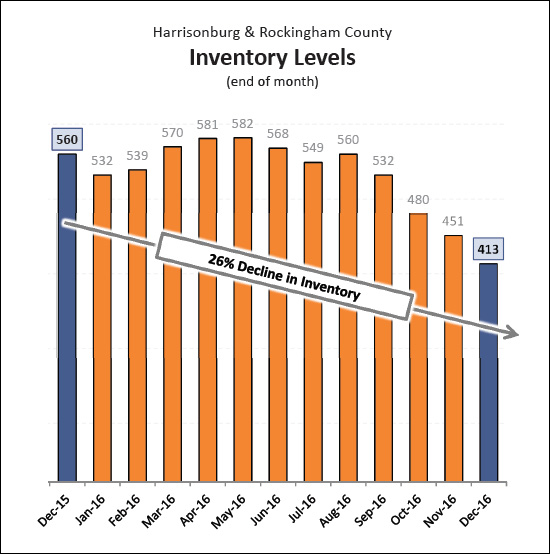 As shown above, buyers only have 413 homes to choose from today -- as compared to 560 one year ago. That is a 26% decline in the number of homes for sale over the past year -- all while we have seen a 16% increase in the number of homes sold. In some ways, the increased sales have created the inventory problem -- buyers have been purchasing homes left and right and depleting the inventory of homes for sale. But now that inventory levels are so low, we must wonder whether sellers will keep pace (in listing their homes) with the buyer demand that we are likely to see in 2017. I'll pause here for now, with you knowing that sales are up (16%), prices are up (4%) and inventory is down (26%) in Harrisonburg and Rockingham County. There is plenty more to read in my full monthly market report, which you can find over at HarrisonburgHousingMarket.com. In coming days on my blog, I'll be exploring....
Until then, feel free to read my full online market report, or download the PDF, or click here to sign up to receive my real estate blog by email. And -- as is always my encouragement -- if you will be buying or selling a home in the near future, start learning about our local housing market sooner rather than later! Being informed will allow you to make better real estate decisions. | |
My Predictions for the 2017 Real Estate Market |
|
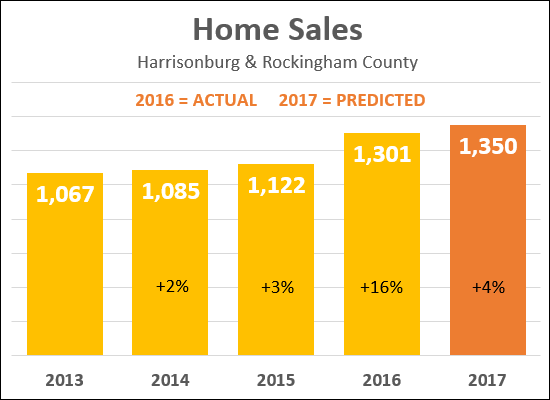 As is my annual tradition, I am making some predictions about what we'll see in the Harrisonburg and Rockingham County real estate market in 2017. Overall, I am cautiously optimistic about what the coming year will look like in this area. As shown above, I am predicting 1350 home sales in 2017. Here's why....
Now, on median sales prices (our best measure of home values)....
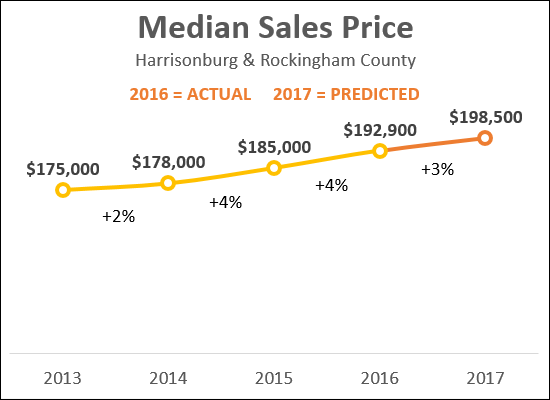
As shown above, I am predicting a 3% increase in the median sales price to $198,500 during 2017. Here's why....
So -- those are my predictions for 2017. What do YOU think? Feel free to email me (scott@HarrisonburgHousingToday.com) with your thoughts, questions and input. | |
Looking Back At My 2016 Housing Market Predictions |
|
So, last year, I made some predictions about what we'd see in 2016.... 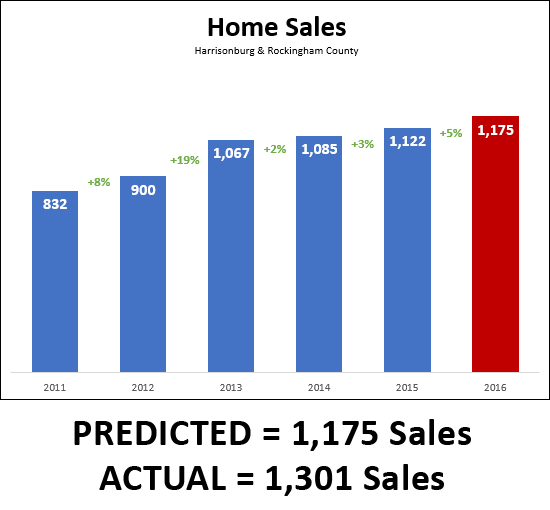 As shown above -- I was WAAAY too conservative in predicting how many home sales we would see in 2016. We ended up seeing a 16% increase in sales, not the 5% increase that I predicted. Now, as to home prices.... 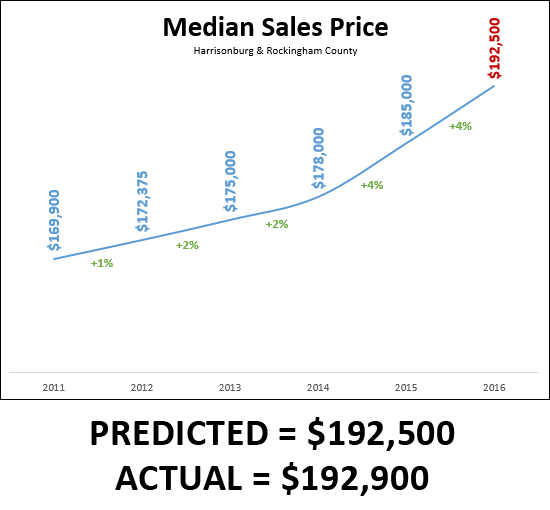 It seems I was able to predict the sales price trajectory much more accurately. I thought we would see an increase to a median sales price of $192,500 -- and the median sales price ended up at $192,900for the year. Stay tuned -- I'll make some 2017 predictions in the coming days. | |
Home Sales Increase (at least) 16% in 2016 |
|
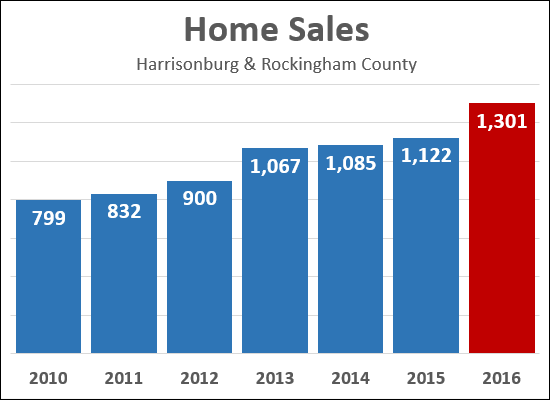 All home sales have not yet been reported but it is now clear that there were upwards of 1300 home sales in Harrisonburg and Rockingham County last year. We are likely to see that figure rise a bit more over the next few days as the last few sales are reported in our local MLS. This is a significant year-over-year increase in home sales as compared to previous years....
Stay tuned for my full market report in the next week or so, as well as predictions for the 2017 housing market. Oh, and HAPPY NEW YEAR! | |
| Newer Posts | Older Posts |
Scott Rogers
Funkhouser Real
Estate Group
540-578-0102
scott@funkhousergroup.com
Licensed in the
Commonwealth of Virginia
Home Search
Housing Market Report
Harrisonburg Townhouses
Walk Through This Home
Investment Properties
Harrisonburg Foreclosures
Property Transfers
New Listings

