| Newer Posts | Older Posts |
Does buying or leasing make more sense with a two year time frame? |
|
  Does buying or leasing make more sense with a two year time frame? It depends on the price range, how much of a down payment you are making, whether you are willing to keep the property as a rental property after you move out, and many other factors. However, above I have included is a 2-year and a 3-year analysis of buying versus renting a property valued at $150K compared to $300K, which shows that....
There are, of course, plenty of extenuating circumstances. Many people might buy a $150K house (or townhouse) even if they are planning to be there for only 3 years --- because they want their own home (not their landlord's), or to get in a certain neighborhood, or because of the tax benefits, etc.
| |
Who bought what, when, for how much? |
|
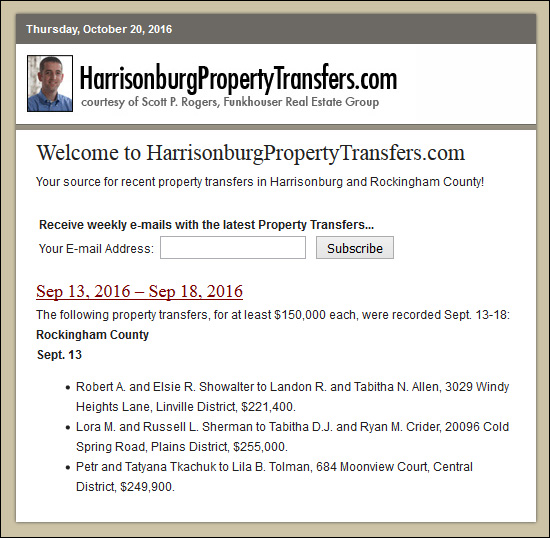 Looking for information about recent property transfers in Harrisonburg and Rockingham County? Be sure to check out HarrisonburgPropertyTransfers.com. | |
Broadway Virginia Real Estate Update |
|
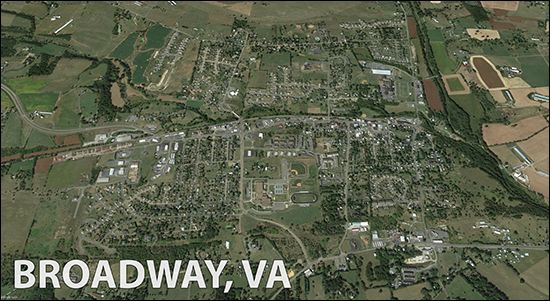 Let's take a look at how home sales have been trending in Broadway in recent years.... 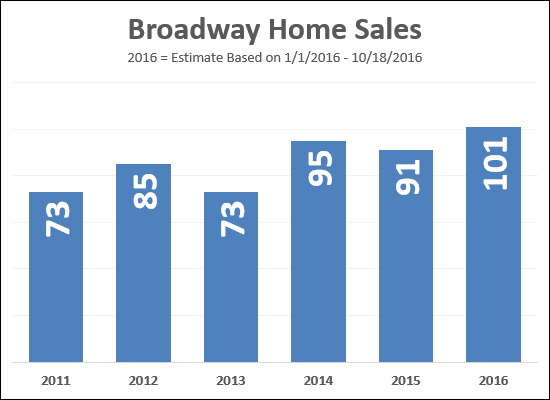 As shown above, 2016 may be the best year in recent memory for home sales in Broadway, Virginia. The estimate of 101 home sales is based on YTD (Jan 1 - Oct 17) home sales. 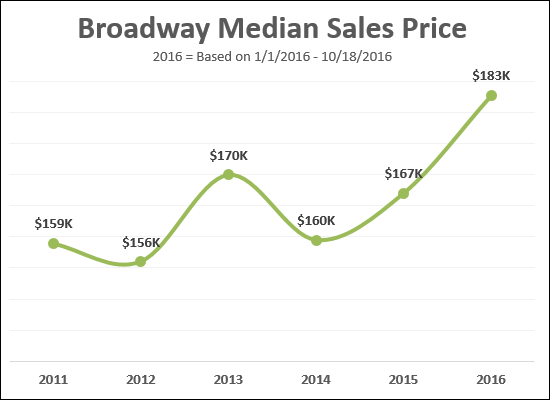 Median Sales Prices are also on the rise in Broadway, as shown above. Based on YTD home sales, the median sales price is $183K -- significantly higher than in any recent year. You can find homes currently for sale in Broadway here. Let me know if you have any questions about the Broadway real estate market! | |
Foreclosures Continue to Decline in Harrisonburg Area |
|
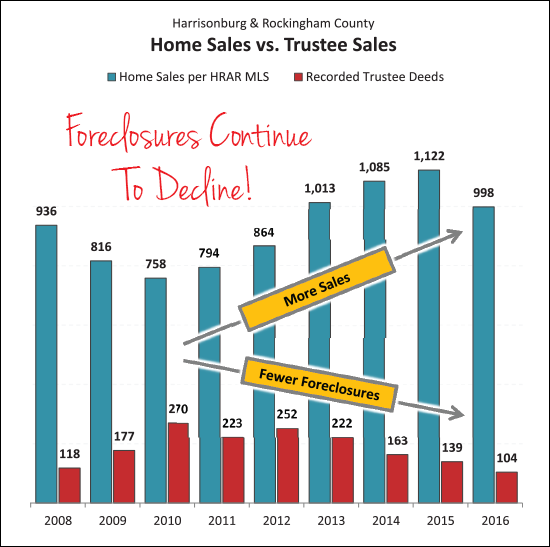 The graph above is a comparison of two imprecise measures -- but the comparison can still be helpful. The blue bars show the number of home sales recorded in the HRAR MLS -- this does not include private sales (without a Realtor), nor new home sales directly from a builder. The red bars show the number of recorded Trustee Deeds. Some foreclosed properties then show up again as REO properties. The foreclosure rate in our local market area is definitely trending downward, as there were 4.6 times as many home sales as foreclosures during 2013, 6.7 times as many home sales as foreclosures in 2014, and 8.1 times as many in 2015. Find out more about the Harrisonburg and Rockingham County real estate market by visiting....  | |
New Home Sales Increasing in Harrisonburg, Rockingham County |
|
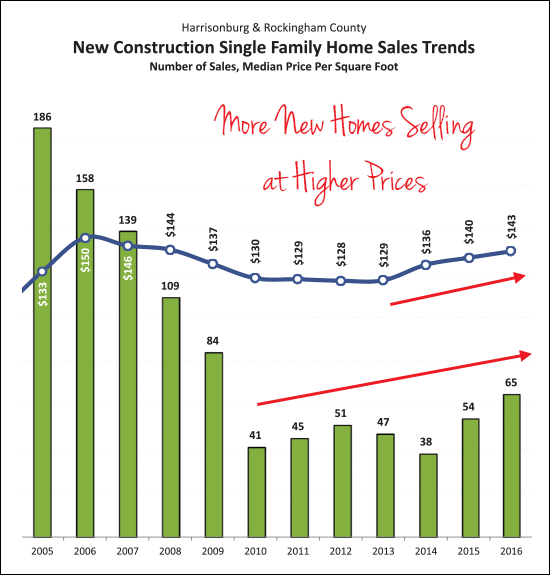 New home builders experienced a steady decline in new home sales between 2006 and 2010 -- dropping 78% from a peak of 186 to 41 sales in a year. Even if we use a starting point of 2001 (before the housing boom) we still see a 70% drop between 2001 and 2010. The number of new home sales per year has not crept up much since that time -- staying between 38 and 54 new home sales per year. This year, however, seems to be QUITE different. We have now seen 65 new home sales in the first nine months of the year, exceeding the full year of sale seen for each of the past six years -- a welcome sign for new home builders! Find out more about the Harrisonburg and Rockingham County real estate market by visiting....  | |
Annual Pace of Home Sales Set to Rise in 2016 |
|
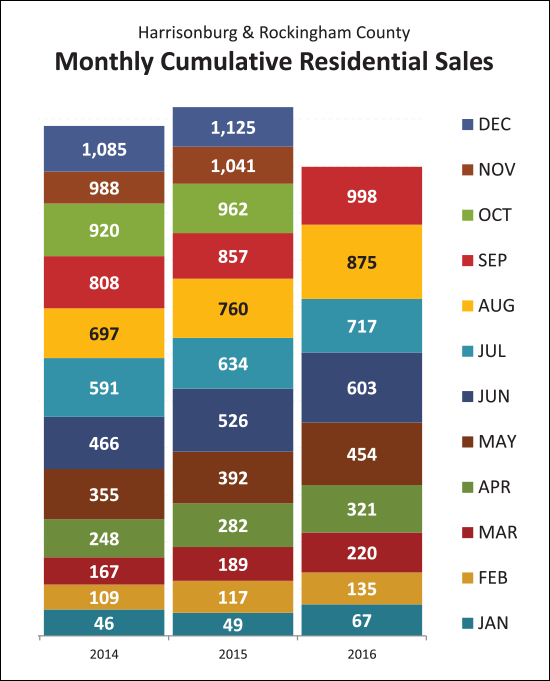 Take a look at the astonishing pace of home sales thus far in 2016. As shown above, the Jan-Sep home sales this year already exceeds the Jan-Oct home sales for the past two years. If not a single home sold in October, we'd still be ahead of the pace of home sales from the past two years! Looking at the graph above, it is hard to imagine (very, very hard to imagine) that we will not see an increase in the annual pace of home sales during 2016. At this point, I'm thinking 1200 sales -- but maybe it could get all the way up to 1250? Or even 1300? Find out more about the Harrisonburg and Rockingham County real estate market by visiting....  And, if you are preparing to buy or sell a home, here are two handy references.... | |
Astonishingly High Home Sales in September 2016 |
|
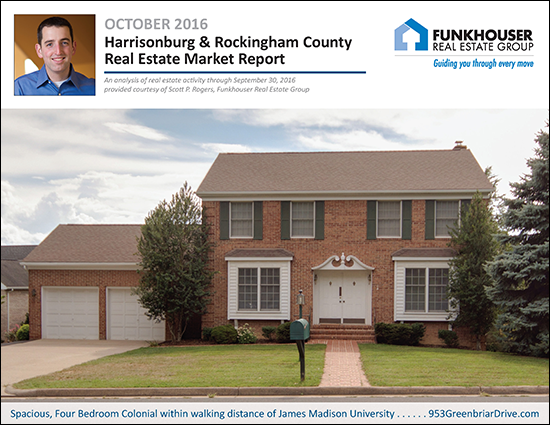 Learn more about this month's Featured Property: 953 Greenbriar Drive I just published my monthly report on the Harrisonburg and Rockingham County real estate market. Jump to the full online market report, download the PDF, or read on for highlights.... First, let's take a look at the overall market performance in September.... 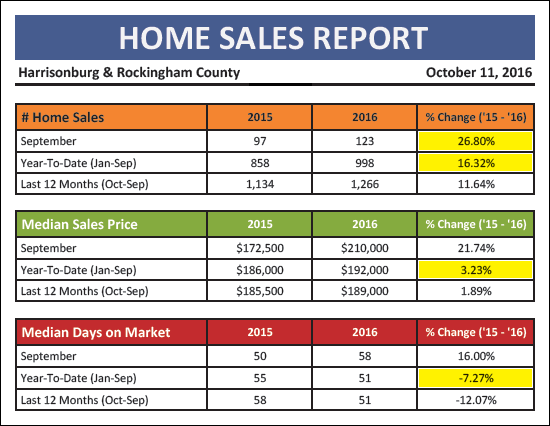 A few highlights from the basic data breakdown outlined above....
Now, let's contextualize those strong September sales.... 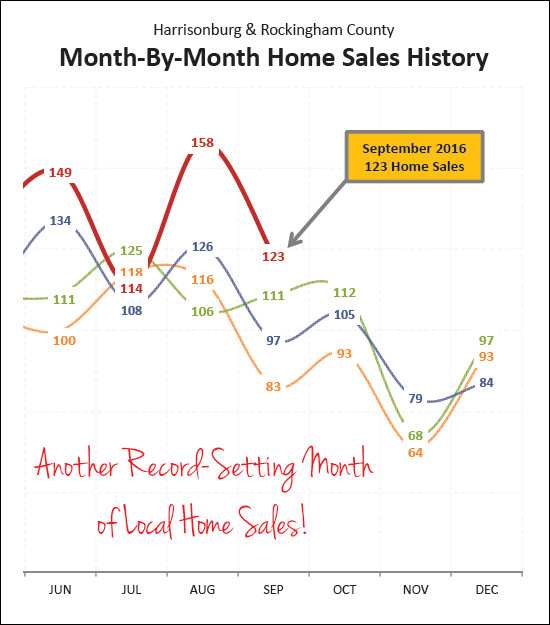 As stated above, there were a LOT of home sales in September 2016 -- a whopping 123 of them. When was the most recent time when we saw this many homes sales (or more) during the month of September? Waaaaaaay back in September 2005 when there were 136 home sales seems to be the only time we have ever seen more than 123 home sales. Wow! 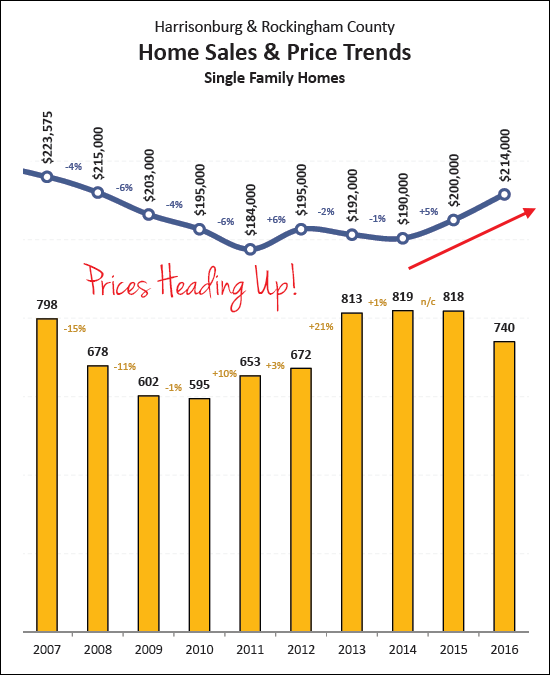 The median sales price of single family homes are often an excellent indicator of the price trends in a local real estate market, as they show a purer form of owner occupant supply and demand. When we examine townhouses as well, we are observing the buyer behavior of both owner occupants and investors -- and there can be much more short-term volatility in demand from investors. So, with the assumption that we'll get the clearest picture of price trends by looking at single family homes, it is striking to see a steady increase in median sales prices of these properties as shown in the graph above. 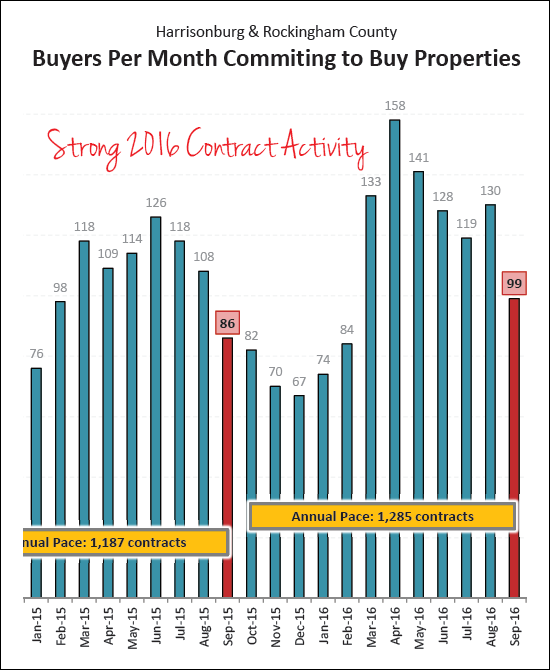 This graph clearly illustrates what a busy buying season it has been over the past seven months. We have seen an average of 130 contracts per month over the past seven months -- as compared to an average of only 96 contracts per month during the same timeframe in 2015. These strong contract numbers, clearly, are leading to the busy season of closings -- and we are likely to see yet another strong month of sales in October based on these contracts. 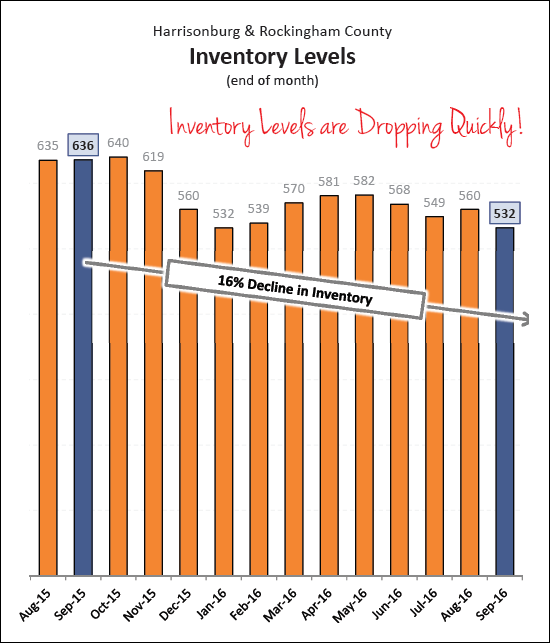 Finally -- buyers are finding fewer and fewer choices in the market -- as inventory levels (as shown above) have declined 16% over the past year. Looking back further (not shown above) there has been a 23% over the past two years! Well, there is much more to know, learn, read....but I'll pause here for now, and I'll let you explore that and read further on your own if you so choose. You can read my entire market report online....
| |
How Many Home Sales Might We See for the Remainder of 2016? |
|
 In 2014 and 2016 we saw 805-858 home sales in the first nine months of the year, and then 268-276 in the last three months of the year. Given this year's 961 (!!??!!) home sales in the first nine months of the year, we might see as many as 315 home sales in the last three months of the year. Or, alternatively, the pace of sales could certainly slow down after a frantic first nine months. If we do indeed see 361 sales, that would result in a total of 1,276 home sales this year compared to only 1,126 sales last year. | |
Massanutten Resort Real Estate Market Update |
|
 Let's take a look at how home sales have been trending at Massanutten Resort in recent years.... 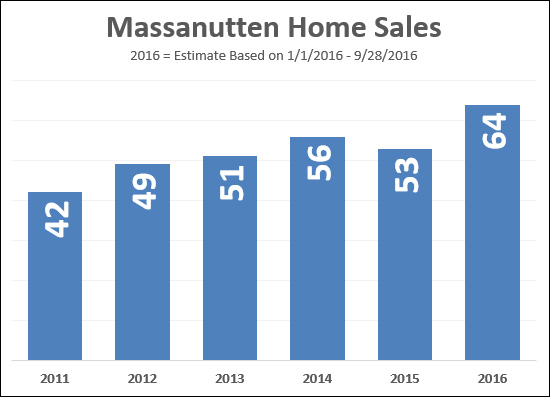 As shown above, home sales have been increasing at Massanutten Resort over the past five years, with the exception of a small decline in 2015. Of note -- there have already (as of 9/28/2016) been 52 home sales in 2016 -- so we are likely to see more home sales this year in Massanutten Resort than in any of the previous five years. The 64 home sales shown above for 2016 are an estimate based on year-to-date home sales (52) and the timing of sales in 2015. 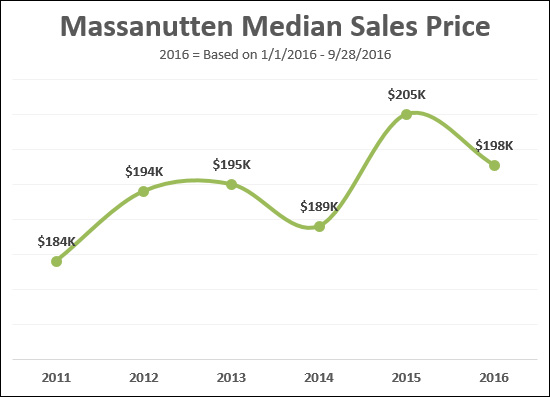 Value trends over time at Massanutten Resort don't paint quite as clear of a picture, but it can certainly be said that home values have been, generally speaking, increasing over the past 5 - 6 years. Values dipped down a bit more than expected in 2014, jumped up a bit more than expected in 2015, and are where we might have otherwise expected them to be in 2016 if we hadn't had that odd low and odd high. This is a relatively small data set (40 - 60 home sales) which can cause some irregularities in value trends. You can find homes currently for sale in Massanutten Resort here. Let me know if you have any questions about the Massanutten Resort real estate market! | |
Another Strong(ish) Year of High End Home Sales |
|
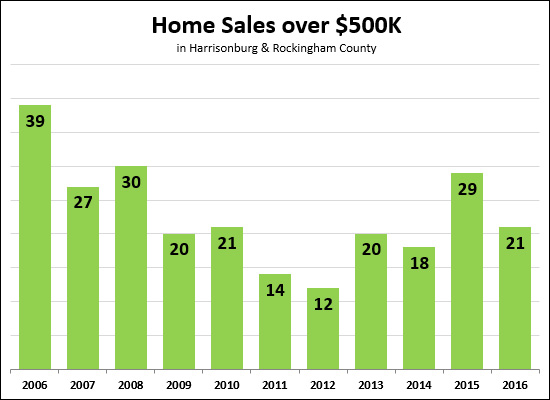 We saw an amazing 29 home sales over $500K last year -- which was the highest seen anytime since 2008. This year we are on track to likely match that pace of high end sales, with 21 home sales over $500K in the first 9.5 months of the year. 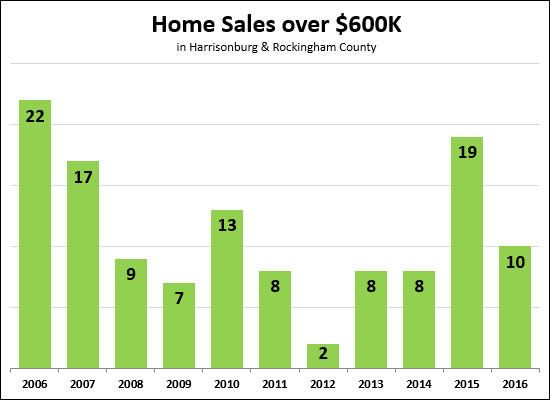 Again, last year showed an amazing number (19) of home sales over $600K - the highest since all the way back in 2007 -- but it does not seem that we will see that many home sales in 2016. With 10 home sales on the books thus far, we have exceed 2011-2014 levels, but it seems unlikely we'll get all the way up to 19 home sales this year. 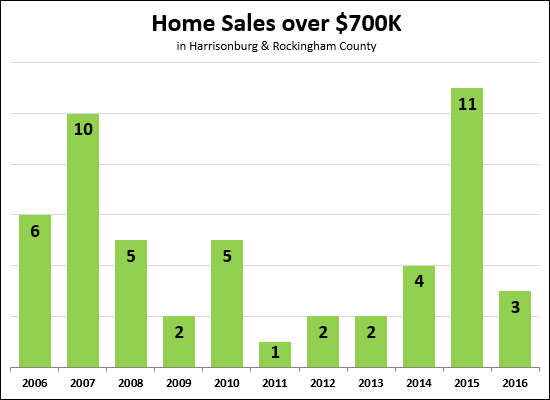 Finally, looking at the super-high-end home sales (over $700K) we are seeing a significant drop off from last year. Last year we saw a remarkable 11 home sales over $700K, which seems to be the highest number on record, ever. This year, however, we have only seen 3 home sales over $700K thus far. | |
44% Fewer Homes for Sale in Harrisonburg, Rockingham County |
|
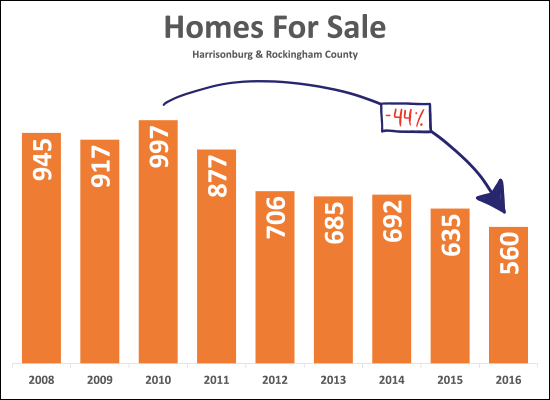 Buyers are finding fewer and fewer options of homes to purchase in Harrisonburg and Rockingham County as inventory levels continue to decline. The graph above shows the number of homes for sale in early September for each of the past eight years. There are 44% fewer homes for sale now as compared to at the peak of inventory levels in 2010. Even looking over the past year, there has been a 12% decline in inventory. These low inventory levels are frustrating buyers in many price ranges, giving them limited options of homes to purchase and SOMETIMES creating multiple offer situations. If you are getting ready to sell your home, it is important to understand the dynamic of how many other home sellers you will be competing against, so we will want to take a look at inventory levels in your particular segment of the market. | |
Median sales prices almost back to high of 2007 |
|
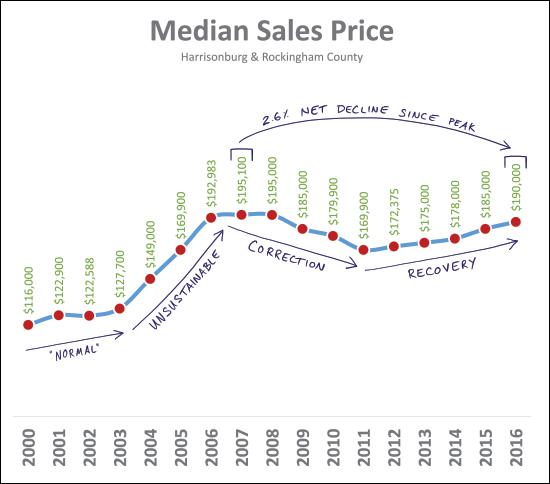 The graph above shows four periods of changes in the local median sales price....
Between the start of last decade (2000) and the peak of the housing boom (2007) the median sales price increased from $116K to $195K. Then, the median sales price dropped all the way back down to 169,900 in 2011. Now, in 2016, we are almost all the way back up to the 2006 peak of a median sales price of $195,100 -- with our current median sales price of $195,000. Thus, if you bought in 2007, your home almost (-2.6%) be now worth what it was when you purchased it. | |
Wild month of home sales in August 2016, contextualized |
|
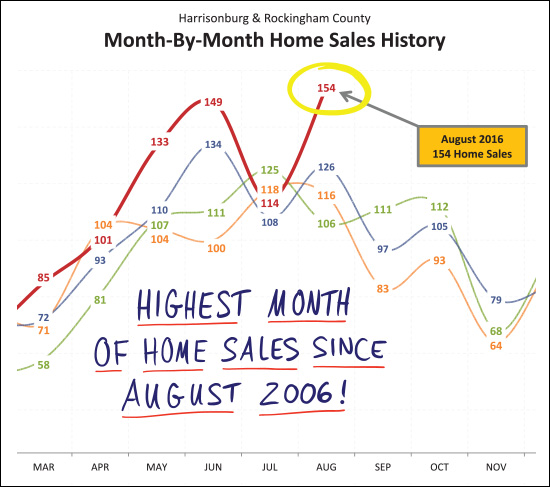
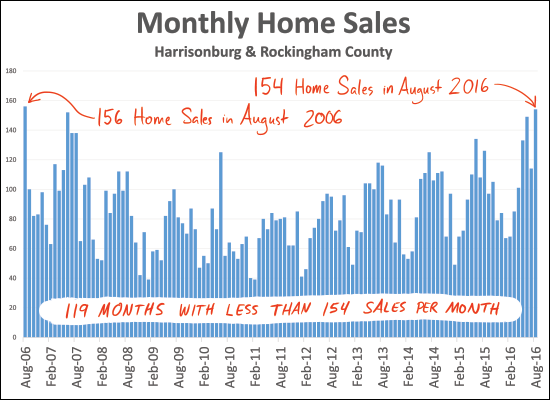 As reported yesterday, we had a RECORD NUMBER of home sales in August 2016. There were 154 home sales --and the most recent month when we saw more than 154 home sales was waaaaaay back in August 2006. With plenty of contracts in August 2016 as well, we are likely to see another strong month of sales in September --- though maybe not 154 of them. Read more about the local housing market here....  | |
Record Number of Home Sales in August 2016 |
|
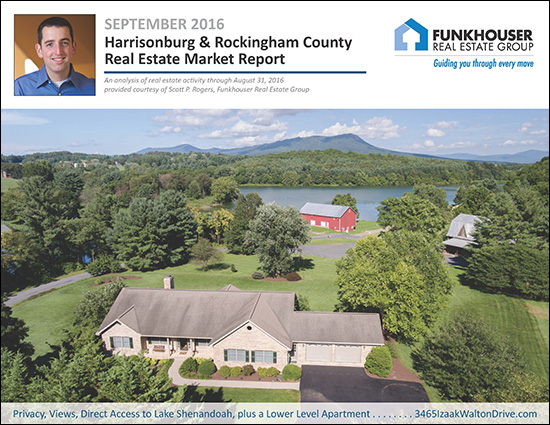 Learn more about this month's Featured Property: 3465 Izaak Walton Drive I just published my monthly report on the Harrisonburg and Rockingham County real estate market. Jump to the full online market report, download the PDF, or read on for highlights.... First, let's take a look at the overall market performance in August.... 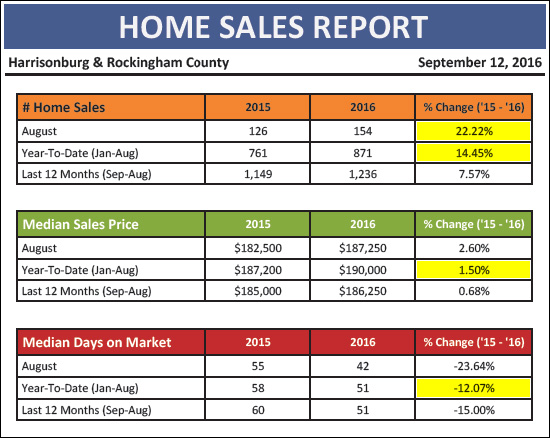 A few highlights from the basic data breakdown outlined above....
As promised, a bit more context. The 154 home sales in Harrisonburg and Rockingham County during August 2016 marked the HIGHEST number of home sales seen anytime in the previous 10 years. We'd have to stretch back 121 months to August 2006 to find the next highest month of home sales, when we saw 156 home sales.
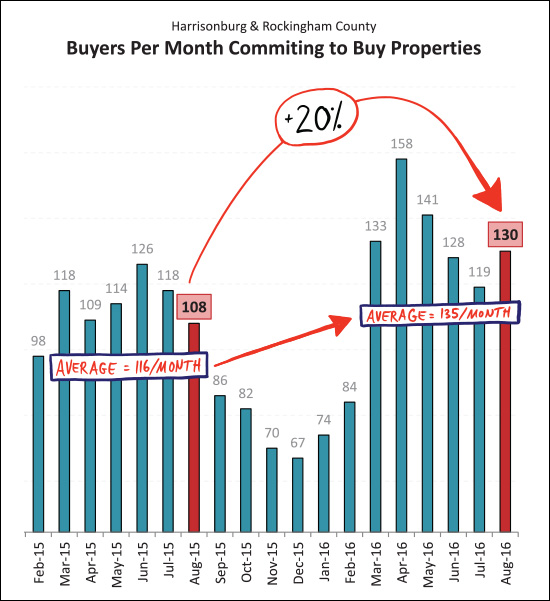
But wait, there's more. If you thought August home sales was the end of a series of strong months, you might be wrong. Take a look at the contract data (above) and you'll note that there were a whopping 130 contracts signed in August -- a 20% increase over last August. As such, we should expect to see strong September/October sales as well. Also of note, over the past six months we have seen an average of 135 contracts signed per months, as compared to only 116 per month a year prior.
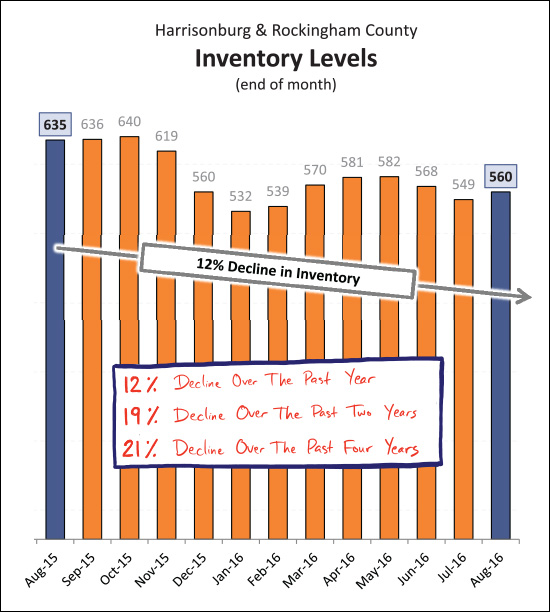
And the inventory levels keep on dropping. Buyers have fewer and fewer choices these days with current inventory levels hovering around 560 homes for sale in Harrisonburg and Rockingham County. This results in the best listings (price, condition, marketing) being sold quickly. There is much more to know, learn, read.... I'll pause here for now, but I'll let you explore that and read further on your own if you so choose. You can read my entire market report online....
| |
Fewer Sellers Providing Closing Cost Credits |
|
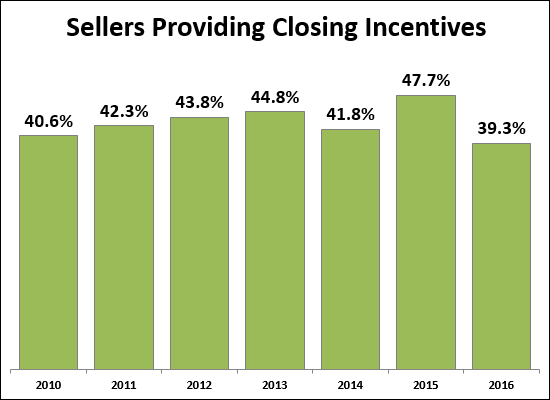 Only 39.3% of sellers have paid for a part the buyer's closing costs on home sales that have closed thus far in 2016. This marks a decline from the 47.7% of sellers who paid buyer closing costs last year. However.... 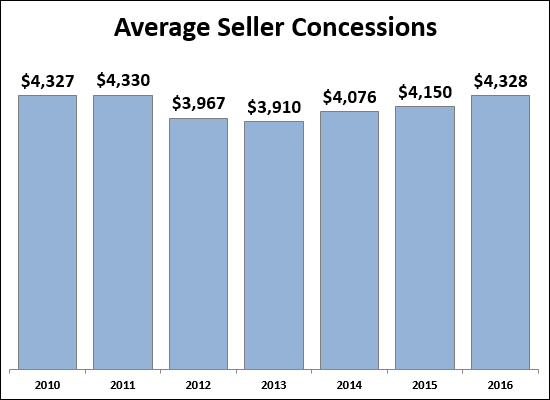 As shown above, the amount of closing costs that sellers are paying is certainly increasing. The average amount of closing costs paid by a seller (when a credit was provided at all) has increased from $4,150 (in 2015) to an average of $4,328 in 2016. Also of note.... 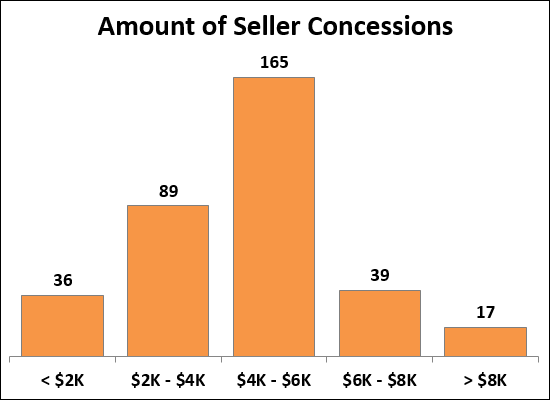 As shown above, of the sellers who are paying buyer closing costs, it is most common for them to pay between $4K and $6K towards the buyer's closing costs. So....if, as a seller, you are asked to pay the buyer's closing costs -- you are not alone (40-ish percent of sellers do) and you will likely be asked to pay $4K - $6K. | |
Showings Up, Down, Up, Down, Up, Down |
|
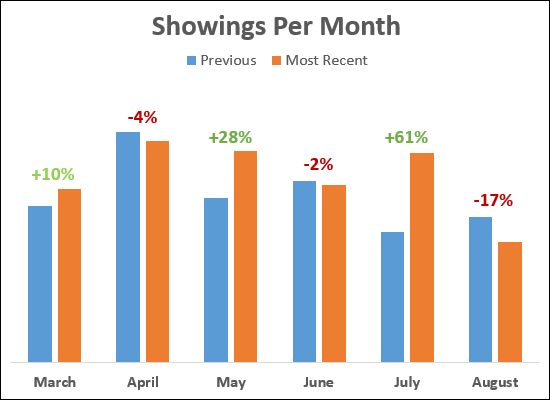 It has been hard to see the overall trajectory of showings this Spring/Summer as compared to last Spring/Summer since we have had both better and worse months of showings. Let's summarize a bit.... Mar/Apr/May 2016 as compared to Mar/Apr/May 2015 = 10% increase Jun/Jul/Aug 2016 as compared to Jun/Jul/Aug 2015 = 11% increase So, while each individual month might be better or worse than the next, it seems that showings are, overall, increasing this year as compared to last year. | |
Early Look Shows Strong Month of Contracts |
|
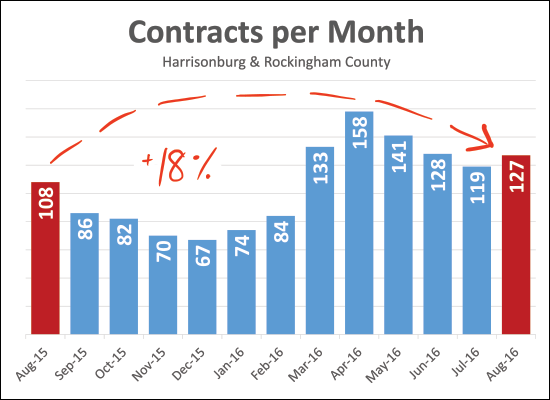 An early look at August 2016 data shows that it was another STRONG month of buyer activity, with 127 signed contracts. This marks an 18% increase over last August -- and an increase from July 2016 as well. | |
Are home sales trends catching up with population growth? |
|
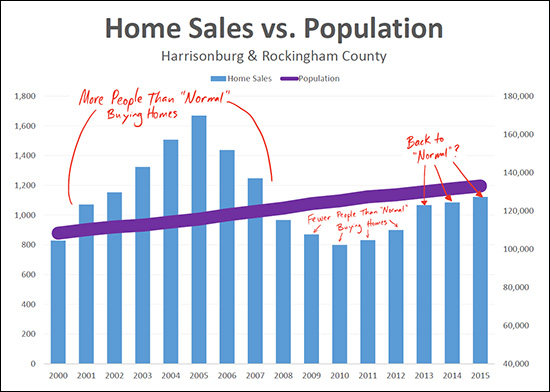 click here for a larger image The Weldon Cooper Center 2015 Population Estimates show that Harrisonburg and Rockingham County are growing, as usual. 2015 Population Estimates: Harrisonburg: 53,875 Rockingham County: 79,134 Combined City/County: 133,009 (up 1% from 131,565 last year) If we take 2000 home sales as a baseline portion of the population to be buying in any given year, and then we project forward based on actual population growth, we can conclude that.... More people than usual bought between 2001 and 2007. (housing boom) Fewer people than usual bought between 2009 and 2012. (housing bust, and then recovery) In 2013/2014 we may have finally returned to a "normal" portion of the local population to be buying in a given year. Based on the data presented above, I believe the new "normal" number of people to be buying per year may be around 1,100. | |
Fall is not the worst time to sell your home |
|
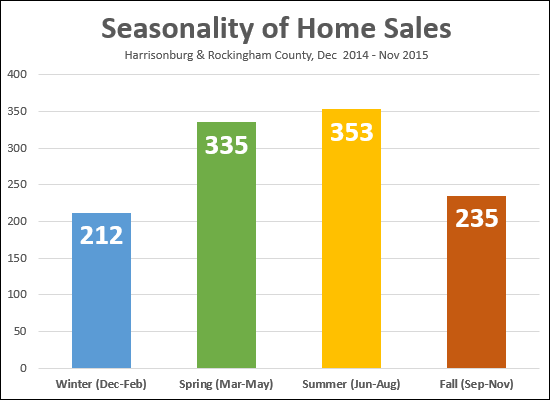 It is, however, the second-worst time of the year to sell your home. The data above reflects the timeframe during which properties went UNDER CONTRACT -- not when they closed. Plenty of the Summer contracts turned into Fall closings -- but the 235 figure is a reflection of how many buyers made buying decisions (signed contracts) between September and November of last year. So....if you want to sell your home (and close on it) in 2016, you should be thinking about getting it on the market sooner rather than later. | |
84 out of 100 buyers are buying for less than $300K |
|
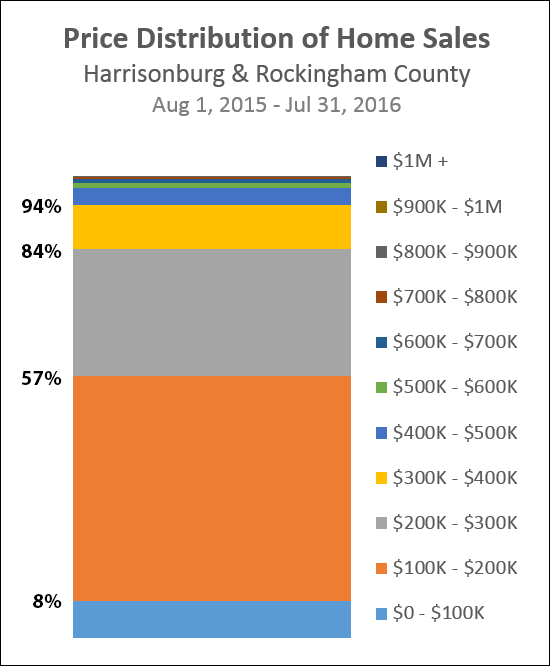 Looking at home sales in the past year we find that....
Clearly, that also means that only 6% of our local market is comprised of home sales over $400K. | |
| Newer Posts | Older Posts |
Scott Rogers
Funkhouser Real
Estate Group
540-578-0102
scott@funkhousergroup.com
Licensed in the
Commonwealth of Virginia
Home Search
Housing Market Report
Harrisonburg Townhouses
Walk Through This Home
Investment Properties
Harrisonburg Foreclosures
Property Transfers
New Listings

