| Newer Posts | Older Posts |
You are most likely to sell your home in the first 60 days on the market |
|
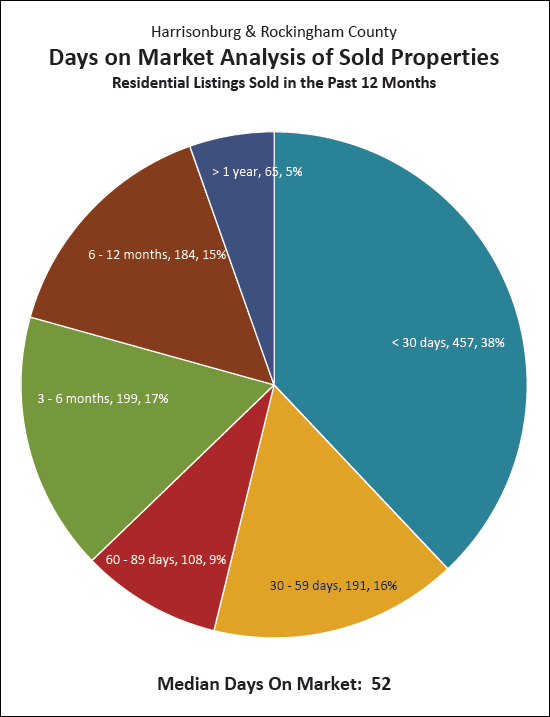 And by that I mean that that more than 50% of the homes that sold in the past year went under contract within the first 60 days that they were on the market. So, as a seller, if you are getting ready to put your house on the market, make sure you are thinking about price, condition and marketing. If your house has already been on the market for 60 days, and is not under contract, it might be time to think through....
Of course, plenty of homes (46%) go under contract after they have been on the market for 60 days -- so that is not necessarily the time to panic -- but it is a good time to pause and take inventory of where things are, making sure that you feel confident in your strategy for moving forward towards a successful sale. For even more analysis of our local housing market, check out.... | |
Will we see 1200 home sales this year in Harrisonburg and Rockingham County? |
|
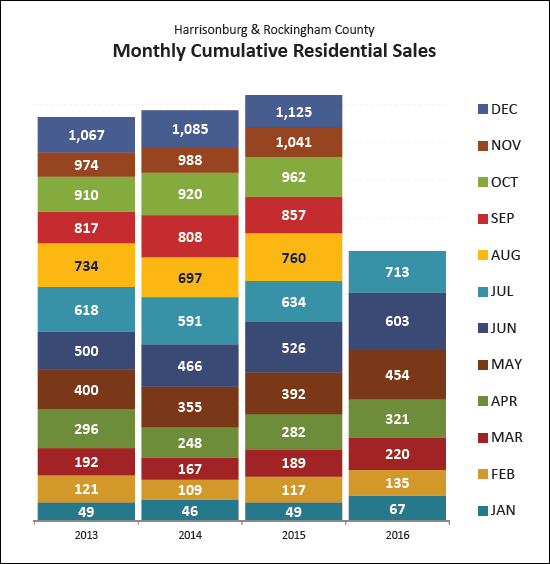 Based on how the year is going thus far, I think we might see 1200 home sales this year. We are currently 79 home sales ahead of the 2015 pace at this time of year -- and if we add those 79 home sales to last year's 1125 home sales, we'd be just over 1200 sales for the year. The only time we have seen more than 1200 sales in a year in Harrisonburg and Rockingham County was between 2003 and 2007 -- the infamous housing boom that lead to the dreaded housing bust. It seems unlikely that 1200 home sales in 2016 will be a sign of another boom (and bust) on the way -- as we are seeing much slower and steadier growth now. For even more analysis of our local housing market, check out.... | |
Market Balance By Price Range |
|
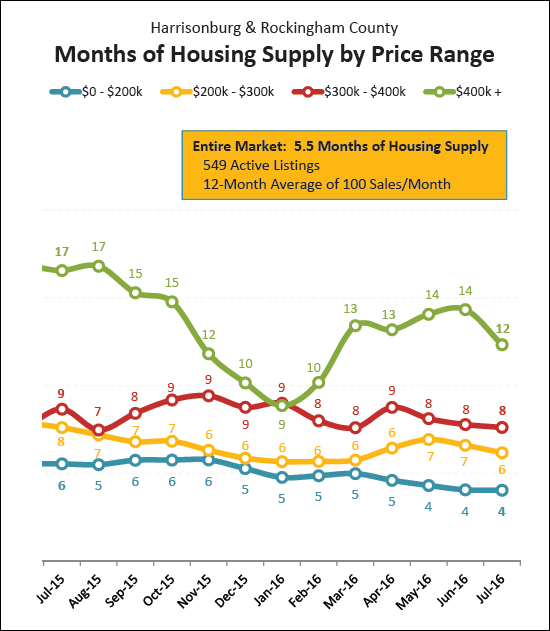 Many housing market analysts consider a six month supply of homes for sale to be an indication of a market that is balanced between buyers and sellers. As such, and based on the information presented above, it would seem safe to say that....
For even more analysis of our local housing market, check out.... | |
More Homes are Selling, Faster, at Higher Prices in Harrisonburg, Rockingham County |
|
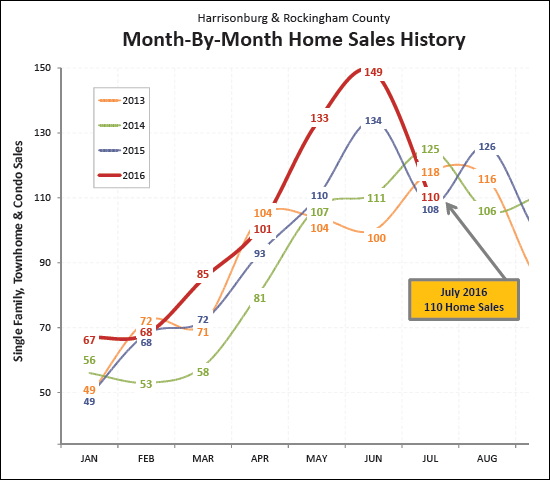
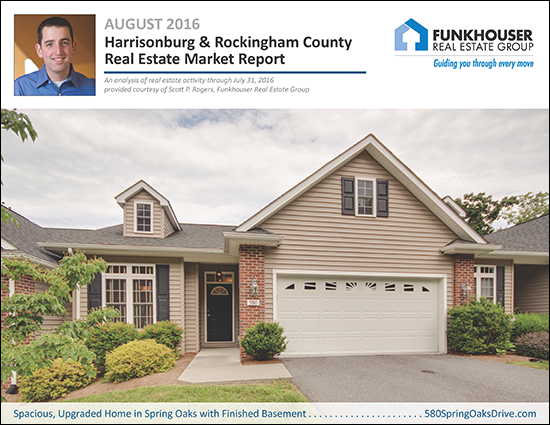 Learn more about this month's Featured Property: 580 Spring Oaks Drive I just published my monthly report on the Harrisonburg and Rockingham County real estate market. Jump to the full online market report, watch the video overview below, download the PDF, or read on for highlights.... First, a video overview....  Now, let's take a look at the overall market performance in July.... 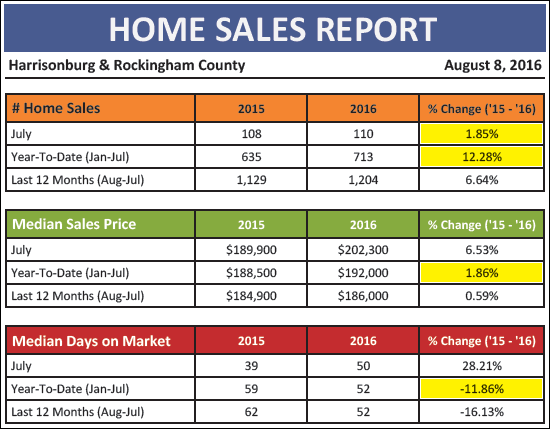 A few things jump out at me when looking at the chart above....
July could be seen as a disappointment in some ways. We didn't see sky high home sales, towering over all previous months of July. We only saw a tiny 1.85% increase in sales as compared to July 2015. But wait -- before we become too glum about the 110 home sales in July, let's not forget the record breaking months of sales that we saw in May and June! Just for fun, let's look at May through July home sales for the past few years....
So, yes, I think we can be satisfied with the 110 home sales we saw in July 2016 given the slightly larger context.
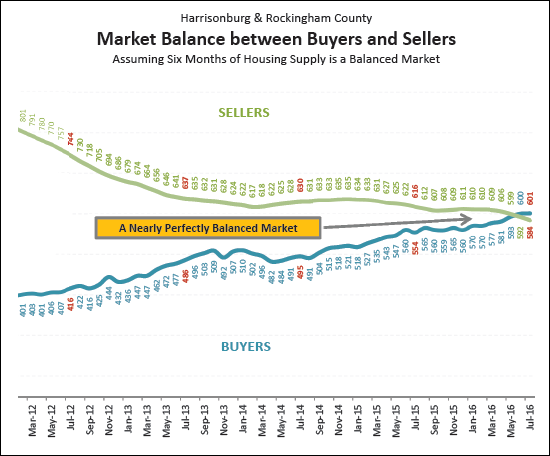
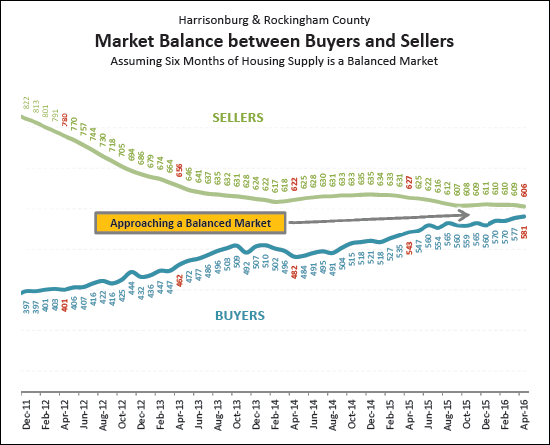
The graph above is somewhat complicated, but very important as to an understanding of our local housing market. The green "SELLERS" trajectory is showing the number of homeowners trying to sell their homes. The blue "BUYERS" trajectory shows the number of buyers closing on the purchase of homes in a six month period. This graph, therefor, is a good indication of overall market balance in our local housing market, as many housing market analysts consider a six month supply of homes for sale to be a sign of a market that is balanced between buyers and sellers. As shown above, after many years, we finally saw these trajectories cross last month. That is to say that there are now more buyers buying in a six month period than there are sellers selling. As such, if we've been approaching a balanced market for the past year, it is now definitely "in balance" -- even if that varies some from price range to price range.
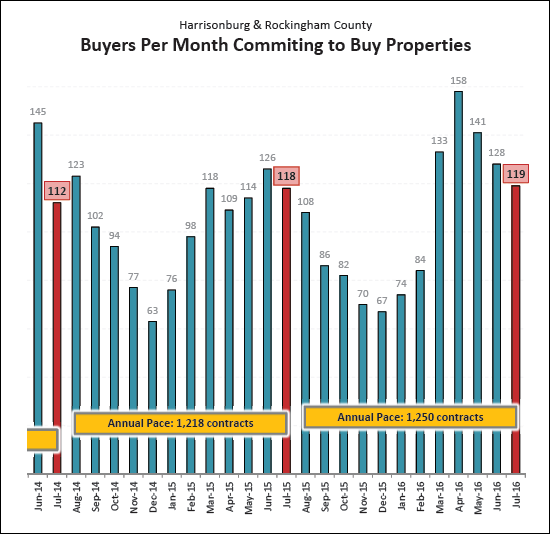
Taking a look at buyer activity in the form of signed contracts, we see that July was another relatively strong month with 119 contracts signed -- as compared to 118 last July. Put in a slightly larger context, we have seen an average of 136 contracts per month over the past five months -- as compared to an average of only 117 contracts per month during the same timeframe in 2015.
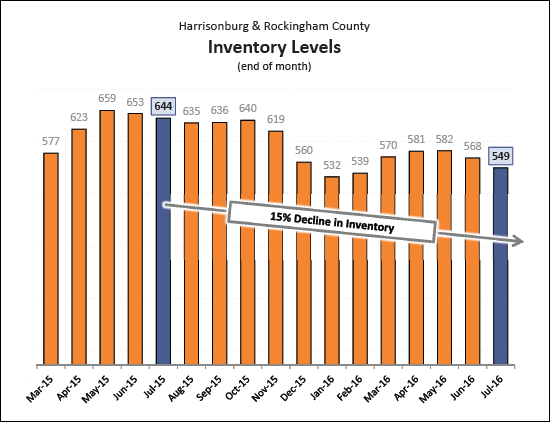
One of the ways that we have achieved the market balance illustrated above is by a reduction in the number of homes for sale. As the graph above indicates, we have seen a 15% decline in inventory levels over the past year. Thus, buyers a year ago had 644 homes to choose from -- and today can only choose from 549 properties. OK, let's cut off my ramblings about our local market there for now. There is a lot more more in my full real estate market report, but I'll let you explore that and read further on your own if you so choose. I'll continue to delve into the latest trends on HarrisonburgHousingToday.com over the next few days, but if you just can't wait, feel free to read the entire report online....
| |
Housing costs stay relatively level despite increasing home values |
|
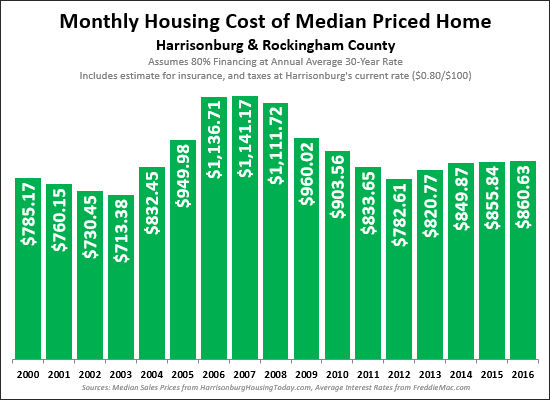 How much does it cost on a monthly basis to buy the median price home in our area, assuming 80% financing? Today, that adds up to an $681 monthly payment -- which is right in the same ballpark as what we've seen for the past two years ($850, $856). How can housing costs be staying relatively level if home values are increasing? Well, it's the declining mortgage interest rates, of course! The graph above shows how much you would pay in a monthly payment for each of the past 16 years if you financed 80% of the purchase price at the average interest rate for that year. These payments include an estimate for your insurance costs, and property taxes based on Harrisonburg's current rate of $0.80 per $100 of assessed value. Another pretty wild perspective -- over the past 16 years, housing costs (understood as outlined above) have only increased by 9.6%. | |
Market Balance (Months of Supply) By Price Range |
|
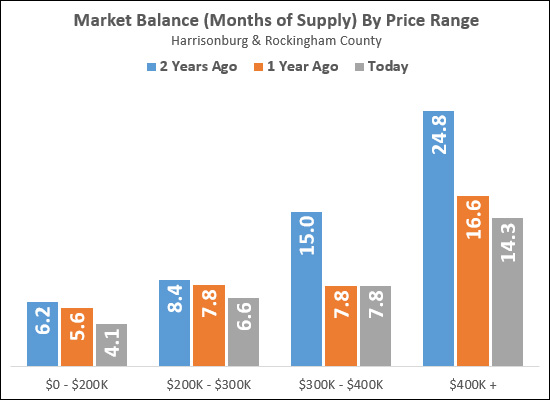 Most housing market analysts consider six months of inventory (active listings) to be an indicator of a balanced market (between buyers and sellers). This past month, our local housing market achieved that balance for the first time in a long time -- the number of buyers buying in a six months period exceeded (just barely) the number of houses for sale. HOWEVER -- it is important to note that this overall market reality can obscure the underlying trends in different segments of our local market. As shown above....
Read more about the latest market trends at HarrisonburgHousingMarket.com.... | |
Best First Half of the Year Since 2007 |
|
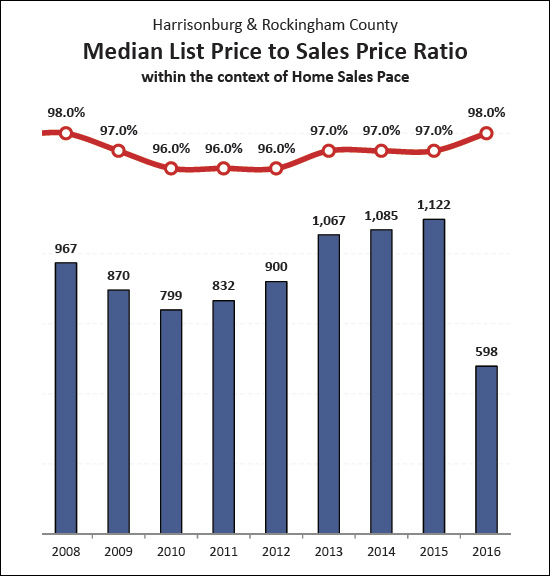
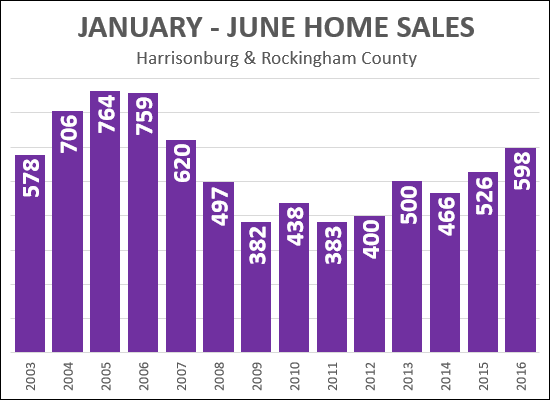 As is shown above, this year's 598 sales between January and June are the most sales in the first half of the year that we have seen since waaaaaay back in 2007. Looks like this will be a solid year of home sales for Harrisonburg and Rockingham County! Read more about the latest market trends at HarrisonburgHousingMarket.com.... | |
Are home values increasing in Harrisonburg? |
|
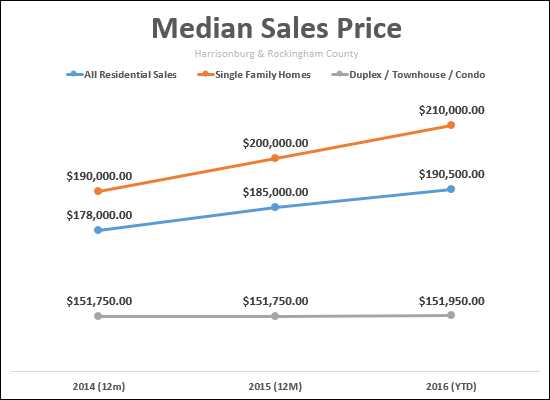 Yes, depending on how you look at the data....
Read more about the latest market trends at HarrisonburgHousingMarket.com.... | |
Just how quickly are people buying homes these days? |
|
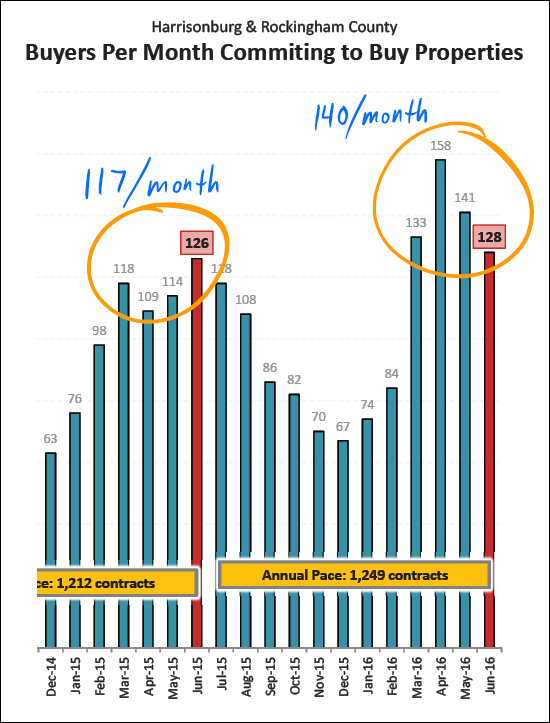 Fast, really fast. If we look at the Spring (and early Summer) buying season this year, as compared to last year, we will note that there has been a 20% increase in the pace of contracts being signed. Last year, an average of 117 contracts were signed each month between March and June. This year, that metric rose to 140 per month! Read more about the latest market trends at HarrisonburgHousingMarket.com....  | |
Strong Home Sales in June 2016 Bring Further Balance to Local Market |
|
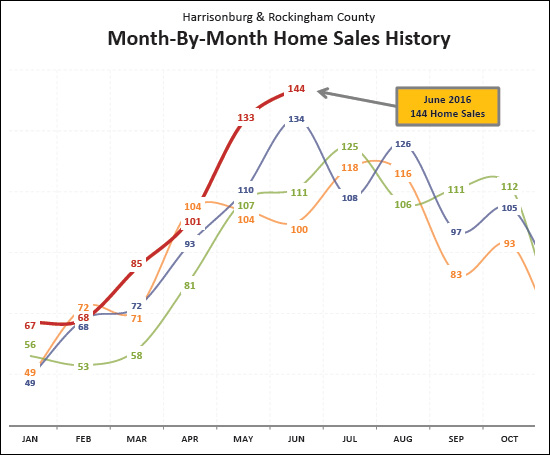
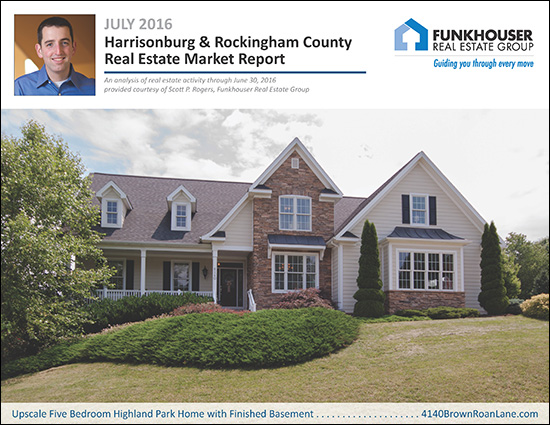 Learn more about this month's Featured Property: 4140 Brown Roan Lane I just published my monthly report on the Harrisonburg and Rockingham County real estate market. Jump to the full online market report, watch the video overview below, download the PDF, or read on for highlights.... First, a video overview....  Now, let's take a look at the overall market performance in June.... 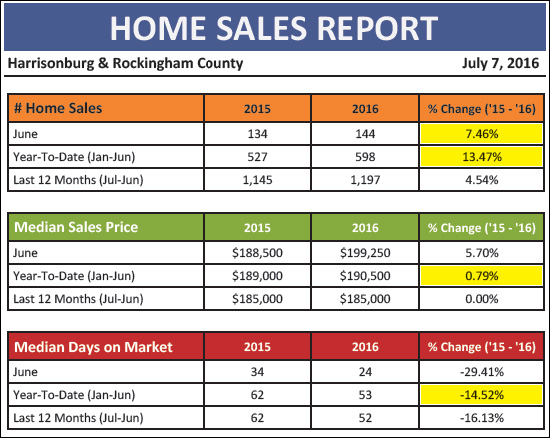 As shown above....
OK -- BIG NEWS HERE -- June 2016 home sales were "off the charts" as they say -- the highest month of monthly home sales we have seen in a LONG TIME! Actually, looking back further that this chart -- the last time we had more than 144 home sales was back in June 2007 -- at the peak of the market boom.
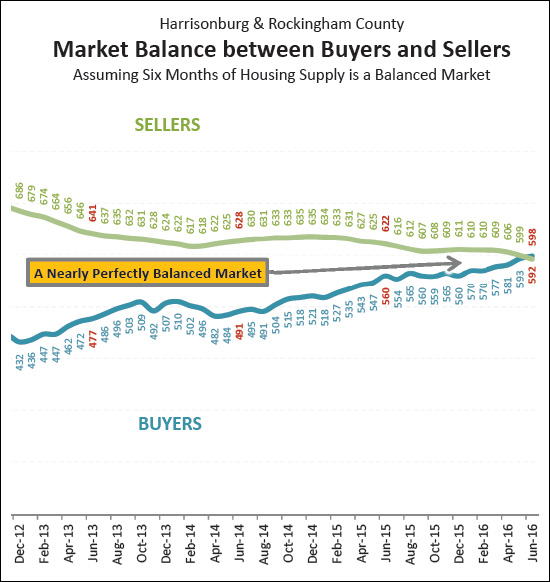
AND -- MORE BIG NEWS -- It happened! It really happened! Most housing market analysts consider six months of inventory (active listings) to be an indicator of a balanced market (between buyers and sellers). The "BUYERS" trend line above is illustrating how many buyers are buying in a six month period. The "SELLERS" trend line above is illustrating how many sellers are in the market (active listings) at any given time. Over the past four years we have seen a steady increase in buyers and a declining number of sellers. And finally, in June, these two trajectories have crossed! There are more buyers buying in a six month period than there are homes for sale!
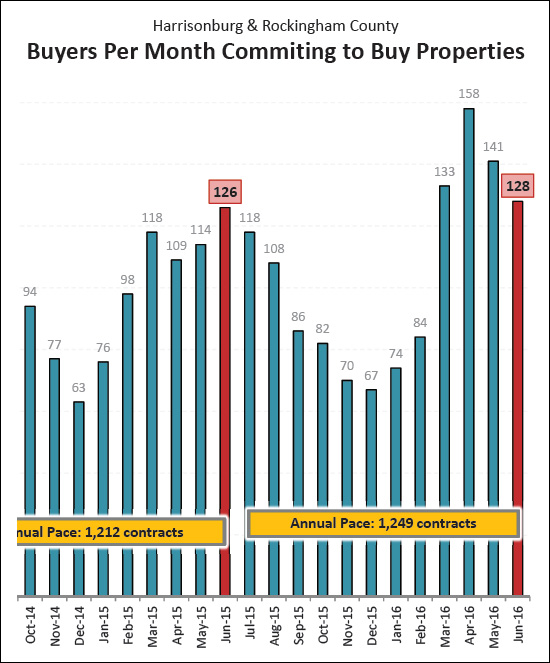 Finally, what should we expect as far as sales for the next few months? Based on recent contract activity, I am thinking we'll see another strong month of sales during July. To put this year in perspective, we have seen an average of 140 contracts per month over the past four months -- as compared to an average of only 117 contracts per month during the same timeframe in 2015. There is more, oh so much more, in my full real estate market report. I have even made it very easily accessible for you to read online....
| |
Buyers have fewer and fewer choices of homes to purchase these days |
|
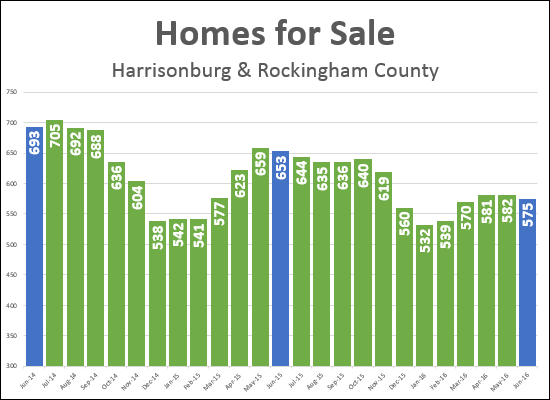 click here for a larger image Buyers have fewer and fewer homes to choose from these days. The blue bars above show that there were 693 homes for sale at this time two years ago -- 653 homes for sale at this time one year ago -- and only 575 homes for sale today! This decline in inventory has helped create a more balanced market -- but can also lead to a frustrating home search for many buyers, depending on their desired price range and location. | |
Home Sales Preview, June 2016 |
|
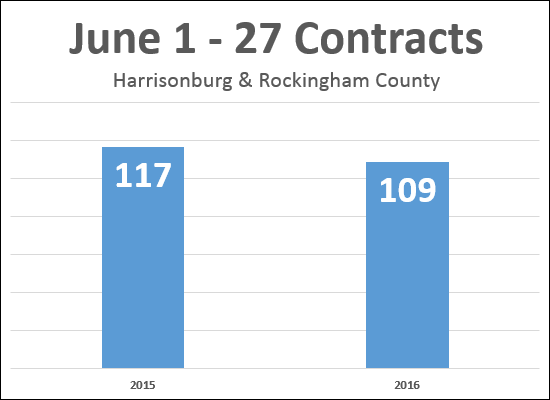 Are home sales slowing down a smidge in June 2016? The graph above shows the number of contracts ratified in the first 27 days of June this year as compared to last year. As you can see, buyers have not quite been keeping up with the pace of contracts seen last year. Stay tuned for a full analysis of the most recent market data in the first week or two of July. And if you're a buyer -- go buy a house, and help out those 2016 numbers. ;-) | |
Home Sales on the Rise in Local Market in May 2016 |
|
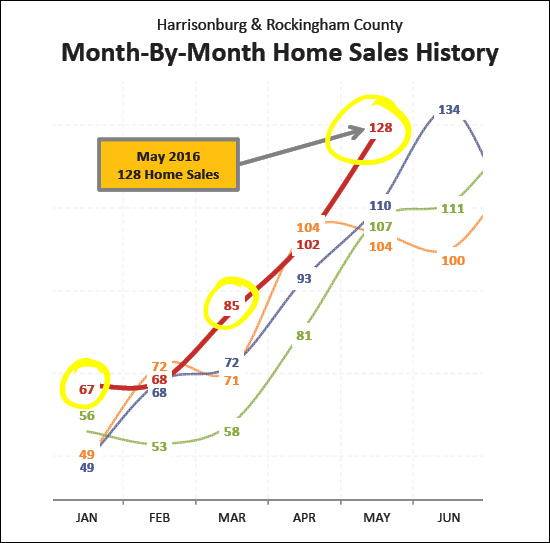
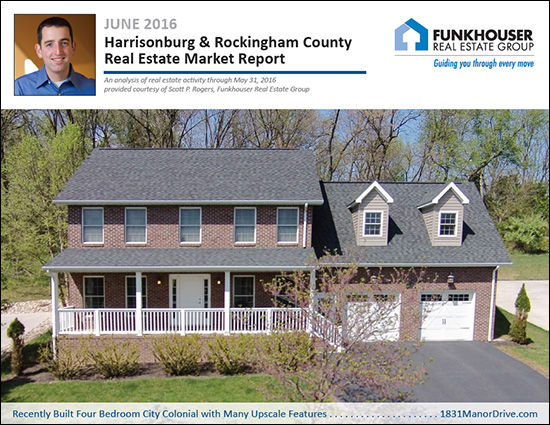 Learn more about this month's Featured Property: 1831 Manor Drive I just published my monthly report on the Harrisonburg and Rockingham County real estate market. Jump to the full online market report, watch the video overview below, or download the PDF, or read on for highlights.... First, a video overview....  Now, let's take a look at the overall market performance in May.... 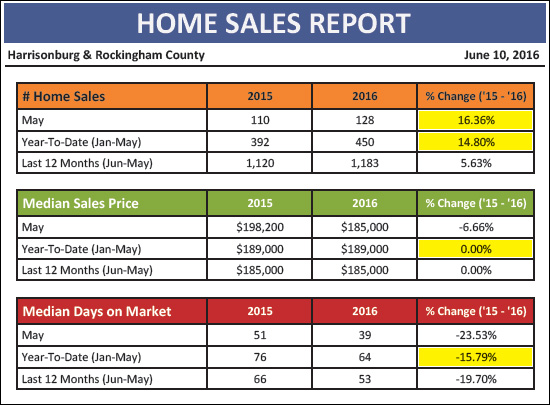 The local housing market is, again, showing signs of strength....
As shown above, there have been several months in particular -- January, March, May -- that have catapulted us to our current 15% improvement in home sales this year as compared to last year.
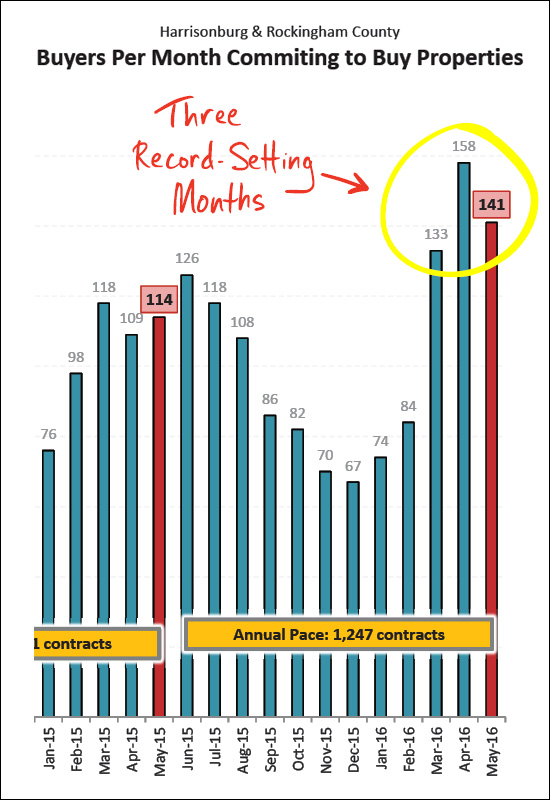
We have seen buyers signing contracts in record numbers over the past three months -- which bodes well for strong sales in June as well as (likely) July.
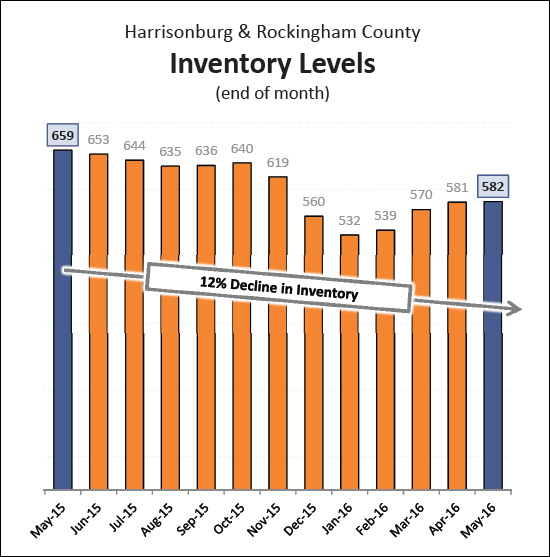
Buyers are buying faster than sellers are ready to sell. Inventory levels, as shown above, have declined 12% over the past year. Buyers are seeing fewer and fewer choices of homes to purchase.
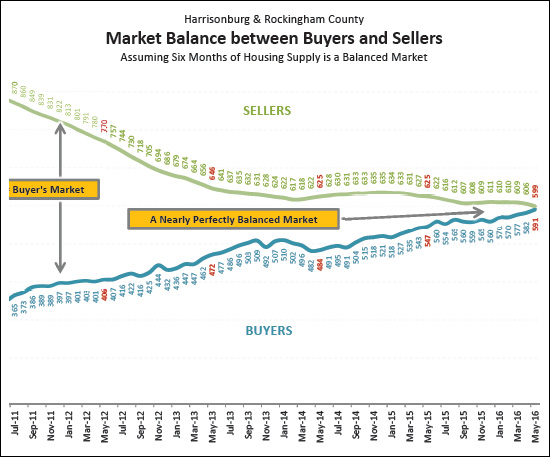
Finally, the market graph we've all been waiting for -- as shown above, we are finally (!) approaching a perfect balance between buyers and sellers in our local market -- with almost exactly six months of supply available. This is a result of a slowly increasing pace of buying activity over the past few years -- and a slowly declining inventory level during the same timeframe. BUT WAIT -- remember -- all real estate is local, and sometimes that means down to the city, town or even neighborhood. If you are getting ready to sell your home, we should start by looking at these overall trends -- but then we'll need to dive much deeper into the analysis of your price range, neighborhood. property type, etc. There is more, oh so much more, in my full real estate market report. I have even made it very easily accessible for you to read online....
| |
The BRICK vs VINYL showdown |
|
How do homes with brick exteriors sell as compared to vinyl-sided homes? Let's take a look to see what the data shows us. To somewhat narrow the scope, this analysis only considers single family homes in Harrisonburg and Rockingham County, sold for more than $300K, with at least 3000 SF, on less than an acre, that have sold in the past year.... More brick homes sell.... 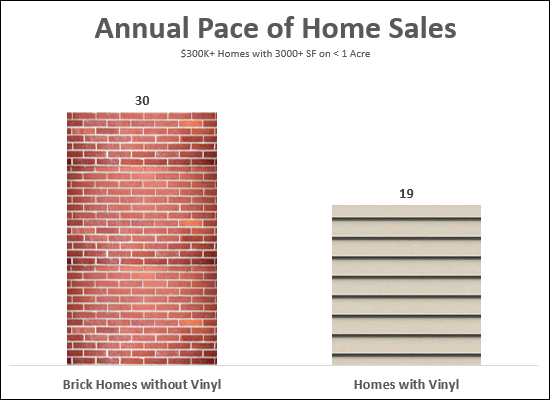 Brick homes tend to be larger.... 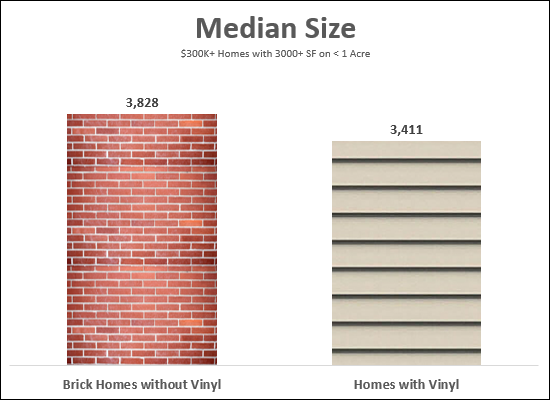 Brick homes sell at higher prices.... 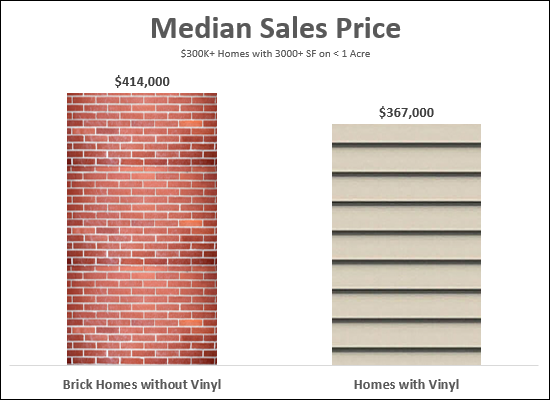 Brick homes sell at a higher price per square foot.... 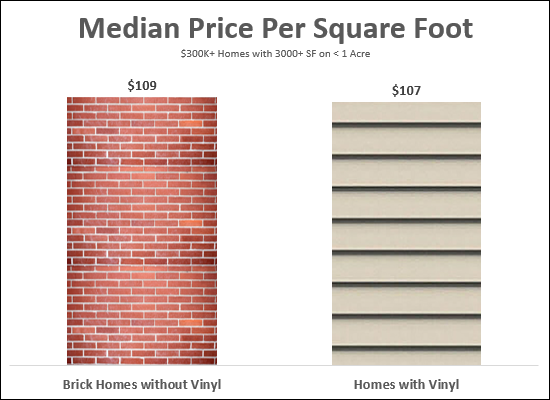 | |
May was a STRONG month for showings |
|
 There have been lots of showings in recent months, leading to lots of contracts -- and the latest (May 2016) data shows another strong month of showings, with 25% more showings as compared to last May. I expect this will have resulted in another strong month of contracts, which I'll verify in the next week or so with a thorough look at our overall residential sales market. Getting ready to buy a home? Learn more about the process at BuyingAHomeInHarrisonburg.com. | |
Should I rent or buy a townhouse in Harrisonburg? |
|
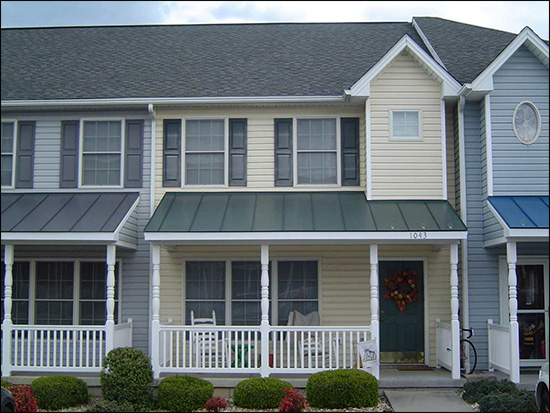 Given continued low interest rates and some increase in home values, let's take a new look at the opportunities of buying versus renting. RENT = $1000/m. There are regularly options for renting a two-story townhouse in Harrisonburg for approximately $1000 / month in Avalon Woods, Beacon Hill, Stonewall Heights, Liberty Square, etc. BUY = $865/m. With a 95% loan, buying such a townhouse apparently may cost as little as $865 per month assuming a $140K purchase price and 3.875% interest rate per SunTrust Mortgage's payment calculator.... 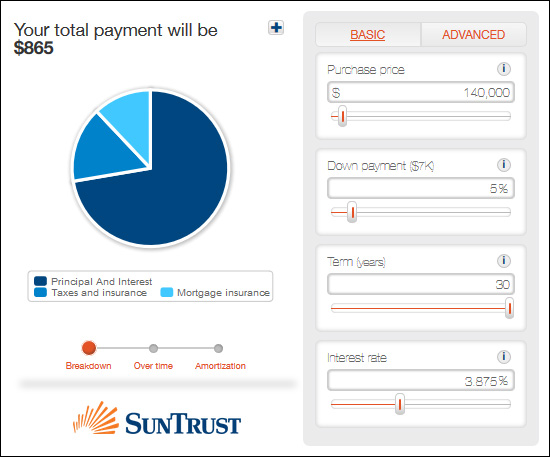 This shows an $135/month cost savings of buying instead of renting. If we then look at the difference between renting and buying over a five year time period, the advantages start to pile up.  As you can see, this builds a rather compelling case for buying instead of renting if you are going to be living in this potential townhouse for the next five years. Two other factors to keep in mind....
| |
The First Time Buyer Is Back! |
|
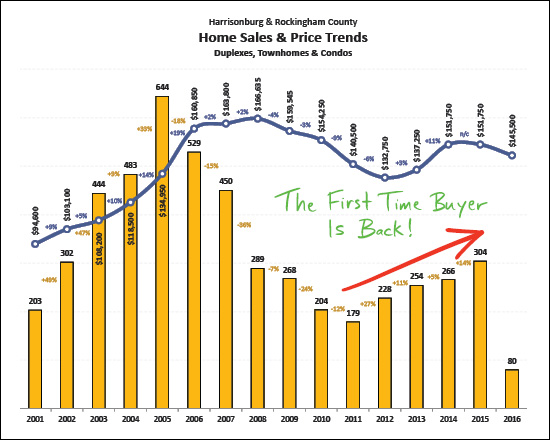 Between 2001 and 2004, the number of duplex / townhouse / condo sales increased drastically from 203/year to 644/year. Many of these sales were first time buyers, eager to latch onto the rapidly increasing home value trend. Between 2005 and 2011, the number of buyers per year dropped just as significantly, all the way down to 179 buyers per year in 2011. Now, however, we have seen a steady increase in duplex / townhouse / condo buyers over the past four years --- and much of this increase is a return of the first time buyer. Low interest rates, and home values that are not declining any longer, have both drawn first time buyers back into the market again in larger numbers than in some recent years. | |
April 2016 was the BEST MONTH EVER for contracts |
|
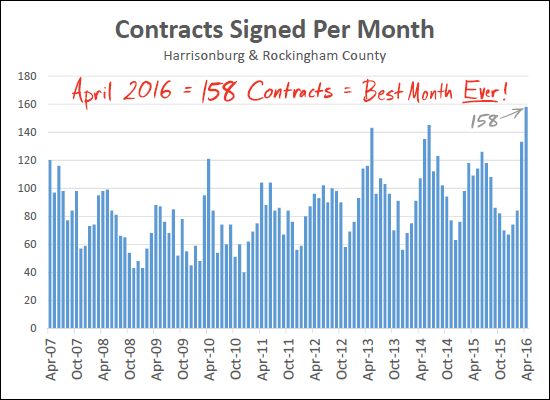 Yep, you heard that correctly, April 2016 was the BEST MONTH EVER -- there has never been another month in Harrisonburg and Rockingham County when more buyers contracted to buy homes. Stay tuned for what might come in May and June. Could we see even higher levels of contract activity? Read more about the local housing market.....  | |
Local Housing Market Shows Strength, Growth in April 2016 |
|
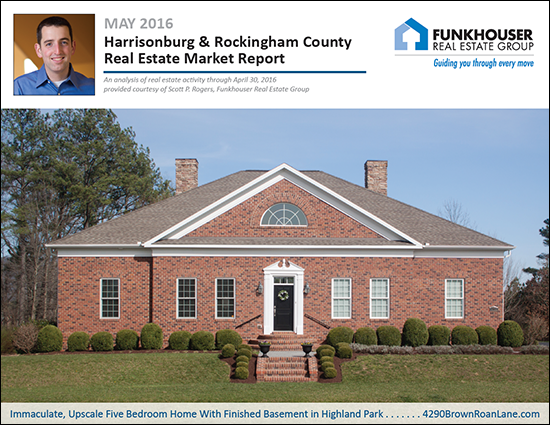 Learn more about this month's Featured Property: 4290 Brown Roan Lane I just published my monthly report on the Harrisonburg and Rockingham County real estate market. Jump to the full online market report, watch the video overview video, or download the PDF, or read on for highlights.... First, a video overview....  Next, let's take a look at the overall market performance in April.... 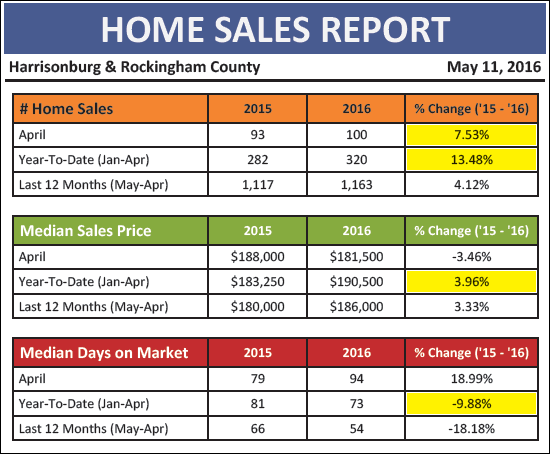 We are, again, looking at signs of strength and growth for our local market....
Let's dig into a few details....
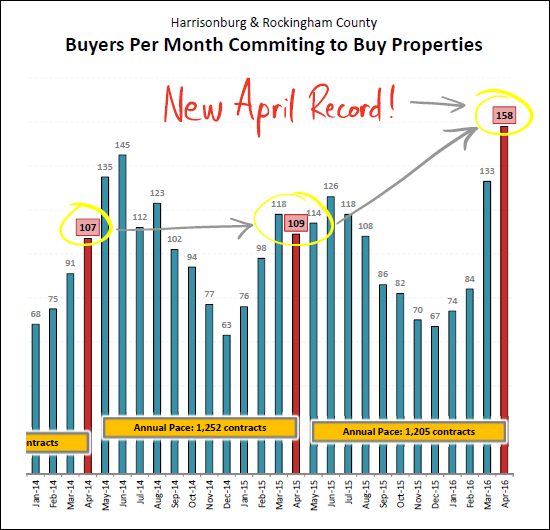
Wow! This graph shows very clearly (look at the last two bars on the right) how HOT of a Spring real estate market we are experiencing this year. The pace of contracts in March was a new record for March -- and in April, buyers have done it again. As far back as I have on record (2007) there has never been a month of April when this many (158) contracts have been signed in Harrisonburg and Rockingham County.
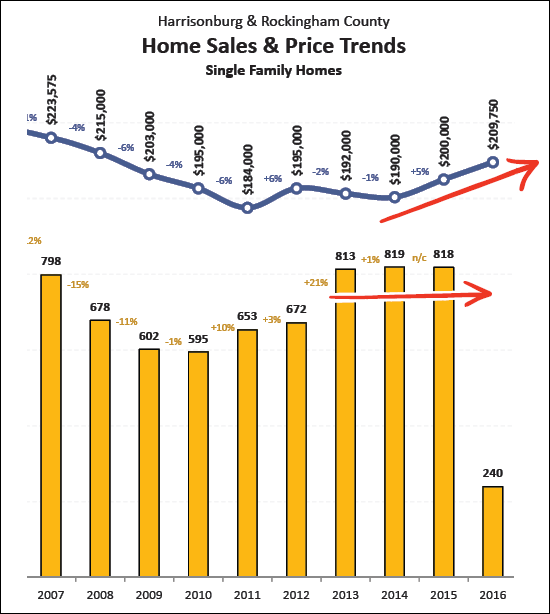
Single family homes are often the best indicator of overall trends in a local housing market. As shown above, sales of single family homes are quite stable -- and the median price has been on the rise for several years now. It seems likely that we will see another increase in the median sales price of single family homes in 2016.
Most housing market analysts consider six months of inventory (active listings) to be an indicator of a balanced market (between buyers and sellers). The "BUYERS" trend line above is illustrating how many buyers are buying in a six month period. The "SELLERS" trend line above is illustrating how many sellers are in the market (active listings) at any given time. Over the past four years we have been seeing a steady increase in buyers in the market and a decline in sellers in the market. In Summary.... | |
Do townhouse values generally increase over time? |
|
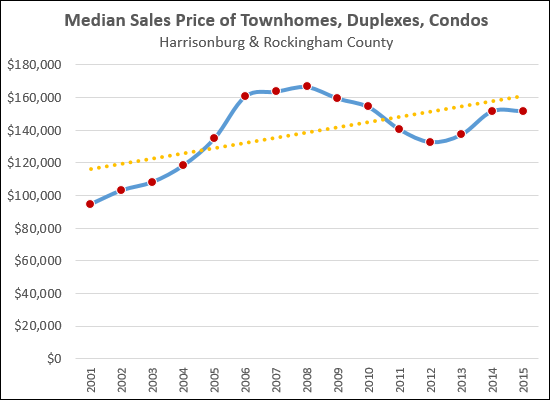 I had an interesting conversation with a potential real estate investor earlier this week -- he asked whether townhouses generally increase in value over time. We decided to take a look at the data, which is shown above, and the conclusions are not necessarily clear.
So, in the past 15 years, there have been some intense increases, some depressing decreases, and some recent recovery. The yellow line is the general trendline over time, which shows that overall, values have trended positively over the past 15 years. So, do townhouse values generally increase over time? Let's go with 'yes' for now -- but continue to monitor as we hopefully have a more normal next three to five years in our local real estate market. | |
| Newer Posts | Older Posts |
Scott Rogers
Funkhouser Real
Estate Group
540-578-0102
scott@funkhousergroup.com
Licensed in the
Commonwealth of Virginia
Home Search
Housing Market Report
Harrisonburg Townhouses
Walk Through This Home
Investment Properties
Harrisonburg Foreclosures
Property Transfers
New Listings

