| Newer Posts | Older Posts |
Home values in 22801 have fared better than most areas since 2004 (Washington Post) |
|
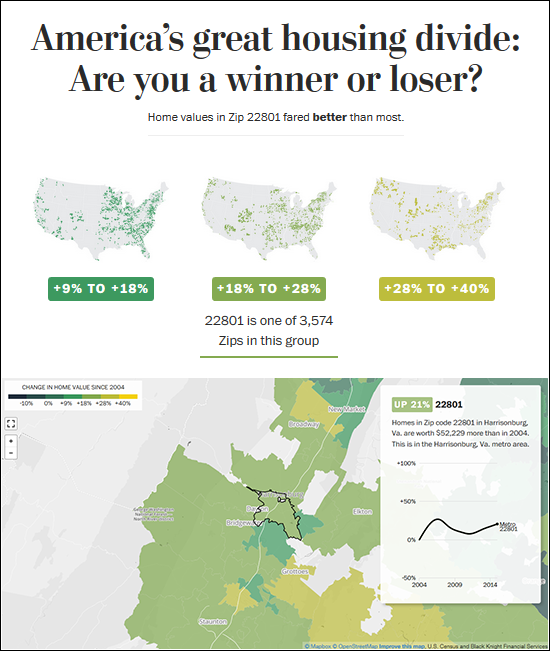 "The overall U.S. housing market has recovered from the crisis that plunged the country into recession. But a new analysis by The Washington Post shows that the recovery has been deeply uneven, creating winners and losers along lines of race, income and geography. " Explore this analysis at The Washington Post, with data specific to Harrisonburg (22801). | |
Buyers are at it again in April |
|
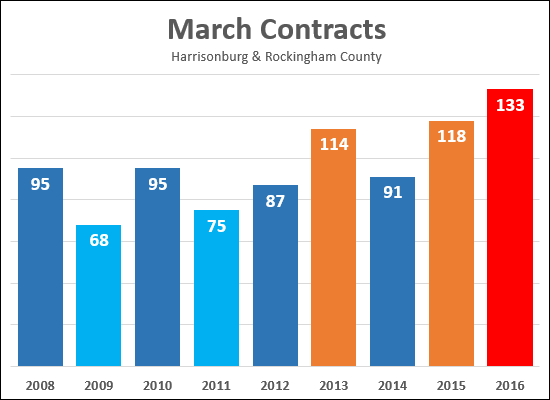
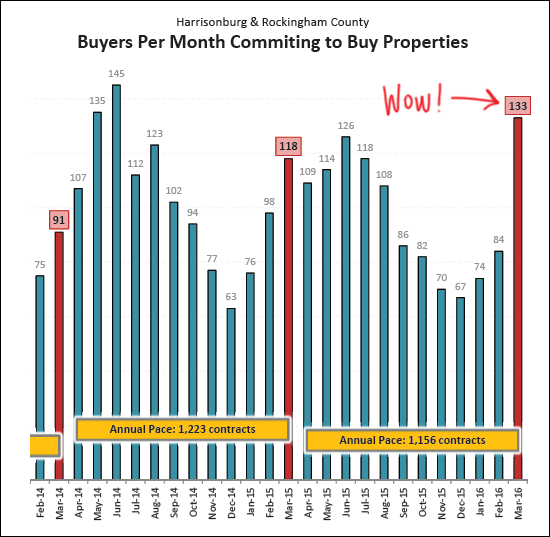
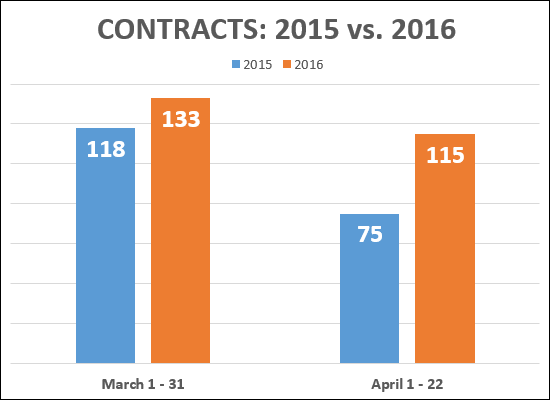 There were a record number of buyers (signing contracts) in March -- the 133 contracts shown above was a 13% improvement over last March, and was the highest month of March contracts on record as far as I can tell. Thus far in April, buyers are still quite active! In the first 22 days of April last year there were 75 contracts -- this year, 115 contracts! Stay tuned at the beginning of May for a final count of April contracts. | |
Predictably, twice as many buyers are choosing the County (over the City) in 2016 |
|
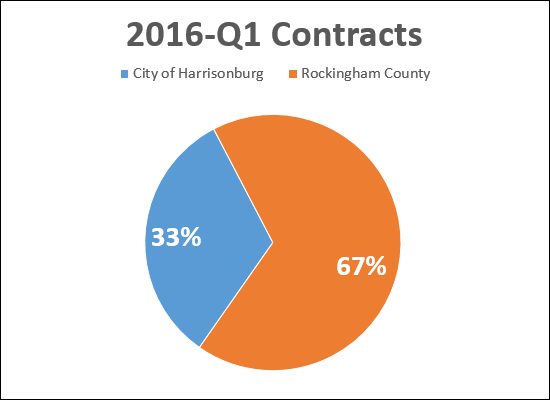 The first quarter of 2016 has been a (crazily) busy few months of contract activity -- especially in March. As shown above, twice as many buyers are contracting on homes in Rockingham County (192) as compared to the City of Harrisonburg (93). But, it turns out that shouldn't surprise us, based on the typical pace of buyer activity in the City and County.... 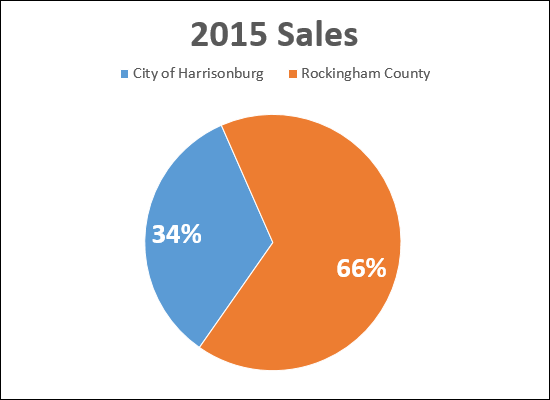 As shown above, last year there were just about twice as many home sales in Rockingham County (746) as there were in the City of Harrisonburg (379). But before you conclude that County home sellers have it soooo easy, because twice as many buyers are buying in the County, I should point out that there are actually MORE THAN twice as many homes for sale in Rockingham County (411) as compared to the City of Harrisonburg (151).... 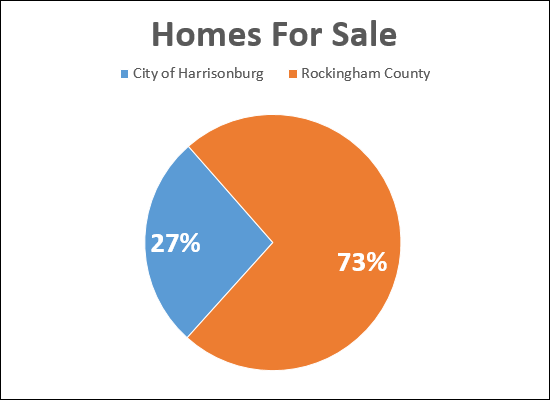 As such, there are actually more buyers per seller in the City than in the County. | |
Most March Contracts Ever? |
|
Buyers are busy buying, in most price ranges.... |
|
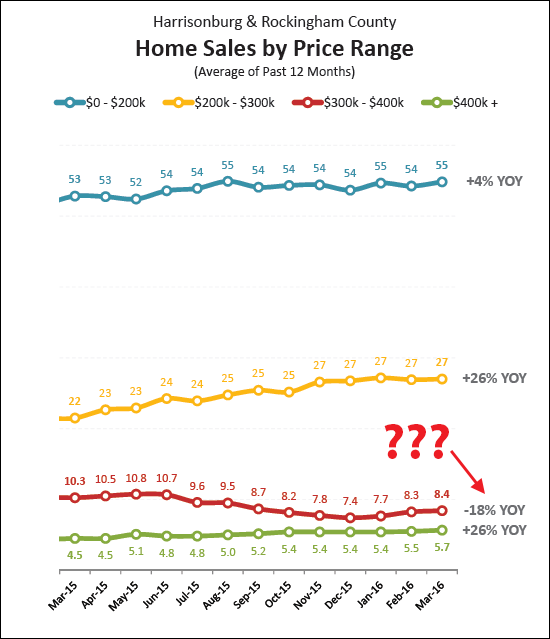 Home sales are on the rise -- on almost every price range:
So, what is happening with the $300K - $400K home sales? As shown above, they are down 18% year-over-year, though they are up 25% compared to where they were two years ago. Maybe it was a temporary boom of these buyers over the past year?? Theories welcome! | |
Home Sales, Median Prices on the Rise in 2016 Q1 |
|
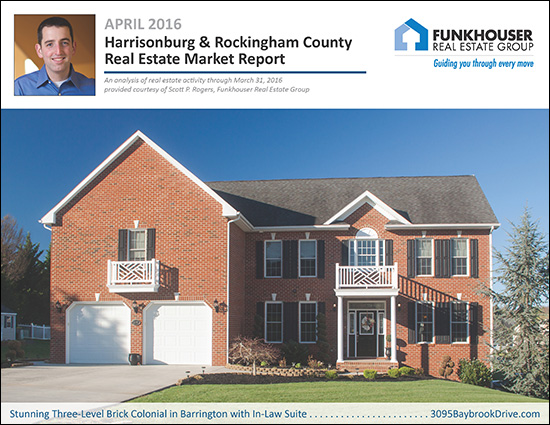 Learn more about this month's Featured Property: 3095 Baybrook Drive I just published my monthly report on the Harrisonburg and Rockingham County real estate market. Jump to the full online market report, watch the overview video below, or download the PDF, or read on for highlights.... First, a video overview....  Next, let's take a look at the overall market performance in March.... 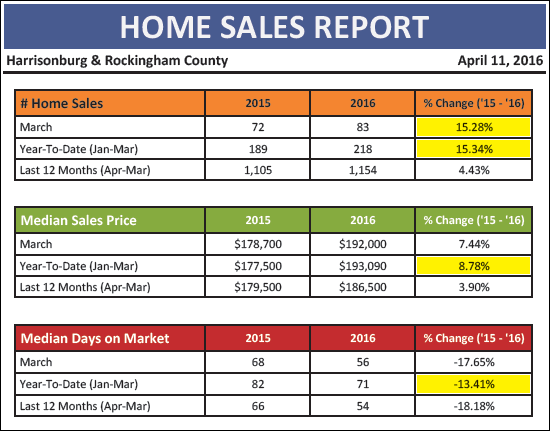 Some rather good news, in all areas, as far as improvements in our local market....
OK -- now with that formality aside, let's talk about the crazy, wild, unbelievable stat of the month....
Yes, you are reading that correctly....
So, buyers were actively signing contracts in March 2016, it seems. :)
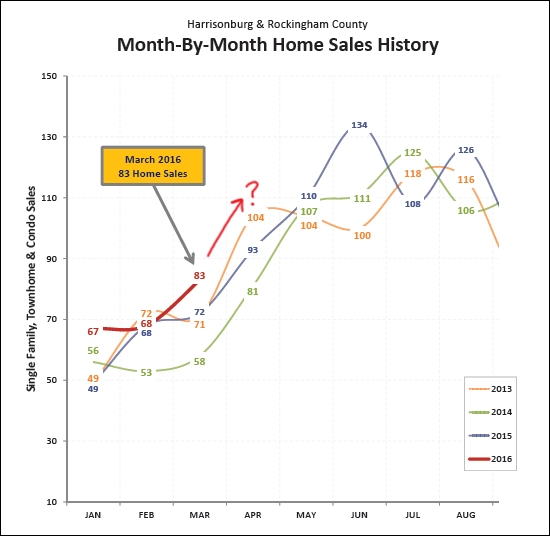
As shown above, the 83 home sales in March 2016 were the highest of any recent March. The question now remains -- how many home sales will we see in April? Could the 133 contracts from March help boost the market up to more than 104 sales in April?
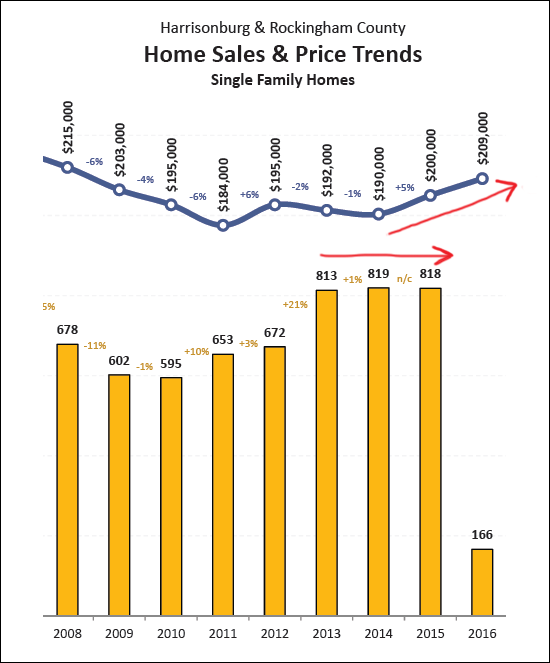
One last trend that I am watching closely -- the single family home market. As shown above, we have seen a relatively steady number of single family home sales over the past few years -- which is neither thrilling nor depressing. The median sales price, on the other hand, has been steadily climbing -- great news for anyone who owns a home, or likes to see an improving housing market. In Summary.... | |
Showings on the rise in March 2016 |
|
 Showing activity is on the rise in March 2016 -- with 8% more showings than last March. This is after a slower December/January as compared to the same time a year ago. I anticipate that this will be a busy Spring season for our local real estate market. | |
Archive of Harrisonburg Housing Market Reports |
|
 You can now access market reports back to 2013 by visiting HarrisonburgHousingMarket.com. Whether you are looking for the most recent report, or if you are interested to see how things were looking a few years ago, you are welcome to explore them all. Also of note, the best ideas for additions to my monthly market reports come from YOU! If you have further questions about our local housing market that are not covered by my monthly market reports, let me know! | |
If you bought in X then your house is likely now worth Y |
|
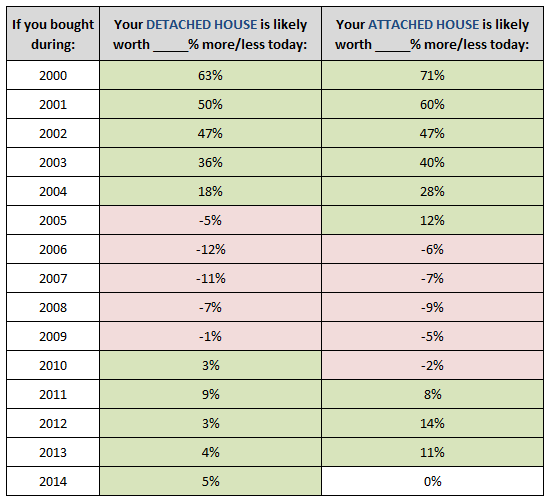 The chart above is calculated based on comparing the 2015 median sales price to the median sales price in each of the prior 15 years. Several key points to take away from this chart....
| |
When do buyers start buying in earnest? (Now!) |
|
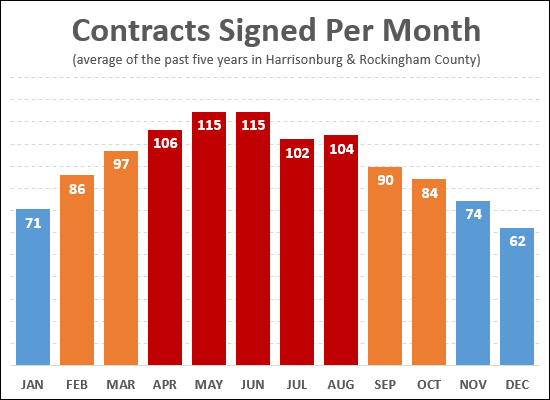 The buyers are coming, the buyers are coming! As you can see, above, buying activity starts creeping up as soon as February, more so in March, and APRIL is the third hottest month of the year for buyers to be signing contracts. Timing is everything -- so if you're thinking of selling this Spring/Summer let's talk about how the data above might speak into your real estate plans. Read more about recent market trends in the most recent version of my monthly housing market report, found online....  | |
Local Housing Market Shows Continued Strength in February 2016 |
|
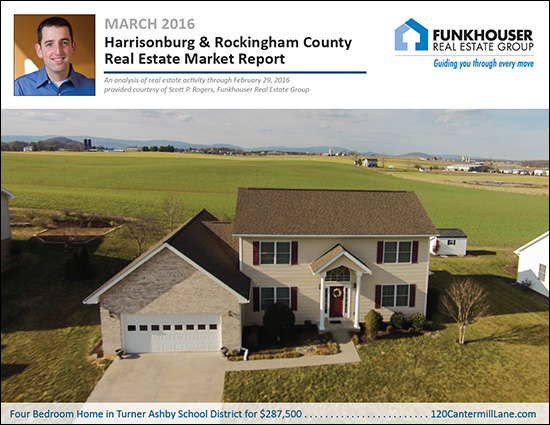 Learn more about this month's Featured Property: 120 Cantermill Lane I just published my monthly report on the Harrisonburg and Rockingham County real estate market. Jump to the full online market report, watch the overview video below, or download the PDF, or read on for highlights.... First, a video overview....  Next, let's take a look at the overall market performance in February.... 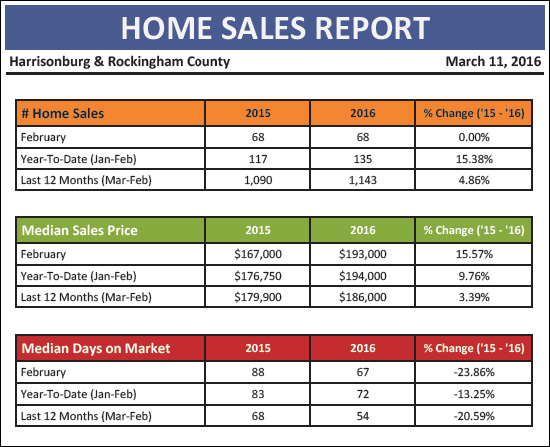 As outlined above, there are several indicators of a strong local housing market....
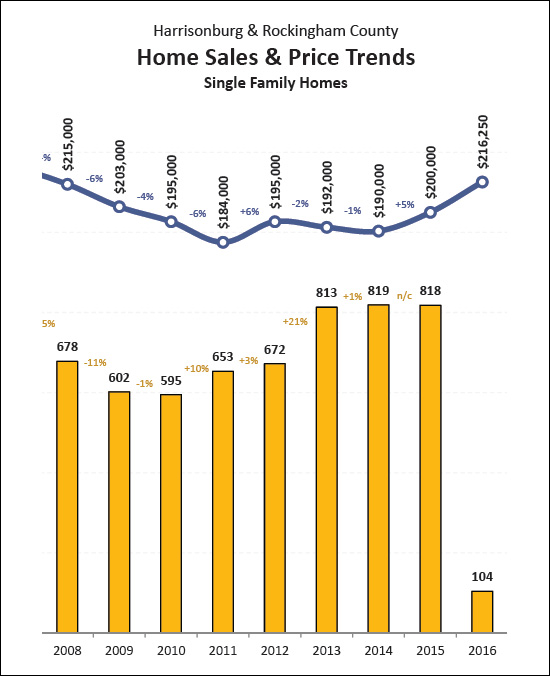 The pace (and price) of single family homes are often a good way to understand the overall trajectory of a local housing market -- because it takes rental properties (and the impact of investors) out of the mix. As such, it is good to see the price of these home sales increasing (quite a bit) even if the pace of sales has not significantly increased over the past few years. 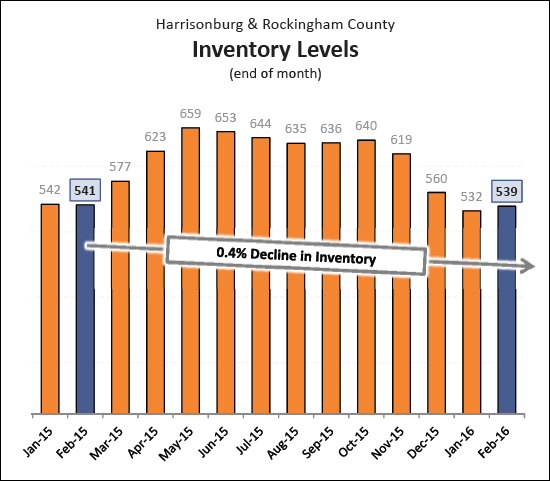 Inventory levels are still hovering around 530/540 -- but are on the brink of increasing significantly, which will likely happen over the next 30 to 60 days. Hang on tight! In Summary.... BUYERS -- You should have plenty of additional options to consider in the coming months, but houses that are priced well will likely sell quickly. Strike while the iron is hot -- and relish the opportunity to still have super low (sub 4%) fixed mortgage interest rates. SELLERS -- Price, Condition, Marketing. If you are getting ready to put your house on the market, let's make sure we have your house priced well compared to what has recently sold, that your house is in a condition to have a broad appeal to buyers, and of course, let's market it thoroughly and professionally. More and Much, Much More.... There is more, oh so much more, in my full real estate market report. I have even made it very easily accessible for you to read online....  And as is always my encouragement -- if you will be buying or selling a home in the near future, become a student of the housing market! Learn what has been happening recently, what is happening now, and what is likely to happen next. Being informed will allow you to make better real estate decisions. Finally, here are two handy references to prepare yourself to buy or sell.... And if you are ready to get the process started, simply contact me at 540-578-0102 or scott@HarrisonburgHousingToday.com. | |
Buyers likely to have many more choices in coming months |
|
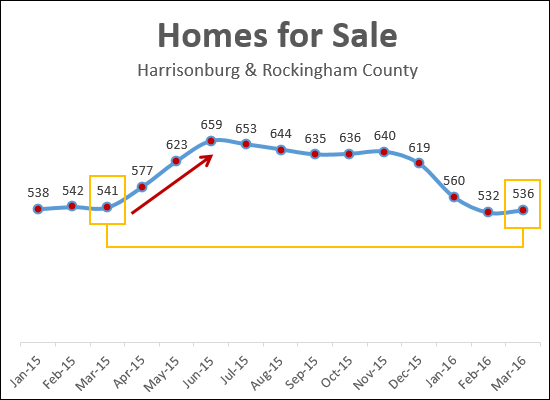 If this year is like last year (and just about every year, ever) buyers will have many more choices in coming months. As shown above, inventory levels are likely to steadily increase over the next three to their peak in June. If you are hoping to know about every new listing, as soon as it hits the market, check out NewListingsInHarrisonburg.com where you can sign up for email alerts for new listings. | |
The 50 Most Valuable Properties in Harrisonburg |
|
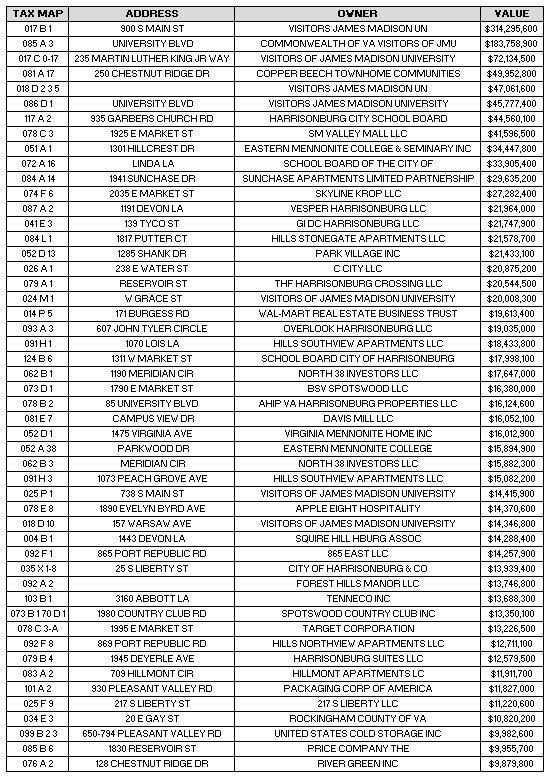 The list above shows the 50 properties in Harrisonburg with the highest assessed values per the 2016 assessments. As you can see, JMU, apartment complexes and City schools are many of the most valuable properties. Let's take a closer look at the top 10.... 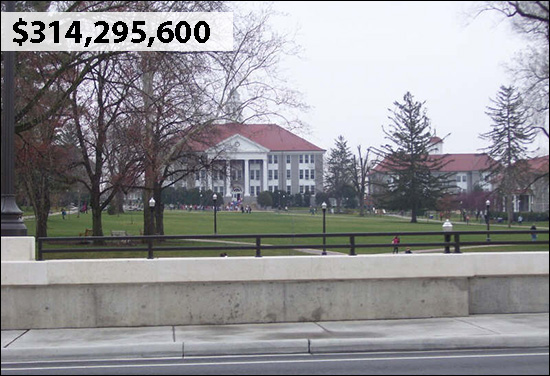 017 B 1 900 S MAIN ST VISITORS JAMES MADISON UN $314,295,600 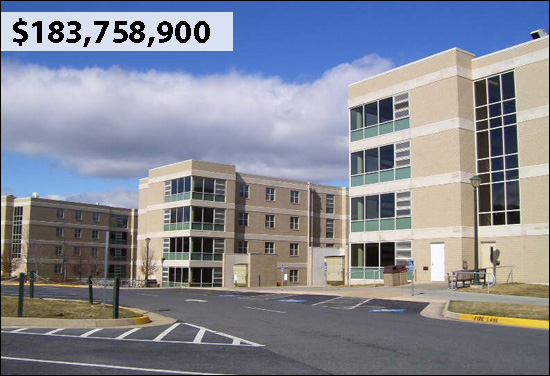 085 A 3 UNIVERSITY BLVD COMMONWEALTH OF VA VISITORS OF JMU $183,758,900 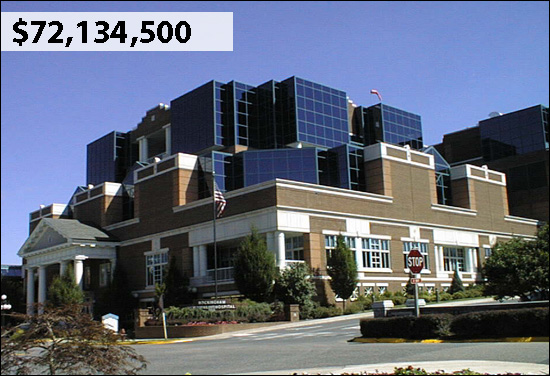 017 C 0-17 235 MARTIN LUTHER KING JR WAY VISITORS OF JAMES MADISON UNIVERSITY $72,134,500 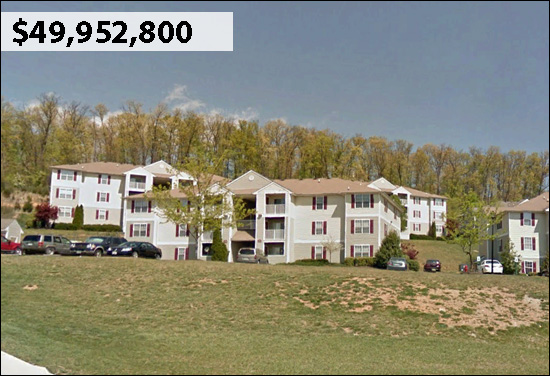 081 A 17 250 CHESTNUT RIDGE DR COPPER BEECH TOWNHOME COMMUNITIES $49,952,800 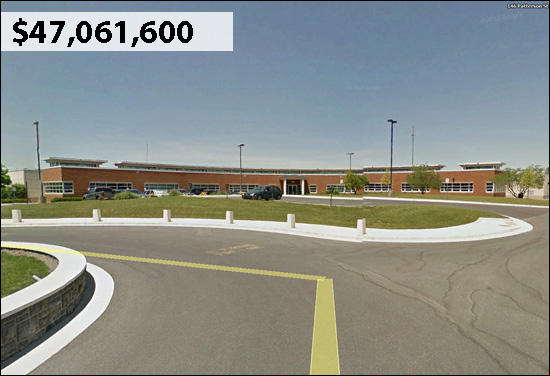 018 D 2 3 5 VISITORS JAMES MADISON UN $47,061,600 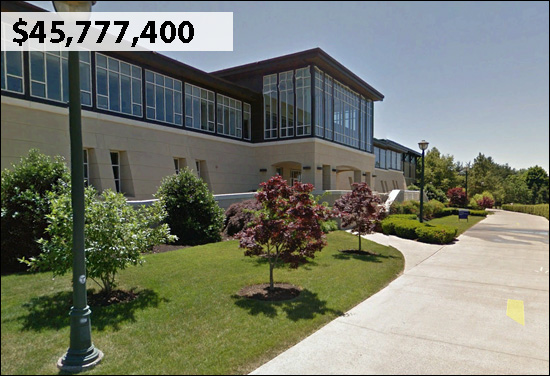 086 D 1 UNIVERSITY BLVD VISITORS JAMES MADISON UNIVERSITY $45,777,400 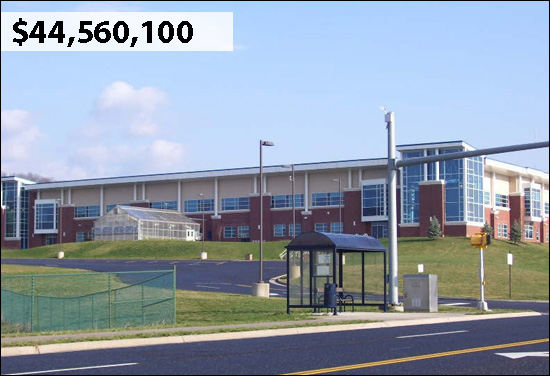 117 A 2 935 GARBERS CHURCH RD HARRISONBURG CITY SCHOOL BOARD $44,560,100 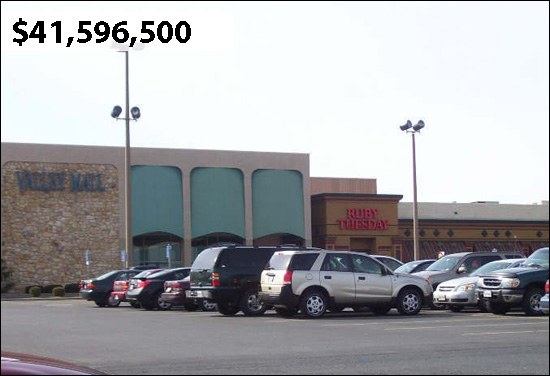 078 C 3 1925 E MARKET ST SM VALLEY MALL LLC $41,596,500 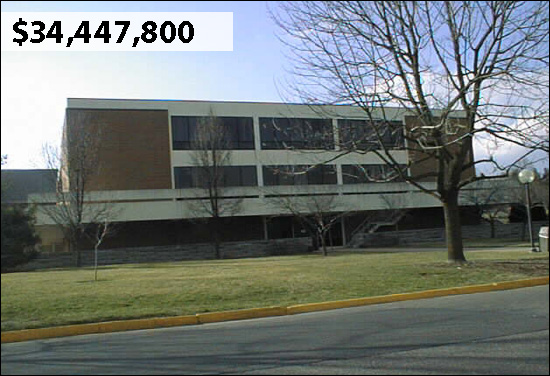 051 A 1 1301 HILLCREST DR EASTERN MENNONITE COLLEGE & SEMINARY INC $34,447,800 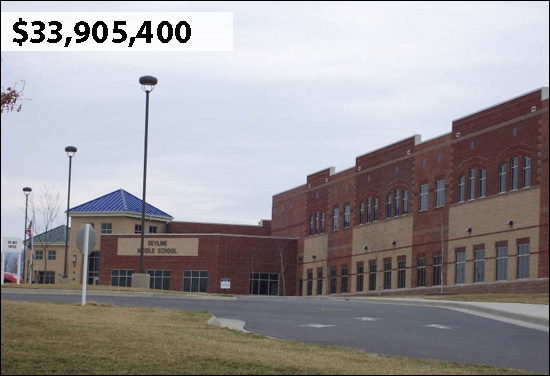 072 A 16 LINDA LA SCHOOL BOARD OF THE CITY OF $33,905,400 | |
Top Property Owners in the City of Harrisonburg |
|
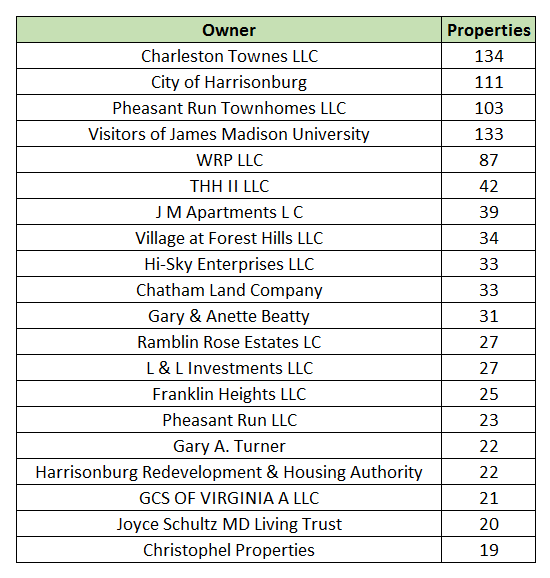 Sorting properties in the City by their owner results in the data outlined above. These are likely some of the most prolific property owners in the City of Harrisonburg. One important disclaimer, however, is that this summary does not account for people who own properties under multiple ownership entities. A more owner specific notes....
| |
Approaching a balance between buyers and sellers |
|
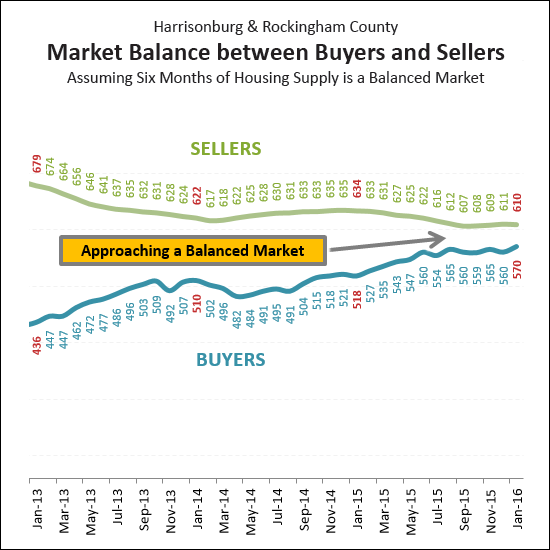 Most housing market analysts consider six months of inventory (active listings) to be an indicator of a balanced market (between buyers and sellers). The "BUYERS" trend line above is illustrating how many buyers are buying in a six month period. The "SELLERS" trend line above is illustrating how many sellers are in the market (active listings) at any given time. As you can see, our market had an extreme imbalance several years ago, with more sellers in the market than were needed based on the buyers in the market. Over the past four years we have been seeing a steady increase in buyers in the market and a decline in sellers in the market. Read more about the local housing market in my most recent market report....  | |
Local Housing Market Sees Strong Start in January 2016 |
|
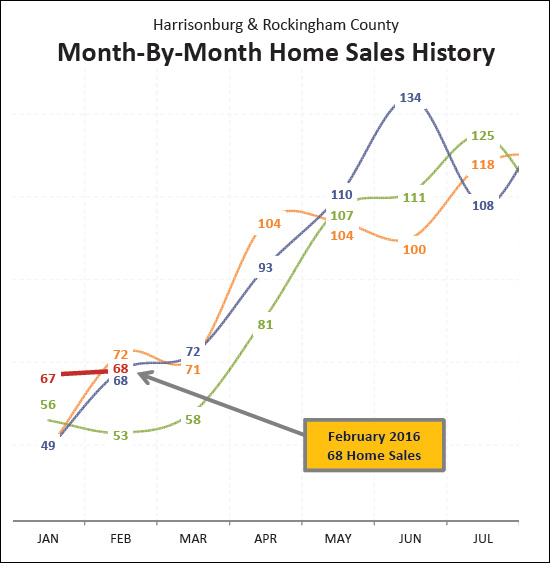
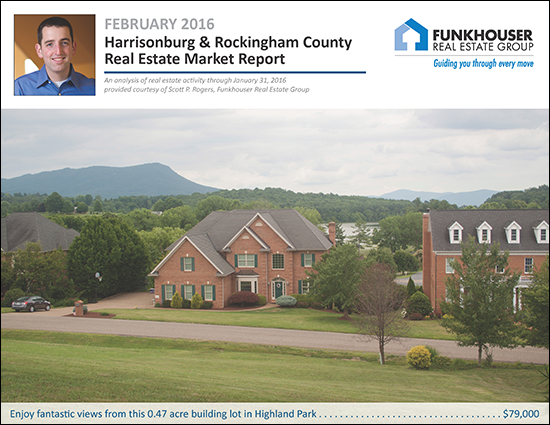 Learn more about this month's Featured Property: 3853 Traveler Road I just published my monthly report on the Harrisonburg and Rockingham County real estate market. Jump to the full online market report, watch the overview video below, or download the PDF, or read on for highlights.... A Video Overview....  Let's start by taking a look at the overall market performance in January and over the past twelve months.... 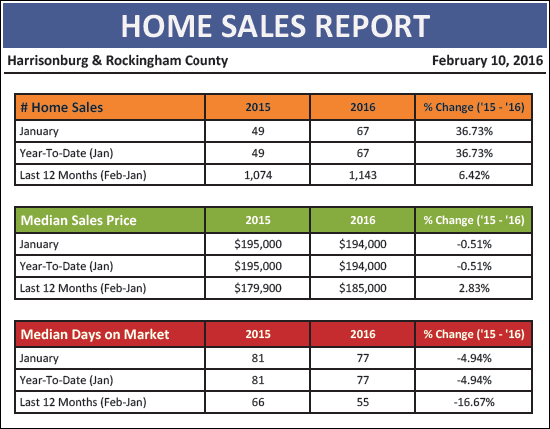 Strong Sales Pace.... As shown above, we saw a strong month of sales in January -- with 67 home sales, as compared to only 49 last January. This 37% year-over-year improvement in January 2016 contributed to a 6.42% year-over-year increase in the annualized pace of home sales in Harrisonburg and Rockingham County. Increasing Prices.... While the median price ticked down 0.51% when only looking at January 2016 figures, the median sales price over the past 12 months increased by 2.83% to $185,000 compared to the previous 12 months. Faster Sales... Homes are also selling faster -- at a median pace of 55 days on the market based on sales in the past 12 months. 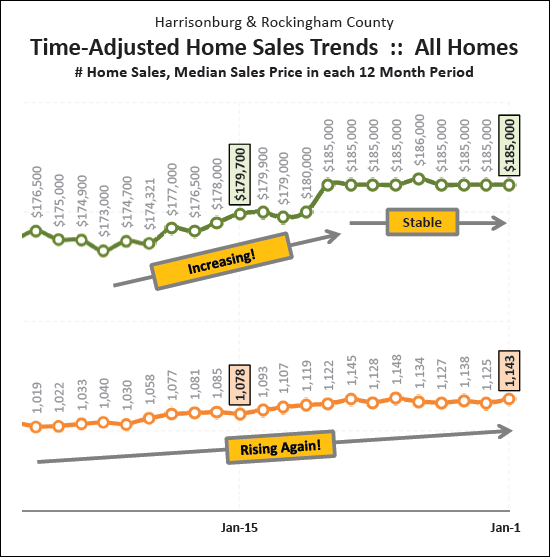 When looking at a rolling 12-month time frame in the graph above, we note that:
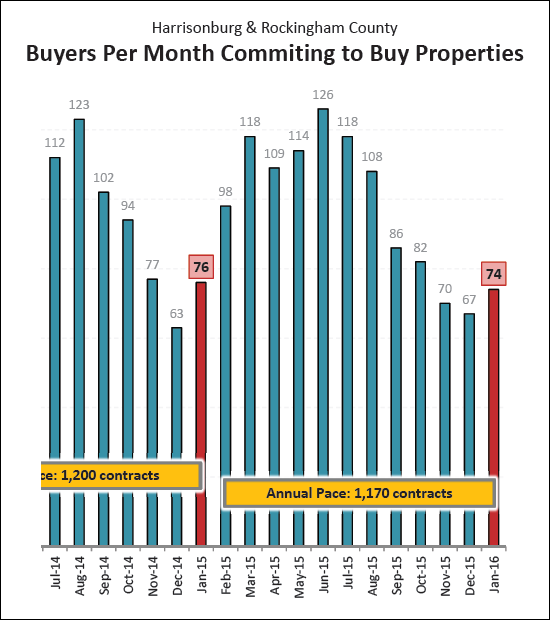
Buyers and sellers signed 74 contracts in January 2016 -- as compared to 76 last January. This is despite a large snowstorm that slowed down the market for at least a week during January. This is an indicator that we are likely to see a similar number of February home sales this year as we did last year.
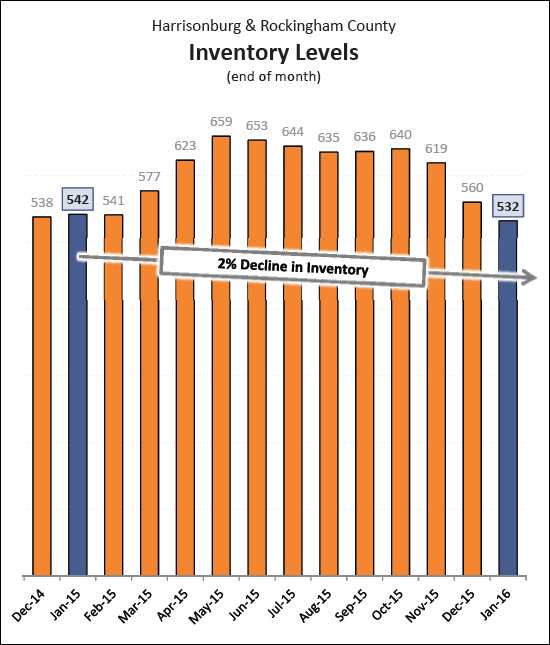
Inventory levels (the number of homes for sale) are at their lowest levels seen anytime in the past eight months. This is not surprising given the time of year we are in -- though year-over-year inventory levels have also declined by 2%. More and Much, Much More.... | |
I am expecting a lot of showings in February |
|
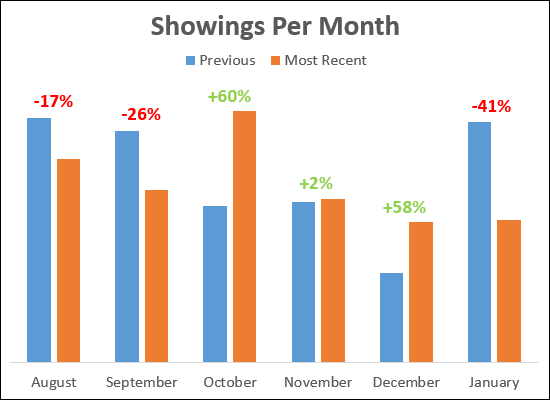 There were a LOT of showings in the fourth quarter of 2015 -- with 60% and 58% year-over-year increases in October and December. But then January came, and along with January came lots of snow. That seems to have been the main driver between the 41% decline in January showings as compared to a year ago. I suspect that as the snow continues to melt, and as some additional homes come on the market, that we will see a strong month of showings in February 2016. | |
Contract Success Rate on the rise |
|
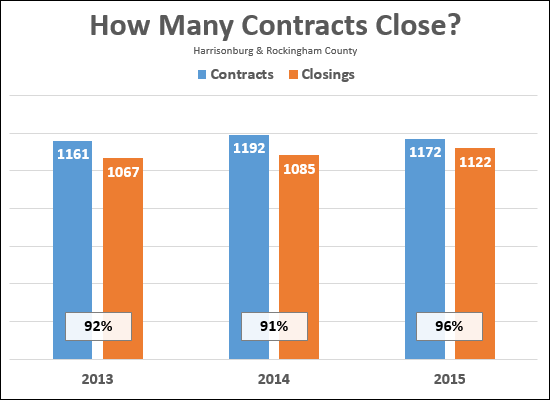 After a slight dip in 2014, the Contract Success Rate rose to 96% in 2015. That means that nearly all contracts that are signed by buyer and seller make it to closing. This may be a result of more reasonable lender underwriting requirements, or more prepared buyers, or buyers and sellers being more rational when negotiating the speed bumps between contract and closing. Regardless, it is good news for anyone who has a house going under contract -- it is more likely to go to closing than it was a year or two ago. | |
January Inventory vs. Full Year Home Sales |
|
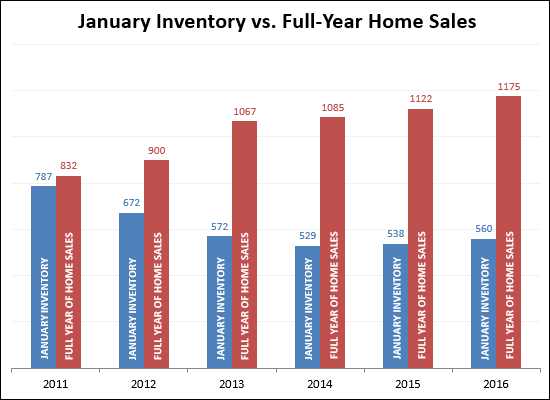 A few short years ago there were enough homes on the market in January to last us nearly an entire year. In January 2011, there were 787 homes on the market and only 832 buyers would go on to buy a home that year. Things have looked at bit different over the past few years, with lower (529-560) levels of inventory at the start of the year, and higher (1085-1175) home sales in the year that followed. ** Please note: The 2016 home sales shown in the graph above are a projection, not a promise. :) | |
| Newer Posts | Older Posts |
Scott Rogers
Funkhouser Real
Estate Group
540-578-0102
scott@funkhousergroup.com
Licensed in the
Commonwealth of Virginia
Home Search
Housing Market Report
Harrisonburg Townhouses
Walk Through This Home
Investment Properties
Harrisonburg Foreclosures
Property Transfers
New Listings

