| Newer Posts | Older Posts |
Market segments under $300K are the healthiest |
|
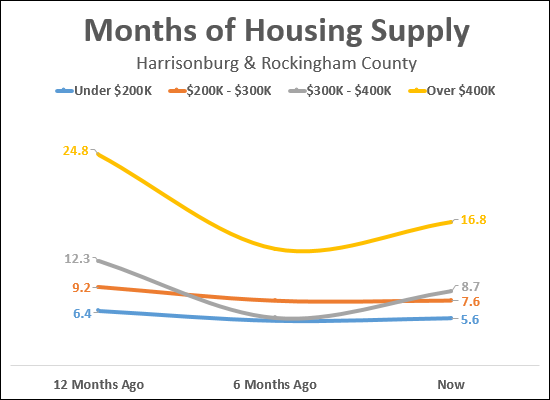 The "months of supply" illustrated in the graph above shows how many months it would take to sell all homes currently listed for sale in each price range given the current pace of buying activity in that price range. As you can tell, each price range is performing differently. Let's take a closer look....  The good news, as shown above, is that over the past 12 months, all price ranges have seen a decline in the months of housing supply available on the market for sale. The decline in the months of supply available ranged from 13% to 32%. But when we look changes over the past six months, we find a bit of a different phenomenon....  As shown above, almost all price ranges are seeing more months of supply available now as compared to six months ago. The largest increase in housing supply has been in the $300K - $400K price range with a 56% increase in months of supply over the past six months. The only price range that did not experience an increase in available housing supply has been the $200K - $300K price range. A few concluding thoughts....
| |
Inventory Levels Headed Down For The Winter |
|
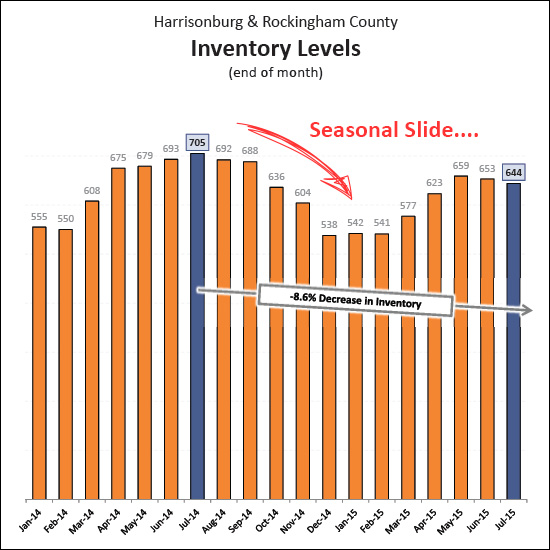 Wait... what?? Inventory levels are headed down... for the winter?? Yep, in some ways, we're already in that seasonal decline. Inventory levels have declined over the past 60 days, and are likely to continue to decline from now until next March based on seasonal trajectories of past years. Furthermore, there is an 8.6% year-over-year decline in inventory levels, further limiting the number of homes that are on the market. BUYERS: If you want to buy a home in the next three to six months, you likely have more options now than you will have in a month, and in another month, and the next after that. SELLERS: While we'll see fewer buyers in the Fall (and then the Winter) those buyers will have fewer and fewer buying options since inventory levels are declining. As such, the declining inventory levels work to your benefit -- giving you fewer sellers to compete with. | |
August 2015 Harrisonburg Housing Market Report: Home Sales Up 6%, Prices Up 7% |
|
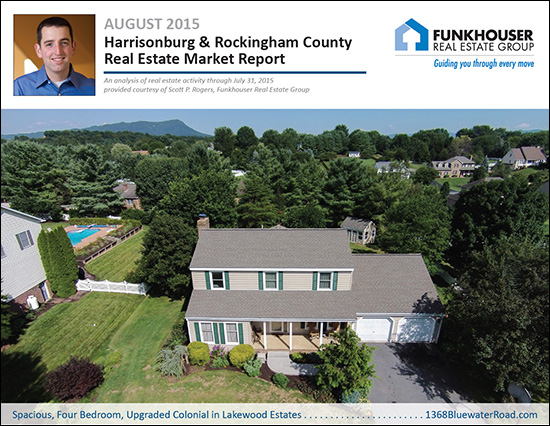 Learn more about this month's Featured Property: 1368 Bluewater Road I just published my monthly report on the Harrisonburg and Rockingham County real estate market. Jump to the full online market report, or download the PDF, or read on for highlights.... 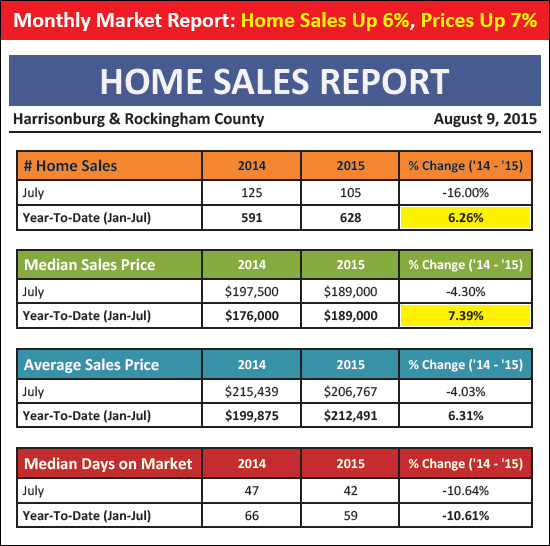 First, the fun news. As noted above, when looking at 2015 YTD home sales, you'll find that the market has shown a 6% improvement over last year in the pace of sales -- and that the median sales price has risen by 7%. Both of these are signs of a strong, growing local real estate market. A third indicator to note is that the median time it takes for a house to go under contract (days on market) has fallen 11% over the past year. 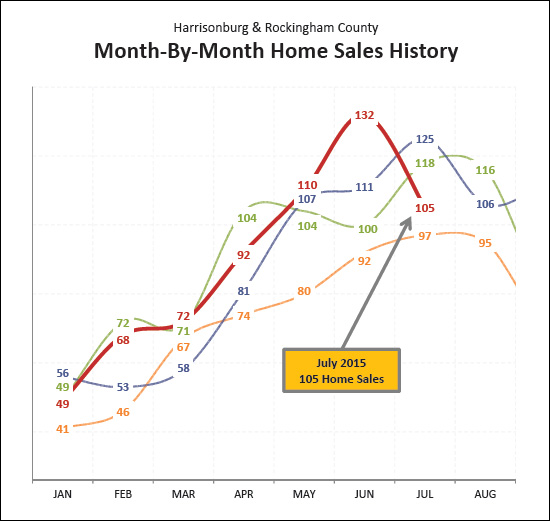 You may have noted that July 2015 home sales (105) were a good bit below July 2014 home sales (125). It turns out the seven year high of 132 home sales seen in June 2015 may simply been a timing phenomenon. When combining June and July home sales, there were 237 home sales in June/July 2015 as compared to 236 home sales during June/July 2014 --as such, the two month track record for June and July is on pace with last year despite the decline in monthly sales in July 2015. 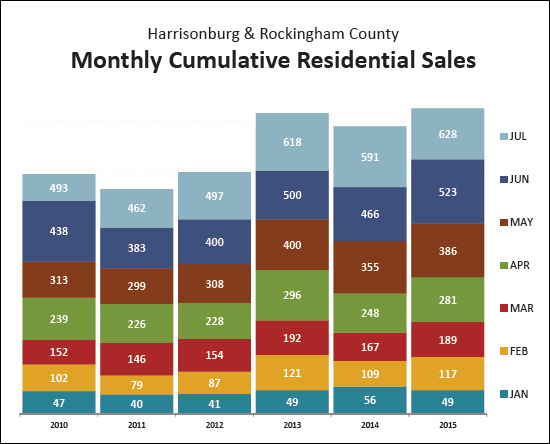 Looking, graphically, at the first seven months of home sales during 2015 (above) you can see that we're a good bit ahead of 2014 (YTD) and that this is the strongest January - July sales pace we have seen in at least the previous five years. Looking back further into the historical data, it seems that the last time we saw 628 (or more) January - July home sales was waaaay back in 2007. 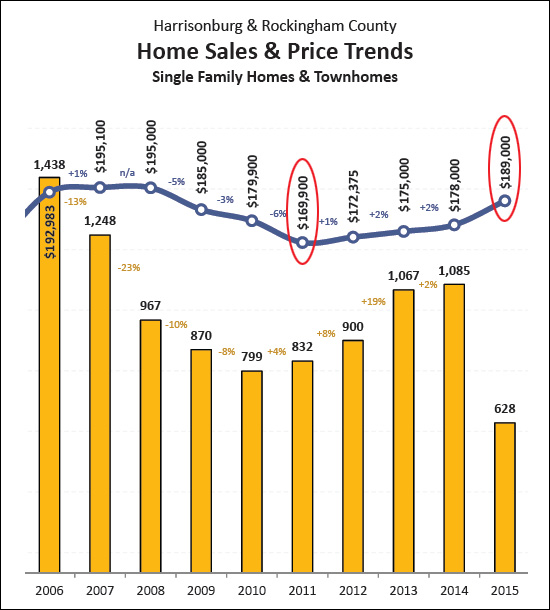 While every market segment (price range, property type, neighborhood, specific house) has performed differently over the past four years -- it is certainly a welcome sign to see a nearly $20,000 increase in the median sales price over the past four years -- after having seen a $25,000 decline from the peak in 2007/2008. 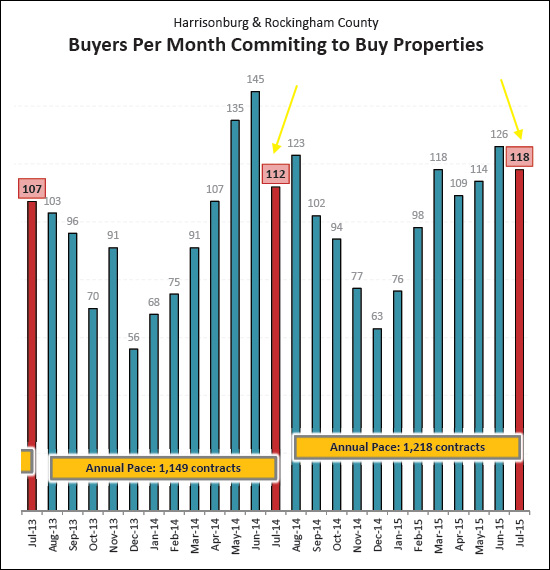 After several months of year-over-year declines in the monthly pace of contracts being signed, we did see (above) a year-over-year increase during July 2015 with 118 contracts being signed by buyers (and sellers). We are likely to see 100+ contracts during August, and quite possibly into September and October as well. OK, that's it for now. I'll hit some high points here on HarrisonburgHousingToday.com in coming days. In the meantime, you can read the full August 2015 Harrisonburg Housing Market Report online or by downloading the PDF. And as is always my encouragement -- if you will be buying or selling a home in the near future, become a student of the housing market! Learn what has been happening recently, what is happening now, and what is likely to happen next. Being informed will allow you to make better real estate decisions.If you are ready to buy or sell a property in Harrisonburg or Rockingham County, contact me at 540-578-0102 or scott@HarrisonburgHousingToday.com to get the process started. | |
July (2015) Home Sales Seeming Cooler Than Past Years |
|
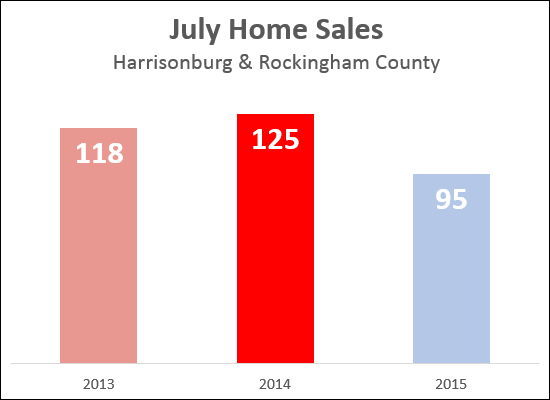 I will hold out a bit longer to see any other home sales that might end up being reported in the MLS in the next few days, but thus far, home sales in July 2015 are coming in a bit lower than the same month in the past two years. Stay tuned for more analysis as the week goes on. | |
Local Market Likely to Hit $225M in Real Estate Sales in 2015 |
|
 Slow increases in the number of sales plus slow increases in the median sales price result in increase in the overall volume of real estate sold in this area. The graph above is based on Jan 1, 2013 - Jun 30, 2015 sales data, so the 2015 figure is a projected figure. It looks like we are on track to get close to, or to surpass 225 million dollars in real estate sales in our local market in 2015. | |
Is August too late to list my home for sale? |
|
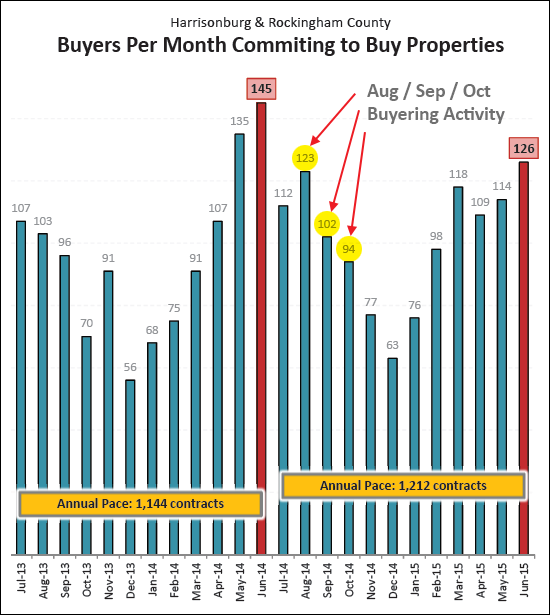 Nope -- it's not too late to list your home in August. While we will have missed the strong Spring and early Summer rush of buyers, there will still be plenty of buyers in August, September and October. As shown above, last year there were more buyers in August than in July! One other silver lining for late Summer (early Fall) sellers -- there will be fewer sellers to compete with as the next month or two passes and inventory levels continue to decline. If you're thinking about putting your house on the market in August, let's chat ASAP about any improvements you will be making to the house as well as reviewing market data to develop a pricing strategy. | |
Contracts Still Slow in July 2015 |
|
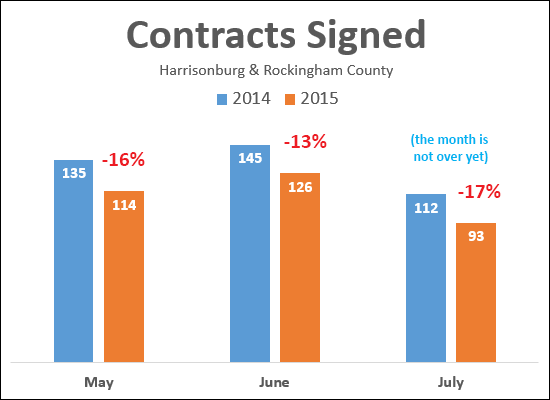 There were 16% fewer contracts in May 2015 as compared to in May 2014. There were 13% fewer contracts in June 2015 as compared to June 2014. Thus far, July 2015 is also lagging behind July 2014 -- by 17% -- though we still have a few more days for deals to stay together. These slower months of contract activity will eventually, inevitably, lead to slower months of closed sales as well. | |
Sales of new construction homes speeding up in 2015! |
|
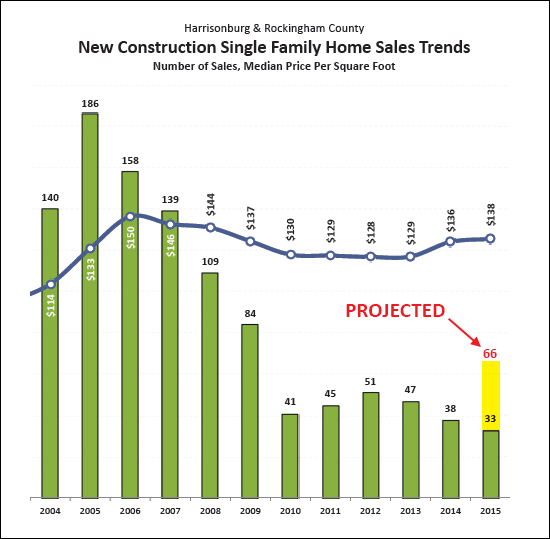 General market recovery (in both pace and price of sales) may finally be resulting in a return of new construction single family home sales. As shown above, we may see a big jump in the number of new construction home sales in 2015 -- perhaps beating out the past five years! | |
Lot Sales, Prices Increasing in 2015 |
|
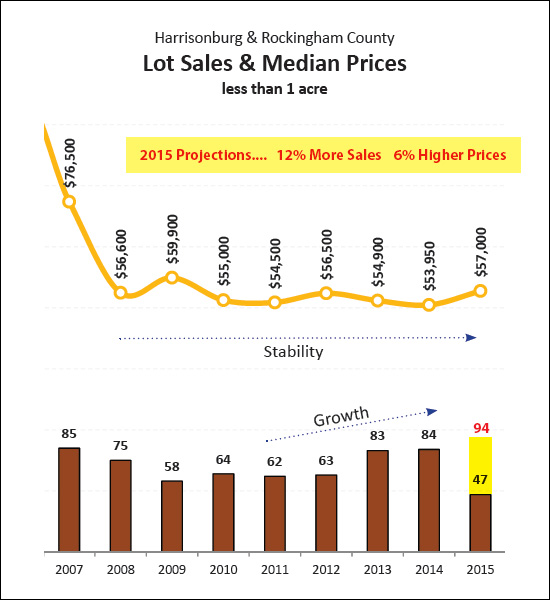 Sales of building lots of less than an acre in Harrisonburg and Rockingham County have started to pick up steam over the past few years. Year-to-date sales (47) point to a potential of 94 lots sales this year, which would be a 12% increase in sales. Prices also seem like they might finally be increasing. The median sales price of building lots of less than an acre declined (slightly) in 2013 and 2014 but seem poised to increase 6% in 2015. | |
Single Family Home Sales Prices Up Nearly 8% in 2015 |
|
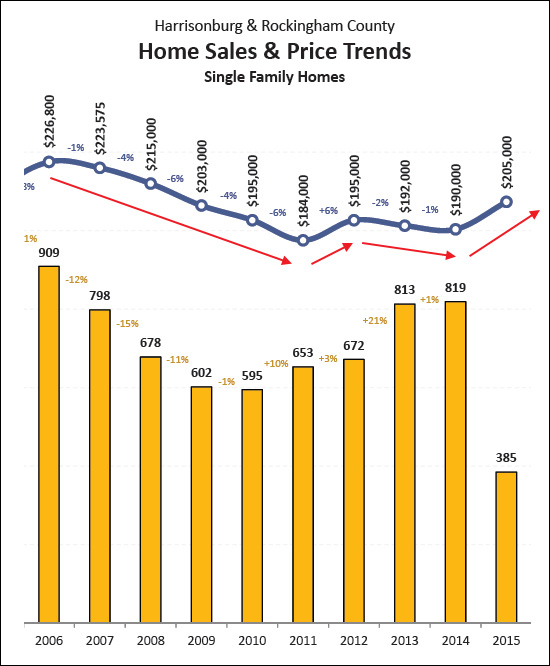 The analysis above looks only at single family home sales -- which excludes duplexes, townhouses and condos. This metric is a helpful indicator for the overall residential market because there are not usually a lot of investors participating in this segment of the market, thus it is typically a good representation of owner occupant demand for houses. As is shown above, the last few years have seen (small) declines in median sales prices with a 2% decline in 2013 and a 1% decline in 2014. It is, thus, exciting news (for home sellers, though perhaps not as much for home buyers) that these median sales prices have increased by nearly 8% thus far in 2015 as compared to 2014 median sales prices. Read more about current market trends in my monthly market report found online at HarrisonburgHousingMarket.com. | |
July 2015 Harrisonburg Housing Market Report: Home Sales Hit Seven Year High |
|
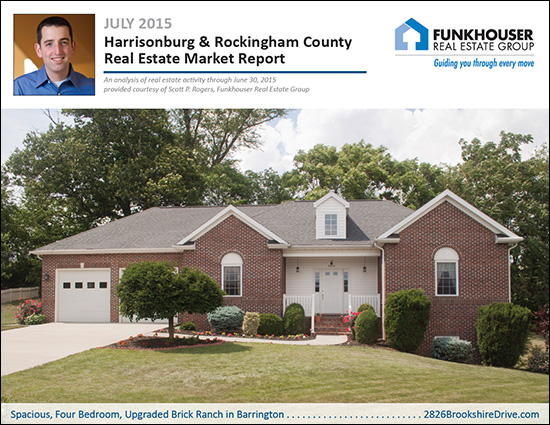 Learn more about this month's Featured Property: 2826 Brookshire Drive I just published my monthly report on the Harrisonburg and Rockingham County real estate market. Jump to the full online market report, or download the PDF, or read on for highlights.... 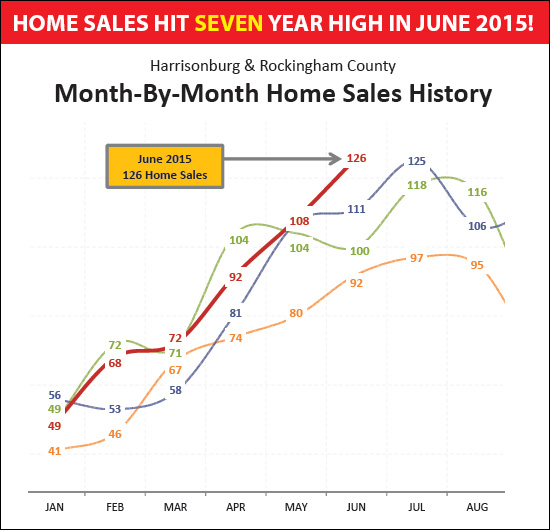 First, the fun news. As noted above, June 2015 home sales (all 126 of them) broke a long-standing record for the number of homes selling in a single month in Harrisonburg and Rockingham County. The last time we saw this many closings in a single month was waaaay back in August 2007! 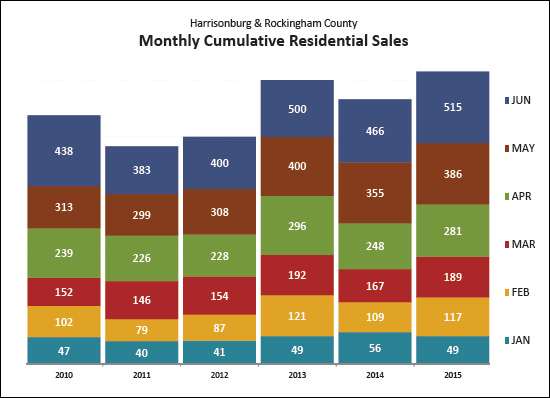 Moving beyond a single month of lots of home sales, it is clear (as shown above) that the first half of the year is off to a smashing start as well. There were 515 home sales in the first half of 2015 -- more than in the first six months of any of the preceding five years. 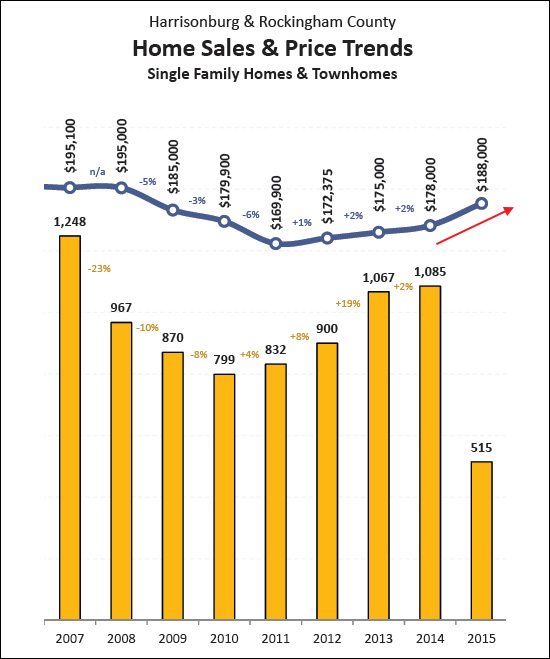 Perhaps these increasing home sales are what is also helping median prices to start to rise. As shown above, after several years of slow increases (+1%, +2%, +2%) in the median sales price, we are now poised to see a 5% - 6% increase in median sales prices in 2015. Stay tuned to see how the rest of the year shakes out -- but hopefully we'll at least clear 3% or 4%. 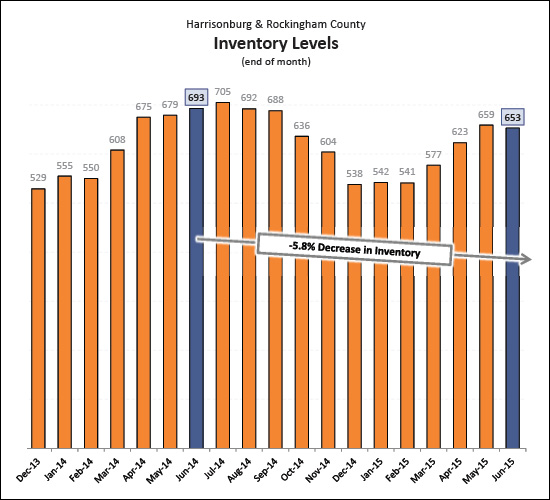 If you're thinking about putting your house on the market, this might be a swell time to do it -- as shown above, inventory levels are down 6% year-over-year AND inventory levels dropped over the past month. Buyers have fewer options right now, and there are still plenty of buyers looking to buy.... 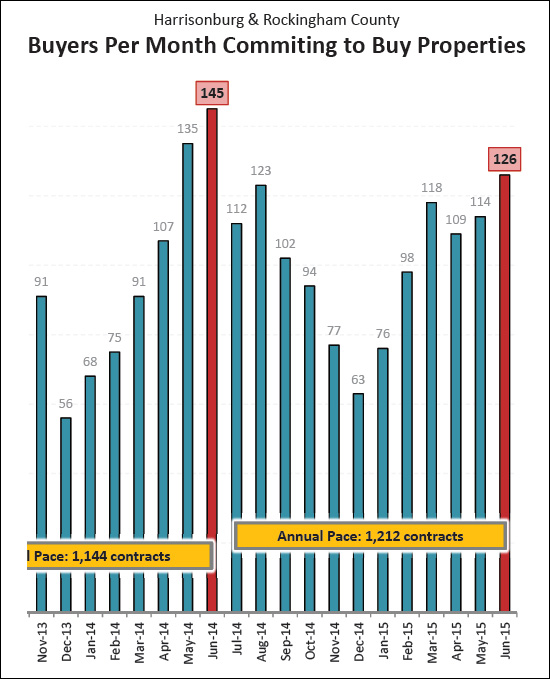 As shown above, there were more buyers (126) in June 2015 than we saw in May 2015 (114) and we should still see quite a few more months of 100+ buyers making decisions to buy homes in Harrisonburg and Rockingham County. OK, that's it for now. I'll hit some high points here on HarrisonburgHousingToday.com in coming days. In the meantime, you can read the full July 2015 Harrisonburg Housing Market Report online or by downloading the PDF. And as is always my encouragement -- if you will be buying or selling a home in the near future, become a student of the housing market! Learn what has been happening recently, what is happening now, and what is likely to happen next. Being informed will allow you to make better real estate decisions.If you are ready to buy or sell a property in Harrisonburg or Rockingham County, contact me at 540-578-0102 or scott@HarrisonburgHousingToday.com to get the process started. | |
Go ahead, set off those fireworks, June 2015 home sales were hot, hot, hot |
|
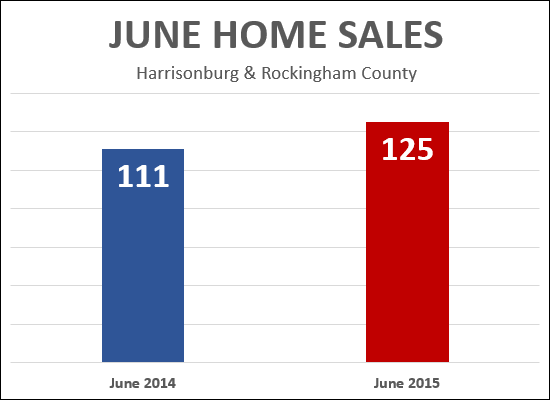 Despite having fewer showings in May/June and fewer contracts in June, it looks like June 2015 was a great month for (closed) home sales. With a few more sales likely to trickle in over the next few days, June 2015 home sales are already showing a 13% improvement over last June. Stay tuned for more analysis in the days to come.....and Happy Independence Day! | |
Showings slower (than last year) in May, June 2015 |
|
 I don't always bring good news. Showing activity in May and June of this year was slower (-28%, -18%) than in the same two months last year. Stay tuned for further market analysis next week to see how we're doing on contracts and sales in the first half of the year. | |
Another month of 100+ contracts |
|
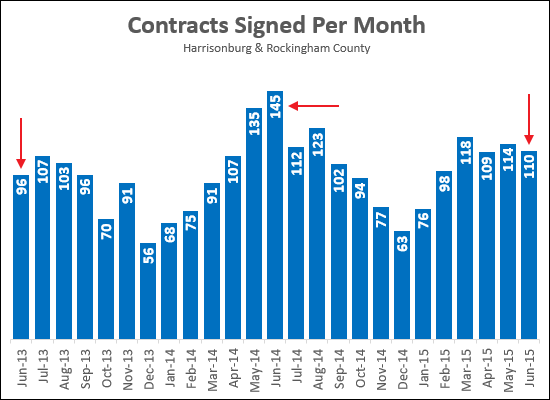 June 2015 will be the fourth straight month with 100+ contracts being signed by buyers in Harrisonburg and Rockingham County. In 2014, we saw 100+ contracts every month between April and September. In 2015, the 100+ months started in March. It seems unlikely that we will hit the high of 145 contracts that we saw in June 2014 this month, but we'll double check again in a few more days. | |
Reimagining Days on Market |
|
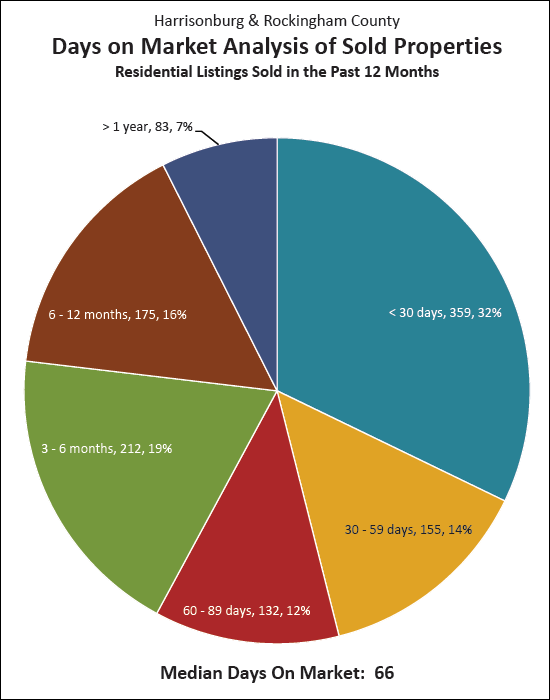 Two months ago, our "Median Days on Market" in this area was 119 days. Now, as shown above, it's only 66 days. What's happening? A drastic acceleration of our local real estate market? Actually, no. "Days on Market" is now being calculated differently by our new MLS. In the past, the "Days on Market" was counting the number of days between the list date and closing date. Now, it is a calculation of the number of days between the list date and when a property goes under contract. In many ways, this is a more helpful calculation -- it takes the variable of "how long it takes a buyer to get to closing once they are under contract" out of the equation. Now, "Days on Market" shows how long it takes for a house to go under contract. | |
Maybe the price of building lots has not plummeted? |
|
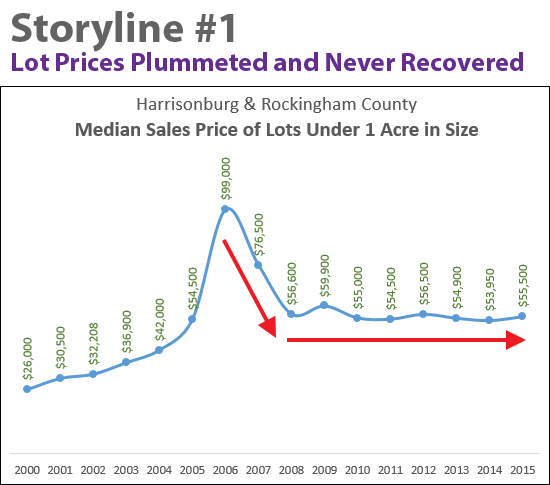 The story illustrated above (lot prices plummeted 50% and have never recovered) is the one I've been running with over the past few years. It takes the $100K lot value as the "new norm" and then looks at all values after that point ($55K-ish for years and years) as depressingly low. Perhaps that's not the correct storyline. What if this is really the story.... 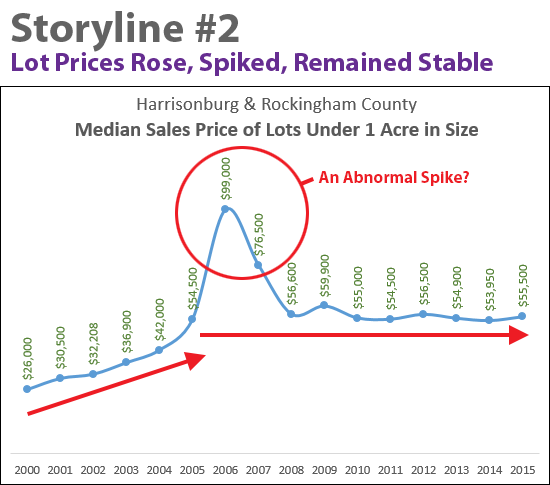 Perhaps the story to be told is that lot values steadily increased between 2000 and 2005 (from $26K to $55K), then had an abnormal, unnatural, unsustainable spike (to $99K) before settling back down to the then continued norm of $55K-ish. If this, is, the more important story to be embracing, then we need not be quite as depressed. Other than a brief two year wild party (for sellers of building lots) the median sales price of these lots has been around $55K for the past decade.... | |
Home prices edging up a bit more quickly? |
|
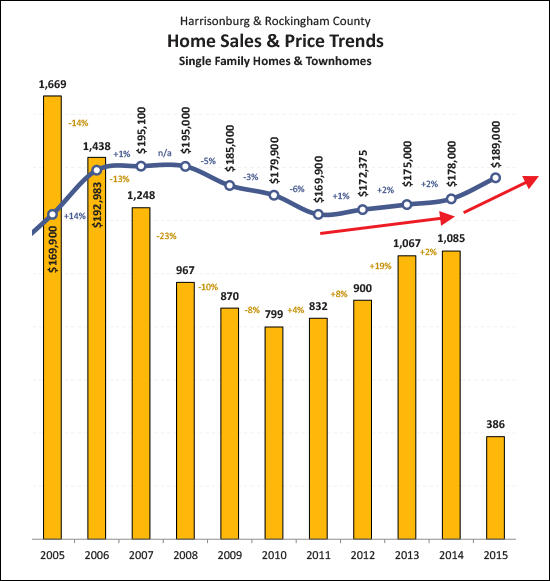 After several years of 1% - 2% increases in median price per year, could we finally be seeing a larger (faster) increase in the median sales price in the Harrisonburg and Rockingham County market? The data thus far in 2015 shows a 6% improvement in median sales price as compared to 2014. Let's see if we can stick with that 6% improvement as the year goes on! Learn more about local market trends via my most recent housing market report....  | |
June 2015 Harrisonburg Housing Market Report |
|
 Learn more about this month's Featured Property: 2550 Ramblewood Road I just published my monthly report on the Harrisonburg and Rockingham County real estate market. Jump to the full online market report, or download the PDF, or read on for highlights.... 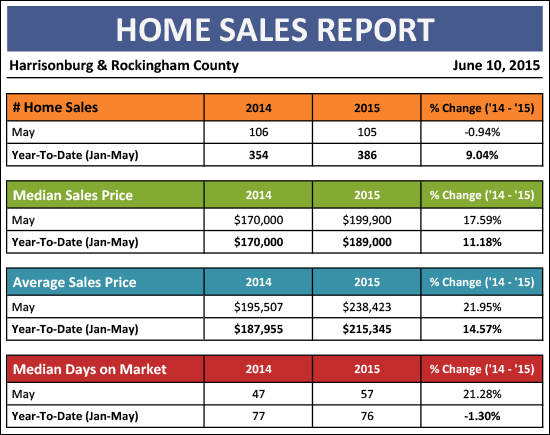 Overall (year-to-date) market indicators look FANTASTIC in this latest report....
Technically, we saw a slight decline (106 to 105) in home sales when comparing May 2015 to May 2014 -- but I'll live with that given the overall positive trends outlined above.
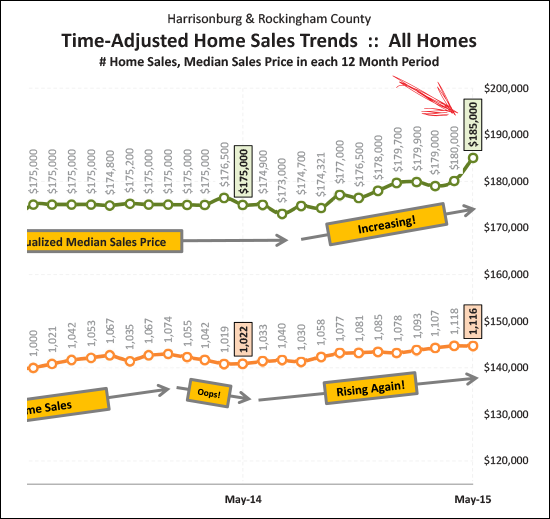
How do we know that home values are increasing in our local real estate market? When we see sustained upward movement in long-term trends -- and it seems safe to say that we're seeing that now. After over three years of a sub-$180K median price (when looking at a rolling 12 month period) we saw that ceiling shattered in April 2015 after over six months of steady increases -- and now, this 12-month rolling median sales price has jumped up to $185K! Stay tuned, folks, but it looks like we may be starting to see some increases in sales prices, and thus home values.
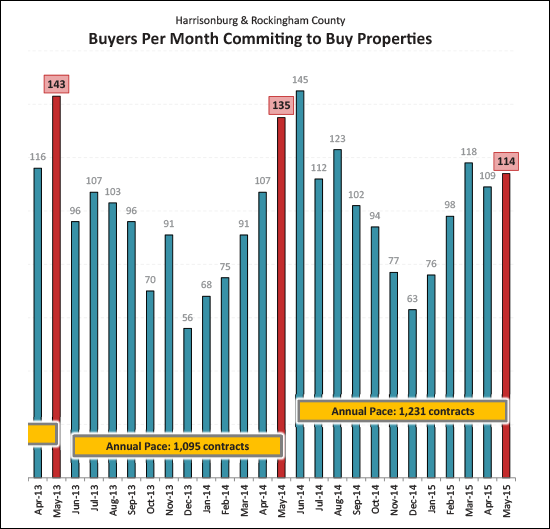
Now, to provide a balanced look at things, I should point out that despite my exuberance about the above-referenced market trends, the pace of buyer activity (as measured by properties going under contract) was a bit disappointing in May 2015 as compared to May 2014. It was certainly a solid month of contracts being signed (114) but a far cry from the 135 we saw last May. It will be interesting to see what happens in June 2015 as last June there were a whopping 145 contracts signed!
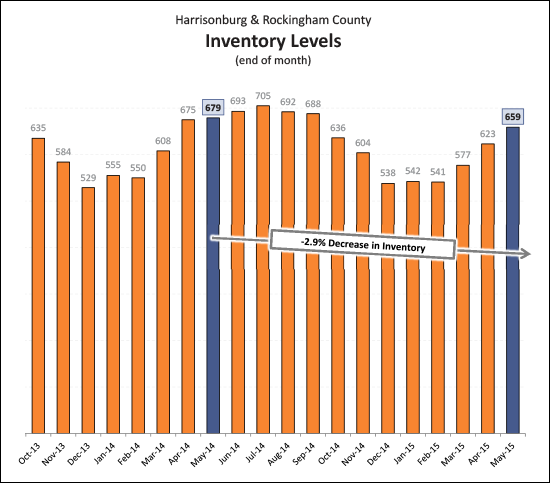
As one last indicator of where we are these days -- it is worth noting that inventory levels have remained relatively stable over the past year. There were 679 homes on the market a year ago -- there are 659 on the market today. In theory, we'll see a slight increase in inventory over the next few months as we continued into and through the Summer market. OK, that's it for now. I'll hit some high points here on HarrisonburgHousingToday.com in coming days. In the meantime, you can read the full June 2015 Harrisonburg Housing Market Report online or by downloading the PDF. And as is always my encouragement -- if you will be buying or selling a home in the near future, become a student of the housing market! Learn what has been happening recently, what is happening now, and what is likely to happen next. Being informed will allow you to make better real estate decisions. | |
Now is the time for $300K+ Home Sales! |
|
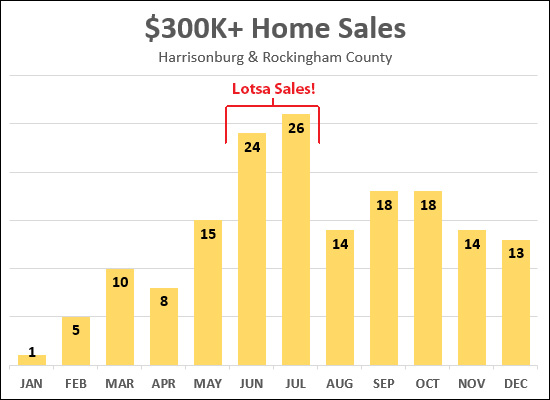 As is usually the case, we are starting to see our annual boom in $300K+ home sales. The graph above shows home sales over $300K during each month in 2014. You can see that June and July were the most active months for sales in this price range. | |
Lots of Showings! (and contracts, too, of course) |
|
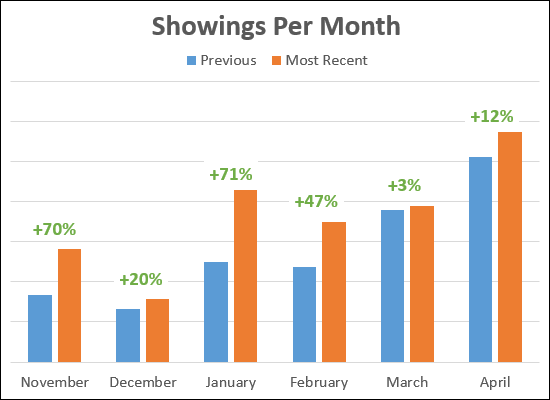 In each of the past six months there have been more showings than in the same month during the previous year. This increase in showings has amounted to a 30% year-over-year increase in showings when looking at November - April. It should be no surprise, then, that contracts and closings are also increasing. | |
| Newer Posts | Older Posts |
Scott Rogers
Funkhouser Real
Estate Group
540-578-0102
scott@funkhousergroup.com
Licensed in the
Commonwealth of Virginia
Home Search
Housing Market Report
Harrisonburg Townhouses
Walk Through This Home
Investment Properties
Harrisonburg Foreclosures
Property Transfers
New Listings

