Analysis
| Newer Posts | Older Posts |
Fewer Homes Are Selling, Though Prices Keep Rising, And Now Inventory Levels Are Rising Too!? |
|
 Happy Thursday morning, friends in and around Harrisonburg and beyond! After I process all the data... and create all of the charts and graphs... and doodle on them to notate trends... I then go back and review it all again in order to write the headline of my monthly market report. As it turns out, this month's headline ended up being pretty similar to last month. Fewer home sales... higher sales prices... but also... higher inventory levels. We are definitely seeing some shifts in our local market, though it is not yet clear how significant of an impact those changes will have. But we'll get to all of that real estate data... First, whether you are a teacher, a student, a professor, a school administrator, a staff member at a local college, or a parent, I hope your school year has had a great start. On our end, Luke has started his first semester of classes at Wake Forest and Emily is a few weeks into 10th grade. It has been a fun but busy start to the year, and we're looking forward to visiting with Luke at WFU Family Weekend soon! Secondly, a few listings of potential interest to you... 9926 Goods Mill Road - A modern farmette on 3.3 acres with awesome mountain views in the Spotswood High School district for $575,000. 3986 Dixie Ridge Road - A spacious four (or five) bedroom home with the primary bedroom suite on the main level for $475,000. 3211 Charleston Boulevard - A like-new, upscale townhouse in Preston Lake with a two-car garage with access to many community amenities for $375,000 Congers Creek Townhomes - Three-level, new construction townhomes across Boyers Road from Sentara RMH Medical Center for $306,900 and up. And thirdly, each month I offer a giveaway, of sorts, for readers of this market report, highlighting some of my favorite places, things or events in Harrisonburg. Recent highlights have included Merge Coffee, Jimmy Madison's and Red Wing Roots tickets. This month I am giving away a $50 gift certificate to a delicious local restaurant, Taste of Thai. I'm writing this report on Wednesday evening... you'll get it Thursday morning... and my writing this evening is powered by one of my go to dishes at Taste of Thai... Massaman Curry. Are you a fan of Taste of Thai as well? Click here to enter to win a $50 gift certificate! And now... on to the data, and charts and graphs... 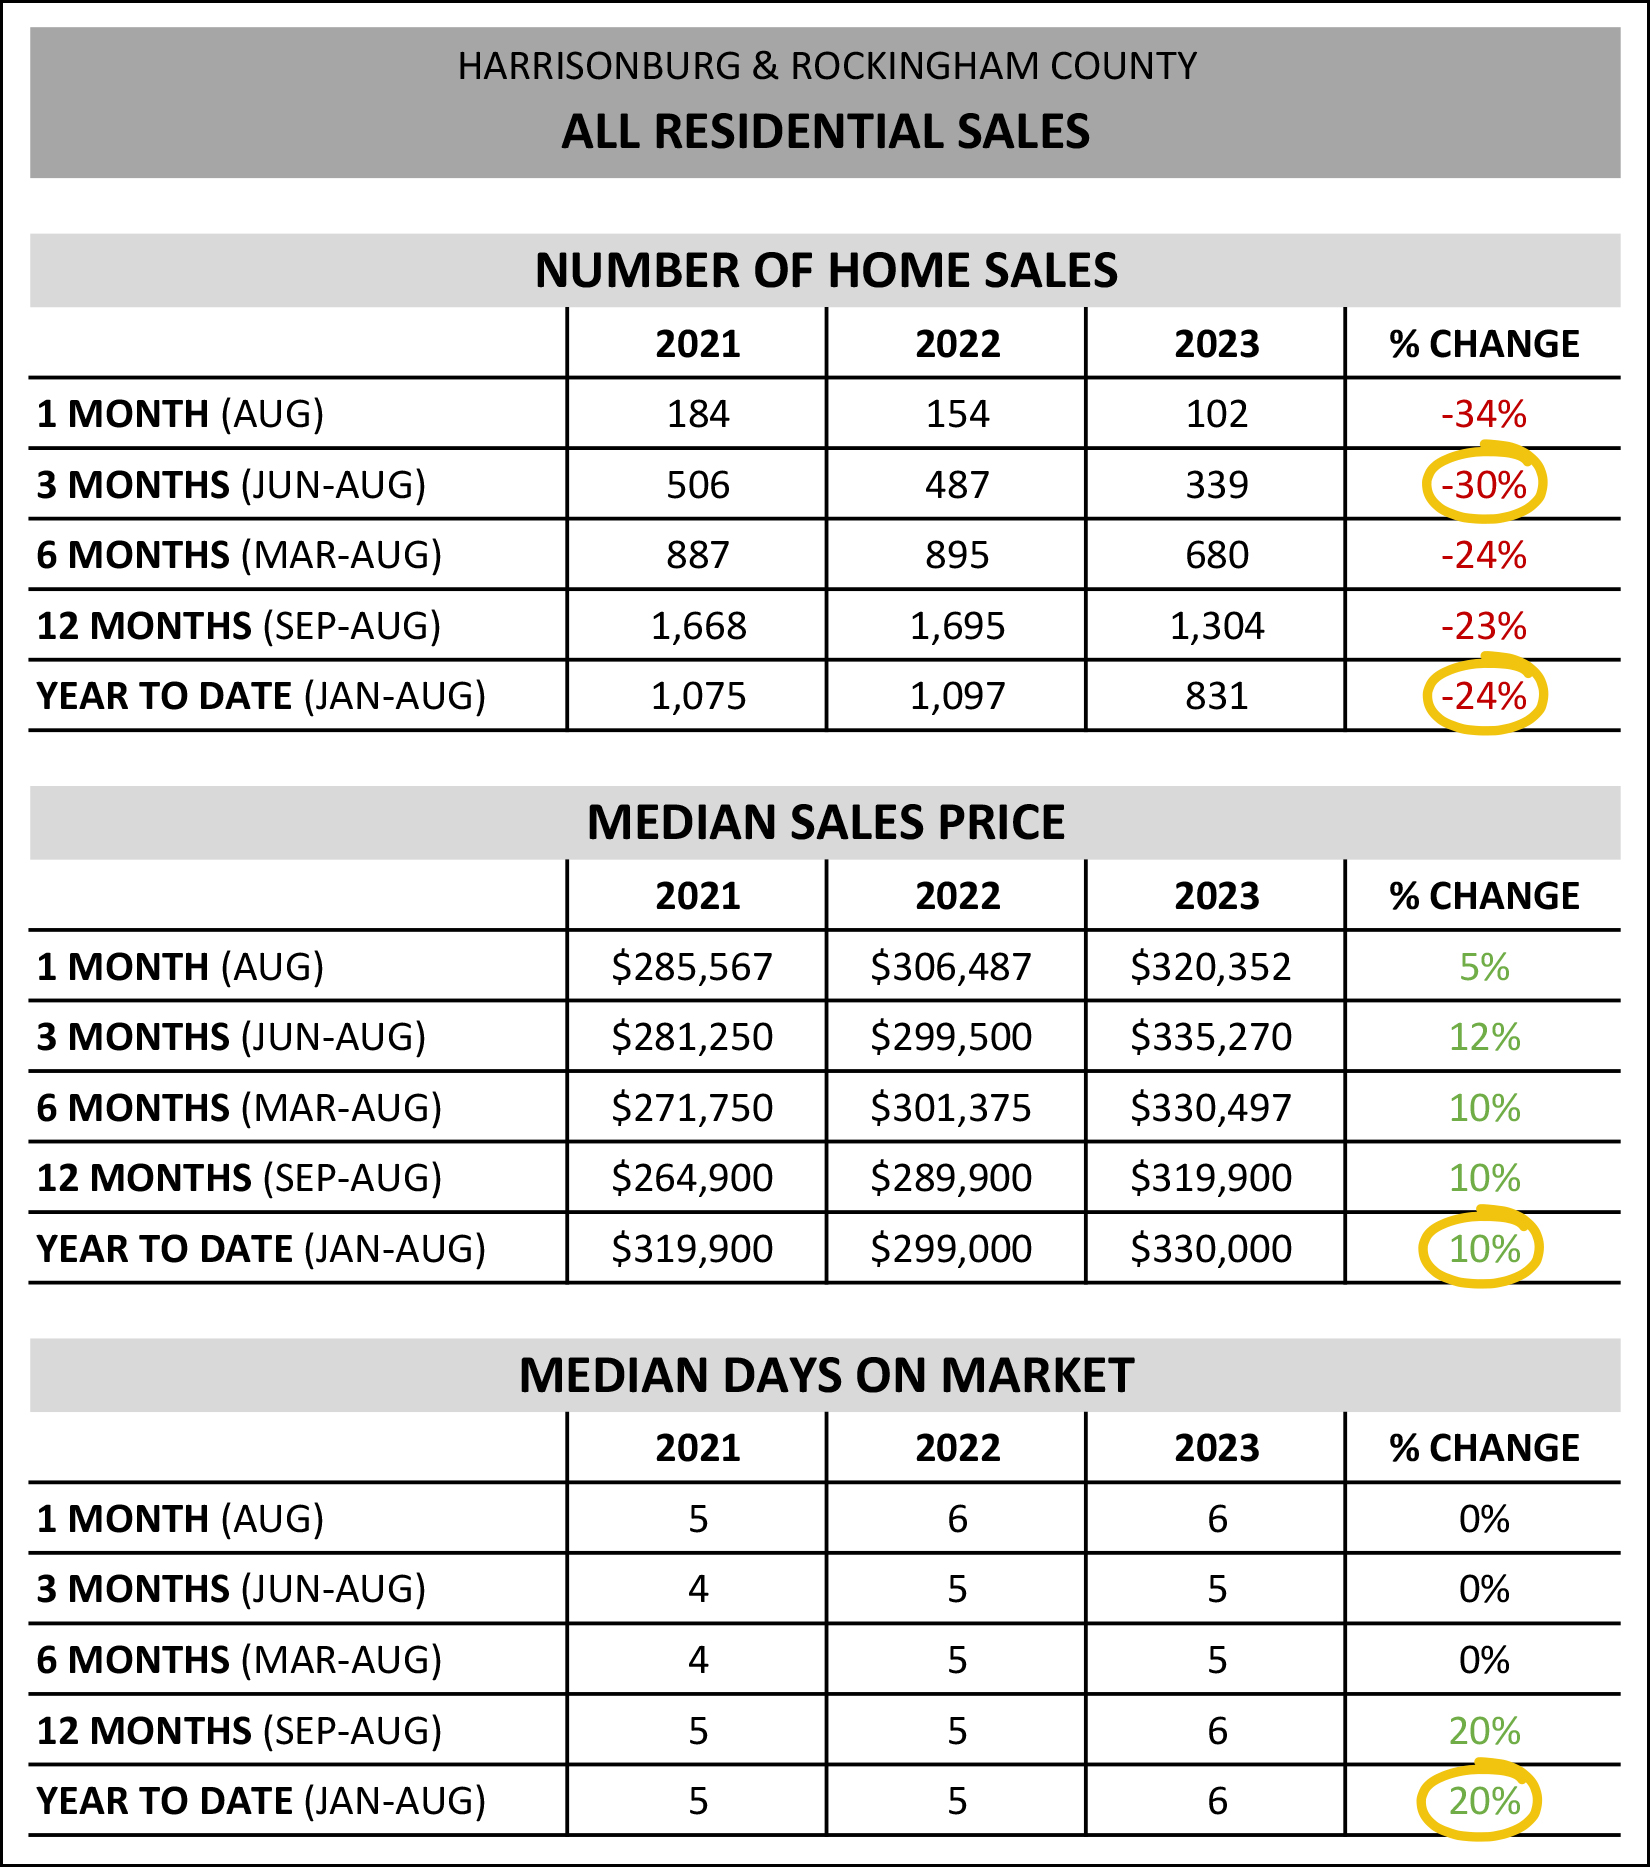 This first data table above shows much of what we've seen for the past year or so now... [1] We're seeing fewer home sales now than we were a year ago. In the first eight months of this year (Jan-Aug) we've seen 24% fewer home sales than in 2022. If we look only at the summer months (Jun-Aug) we see a slightly larger 30% drop in the number of homes selling. [2] The median sales price continues to rise... it's up 10% in the first eight months of this year (Jan-Aug) as compared to the same timeframe in 2022. [3] Homes are still going under contract rather quickly with a median days on market of six days, which is just a smidge ahead of last year's median of five days. As alluded to above, the summer months were a good bit slower this year than last... 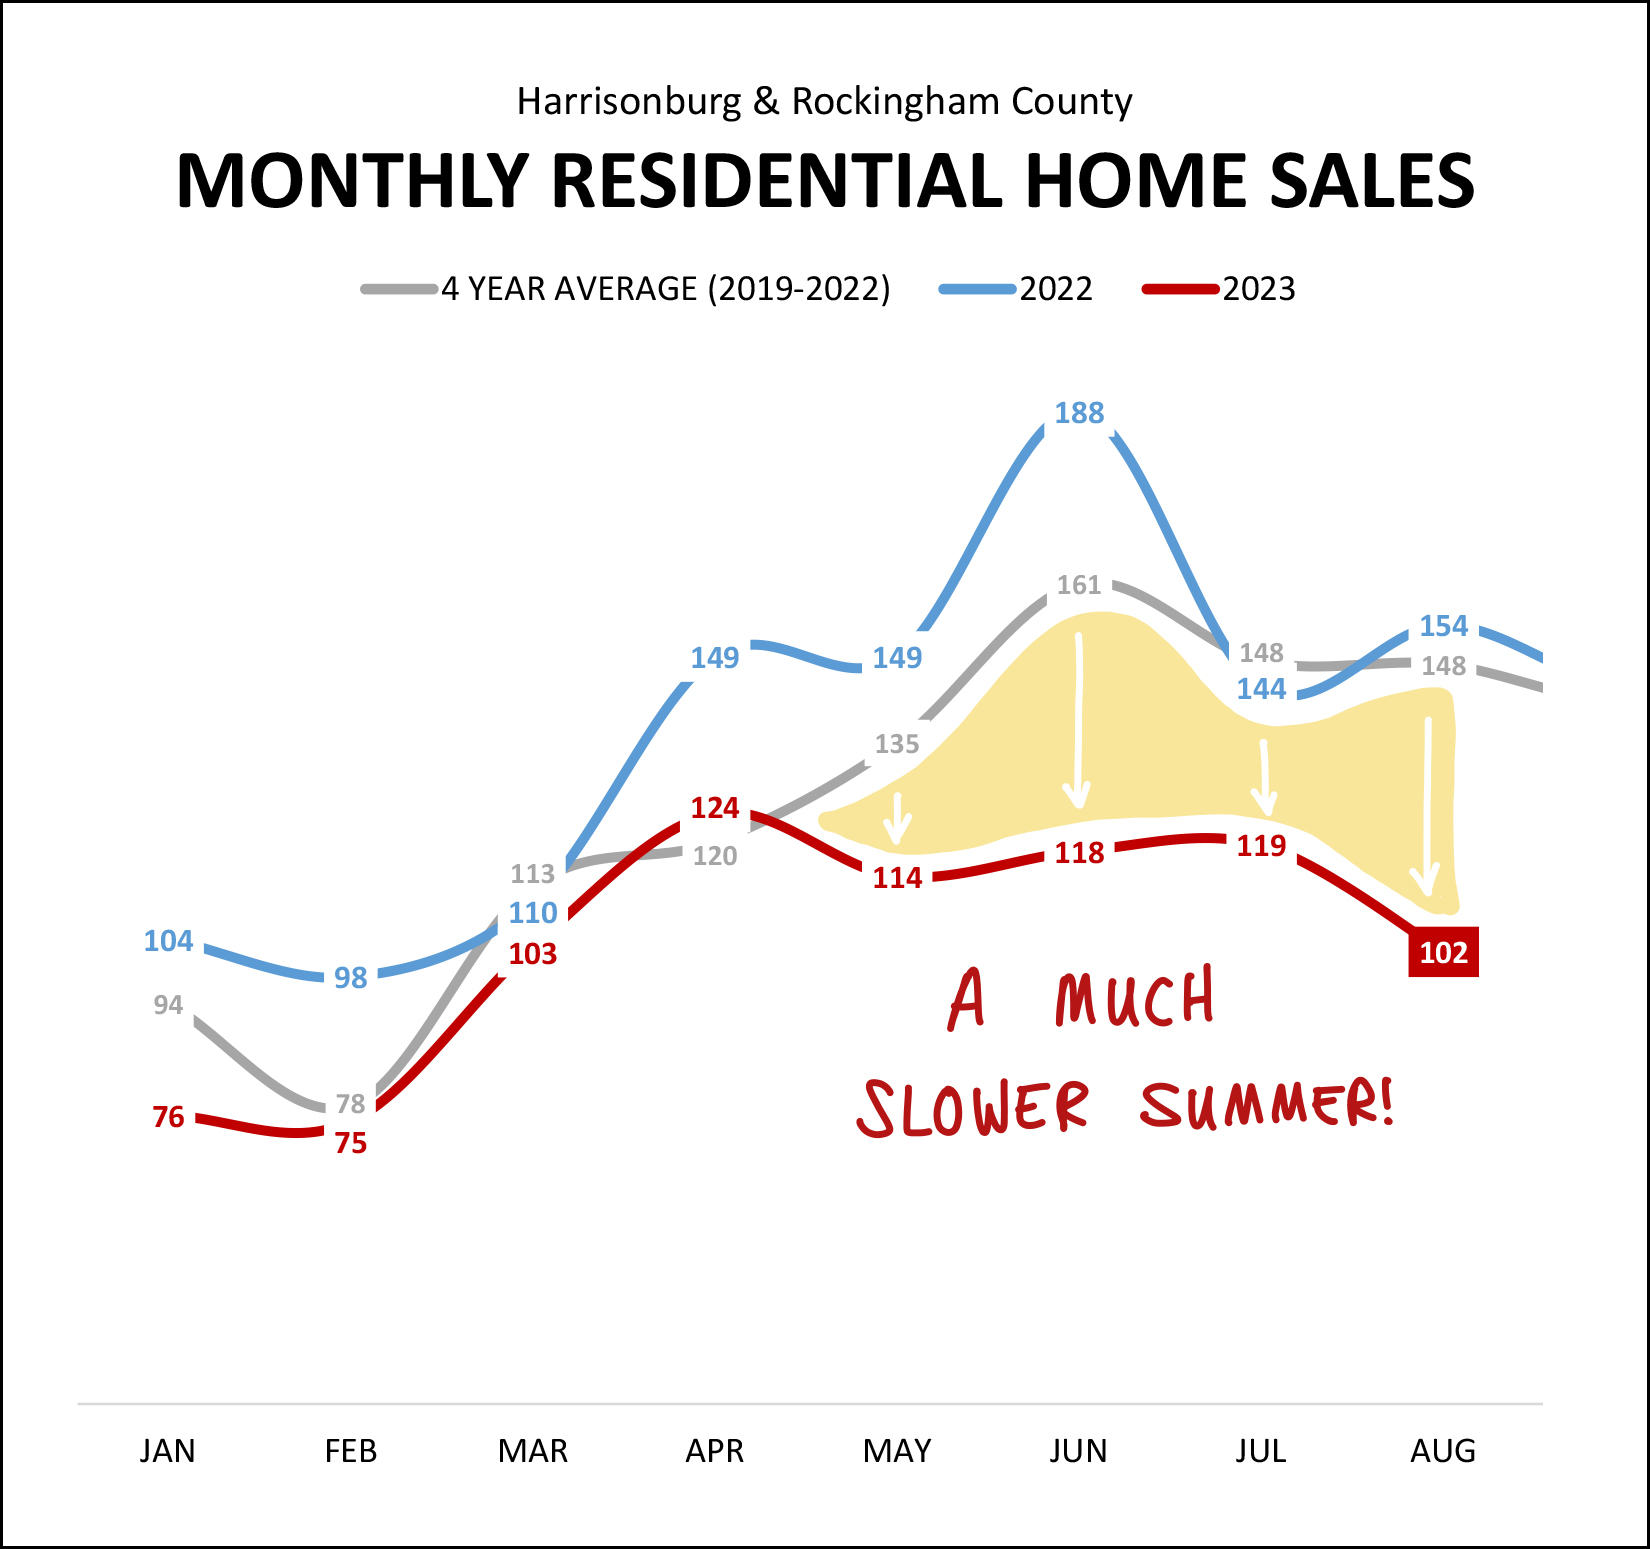 The three lines shown above are as follows... Red = This Year Blue = Last Year Grey = Average of Past Four Years As such, home sales in the summer (+/-) of 2023 were well below the average of the past few years, and even farther below last summer. We saw 102 home sales in August 2023... which is slightly less than we saw in... January 2022. That's actually sort of surprising... a summer month that we would expect to be rather active was slower than a winter month that we would expect to be rather slow. High mortgage interest rates -- we'll get to those below -- likely play a significant role in slowing down the number of homes that are being sold and purchased these days. Now, putting the lower and lower number of home sales in context... 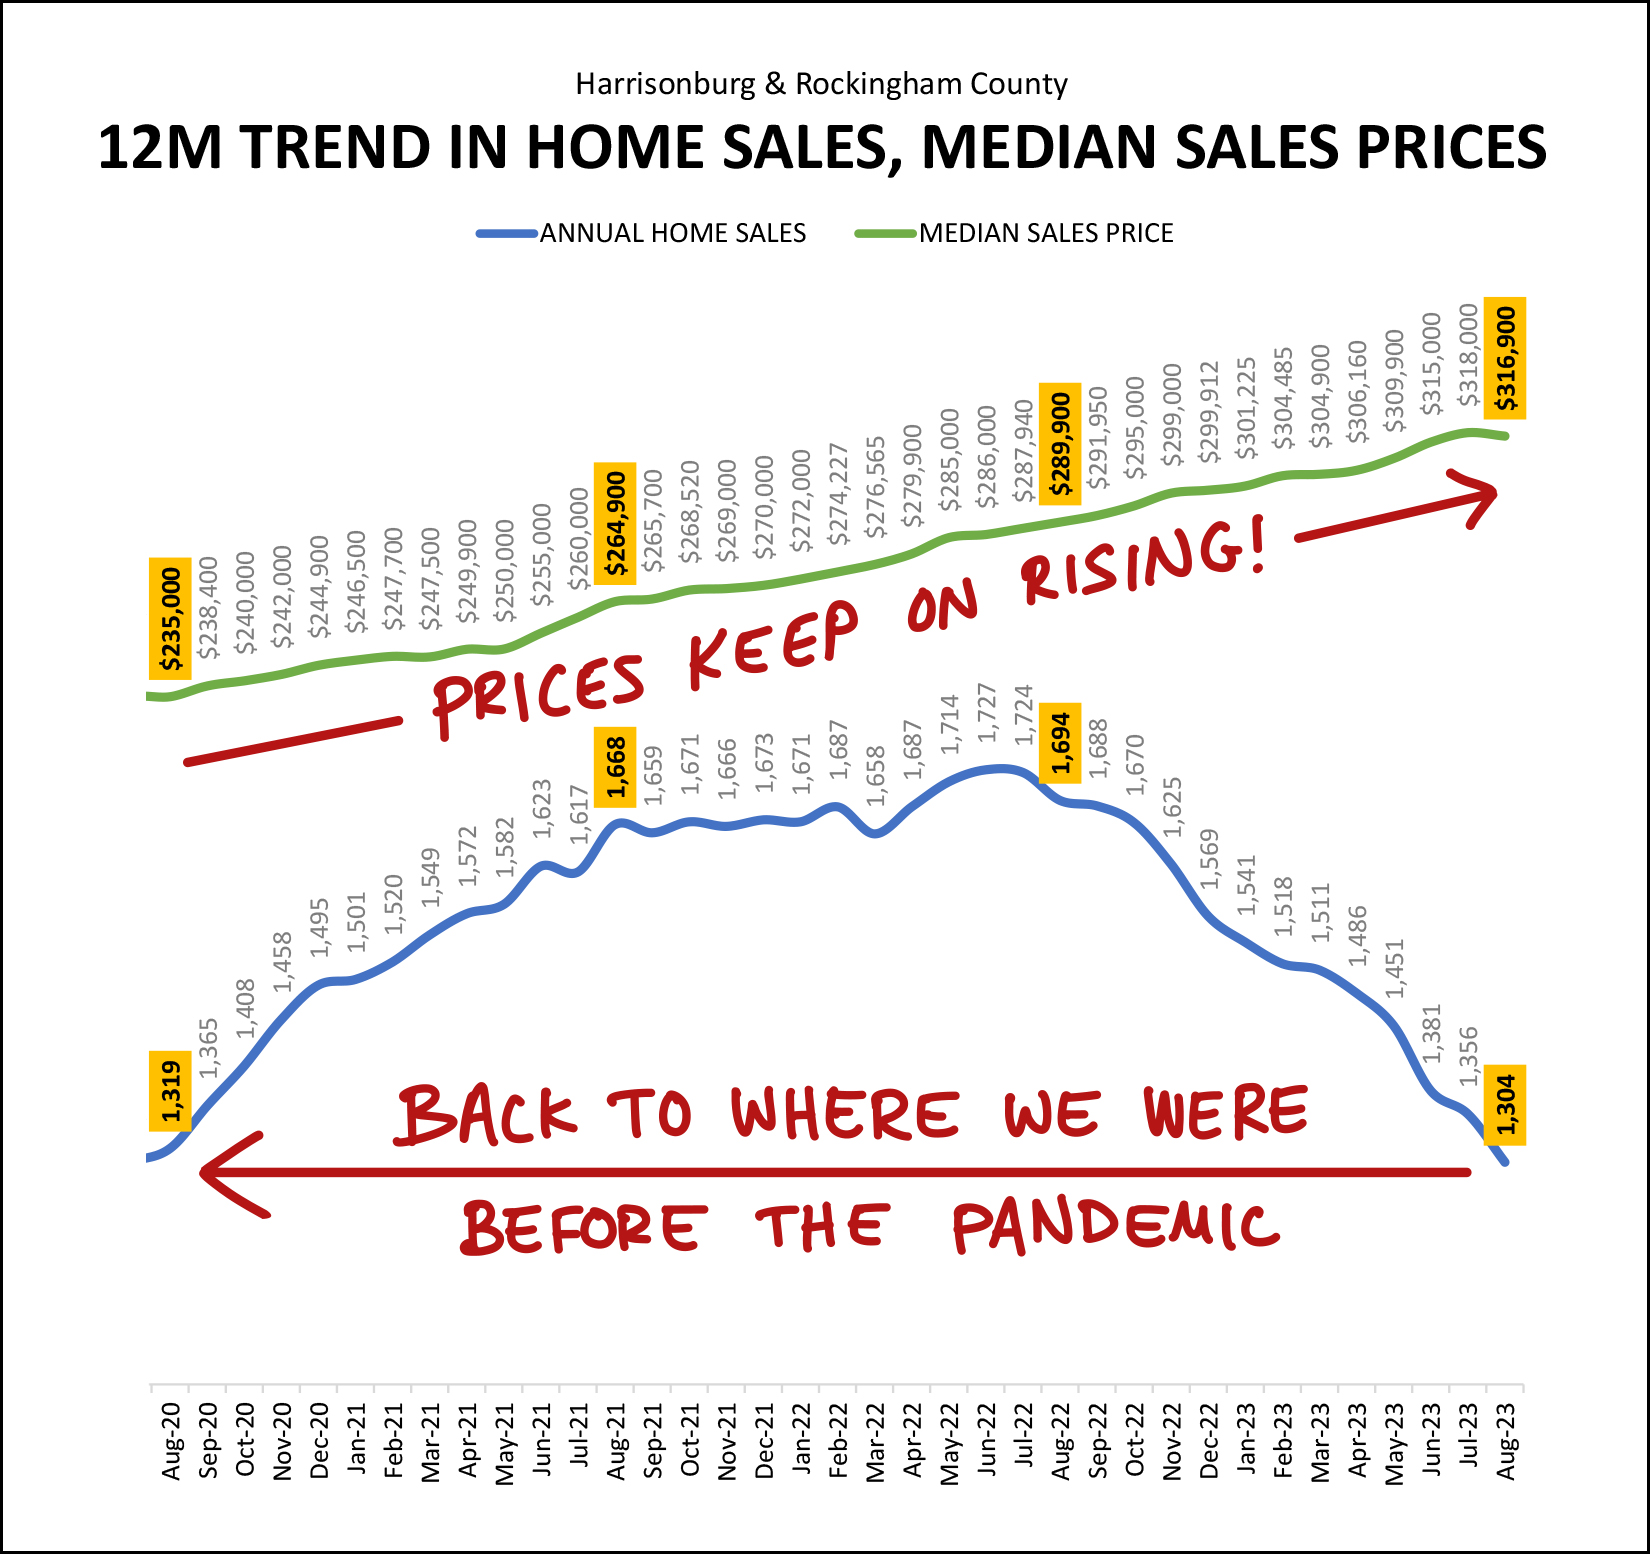 We have seen the number of home sales in a 12 month period drop from about 1700 home sales (summer 2021 through summer 2022) down to only 1300 home sales. But... looking back a bit further, this just takes us back to... where things were at the start of or just before the pandemic. So... yes, we're seeing significantly fewer home sales right now... compared to the significantly higher number of home sales seen in 2020, 2021 and 2022... which were likely high points fueled by low mortgage interest rates and lots of buyers rethinking what they needed in a home during the pandemic and thereafter. And yes, despite the rapid increase (1300 to 1700) and then rapid decrease (1700 to 1300) in home sales, we've seen home prices steadily march on along, upward, during the entirety of the past three years. Looking back a bit further than three years puts the change in median sales price in an even wilder context... 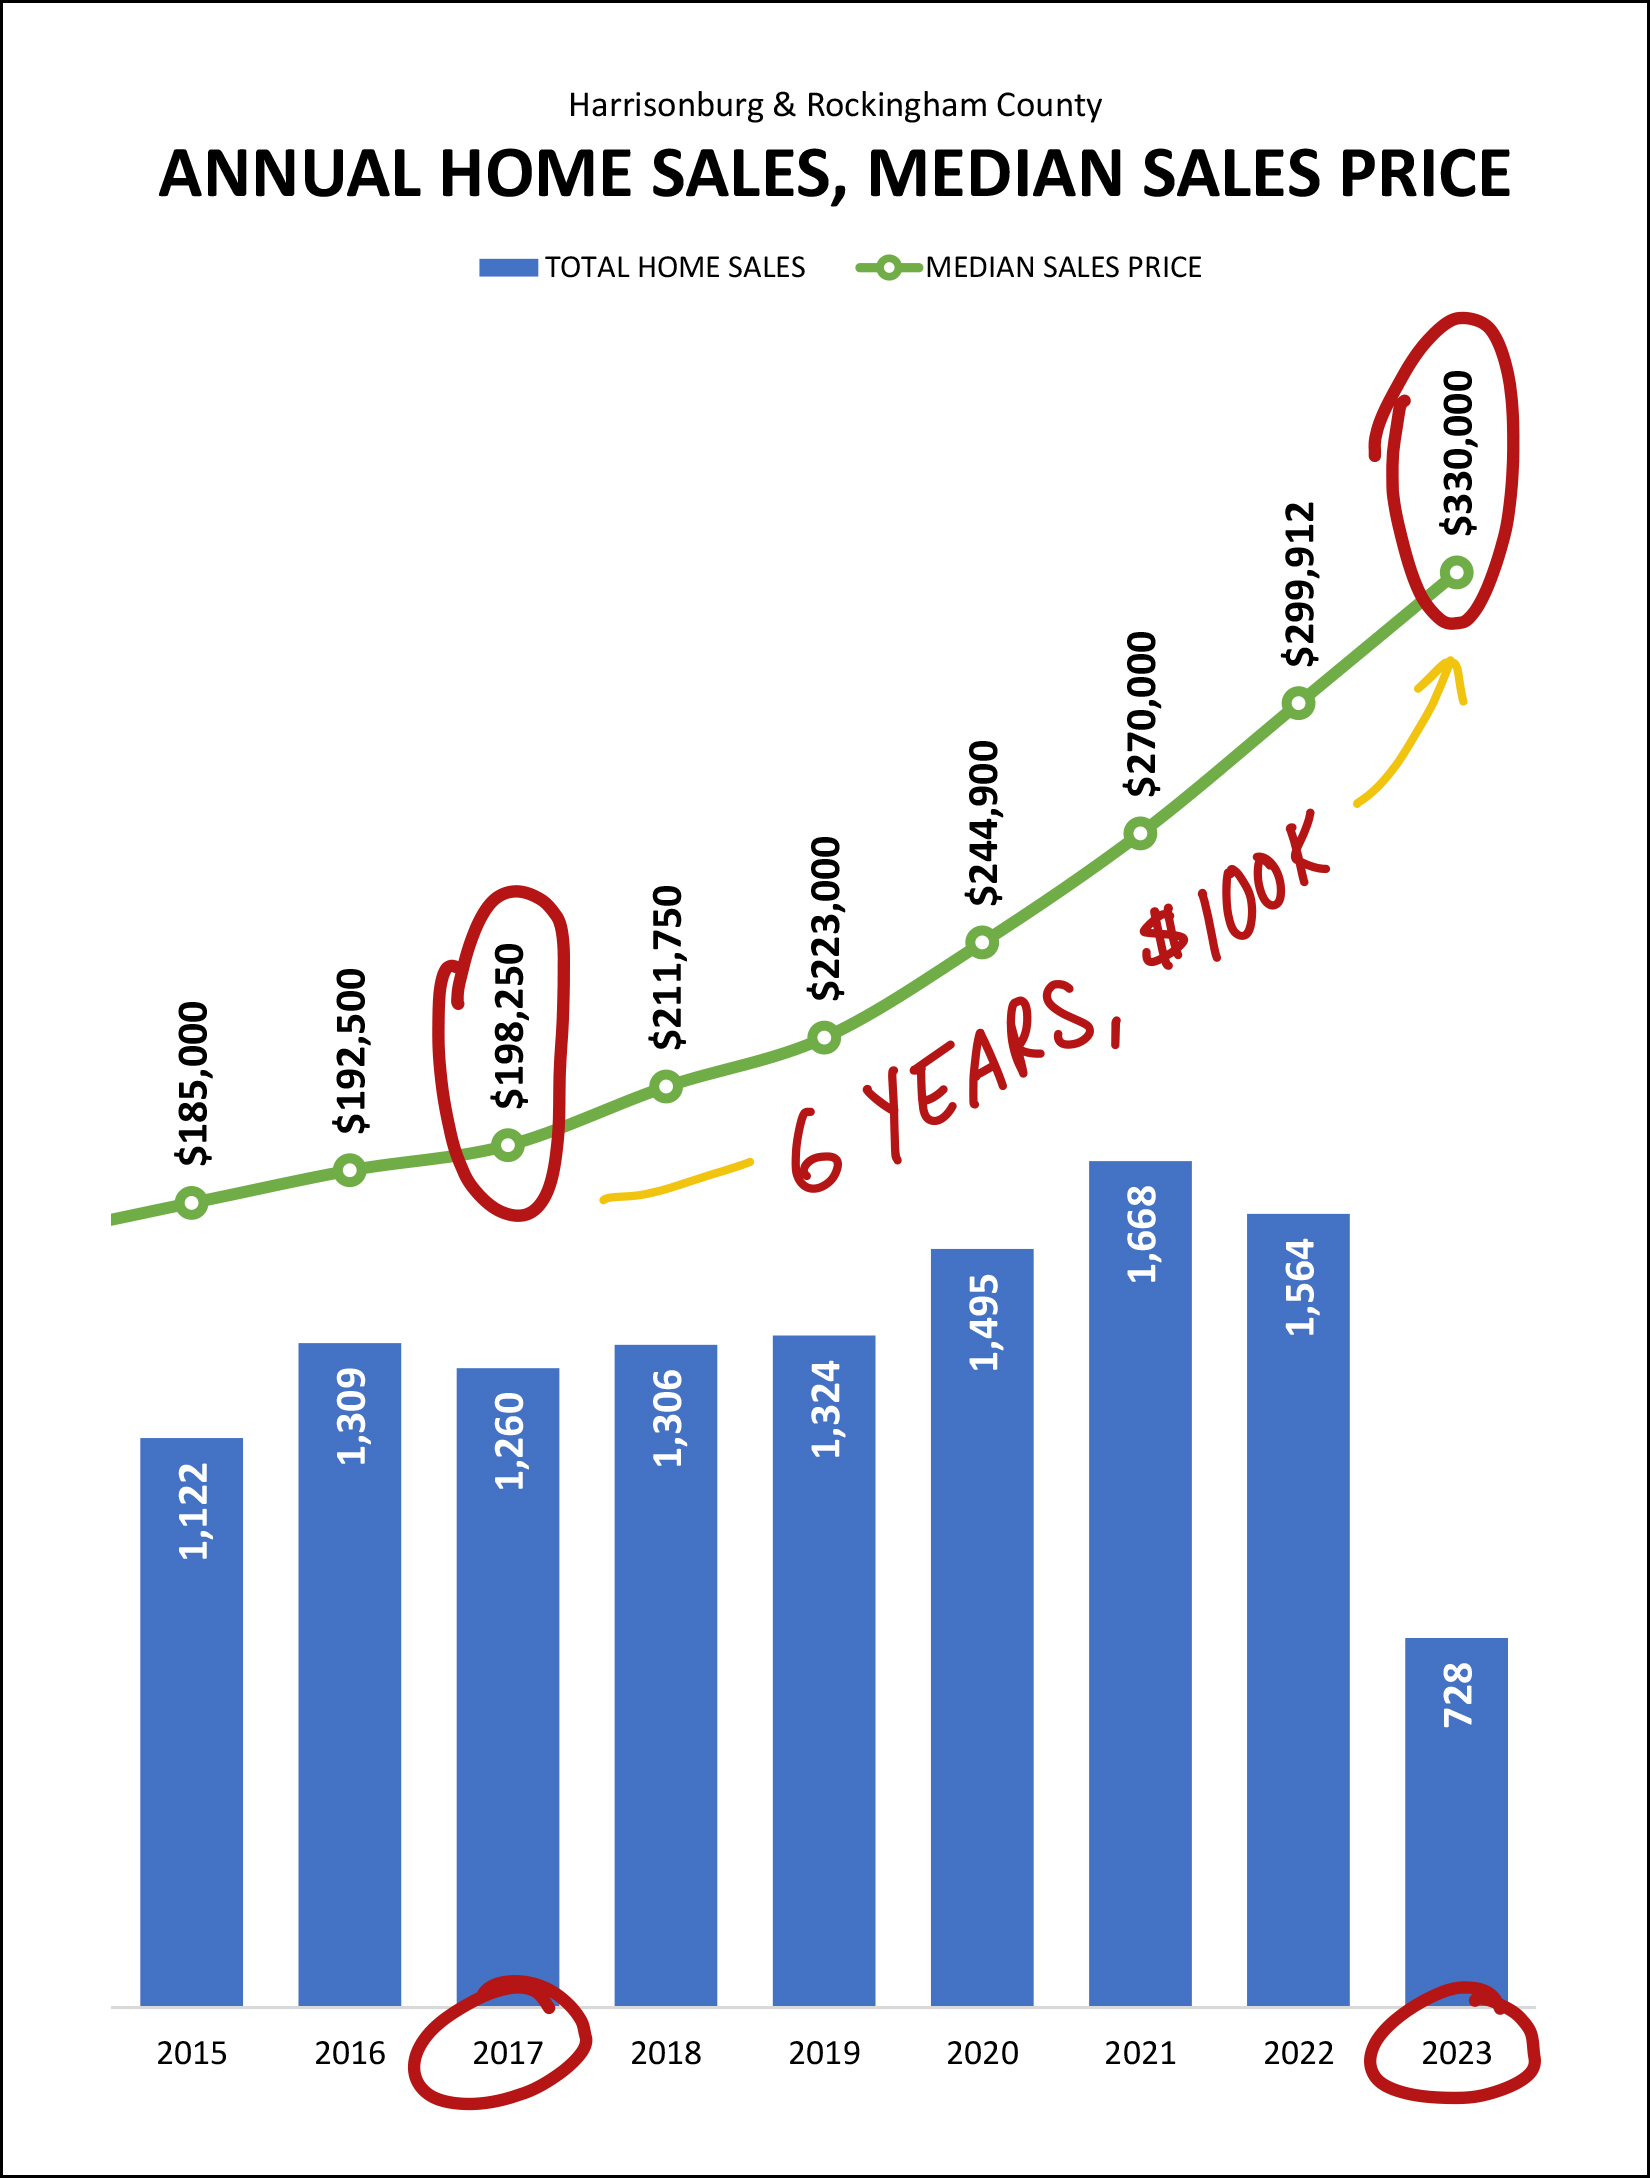 Not too long ago (2017) the median sales price in Harrisonburg Rockingham County was just below $200K. This year (2023) that median sales price is now above $300K. That $100K(+) jump over the course of six years has significantly changed what it looks like to be a first time buyer (or a move up buyer) in our local market. Certainly, the higher mortgage interest rates we have seen in 2023 (and 2022) haven't helped either. The combination of higher sales prices and much higher mortgage interest rates have resulted in much, much higher housing payments for buyers in today's market. Looking for a trend that is heading in two different directions at once? Here's one... 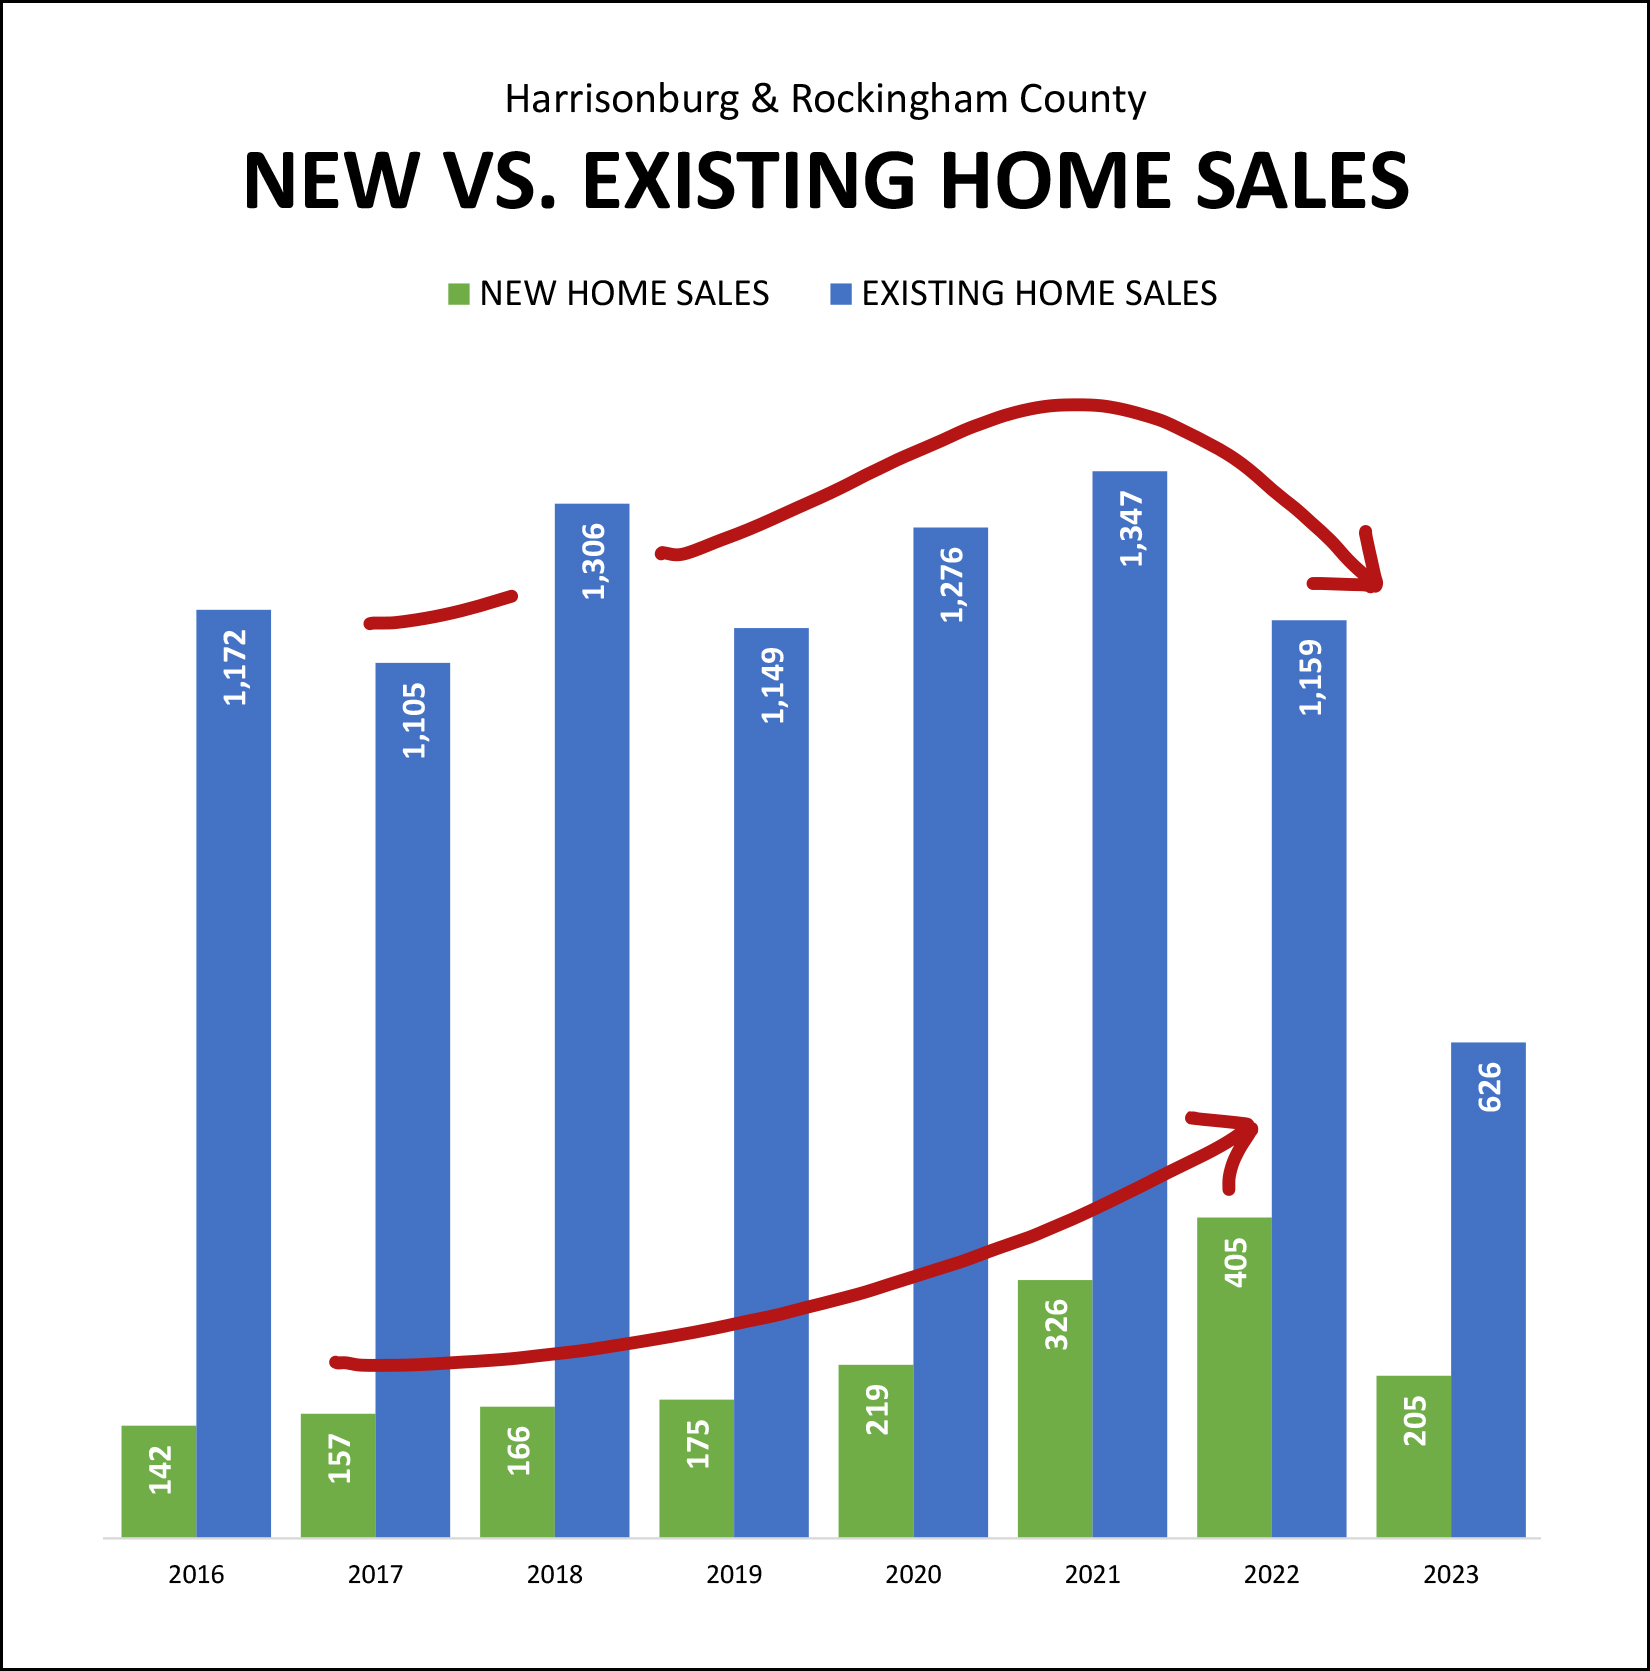 We are currently seeing a downturn (blue bars) in the number of existing homes selling in Harrisonburg and Rockingham County... while at the same time seeing an increase (green bars) in the number of new homes selling in our market. Higher mortgage interest rates are causing many homeowners to have no interest in selling... which is resulting in fewer existing homes being on the market for sale. Thankfully, there are builders helping to add housing stock in our area, resulting in more new homes selling over the past few years. Shifting gears a bit to the here and now... the freshest data to watch for the most recent trends is contract activity... 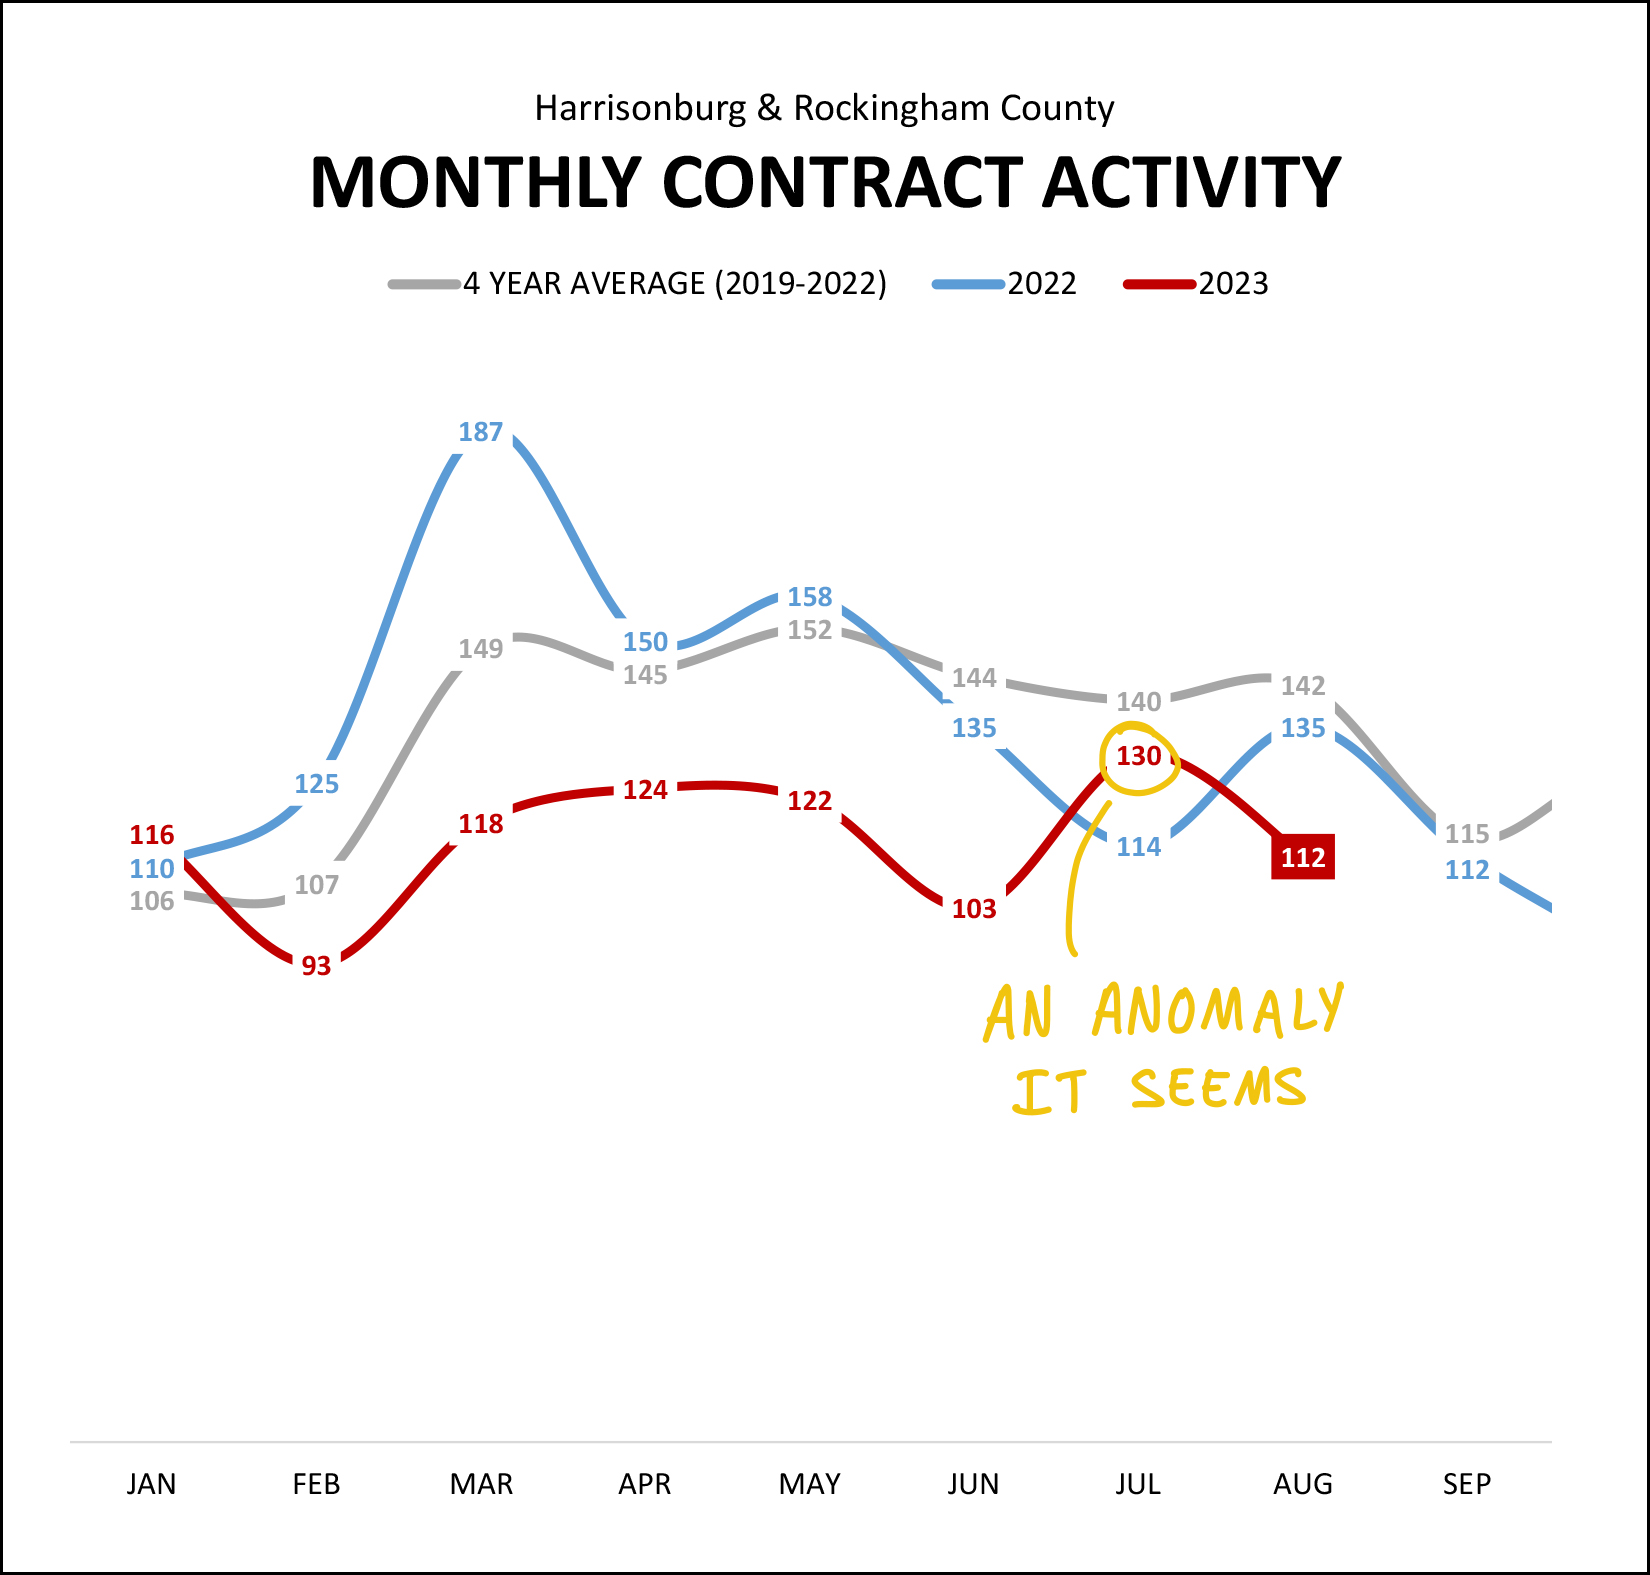 Last month we saw an increase in contract activity... with 130 homes going under contract, compared to only 114 in the same month last year. It seemed that maybe we would see a sustained surge of buyer activity. But... maybe not. With only 112 contracts signed in August 2023, it seems that the surge of contract activity in July 2023 was an anomaly, and we will still see smaller numbers of contracts being signed in 2023. Darn. And here's the most interesting graph of them all, in my opinion... 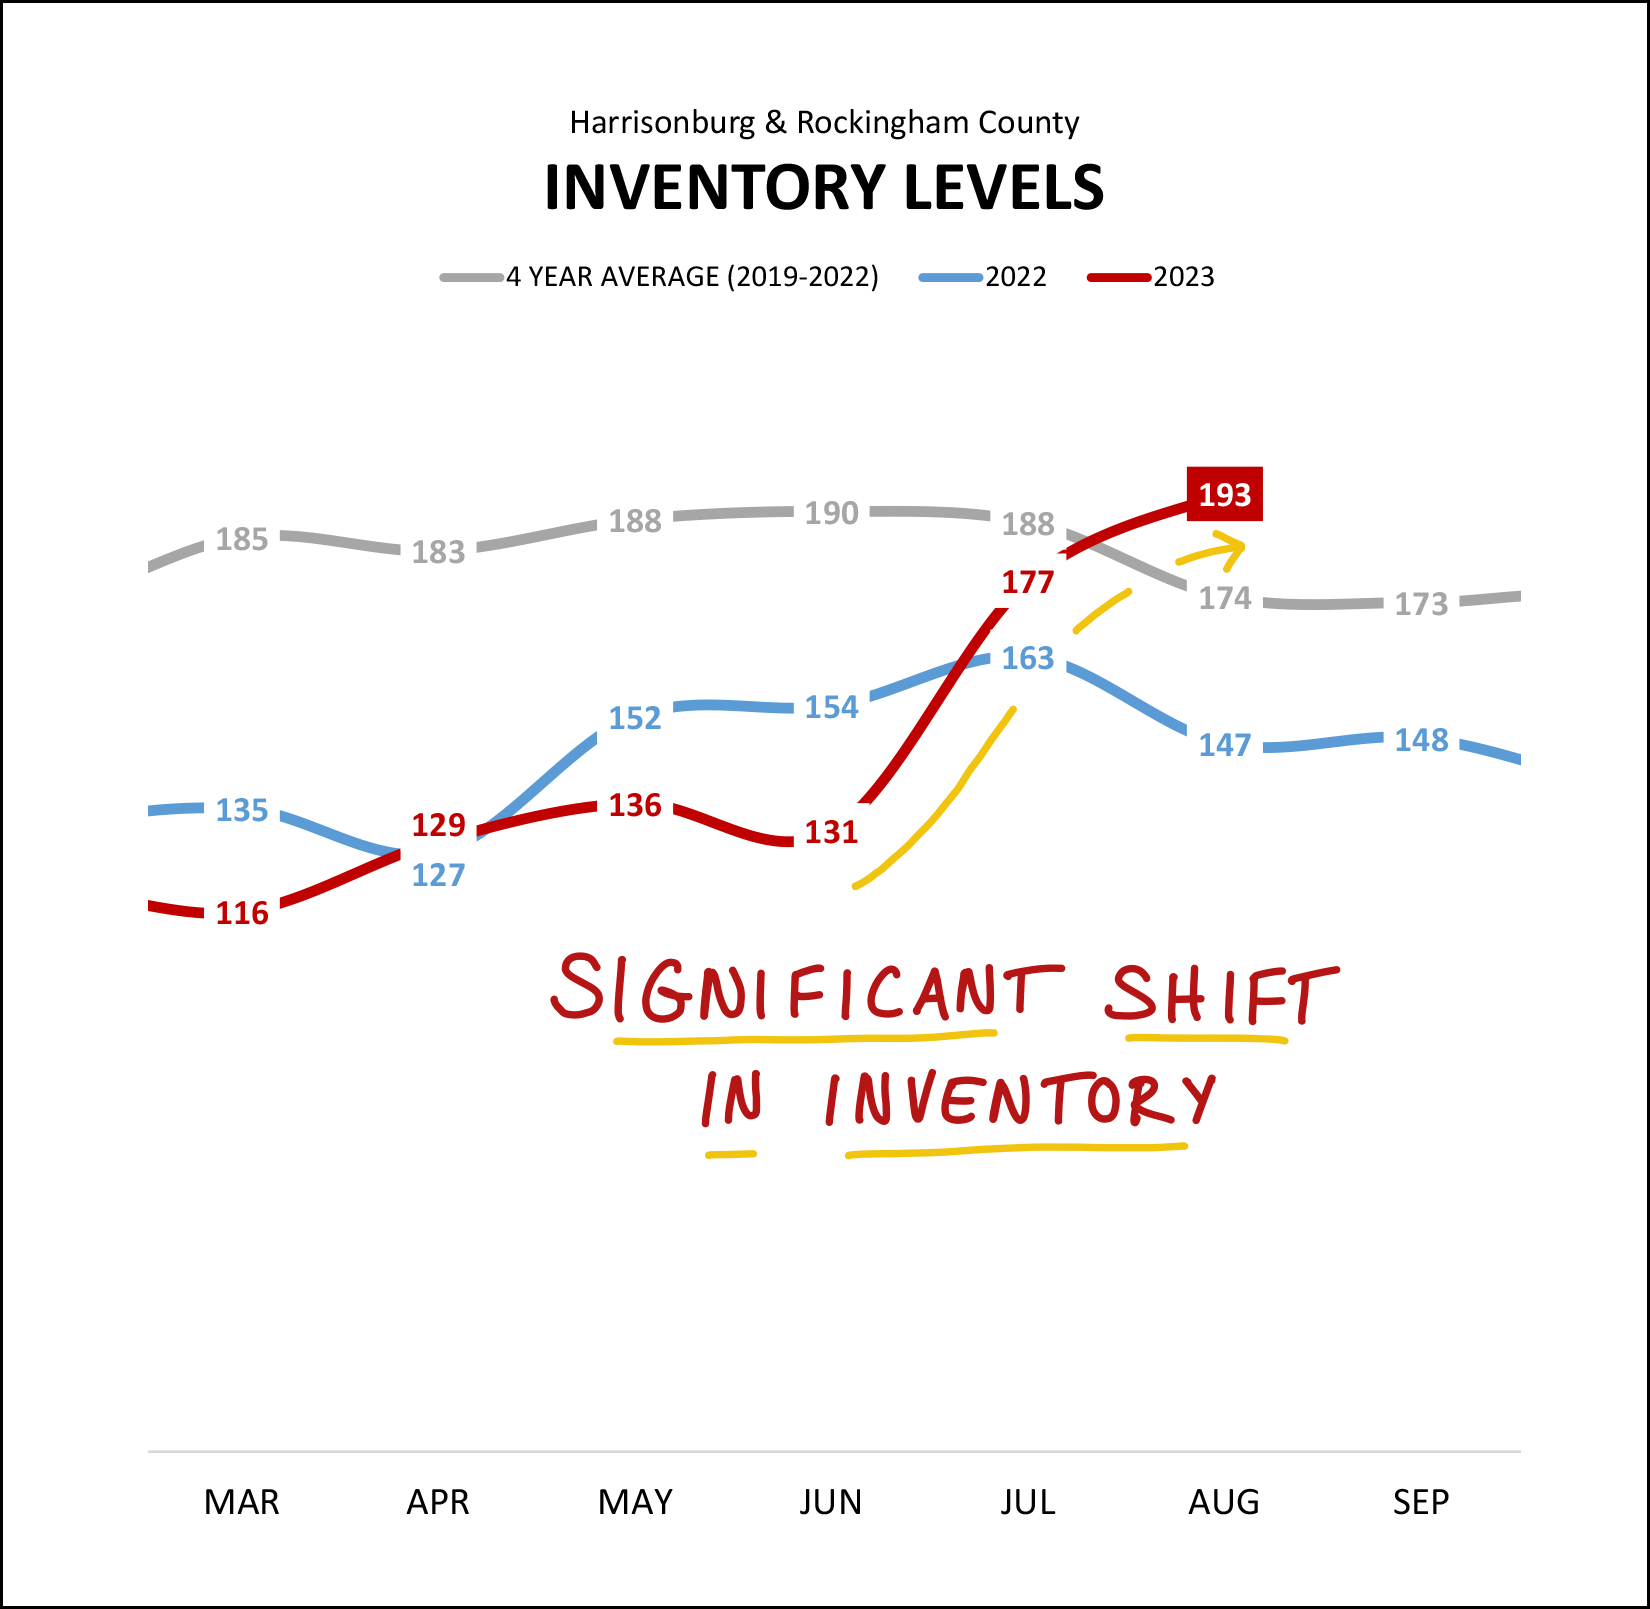 Over the past two months we have seen a significant shift in inventory levels -- the number of homes available for sale in Harrisonburg and Rockingham County. For most of this year (red line) we have seen even fewer homes for sale than last year (blue line) but that all changed in July 2023. Over the past two months we have seen inventory levels build up beyond (above) where they have been for the past several years. These higher inventory levels are resulting in... [1] Buyers have slightly more choices of homes to go view. [2] Homes sometimes staying on the market a bit longer than before. [3] Many sellers seeing fewer showings than they expected. [4] Plenty of homes not going under contract in the first few weeks. Will higher inventory levels eventually translate into a higher number of home sales, bringing inventory levels back down? Maybe. Will higher inventory levels eventually lead to some sellers being more flexible on price, and a leveling out of the median sales price, or even a decline in the median sales price? Maybe. I'll continue to monitor inventory levels with interest as higher inventory levels can start to make it a slightly more favorable market for buyers than it has been for the past few years. As already mentioned in this report, despite higher inventory levels, we're still seeing prices rise... and most (50%+) homes are still going under contract quite quickly... 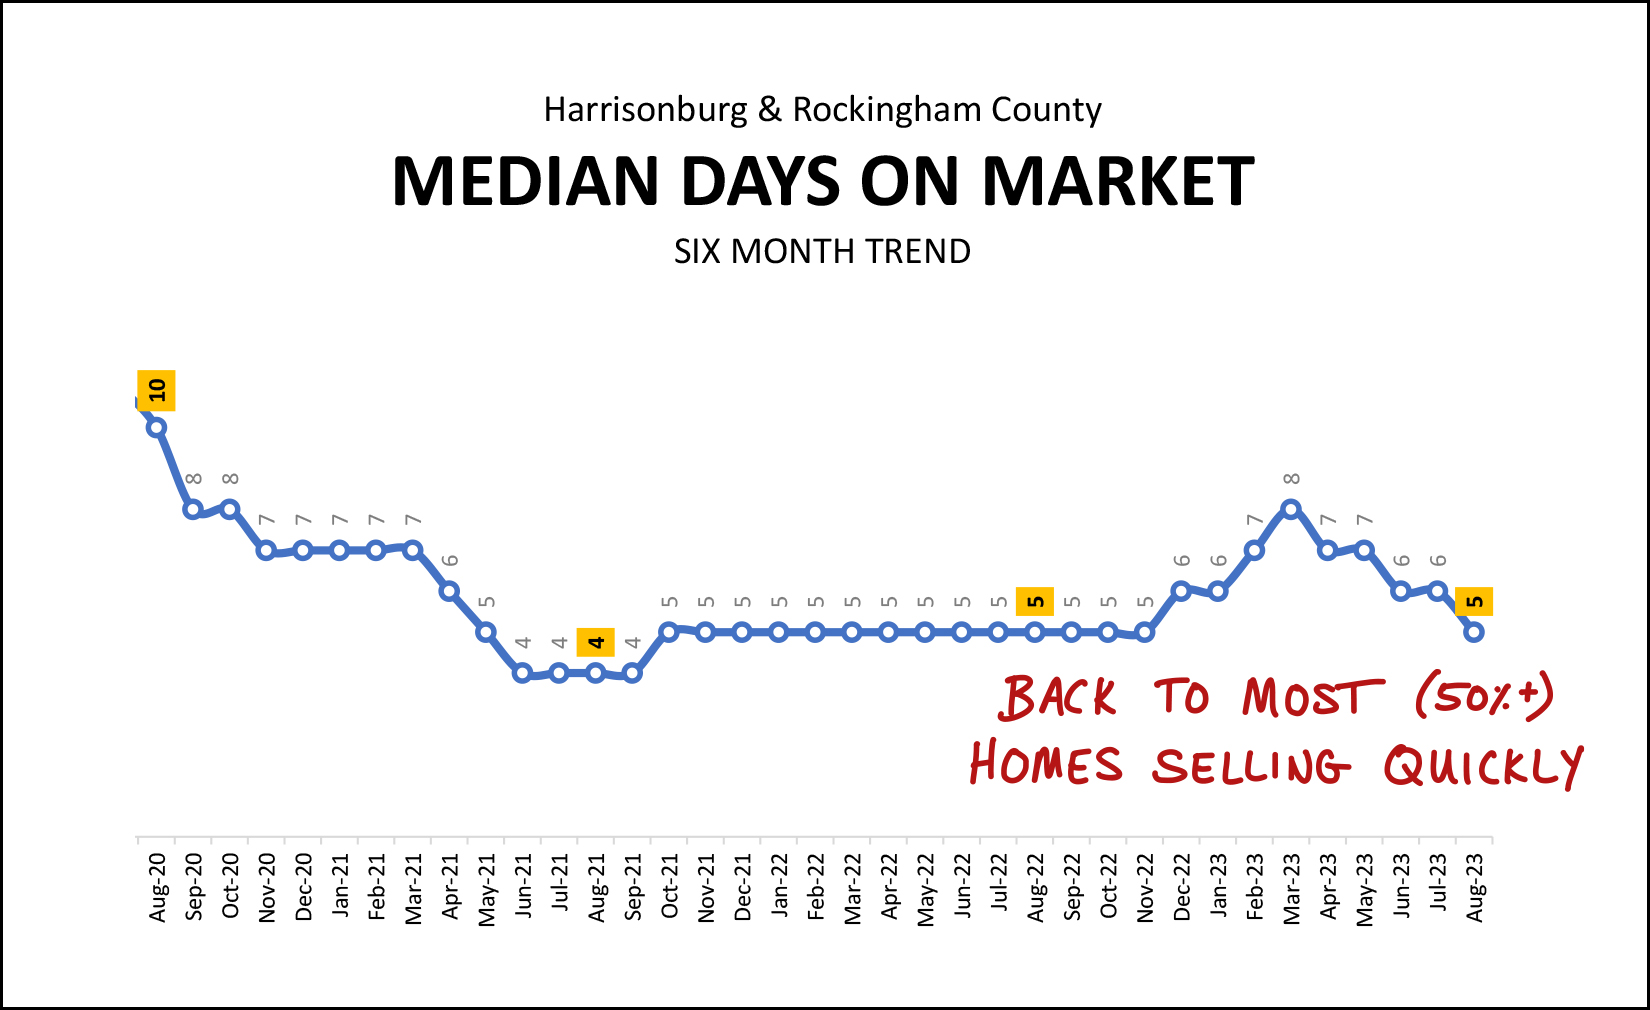 Just to translate the graph above into words... over the past six months the median "days on market" of homes that have sold was five days. Of note... that only measures the median days on market for sold homes... not those that are still on the market for sale. Furthermore, this is just a median -- it's not saying that all homes are going under contract in five or less days. As per how a "median" calculation works... 50% of homes are going under contract in five or fewer days... and 50% are going under contract in five or more days. And finally... I have mentioned higher mortgage interest rates so many times in this market report that you're probably wondering how high they are... 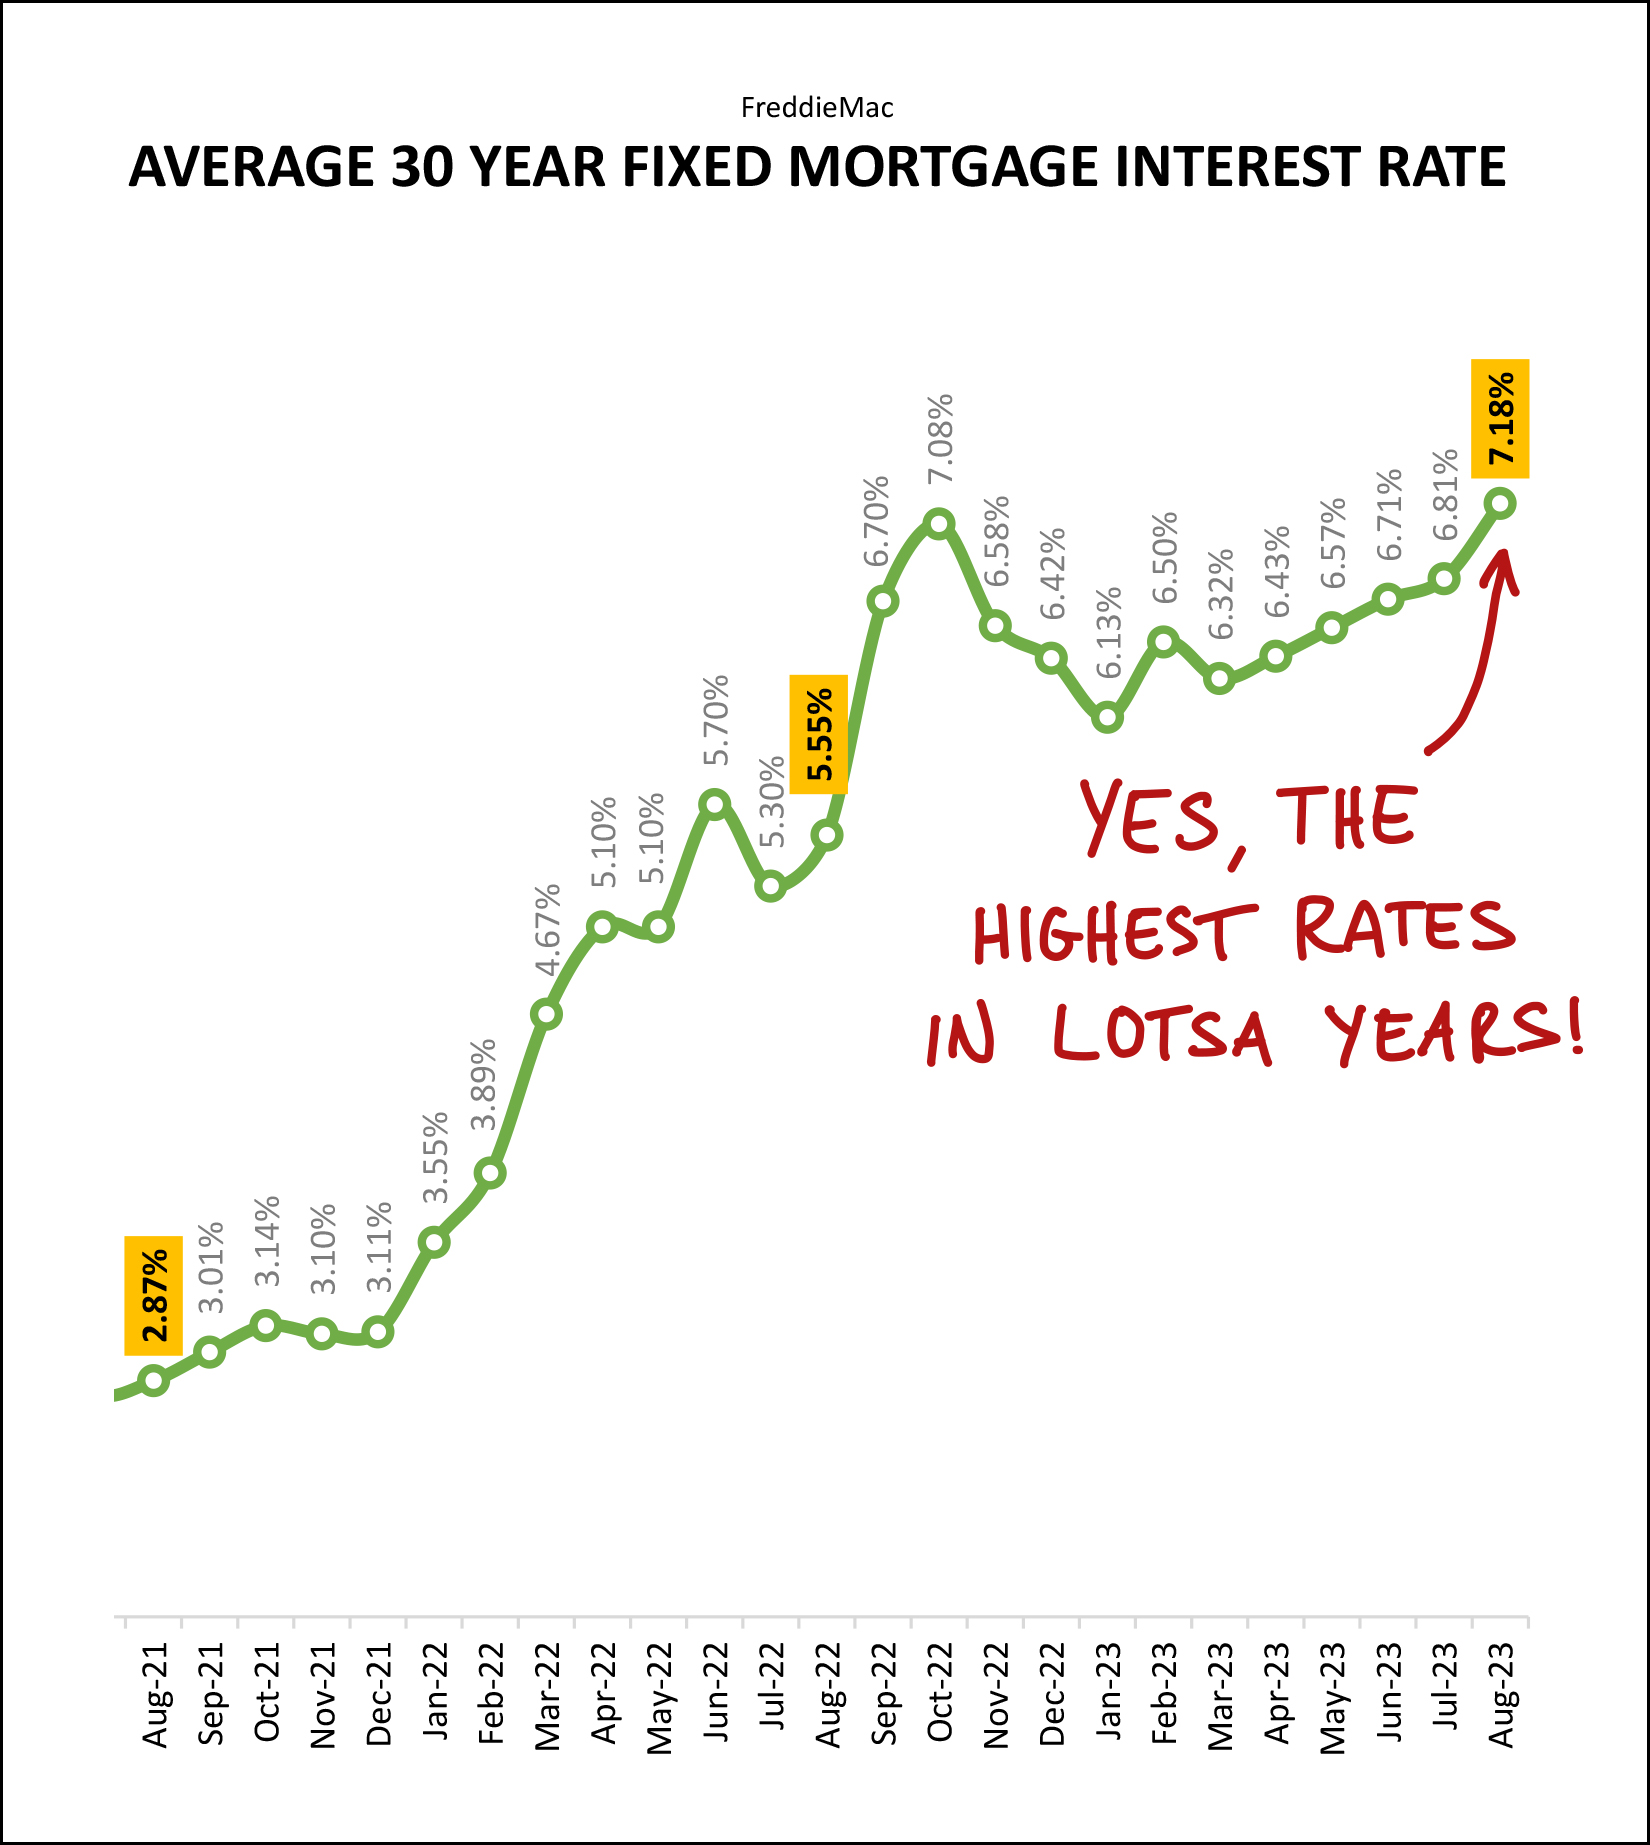 They are QUITE high... higher than they have been in many years... higher than they have been in several decades. It seems quite possible that mortgage interest rates will edge back down below 7% in the coming months... but I'm guessing we'll see mortgage interest rates above 6% for the next year or two. These higher mortgage interest rates significantly affect housing costs for buyers making a decision to buy in today's market. If mortgage interest rates were lower, we would likely see more sellers being willing to sell, and more buyers able to and interested in buying. And just like that, we've breezed our way through all of the charts and graphs I have for you today. My advice to buyers and sellers is relatively similar to recent months gone by, but I'll reiterate it here... Home Buyers -- You might be able to wait a day (or even two) to go see a new listing now, but don't assume that many or most will be there three or four days after they hit the market. Plenty of homes are still going under contract very quickly, particularly those in more desirable price ranges, locations, etc. Talk to a mortgage lender to understand your potential housing costs and get going to see some new listings as they hit the market. Home Sellers -- All homes won't go under contract within five days. Your home might be on the market for a few weeks or even a few months depending on it's condition, location, price range and other attributes that are appealing to either a wide or narrow pool of buyers. Price your home competitively, prepare it well for the market and market it thoroughly and professionally and you should still have success in securing a contract with a buyer -- but it won't necessarily happen overnight like it seemingly always was over the past few years. If you have a real estate question... reach out anytime. It's never too early to have an initial chat about your possible plans to buy, sell or move. I'm happy to provide feedback and input to help you think some things through and make a plan for your housing transition when you're ready to do so. You can reach me most easily at 540-578-0102 (call/text) or by email here. | |
August Contract Activity Was Slower Than In Recent Years |
|
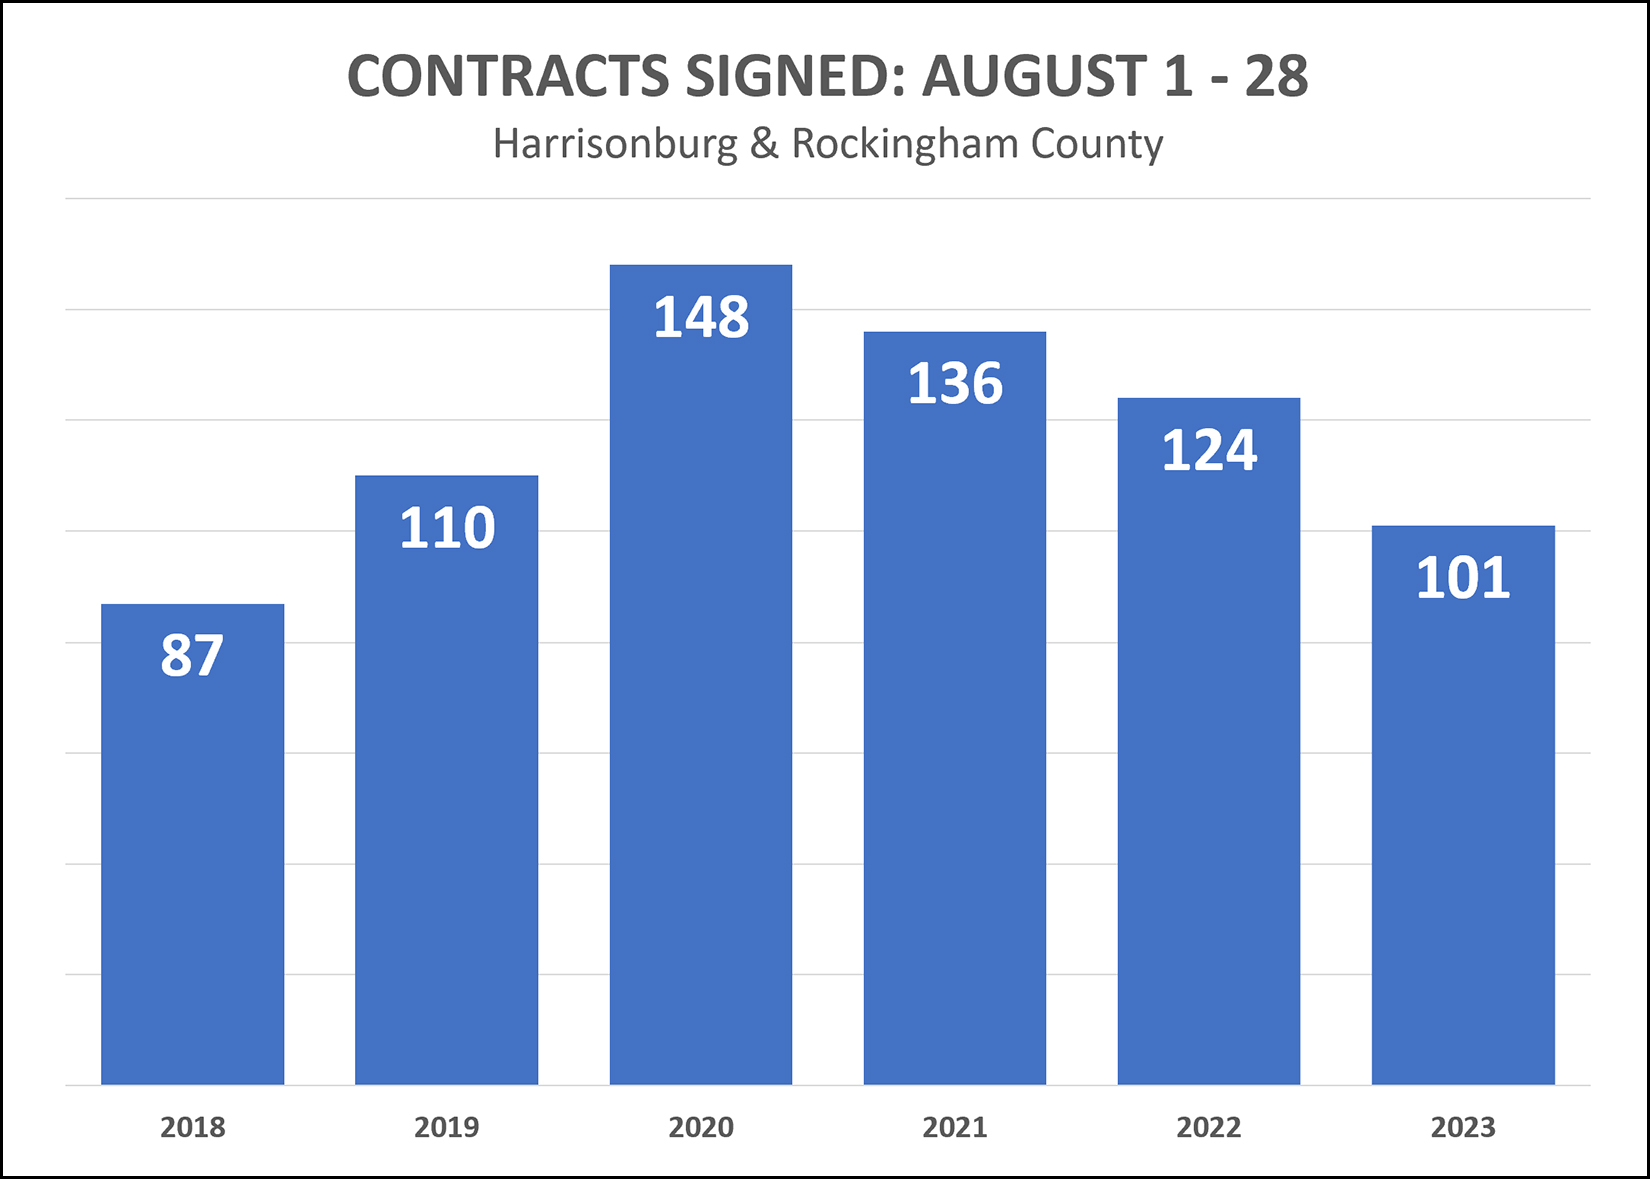 We are seeing fewer home buyers signing contracts to buy homes right now... compared to the past few years. The graph above shows the numbers of homes that went under contract in the first 28 days of August for each of the past six years. The 101 contracts signed in the first 28 days of August 2023 is decidedly lower than the contract activity seen in August 2020, 2021 and 2022 -- though most of those years were much more active than normal given COVID-induced buyer enthusiasm and super low mortgage interest rates. As such, it is not totally surprising to see us return to around 100 contracts signed in August, which is the average of how many we saw in August 2018 and August 2019. With mortgage interest rates around 7% right now, I expect we will continue to see slower months of contract activity as we continue into and through the fall months of 2023. | |
Fewer Home Sales, But Prices Are Rising!? More Contracts But Inventory Levels Are Rising!? |
|
 Happy Monday afternoon to you, friends! This monthly market report is one of some enigmas, some contradictions, some puzzlement. Some of these will be familiar, some new, some unrelated to real estate... [1] How can it be that we are seeing fewer home sales, but higher prices!? [2] So, contract activity is increasing, but inventory levels are also rising!? [3] How can I feel so young, yet have a son heading off to college this Friday!? :-)  Indeed, Luke heads off to Wake Forest University this Friday! We are tremendously excited for this next step in his life and educational journey, but we will miss him and his friends greatly as they head off in new directions. Swiveling quickly back to real estate before I spend too much time thinking about the aforementioned major life transition (!!) I'll point you towards a few of my current listings that might be of interest... 9926 Goods Mill Road - A spacious home / farmette on 3.3 acres with wonderful mountain views in the Spotswood High School district. $585,000. 150 Autumn Bluff Drive - A like-new, upscale, custom-built, single-level home in Autumn Breeze on a large corner lot. $445,000. 1210 King Edwards Way - A four bedroom home in the City with an attached two car garage and a large back deck. $389,500. 3211 Charleston Boulevard - An upscale townhouse in Preston Lake with a two-car garage with access to many amenities. $375,000 Congers Creek Townhomes - Three-level, new construction townhomes across Boyers Road from Sentara RMH Medical Center. $306,900 and up. And finally, before we get to the real estate data... Each month I offer a giveaway, of sorts, for readers of this market report, highlighting some of my favorite places, things or events in Harrisonburg. Recent highlights have included Jimmy Madison's, Red Wing Roots tickets and The Little Grill. Now, then, on to the data. You can likely skim this chart of data rather quickly to get a sense of what I'm going to say... 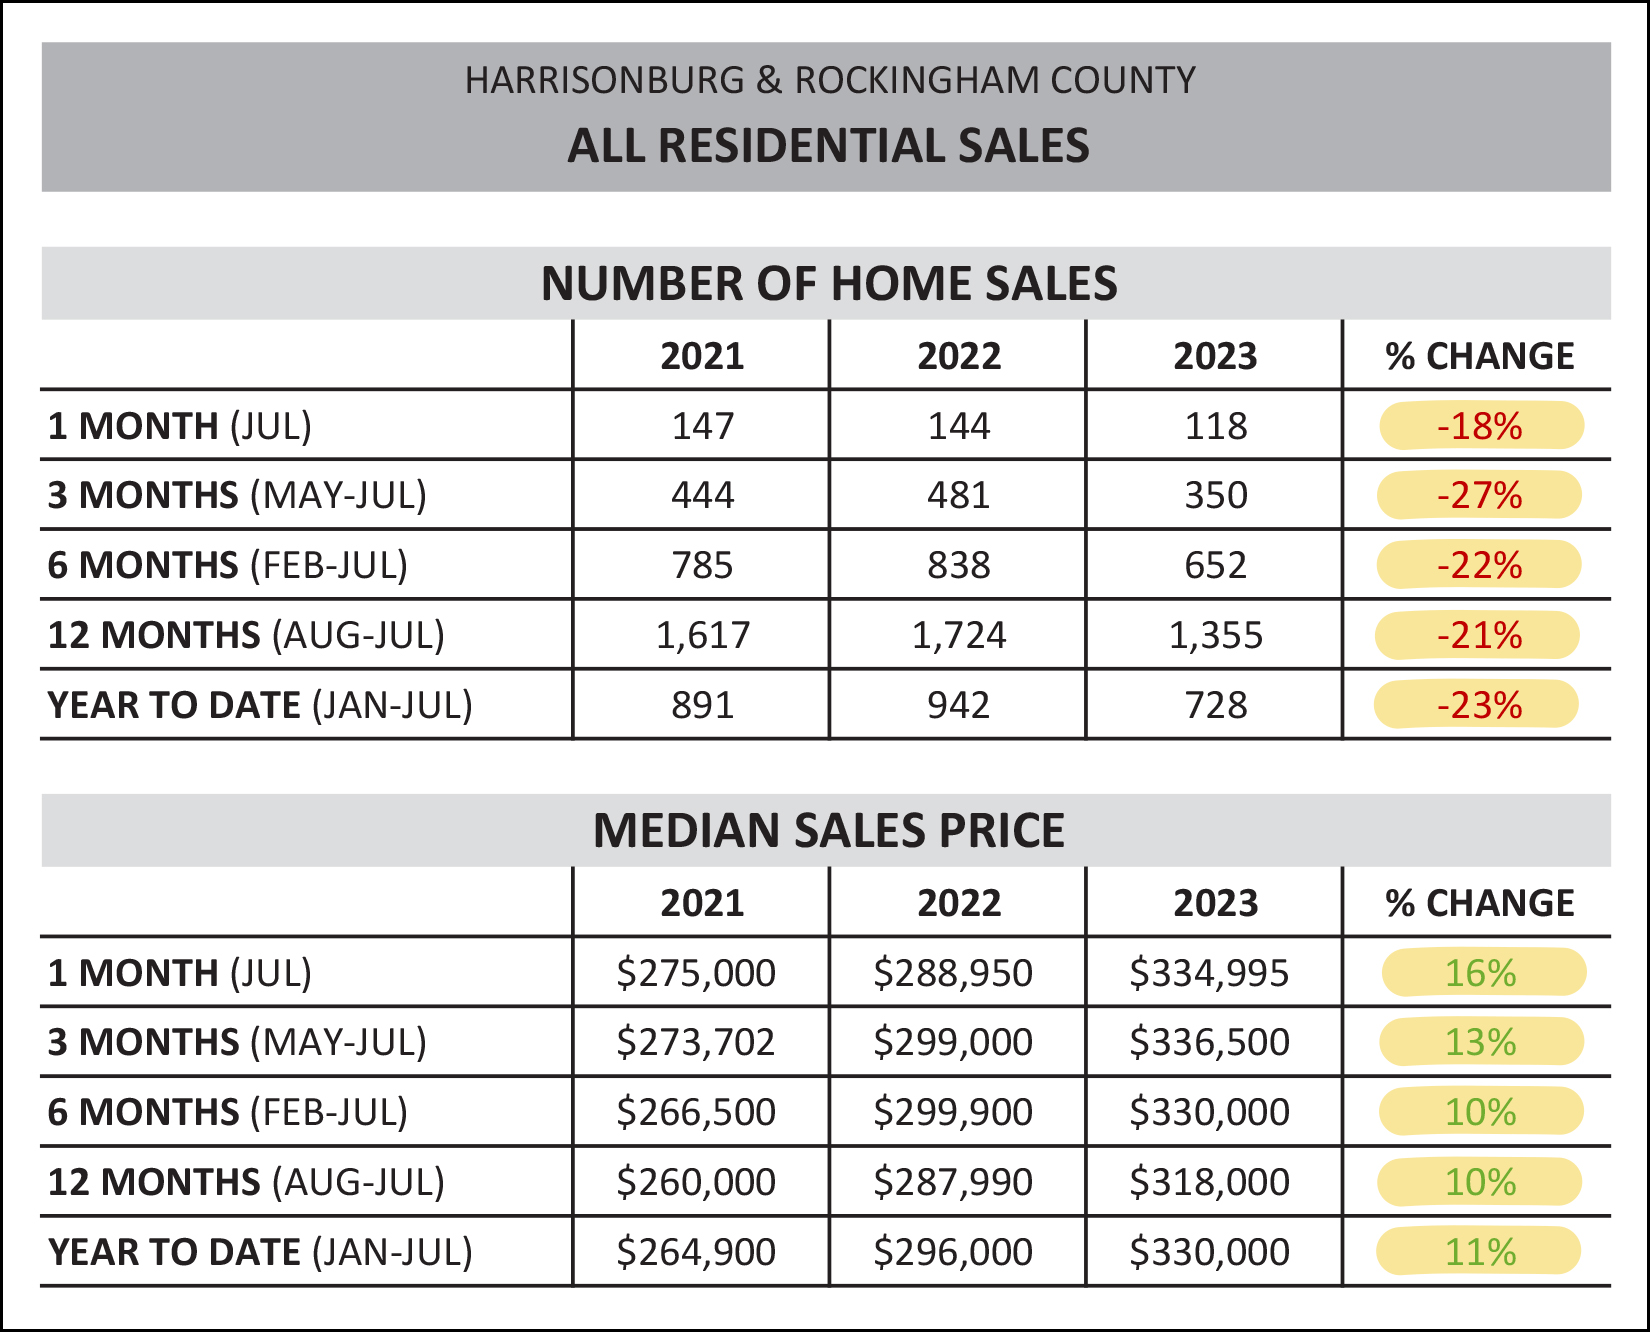 Regardless of the timeframe outlined above... [1] We are seeing fewer homes selling now than in the recent past in Harrisonburg and Rockingham County. Year to date (Jan-Jul) we have seen a 23% drop in the number of homes selling as compared to last year. [2] We are seeing higher and higher sales prices in Harrisonburg and Rockingham County. Year to date (Jan-Jul) we are seeing a median sales price that is 11% higher than a year ago. Here's a month-by-month visualization of those slower sales we're seeing this year... 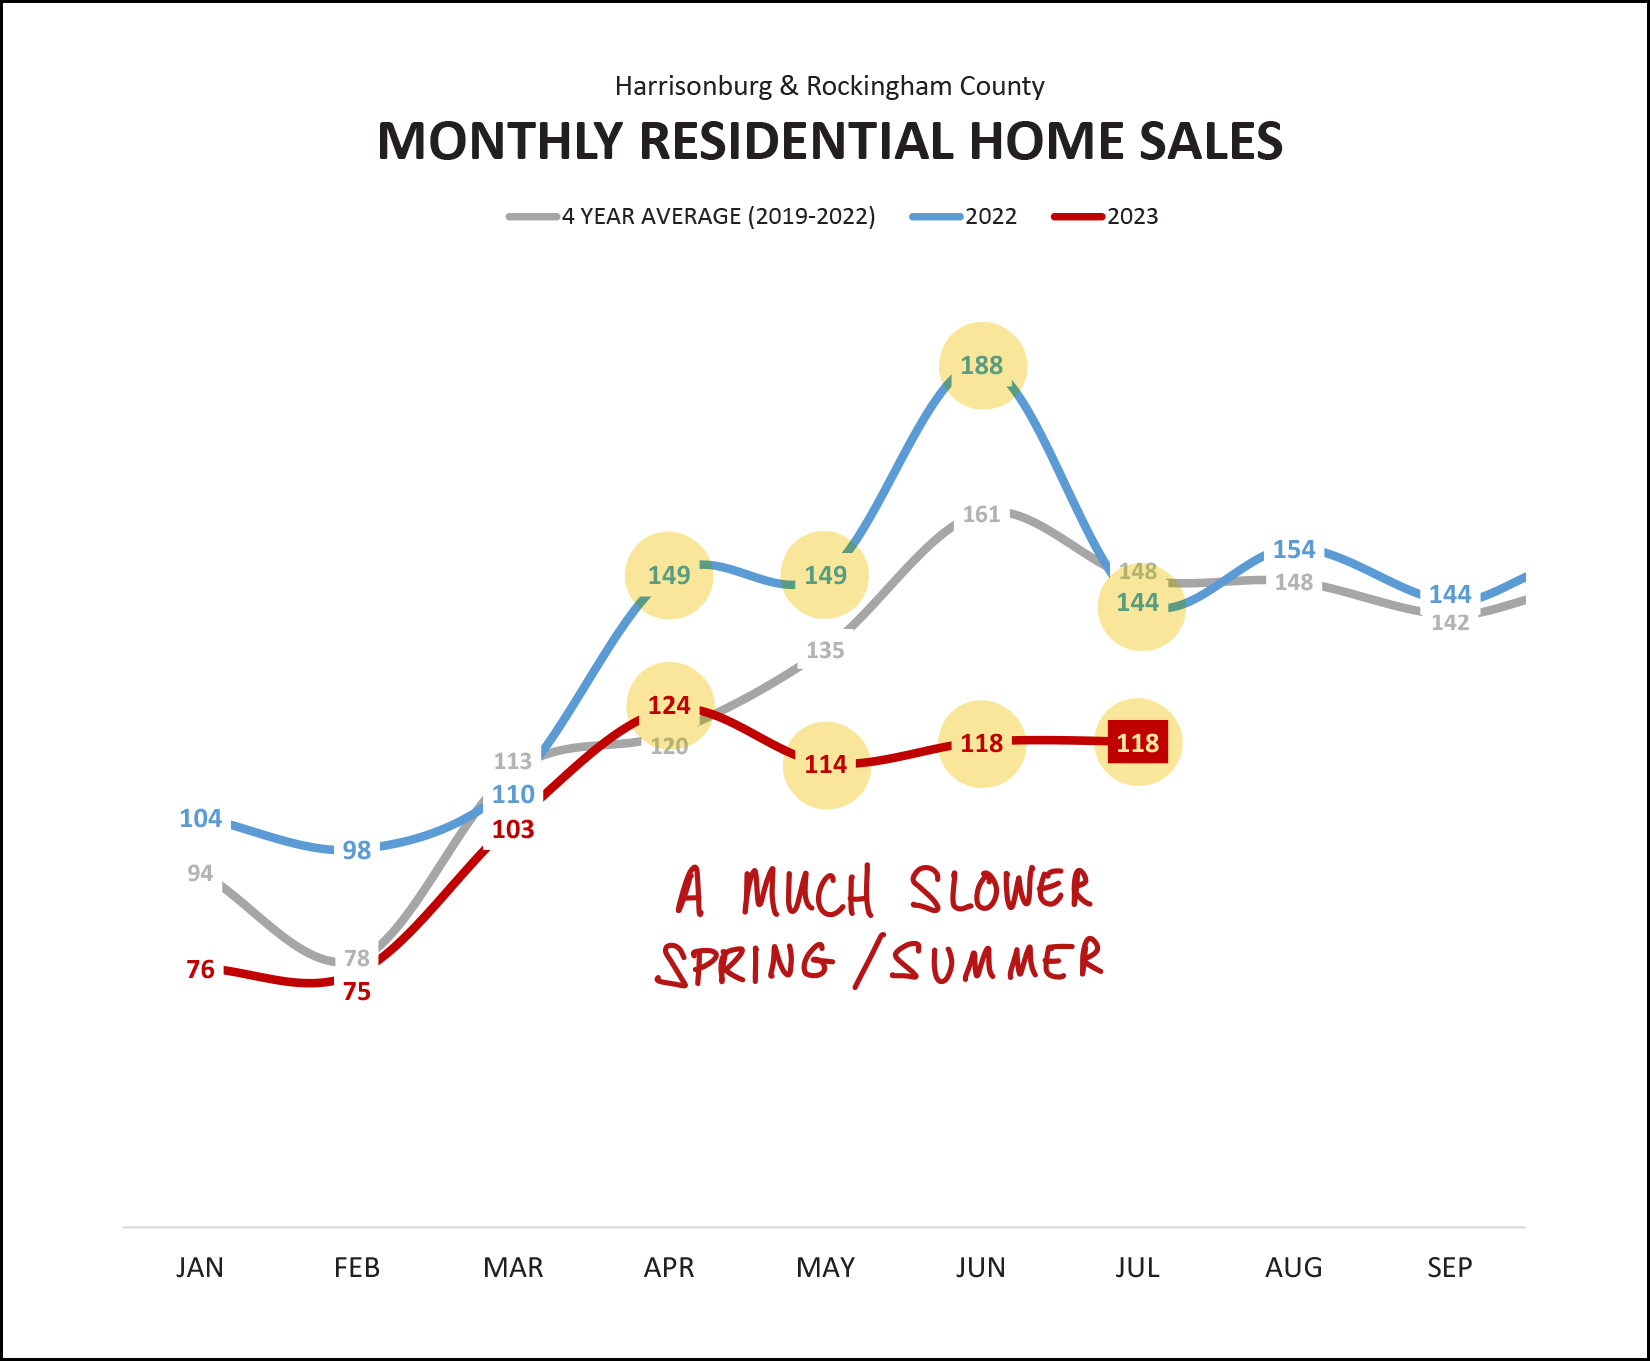 The grey line above shows the average number of home sales per month between 2019 and 2022. You'll note that a typical trend is to see more and more home sales (closings) as we move from April through June before starting to see things decline a bit in July. The blue line above shows last year, when April, May and June were well above where we might have expected them to be. Then, there's this year... the red line. We just haven't seen the typical boost in home sales during April, May and June that we would usually expect to see. In fact, July was the third month in a row of between 110 and 120 home sales. So, this year is not a typical year. We are experiencing a much lower spring and summer in the local real estate market. Why, you might ask? Likely because of mortgage interest rates -- which are quite a bit higher than over the past few years -- and because there aren't as many homeowners selling their homes. Stacking all of those months on top of each other, you can see how this year compares to previous years, thus far... 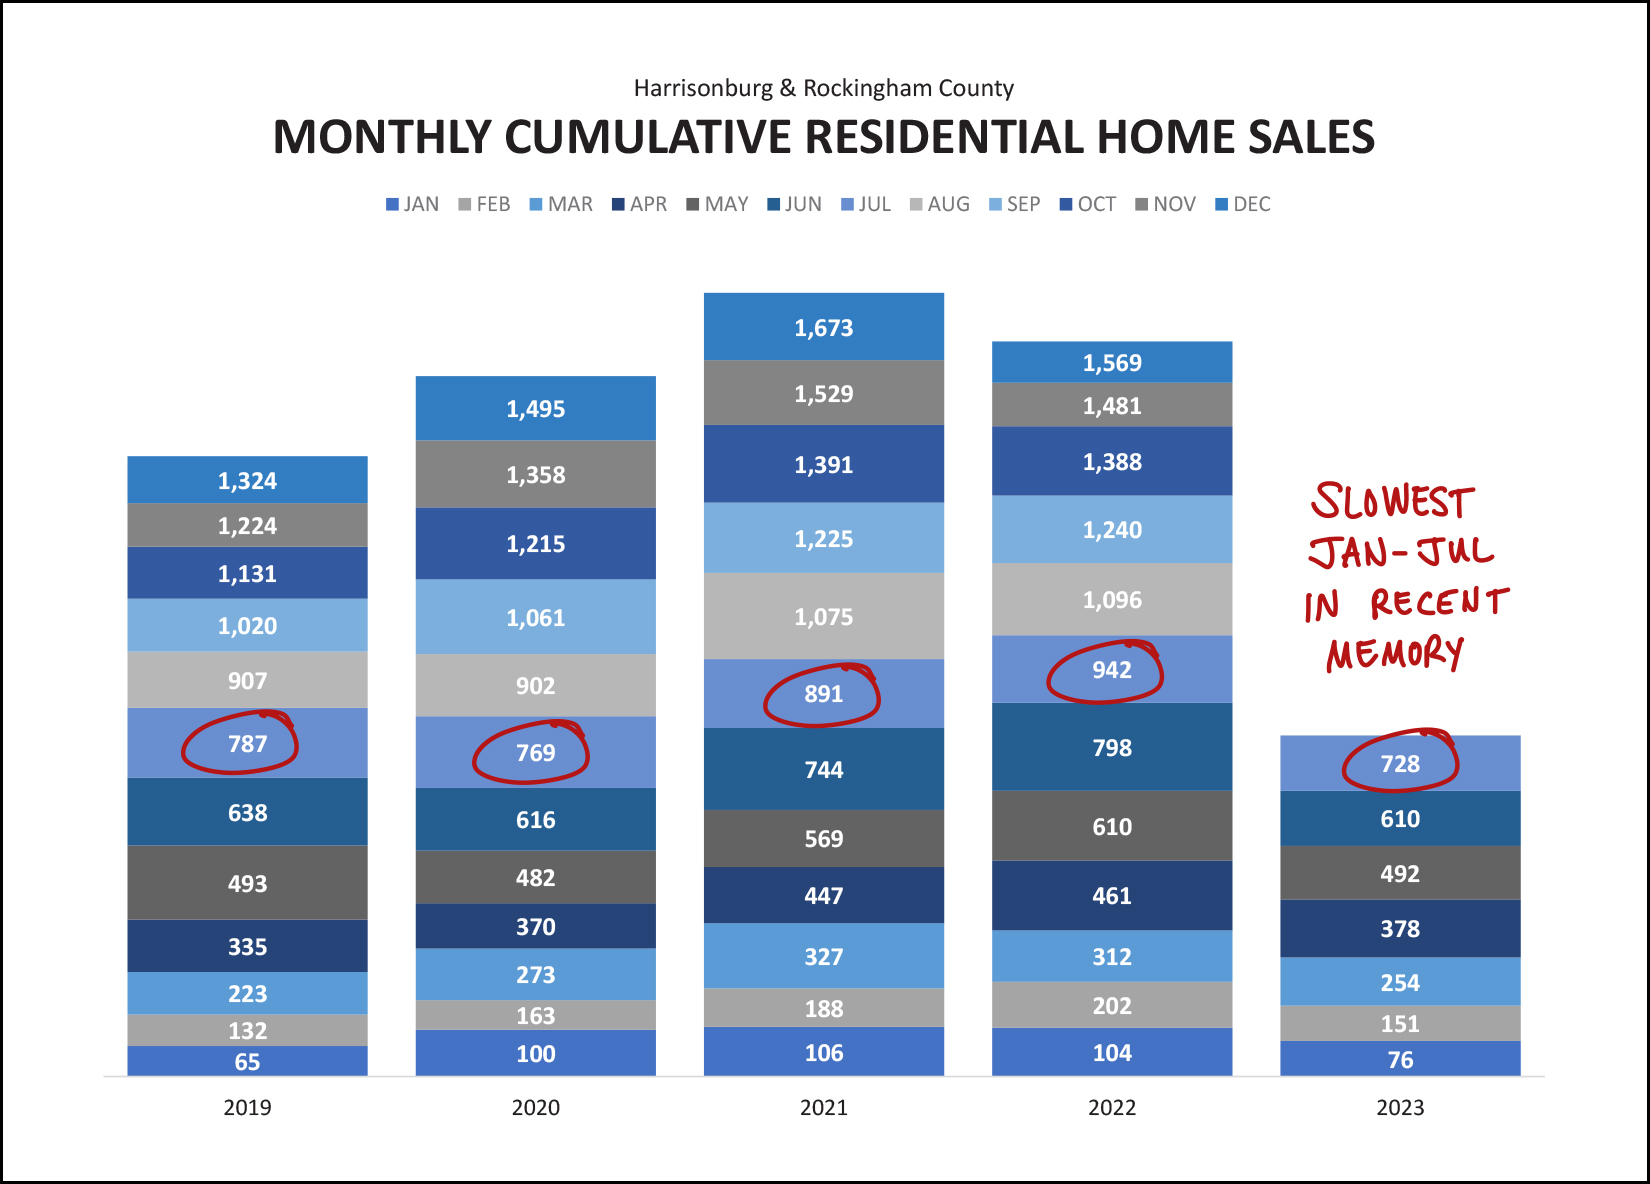 Clearly, this year seems unlikely to come anywhere near the level of sales seen over the past few years (2021 and 2022) and we're likely to finish out the year with fewer home sales than in 2019 and 2020 as well. Here's an illustration of that puzzling increase in sales prices and decline in the number of homes selling... 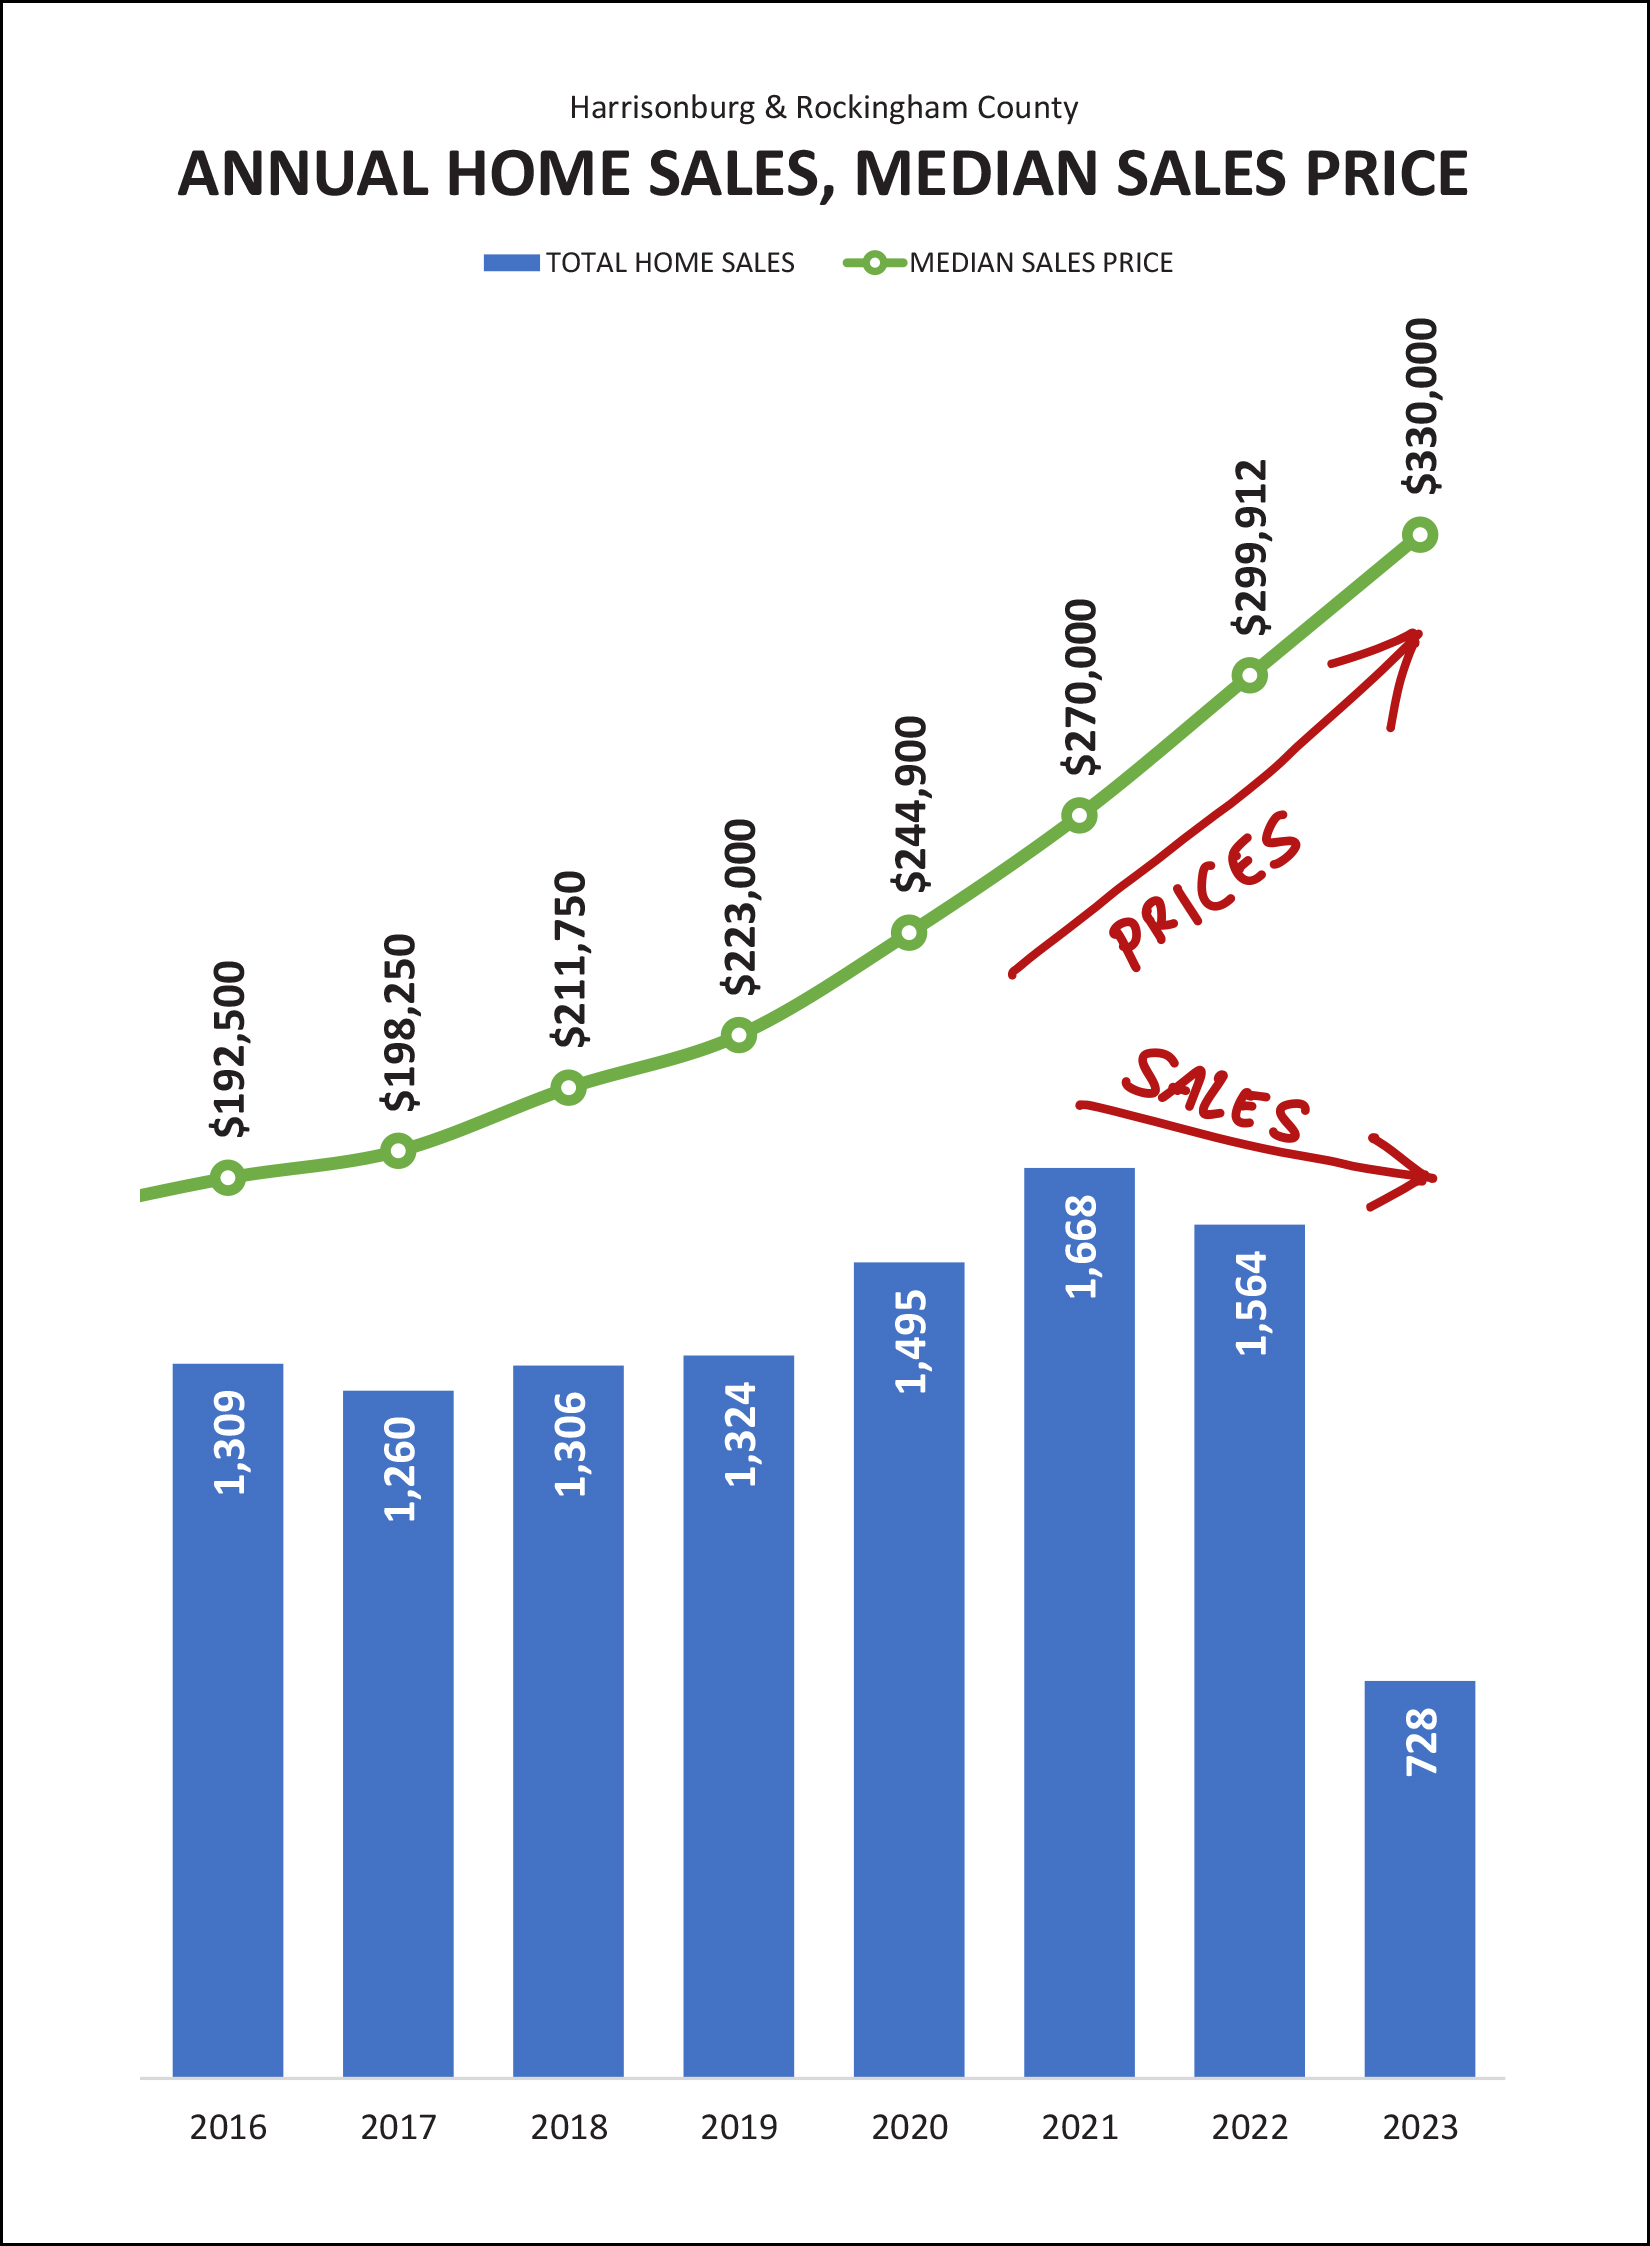 This is, as some of you would undoubtedly point out, both puzzling... and not. Typically, if demand decreases, sales decrease, and prices decrease. But despite fewer home sales (as shown above) we are not seeing prices decline. Which means... we are not seeing a net overall decrease in demand... but rather... a decrease in supply. So long as home prices keep climbing, I think the decrease in the number of home sales can be almost entirely attributed to fewer sellers selling. Given fewer homeowners being willing to sell, we're likely going to need new construction homes to fill in the gap to help meet buyer demand... 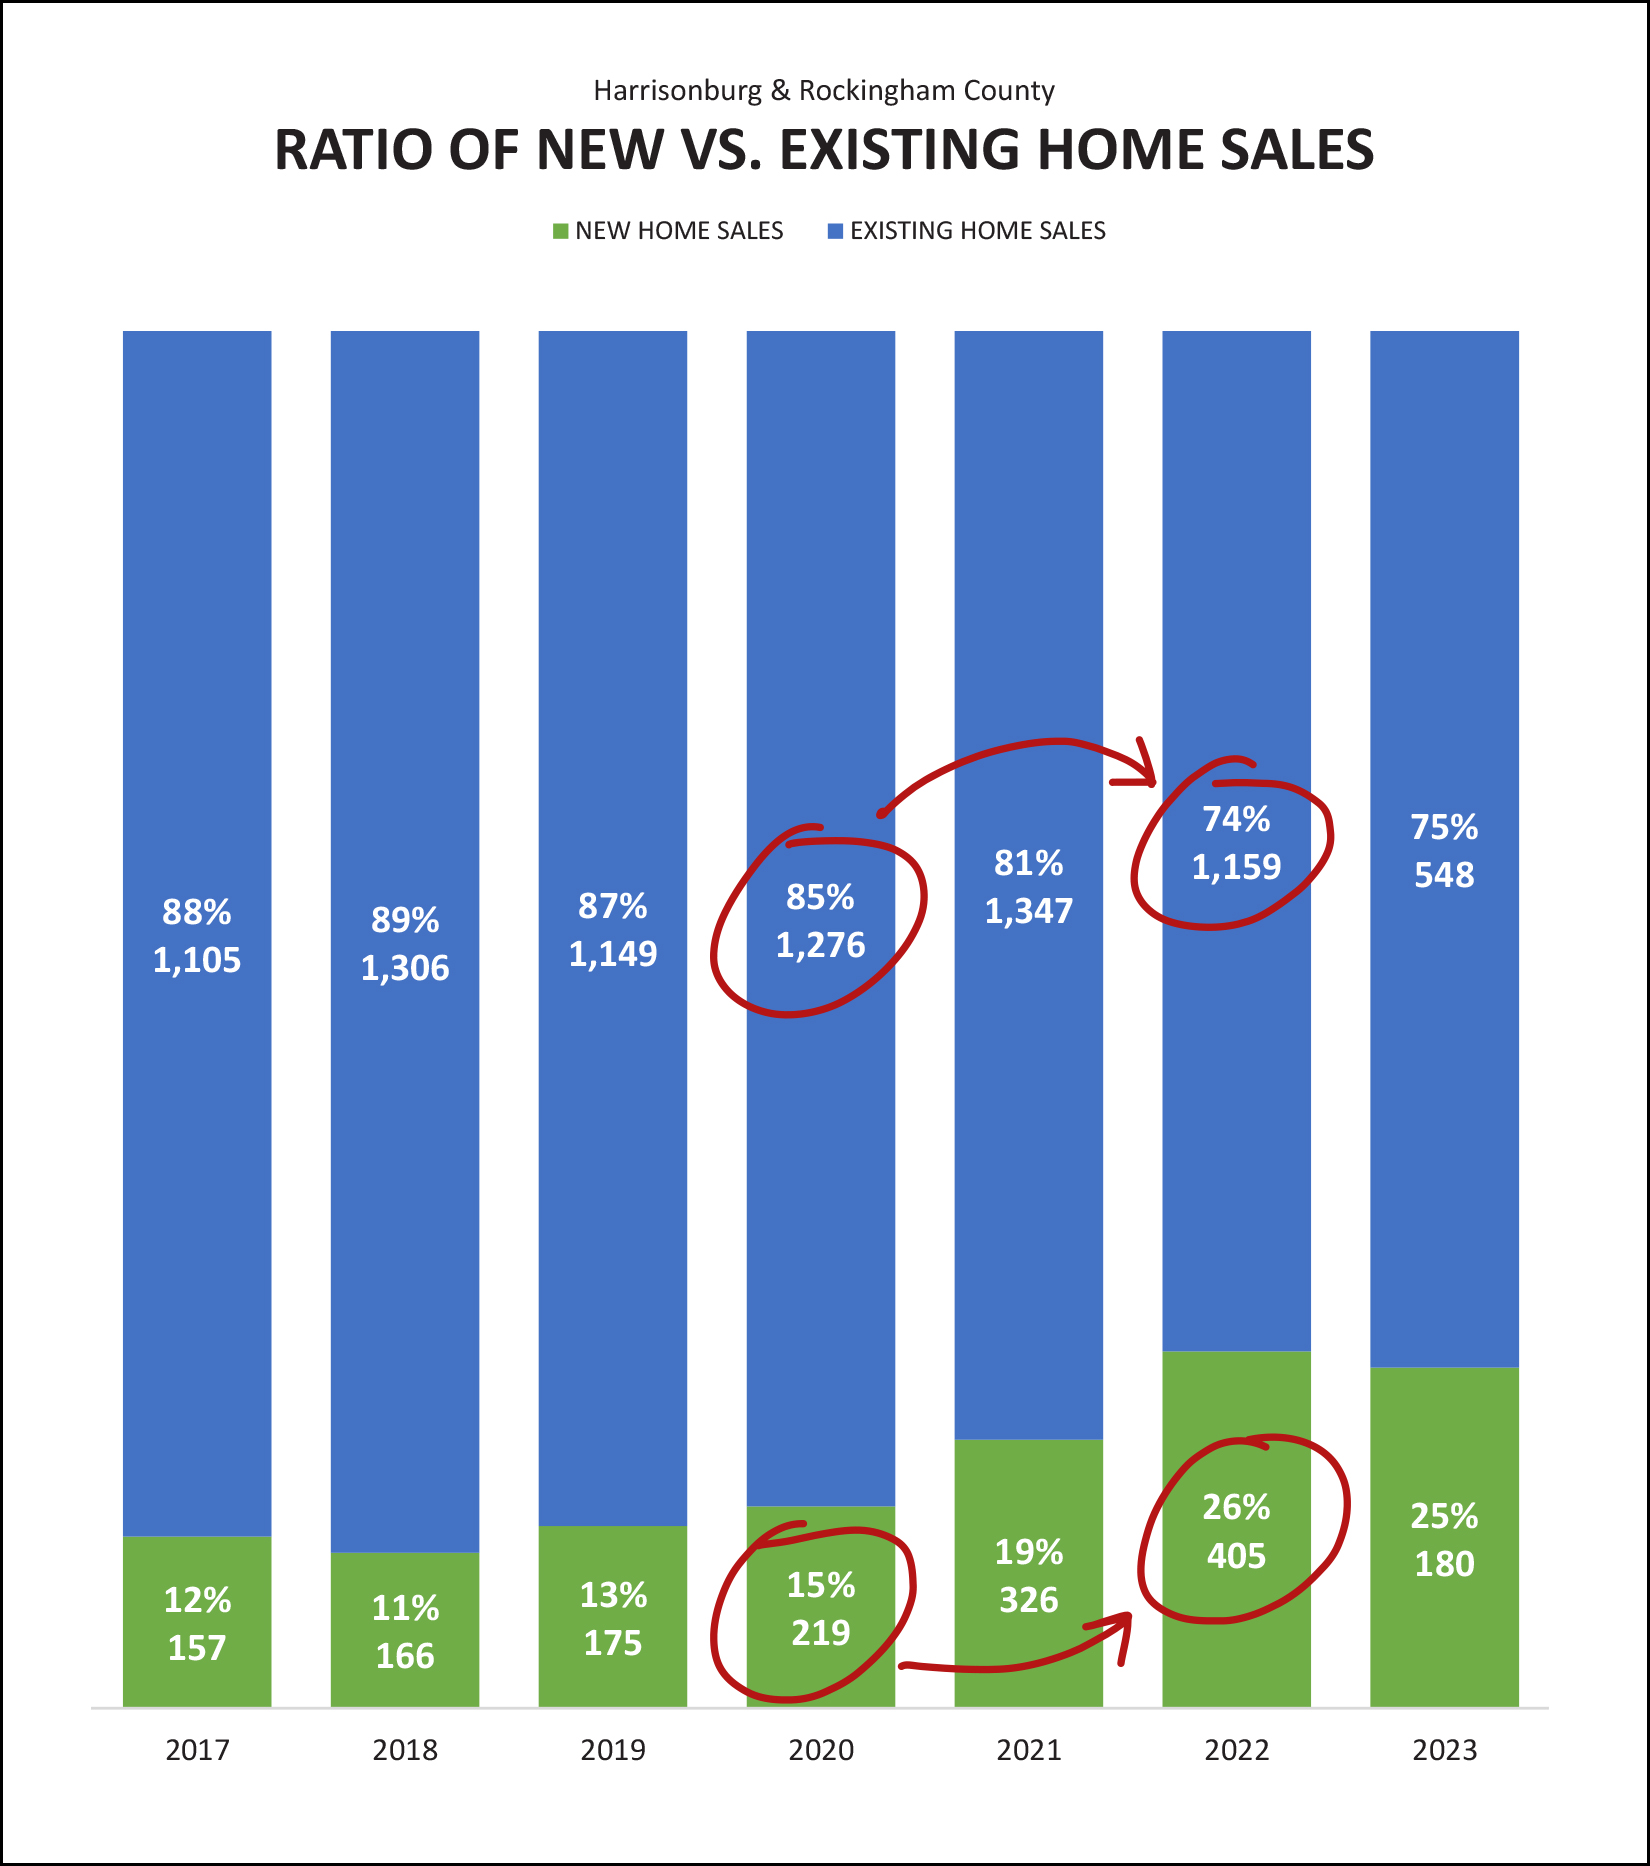 Overall, over the past few years, we have seen new home sales (green bars above) increasing. After only 219 new home sales in 2020, that climbed to 405 in 2022... leading to one in four (26%) homes selling being new homes. We are still seeing similar (75% / 25%) numbers this year. During that same timeframe (2020-2022) we saw a decline in existing home sales... from 1,276 existing home sales in 2020 down to 1,159 existing home sales in 2022. I expect we will see even fewer existing home sales in 2023 based on data from the first seven months of this year. Now, here comes a surprise this month... 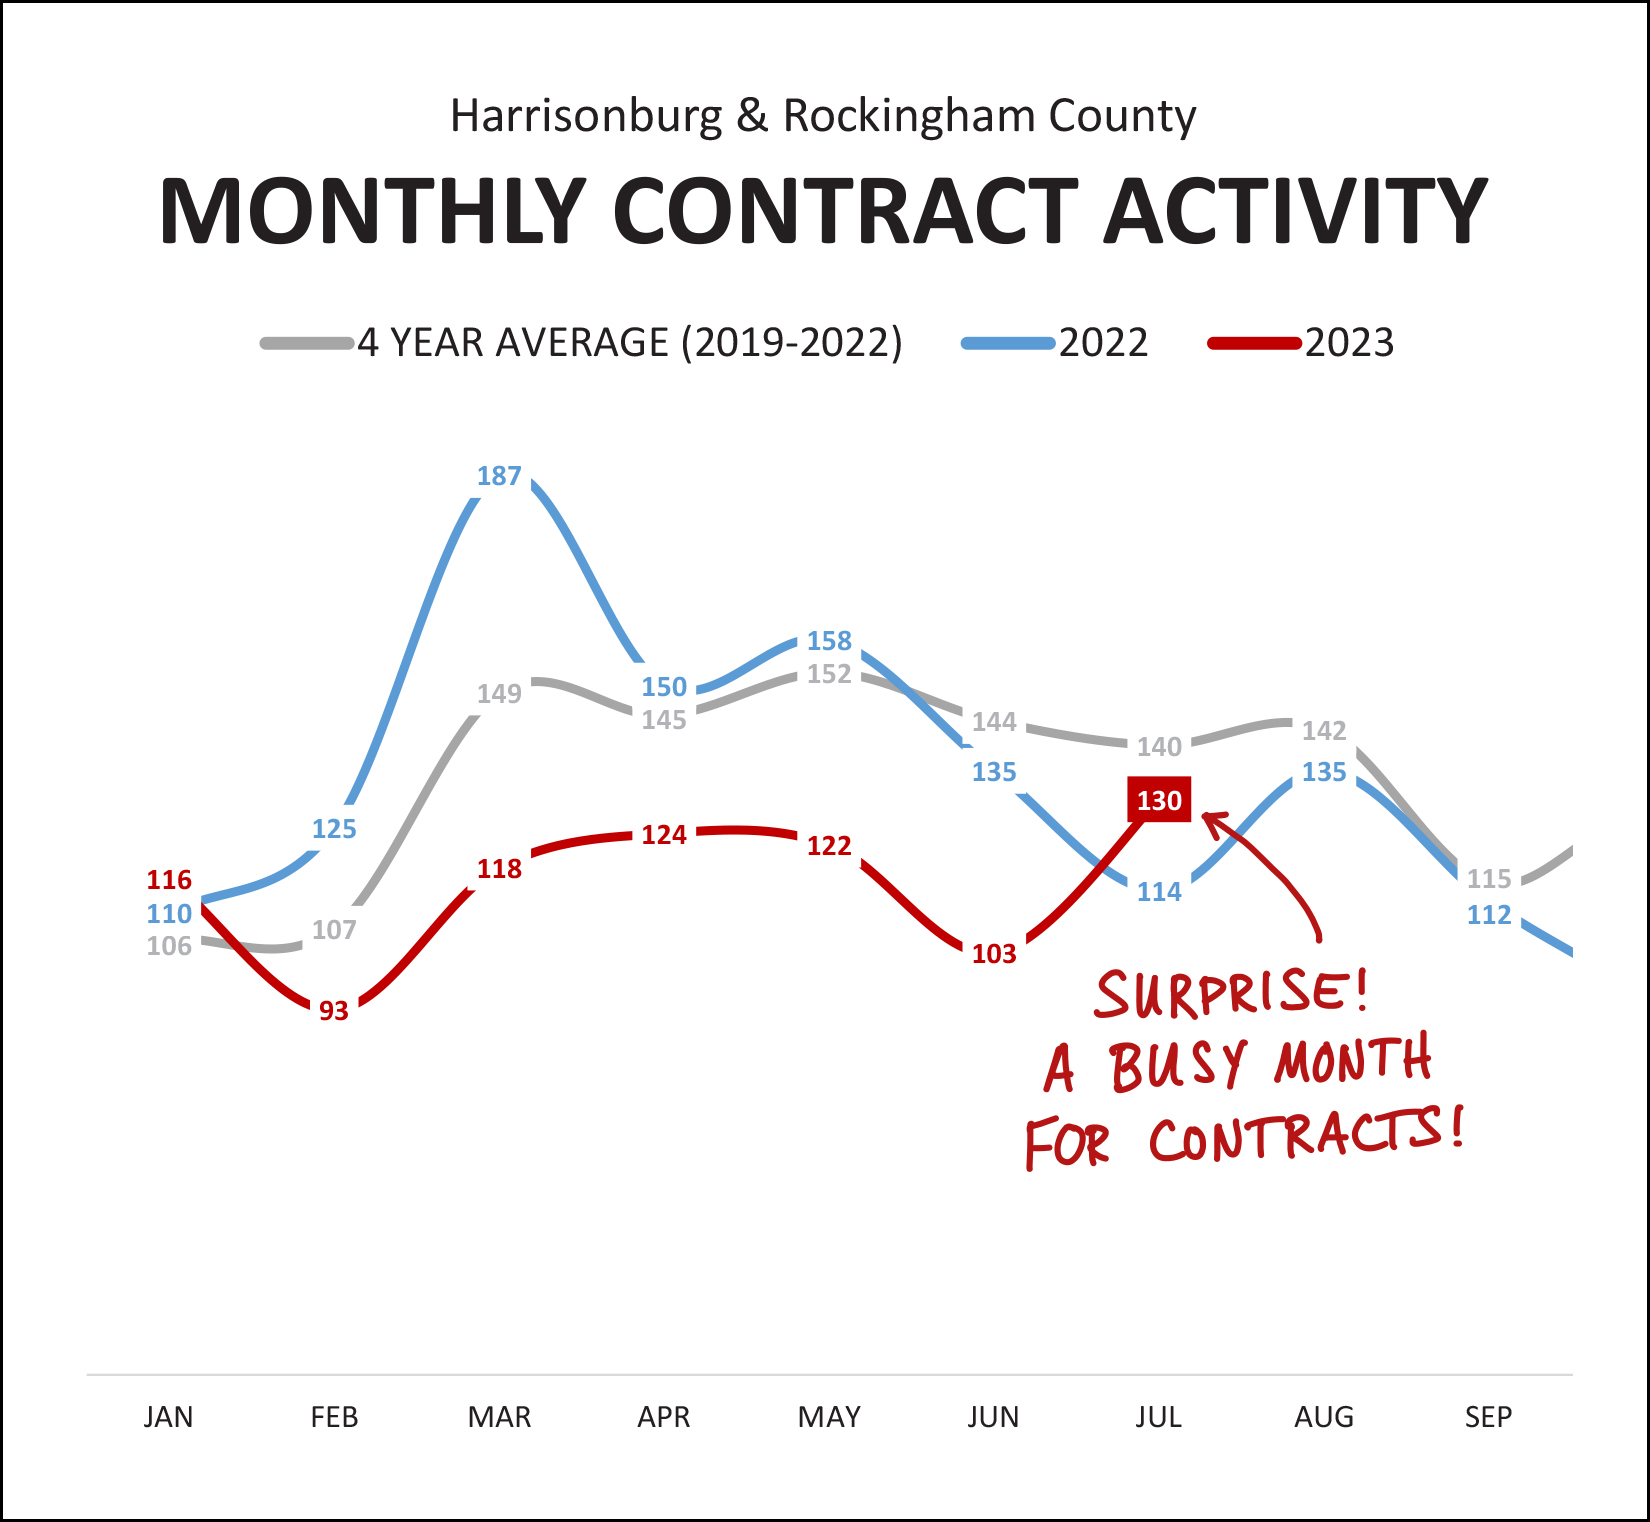 Last year we saw a month after month decline in contract activity as we moved from May through July. This year we started to follow that same trend as we saw fewer home sales in June that in May. But, then, July. Contract activity was quite a bit higher than I expected it would be in July 2023. In fact, this was the month with the largest number of contracts signed thus far in 2023. And yet, two other indicators keep me scratching by head a bit... 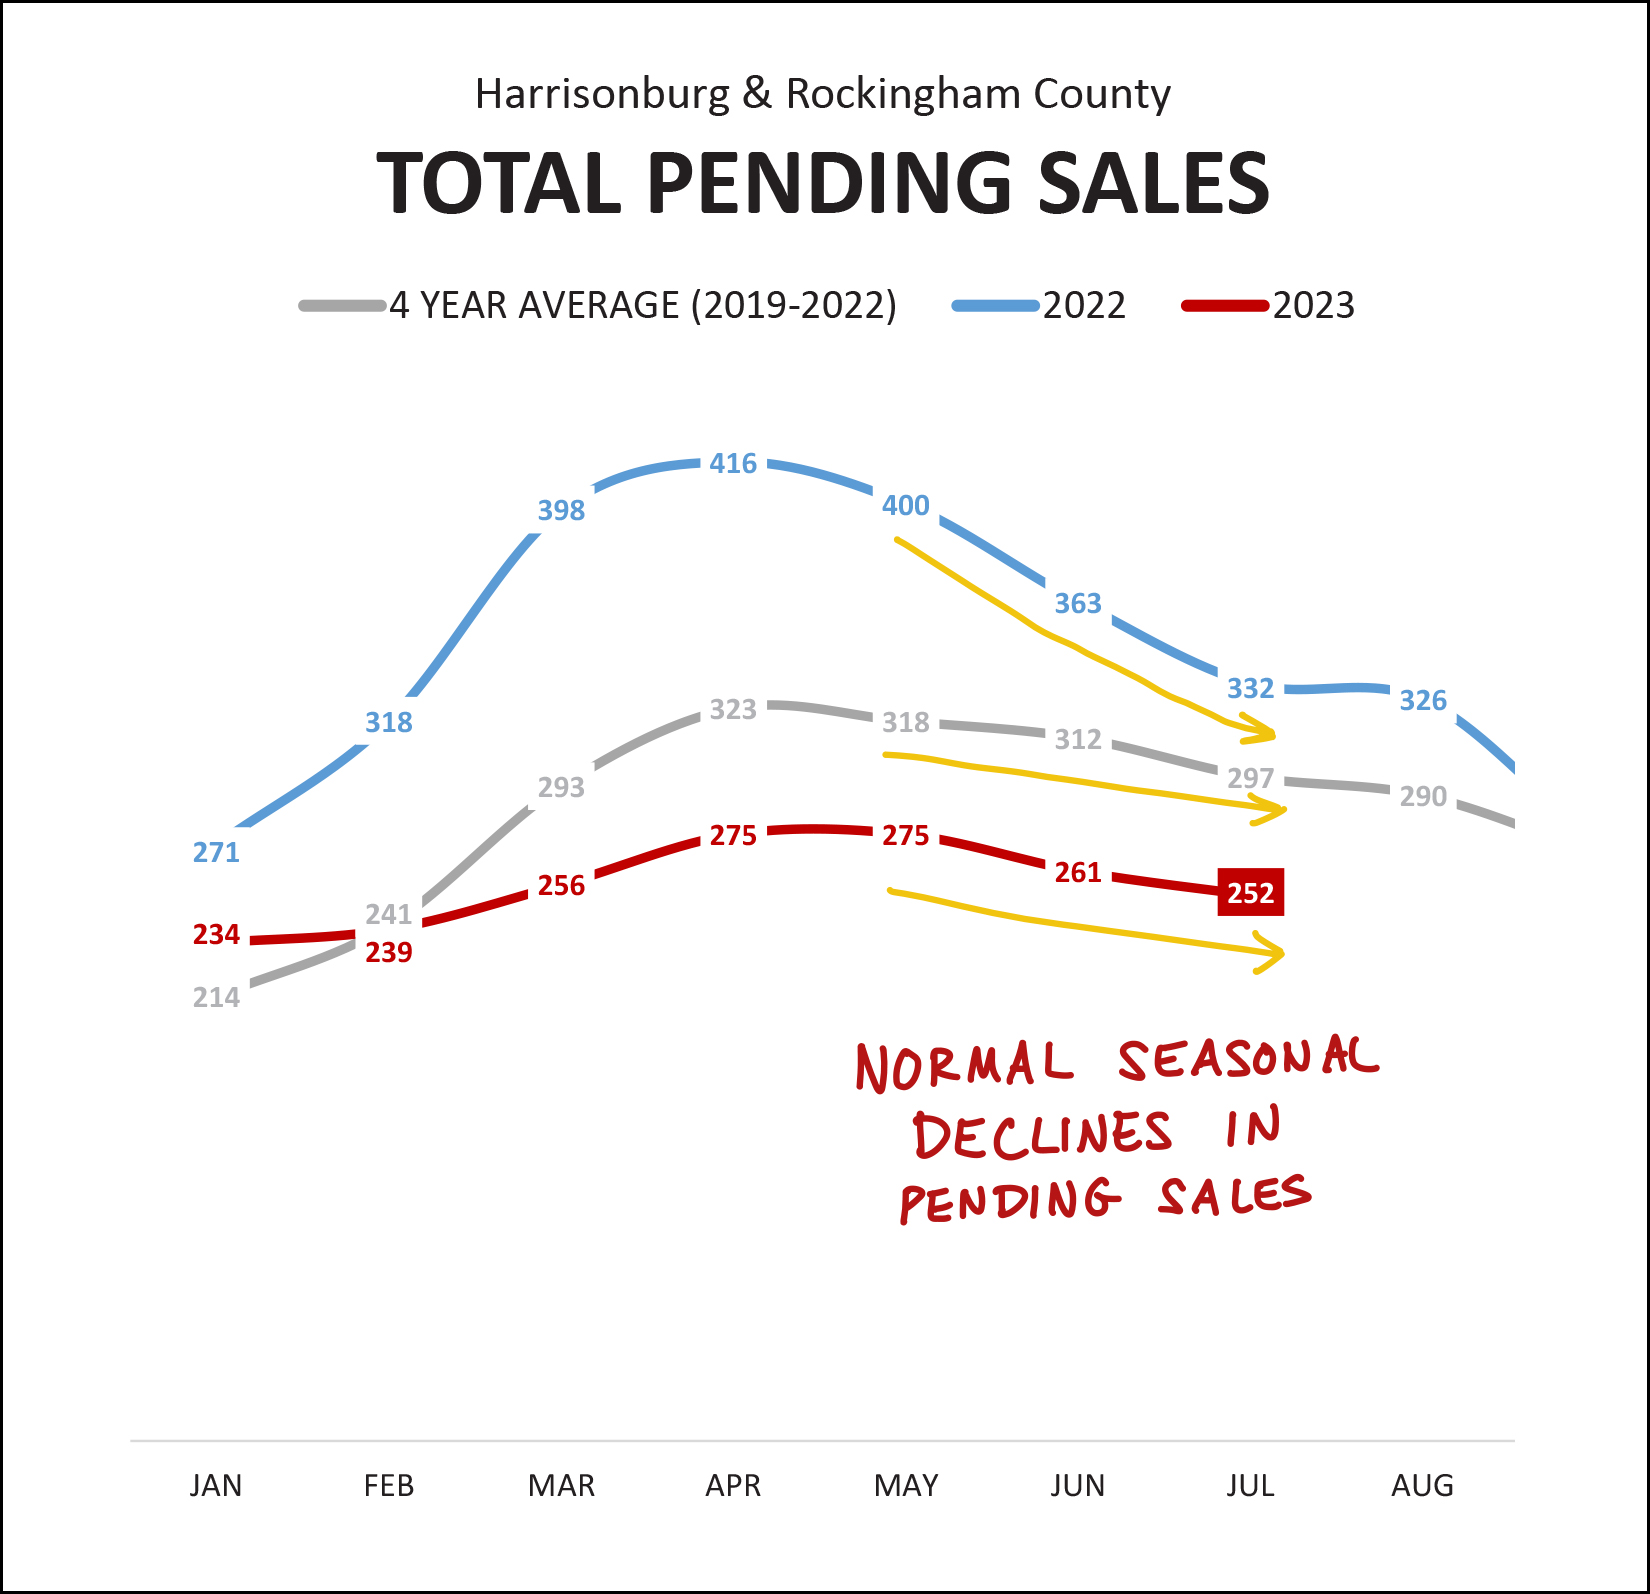 Despite that uptick in contracts being signed in July 2023... the number of pending (under contract) homes followed its normal seasonal trend of declining slightly between May and July. There are (as shown above) 252 homes under contract in Harrisonburg and Rockingham County right now... which is lower than a month ago (261) and lower than a year ago (297). Furthermore... 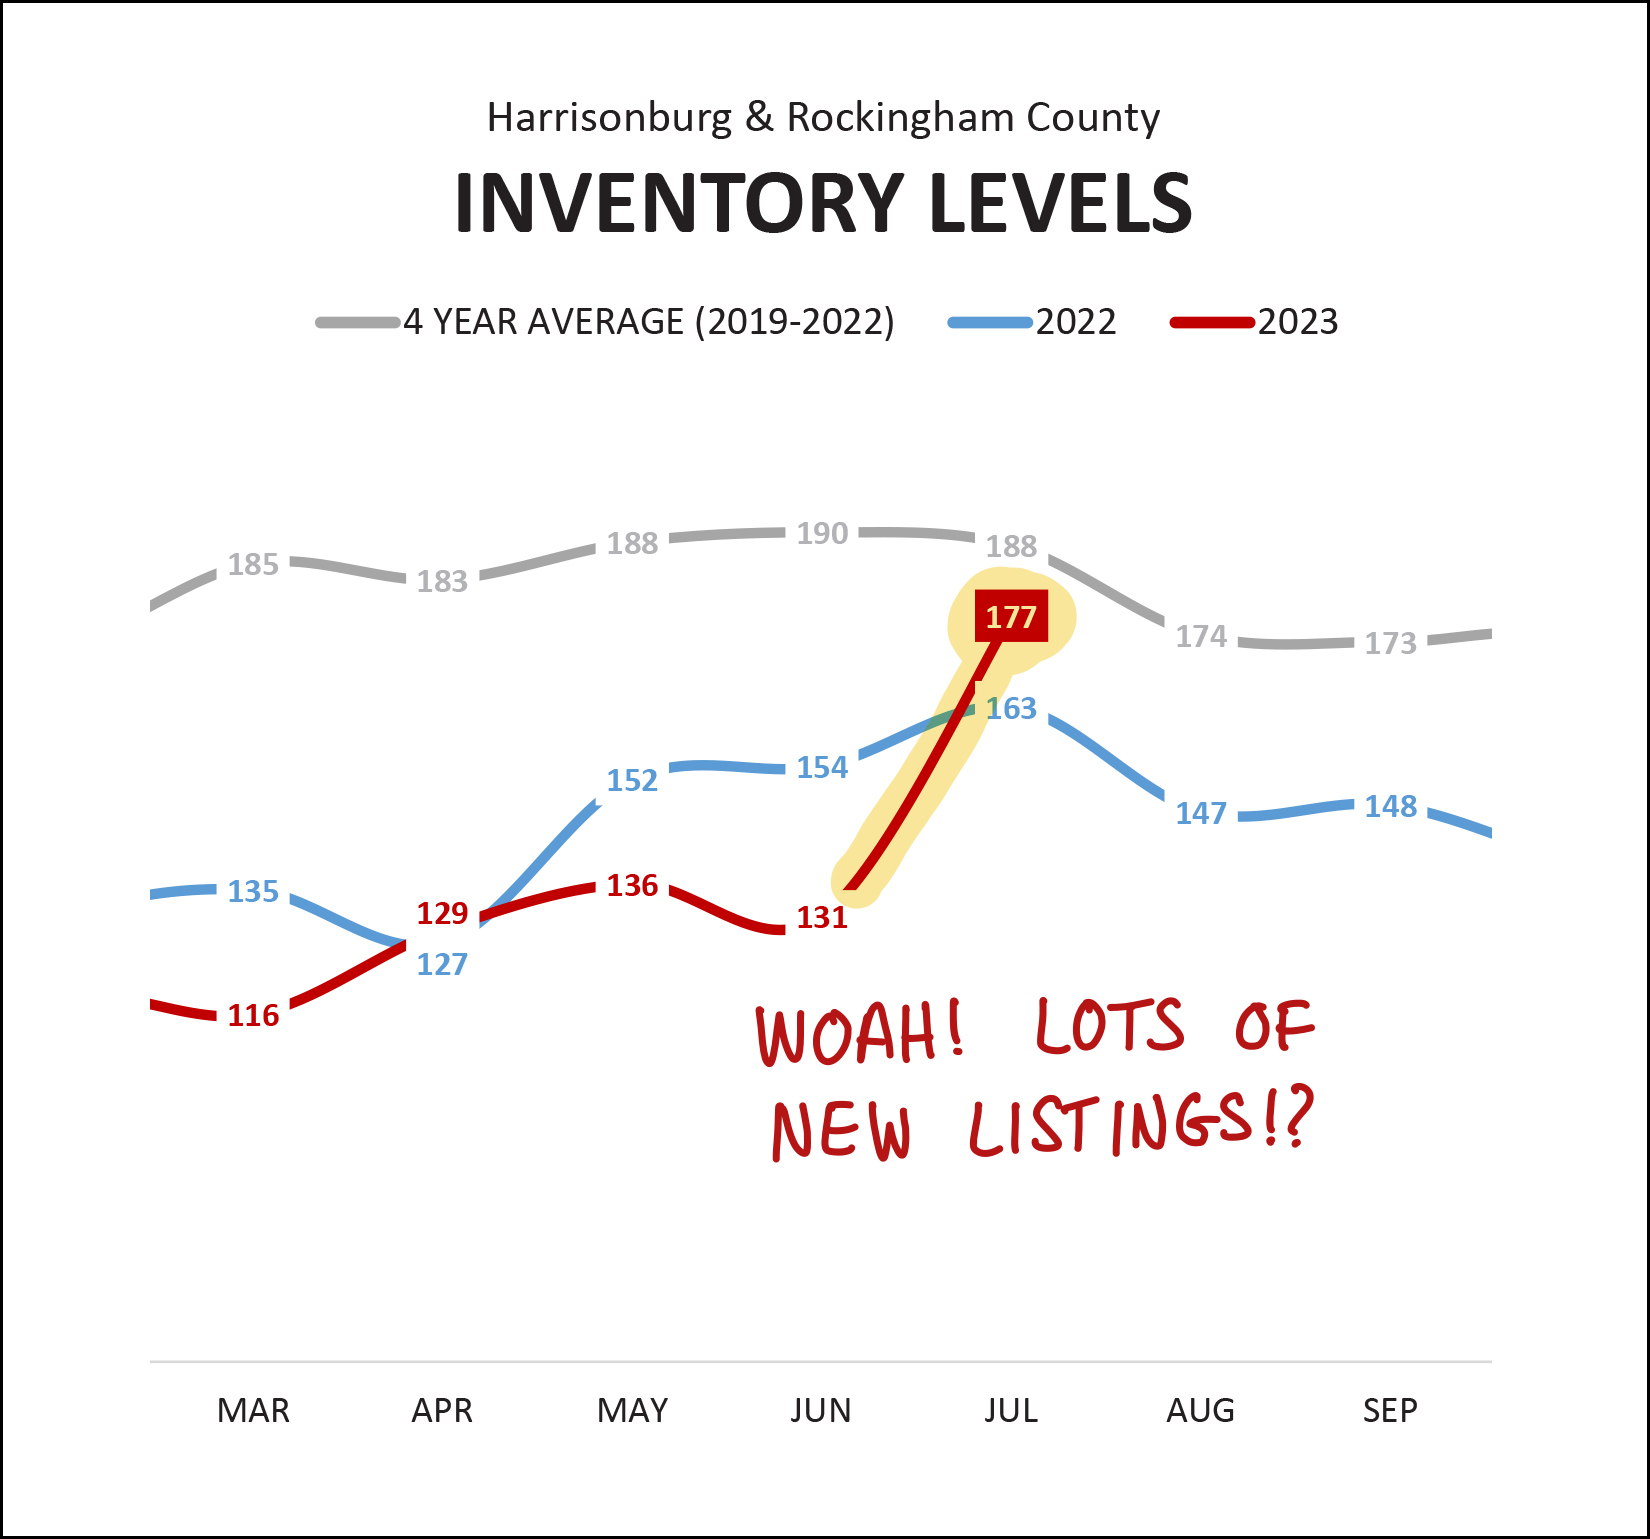 Despite lots of homes going under contract in July... inventory levels jumped up quite a bit (131 to 177) in a single month's time. This brings current inventory levels to the highest point that we have seen anytime in the past year. I'll take a closer look at some of these overall trends in the coming days to try to dial in whether there is another story to be told and understood. For now, it's clear that there are quite a few more listings on the market now than anytime of late. Moving through the next few months, it will be interesting to watch... [1] Will inventory levels bounce back downward after buyers have a chance to contract on some of these new listings? [2] Will we see more price reductions on listings as sellers have slightly more competition from other sellers in some price ranges and with some property types? [3] Will we see homes staying on the market longer than they have in the past? I don't know that we need to instantly jump to any conclusions about this increase in inventory levels, but the data over the next few months will help color in the picture of whether we are seeing any sort of a transition in our local housing market. Speaking of median days on the market... is it starting to rise? 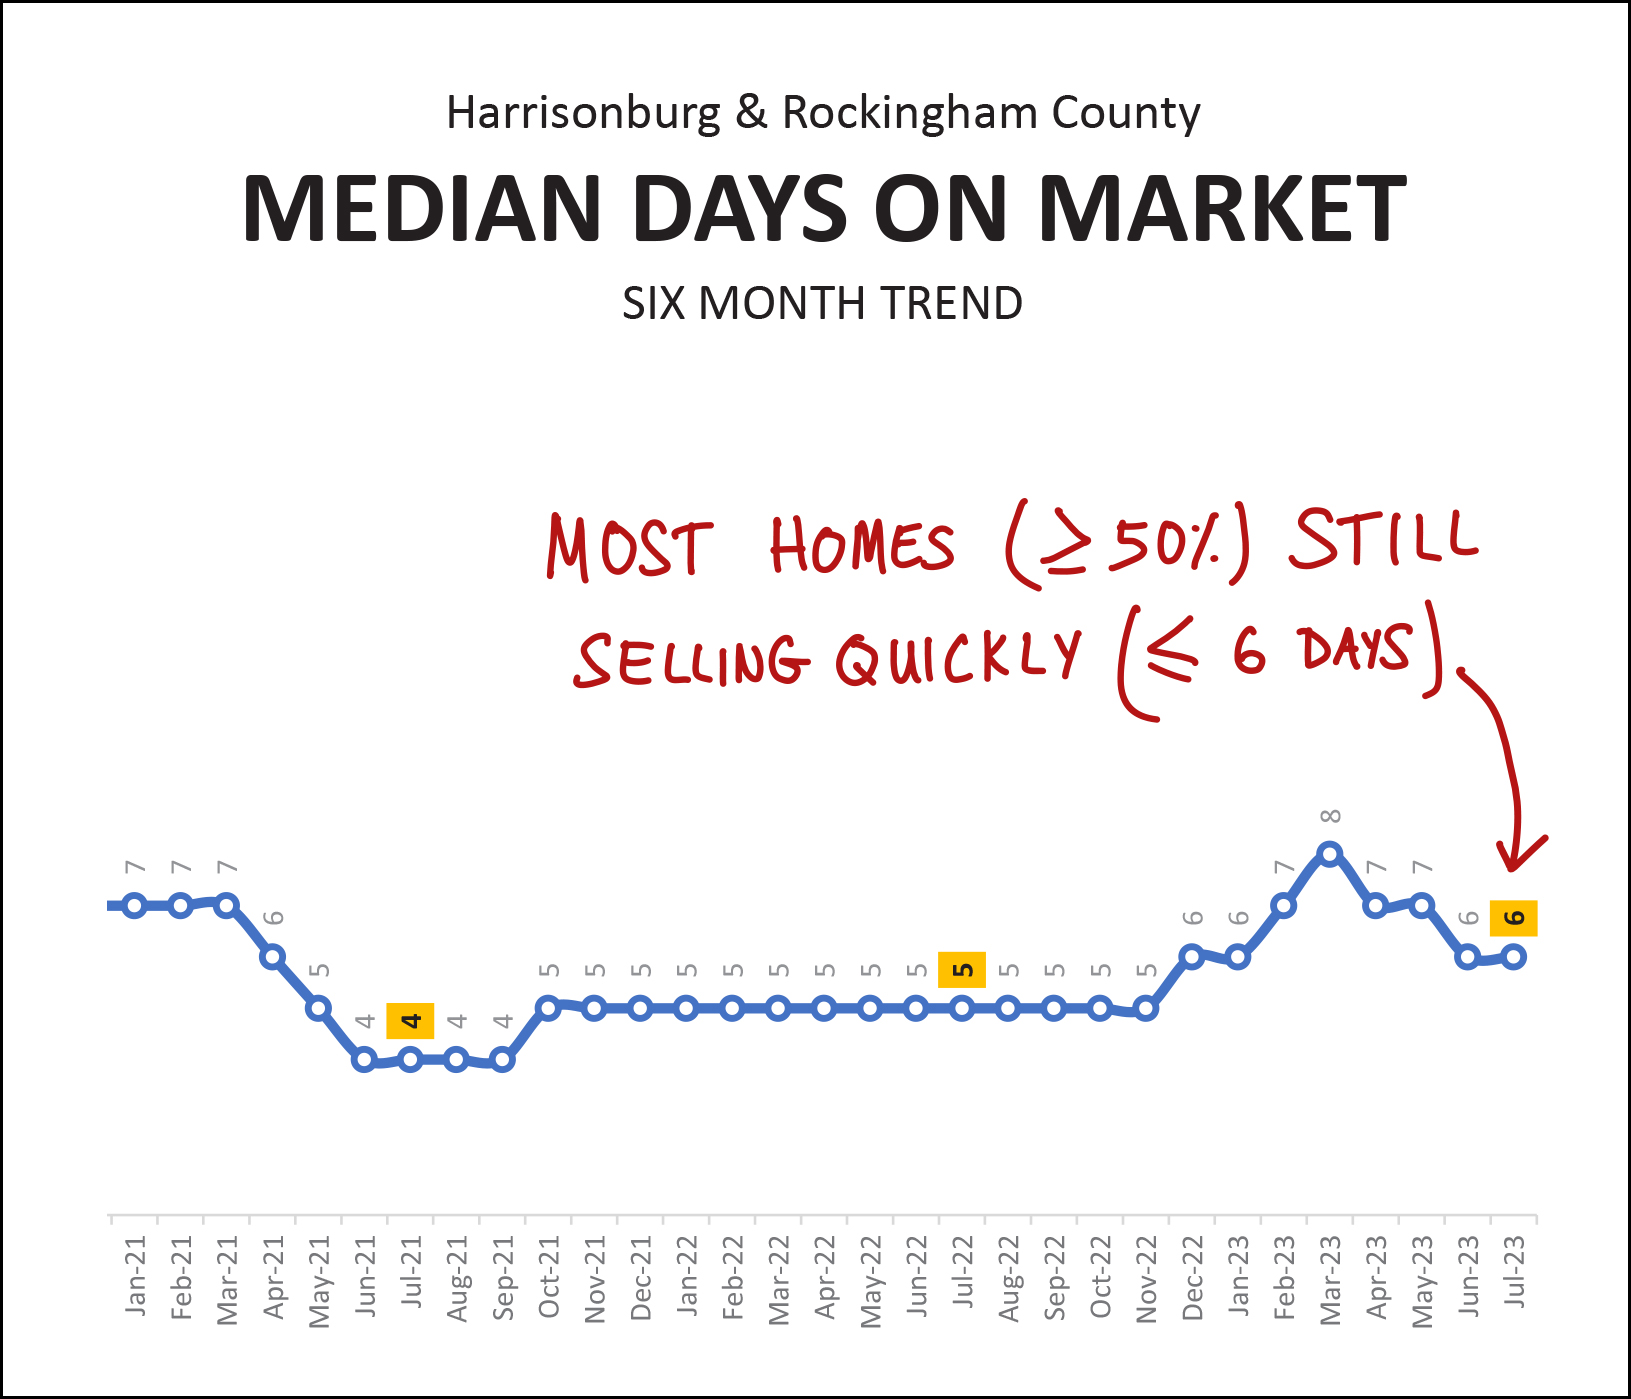 Mmmm... nope. Most homes (at least half of them) are still going under contract very quickly (in six days or less) in Harrisonburg and Rockingham County. This metric will continue to be helpful to gauge whether buyer enthusiasm is slowing at all in the local market. What could slow buyer enthusiasm, you ask? How about those mortgage interest rates!? 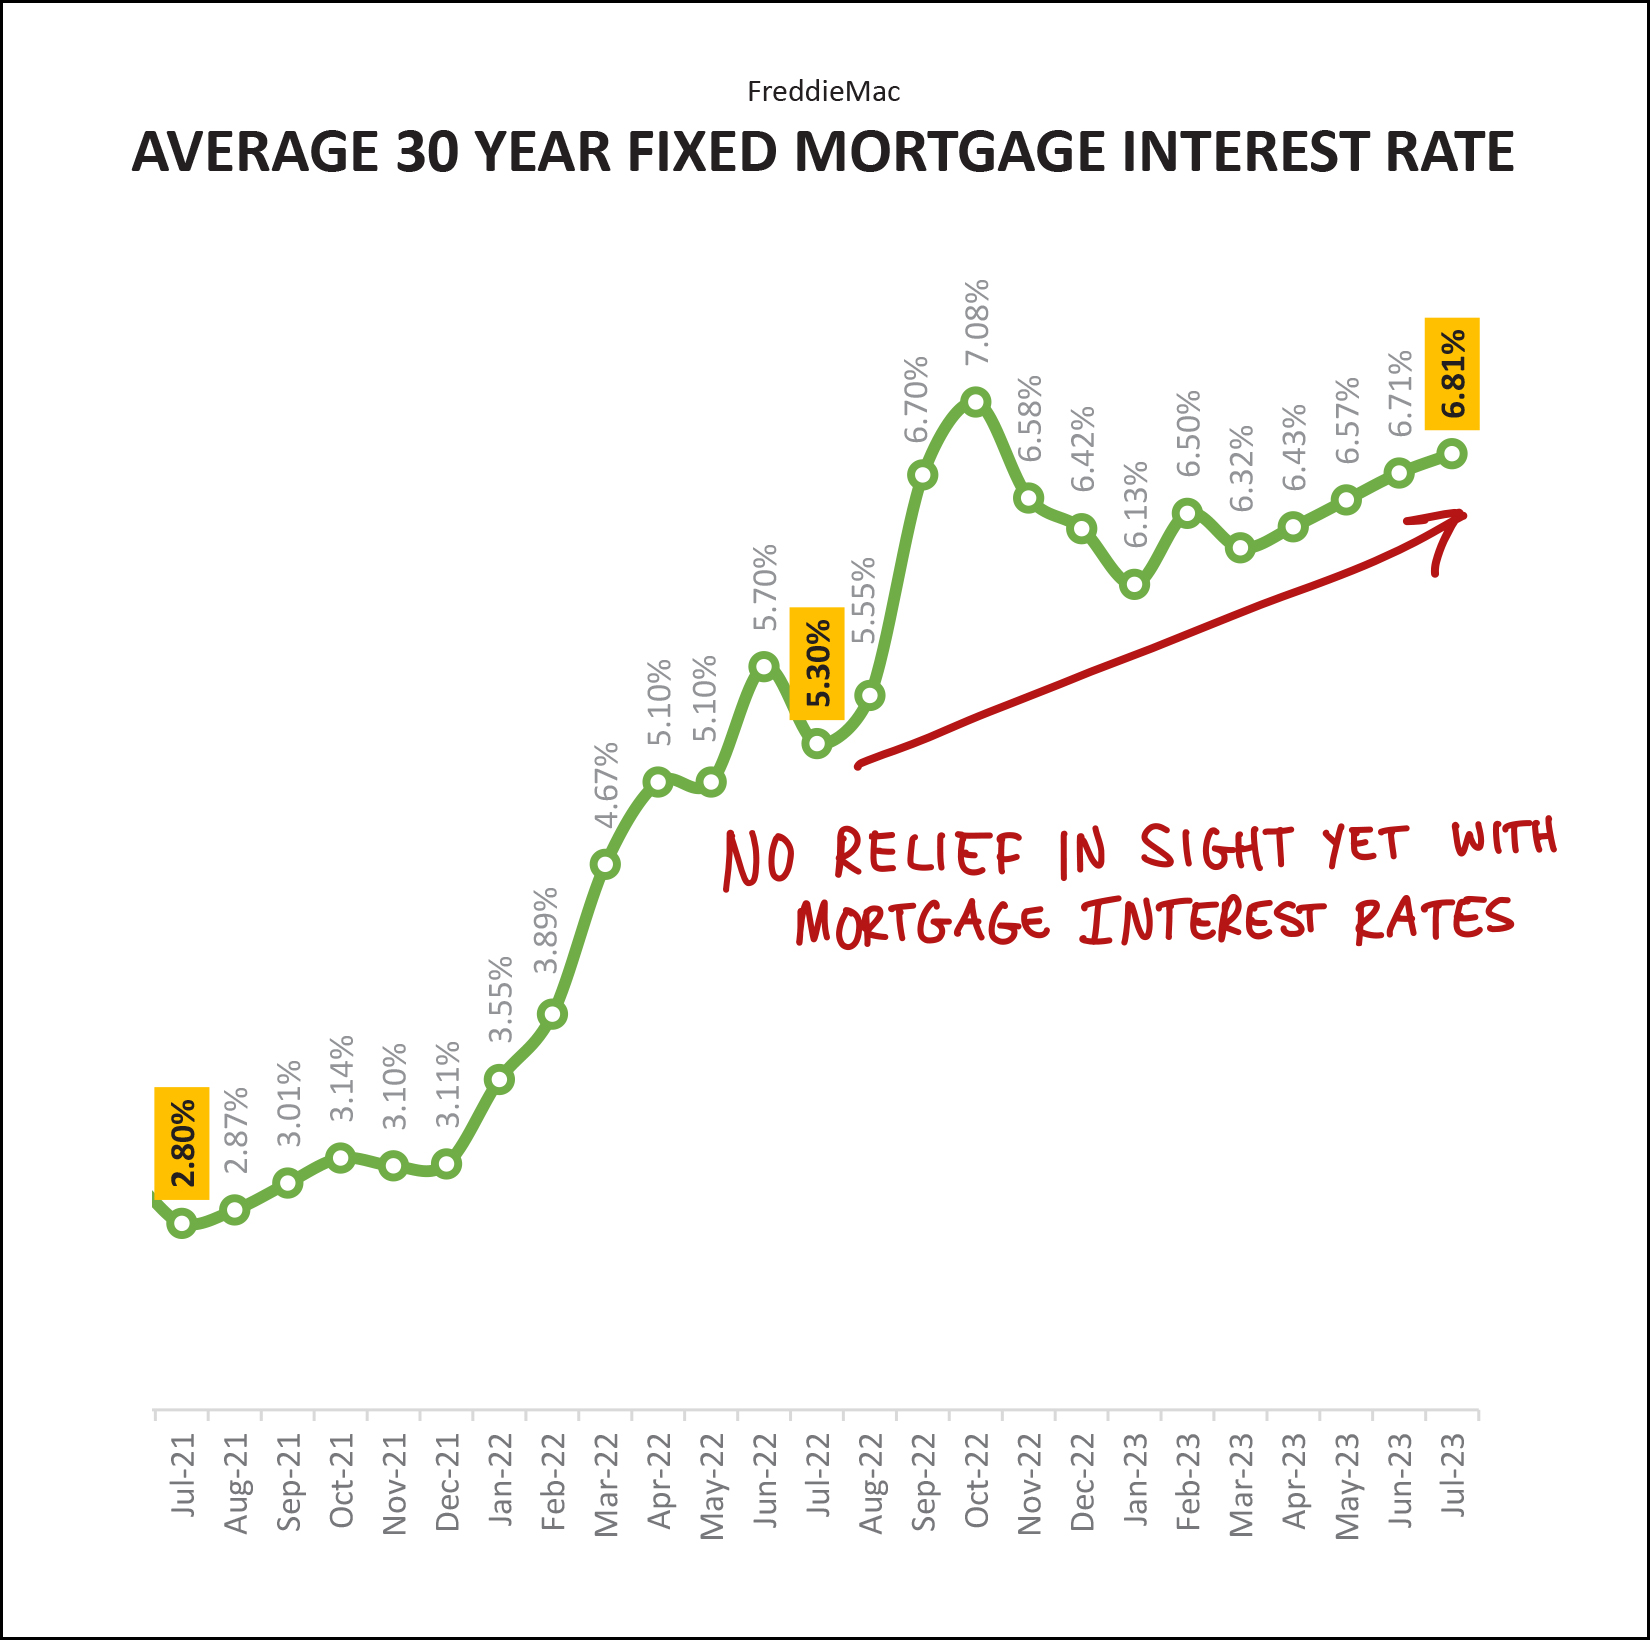 Don't look too far back on the chart above or you'll note that 2.8% mortgage interest rate two years ago. Wow! Even if we ignore the first year (first half) on the chart above, we still see a significant increase in mortgage interest rates over the past year... from 5.3% to 6.8%. We still aren't seeing any relief in sight with mortgage interest rates. Yet. I am hopeful that we move through the remainder of 2023 we'll start to see mortgage interest rates settle down a bit... but I'm guessing they will almost certainly stay above 6%. So, given all of the data above, what should you be thinking about if you are a home buyer, seller or owner? Home Buyers -- Many new listings are still seeing plenty of action... so you very likely may still find yourself in a competitive offer situation... but not always. Understand how current mortgage interest rates affect your potential monthly mortgage payment... and get out there quickly to see new listings. Home Sellers -- You might talk to friends who saw their home go under contract within three days with multiple offers. You might talk to other friends who have had their home on the market for three or four weeks without an offer. Both of those market realities currently exist... and it varies based on price range, property type, location, and many other factors. We need to take a close look at your corner of the local real estate market to devise a reasonable and realistic pricing and marketing strategy for selling your home in a timeframe that suits your needs. Homeowners -- Enjoy your ever increasing home value. If you're talking to a friend who is trying to buy a home, don't mention your mortgage rate, or how glad you are that you already own a home. ;-) And... that's all for today. I hope that the remaining days or weeks of your summer break (if you had one) are enjoyable, and that the start to the school year goes well for you if you are a parent, teacher or administrator. As always, feel free to reach out to me if I can be of any assistance to you as you make plans to buy or sell. You can reach me most easily at 540-578-0102 (call/text) or by email here. | |
Two Startling (Nationwide) Stats That Show Why Many Homeowners Are Not Likely To Sell Within The Next Few Years |
|
 Current mortgage interest rates for a 30 year fixed rate mortgage are averaging at 6.9% per Freddie Mac. Here are the two startling statistics as reported by Business Wire as well as by many others over the past few months... [1] 82% of homeowners have a mortgage interest rate below 5%. An enormous share of homeowners have super low mortgage interest rates on their homes because they bought their home between 2020 and 2022 when we were seeing ridiculously low, historically low, mortgage interest rates -- or they refinanced their mortgage during that time. Most of these 82% of homeowners with a mortgage interest rate below 5% are rather unlikely to sell their home (and pay that off) and buy a new home at current mortgage interest rates that are near 7%. [2] 60% of homeowners with mortgages have lived there for four years or less. We saw record numbers of home sales between 2020 and 2022, as the Covid-19 pandemic (and super low mortgage interest rates) prompted lots of folks to buy a home. Many homeowners eventually find that their home doesn't work as well for them -- based on size, layout, features, etc. -- but that doesn't usually happen within four years. As such, many or most of these 60% of homeowners who have been in their homes for less than four years are not likely to be selling anytime soon. What does all of this mean for our real estate market? We are likely to continue to see low numbers of resale homes coming on the market over the next few years as more homeowners opt to stay put rather than selling their home that likely has a super low mortgage interest rate - and that likely is a home they purchased in the past few years. | |
We Are Starting To See A Few More Homes With Price Changes These Days |
|
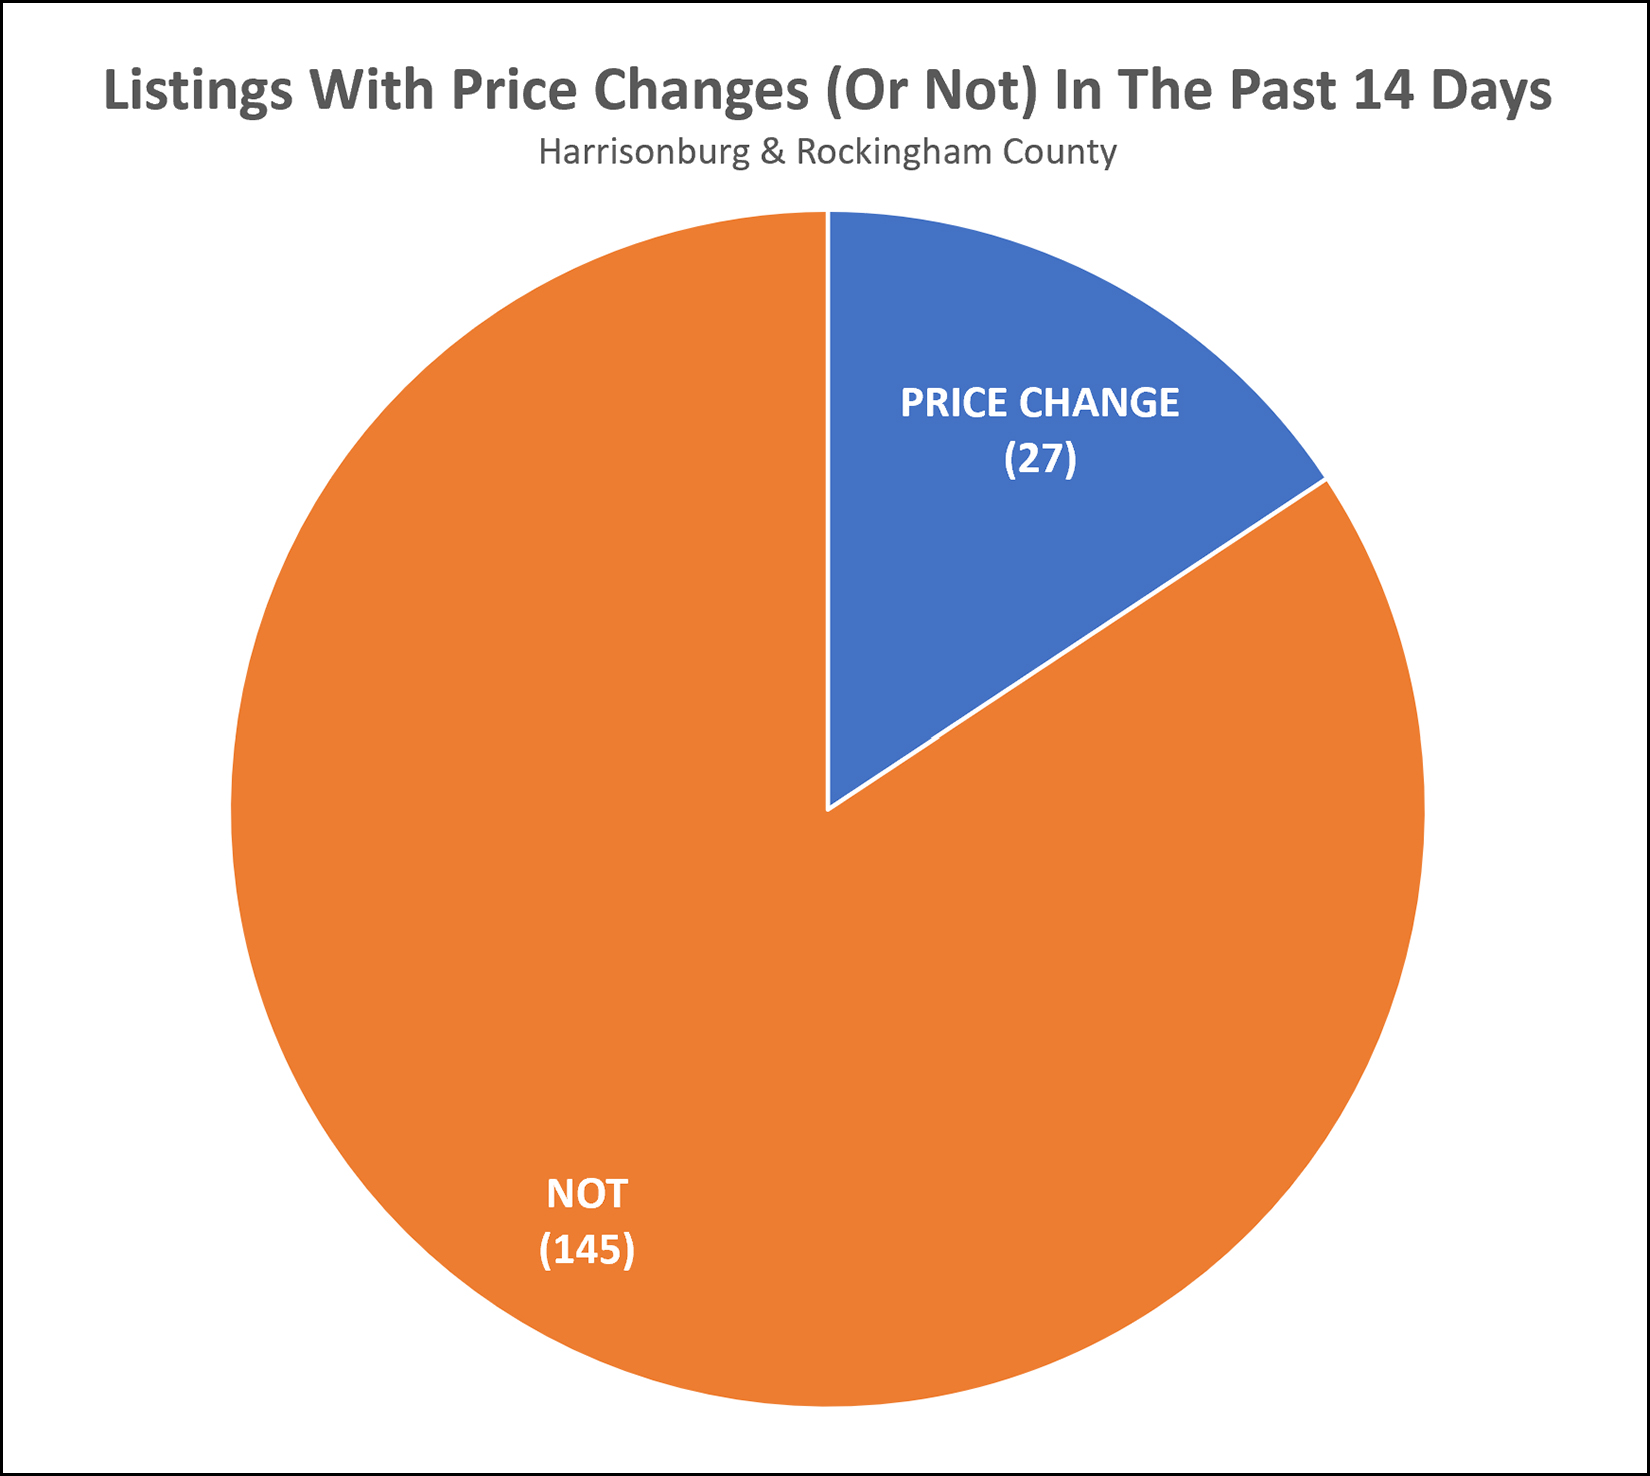 There are 172 active listings (homes for sale) in Harrisonburg and Rockingham County right now. Of those... 27 have had price changes in the past two weeks... and 145 have not. I don't think this number of price changes suggests that homes are selling for less... or that home prices are or will be declining... but some home sellers seem ready to start make adjustments in their asking price if their home is not going under contract as quickly as anticipated. | |
Quite A Few Home Buyers (And Sellers) Signed Contracts In July 2023 |
|
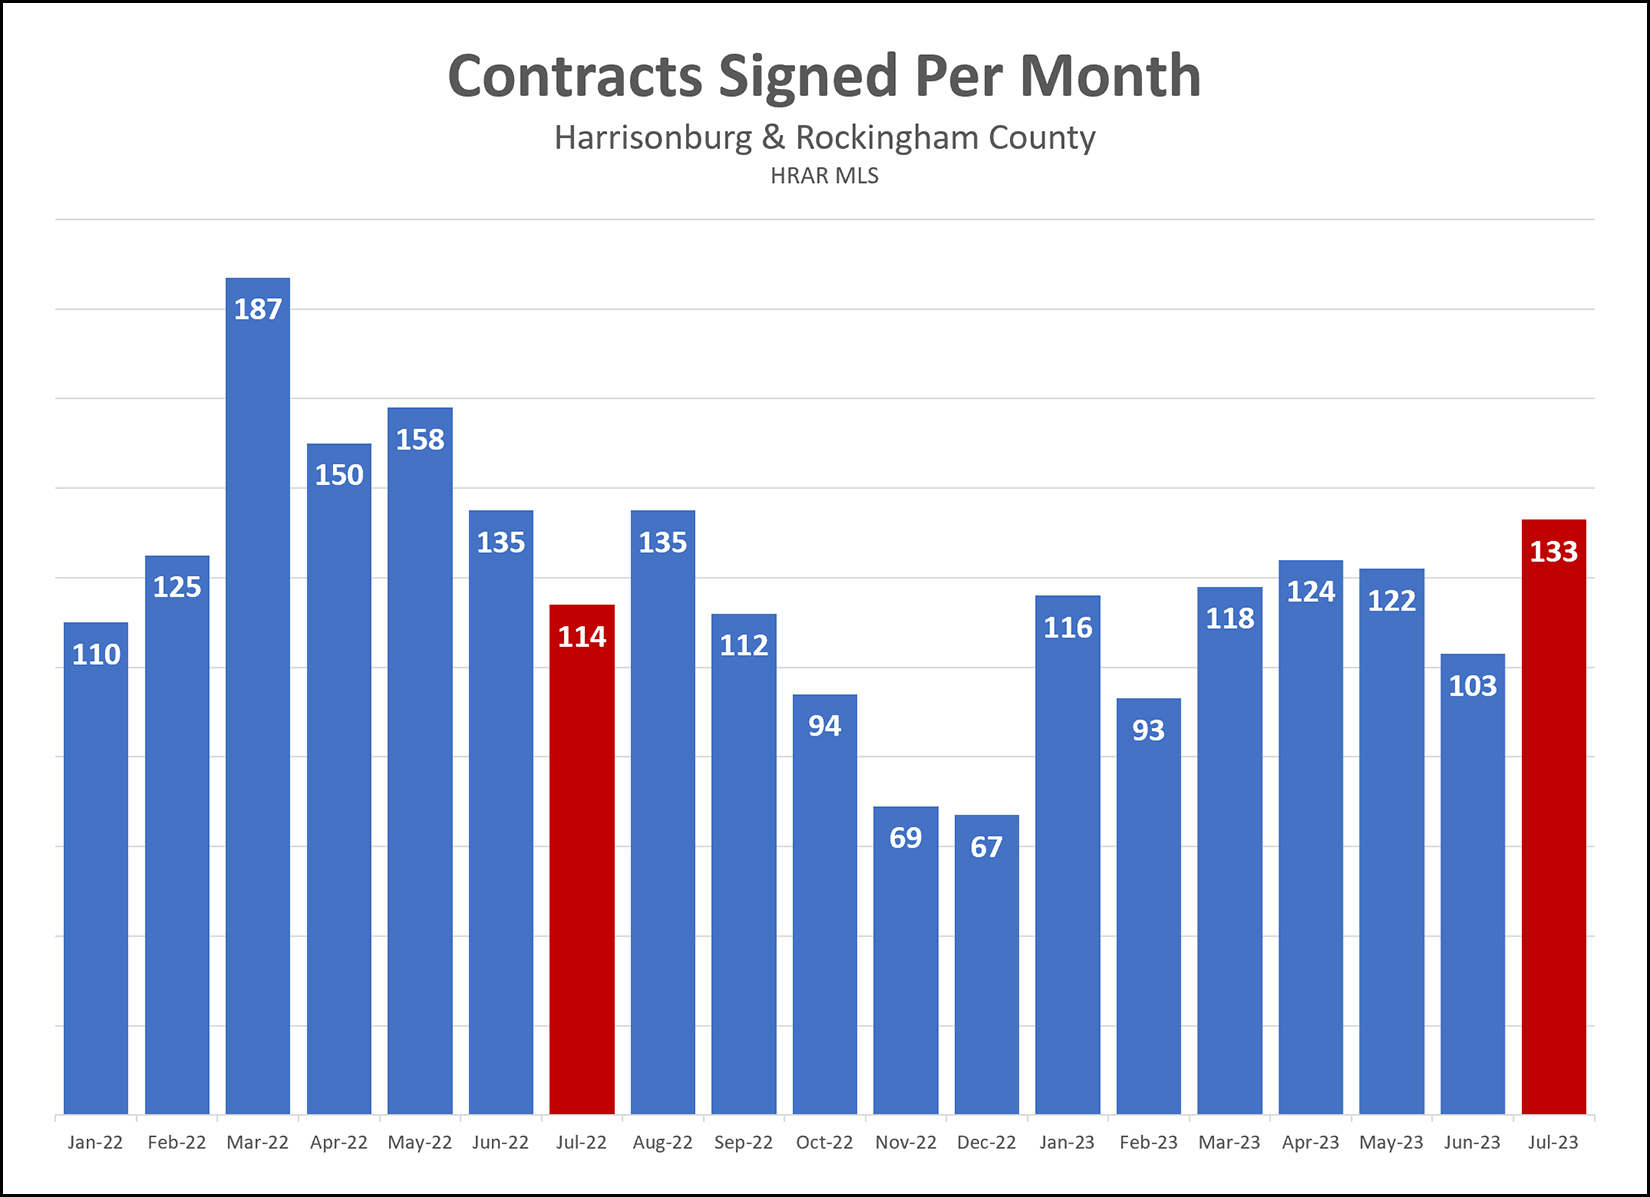 Looking back at the number of contracts signed last month in Harrisonburg and Rockingham County -- there were 133 contracts signed. These 133 contracts signed in July 2023 were... [1] The most contracts signed in a single month thus far in 2023. [2] About 17% more contracts than were signed last July. But... when you look (above) at all of last year and this year thus far, you'll see we never experienced the 150+ contracts per month that we saw last March, April and May. So, perhaps the pace of contract activity is picking up a bit as of last month... but we are still well behind where we were a year ago. | |
Far Fewer Homes Are Selling, But Sales Prices Keep Rising |
|
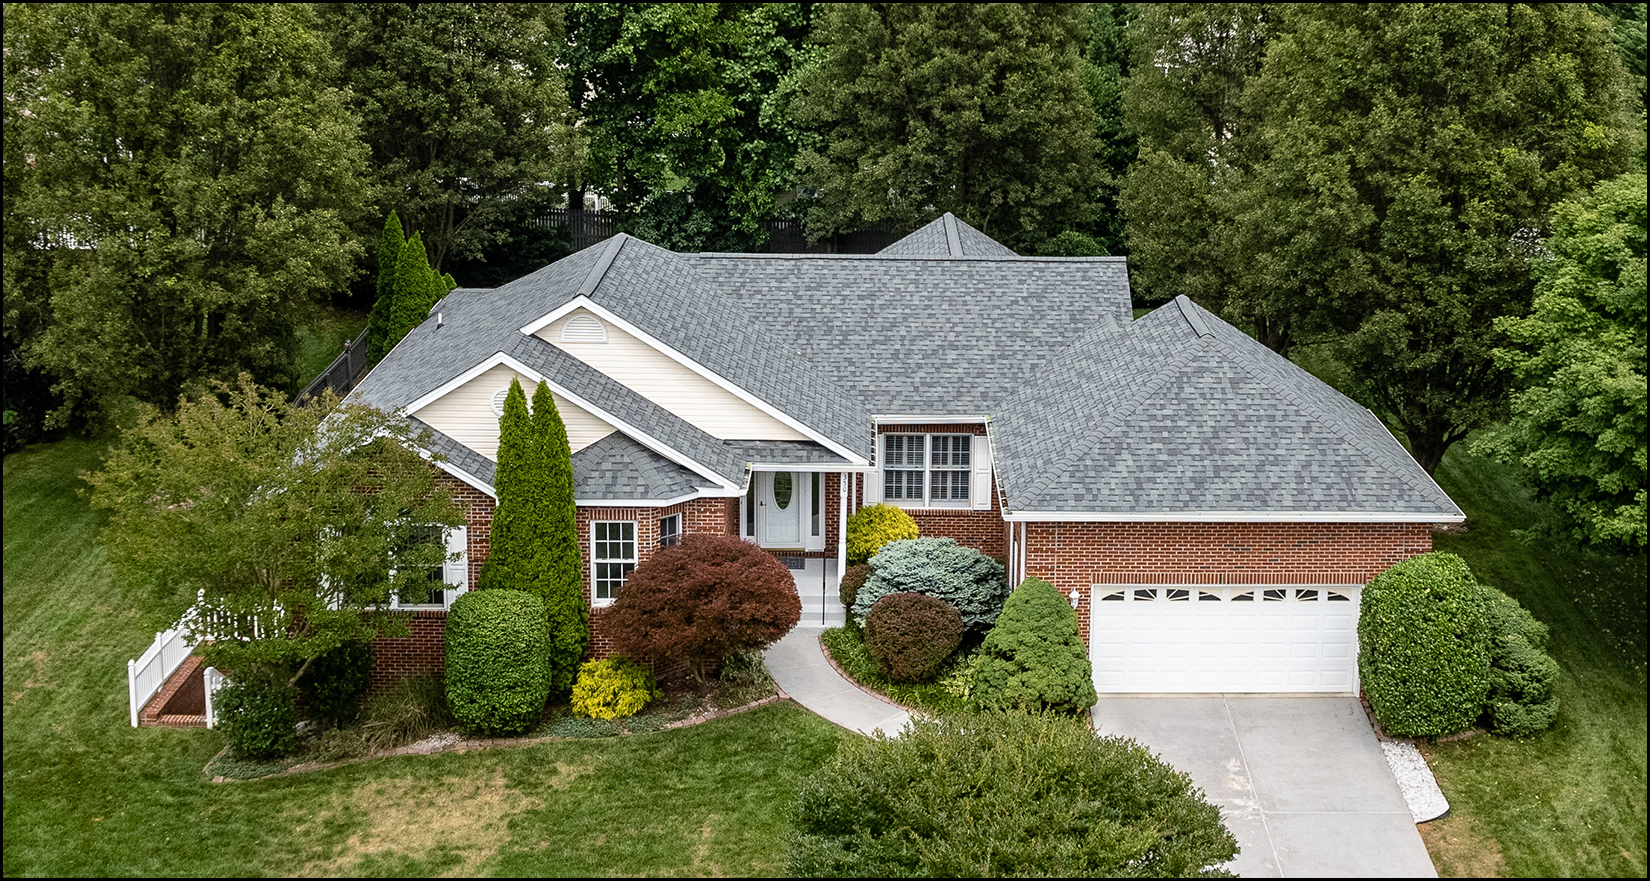
 Happy Friday Morning, Friends! As per the headline above, far fewer homes are selling this year, but sales prices keep rising. But before we dive into it... First, if you're looking for a spacious four bedroom home in a neighborhood in the Spotswood High School district, be sure to check out 350 Confederacy Drive... This beautiful, well maintained house in Battlefield Estates has had many updates over the past few years and is currently listed for sale. Find out more at 350ConfederacyDrive.com. Second, I hope you have had a fun first half to your summer. The weeks are flying by and before you know it, we'll be thinking about and planning for the coming school year. I was out of town for a few days last week for some fun on the water...  I have always loved water skiing but in recent years I have become the boat driver so it was great to have Luke drive this year so I could ski again. It was a fun and relaxing time away with family, and I hope you find time to have fun this summer as well... whether at the lake, at the beach, or right here in the beautiful Shenandoah Valley. Third, and finally before we get to the market data, each month I offer a giveaway, of sorts, for readers of this market report, highlighting some of my favorite places, things or events in Harrisonburg. Recent highlights have included Red Wing Roots tickets, The Little Grill, and Cuban Burger. This month I am giving away a $50 gift certificate to Jimmy Madison's... located in downtown Harrisonburg. If you find me at Jimmy Madison's, I'll be enjoying one of many favorite items from their fantastic menu... but always with a side of their delicious Jimmy Sprouts -- Caramelized Brussels Sprouts with sweet pecans, candied bacon and honey thyme vinaigrette. I'm getting hungry just talking about them! Click here to enter to win the $50 gift certificate to Jimmy Madison's. Now, on to the data... 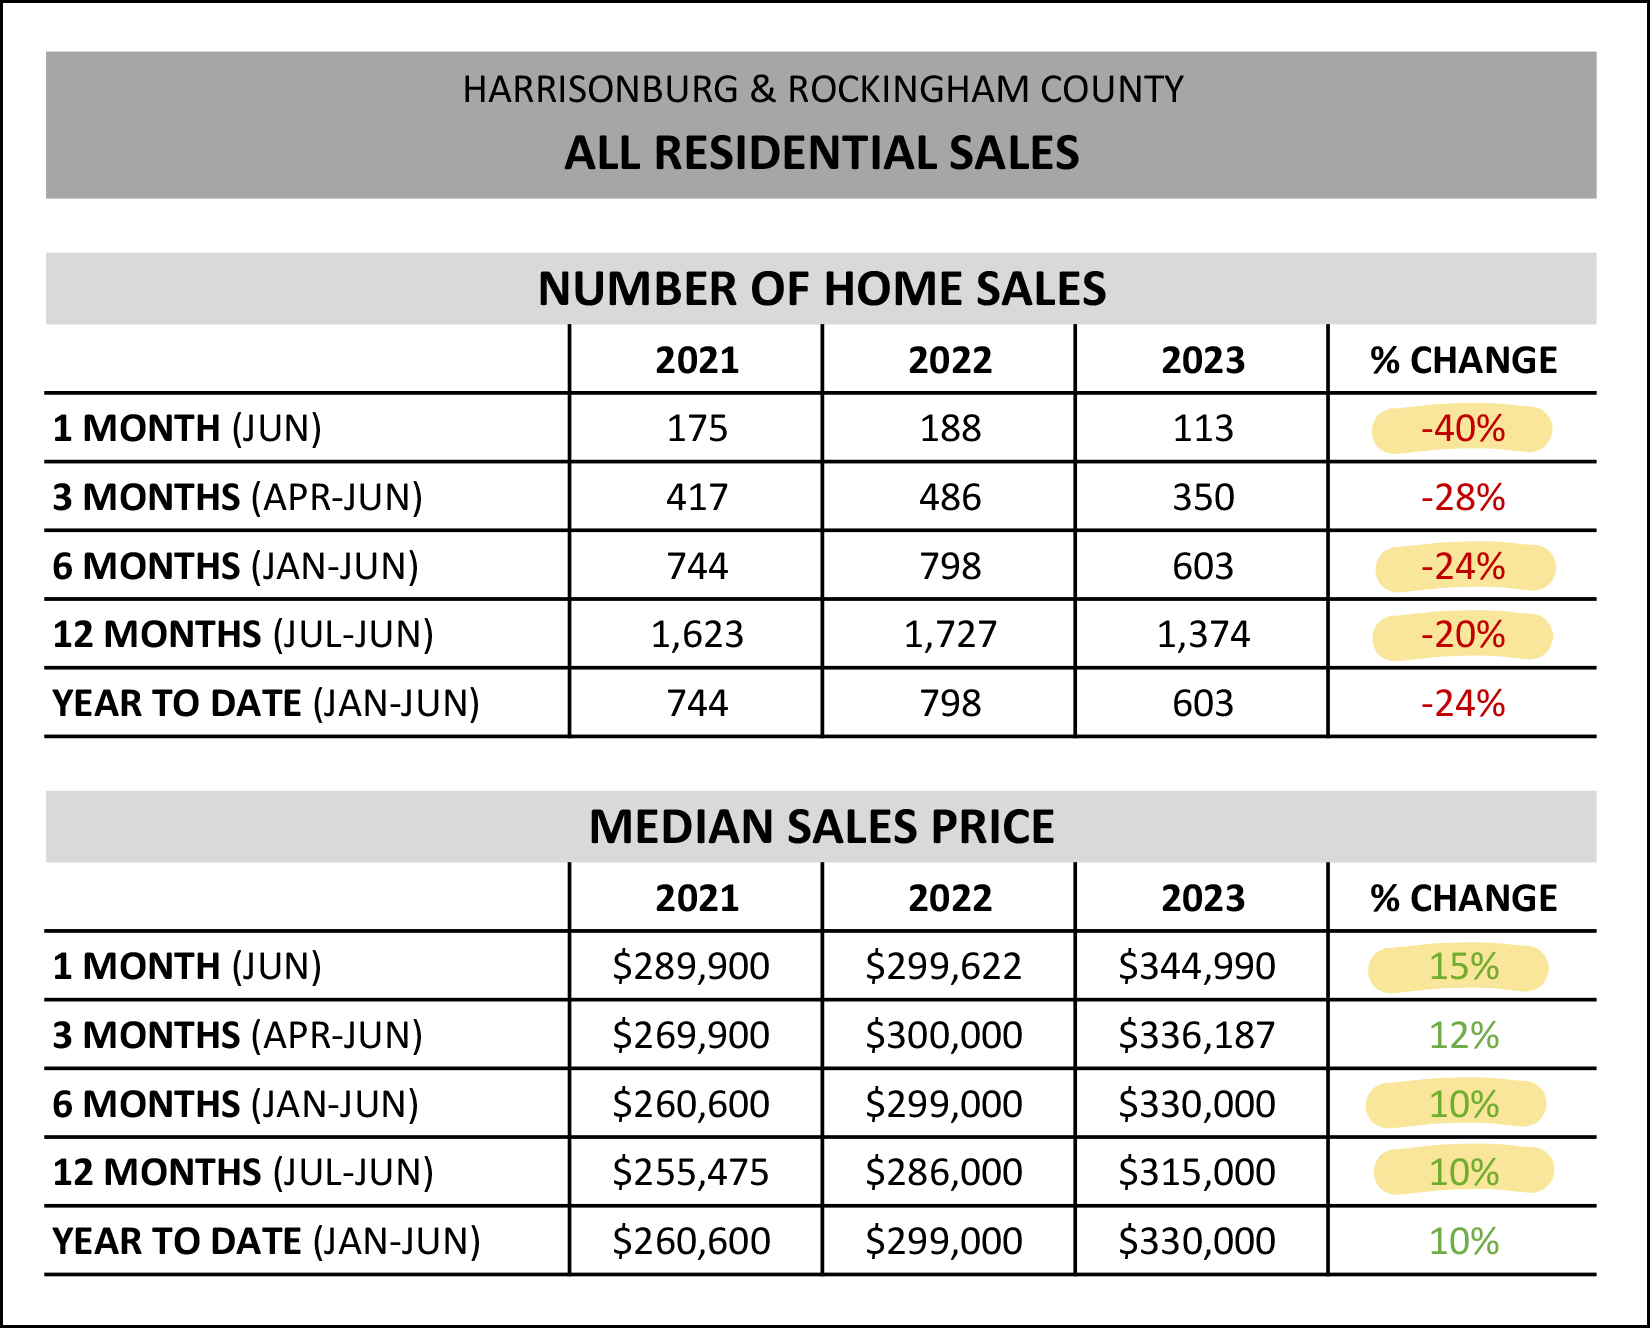 As shown above... [1] There were only 113 home sales in June 2023, which was a 40% decline from last June. We'll see this visually in a graph in a bit. [2] We've seen 603 home sales in the first half of the year which is a 24% decline from the first half of last year. This is the "far fewer homes are selling" part of my market report. [3] If we stretch back a full year (12 months) we will find 1,374 home sales -- a 20% decline from the 1,727 home sales seen in the 12 months before that. So, regardless of how you slice or dice the data, fewer homes are selling in Harrisonburg and Rockingham County this year than last. But... [4] The median sales price in June 2023 ($344,990) was 15% higher than last year when it was $299,622. [5] The median sales price in the first half of 2023 ($330,000) was 10% higher than the first half of 2022 when it was $299,000. [6] The median sales price over the past 12 months ($315,000) was 10% higher than in the in the 12 months before that when it was $286,000. As such, regardless of how you look at it, the median sales price is still on the rise in Harrisonburg and Rockingham County, despite far fewer homes selling. Here's a visual of the drop off in the number of homes selling... 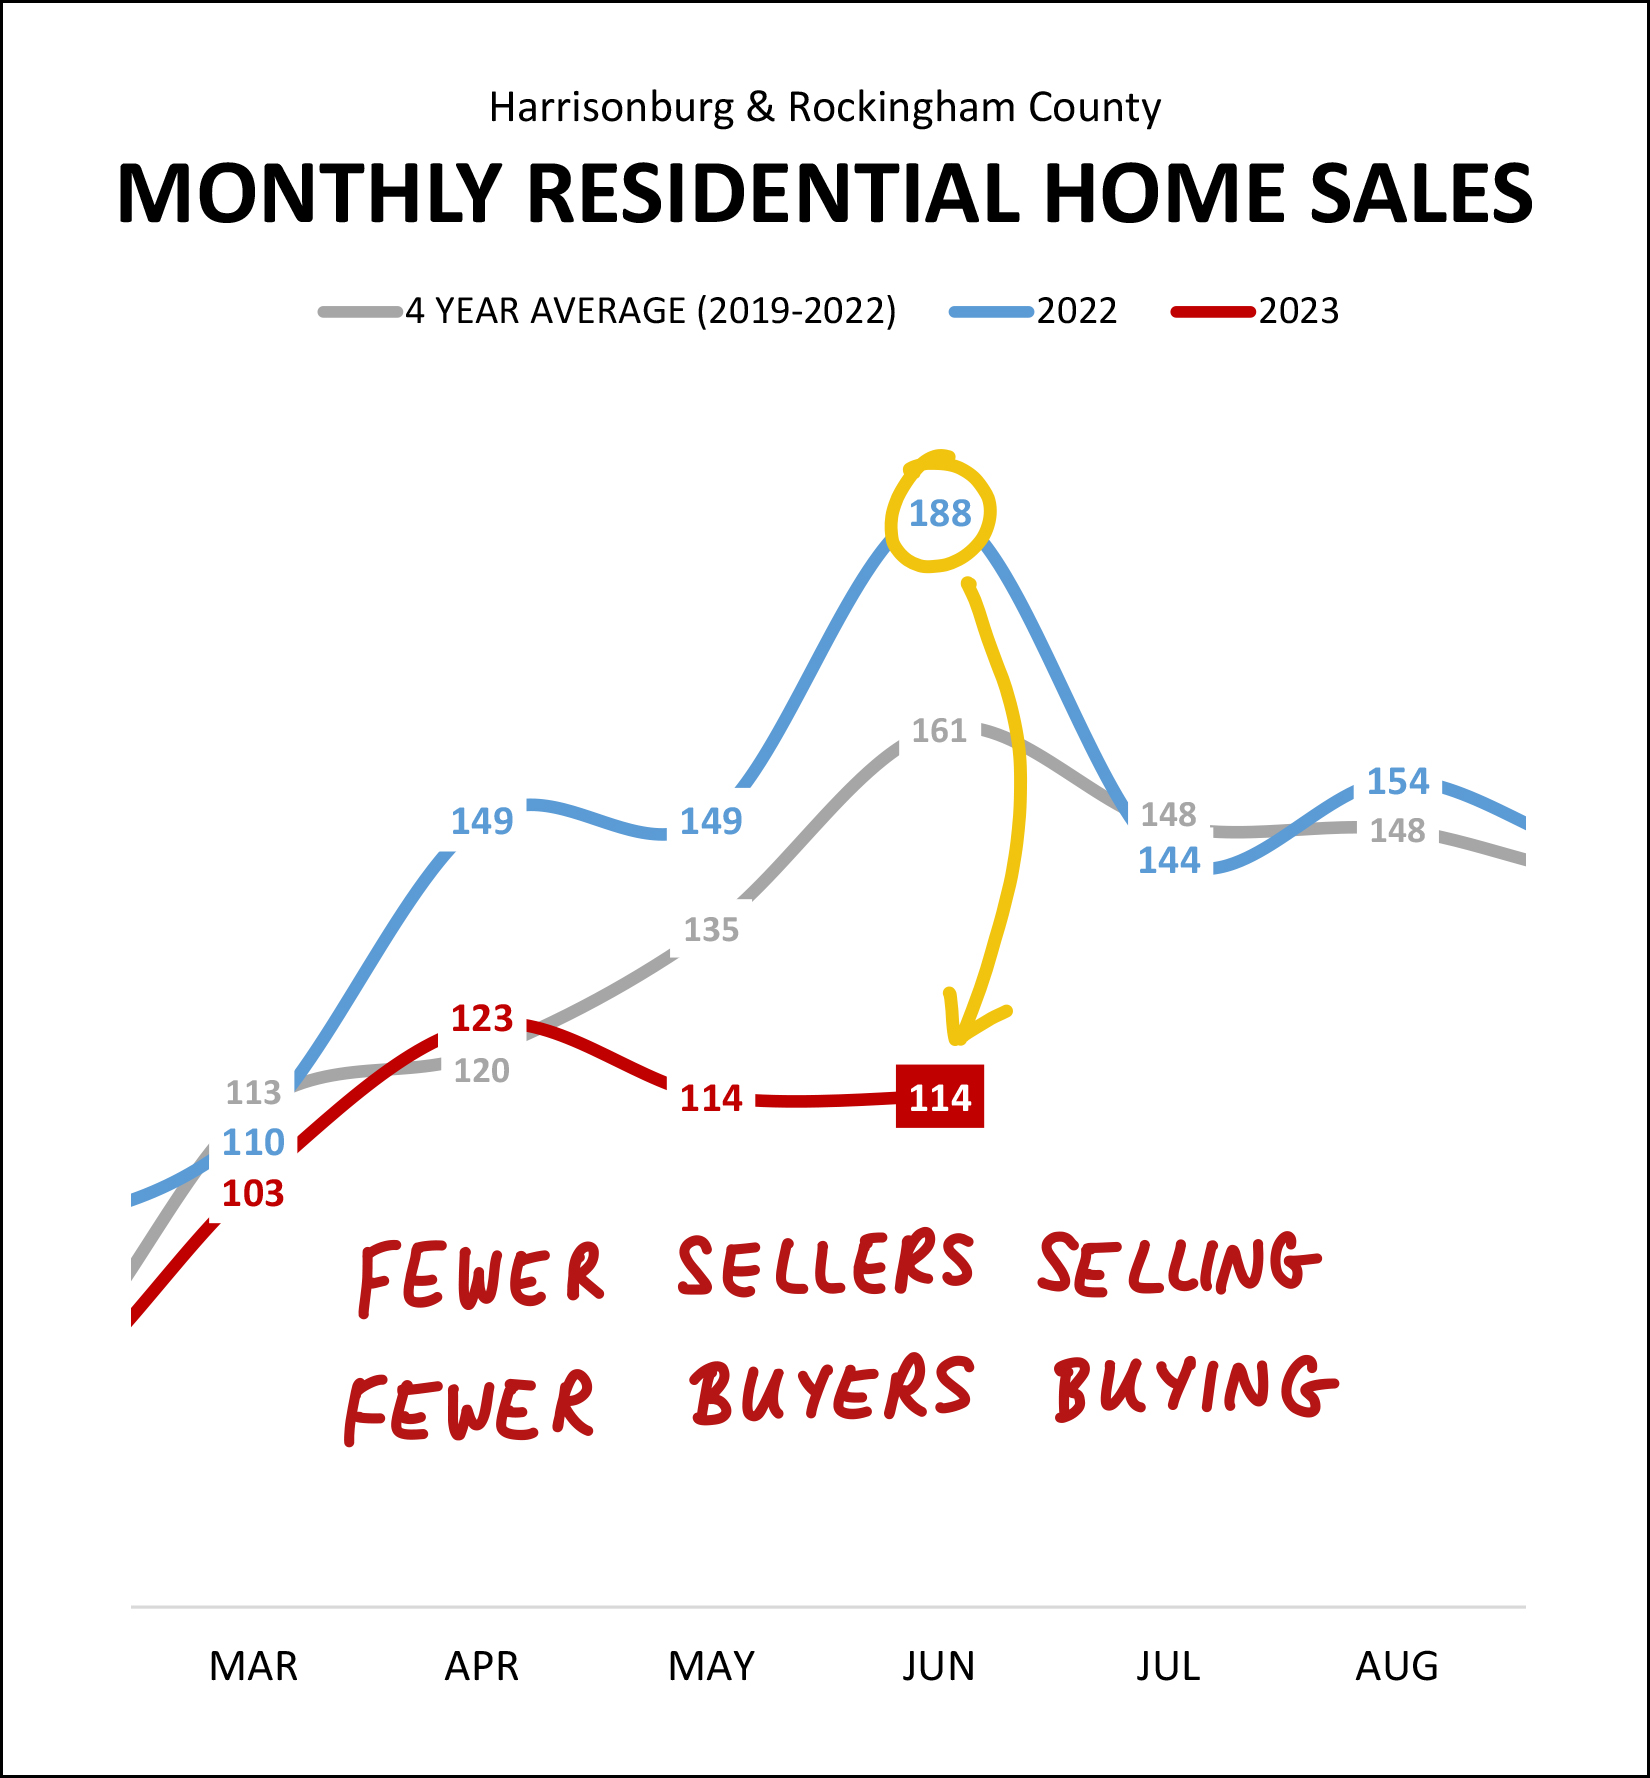 The blue line above shows the number of homes selling per month last year -- compared to the red line which shows this year's home sales. As is quite evident, the number of homes selling has been far lower this year than last, particularly over the past few months -- April, May and June. The grey line above shows the average number of home sales per month based on the past four years (2019-2022) of data. When looking at all three lines together it becomes clear that home sales last year were significantly above historical averages and home sales this year are now (particularly in May and June) significantly below historical averages. As I'll continue to discuss throughout this report... this decline in the number of homes selling is (perhaps obviously) both a result of fewer sellers selling and fewer buyers buying. We need both a seller and a buyer for a home sale to take place. As we'll see in later graphs, inventory levels remain low -- so it seems likely that the main constraint on home sales is the number of sellers selling... not a limit on the number of buyers who would like to buy. But before we get to inventory levels, let's look at a slightly longer historical perspective... 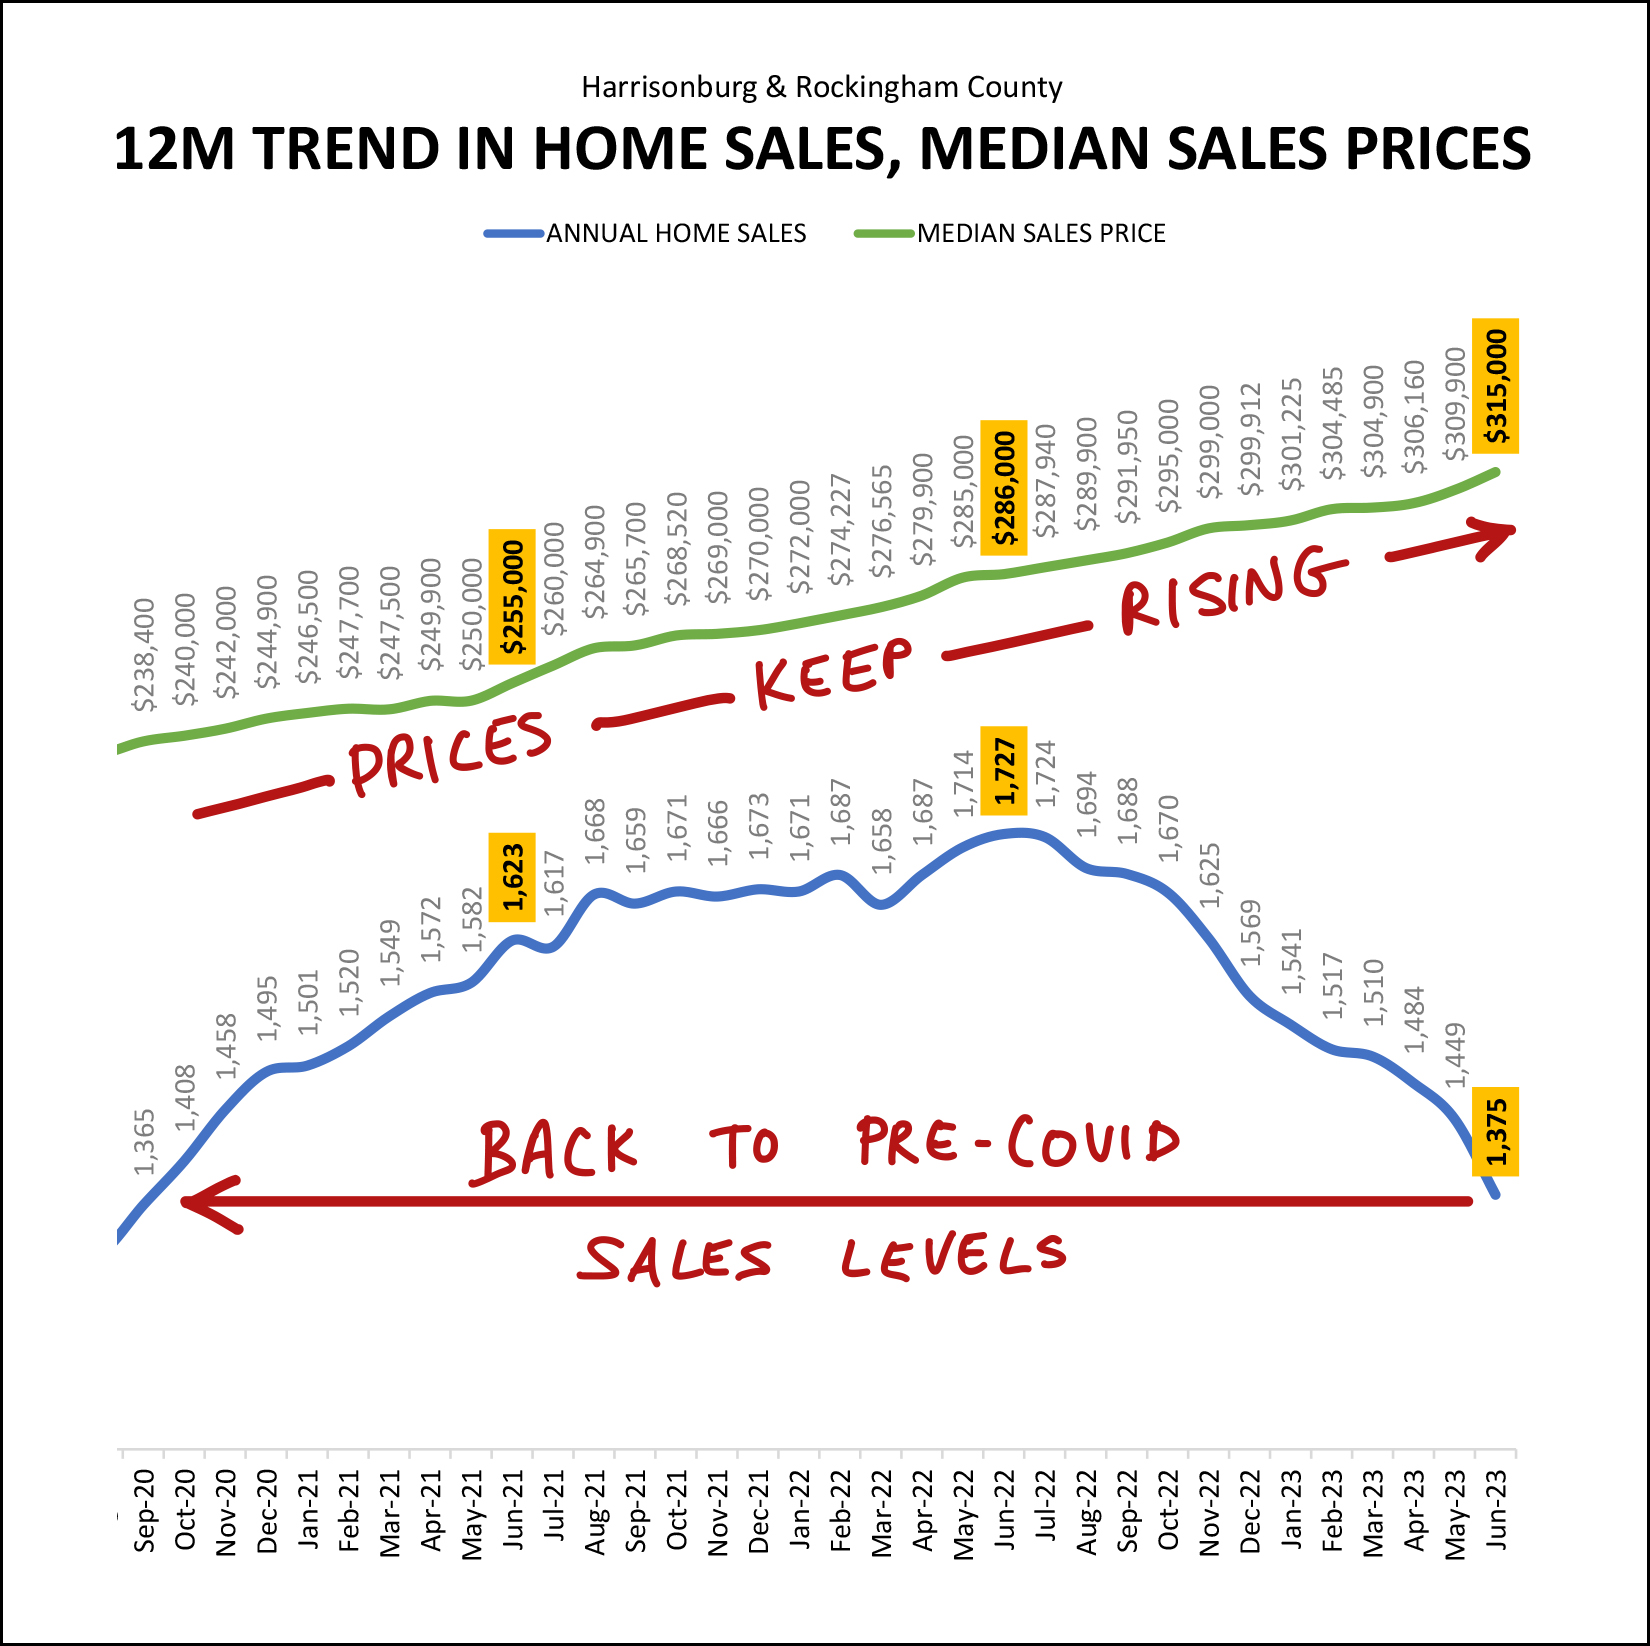 The blue line above shows the number of home sales per year, updated each month. This snapshot looks back to late 2020 (in the thick of Covid) when home sales were surging upwards, from 1,365 annual sales all the way up to 1,727 annual sales. But over the past year we have seen annual sales steadily drop... all the way back down to 1,375 sales per year... about the same place as where we were in the early months of the pandemic. If the pandemic (and low mortgage interest rates, and lots of people working from home) drove the number of annual home sales up over the course of two years... it was immediately followed by much higher mortgage interest rates driving the number of annual home sales down over the course of the most recent year. When the number of home sales in our market was surging in 2020, 2021 and 2022 it certainly made sense that home prices were rising steadily, as shown in the green line above. But over the past year, even as the number of homes selling has declined, and even with higher mortgage interest rates, we have continued to see home prices keep on rising. This (ever higher prices) is an indication (along with continued low inventory levels) that the limitation of the number of homes selling is almost certainly primarily a supply side issue -- not enough sellers being willing to sell. To put rising home prices in context... take a look at this change in the median sales price in our local market over the past four years... 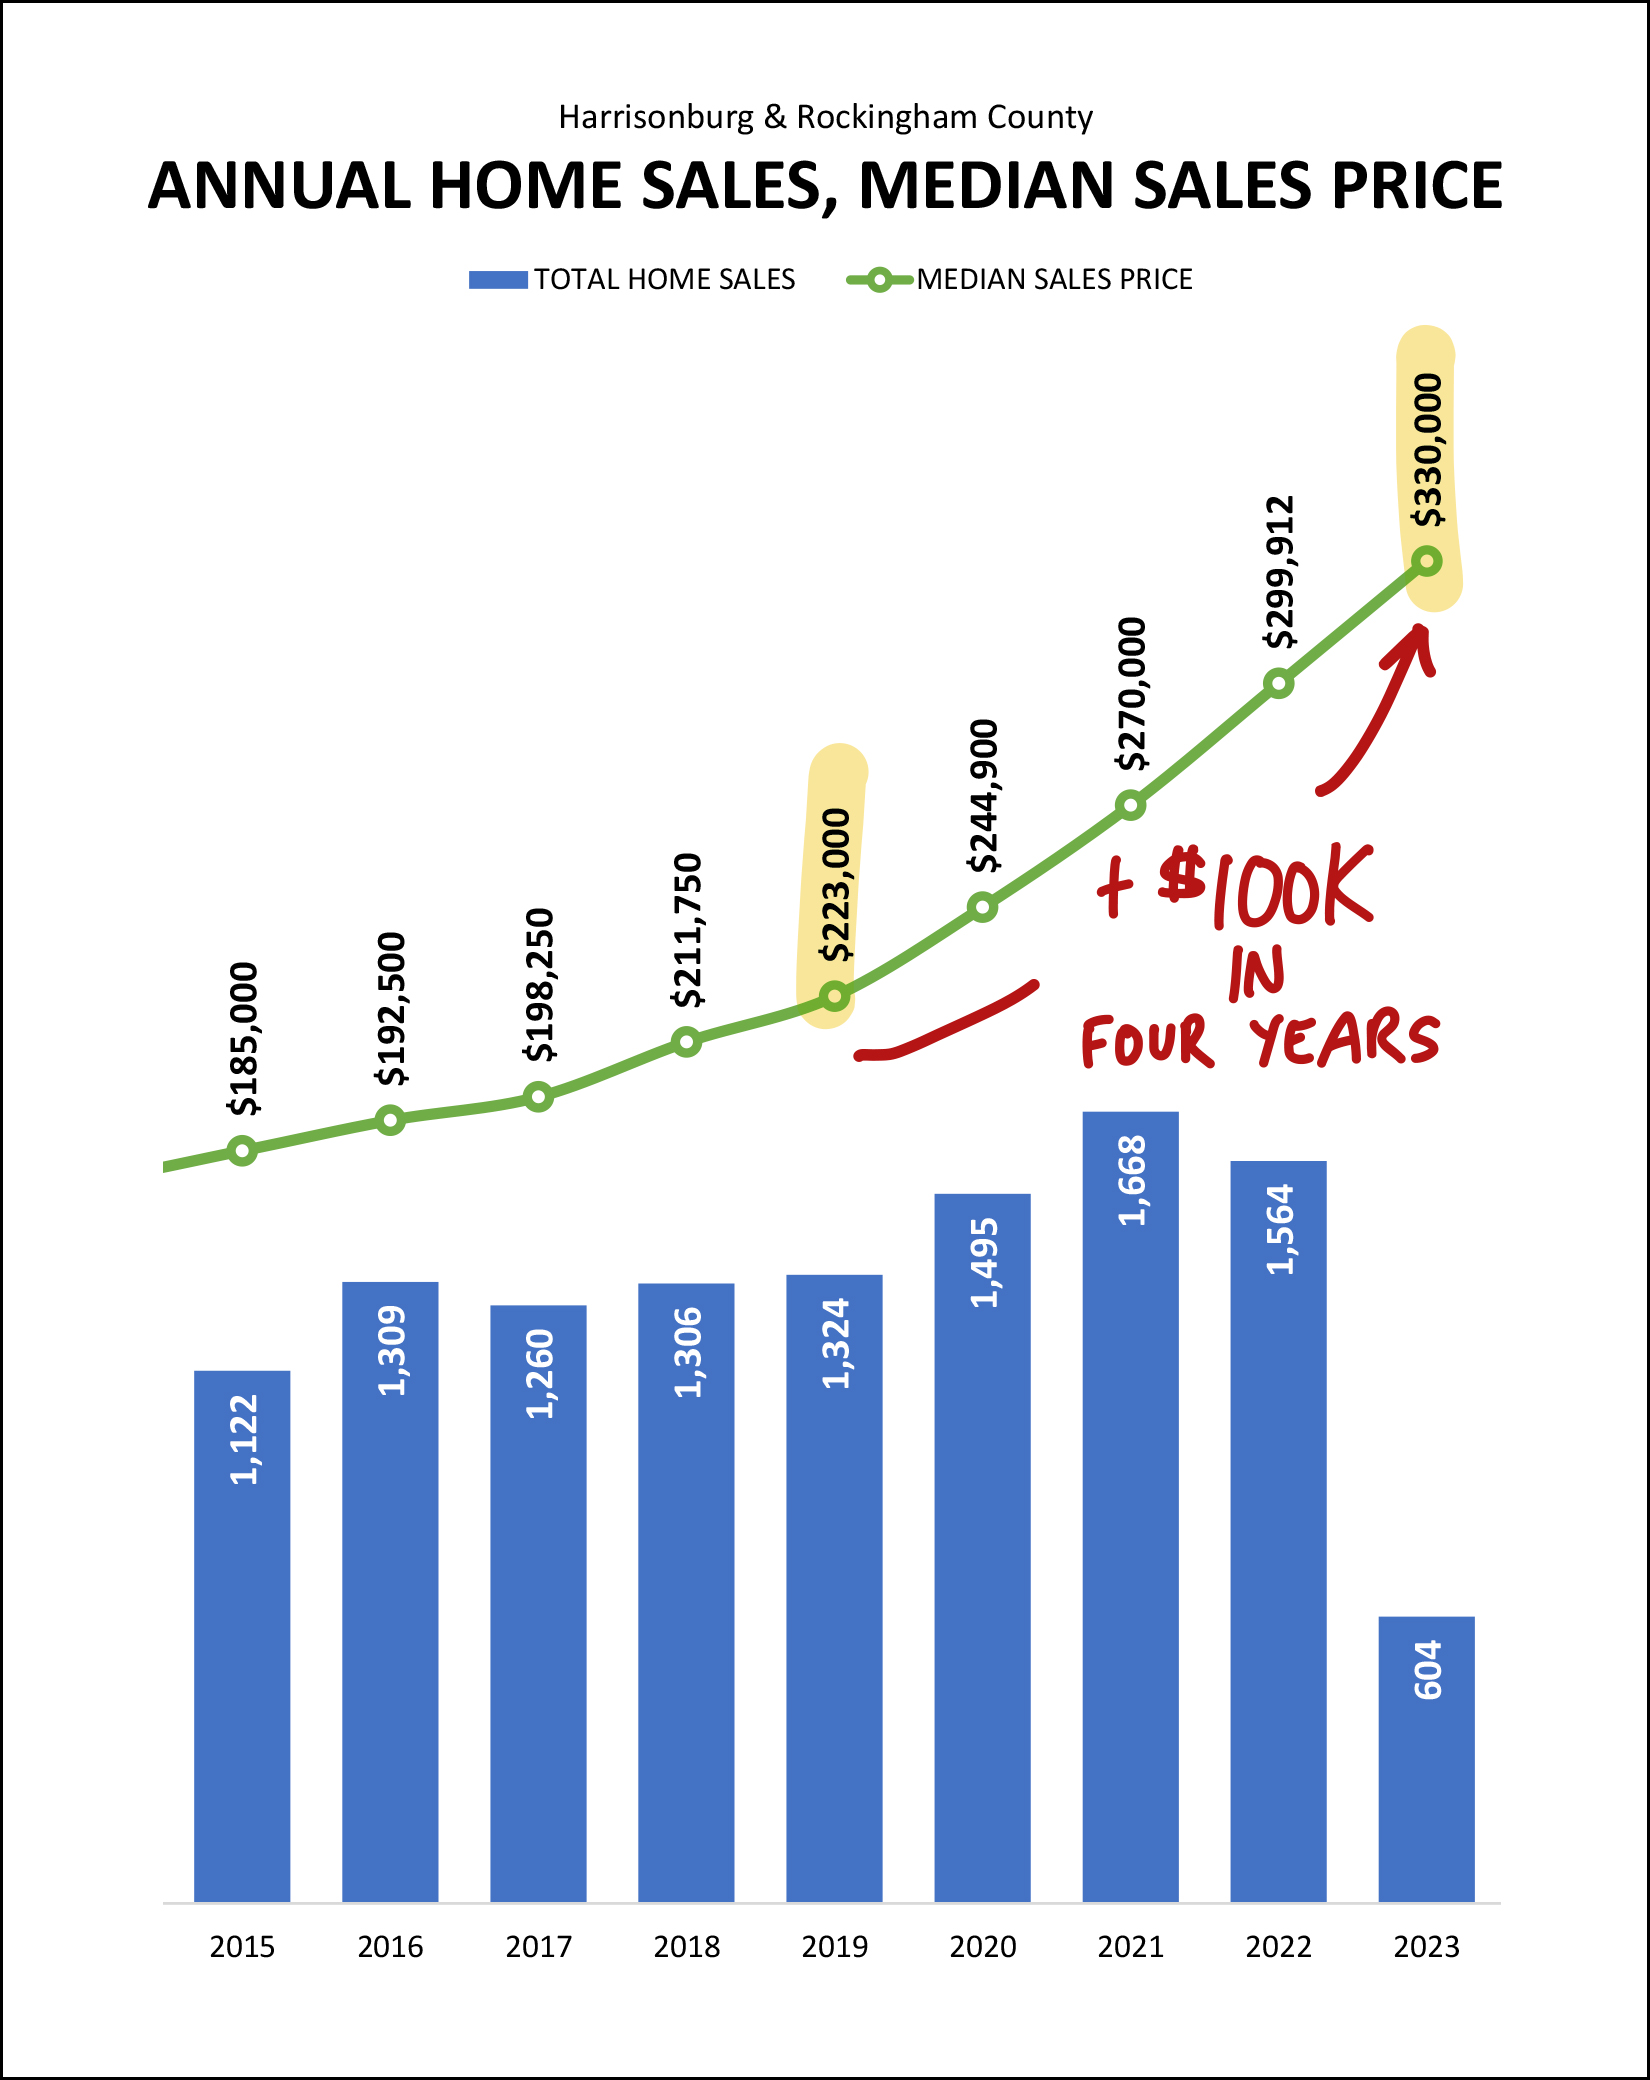 The median sales price in Harrisonburg and Rockingham County has increased by more than $100,000 over the past four years. Wow! Four years ago your purchase of a median priced home would have had you spending $223,000 -- and today you'd be spending $330,000. This is certainly wonderful news if you have owned a home over the past four years -- or if you bought a home four years ago -- and less exciting news if you do not own a home and/or have been trying to buy a home for any or all of the past four years. It is important to note that these figures are not adjusted for inflation. I'll take a look at that separately, hopefully soon, as we have seen significant changes in what a dollar buys you over the past few years -- not just with houses, but across the majority of the economy. As should come as no surprise, the precursor to fewer home sales is... fewer contracts being signed... 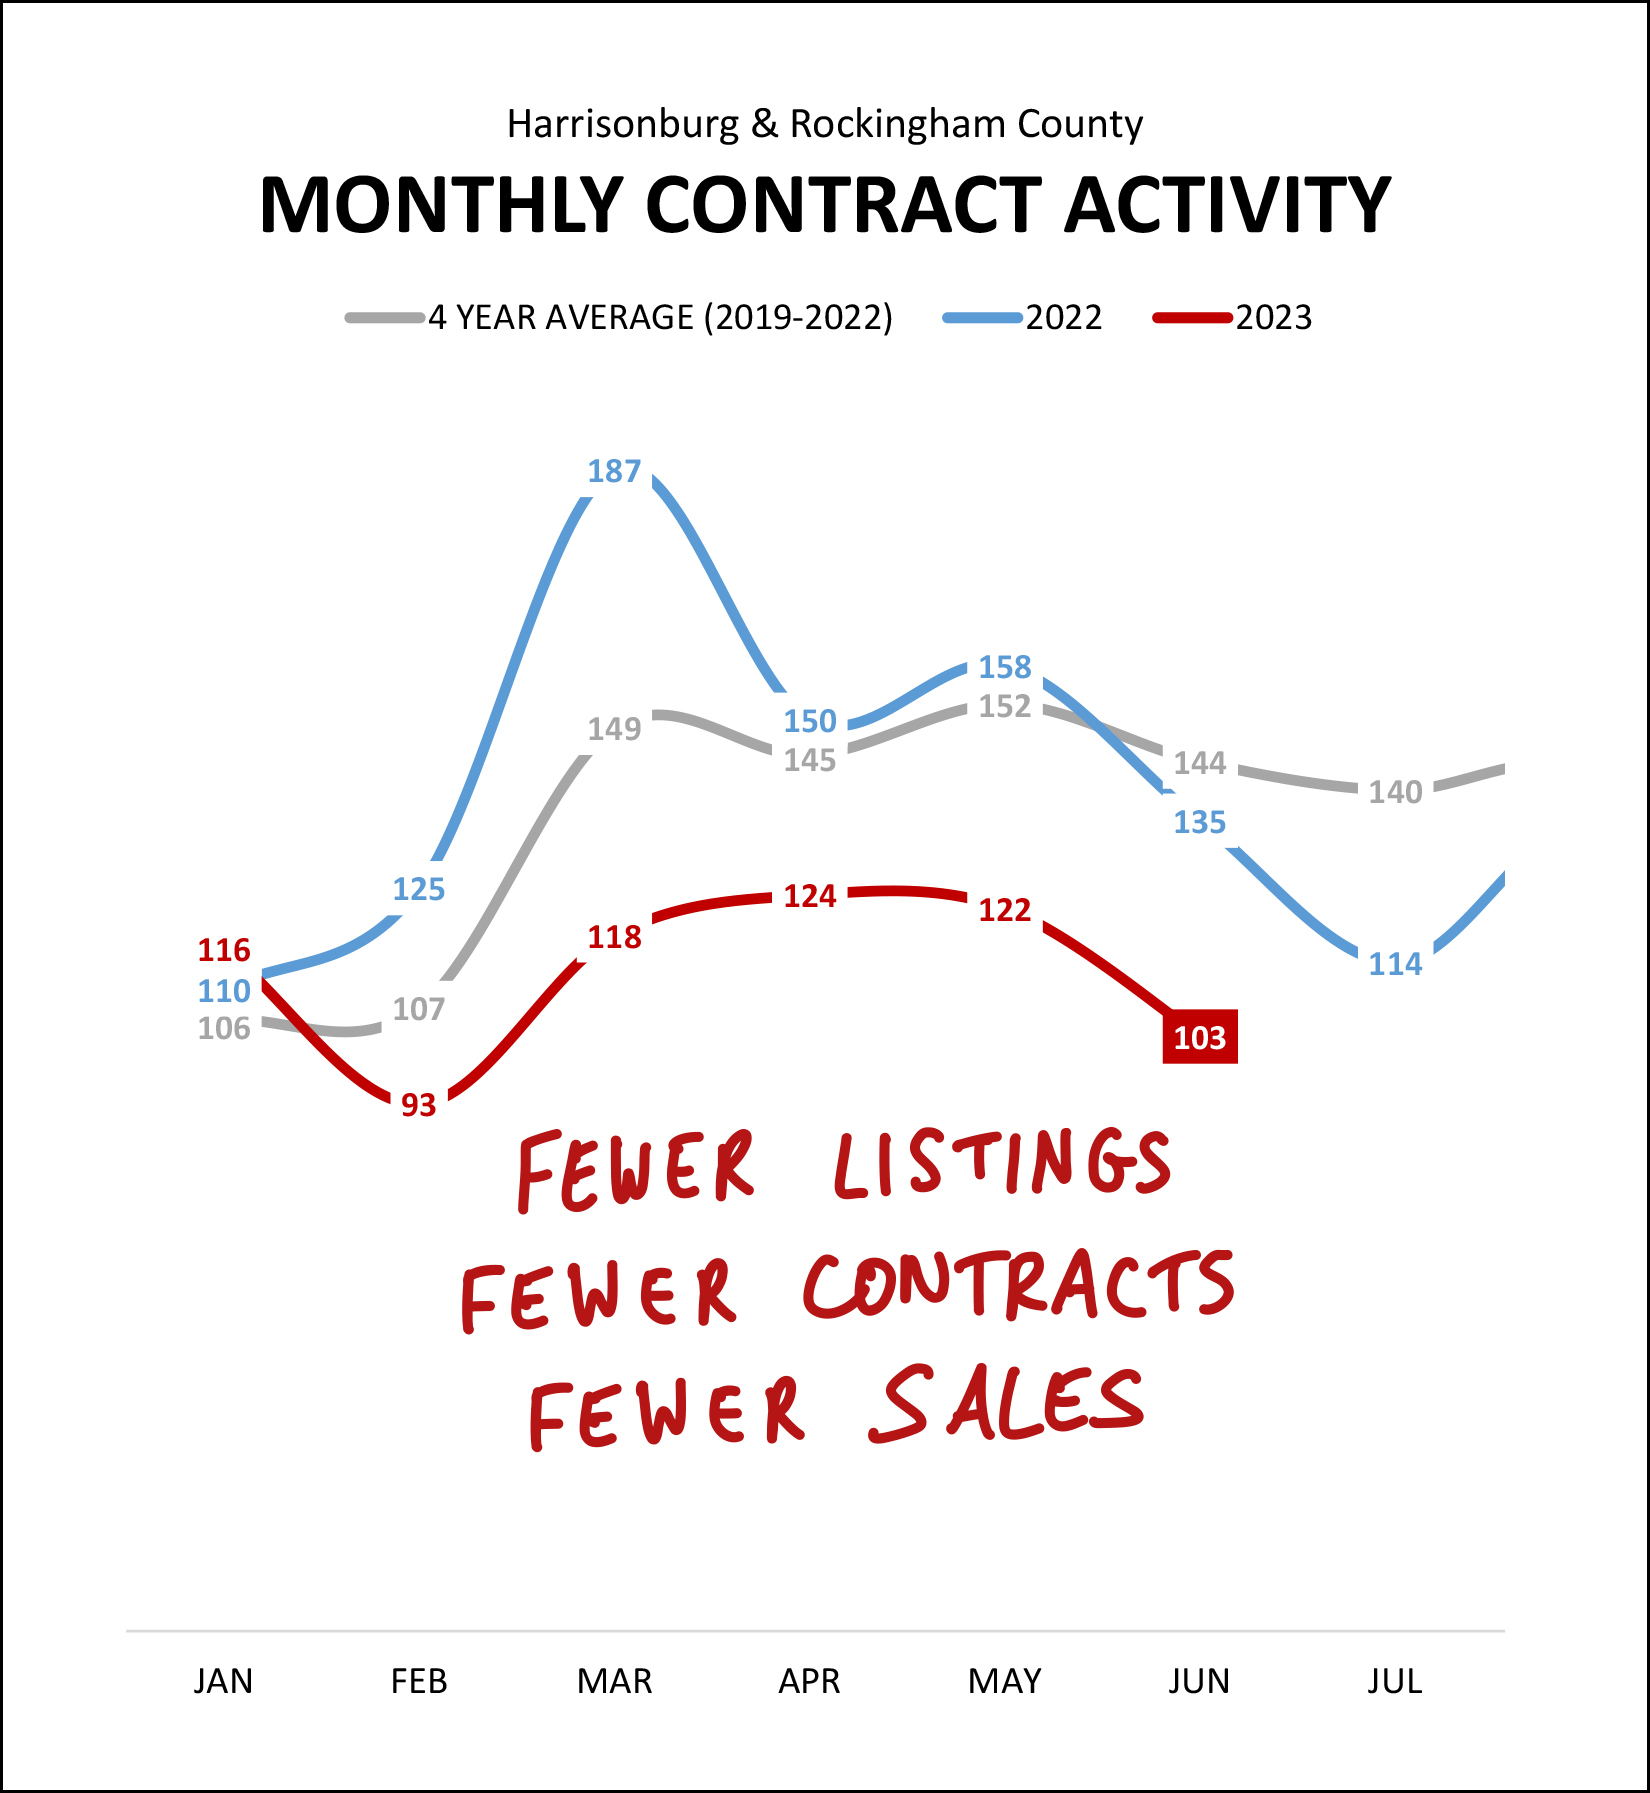 As to the point I made earlier, the blue line above (last year's monthly contracts) was certainly above the historical average (grey line) but this year's trajectory of monthly contracts (red line) is well (well!) below historical averages. Looking ahead to home sales for the rest of the summer and into fall, we are likely to see continued to declines in home sales based on continued low levels of contracts being signed. As mentioned previously, one of the main reasons why we are seeing fewer home selling... is because there are fewer sellers selling... 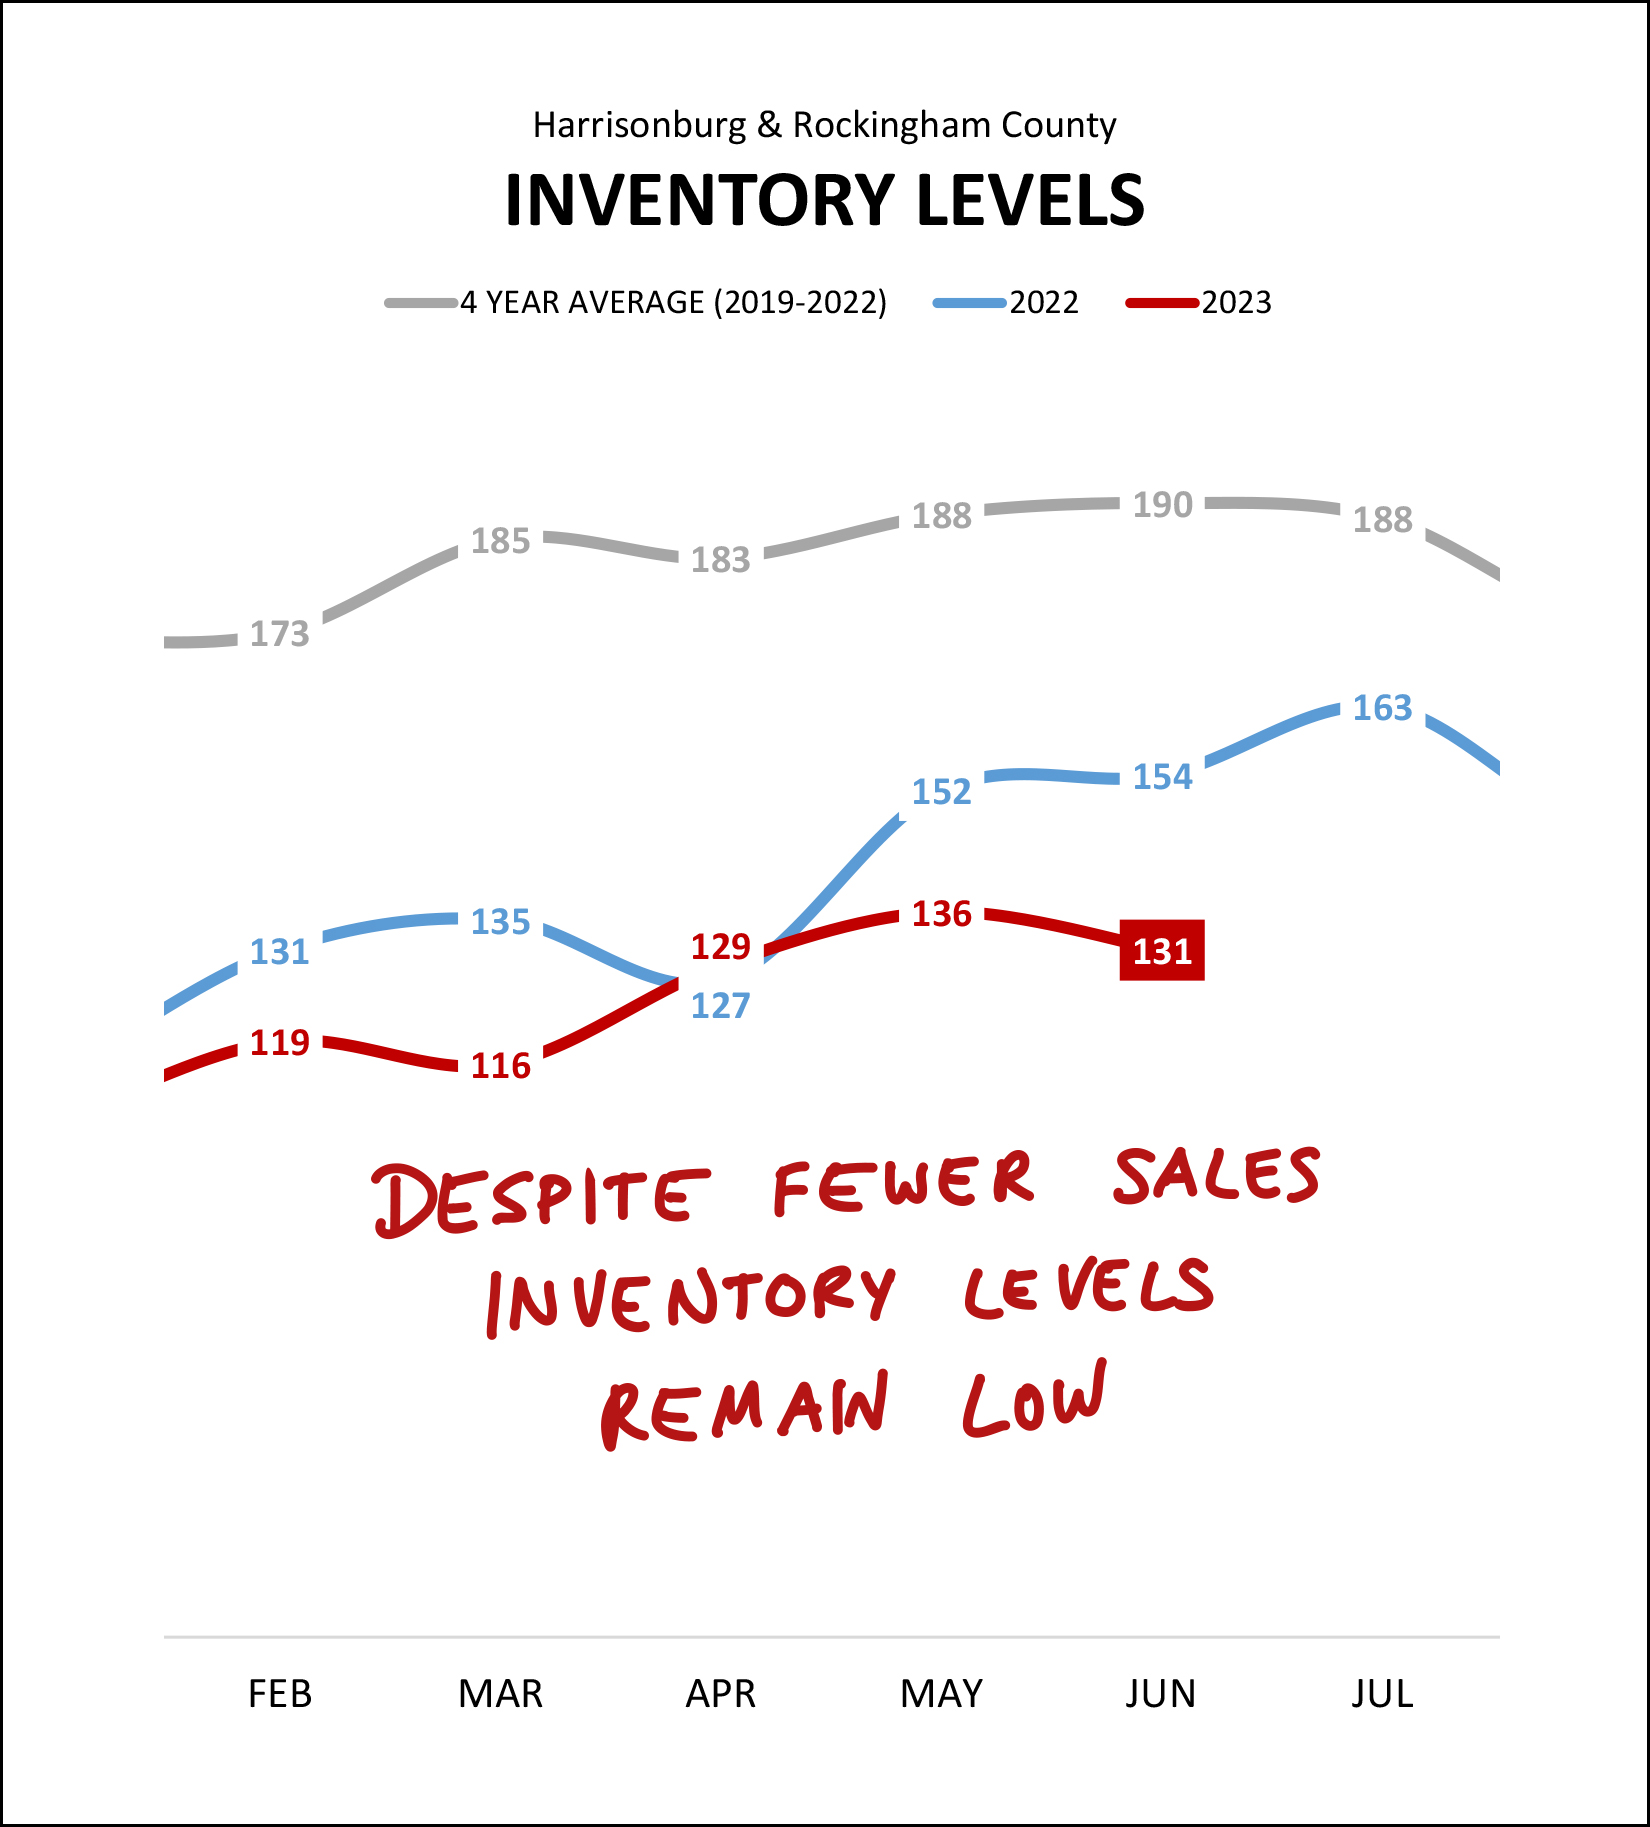 Over the past four years (grey line above) we have seen an average of 180 to 190 homes for sale as we have rolled through March, April, May and June. This year (red line above) we have seen between 116 and 136 homes for sale during those same months. Inventory levels are remaining low despite far fewer home sales. This is the data point (alongside continued increases in the median sales price) that seems to rather clearly confirm that the decline in home sales is almost entirely related to fewer sellers selling -- and not fewer buyers wanting to buy. Across many (though not all) price ranges and property types, home buyers keep snatching up most new listings that come on the market -- which is keeping inventory levels quite low. How quickly are those new listings getting snatched up, you might ask? That is most readily measured via the "days on market" metric... 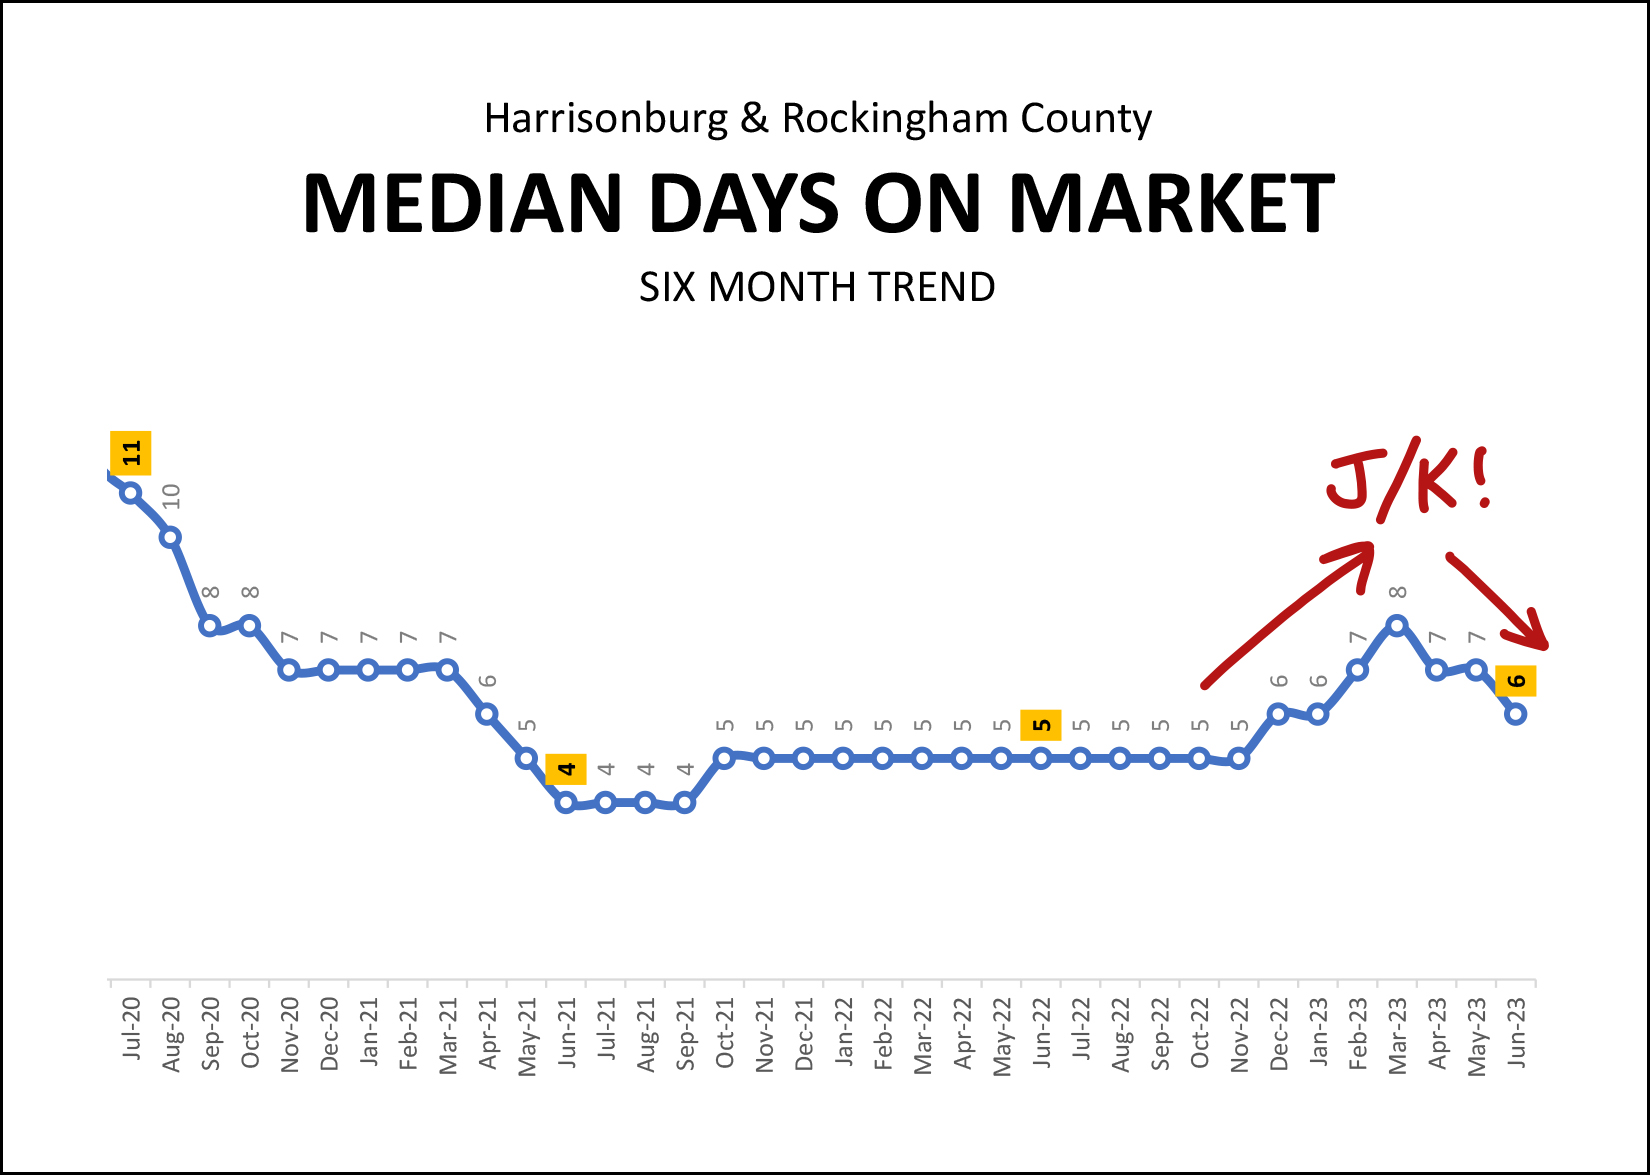 The graph above tracks the median "days on market" metric -- looking at six months of data at a time. As such, the most recent data point of a median of six days on the market is based on January 2023 through June 2023 home sales. After dropping, dropping, dropping to a median of only four days on the market in mid-2021, we saw a steady report of a median of five days on the market all the way through the end of 2022. But then, it seemed that things might be changing as the median days on market crept up to eight days on the market in early 2023. But... maybe not, after all... as median days on market has shifted back down to only six days over the past few months. If we ever see a significant shift in market balance -- with more sellers trying to sell than there are buyers to buy -- we are likely see that reflected in this median days on market metric. As is likely evident from the graph above, we're not seeing that type of market shift right now, despite far fewer homes selling this year than last. Finally, how about those mortgage interest rates. :-/ 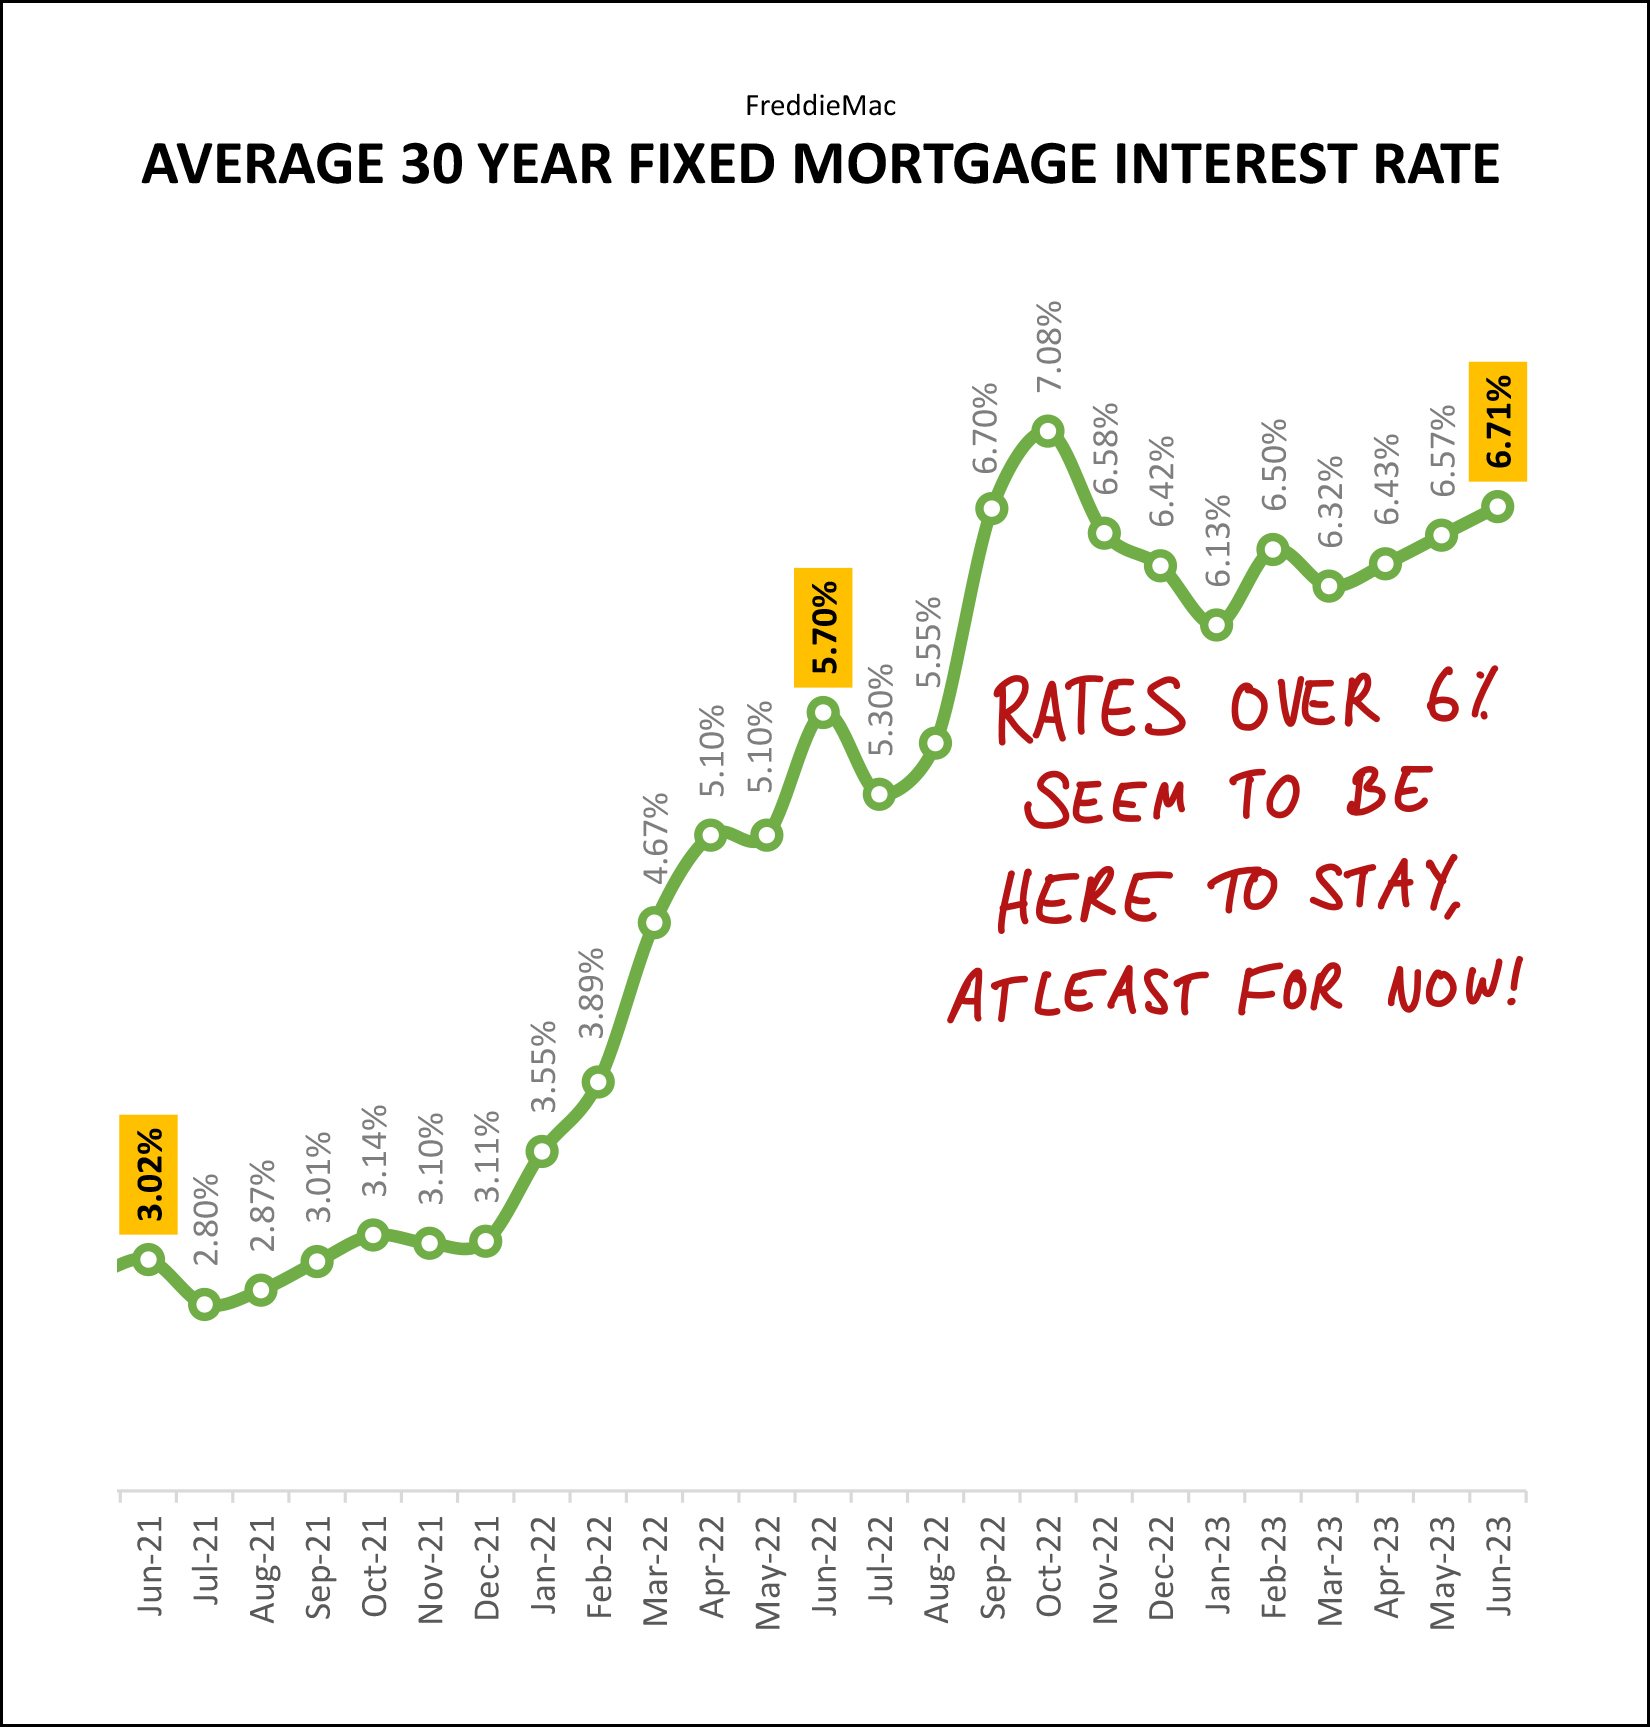 Please only looking briefly (and wistfully) at that 3.02% rate from two years ago... and then focus more on the past year. We have seen relatively volatile mortgage interest rates over the past year -- starting at 5.7%, ending at 6.7%, drifting as high as 7.1% and as low as 6.1%. It seems likely that we will continue to see mortgage interest rates over 6% for the balance of 2023... though home buyers would certainly love to see that be closer to the 6.31% seen in January rather than the 6.7% at the end of June or the 6.96% seen this week. Having sifted through all of the data above, what does it all mean for current home sellers and would be home buyers? Home sellers are likely to still do quite well in the current market, as the median sales price keeps rising and inventory levels (your competition) remain quite low. Home buyers are likely to continue to have difficulty securing a contract on a home as we move through 2023 due to fewer sellers selling, homes still going under contract very quickly, and likely competition from other buyers for many new listings. If you are planning to sell your home, or buy a home, in the coming months I would be happy to chat with you about how your segment of the local housing market (based on location property type and/or price) is performing as it compares to the overall market. Feel free to reach out to me if I can be of any assistance to you as you make plans to buy or sell. You can reach me most easily at 540-578-0102 (call/text) or by email here. Until next month, I hope you find some time to disconnect and enjoy the summer season with your family, friends and loved ones... and if you need me to drive the boat while you water ski... just let me know... ;-) | |
Contract Activity In June 2023 Was The Slowest It Has Been In A Decade, Much To The Dismay Of Would Be Home Buyers |
|
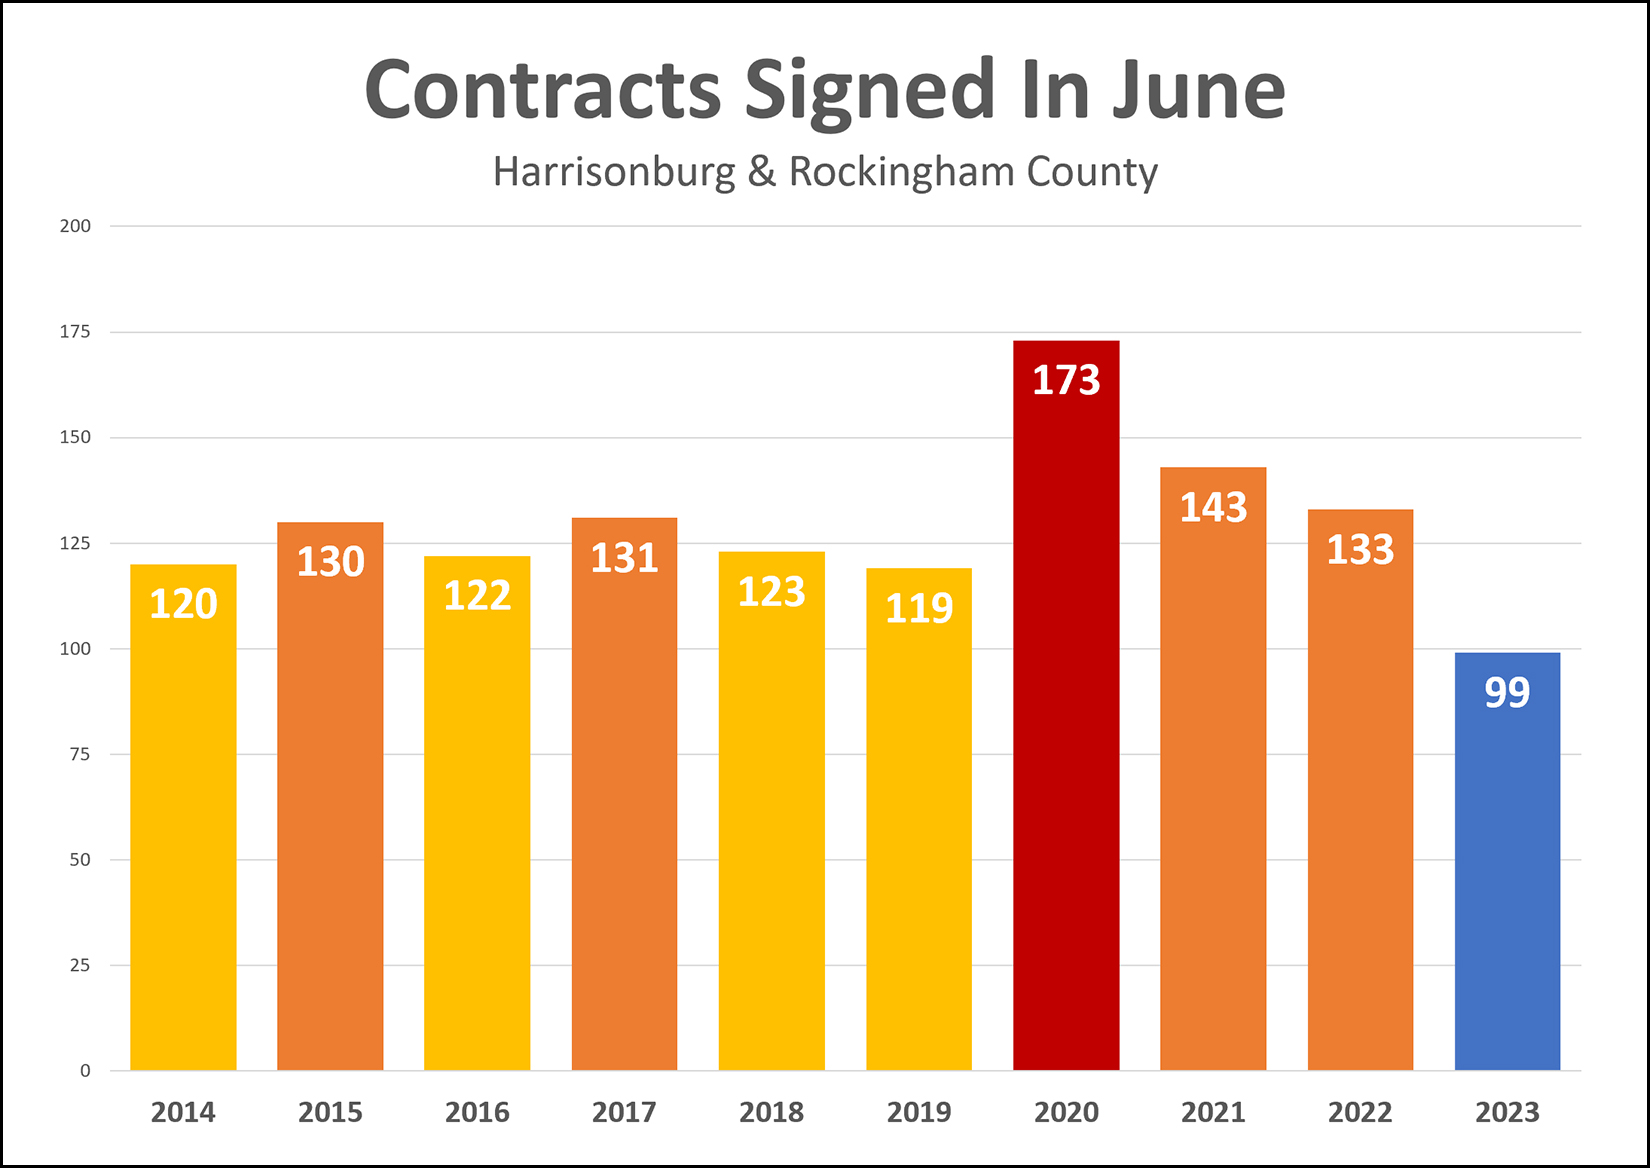 It remains a tough time to buy a home in many or most price ranges and locations -- with limited resale inventory leading to continued low levels of contract activity. As shown above, the 99 contracts that were signed in Harrisonburg and Rockingham County in June 2023 was the lowest number of contracts signed in a month of June for the past decade. At first glance some might assume that the low number of signed contracts is an indication that fewer buyers want to buy homes right now -- but with inventory levels starting the month low and ending the month low -- the bottleneck seems to be almost entirely on the supply side of the equation. There aren't enough sellers willing to sell their homes. Getting into the details of new homes versus resale homes for a moment, let's take a look at the highest and lowest data points... June 2020 = 124 resale homes + 49 new homes = 173 total contracts June 2023 = 73 resale homes + 26 new homes = 99 contracts So, if we take out new homes, not only did only 73 buyers sign contracts to buy home in June 2023 compared to 124 in June 2020... only 73 sellers were willing to sell their homes in June 2023 as compared to 124 in June 2020. I don't expect we'll see much of an increase in resale homes being listed for sale as we continue through 2023, so any upside potential for increased contract activity likely lies on the new home side of the equation. If you were one of the 99 buyers to secure a contract to buy a home in June 2023... congrats! | |
Contract Activity In The First Half Of 2023 Was... Rather Slow |
|
 It's the last day of the first half of the year! Wow! As such, I've taken a moment to look at contract activity in the first half of 2023 as compared to the first half of each of the nine years prior to 2023. As you can see, above, contract activity (buyers and sellers signing contracts) has been quite slow this year compared to every other year since 2014. Will we see contract activity ramp up in the second half of 2023? Maybe. But it will have to start with sellers being willing to sell. There are plenty of buyers ready to buy -- but not quite as many sellers willing to sell. | |
Homes Still Selling Quickly, At Record High Prices, Despite Decline In Total Home Sales |
|
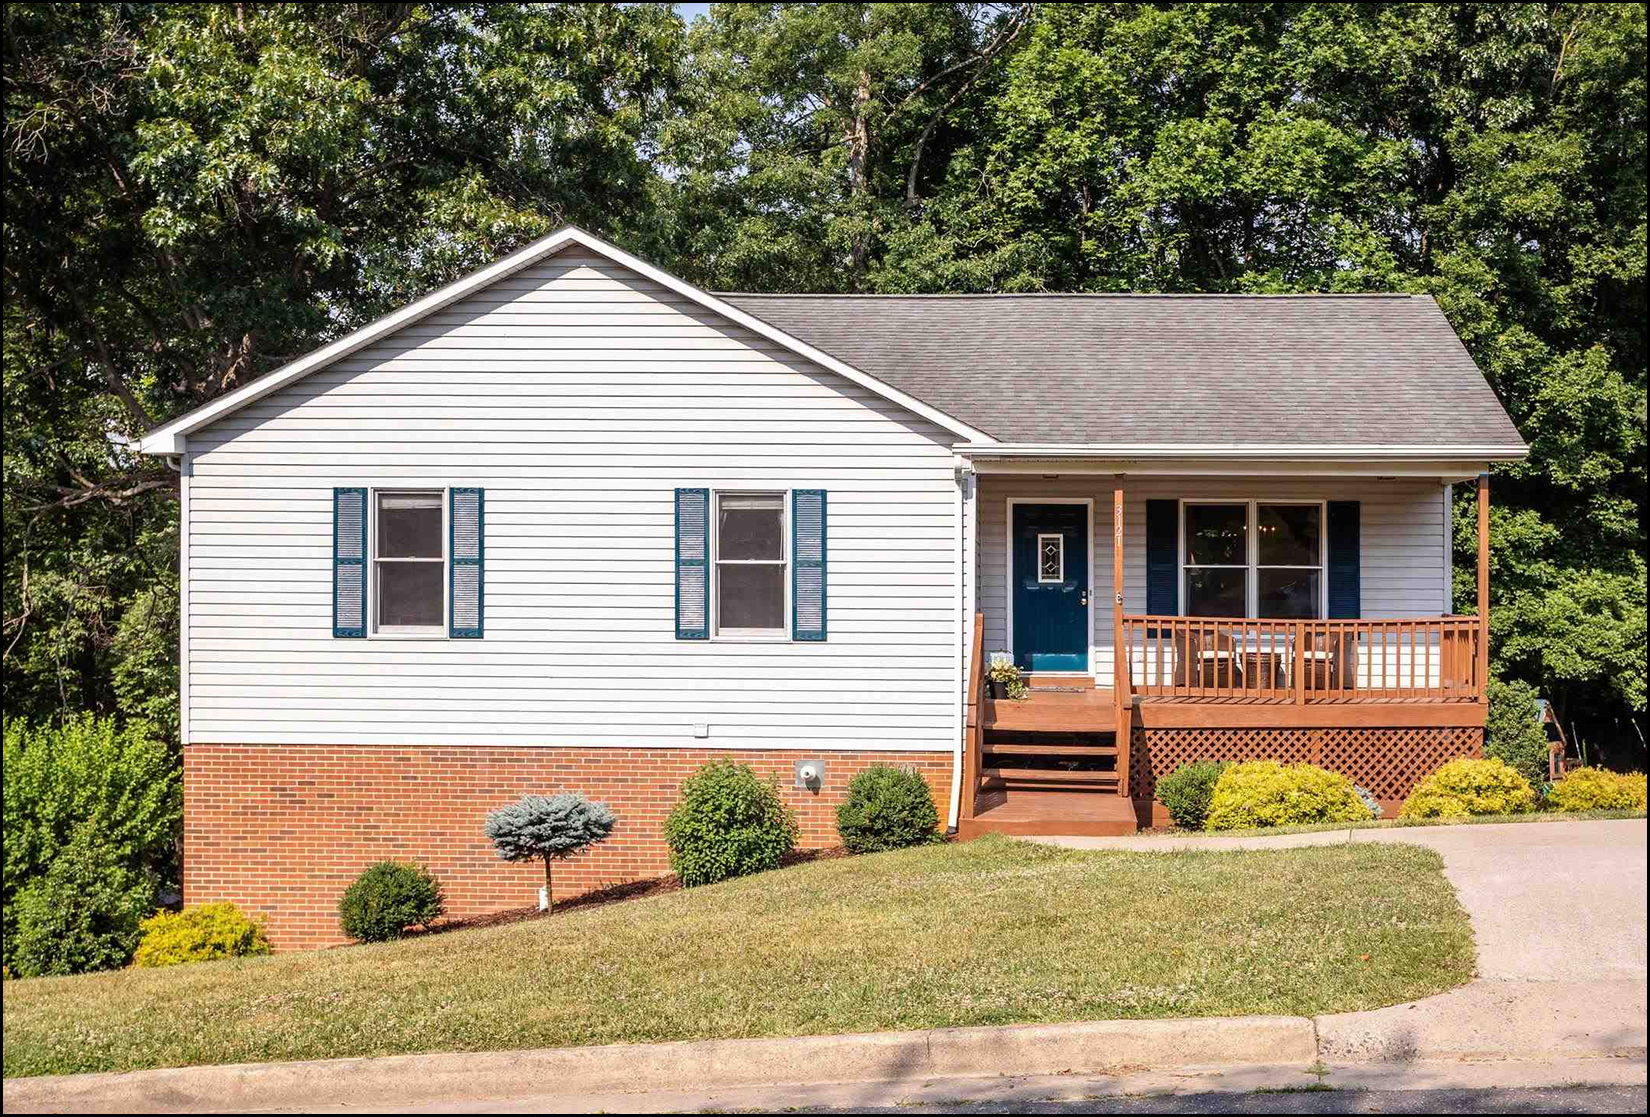
 Happy Monday morning, friends! They say summer doesn't start until June 21st, but the 85 degree temps yesterday certainly felt like summer. Regardless of the formal start of the season of summer, most students have finished out their school year now, which also certainly makes it feel like summer. One such student who finished up his school year is this guy, below. Luke has now officially graduated from high school! :-) We are delighted for his accomplishment of this major milestone, and are excited for all that lies ahead. And yes, Emily also finished up 9th grade! These kids they sure do grow up quickly! 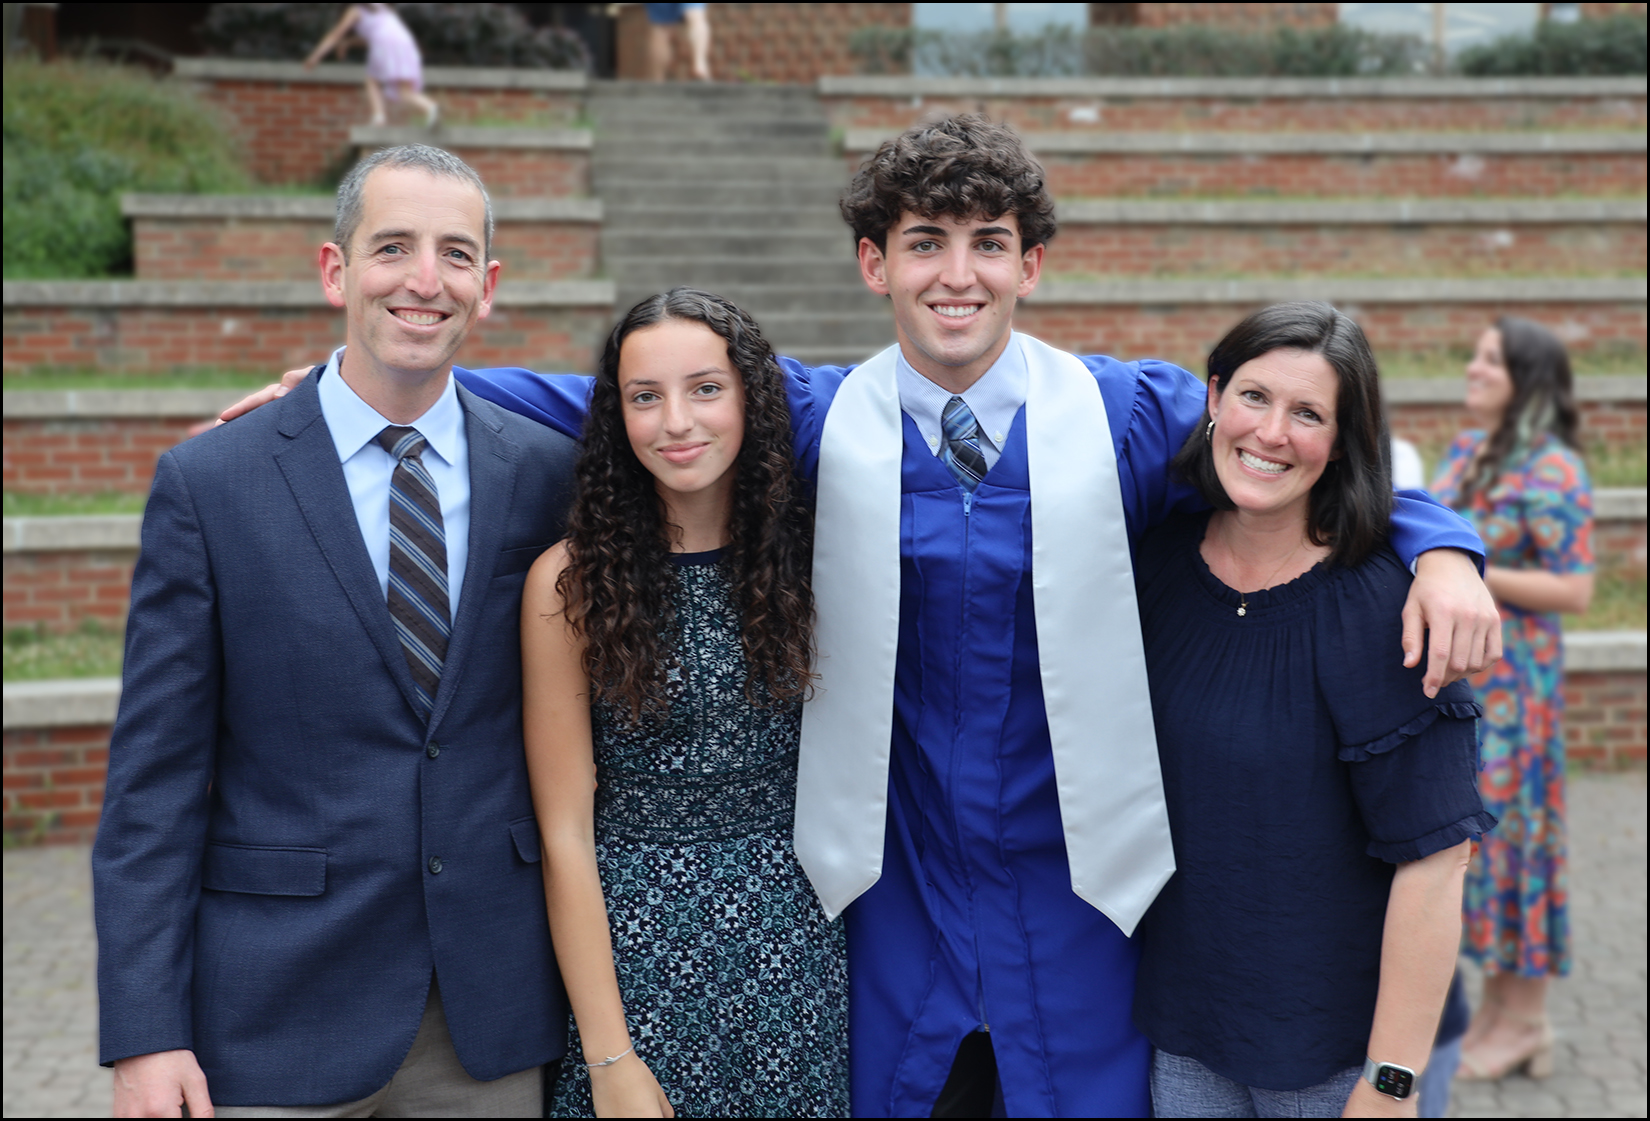 Looking for a new (to you) house this summer? Look no further than this brand new listing (just listed this morning) in the City of Harrisonburg... Find out more about this spacious four bedroom City home on a large lot by visiting 3121HorseshoeLane.com. And finally, one last item of business before we get into the real estate data. Each month I offer a giveaway, of sorts, for readers of this market report, highlighting some of my favorite places, things or events in Harrisonburg. Recent highlights have included The Little Grill, Cuban Burger and Taste of India. This super relaxing and family friendly music festival from June 23 - 25 at Natural Chimneys Park in Mt Solon features wonderful music (on multiple stages throughout the weekend), great food, lots of activities (hiking, biking, running, yoga, kids events), and all around great fun with family and friends. Have you considered going to Red Wing but haven't been yet? Maybe this summer is the time for you to make it one of your favorite family traditions. I am looking forward to being there with my family and I'm hoping you'll join in on the fun... from June 23rd through 25th. If you're interested in going to Red Wing but don't have tickets... I'm giving away a pair of three-day general admission tickets. Click here to enter to win the tickets... I'll pick a winner later this week. Now, on to the real estate data... 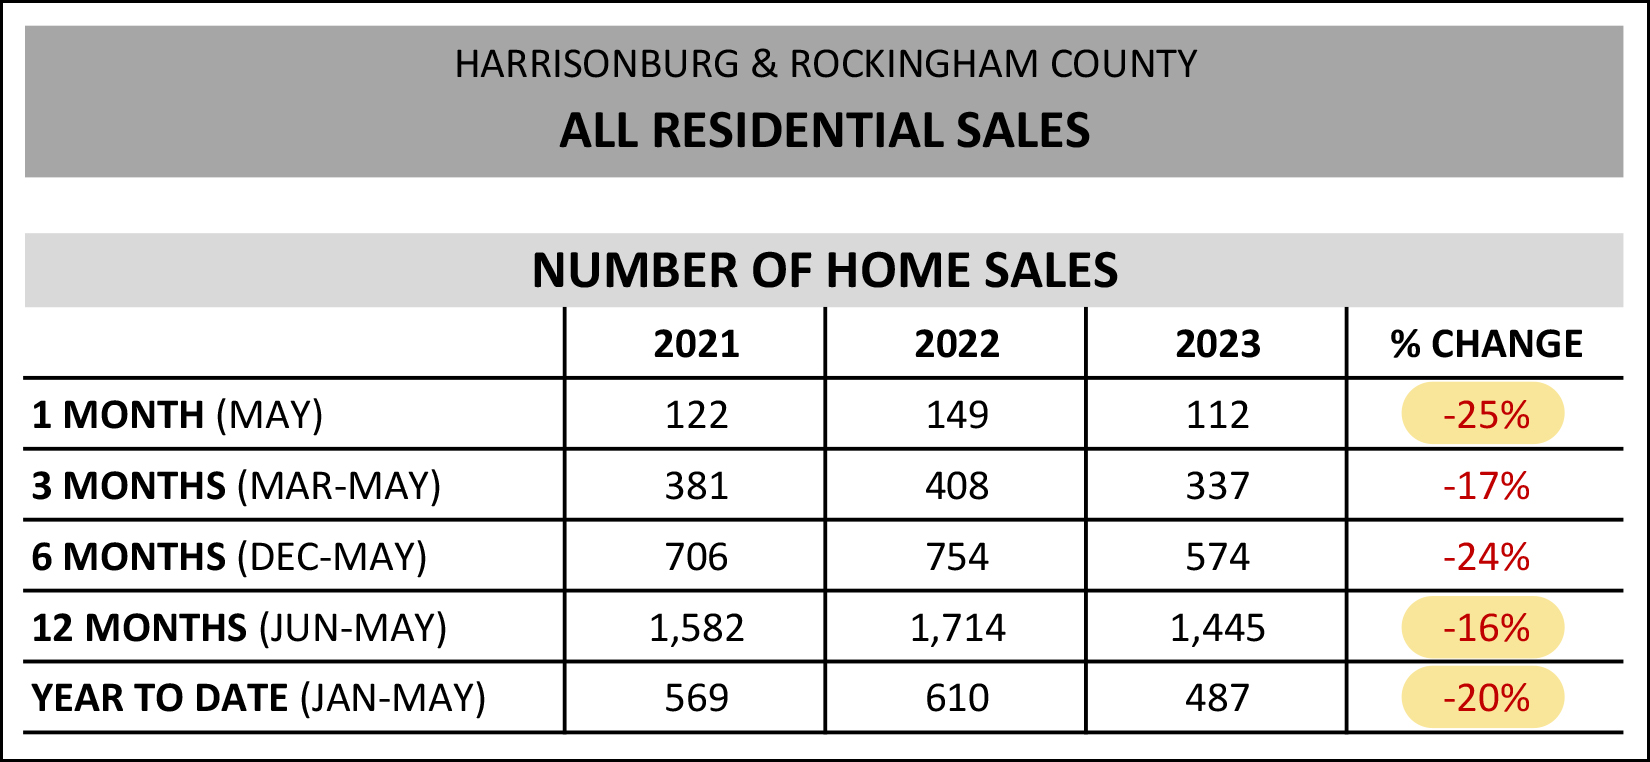 As mentioned in the headline, and as shown above, we're seeing far fewer home sales this year than last... [1] This past May (last month) we saw 112 home sales in Harrisonburg and Rockingham County, which marks a 25% decline from last May. [2] When looking at the first five months of this year, there has been a 20% decline in home sales compared to last year during the same (Jan-May) timeframe. [3] When looking at a full year of data (June - May) the number of homes selling in our area has declined 16%. A year ago we were seeing an annual pace of 1,714 home sales... and that metric has now declined to an annual pace of 1,445 home sales! But... fewer home sales has not resulted in lower sales prices... 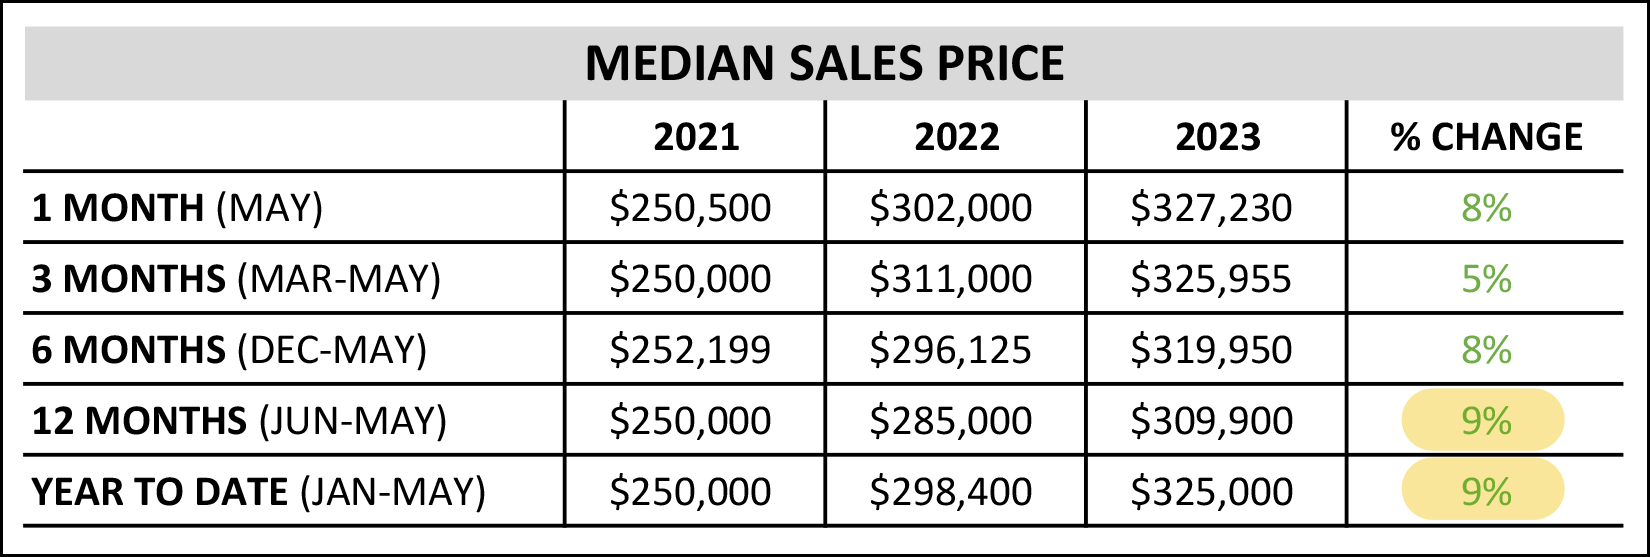 As home sales have started to decline, some folks speculated that prices would also start to decline. That hasn't been the case, and I believe it's because the decline in sales is a supply side issue, not a demand side issue. There seem to be plenty of buyers still wanting to buy... but fewer sellers willing to sell. We need both a buyer and seller in order for a home sale to happen... so fewer sellers results in fewer home sales... but the continued ready supply of buyers is keeping competition fierce for most new listings, which is causing home prices to keep on rising. As shown above, the median sales price thus far in 2023 ($325,000) is 9% higher than it was a year ago ($298,400) and when we look at 12 months of data (June - May) we also see a 9% increase in the median sales price over the past year. I should point out that each month I prepare many more charges and graphs than make it into this report. You can also view those over at HarrisonburgHousingMarket.com including this month's charts and graphs here. One of the data subsets I dive into in the extra charts and graphs at the link above is the breakdown of new home sales vs. existing home sales... 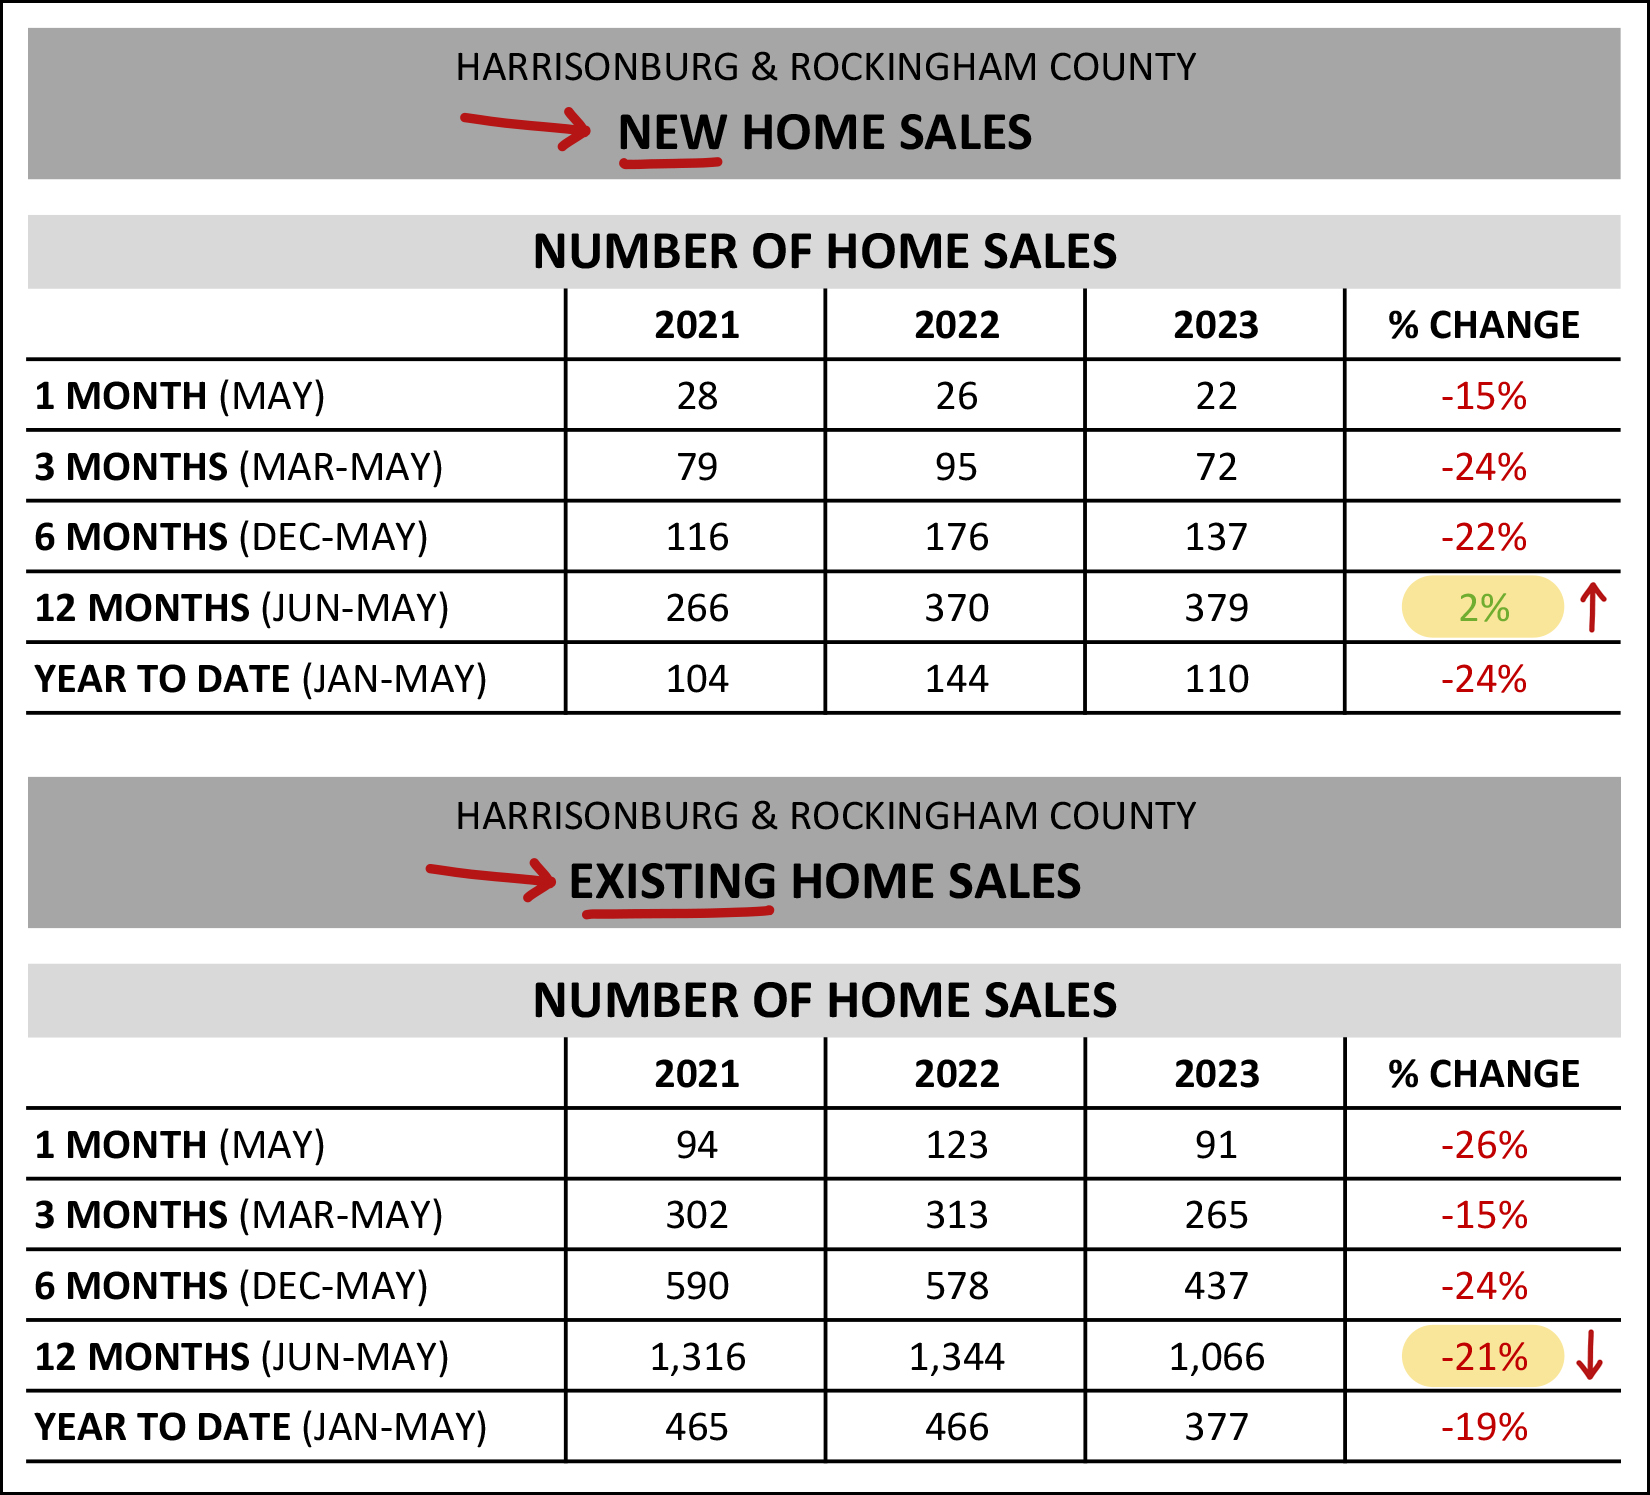 As shown above, when we look at the past 12 months we see slightly different trajectories when it comes to new vs. resale homes... [1] There have been 2% more new home sales over the past 12 months as compared to the previous 12 months. [2] There have been 21% fewer existing home sales over the past 12 months as compared to the previous 12 months. Certainly, when we look at other timeframes above, we see declines in sales activity of both new and existing home sales, but it's worth nothing that a significant cause of fewer home sales in our market... is a lower number of homeowners who are willing to sell their existing (resale) homes. Why, might you ask? Mortgage interest rates are likely a key piece of the puzzle. Most homeowners have current mortgage interest rates under 5%, and many under 4%... compared to current mortgage interest rates that are above 6%. As such, the difference in mortgage payments is quite significant for a homeowner who would sell their home and pay off a mortgage with an interest rate under 4% (for example) to then take out a mortgage with an interest rate above 6%. I expect we will continue to see lower numbers of homeowners willing to sell their homes throughout the remainder of 2023. Getting into some visuals now, here's how slow May was... 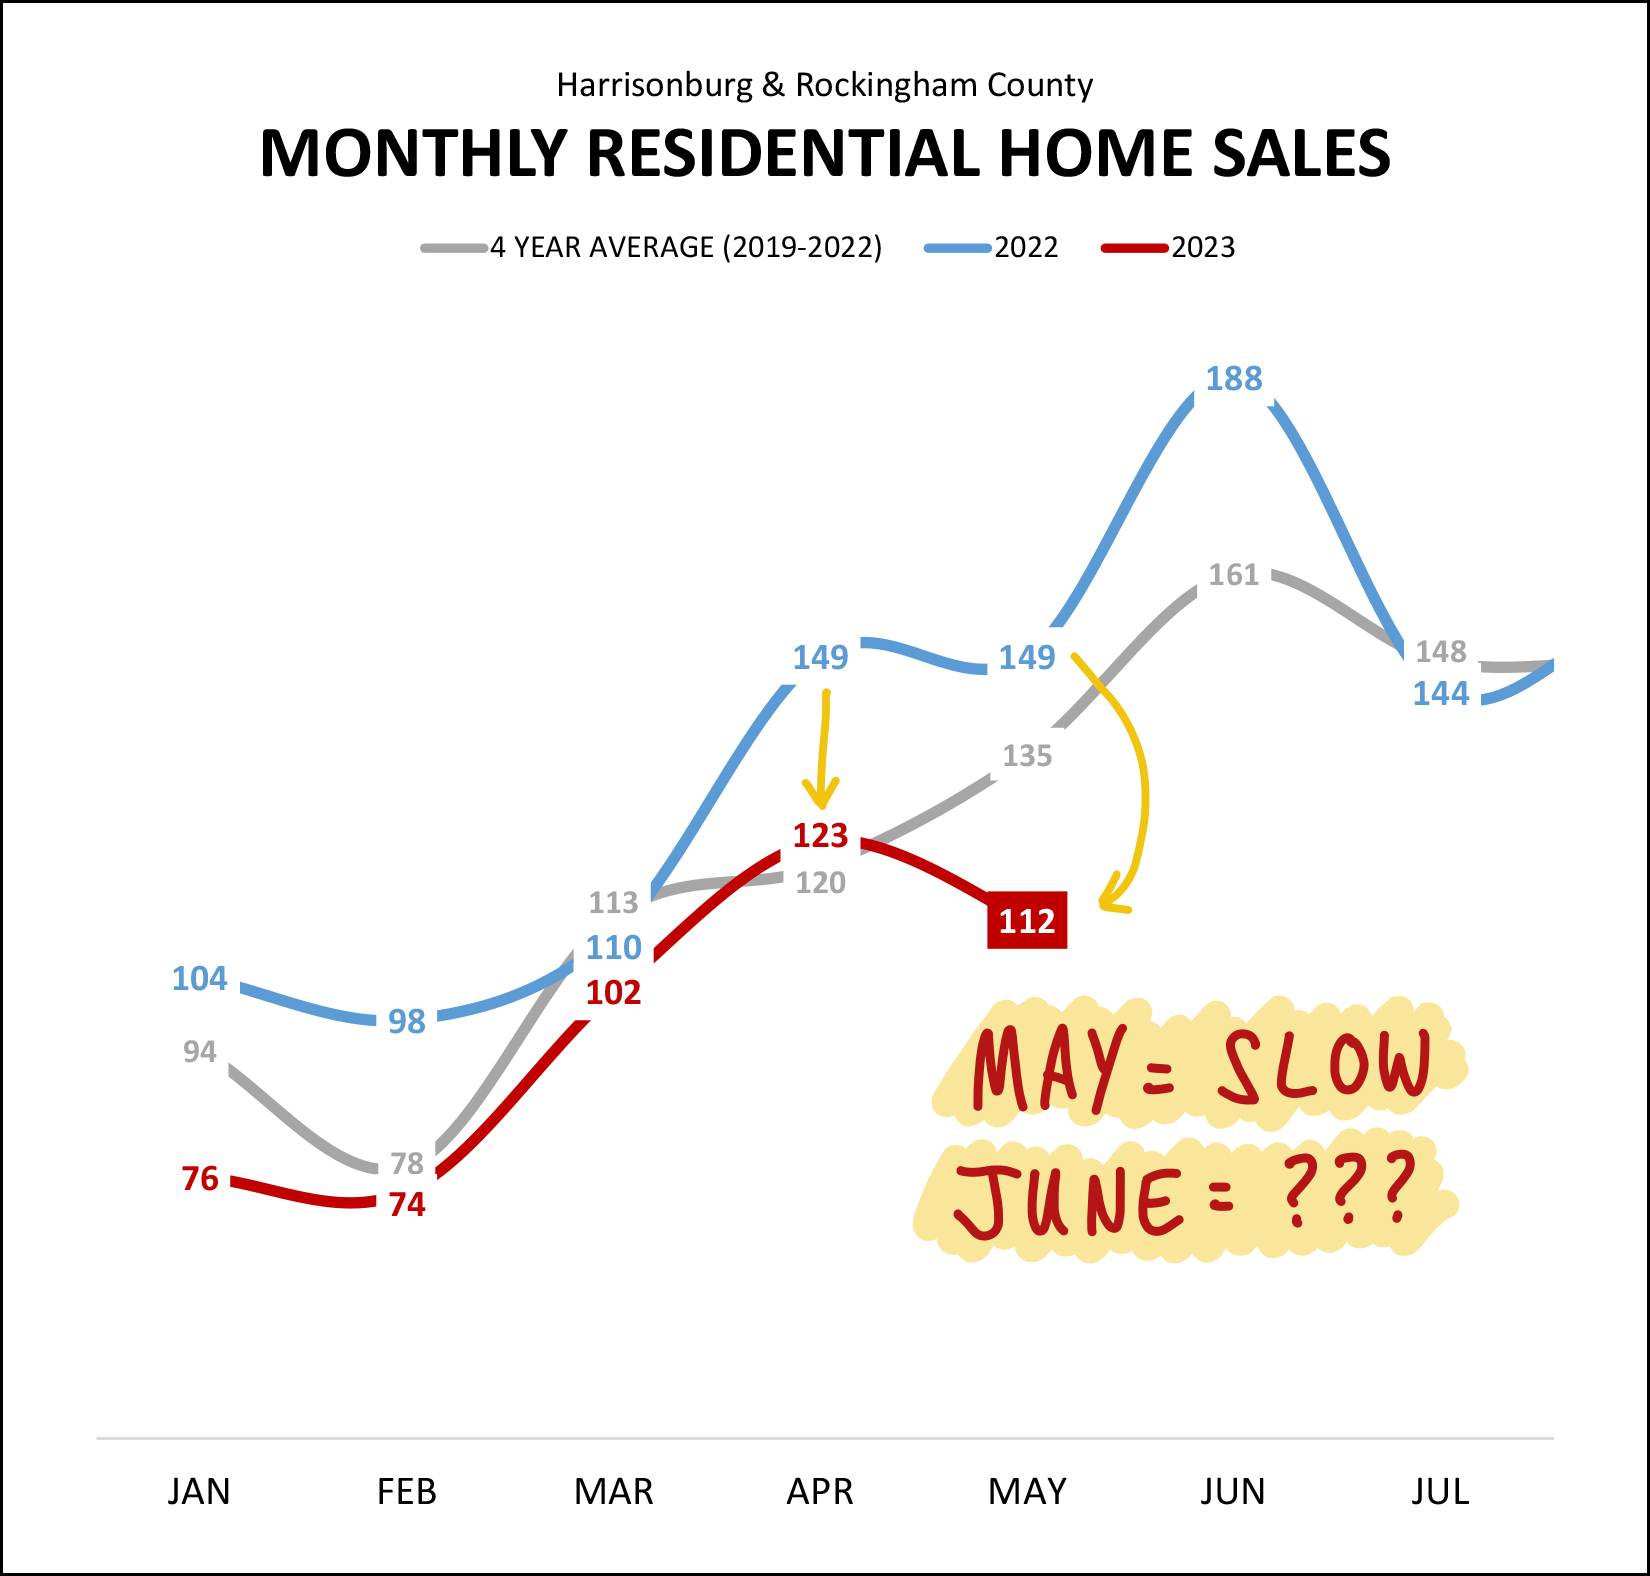 After a 17% decline in April home sales (149 to 123) we then saw a 25% decline in May sales (149 to 112) which is almost certainly going to result in an even larger decline in June home sales... since there were a LOT of sales in June last year. As I have already mentioned, sales prices keep on climbing, so a decline in the number of homes selling isn't really a concern for home sellers, or homeowners, but it is not as exciting of news for would-be home buyers. We are likely to continue to see fewer home sales throughout the remainder of 2023 in Harrisonburg and Rockingham County... and it will be a result of fewer homeowners being willing to sell... not a result of fewer would be home buyers being interested in buying. Here's another visual of the general trends we're seeing in our local housing market right now... 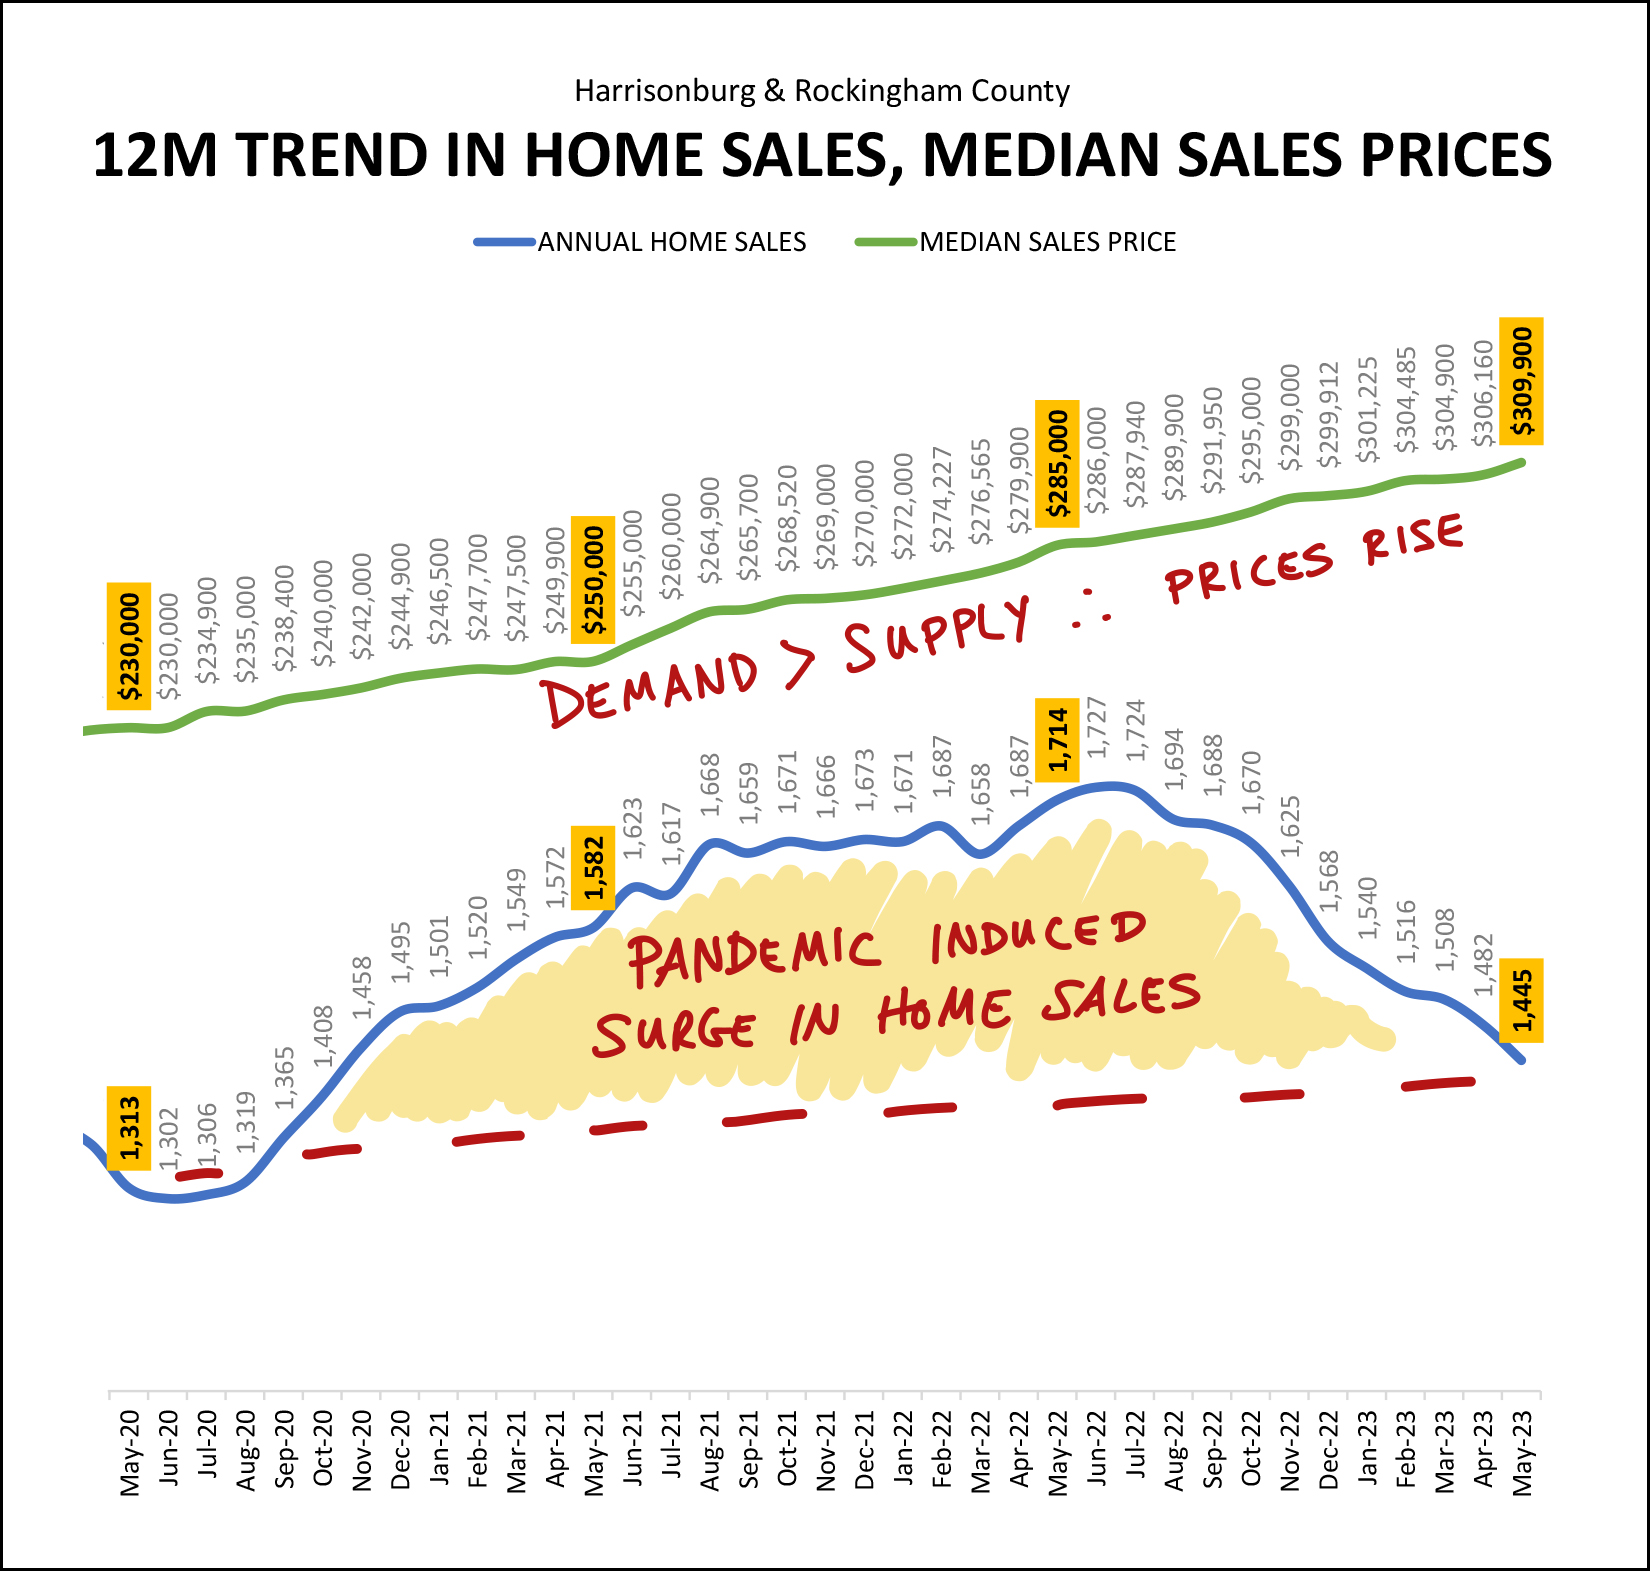 We're still seeing a general increase in the number of homes selling per year if we compared pre-pandemic (early 2020 and prior) and post-pandemic (2023) but we've seen a steady decline in annual home sales over the past year, from 1,714 sales/year to 1,445 sales/year. So, after a steady increase in home sales during the pandemic (largely brought on by the pandemic - with super low mortgage interest rates and everybody needing their home to serve more functions than before) we have now seen a steady decrease in home sales as the pandemic has come to a close. We're returning to where we were pre-pandemic as far as how many homes are selling a year... with the home sales trendline being dragged down by a limited number of home sellers being willing to sell. There seem to still be plenty of buyers ready and willing and able to buy. With continued high levels of demand, but lower levels of supply, we have continued to see steady increases in sales prices as shown by the top line. That trendline (rising prices) seems unlikely to change course significantly anytime in the near future. But even if we aren't likely to see home prices stop rising, or to see them decline, perhaps we'll see a slight tapering off of the surge in sales prices? 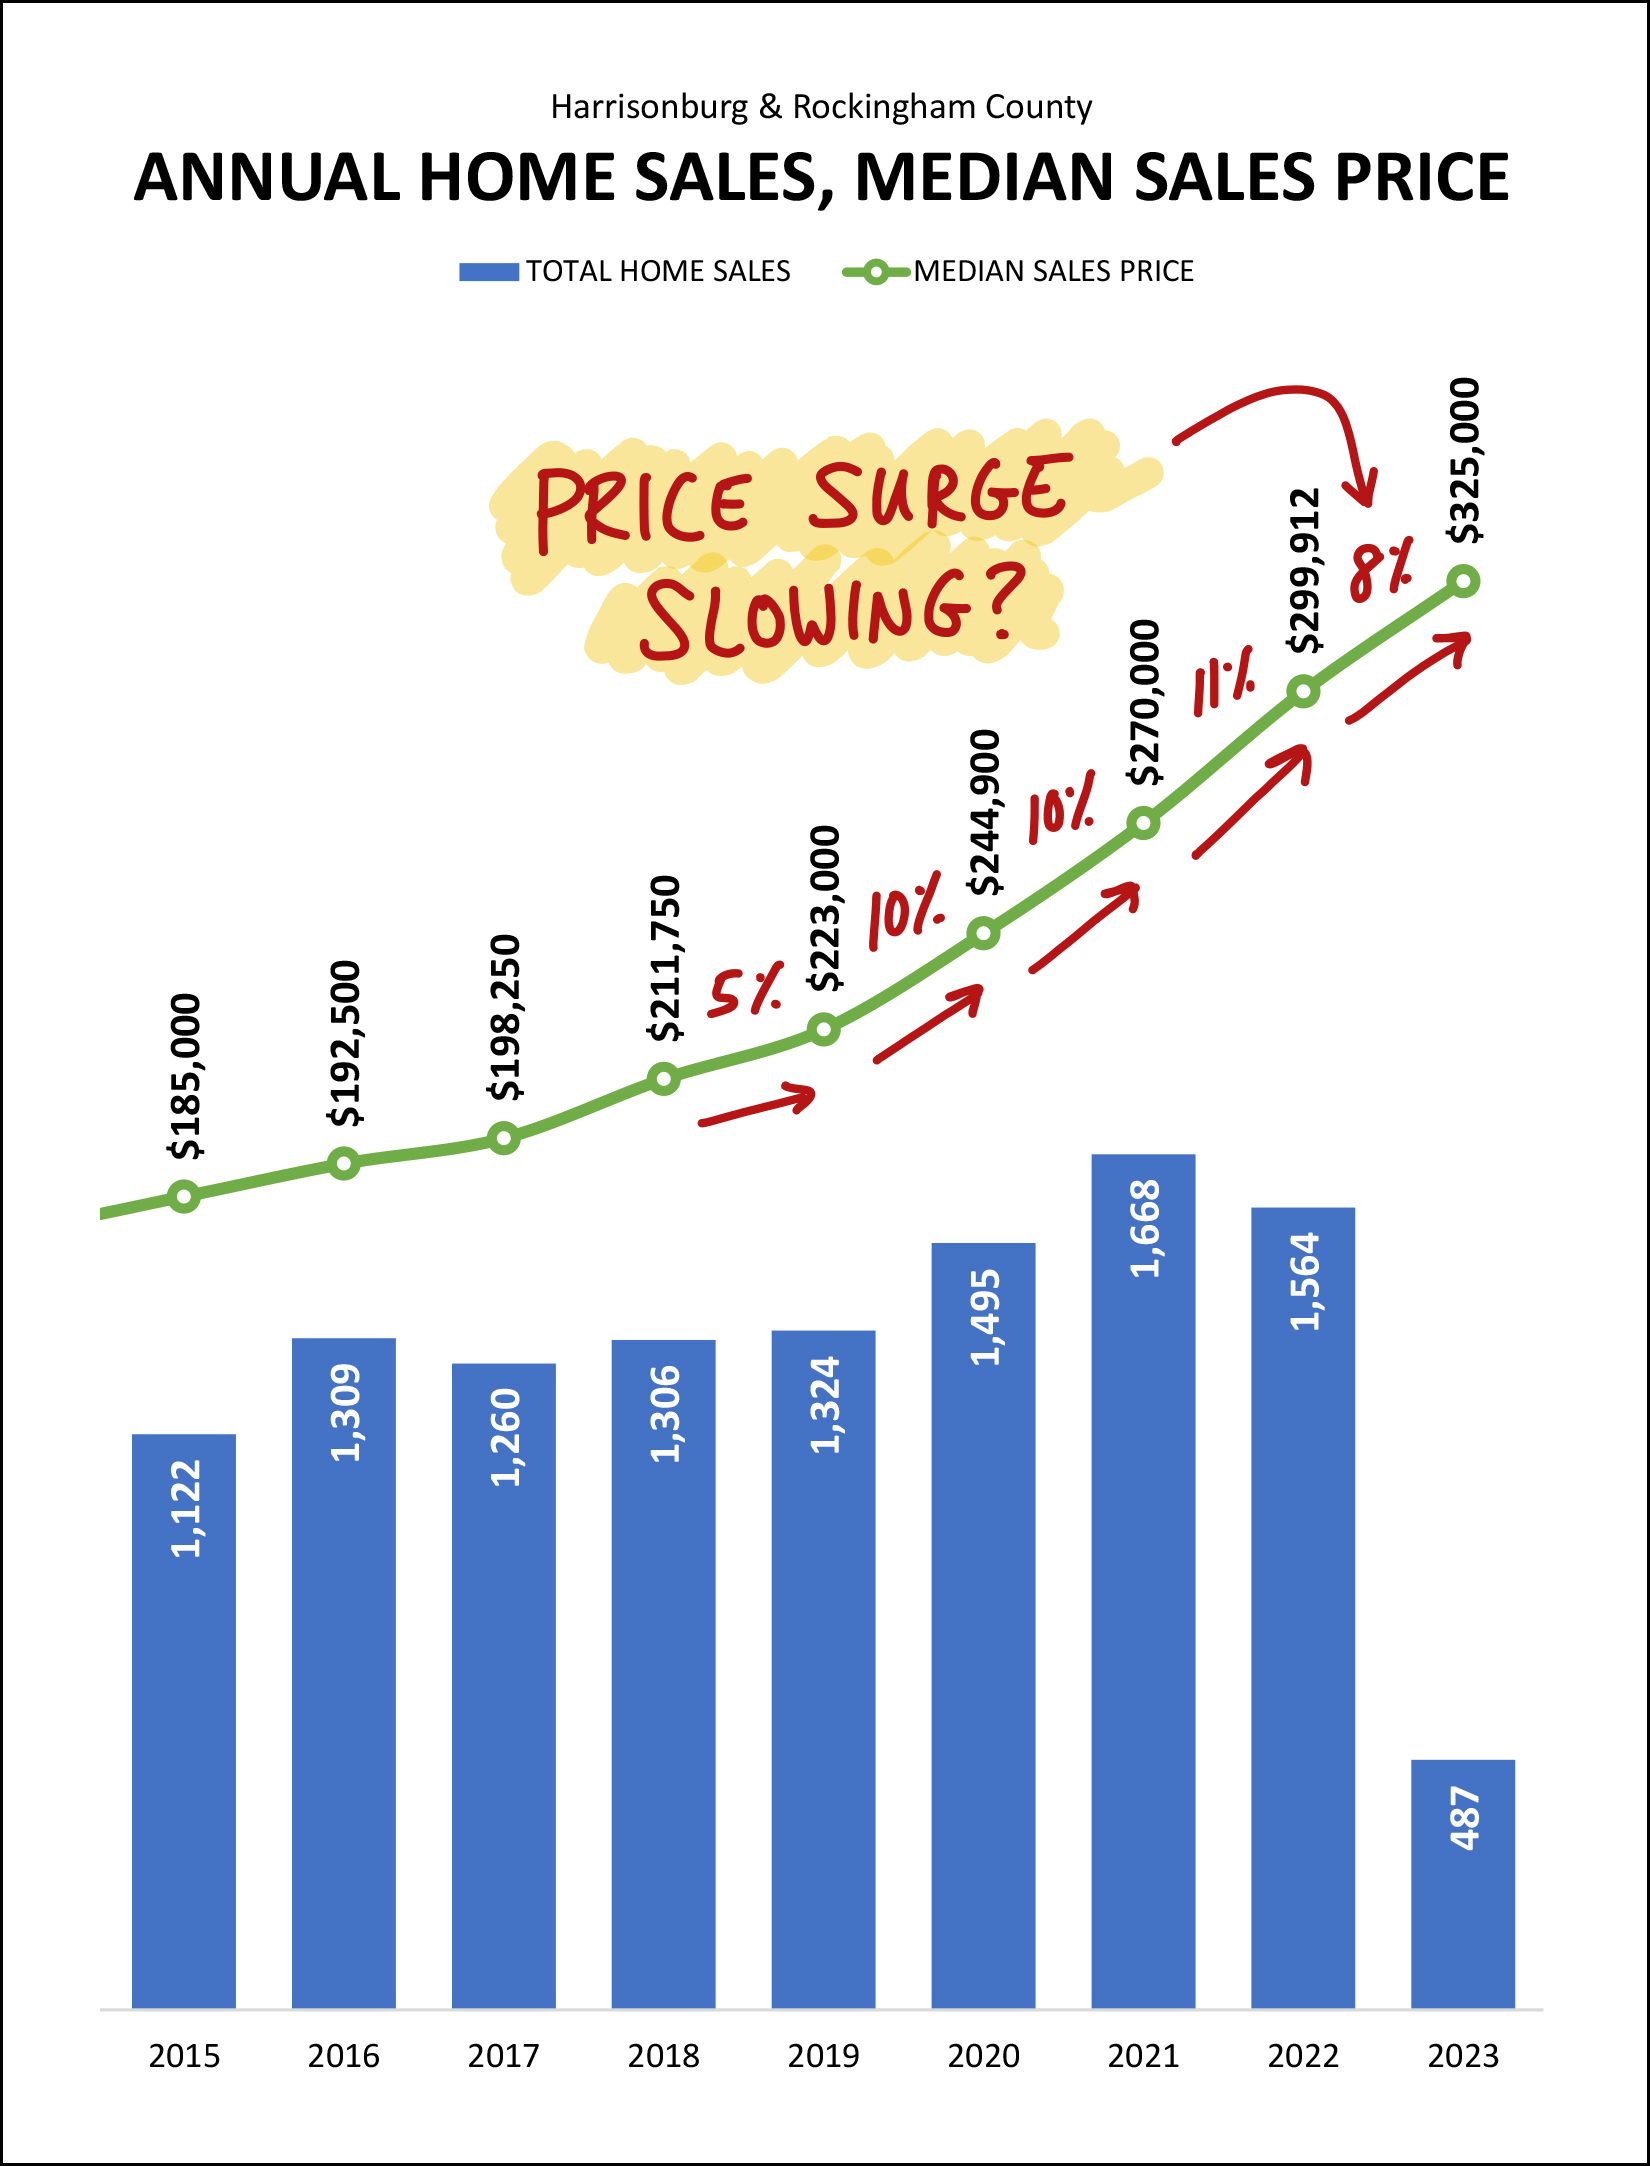 In the last full year before the pandemic (2019) we saw a 5% increase in the median sales price in Harrisonburg and Rockingham County. Then, we saw three years of double digit increases in the median sales price with a 10%, 10% and 11% increase in 2020, 2021 and 2022. Thus far in 2023, we are seeing a slightly smaller increase in that median sales price, with an 8% increase through the end of May. Of note... sales prices are not declining... they are just increasing slightly more slowly than they have over the past three years. Stay tuned to see how this metric does or does not continue to change as we move through the next few months. Looking ahead, though, contract activity is our best indication of what we are likely to see in the way of closed home sales over the next few months... 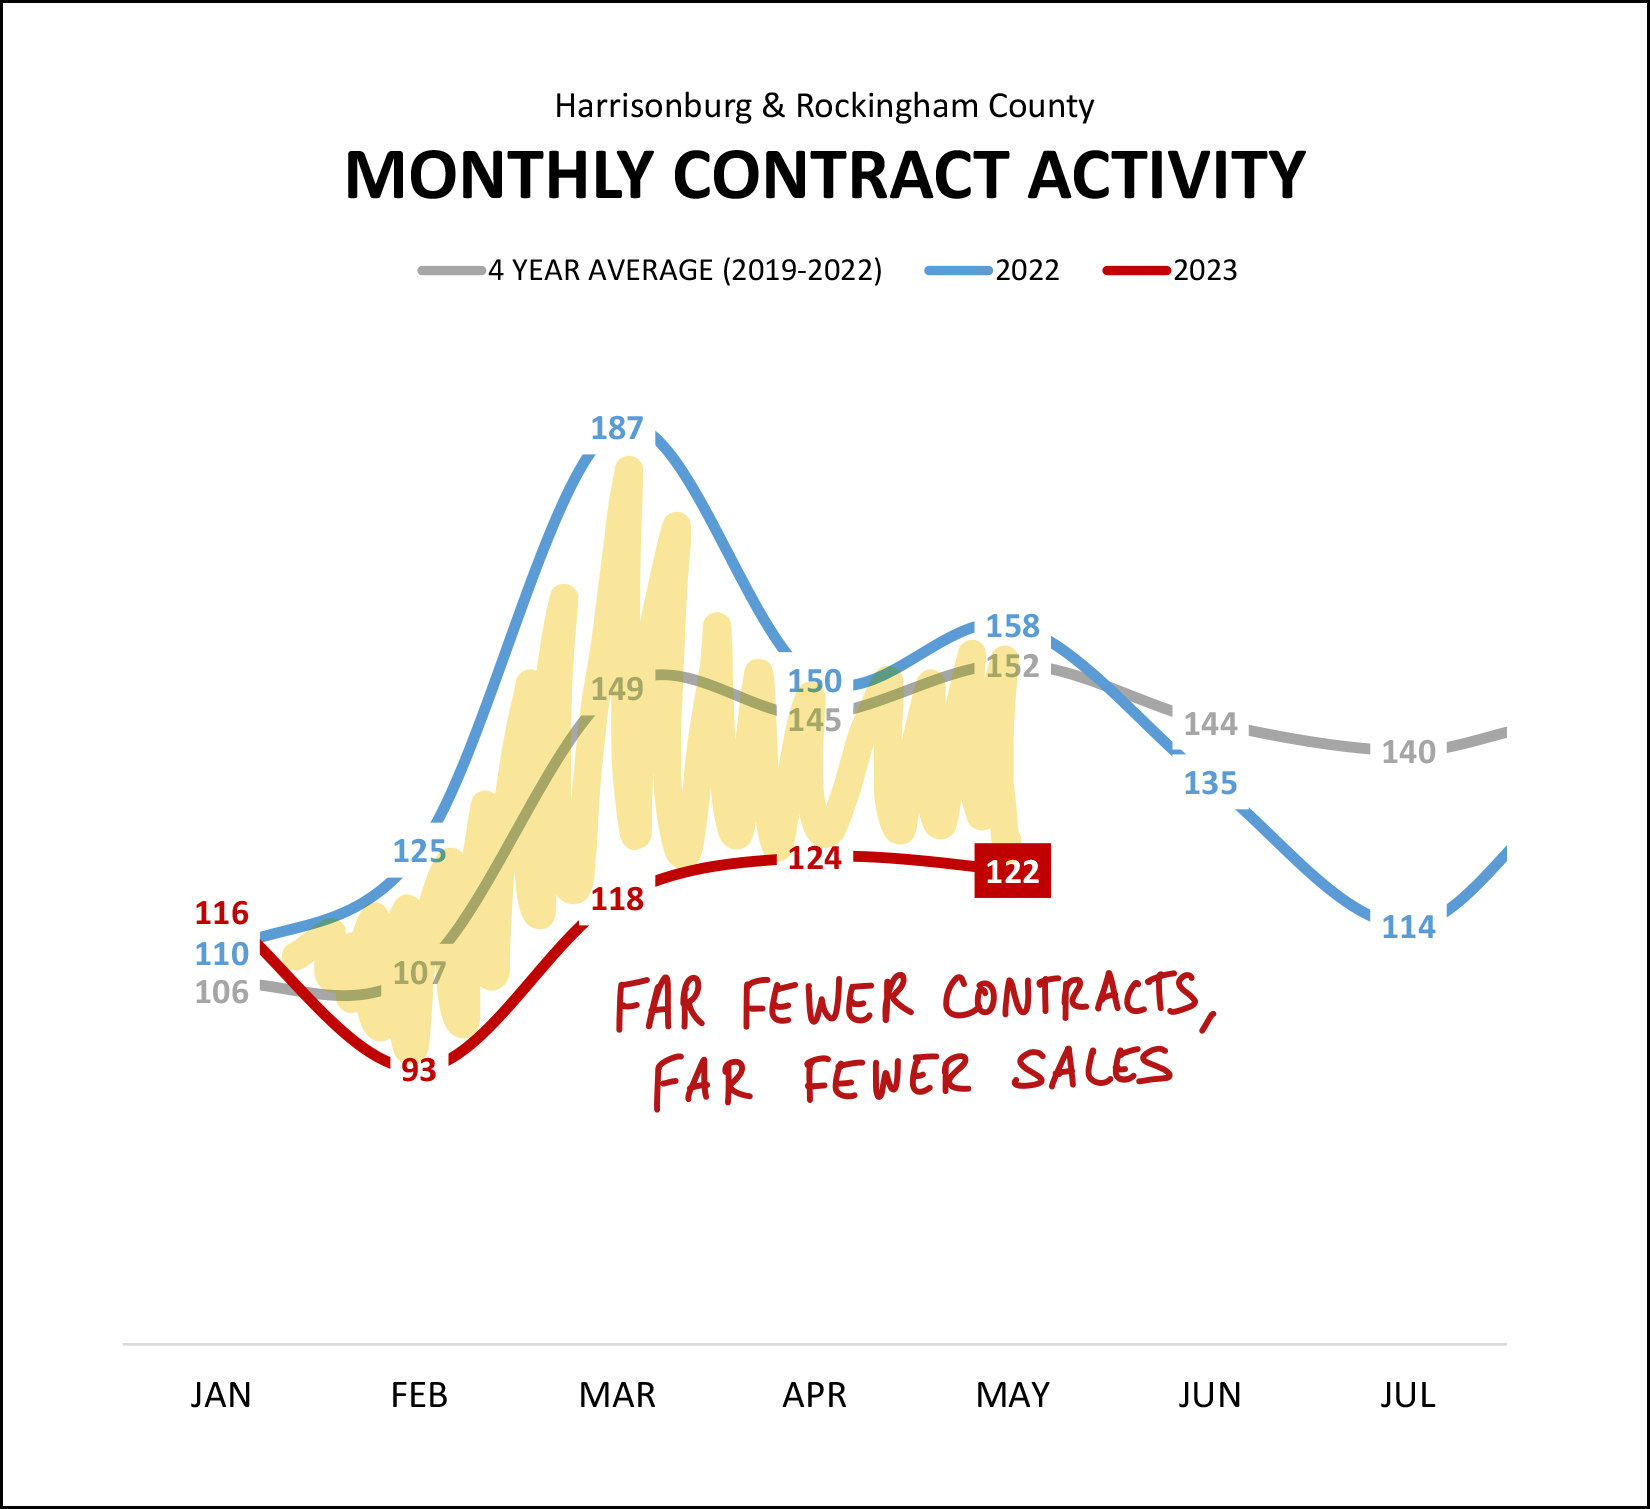 As you can see, we have now closed out the fourth month in a row of significantly lower levels of contract activity in Harrisonburg and Rockingham County. The red line is measuring contracts signed per month this year, and the blue line shows the same months last year. As such, we are likely to continue to see lower levels of closed sales over the next few months, given lower numbers of contracts being signed. And finally, here's a visual of the supply side of the market... 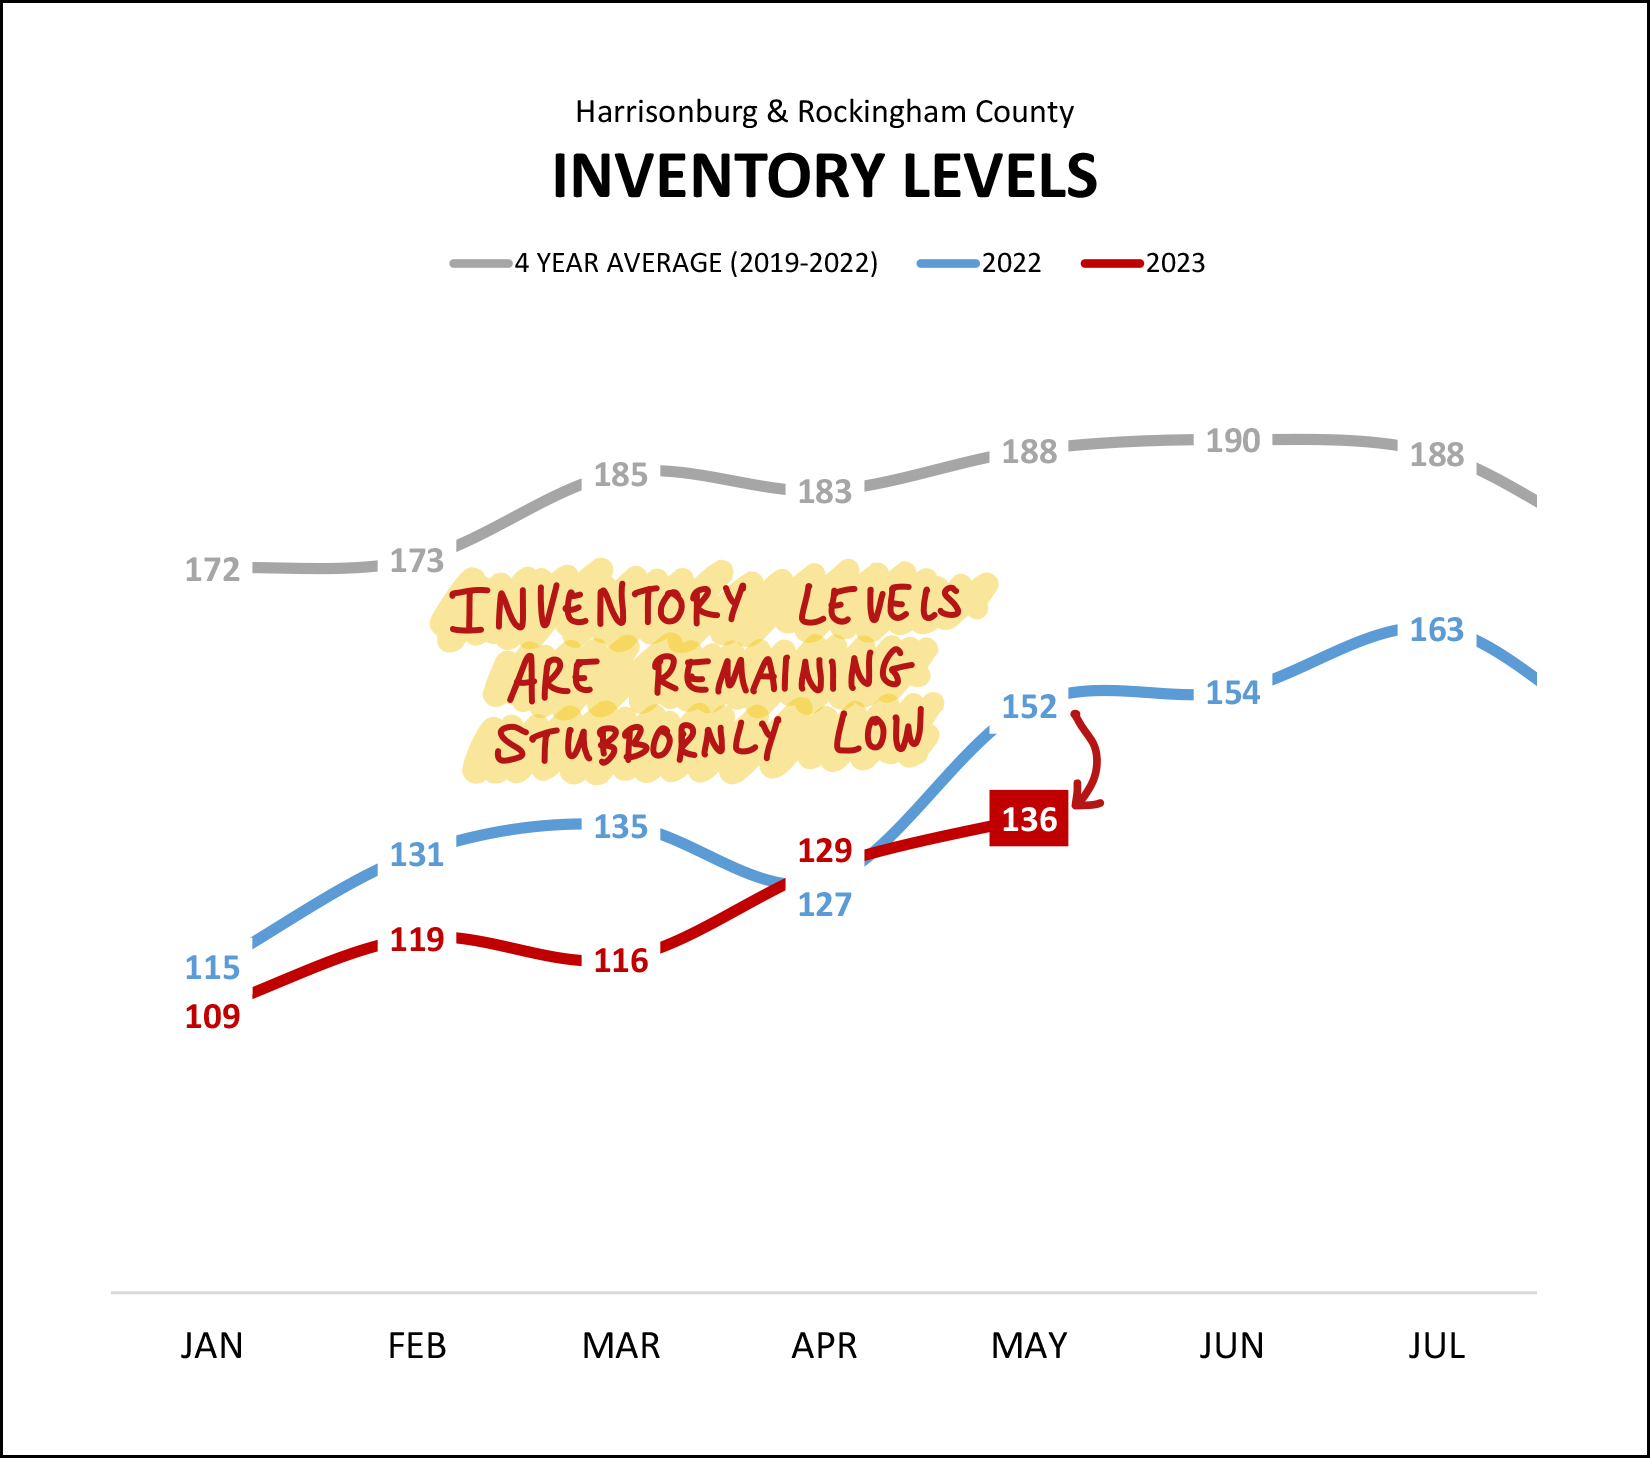 Despite 20% fewer home sales this year... inventory levels are lower than they were a year ago. The red line above shows inventory levels this year, compared to last year in blue. If we were seeing a shift in the market, with demand softening, we would start to see inventory levels increasing. We're just not seeing that. As such, the 20% decline in home sales seems almost certainly to be a result of an insufficient number of homes being available for buyers to buy. Now, for all the stats folks out there, here's the statistic that could be the most misleading... 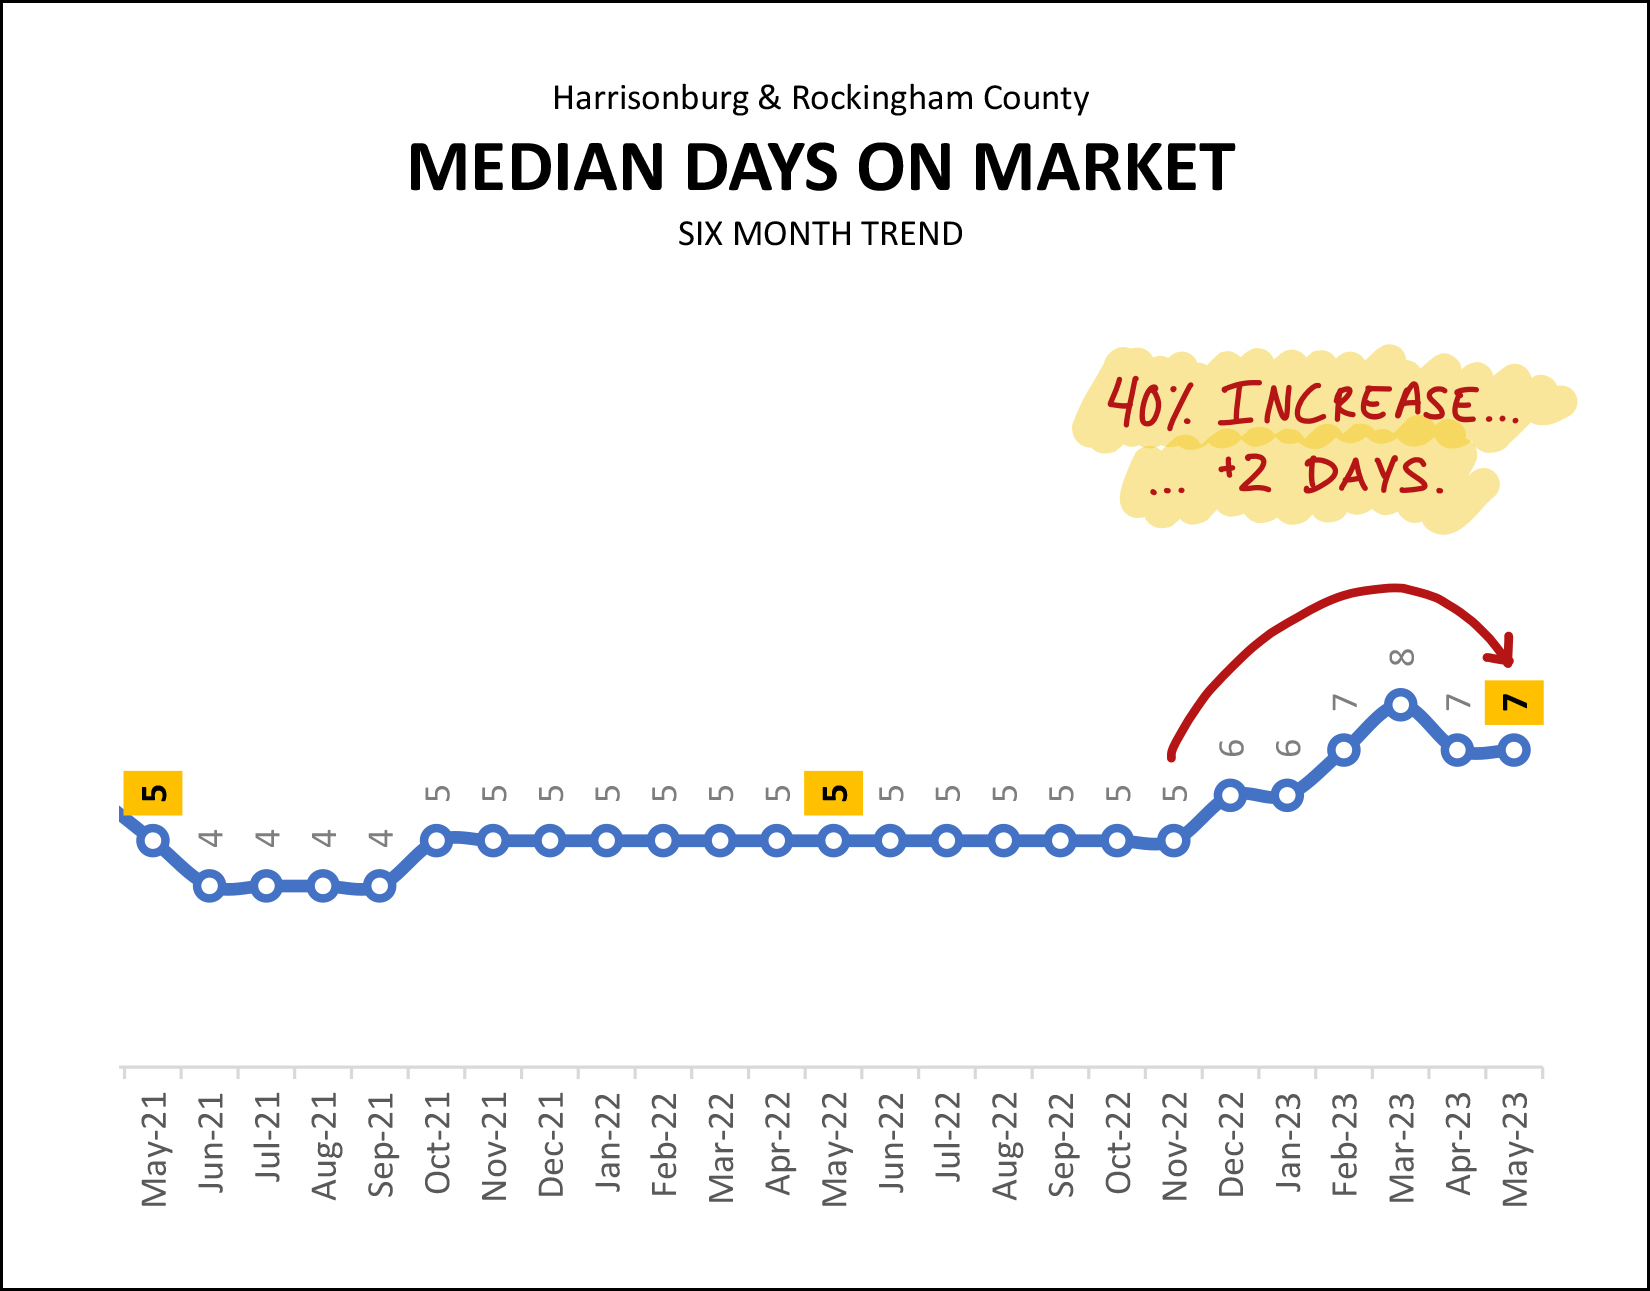 We have seen a 40% increase in the time it takes for a house to go under contract in Harrisonburg and Rockingham County! Gasp! Oh my! But wait... that just means that it is taking seven days for a house to go under contract... instead of five days? Yes, that is correct. The 40% increase in the median days on market is an increase from five to seven days. Ask just about any would-be buyer and they will report that this doesn't measurably change how quickly they need to act on seeing and pursuing new listings. And another interesting phenomenon in our current market, mortgage interest rates... 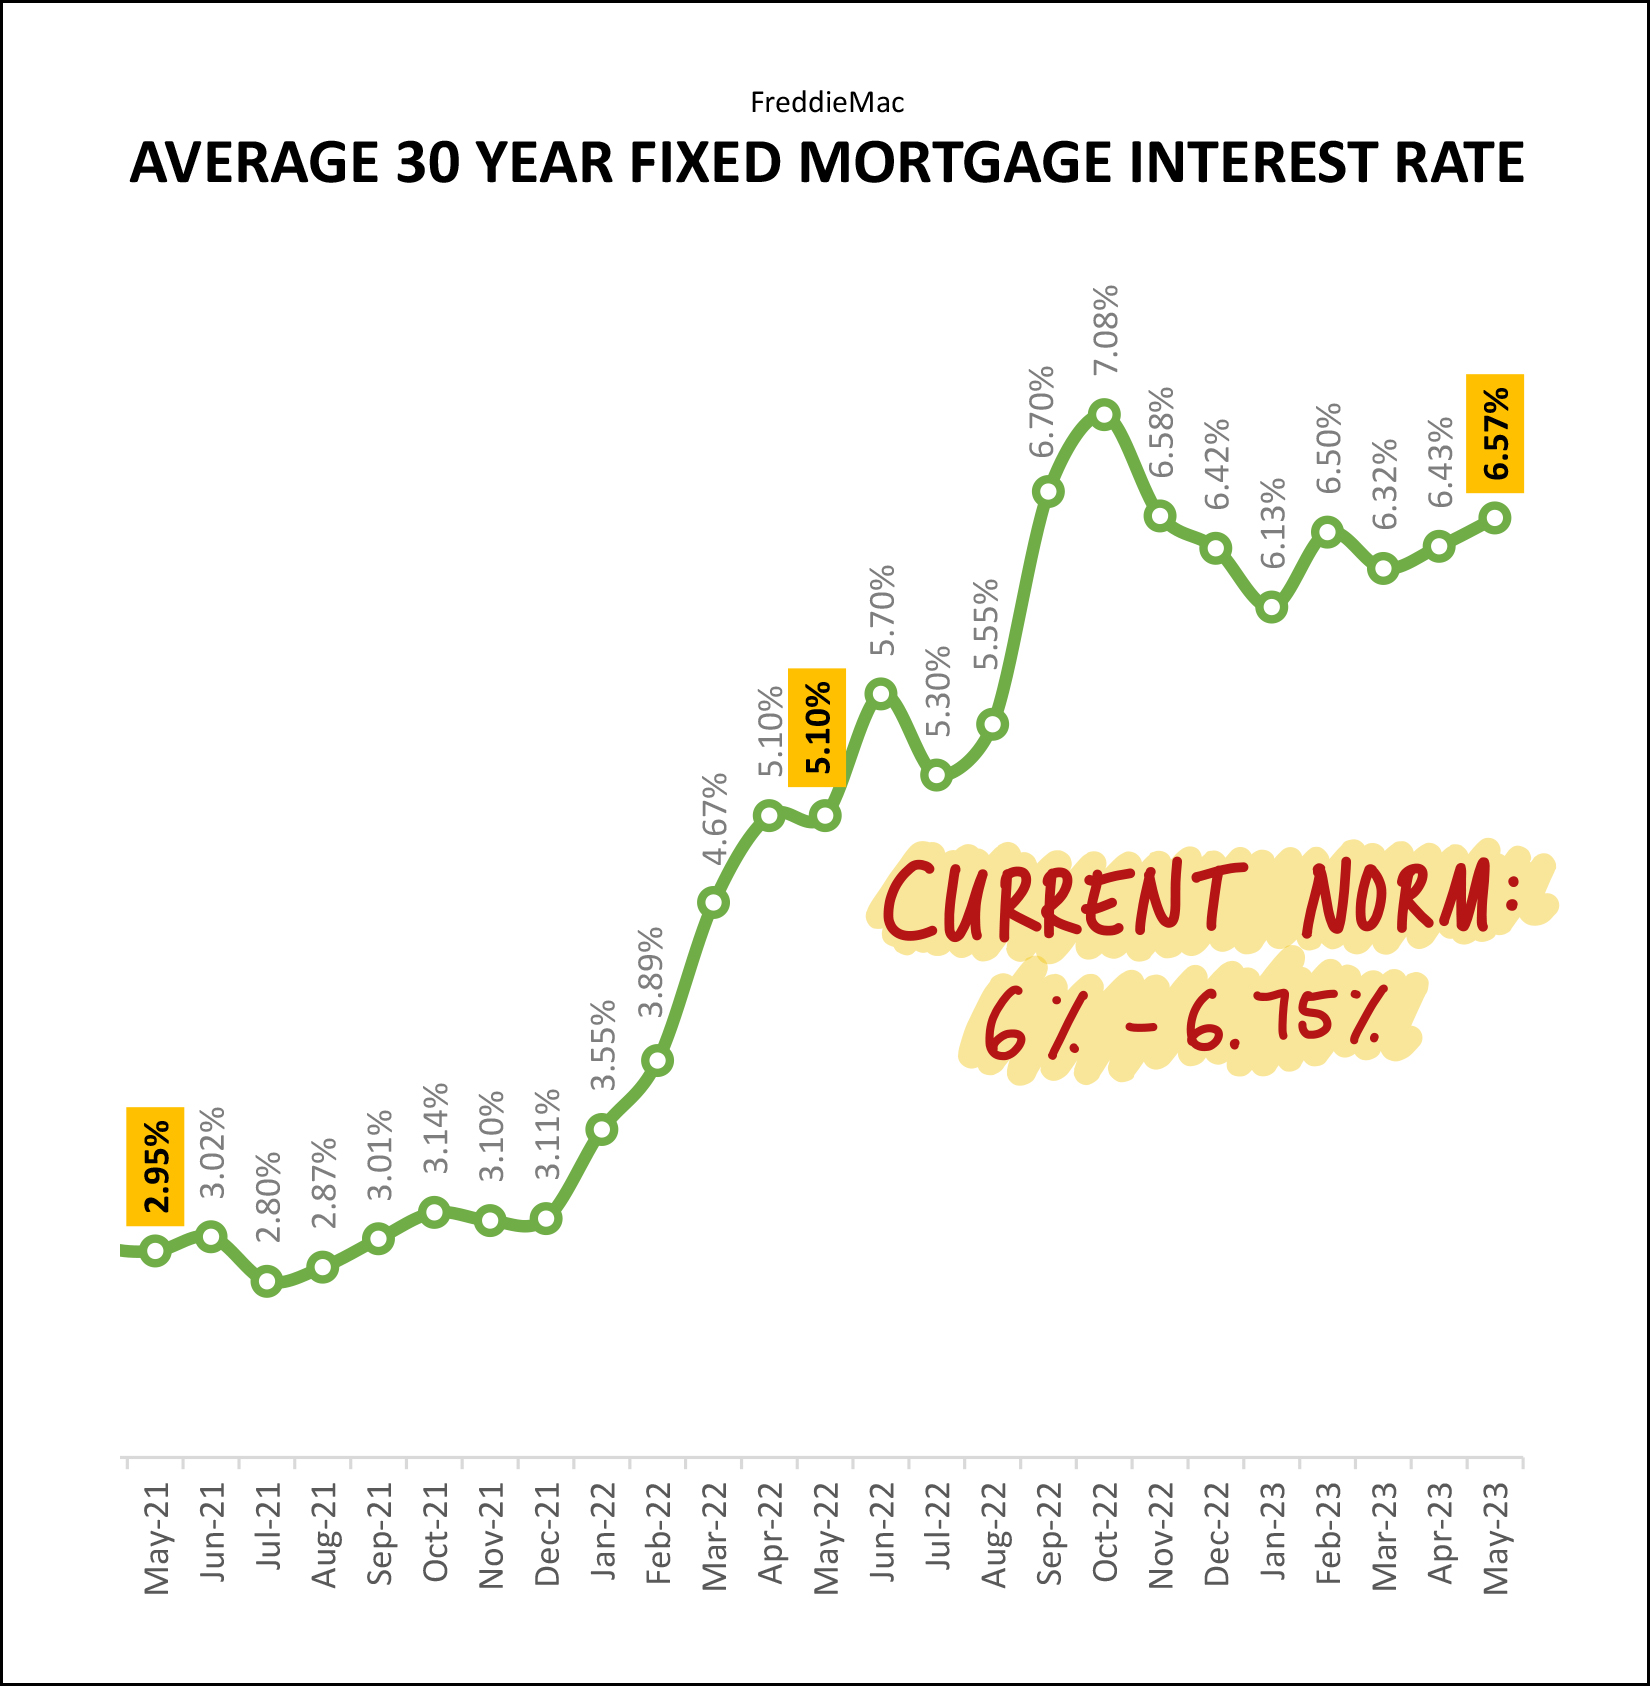 Despite fewer homes selling... sales prices keep rising. Despite higher mortgage interest rates... sales prices keep rising. Two years ago the average mortgage interest rate was around 3%. A year ago that had risen to 5%. Now, it is bouncing around between 6% and 7%. And yet, buyers keep buying, and they are paying ever higher prices for the homes they are purchasing. As you can imagine, that means that mortgage payments are higher than ever for today's home buyers -- as a result of both higher sales prices and higher mortgage interest rates -- but these higher rates haven't seemed to have impacted buyer interest enough to then impact sales prices. So, given all of the data above, what does this mean for you? If you are planning to sell... you'll likely still have plenty of interest from buyers, you're likely to sell at a very favorable price, and your home is still likely to be under contract within a week. If you are hoping to buy... you'll need to see homes quickly when they come on the market, you will still have stiff competition from other buyers, and you should talk to a lender to understand mortgage payments based on current mortgage interest rates. If you own a home and aren't planning to sell... lucky you. Home values keep on increasing, and you likely have a low or low-ish mortgage interest rate. I hope this overview of the latest trends in our local housing market has been informative and helpful, especially if you are gearing up to buy or sell soon. Feel free to reach out to me if I can be of any assistance to you as you make those plans. You can reach me most easily at 540-578-0102 (call/text) or by email here. Until next month, I hope you enjoy the start to summer, and perhaps I'll see you at Red Wing! | |
An Early Look At May 2023 Home Sales In Harrisonburg And Rockingham County |
|
 May is over! Gasp! It's June. Already! Here's a quick look at a few early indicators of trends in our local housing market in May 2023... May 2020 = 112 home sales May 2021 = 122 home sales May 2022 = 149 home sales May 2023 = 106 home sales So... unless quite a few more (6+) home sales are reported over the next few days as having been sold in May via the HRAR MLS, it seems May 2023 may have been the slowest (number of sales, not speed of sale) month of May in several years. Mortgage interest rates were also a bit higher this May than last, and much higher than two years ago... Early May 2021 = 2.96% Early May 2022 = 5.27% Early May 2023 = 6.39% And yet, despite fewer home sales and higher mortgage interest rates, home prices seem to keep on rising... Median Sales Price, Jan 2022 - May 2022 = $298,400 Median Sales Price, Jan 2023 - May 2023 = $325,000 Stay tuned for a fuller analysis of local market trends in about a week. | |
Median Sales Price Up 10% In 2023 Despite 19% Decline In Home Sales |
|
 Happy Tuesday morning, friends! We are now -- wait for it -- more than a third of the way through 2023!? How can it be!? And how's the market you might ask? Fewer homes are selling this year, but at higher prices than last year!? Again, how can it be!? -- This whirlwind of a start to 2023 has involved a rather busy few months in the Rogers household -- with a soon-to-be-graduating high school senior (Luke) attending a Junior-Senior banquet and playing in his last few baseball games, and an ever-speedier ninth grader (Emily) running (and jumping) in multiple events on the track team. Whatever is keeping you busy and running all around town this Spring, I hope it is just as fun and fulfilling as it has been for Shaena and I to see our kids growing up over these recent years. Time surely does fly by quickly! -- But, back to real estate. Below I'll delve into all the juicy details of the latest happenings in our local housing market... after I make you hungry... Each month I offer a giveaway, of sorts, for readers of this market report, highlighting some of my favorite places, things or events in Harrisonburg. Recent highlights have included Cuban Burger, Taste of India and A Bowl of Good. -- OK, now, I'm really getting to the real estate. Jumping right in to where my headline began... home sales (not prices) are declining, rather significantly in Harrisonburg and Rockingham County right now... 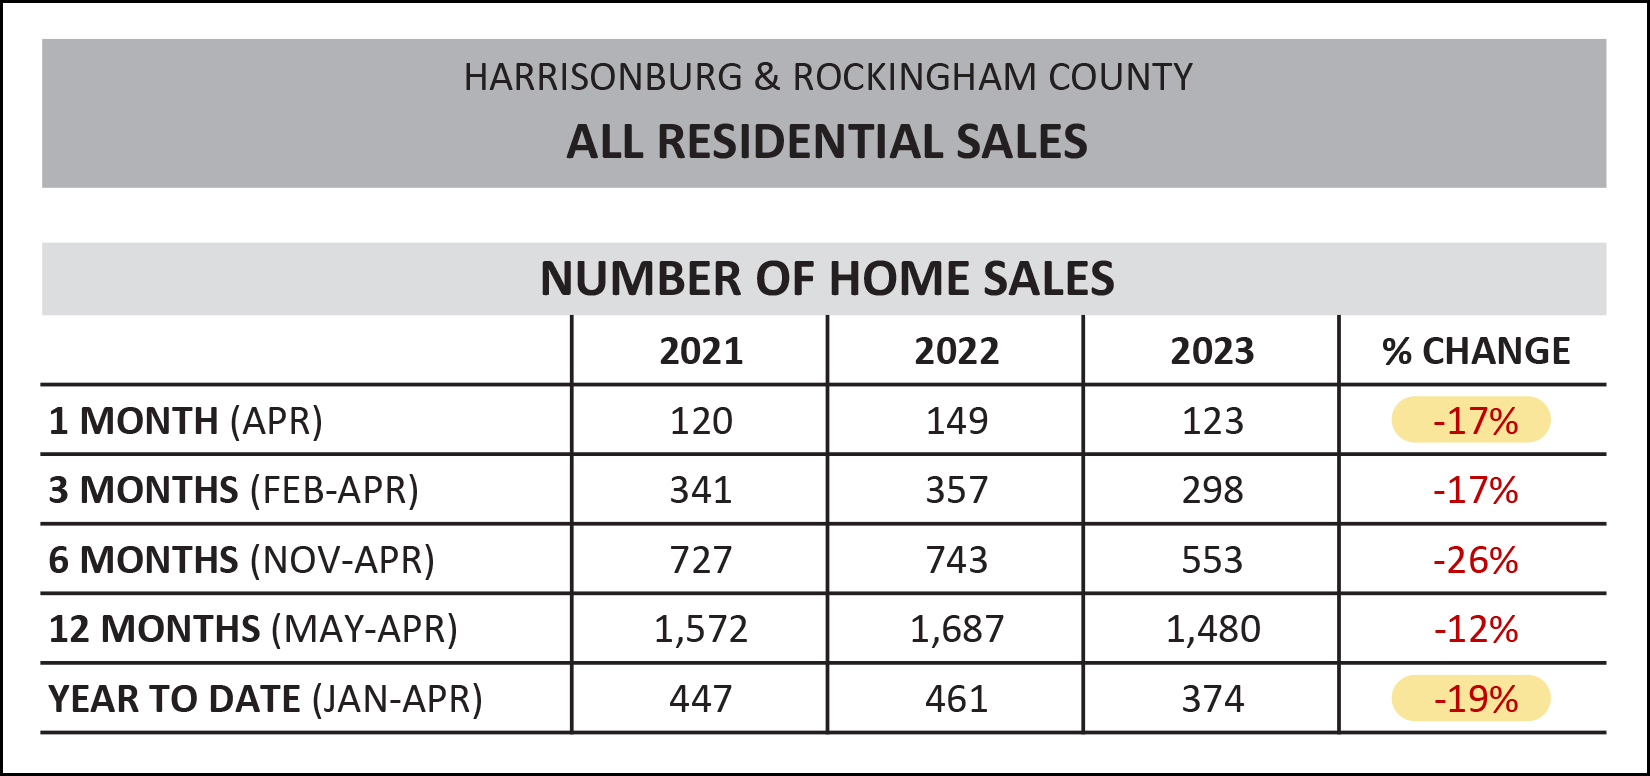 As shown above... [1] There were 17% fewer home sales in April 2023... which I suppose isn't too much of a surprise given several other recent months of slower home sales. [2] Looking at the year thus far (Jan - Apr) home sales have declined 19%. During the first four months of 2022 we saw 461 home sales in Harrisonburg and Rockingham County while there have only been 374 home sales thus far in 2023. Generally, there are two reasons why home sales decline: [1] Fewer buyers want to buy. [2] Fewer sellers want to sell. In our local market, the 19% decline in home sales seems to be almost entirely a result of fewer sellers wanting to sell. I come to this conclusion based on continued low inventory levels, which we'll get to in a bit. Despite the 19% decline in the number of homes that are selling, as the headline referenced, we're still seeing home prices rise in Harrisonburg and Rockingham County... 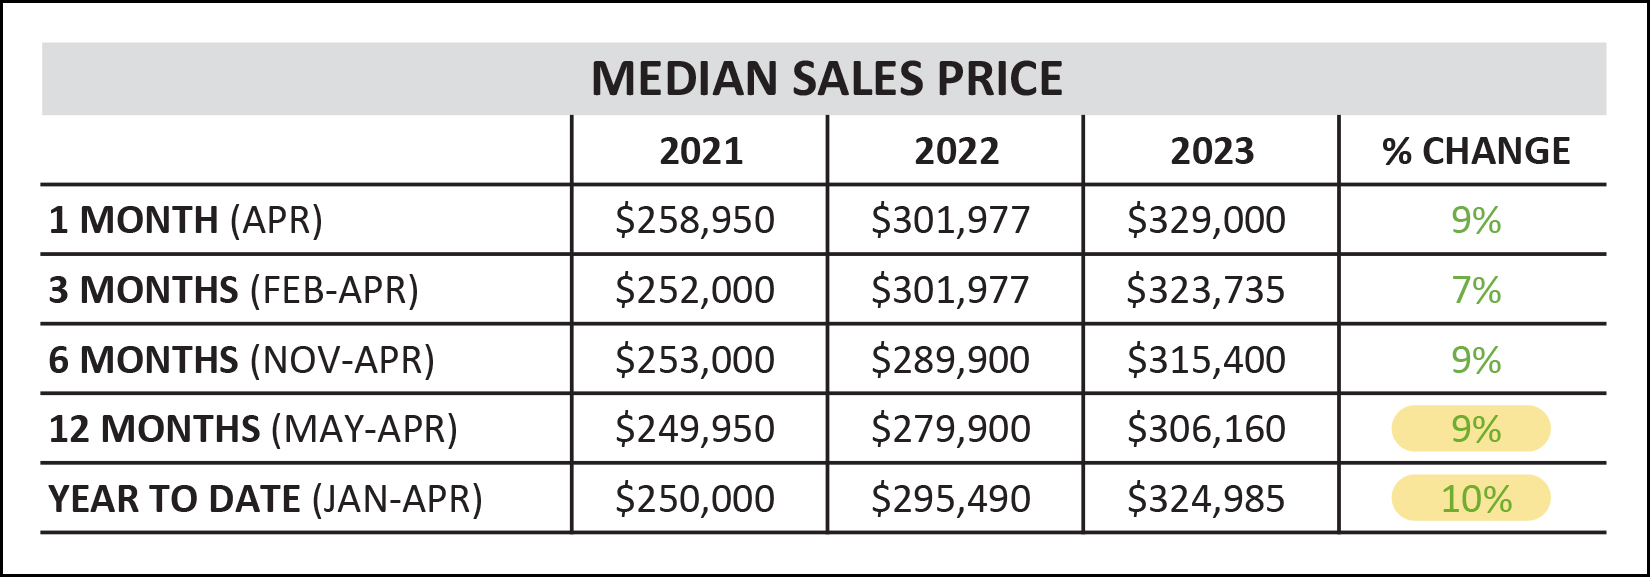 Indeed, when analyzing multiple different timeframes, we are consistently seeing increases in the median sales price in our local area... [1] The median sales price over the past 12 months ($306,160) is 9% higher than it was in the previous 12 months ($279,900). [2] Looking just at the first four months of the year, the median sales price is 10% higher this year ($324,985) than last ($295,490). Will home prices keep rising forever? I can make no promises, but generally speaking, so long as demand (buyers wanting to buy) continues to exceed supply (sellers wanting to sell) we are likely to continue to see prices rise. Will home prices keep rising at a rate of 10% per year? This seems less likely, especially given higher mortgage interest rates right now... though I've been saying this for at least six months now, and thus far, home prices are still rising at about 10% per year. One metric that is running slightly contrary to most others is the time that it takes for a home to go under contract once listed for sale. We have actually seen a slight increase in this "median days on market" statistic over the past year... 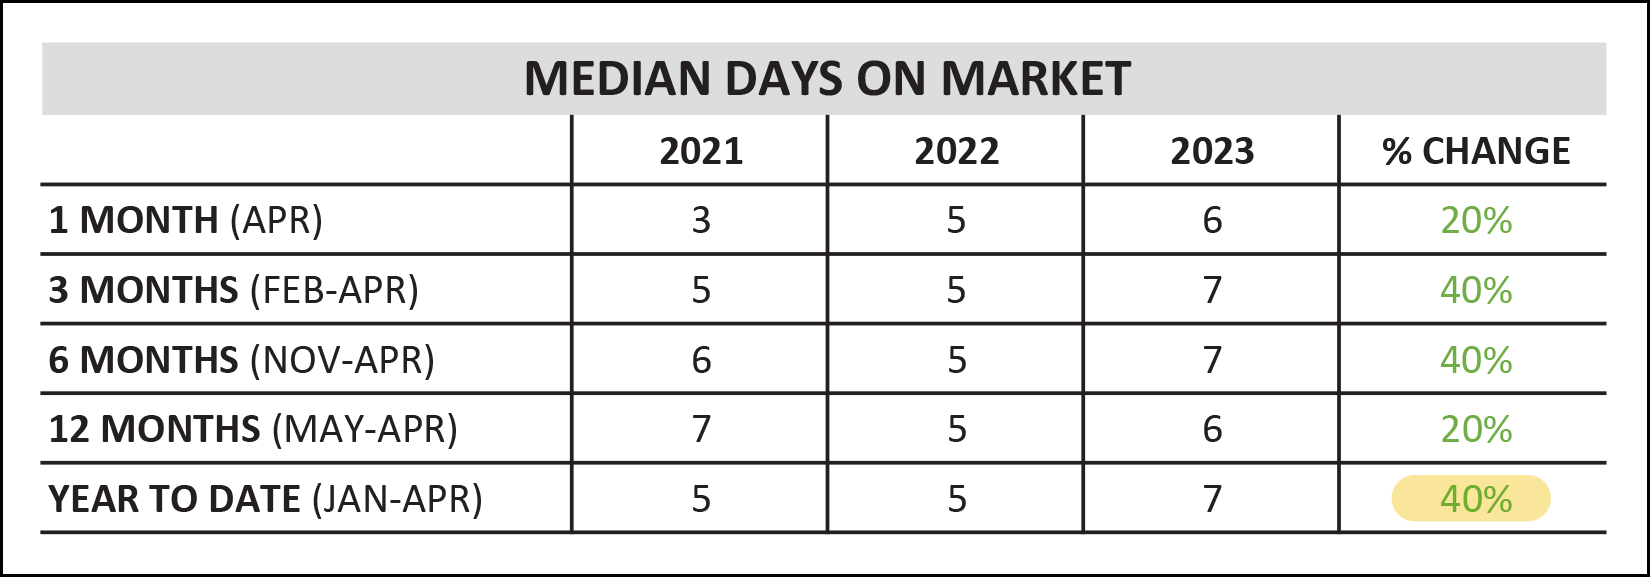 I suppose the "gotcha" headline would be that it is taking homes 40% longer to go under contract now as compared to a year ago. :-) But... this was a change from a median of five days to a median of seven days... and seven days is still mighty speedy. I should also note that this slight (two day) slow down is not much consolation to would-be home buyers who are frustrated by how quickly the market is moving right now. Pausing for a moment, as you may or may not know, I compile a bunch of data that is not highlighted in this monthly market narrative. You can find lots of other data tables and graphs over here. Pulling from the variety of other charts and graphs that I generate each month, let's take a peek at one subset of our overall market... home sales within the City of Harrisonburg. 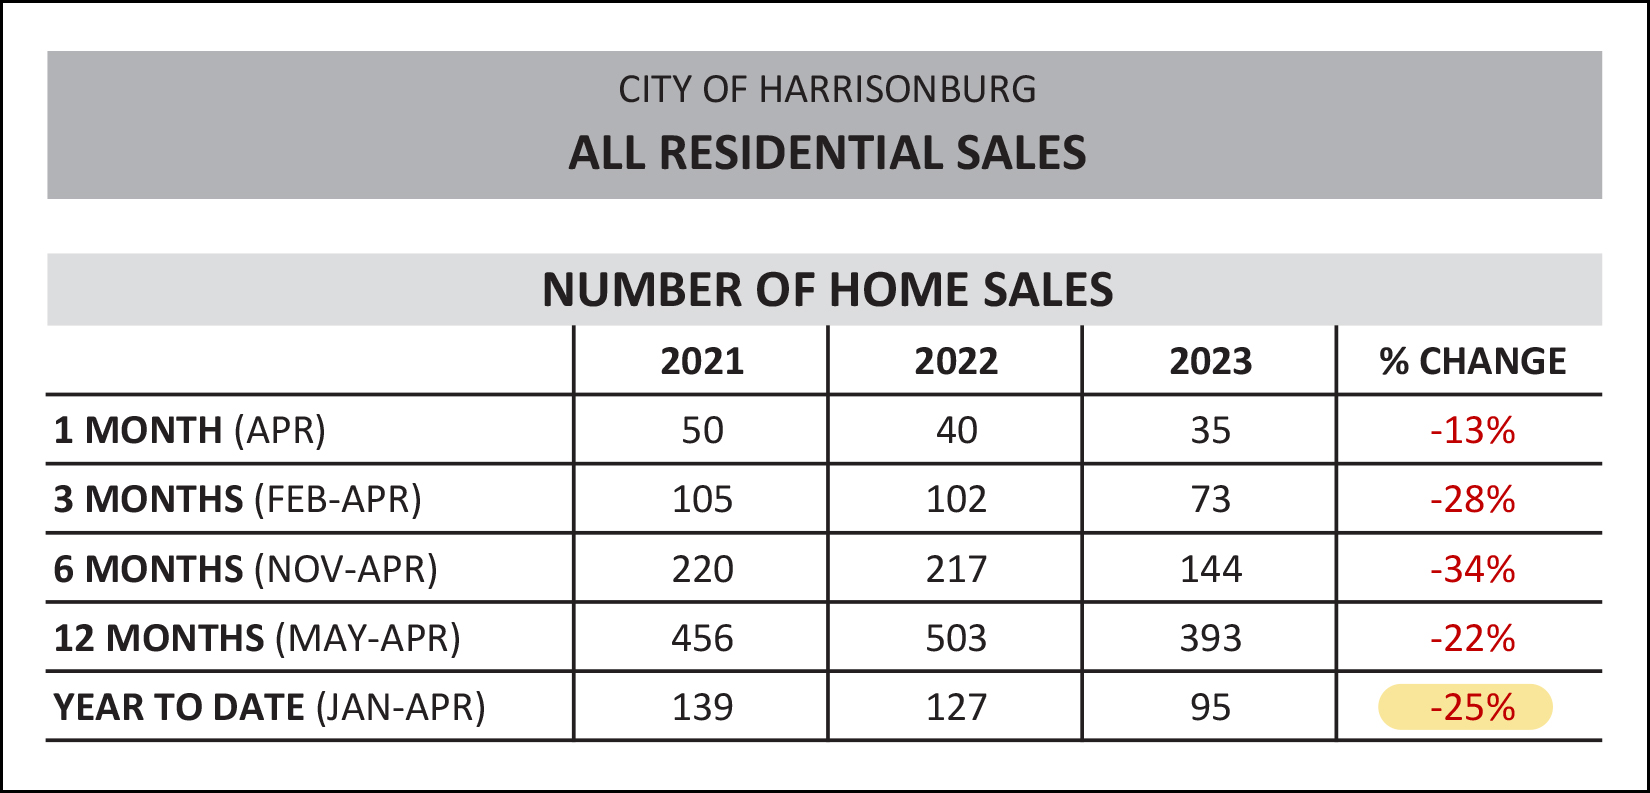 Home sales actually declined *even more* in Harrisonburg than in the market as a whole. The entire market (City + County) has seen a 19% decline in home sales in the first four months of the year... but the City alone has seen a 25% decline. If you're hoping to buy a home in the City of Harrisonburg, it's a tough time to do so based on very limited inventory of homes offered for sale. Now, moving past these charts, to some graphs, for the visual learners amongst us... 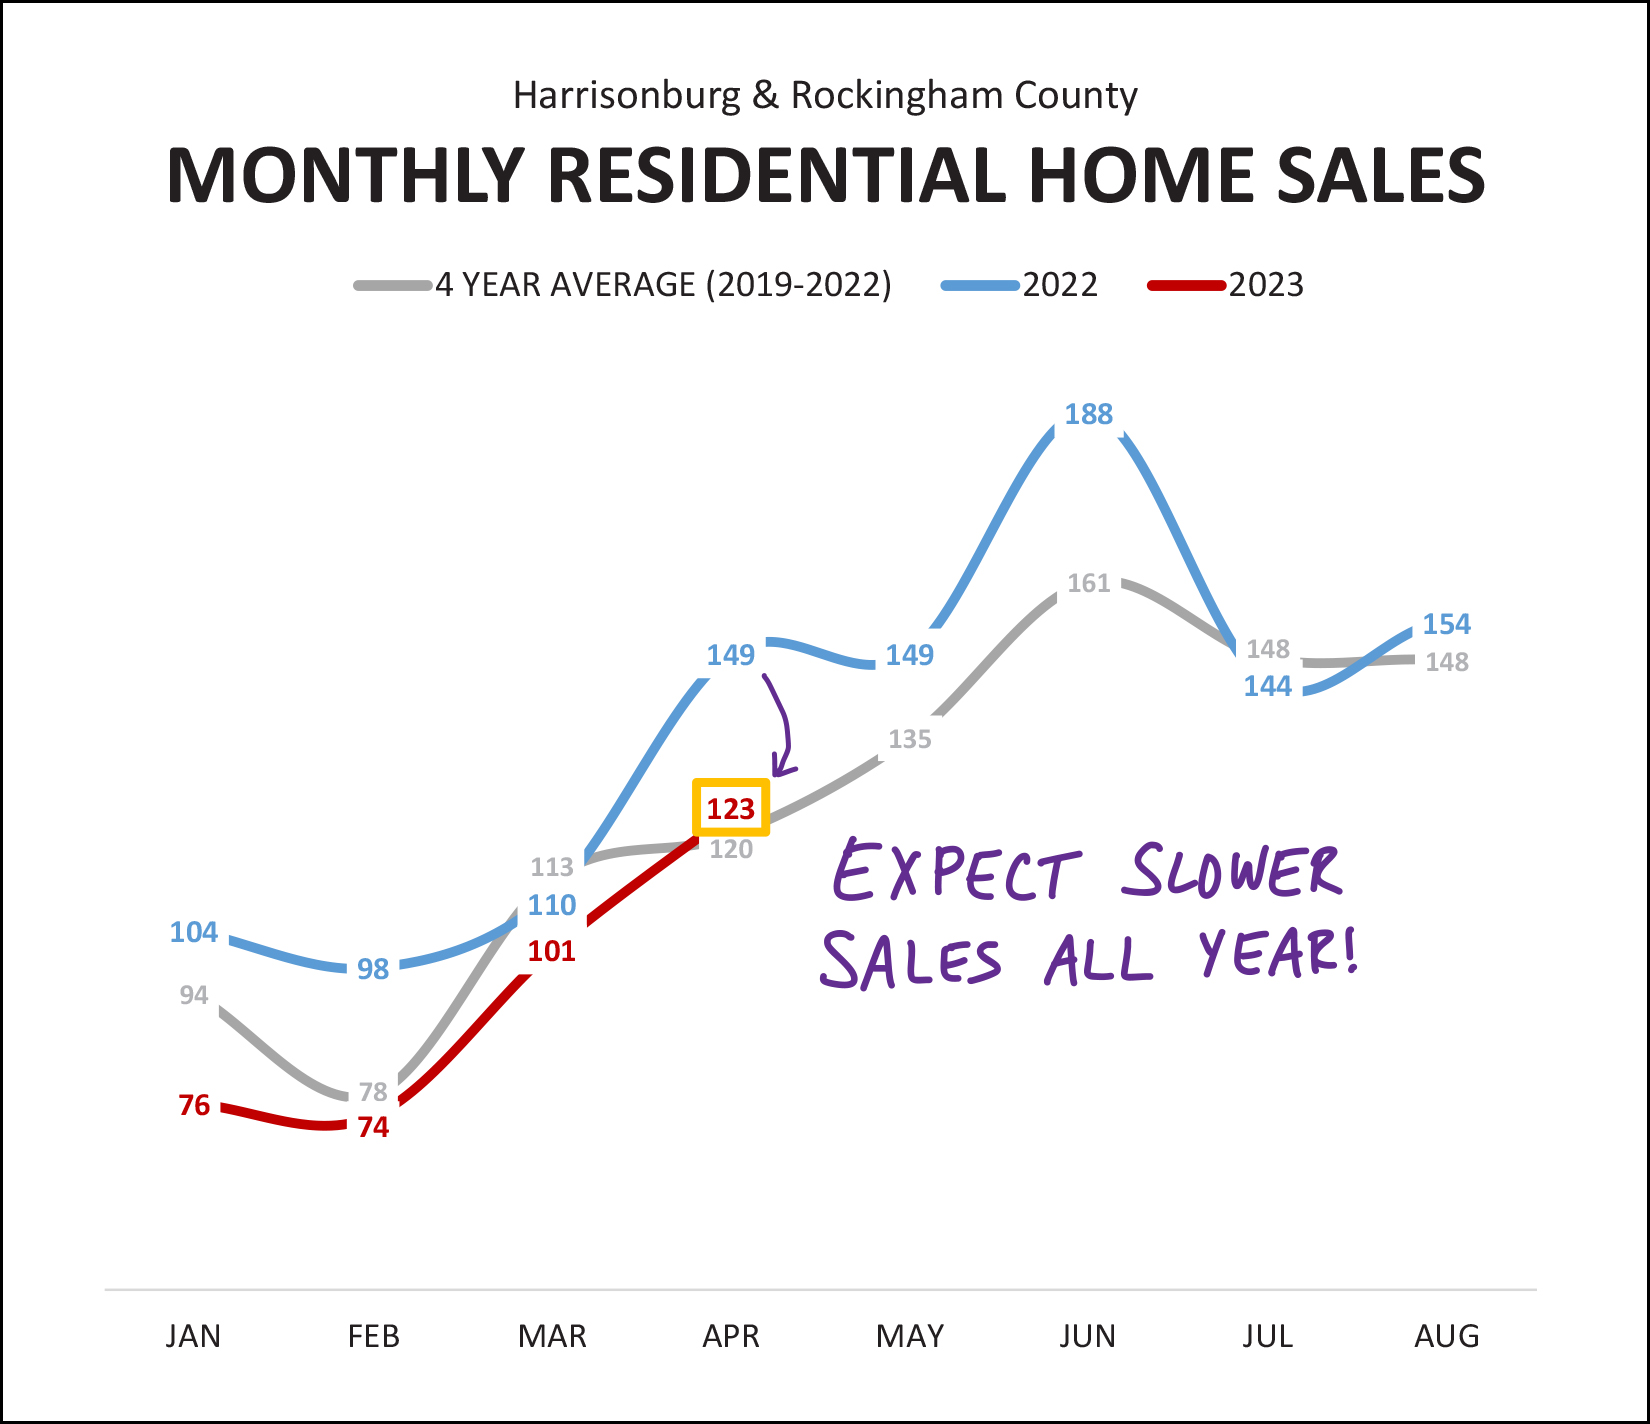 Follow the red line on the graph above to see each month of 2023 home sales in Harrisonburg and Rockingham County and you'll find that it is lower than each month on the blue line, which represents home sales last year. March 2023 came close to March 2022 (101 vs. 113) but the gap widened again in April (123 vs. 149) and I am expecting we'll continue to see slower home sales (fewer home sales) for most or all of 2023. I'll talk more about mortgage interest rates further down in this report, but it's worth noting that higher mortgage interest rates seem to be limiting the number of home sales that we're seeing right now -- but it might be stopping just as many sellers from selling as it is stopping buyers from buying. Many homeowners aren't all that interested in selling their homes with mortgages in place with a three-point-something interest rate, to then be replaced by a new mortgage at a six-point-something interest rate. I can't blame them. This is only one of the factors limiting the number of homes that are selling, but I don't think we should overlook its impact. So long as mortgage interest rates stay high, we are likely to continue to see a lower number of home sales this year as compared to last year. Moving on to the opposing trends of price and pace of home sales... 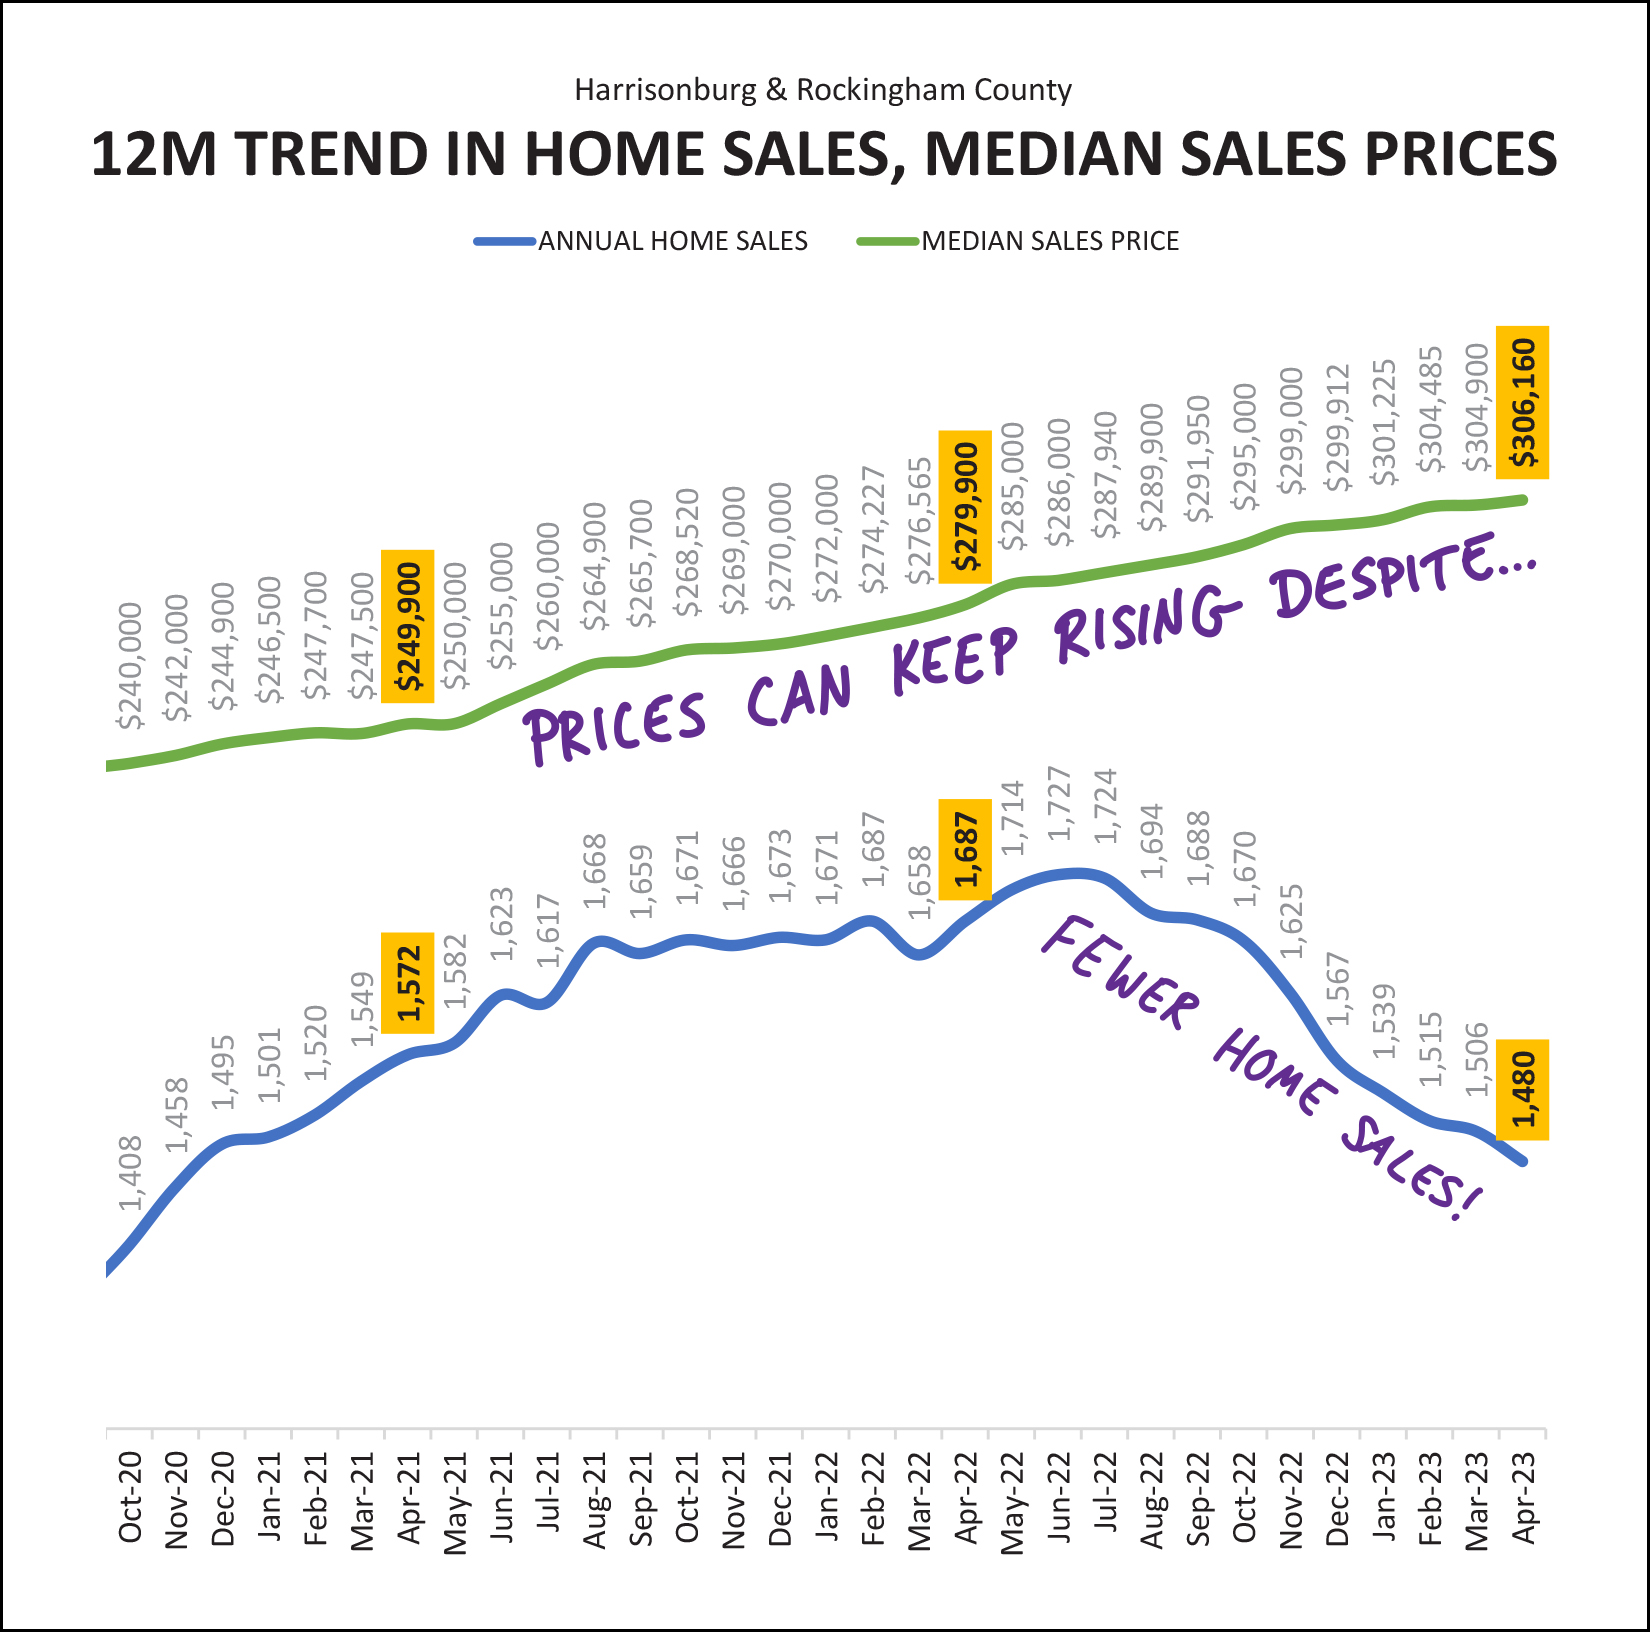 Many assumed that if home sales started to decline (they definitely have) that home prices would be sure to follow. Not so. It seems that the combination of continued strong levels of buyer demand, paired with a smaller number of sellers willing to sell, has resulted in fewer home sales, but higher prices. Over the past year we have seen 1,480 home sales in Harrisonburg and Rockingham County. Back the clock up a year and we were seeing 1,687 home sales a year. That's a rather significant change in the pace of home sales activity in our local market. Over the past year the median sales price has been $306,160 in Harrisonburg and Rockingham County. A year ago, the median sales price was only $279,900. This is, again, a rather significant change, though in the opposite direction (up) that we're seeing when it comes to the number of homes selling (down). Looking at the change in median sales prices a bit differently, here's a startling change over a relatively short timeframe... 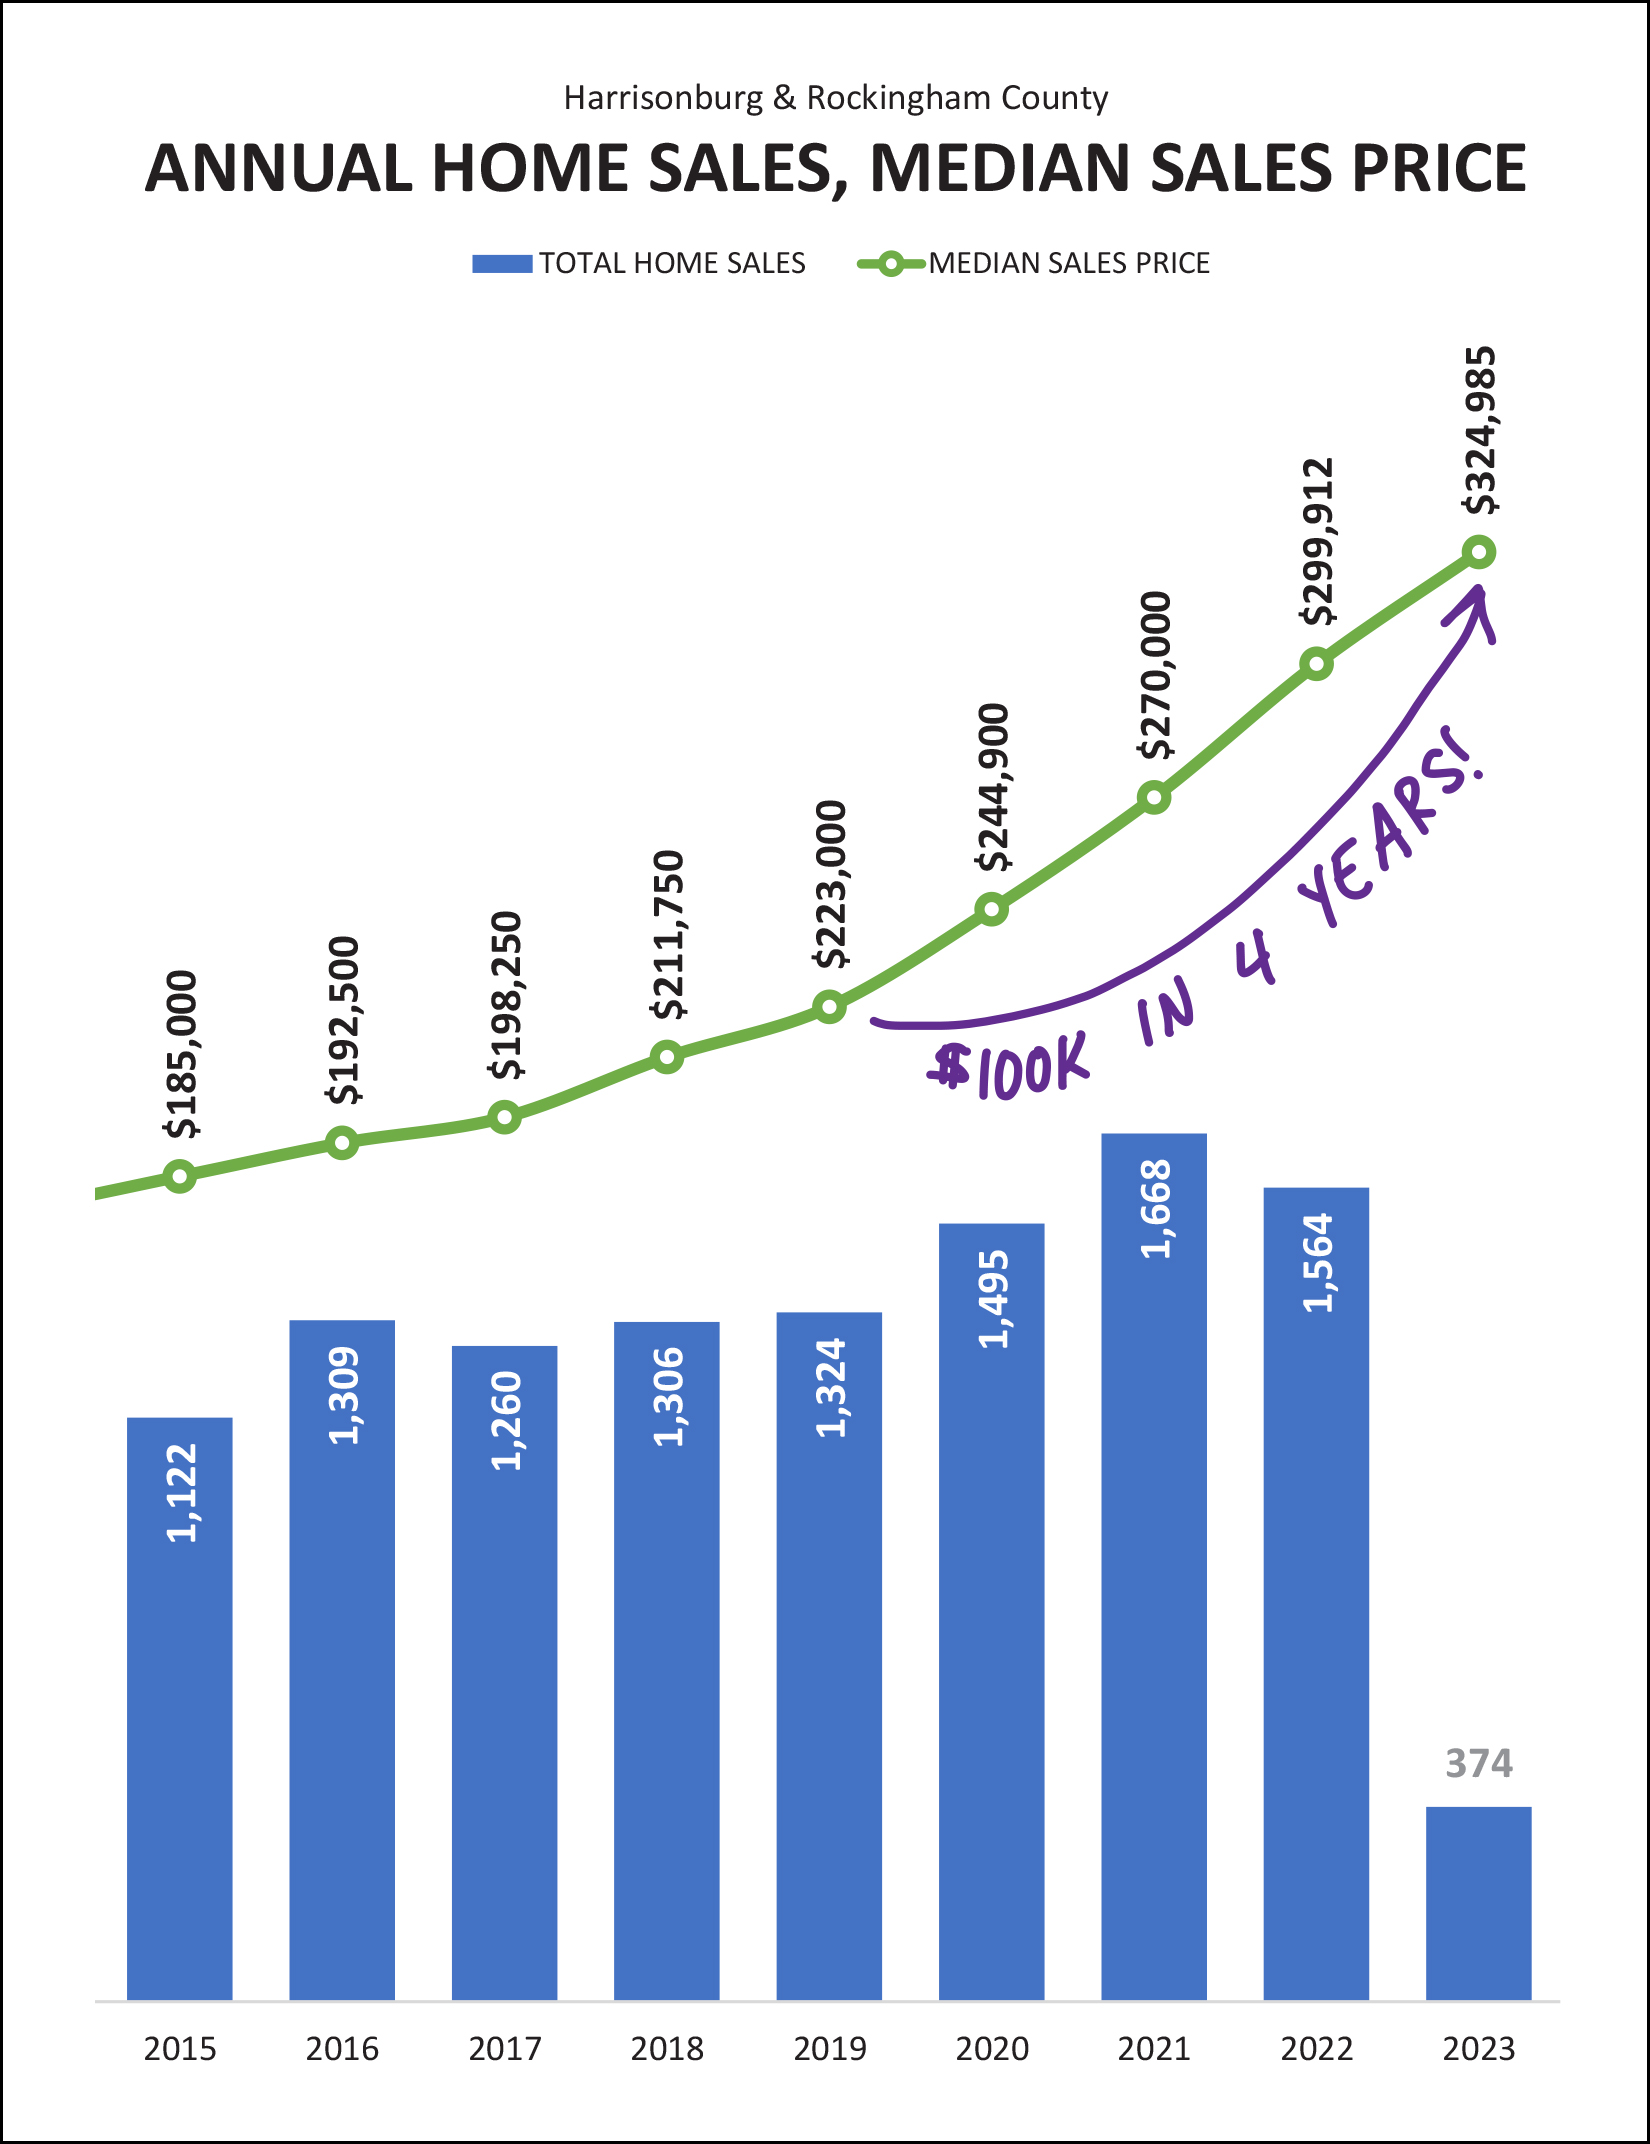 If you bought a median priced home four years ago, that home may very well be worth $100,000 more today!?! Now, before you get too excited about this newly discovered six figure pile of equity in your home, keep in mind that these numbers ($223K in 2019 to $325K in 2023) are simply showing overall market-wide trends. Some homes certainly have appreciated by $100K over the past four years -- but not all homes. That said, almost universally, homeowners have been shocked to see how much their home value has increased over the past four years! Now, let's try to guess at where things might go from here over the next few months... 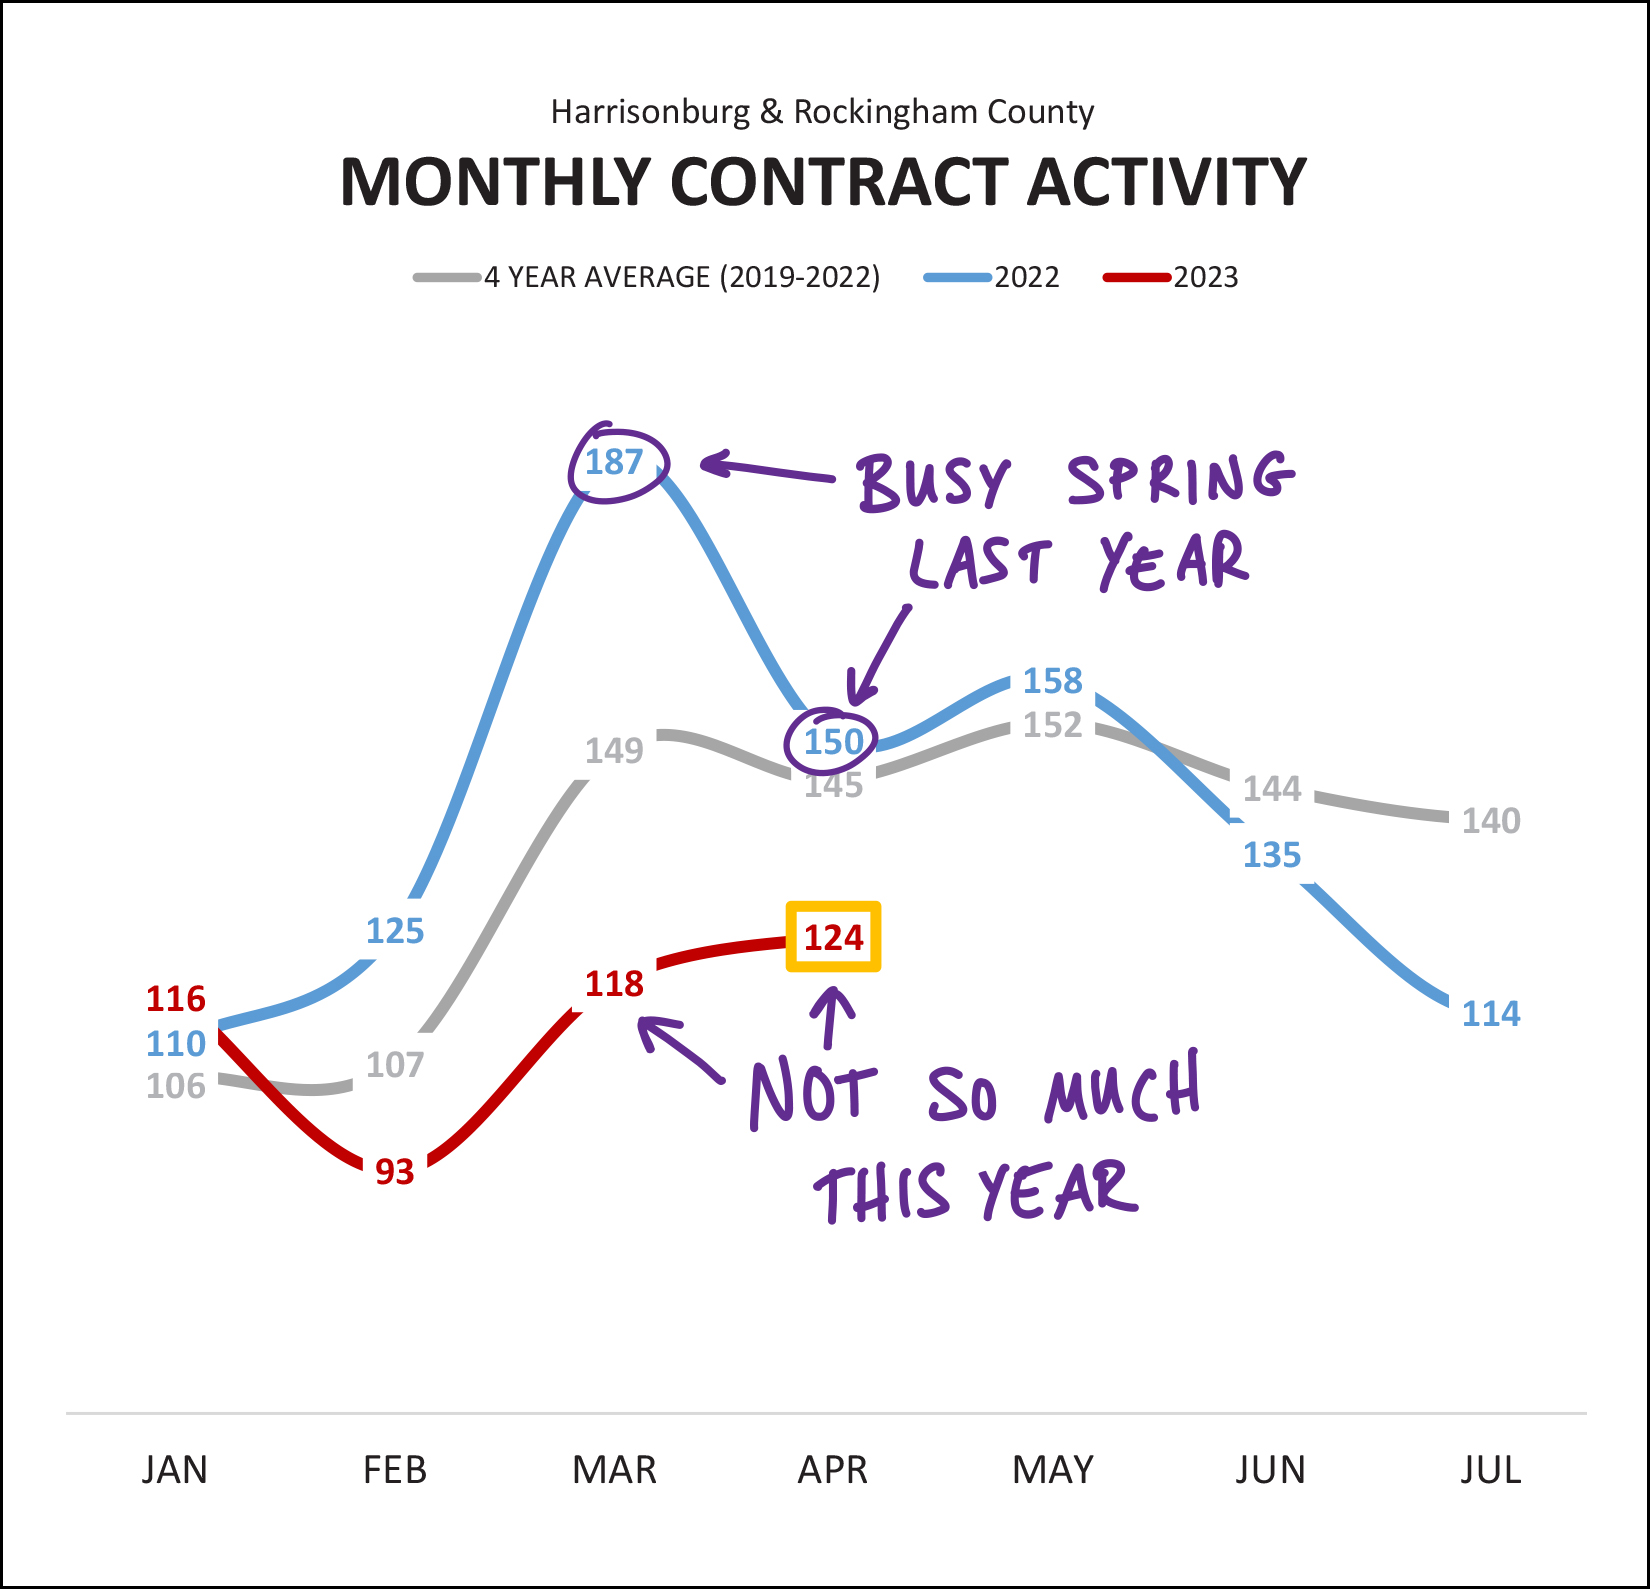 This first graph is showing the number of contracts being signed per month, as compared to previous graphs that showed the number of home sales taking place each month. Over the past two months we have seen 242 contracts signed for buyers to buy (and sellers to sell) in Harrisonburg and Rockingham County. This is quite a decline compared to last year when we saw 337 contracts signed during the same timeframe. Bottom line... this spring (red line) has just not been as active of a "spring market" as last year (blue line)... and it also hasn't kept pace with recent historical trends (grey line). These lower contract numbers have lead to fewer properties being under contract and waiting to get to closing... 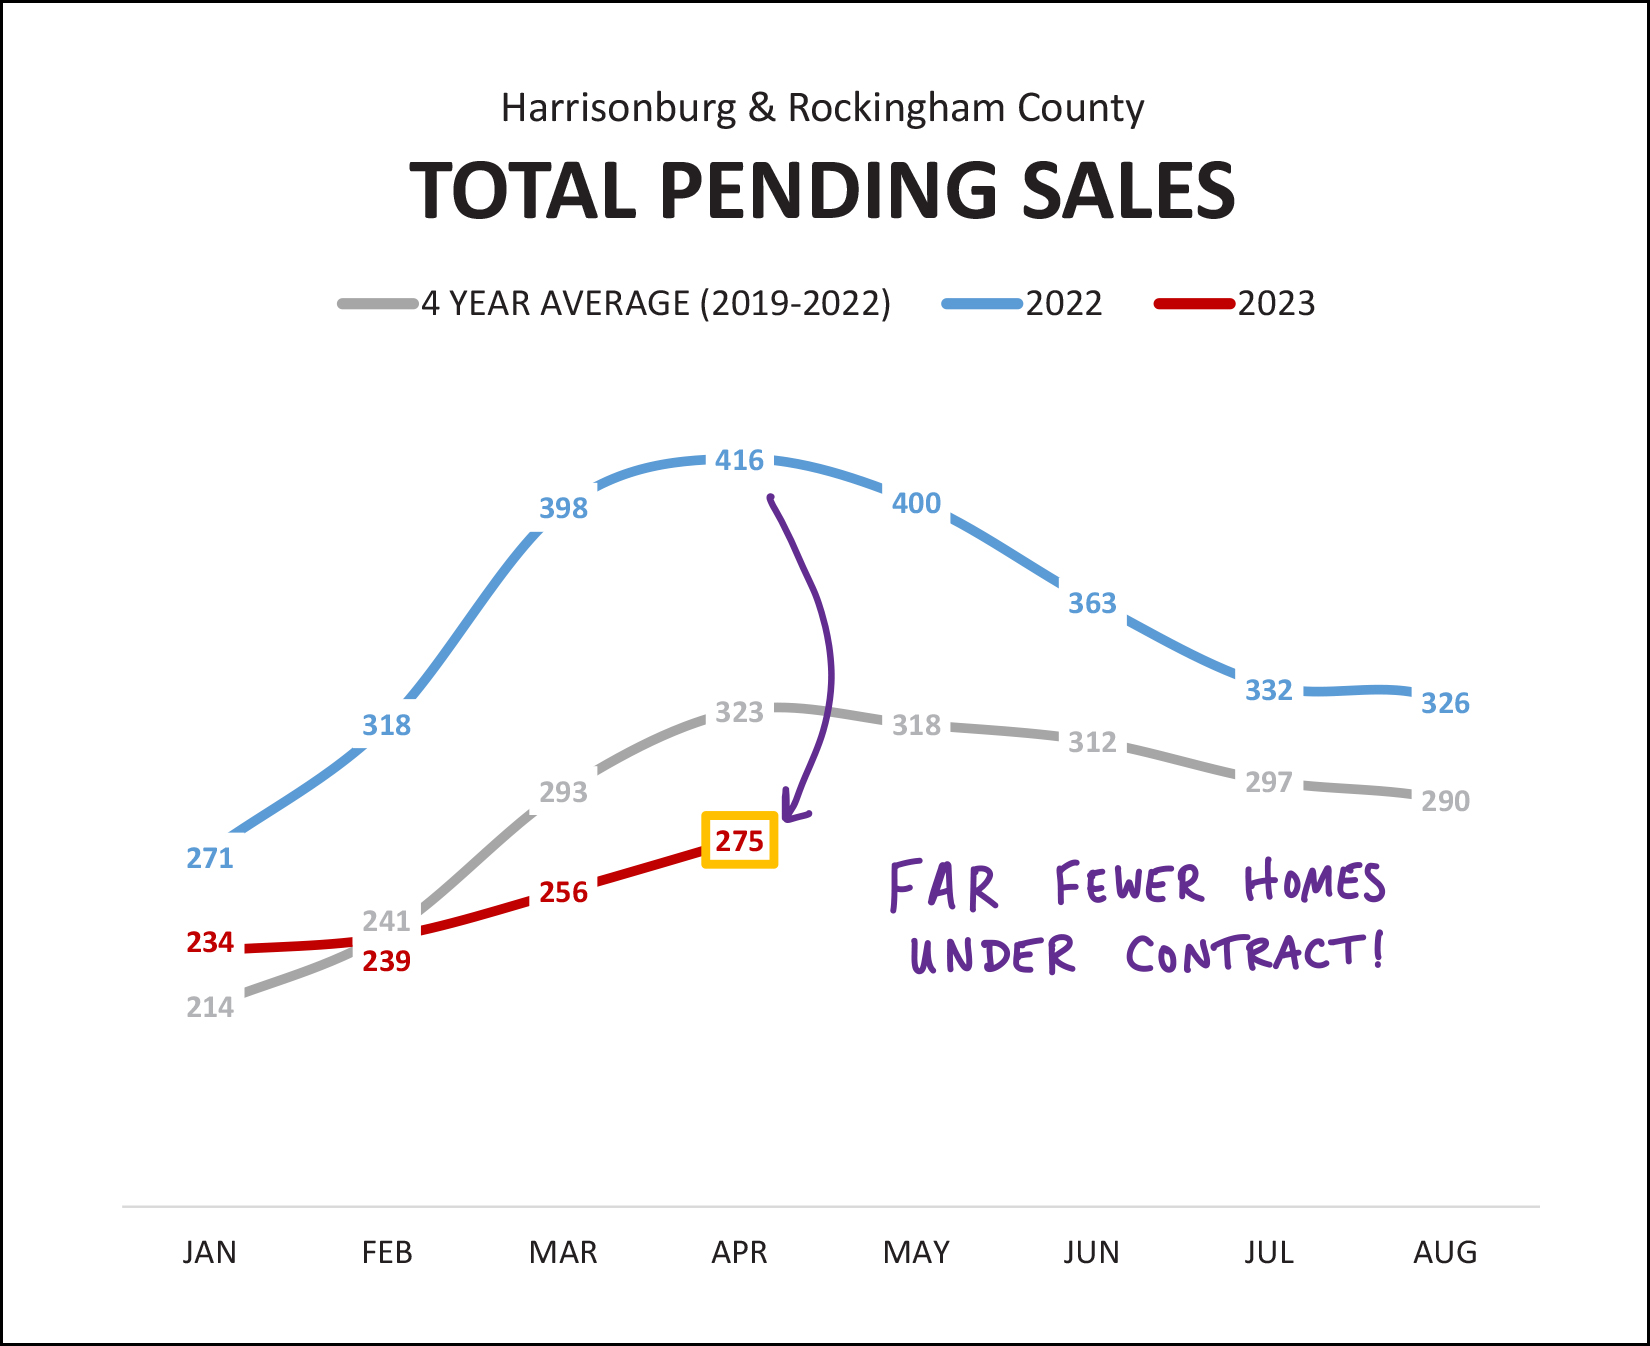 One year ago, there were 416 properties under contract just waiting to get to closing. Now, that "pending sales" figure is only at 275. This is the clearest predictor we can get as to the slower months of home sales that seem to be headed our way in May and June. With such a significant decline in contracts signed, and with a much lower number of properties being under contract, are we seeing ever higher inventory levels of homes available for sale? 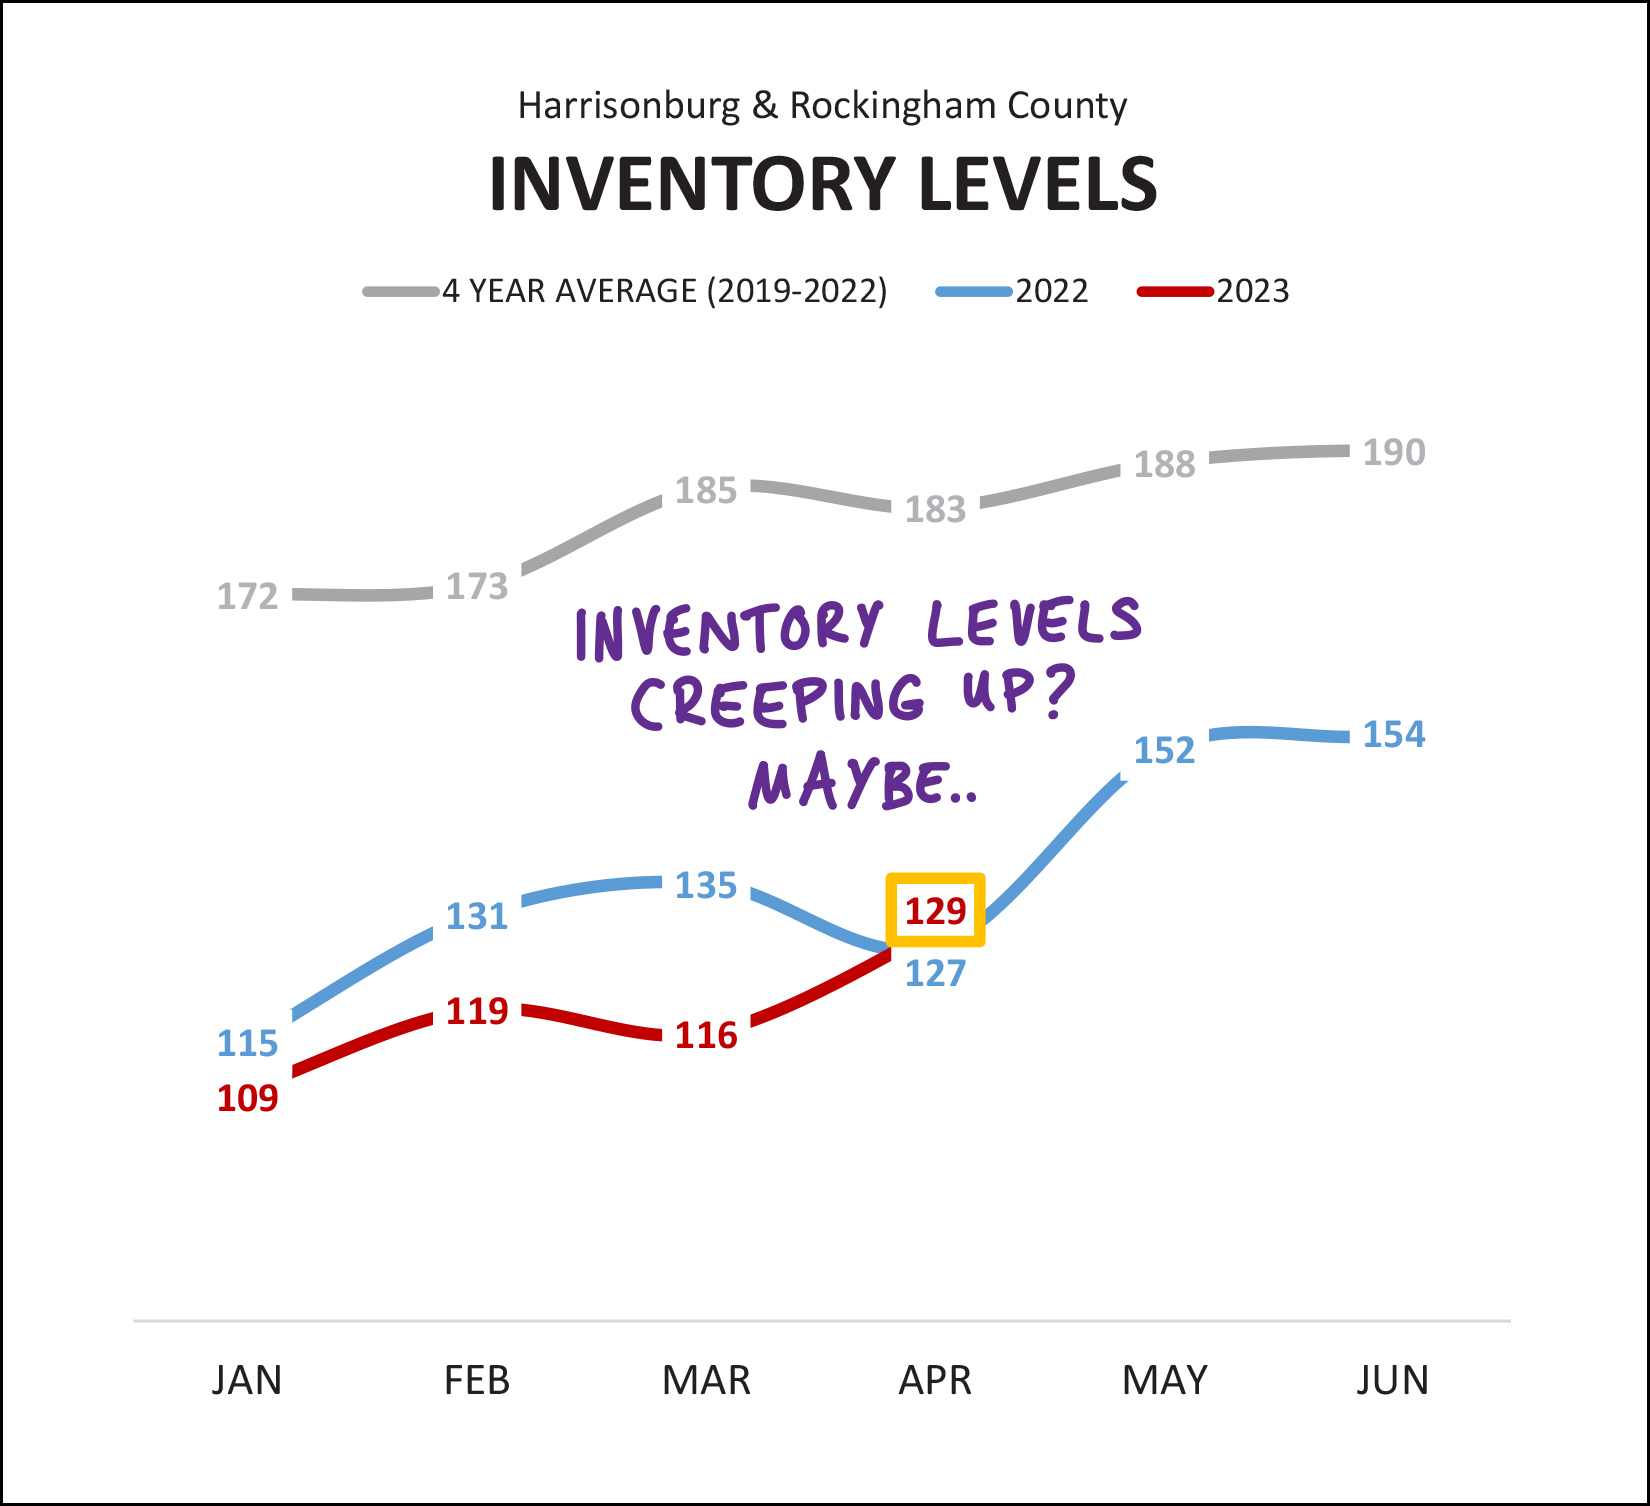 Mostly, no. Over the past four years (2019-2022) the average number of homes for sale at this time of year (early May) has been 183 homes. Today, that number is 129 homes for sale. So, despite fewer sales and fewer contracts, we are still seeing inventory levels that are well below where inventory levels have been over the past few years. That said, for the first time this month we are seeing the inventory level of homes for sale (129) sneaking past (just barely) the number of homes for sale (127) a year ago. Is this significantly? Give it another month or so to see how things shake out. Keep in mind that to continue this trend (more homes for sale in 2023 than in 2022) we'd have to see inventory levels climb above 152 homes for sale over the next month. Stay tuned. Earlier I mentioned that homes are taking an extra day or two to go under contract right now, as compared to a year ago... 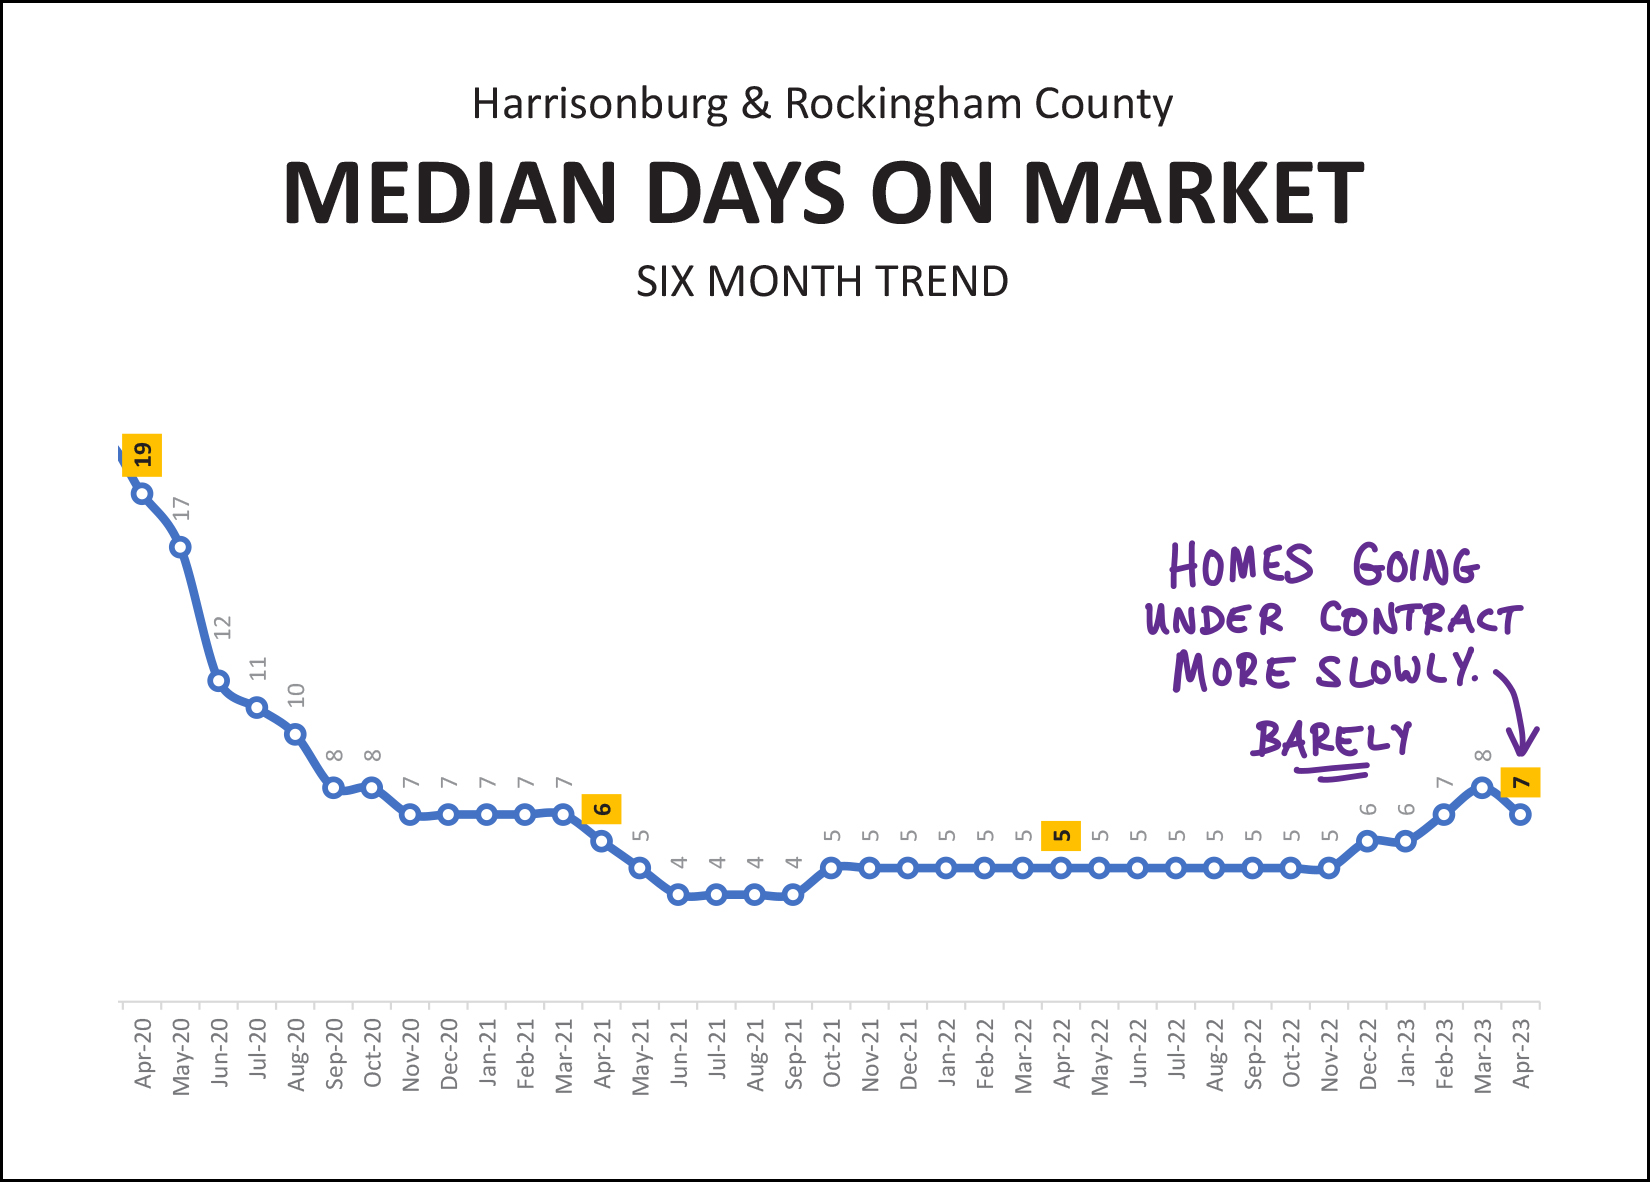 Indeed, after about a year of the median "days on market" statistic hovering right at five days... we have now seen the pace at which homes go under contract slowing, slightly, over the past five months. If I had to hypothesize as to why this number has risen (barely) I would guess it is related to higher mortgage interest rates. I am seeing three things happen when new listings hit the market right now... [1] Slightly fewer showings than we would have seen a year ago. [2] Fewer offers than we would have seen a year ago. [3] Many buyers needing to take a day or two to run numbers with their mortgage lender before making a decision about making an offer. The speed at which homes are going under contract certainly varies quite a bit based on the price range, location and property type -- but as shown above -- it is taking an extra two days (ish) for homes to go under contract right now. This is slightly slower than in 2022, but drastically faster than just about anytime prior to 2021. Finally, mortgage interest rates, which have been mentioned (and blamed) throughout this report... 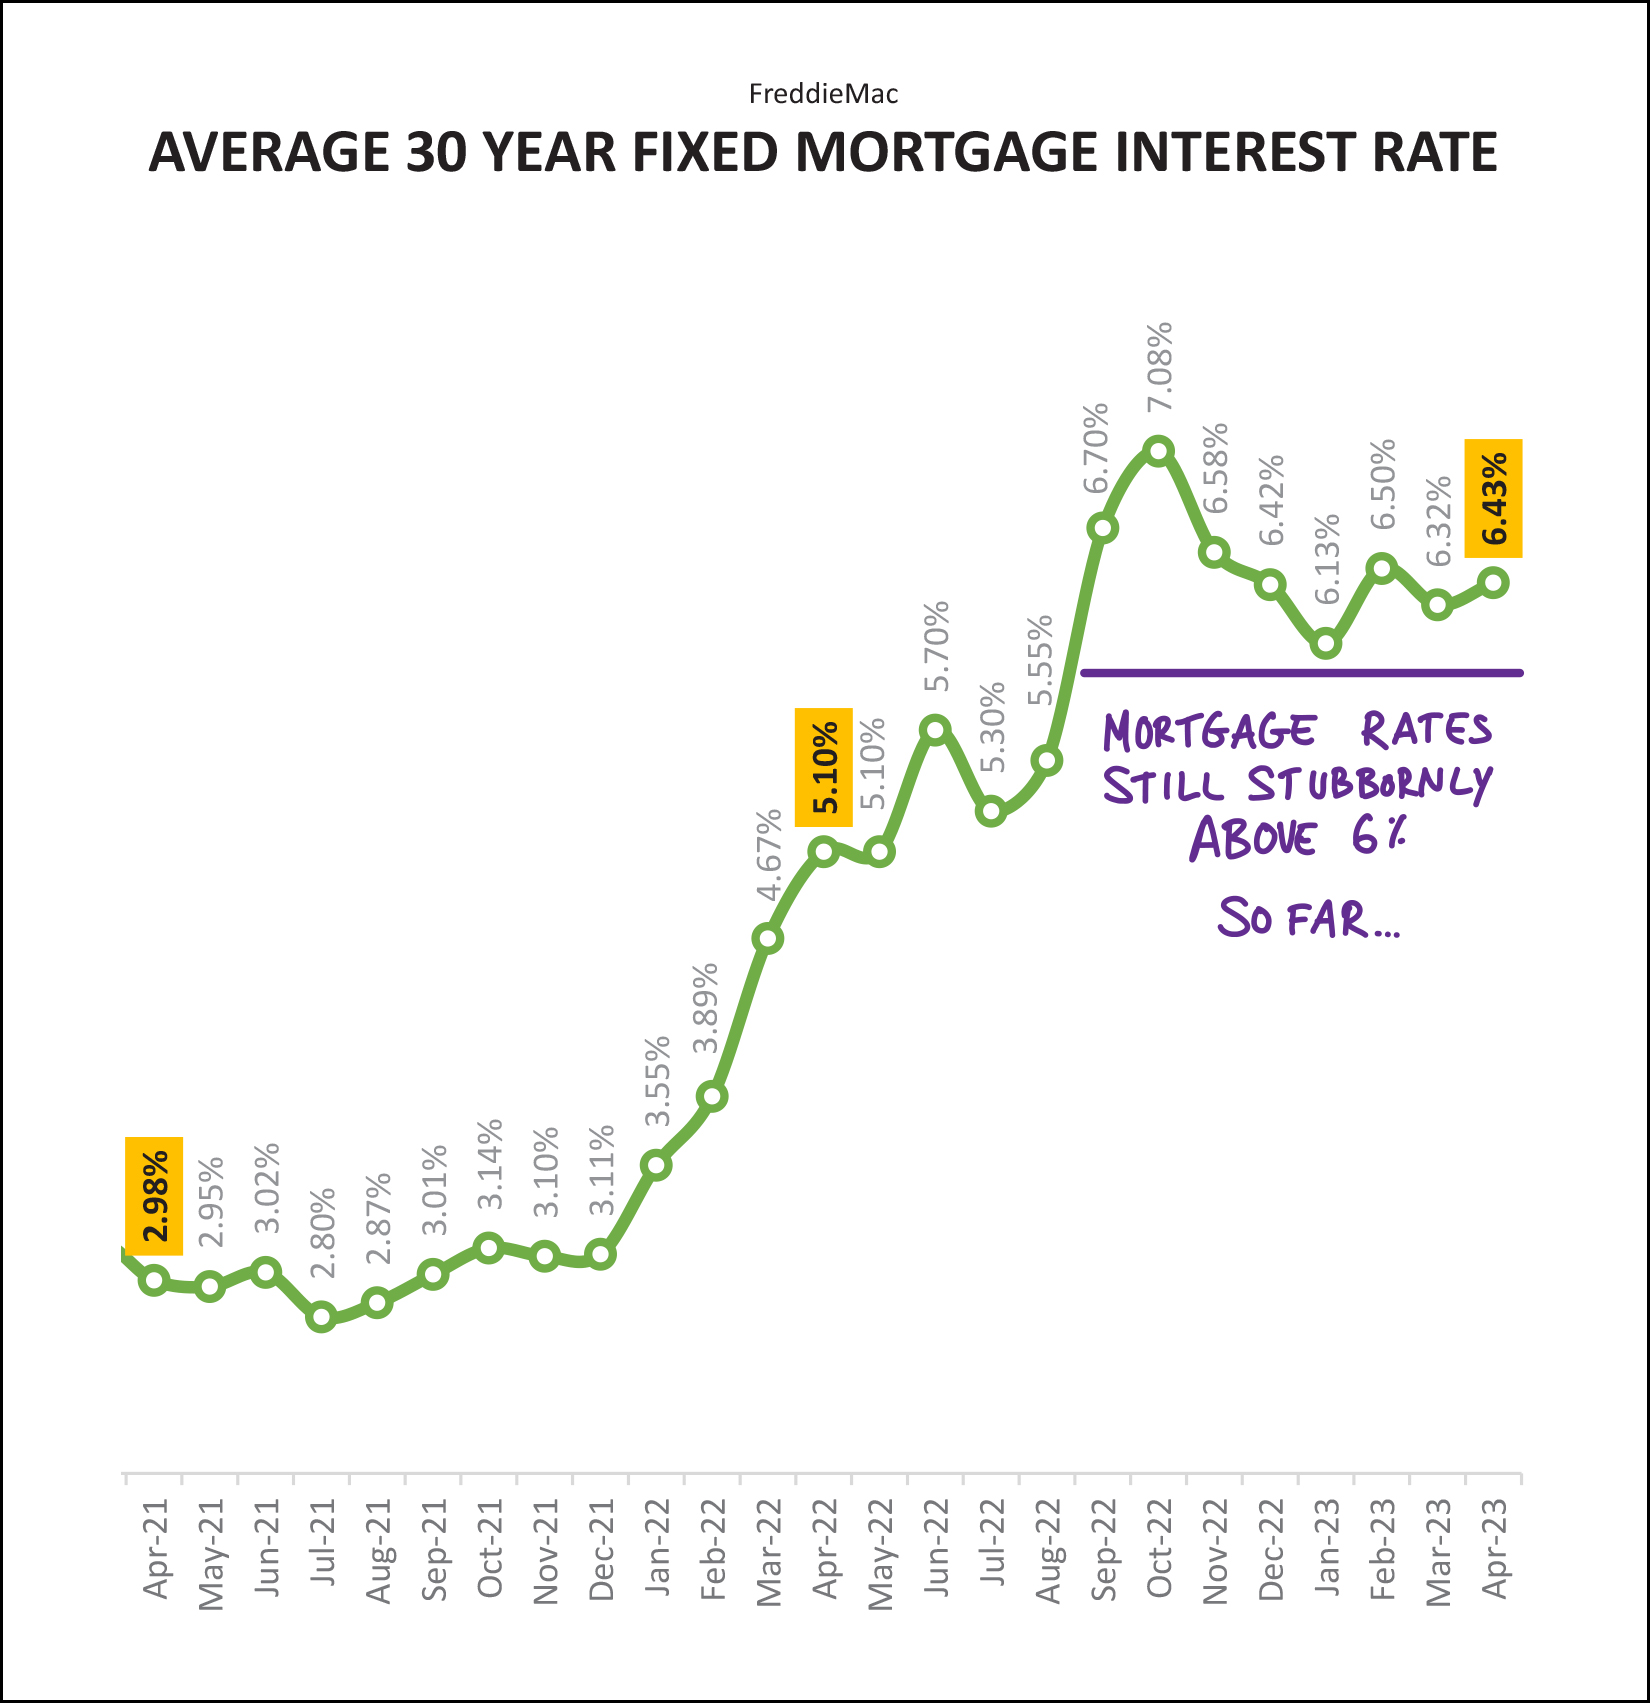 After multiple years of mortgage interest rates below 4%, we saw them climb quickly through the 5% range (within six months!) and they have stayed above 6% since that time. We are now entering the ninth month of most buyers likely buying homes with mortgage interest rates above 6%. These higher mortgage interest rates, combined with higher sales prices, are significantly increasing the monthly housing cost for any would-be home buyer considering a purchase in 2023. Will mortgage interest rates edge back down below 6%? I think there's a chance they will later in 2023, but it is certainly not... certain. ;-) So... given all of this data, given all of these trends, where does this leave us? Home buyers should still be prepared to go see new listings quickly when they hit the market, and must have their lender on speed dial to confirm a potential mortgage payment given ever changing mortgage interest rates. Depending on the popularity of the home you will be buying, we may very well still be competing with multiple other offers and considering which contingencies you might be willing to omit from your offer. You'll be buying in a challenging market for buyers -- with limited inventory and increasing prices. Buying a home in 2023 is definitely still possible, but it will require patience and perseverance. Home sellers are still in good (great) shape with lots of buyer demand in many or most price ranges... but home sellers should *not* assume that they will definitely have multiple offers, over asking price, with limited contingencies. That might be the situation you find yourself in (hooray!) but if you only have one offer, at the asking price, with some "normal" contingencies - I'll encourage you to still be excited. Pricing your home appropriately, preparing it thoroughly and marketing it professionally are just as important as ever in 2023. That's all for today, friends. I hope you now consider yourself a bit more informed about our local housing market, and a bit hungrier for a delicious meal at The Little Grill. ;-) The next month or so is a busy time for many of us with school years ending, summer beginning, and many other changes. Even as the days inevitably seem to start moving by more quickly than ever, I hope you are able find the time to slow down and meaningfully connect with the people who are important in your life. Send a friend, family member, neighbor or colleague a quick text to check in - or give them a call just to say hello. Make the time to make those connections, and I'm confident you will be glad that you did so. As always, please reach out anytime if I can be of help to you -- with real estate or otherwise. You can reach me most easily at 540-578-0102 (call/text) or by email here. | |
Home Prices Still On The Rise Despite Fewer Home Sales In 2023 |
|
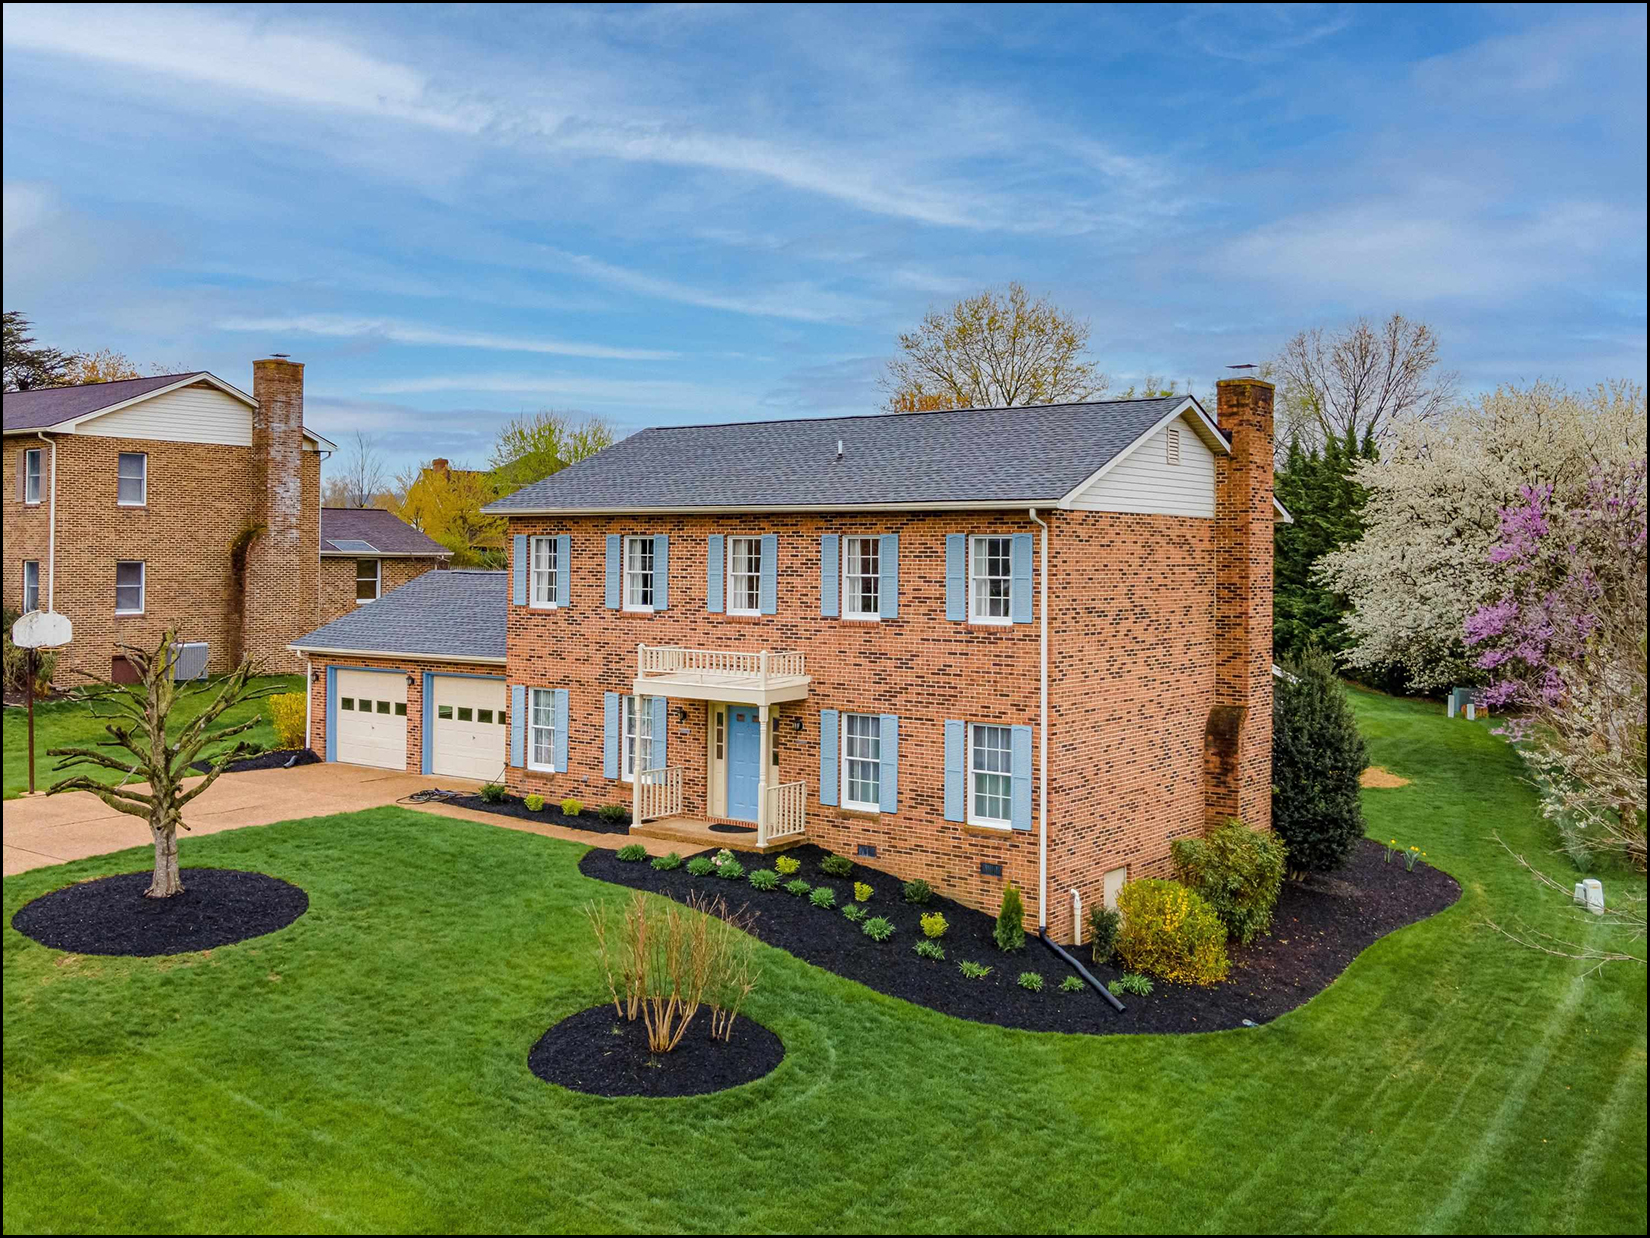
 Happy Thursday afternoon, friends! The spring real estate market is upon us -- though it looks and feels a bit different than it did over the past few years. Read on for stories of fewer home sales, rising prices and stubbornly low inventory levels. Speaking of spring... if you're looking for a home with landscaping that really pops each March, check out this beautiful, four bedroom, brick home over on Meadowlark Drive that came on the market earlier this week... On a personal note, can you spot any proud parents of a soon-to-be high school graduate in the photo below? :-) Wow, the past 18-ish years have flown by quickly. Luke will be graduating in early June and Shaena and I couldn't be more proud of this guy!  << Insert Here: Quick transition to some other topic so I can stop thinking about how old I must be if my son is about to be a high school graduate!?! >> OK, then... Each month I offer a giveaway, of sorts, for readers of this market report, highlighting some of my favorite places, things or events in Harrisonburg. Recent highlights have included Taste of India, A Bowl of Good and a Steel Wheels concert. This month... I'm giving away a $50 gift card to one of my favorite lunch (or dinner) spots downtown... Cuban Burger! I almost always order the Cuban Chop Chop with Chicken, but everything on their menu seems likely to be delicious! Click here to enter for a chance to win the $50 gift card! And now... let's move on along to the most recent data on our local real estate market. First, let's see what "fewer home sales" looks like right now... 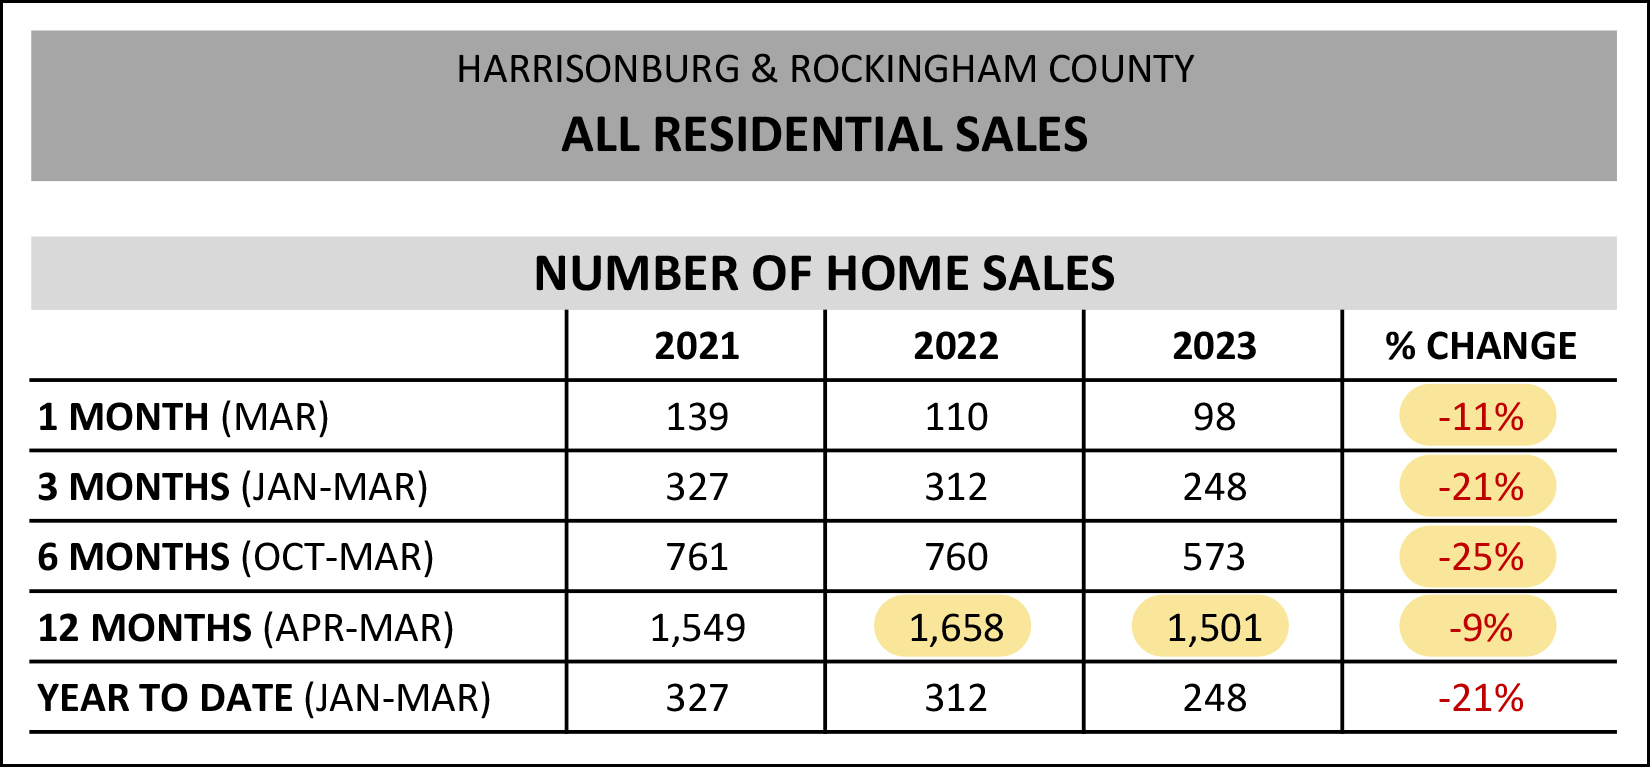 A few observations related to the chart above... [1] While the number of home sales taking place this March was 11% lower than a year ago -- that's not quite as much of a drop as we see when we look at the past three months (-21%) or the past six months (-25%). So, maybe things are picking back up -- a bit -- here in March? Maybe? [2] There have been 1,501 home sales over the past year in Harrisonburg and Rockingham County which is a 9% drop from the previous 12 months when there were 1,658 home sales. This drop of 157 home sales for the year seems almost certainly to be a one-sided supply side issue -- not enough sellers selling. You'll note later on in this report that inventory levels haven't risen by 157 homes (due to buyers not wanting to buy) so the constraint on the number of home sales is almost certainly directly tied to how many sellers want to or are willing to sell. But despite fewer homes selling, home prices keep on rising...  Yes, we could pick on the one red number on the chart above -- showing a 1% decline in the median sales price between March 2022 and March 2023 -- but the small sample size (of one month of data) means that this is not necessarily a meaningful indicator of an actual downward trend. This is made even more evident by the 10% - 11% increases in the median sales price when looking at three, six and 12 months of data in the chart above. Perhaps more importantly, yes, we're still seeing double digit annual increases in the median sales price in Harrisonburg and Rockingham County. One year ago the median sales price was $276,200. It has risen 10% over the past year, cleared $300K, and is now at $304,900. Just to refresh one's memory on what "median" signifies -- it means that half of the homes that are selling are priced at or above $304,900 and half are at or below $304,900. Prices just keep on rising! Buyers who are frustrated that they can't wait even just a day to make a decision about an offer on a hot new listing might be encouraged by these next stats...  There has been an ever so slight (ok, technically 20%) increase in the median days on market stat over the past year. A year ago homes were going under contract after a median of five days... and now that has risen to... six days. Yes, I know, that one day might not seem that significant -- but if we look at just the past three months we'll note that the median days on market has jumped up to eight days! So, some new listings are lasting an extra day (or three) on the market before they're going under contract. So, the market is slowing down... barely. It will be interesting to see if this metric continues to rise, falls again, or stays at about the same level as we move into and through the spring market. Now, as to what is actually selling, there are some interesting trends to be noted between existing homes and new homes. I have highlighted the numbers below that I think deserve attention. Here's the existing home sales data... 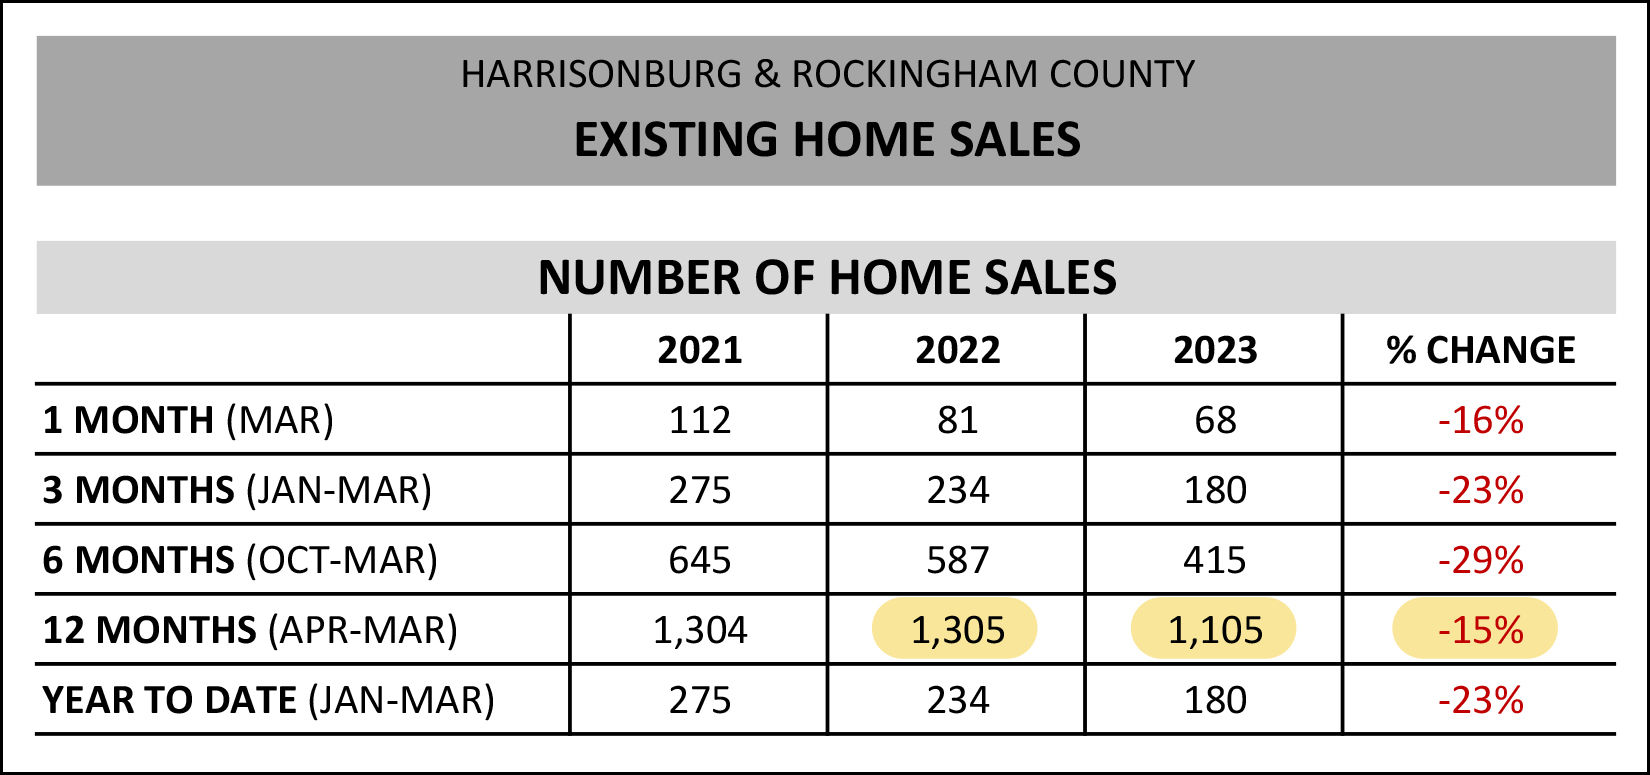 ...and here's the new home sales data... 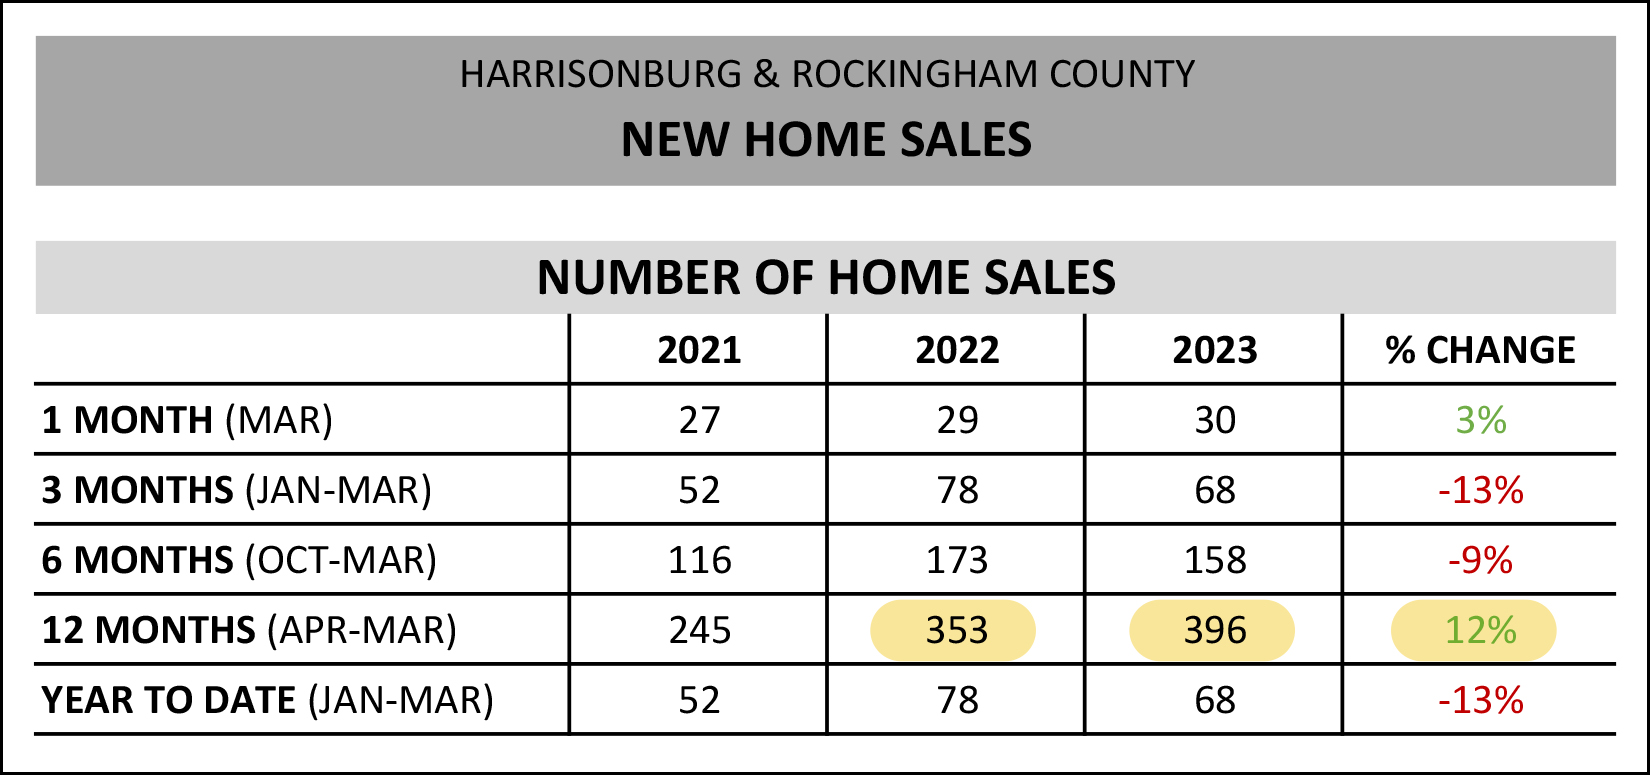 So, while the overall market has seen a 9% decline in home sales over the past year... [1] There has been a 15% decline in existing home sales. [2] There has been a 12% increase in new home sales. If you want to buy a home that is of the property type, size, price and location of one of our area's new home communities -- these trends work in your favor. If you want to buy an existing home (not a new home) in an established neighborhood -- these trends aren't all that exciting. There haven't been 9% fewer homes to buy over the past year -- there have been 15% fewer homes to buy!?! Now, circling back to the monthly data... 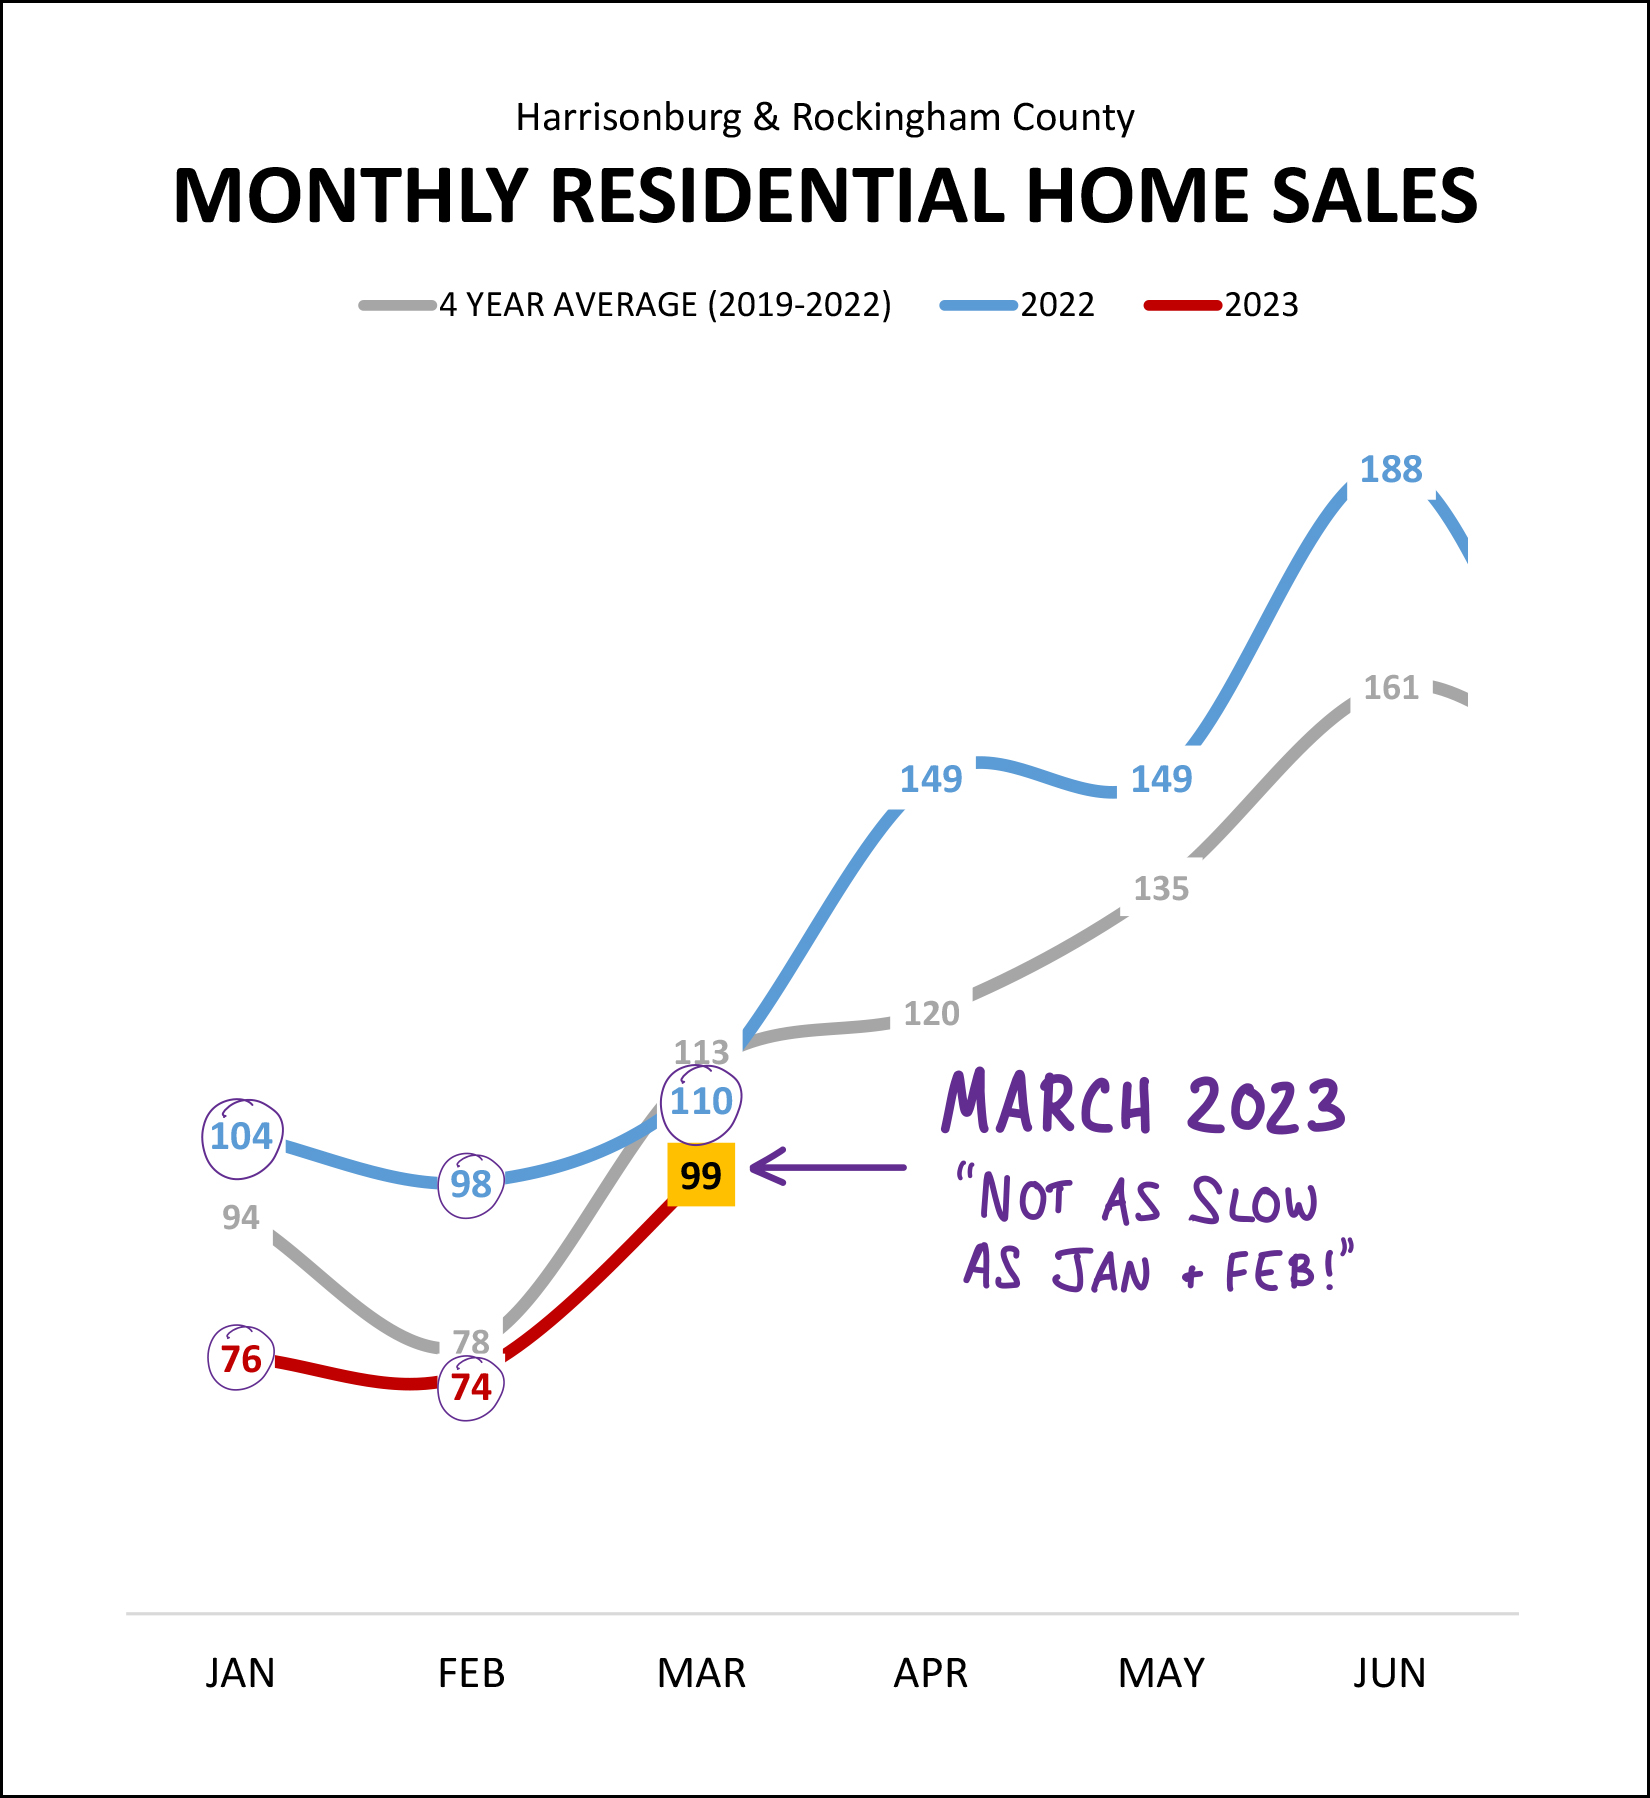 March was... not as slow as January and February!?! ;-) We saw significantly fewer home sales this past January and February as compared to the same month last year. January sales were 27% below the prior year. February sales were 24% below the prior year. March sales were only... 10% below the prior year! So, I suppose that's a bit encouraging... we're starting to see a slight increase in monthly home sales... though yes, we're definitely still well behind 2022. And for anyone who likes a good participation trophy... 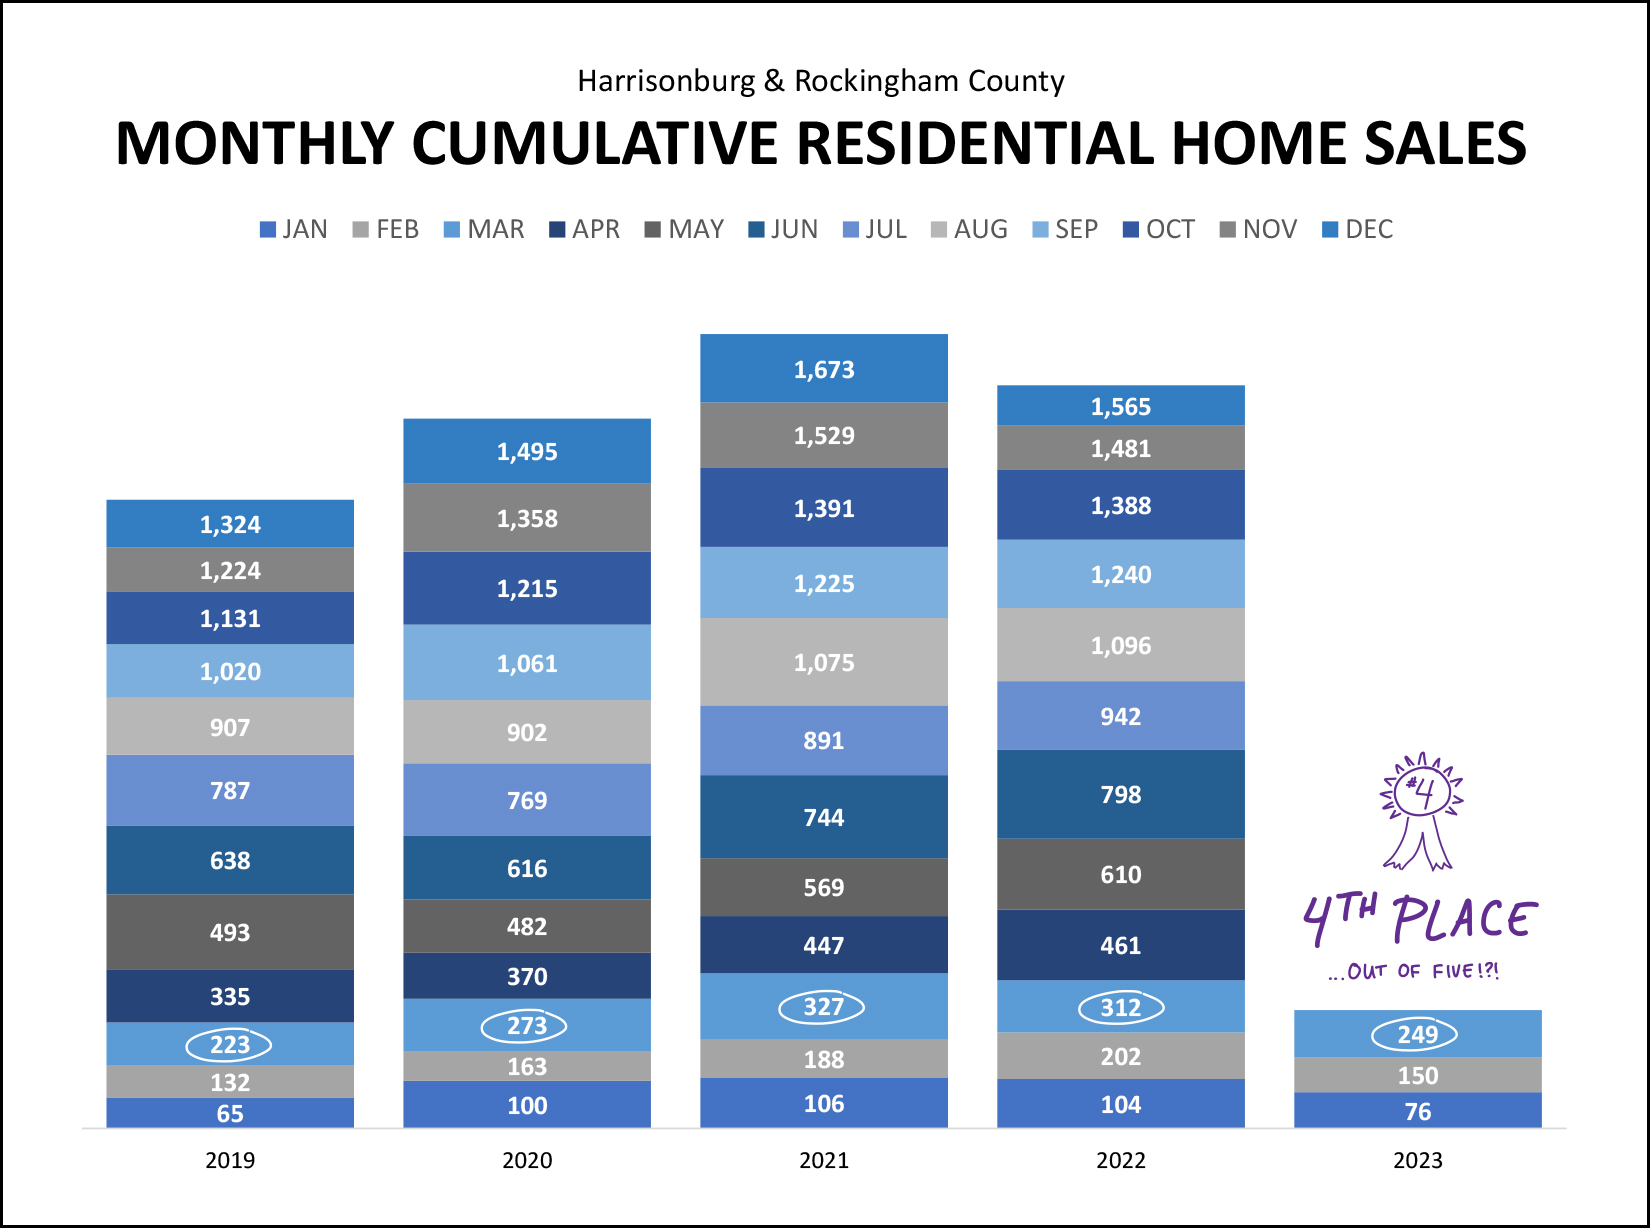 ... First Quarter Home Sales In 2023 came in at... 4th Place... oh, out of five contestants! Indeed, the 249 home sales we have seen in the first quarter of 2023 was fewer than we saw in 2020, 2021 and 2022. We are slightly ahead of the first quarter of 2019, though, so there's that... Looking at the big picture of our market over the past few years, in visual form... 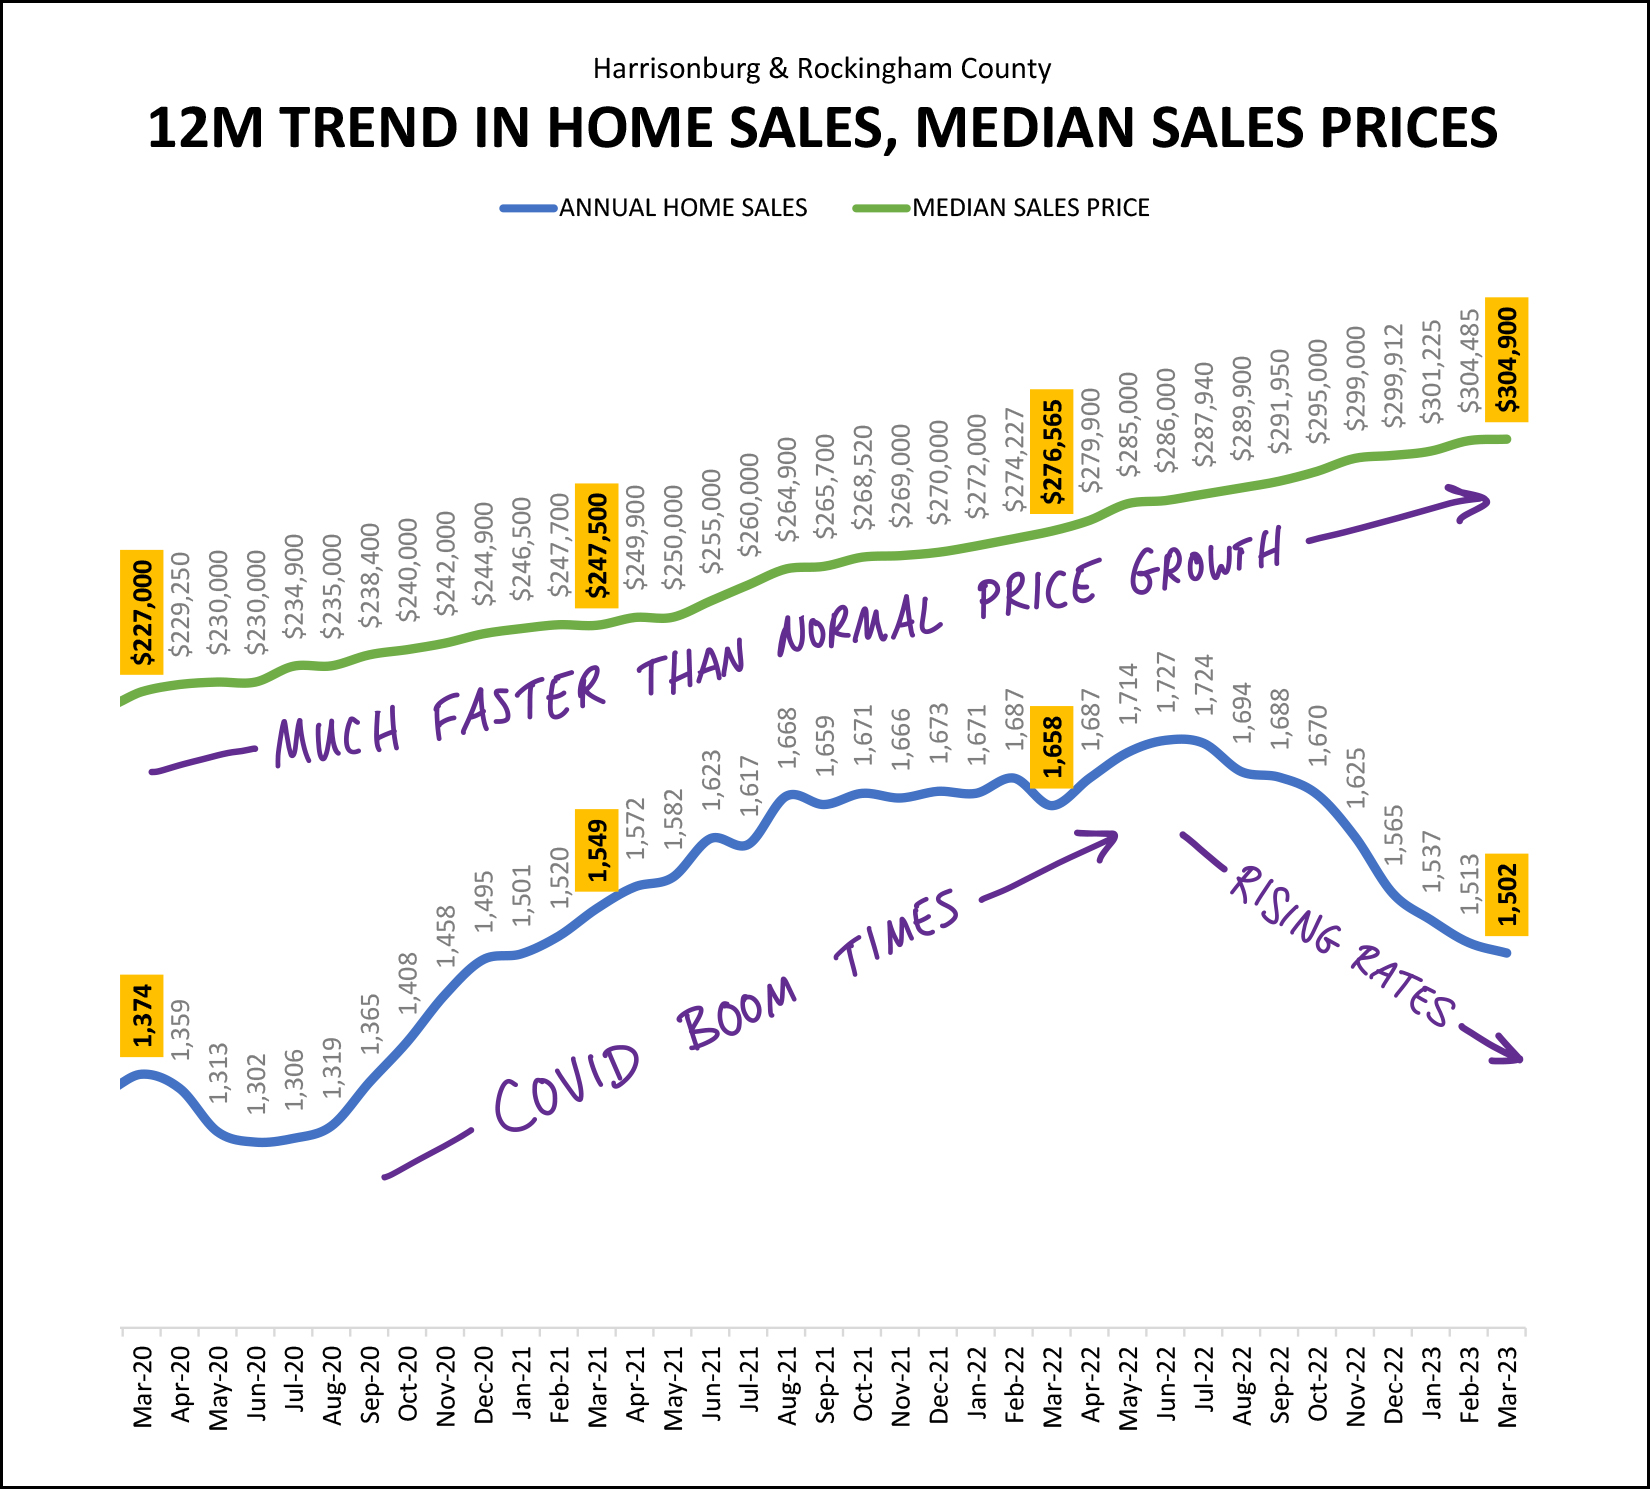 There are two main things to note in the graph above... [1] Home prices have been increasing at a much faster pace than is historically normal. We're in the third year in a row of double digit (per year) increases in the median sales price in our area. [2] After a two year boom in the number of homes selling (due to Covid and super low interest rates) we are now almost a year into a steady decline in annual home sales (from 1,727 per year to 1,502 per year) mostly related to rising mortgage interest rates. Now, let's look ahead by looking behind... 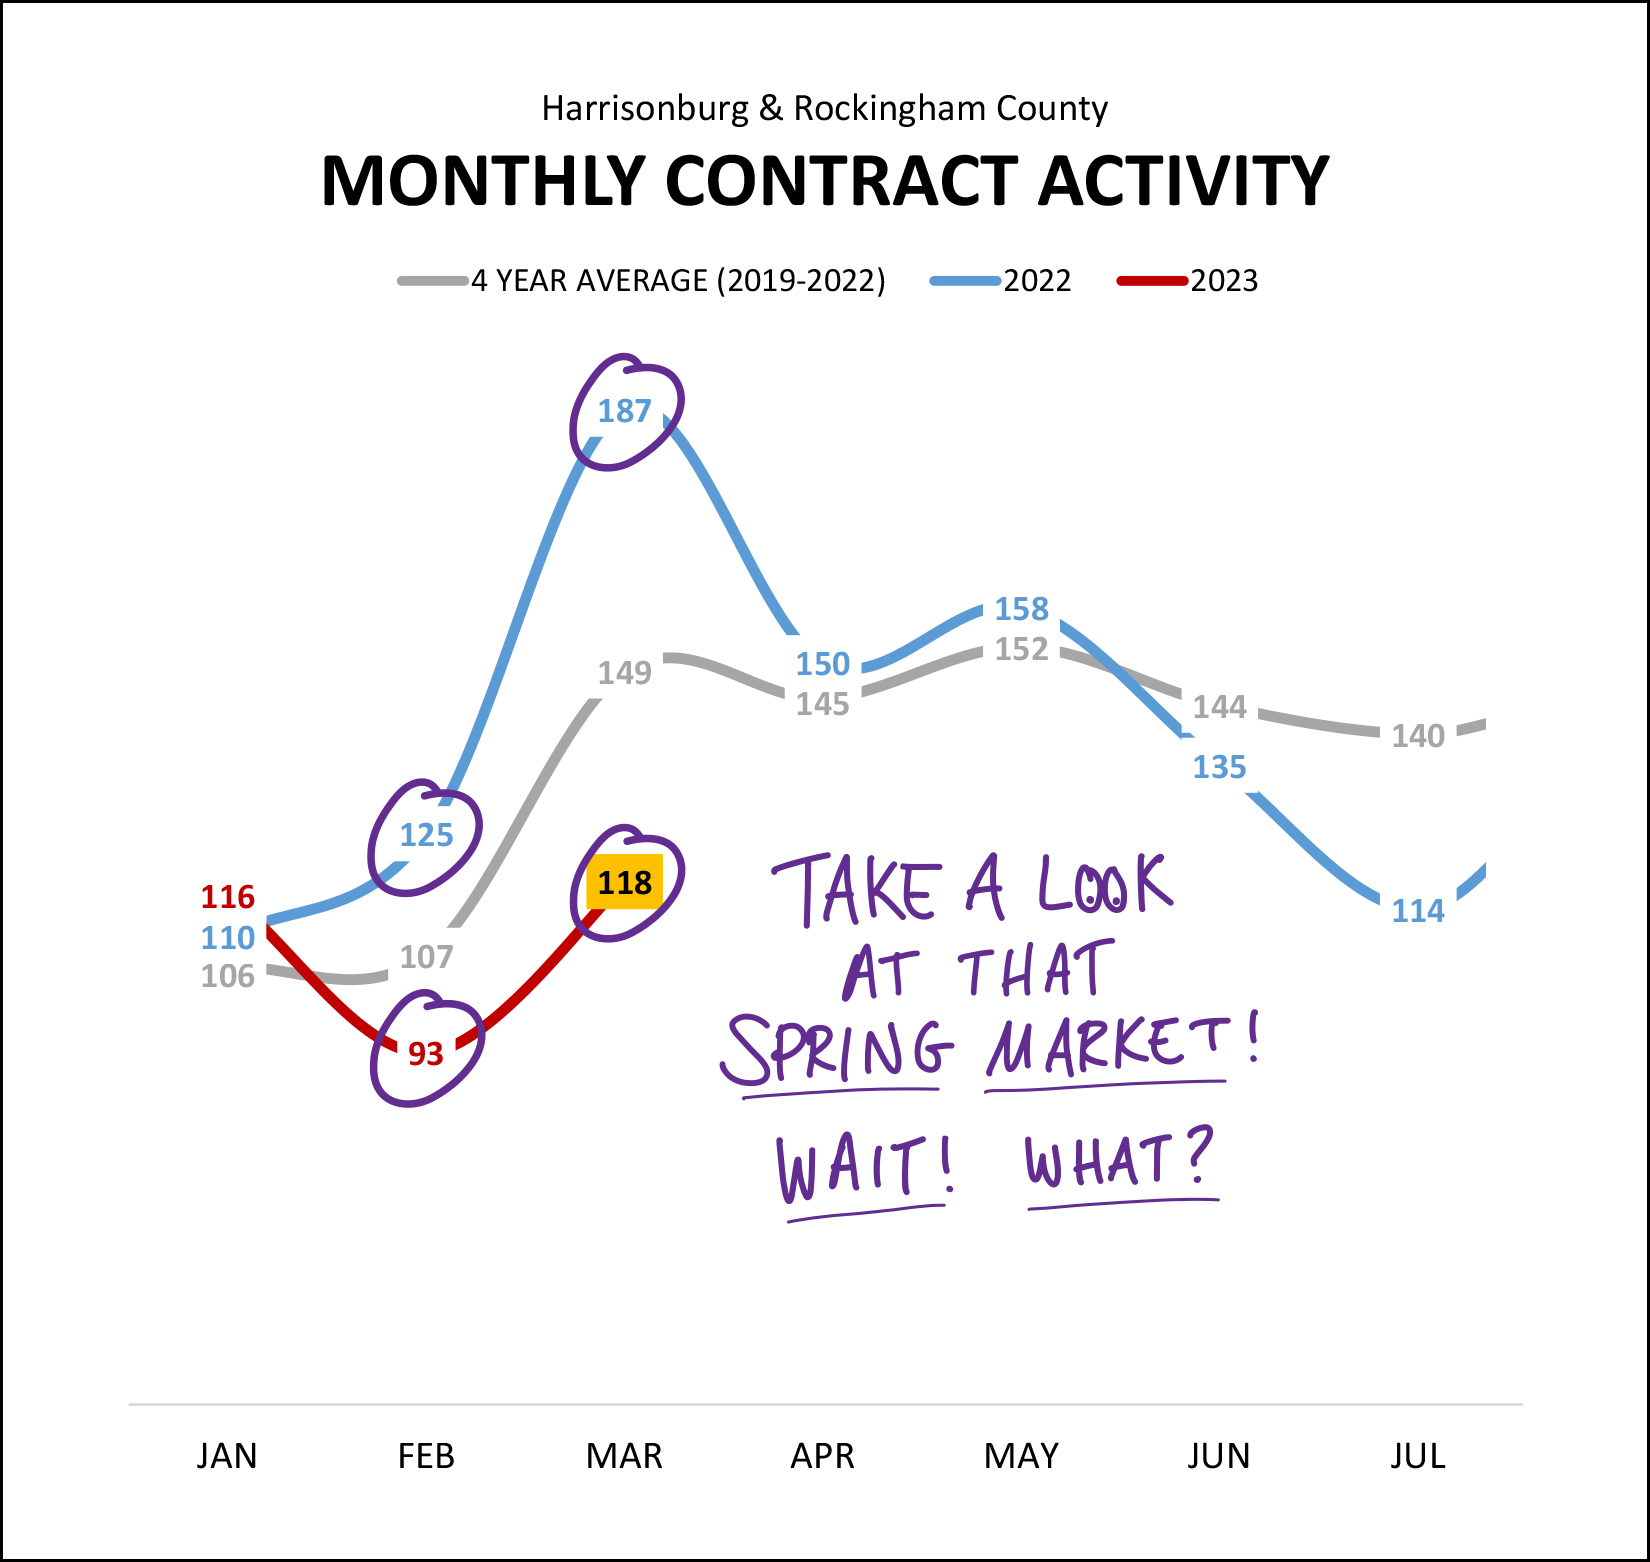 Home sales this month are most directly influenced by contracts last month. So, how did things go in the March market? Lots of sellers listing their homes for sale? Lots of buyers contracting to buy homes? Well... not really. [1] Contract activity declined 26% in February 2023 compared to February 2022. [2] Contract activity declined 37% in March 2023 compared to March 2023. So, yeah, the spring market (sooo many listings, sooo many contracts) doesn't quite seem to be showing up this year like it did last year. Maybe the buyers (and much more importantly, the sellers) will start showing up in April? Unsurprisingly, several slow months of signed contracts brings on a lower than ever number of pending sales in Harrisonburg and Rockingham County... 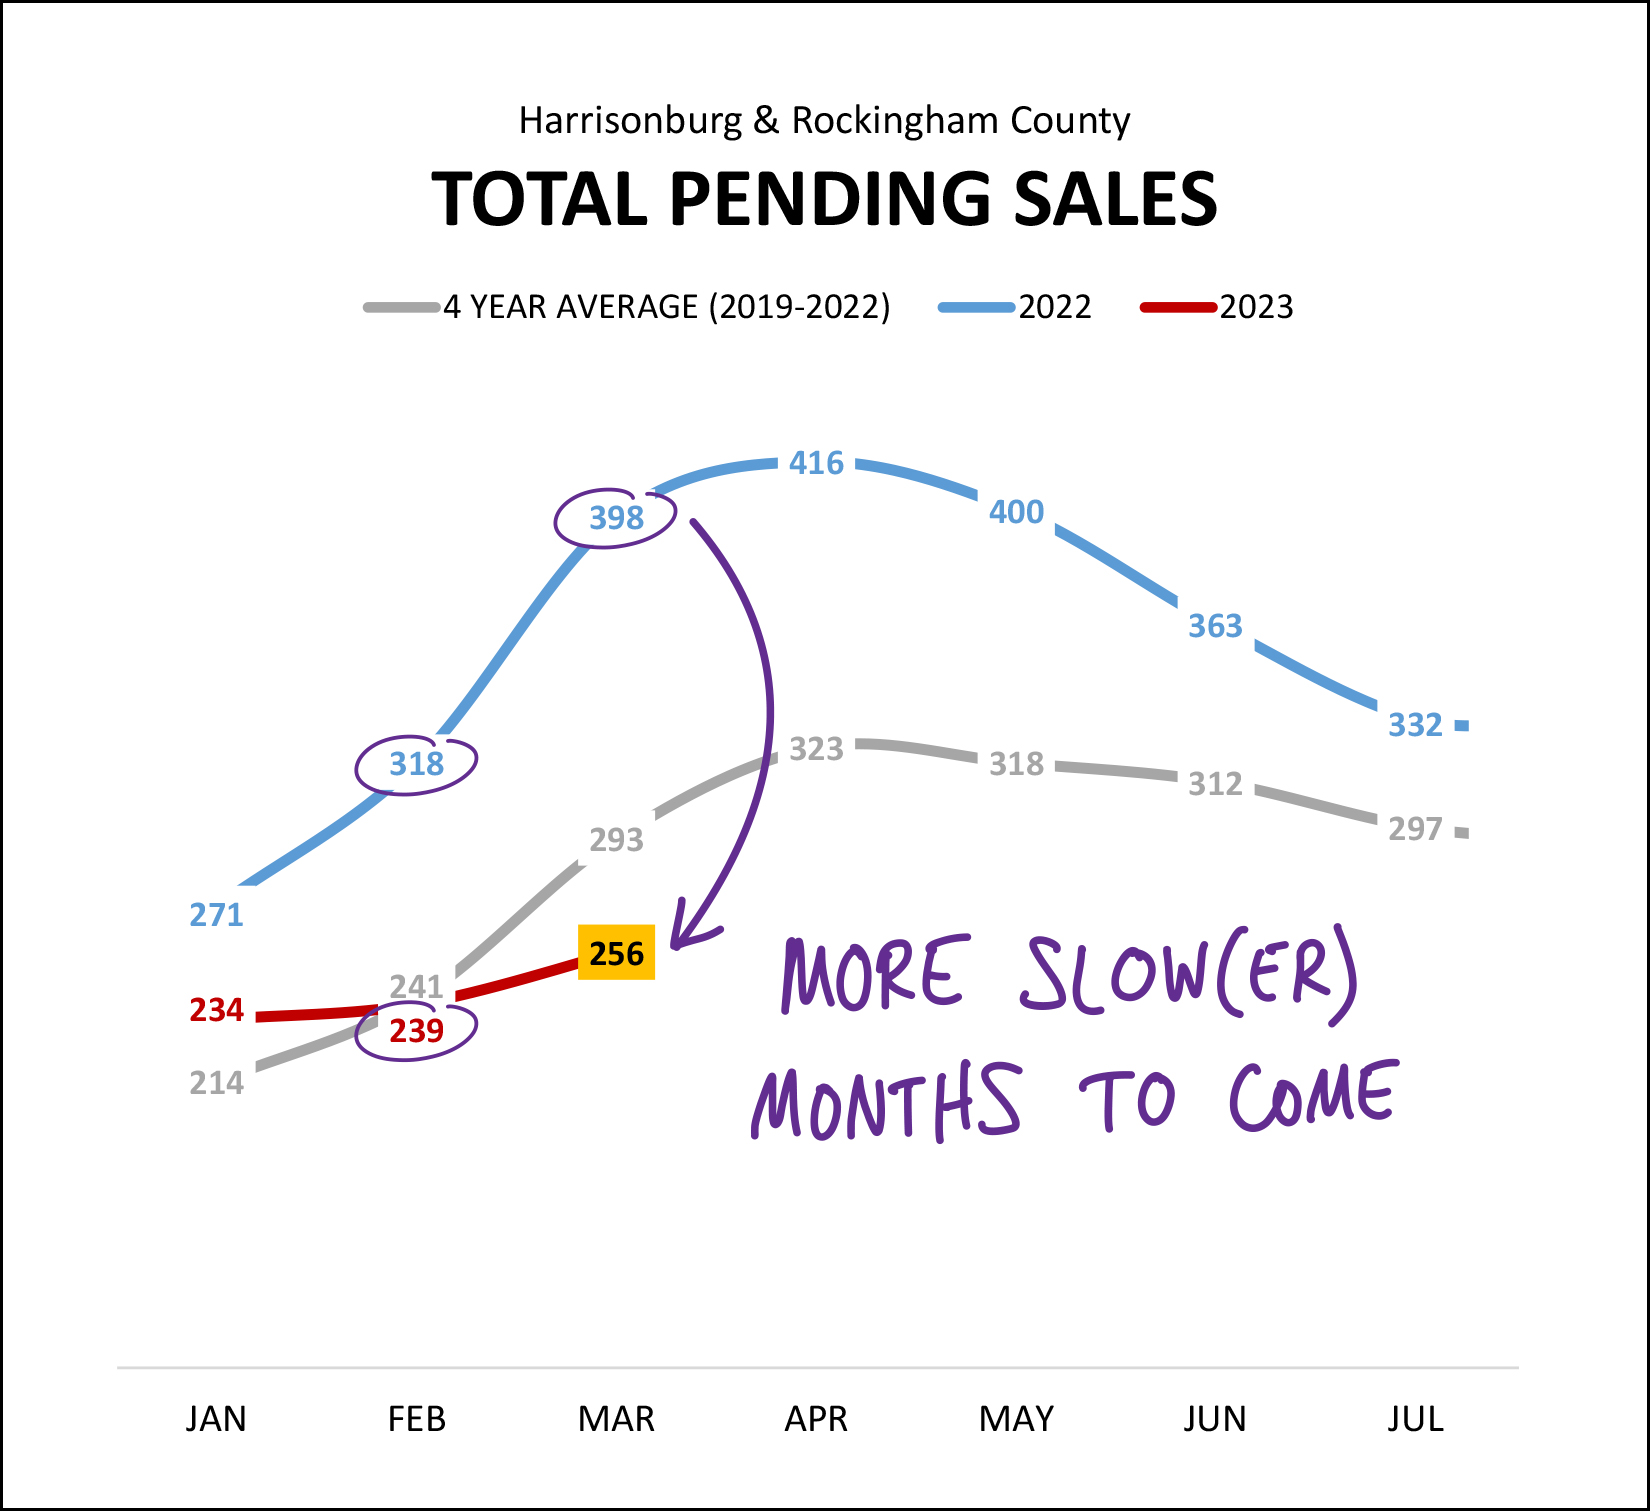 There are 256 homes currently under contract in Harrisonburg and Rockingham County. One year ago there were 398 (!!!) homes under contract. Over the past four years we've seen an average of 293 homes under contract at this time of year. So, yeah, based on the low number of pending sales right now, we are likely to see at least another month or two (or more!?) of slow(er) months of home sales. Why have there been so few homes going under contract? Are the listings pouring onto the market and buyers are just deciding not to buy? If that were the case, we'd see inventory levels starting to climb, so, let's take a look... 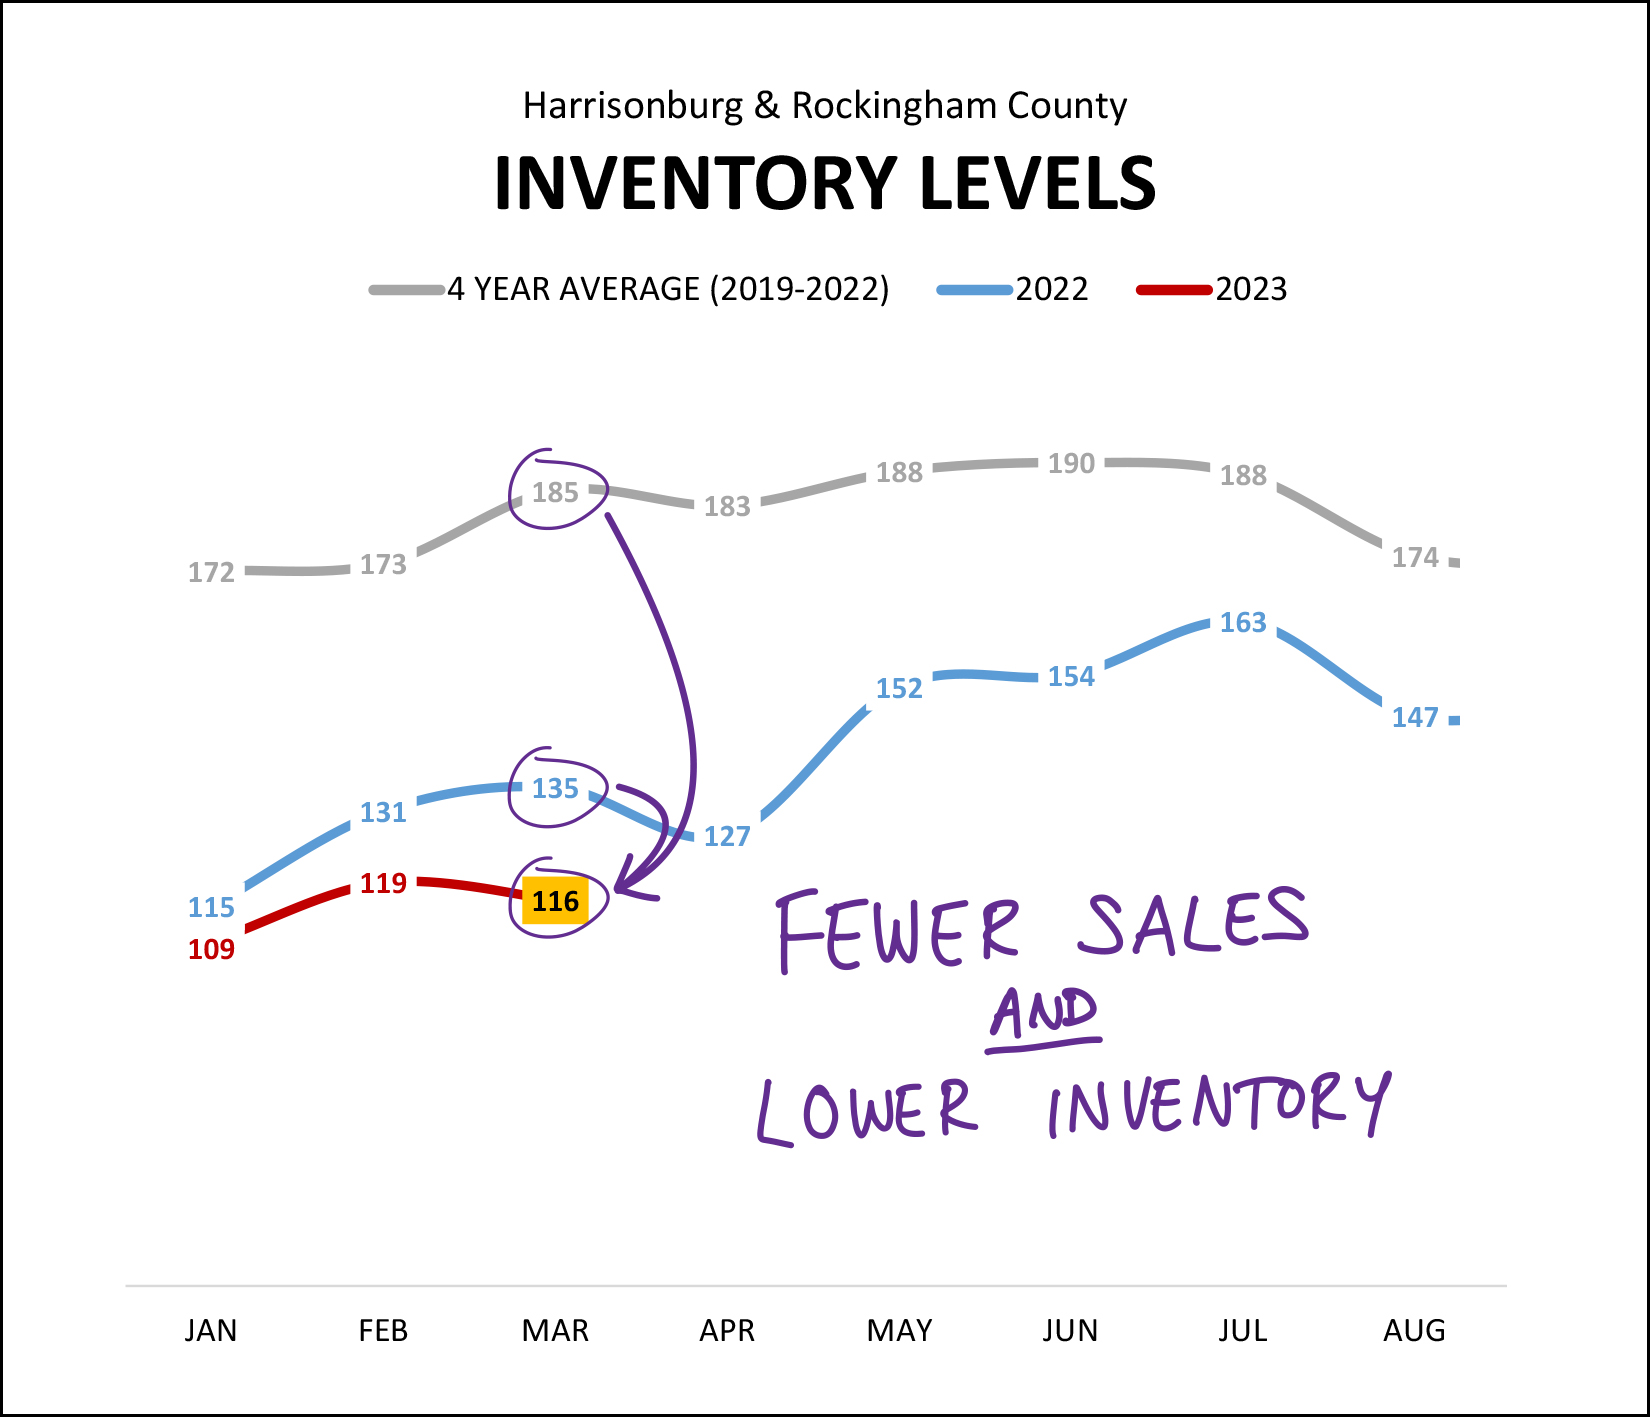 In fact, no, inventory levels are not rising. They are staying stubbornly low. There are 116 homes on the market right now (for sale, not under contract) in Harrisonburg and Rockingham County. This is compared to 135 being on the market a year ago at this time... and an average of 185 being on the market over the past four years at this time of year. So, buyers seem to not be buying because... there's nothing to buy. Or, at least, there's less to buy. Plenty of homes (-9% year over year) are still selling, but this decline in sales activity seems to still be entirely related to sellers not selling, and not related to buyers not buying. And yet, despite inventory levels staying super low, we are actually seeing a slightly change in how quickly homes are going under contract... 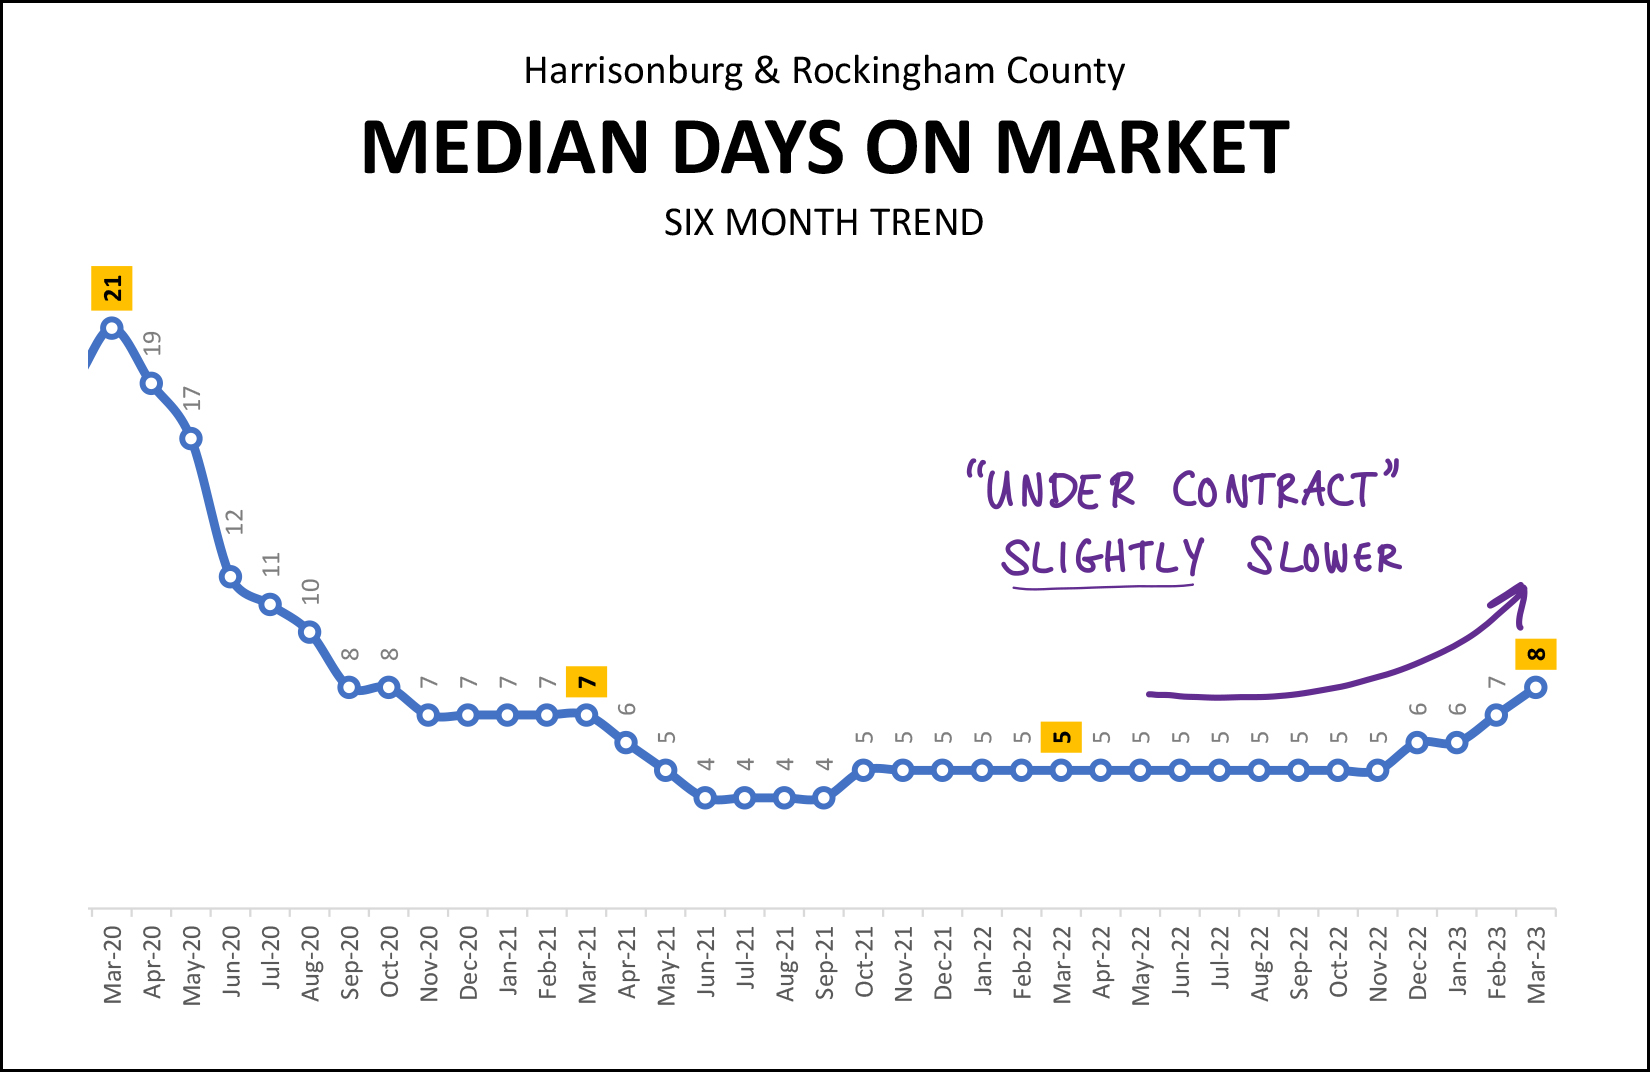 Over the past six months the "median days on market" has been eight days in Harrisonburg and Rockingham County. That means that half of the homes that have sold were under contract within eight days of hitting the market and half were under contract in eight or greater days. The change here is a slight increase from five days up to eight days over the past few months. We were seeing a median days on market of six days or less for almost two straight years (April 2021 - January 2023) but that is starting to drift upwards a bit. So, (some) listings are lasting an extra day or two (or three) on the market right now -- though these days on the market levels are still well below long term historical norms. Maybe it's taking buyers an extra day or two to make an offer because they have to keep checking in with their lender because rates are constantly jumping up and down from week to week and month to month? 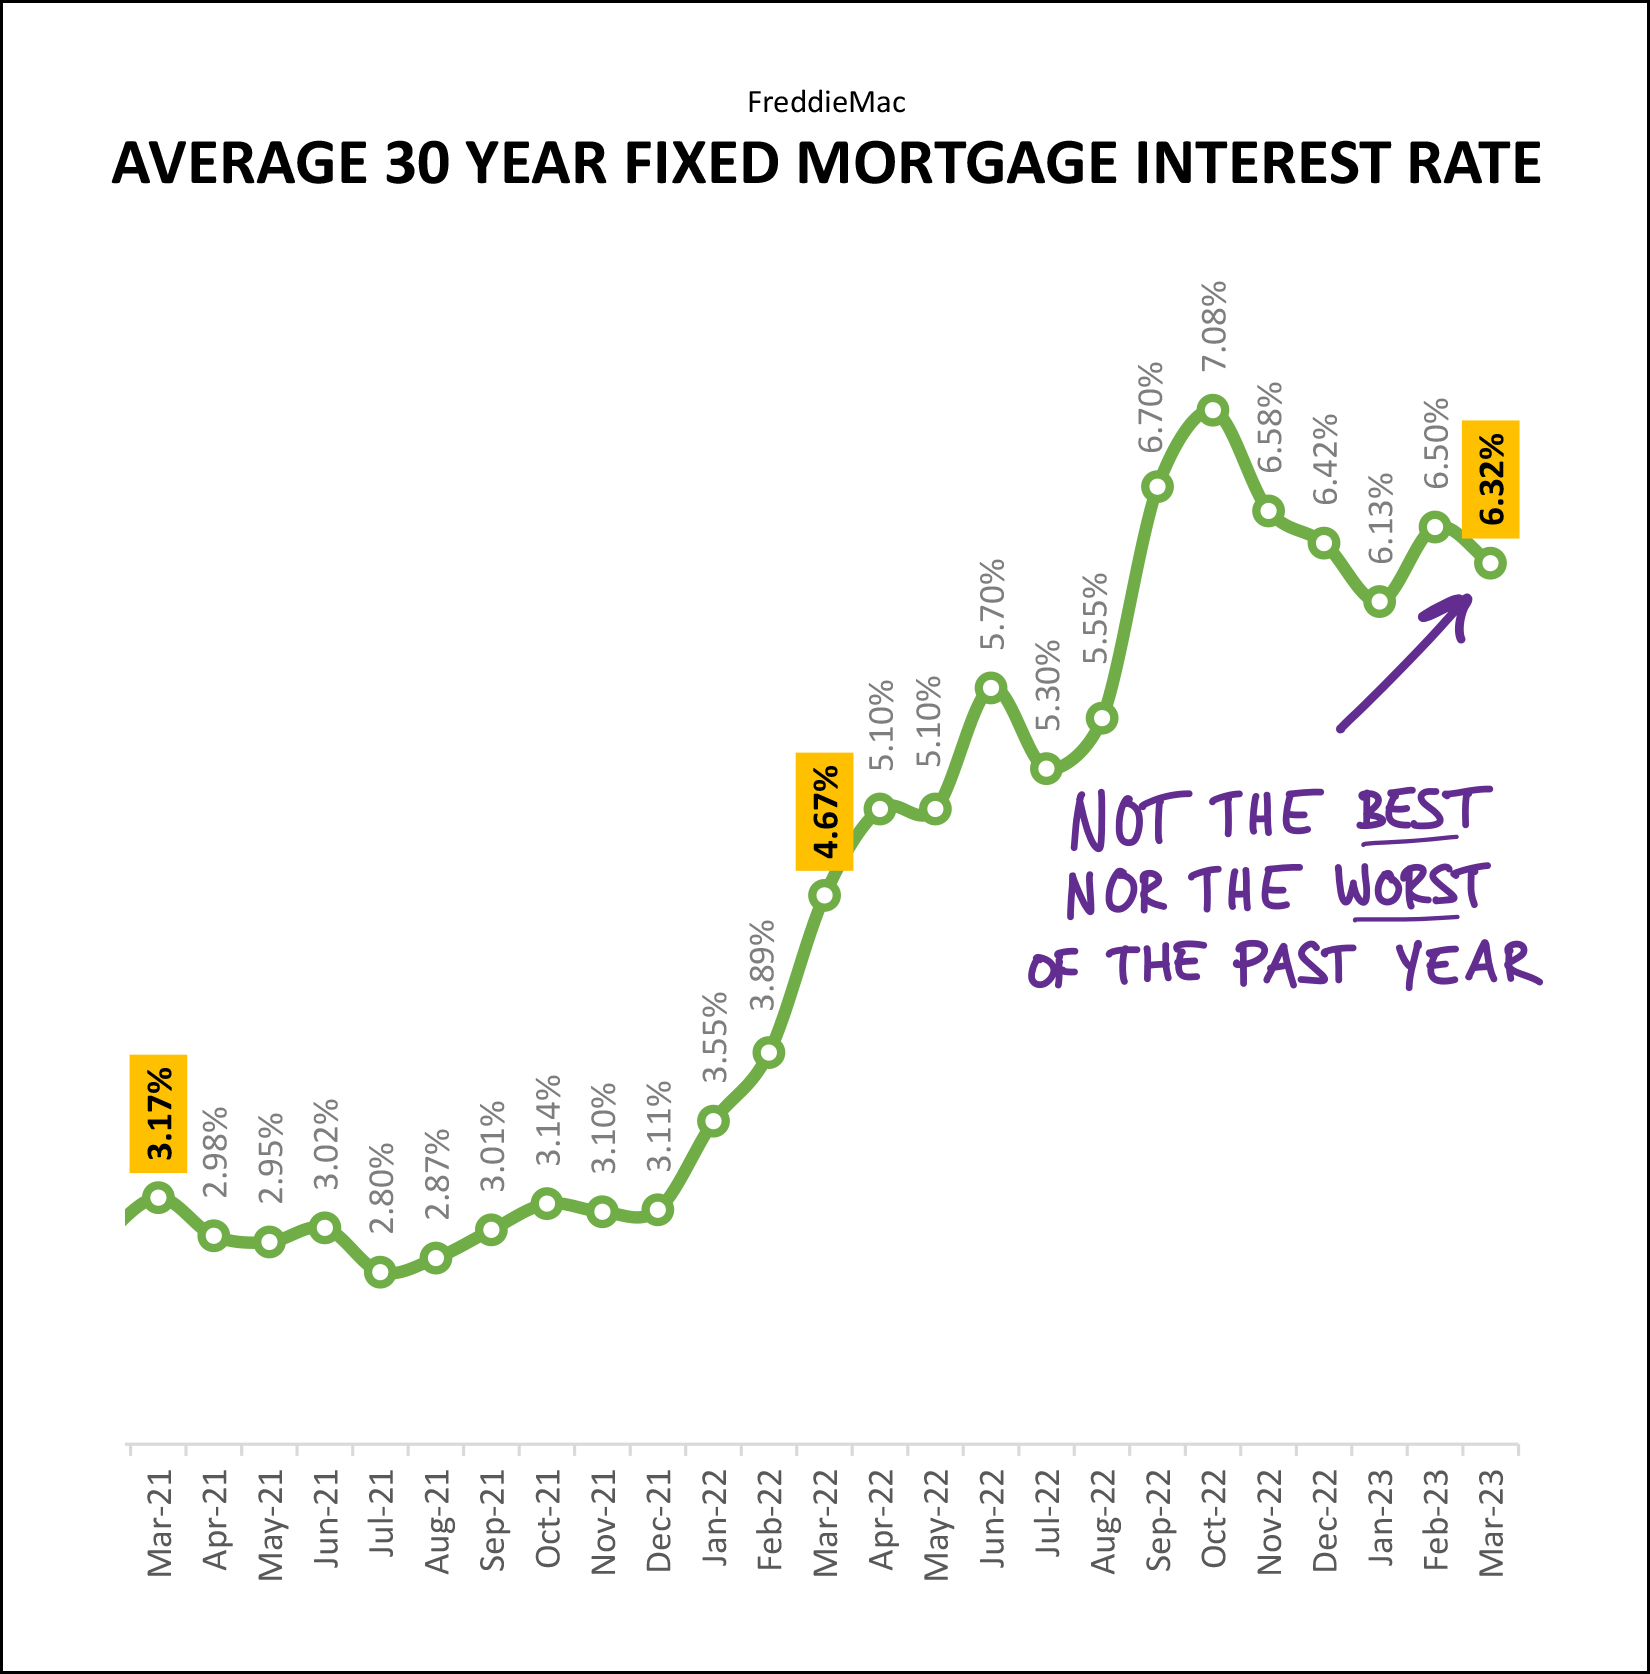 Rates dropped in March, after rising in February, after dropping in January -- you get the picture. We're currently seeing mortgage interest rates that are definitely and absolutely not the best we've seen in the past year -- but that also are a good bit below the worst that we've seen in the past year. Where mortgage interest rates go from here is anyone's guess -- but I'm thinking they will continue to fluctuate on a weekly and monthly basis for much of 2023. OK! That was a lot of data, and charts and graphs, oh my! If you made it all the way to the end, thanks for reading and I hope you are feeling more informed than ever as to the latest trends in our local housing market. If you're thinking about selling your home this spring or summer -- all of the would-be buyers of Harrisonburg and Rockingham County would REALLY like you to decide to do so. ;-) Let me know if you'd like to set up a time to walk through your home together to talk about preparations, pricing, timing, etc. If you're hoping to buy a home this spring or summer -- I'd be delighted to be in your corner helping you navigate this rapidly moving, competitive market. Let's chat about what you're hoping to buy, get you connected to a local lender to become pre-approved, and then let's try not to develop a twitch as we keep checking for new listings again, again, again and again. That's all for today, folks. I hope the balance of your month of April goes well and that you aren't struggling too much with the seasonal allergies that seem to affect so many of us at this time of year. I think the beauty of the blooming flowers and trees generally outweigh the not-so-exciting allergy symptoms that I'm currently working through. Be in touch anytime if I can be of help to you -- with real estate or otherwise. You can reach me most easily at 540-578-0102 (call/text) or by email here. P.S. If you want even more charts and graphs than I have included above, you'll find them here. | |
First Look At Contract Activity In March 2023 |
|
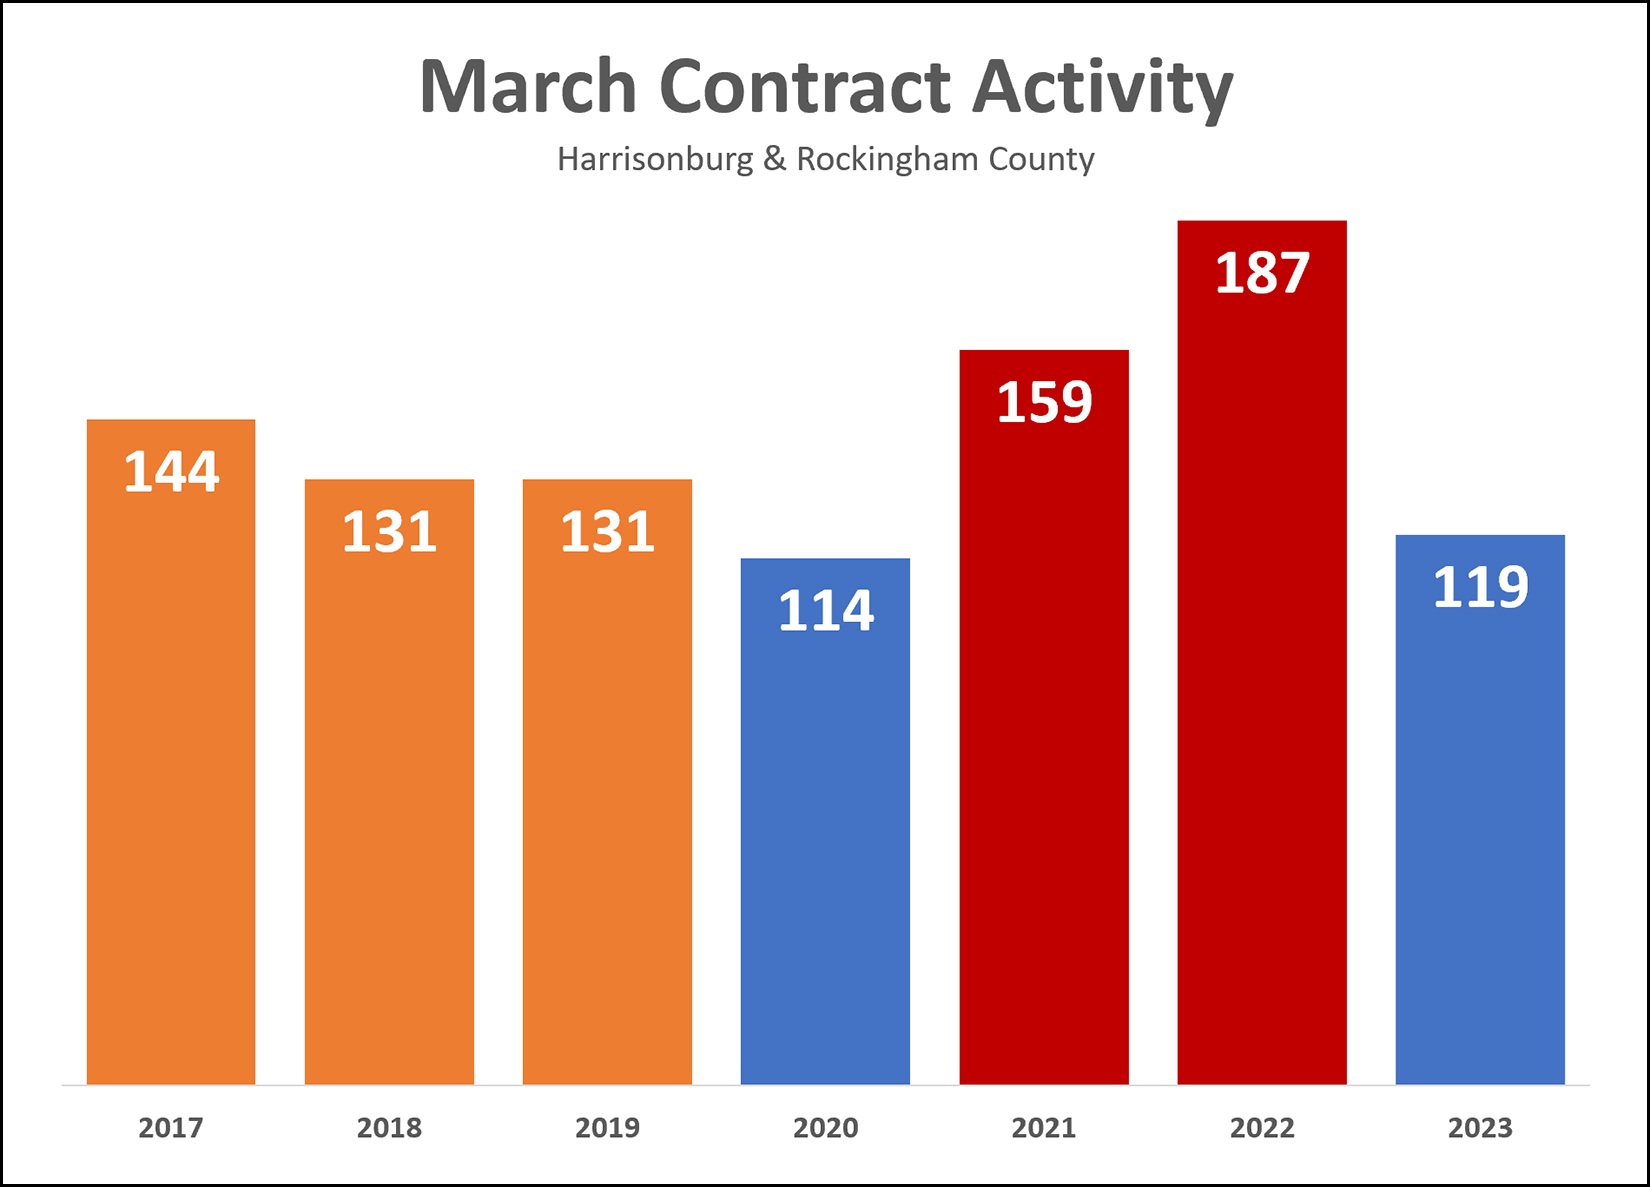 In the next week or so I'll provide a much fuller analysis of what March (and the first quarter of 2023) looked like here in the Harrisonburg and Rockingham County real estate market. Until then, here's a first look at buyer activity last month. A total of 119 home buyers signed contracts to buy homes in March 2023... which is... [1] Much lower than the second and third March of Covid -- 2021 and 2022 -- when mortgage interest rates were super low and buyers were stumbling over themselves to buy. [2] Slightly higher than the first March of Covid -- 2020 -- when we were all still trying to figure out what Covid was and how it would impact the economy and housing market. [3] A good bit lower than the three years just before Covid -- 2017, 2018 and 2019. Housing inventory levels still aren't rising, so I think the lower contract numbers are related to a limited number of sellers being willing to sell -- not related to a limited number of buyers being interested in buying. | |
Nationwide Median Sales Price Declines For First Time In More Than 10 Years... But, What About Locally? |
|
 I saw the headline over at CNN yesterday... home prices are falling (nationwide, barely) for the first time in over a decade. The median sales price of a home in the United States was $363,000 in February 2023... ...marking a (tiny) 0.2% decline from a year ago. How do those numbers compare to Harrisonburg and Rockingham County? February 2022 - February 2023
February 2023
So, as usual, we're just doing our own thing over here in Harrisonburg and Rockingham County. Will we see home prices decline in Harrisonburg and Rockingham County? Before that happen, we'd need to see them level out (stop going up) which isn't happening at this point. So, read the national news (if you must) but as usual, it's much more important to keep tabs on the local trends. | |
Buyer Demand Exceeds Supply In Varying Degrees By Price Range |
|
 As one might expect, there are more buyers able to and interested in buying a home for $200K than for $300K... and more buyers able to and interested in buying a home for $300K than for $400K. You get the picture. As such, we currently find buyer demand exceeding supply in varying degrees by price range. These numbers are completely made up, but are likely not too far off base given recent listings or transactions I have been a party to or have heard about in our local market... SHOWINGS IN WEEK ONE, BY PRICE RANGE:
If you're seeing more showings than outlined above, your house may be slightly more popular than the average house based on its location and condition - or you might have priced it "just right" for the current market. If you're seeing fewer showings than outlined above, your house maybe slightly less popular than the average house based on it's location and condition - or you might have priced it "a bit too high" for the current market. Again, the data above is completely fictional (not based on actual showing data) but is included to paint a general picture of the differing amounts of buyer demand in different price ranges in the current market. | |
Pending Home Sales Data Points To Slower Months Of Home Sales Ahead |
|
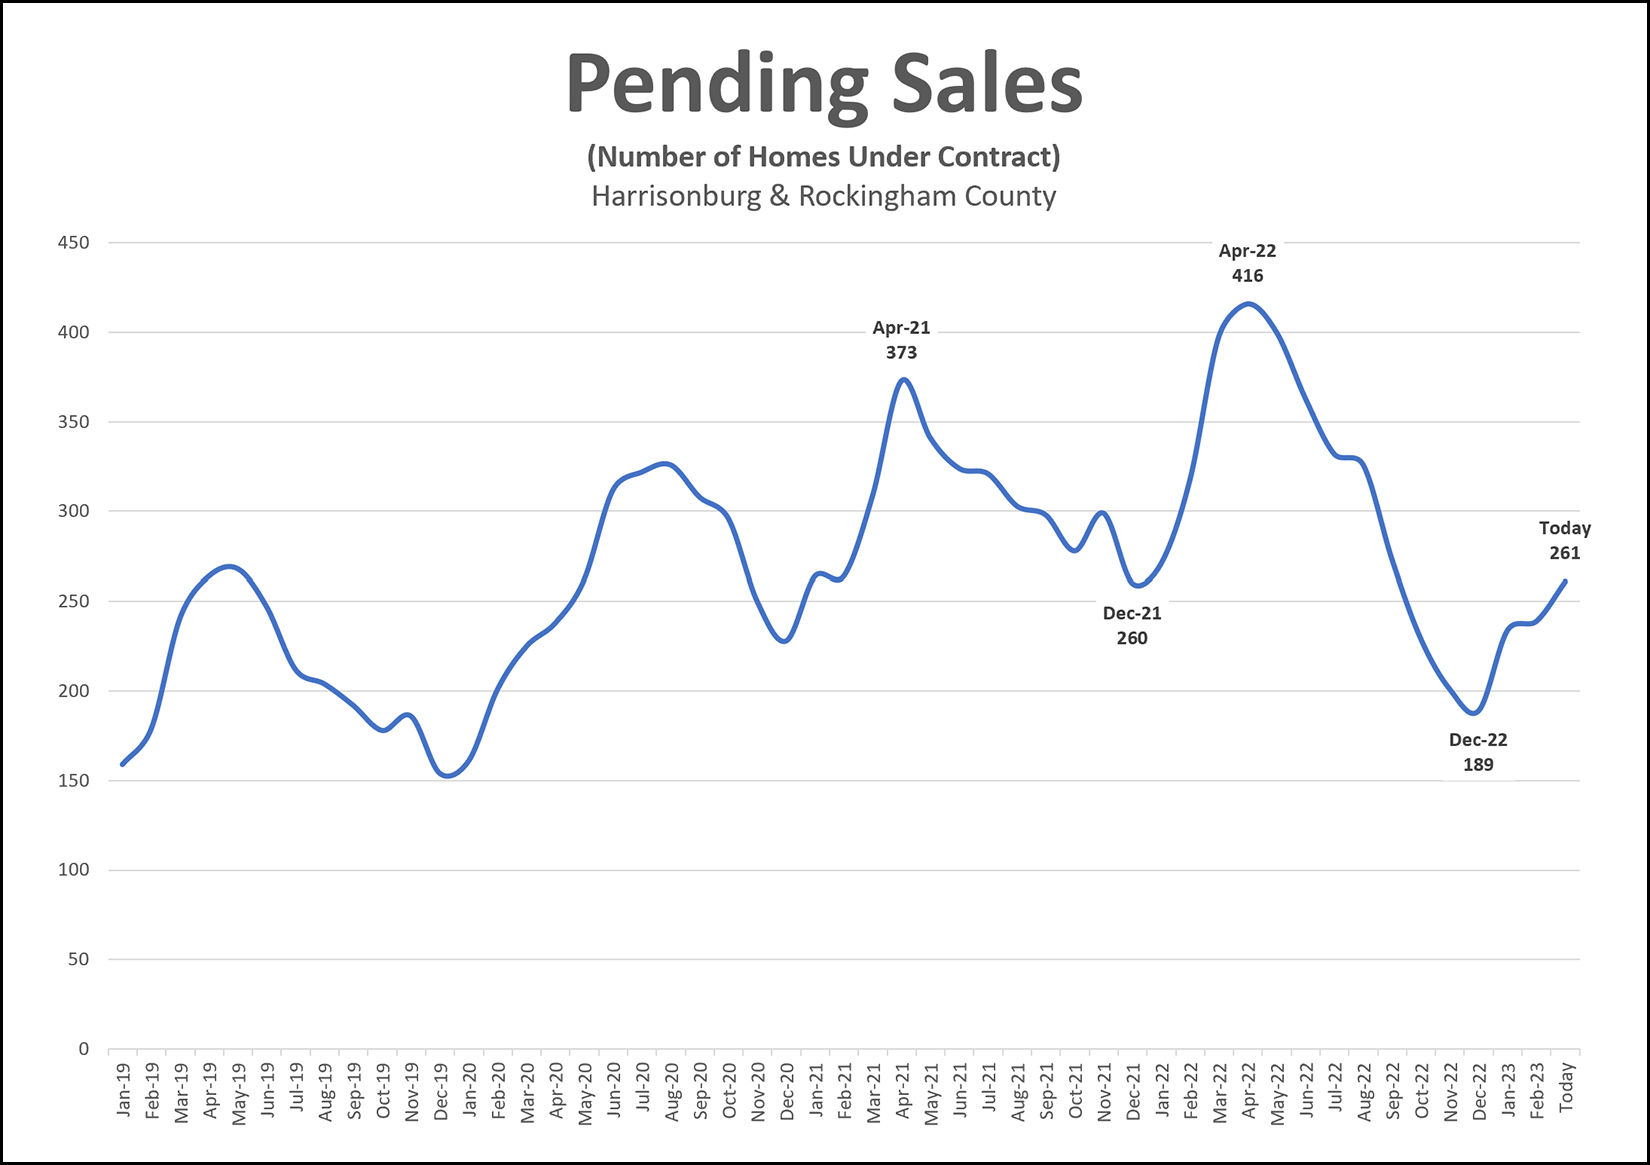 Pending home sales is the most timely indicator of what we should expect in the very near future for closed home sales. A pending home sale is a house that is under contract. Two springs ago (2021) the number of pending sales peaked at 373. Last spring (2022) the number of pending sales peaked at 416. There are currently only 261 pending home sales. As such, it seems likely that we'll see fewer closed home sales over the next few months. But, interestingly, this lower level of pending home sales does not necessarily seem to be a result of an insufficient number of buyers wanting to buy -- but rather, an insufficient number of sellers willing to sell. This seems to be a supply side issue inventory levels (the number of homes on the market for sale) remain stubbornly low. If we were seeing fewer pending home sales, and inventory levels climbing, this would be an indication that buyer demand is declining. That is not what we're seeing. So long as fewer sellers are willing to sell, we are likely going to continue to see lower numbers of pending home sales, and lower numbers of closed home sales unless new construction options increase to provide additional housing options for home buyers. | |
Fewer Home Sellers, Thus Fewer Home Buyers, But Ever Higher Sales Prices In Early 2023 |
|
 Happy Tuesday morning, friends! Indeed, February flew by quickly -- such a short month ;-) -- and now we're headed into what is typically a very busy spring in our local real estate market. Read on for an overview of everything happening right now in our local market... but first... a local highlight and an opportunity for you to be a winner! :-) Each month I offer a giveaway, of sorts, for readers of this market report, highlighting some of my favorite places, things or events in Harrisonburg. Recent highlights have included A Bowl of Good, a Steel Wheels concert, and Grilled Cheese Mania. This month... I'm giving away a $50 gift card to another of my favorite local restaurants, Taste of India. My go to order is the Chicken Tikka Masala, but you will find an extensive menu of unique and flavorful dishes at Taste of India, located on University Blvd. Click here to enter for a chance to win the $50 gift card! And now, let's move on along to the most recent data on our local real estate market... 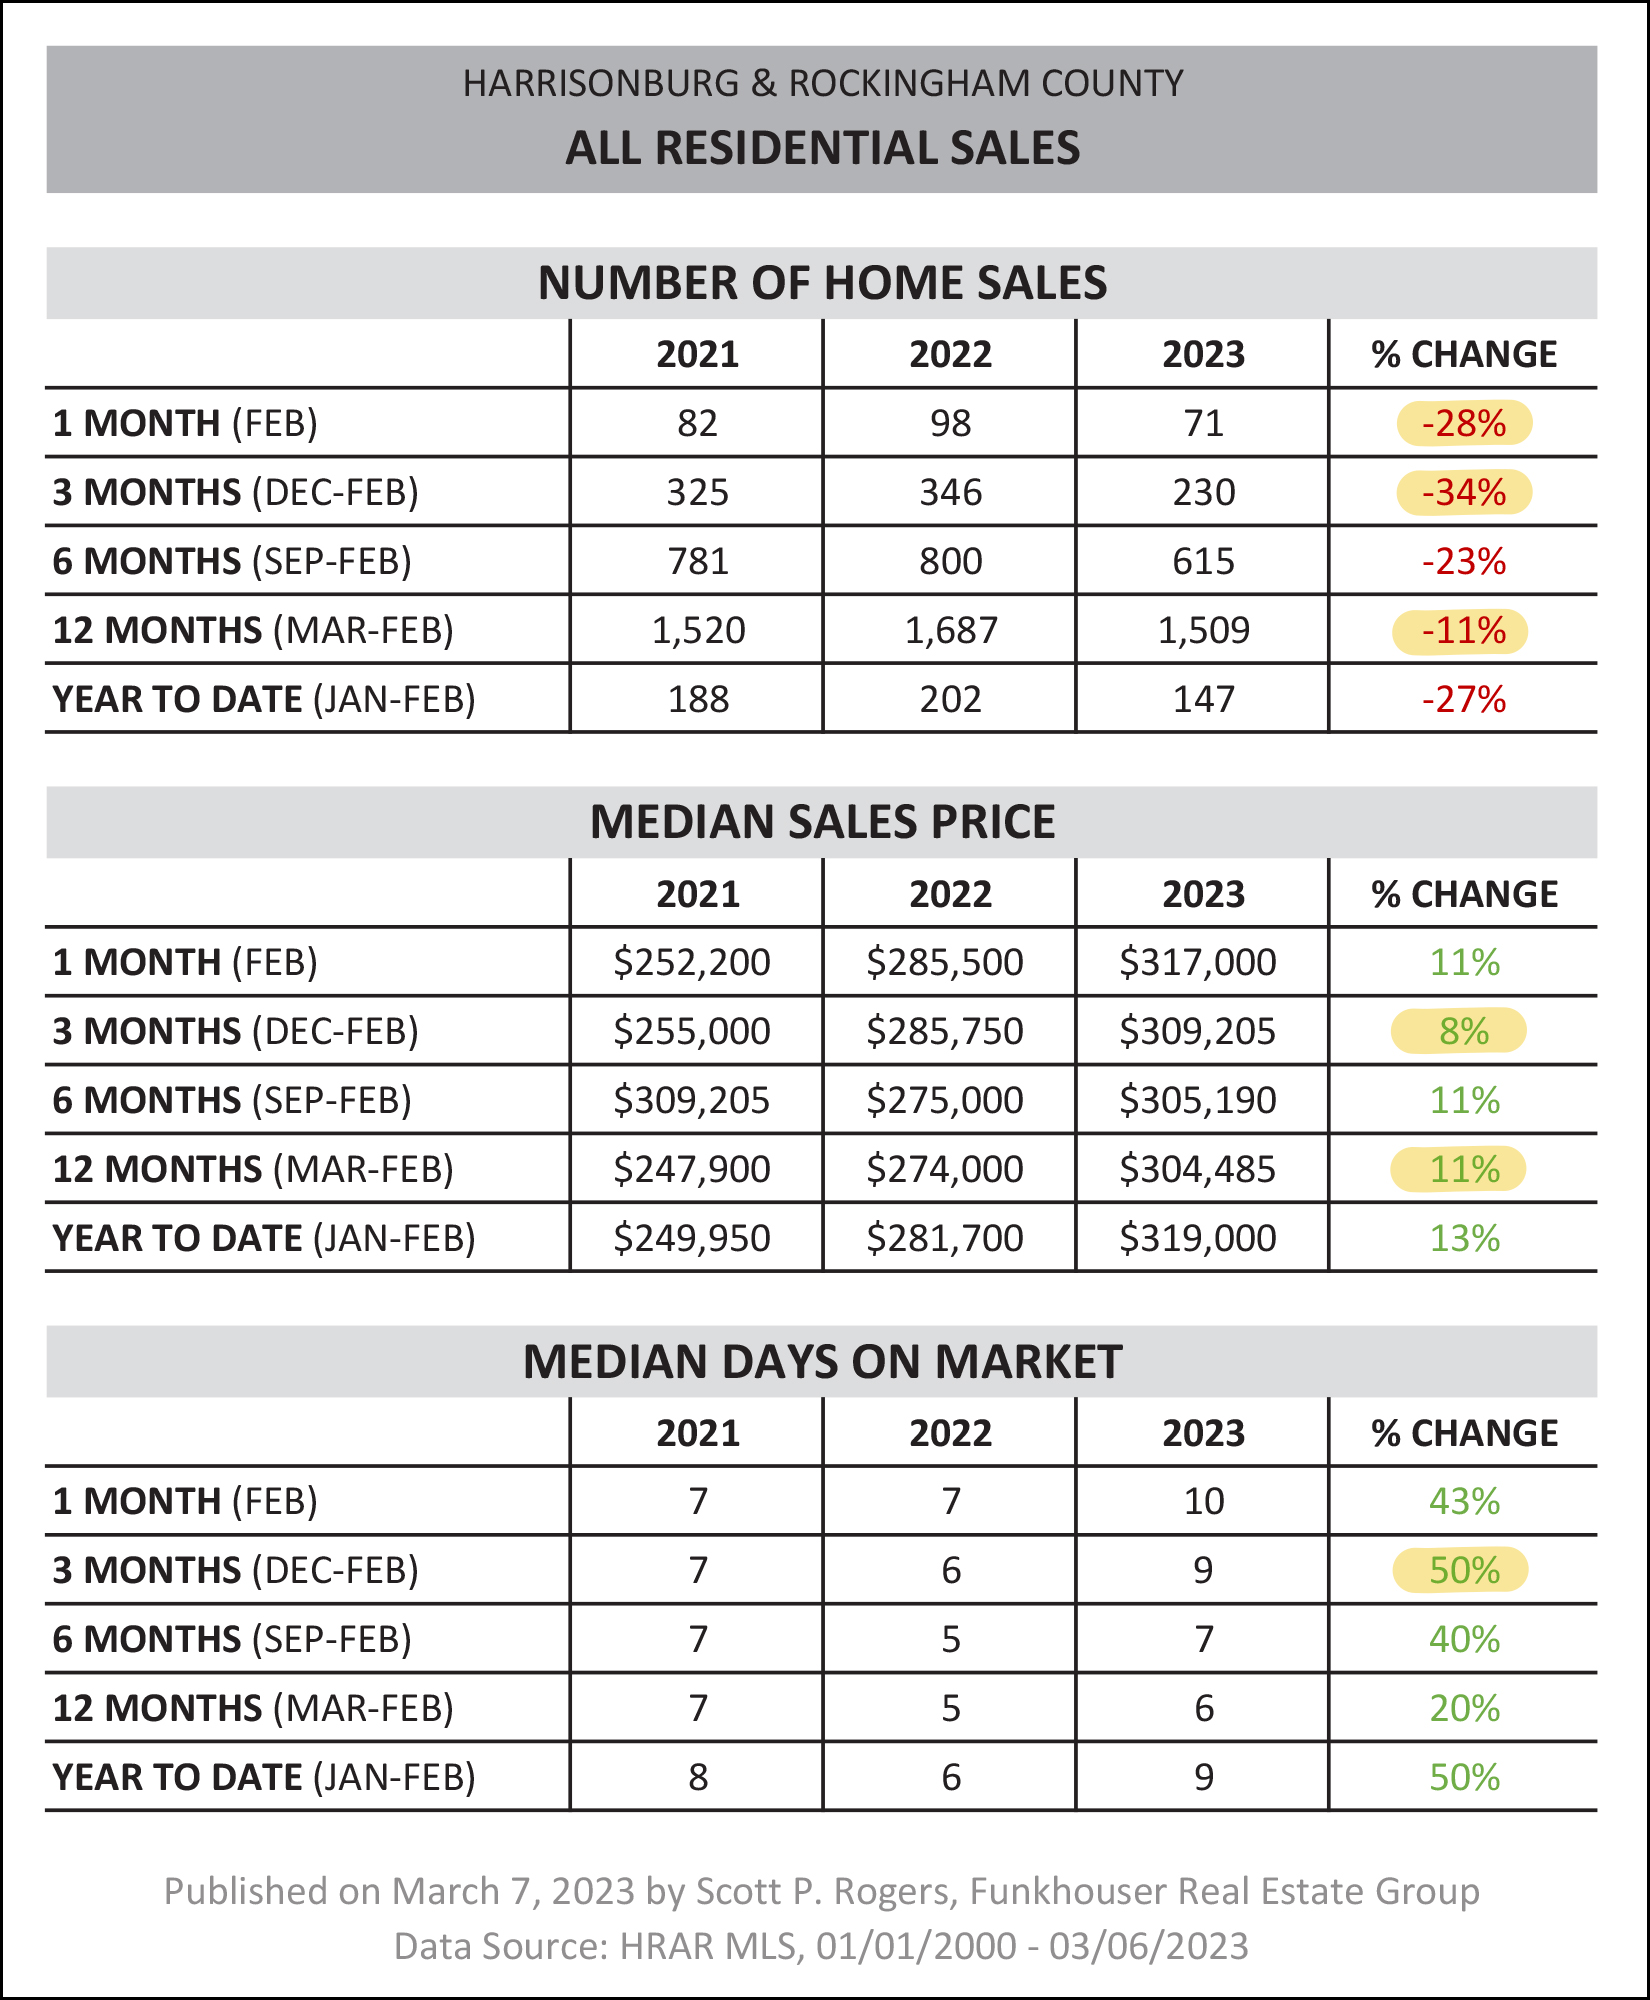 As per my headline, there are definitely fewer buyers buying homes right now, but I am fairly confident that it is a result of fewer sellers selling homes right now - as inventory levels are not rising. As shown above... [1] There were 28% fewer home sales this February (71) compared to last February (98) in Harrisonburg and Rockingham County. [2] Looking at the past three months (Dec, Jan, Feb) there was an even larger drop off in home sales... with a 34% decline from last year (346 home sales) to this year (230 home sales). [3] If we look back at an entire year of sales we will only find an 11% decline in home sales (from 1,687 sales to 1,509 sales) indicating that the majority of the slow down is in the more recent months. [4] Despite these decreases in the number of homes that are selling... home prices keep rising! The median sales price during the past three months (when the number of sales was 34% lower than last year) was $309,205... which is 8% higher than the median sales price one year ago of $285,750. [5] Looking back at the entire year again, the median sales price over the past 12 months was $304,485 which is 11% higher than in the 12 months before that when it was $274,000. [6] The number of days it takes for a home to go under contract is -- maybe, possibly -- on the rise. This (most recent) December through February homes went under contract with a median "days on market" of nine days... which is (50%) higher than the median of six days a year ago during those same three months. So, fewer homes are selling, slightly slower, but at ever higher prices!?! Now, let's look at the number of home sales January and February compared to past norms for these months... 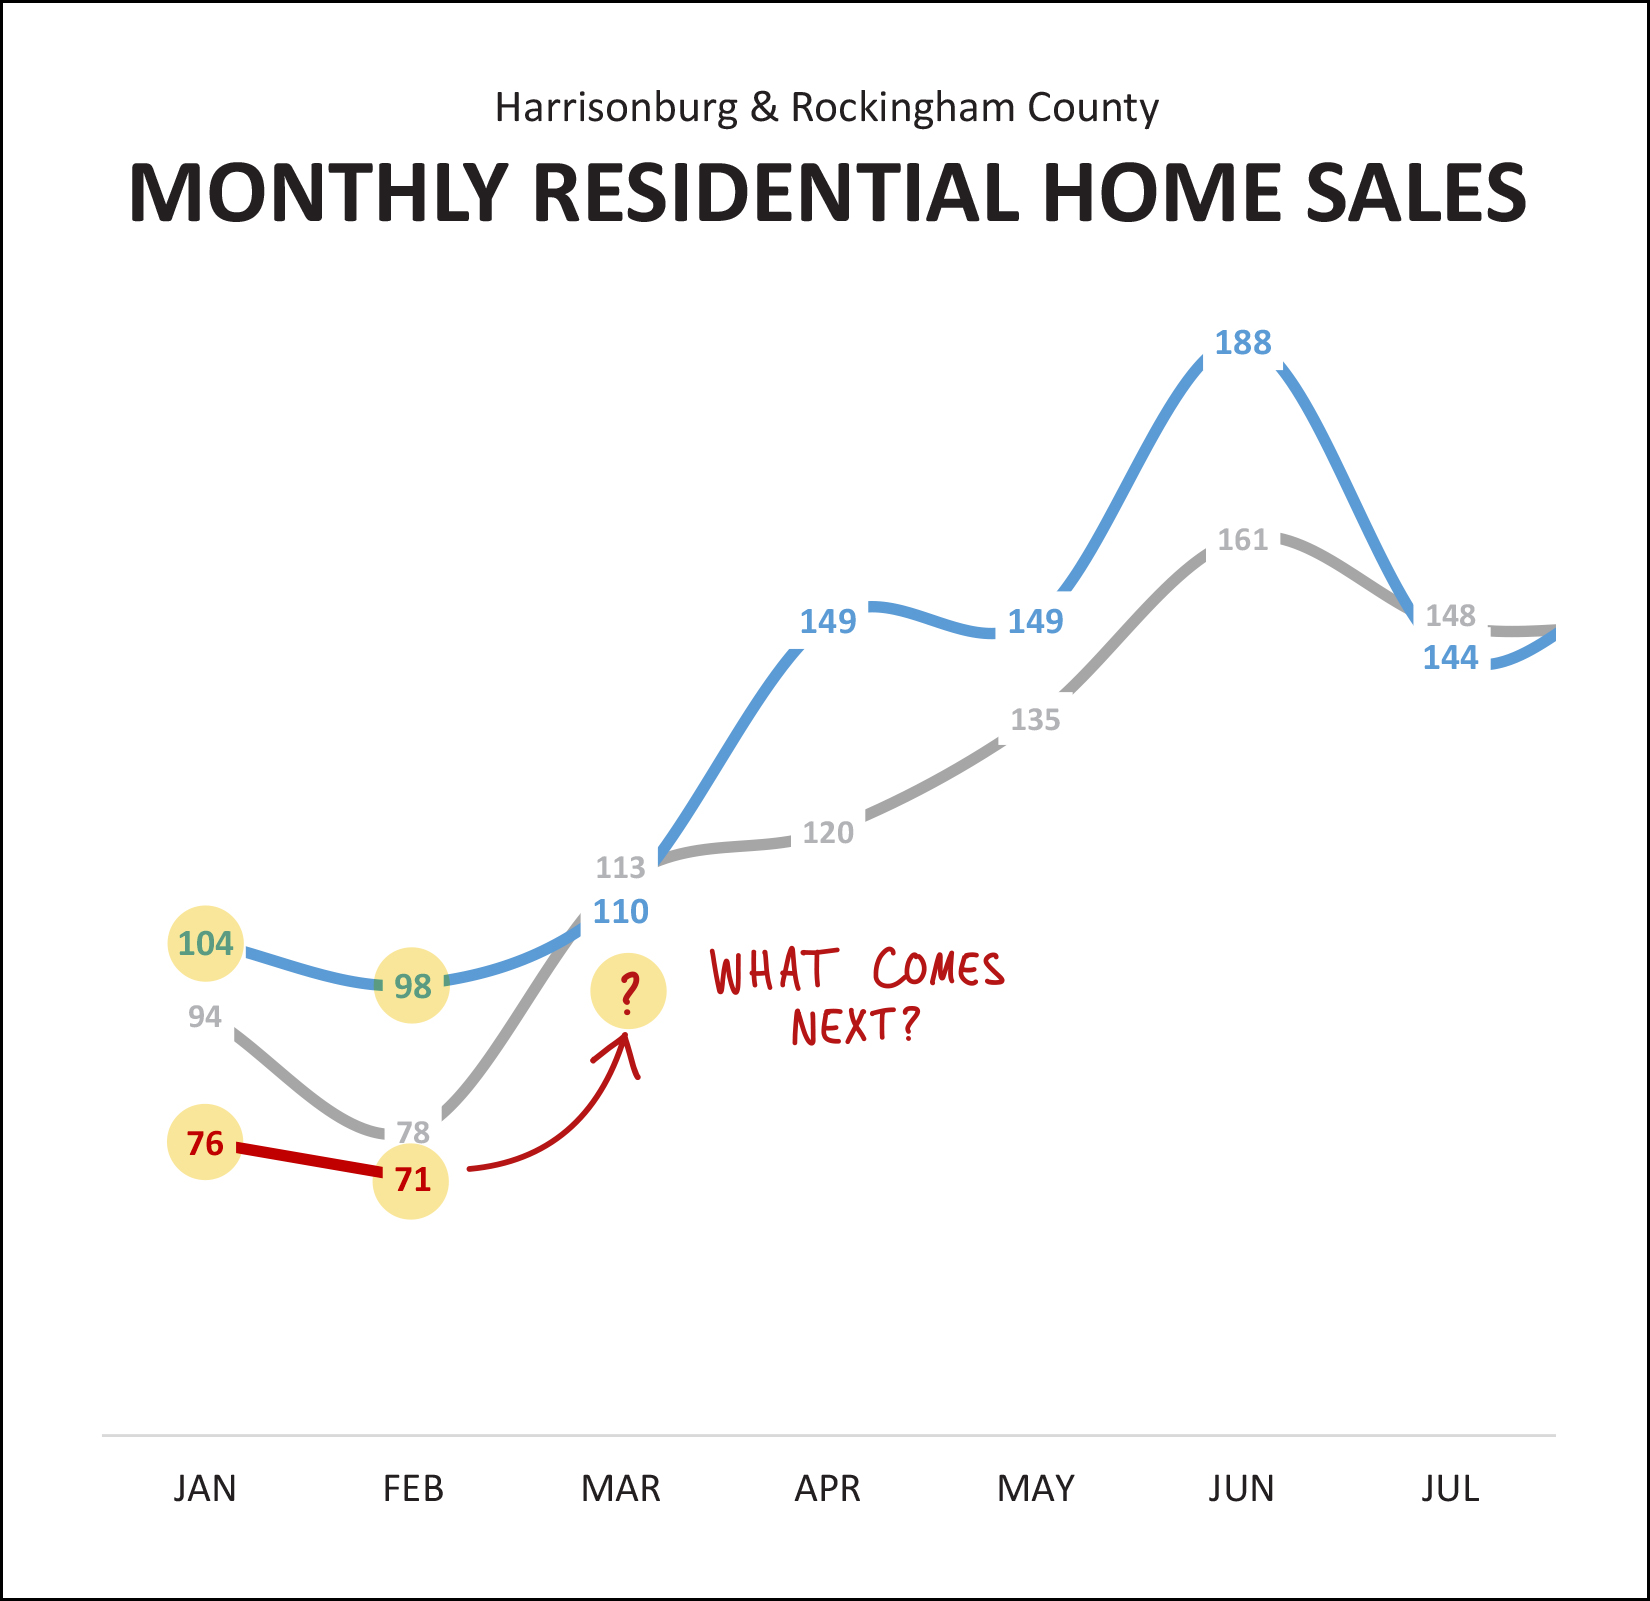 The red line above is the current year -- 2023 -- and you can see that the number of home sales in January and February is quite a bit lower than... [1] The number of home sales last January and February -- shown in blue. [2] The average number of home sales in each month over the past four years -- shown in grey. So, there have been fewer home sales this January and February than in other recent years. Thus, what comes next? I expect we will continue to see lower number of home sales per month as we move through March, April and May 2023 as compared to last year and as compared to the average of the past four years. Let's put the declining number of home sales in a bit of a historical context... 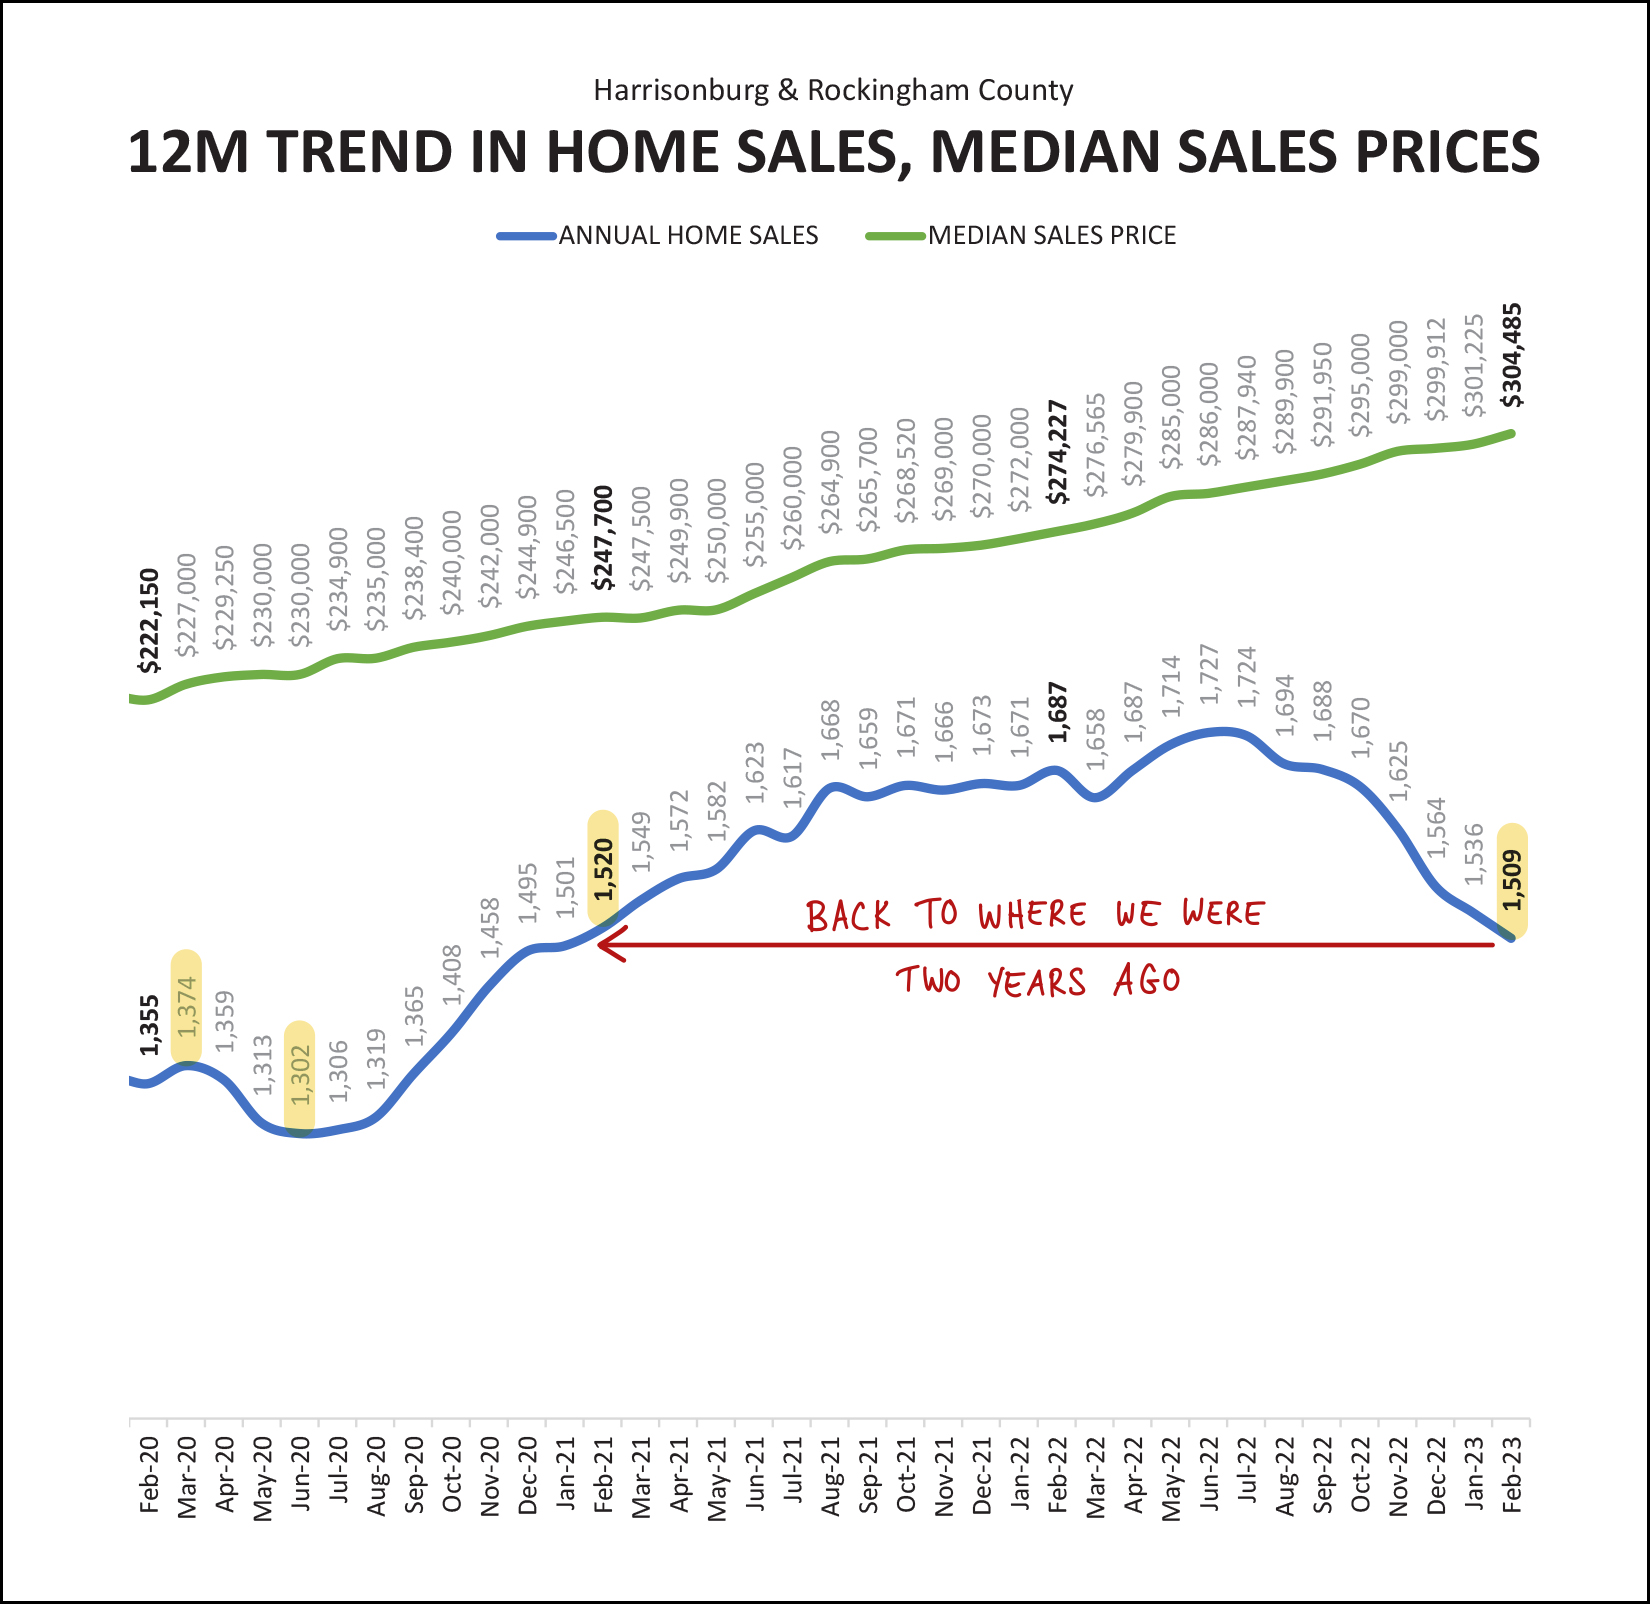 The annual pace of home sales peaked at 1,374 home sales back in March 2020 after declines in monthly home sales in early 2020 due to the start of the COVID-19 pandemic. The annual pace of home sales slowed for a few months... but bottomed out at 1,302 home sales per year just three months later. Then, the annual pace of home sales started climbing, and climbing, and climbing. Two years ago, homes were selling at an annual pace of 1,520 home sales per year in Harrisonburg and Rockingham County. Then, annual home sales accelerated all the way up to 1,727 home sales per year in in June 2022 -- before they started declining again. Now, as we close out February 2023, the annual pace of home sales (1,509) has returned to the same approximate place that we were in two years ago. I expect that this annual pace of home sales will continue to decline over the next six months. But, yes, sales prices keep on rising, as shown with a green line above. The annualized median sales price seems intent on continuing to rise, month after month. It has now risen from $222,150 to $304,485 in just three years! But, perhaps the increase in the median sales price is... slowing? 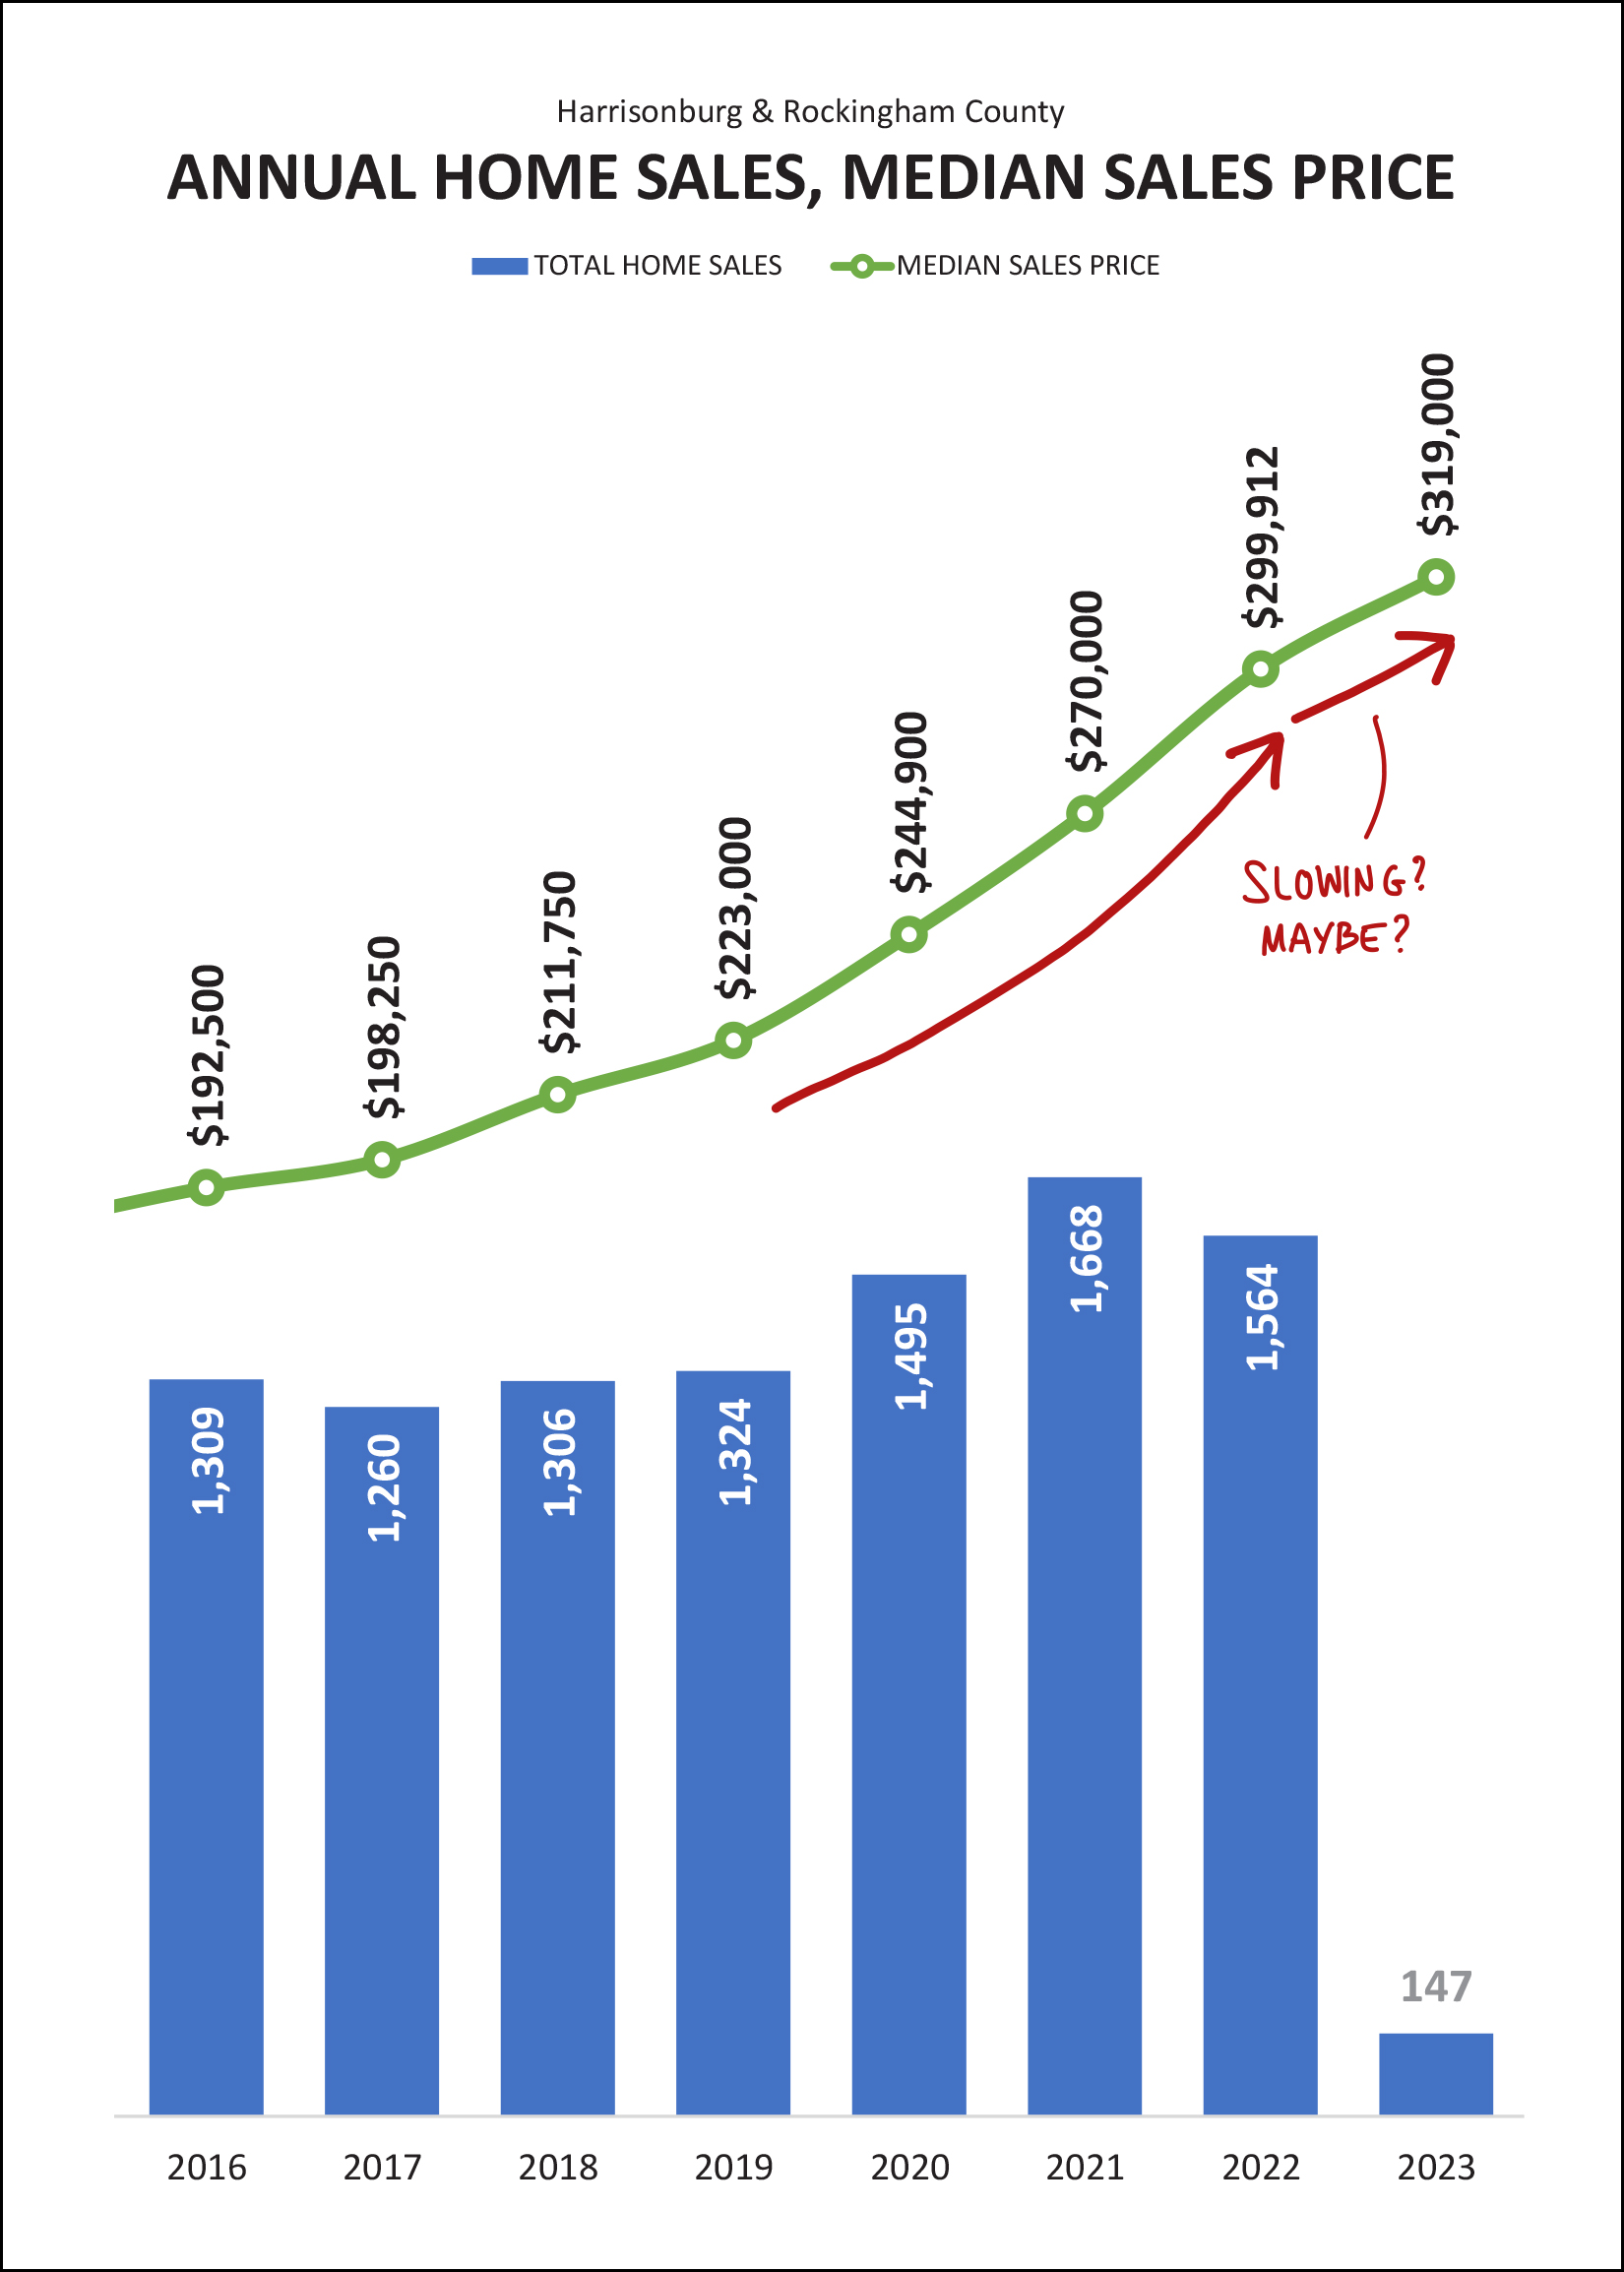 If you stare intently at the green line above, you'll see the slope changing a bit, which perhaps is an indicator that the rate of price increases is slowing. Maybe. 2020 increase in median sales price = 9.8% 2021 increase in median sales price = 10.2% 2022 increase in median sales price = 11.1% 2023 increase in median sales price = 6% Don't read this too quickly... home prices are not declining... but the pace at which home prices are increasing... might be slowing. Or, then again, maybe not. We are only working with two months of data for 2023. Stay tuned over the next few months to see how the 2023 median sales price adjusts as we move further through the year. Now, to predict where home sales might go next, let's look at contract activity... 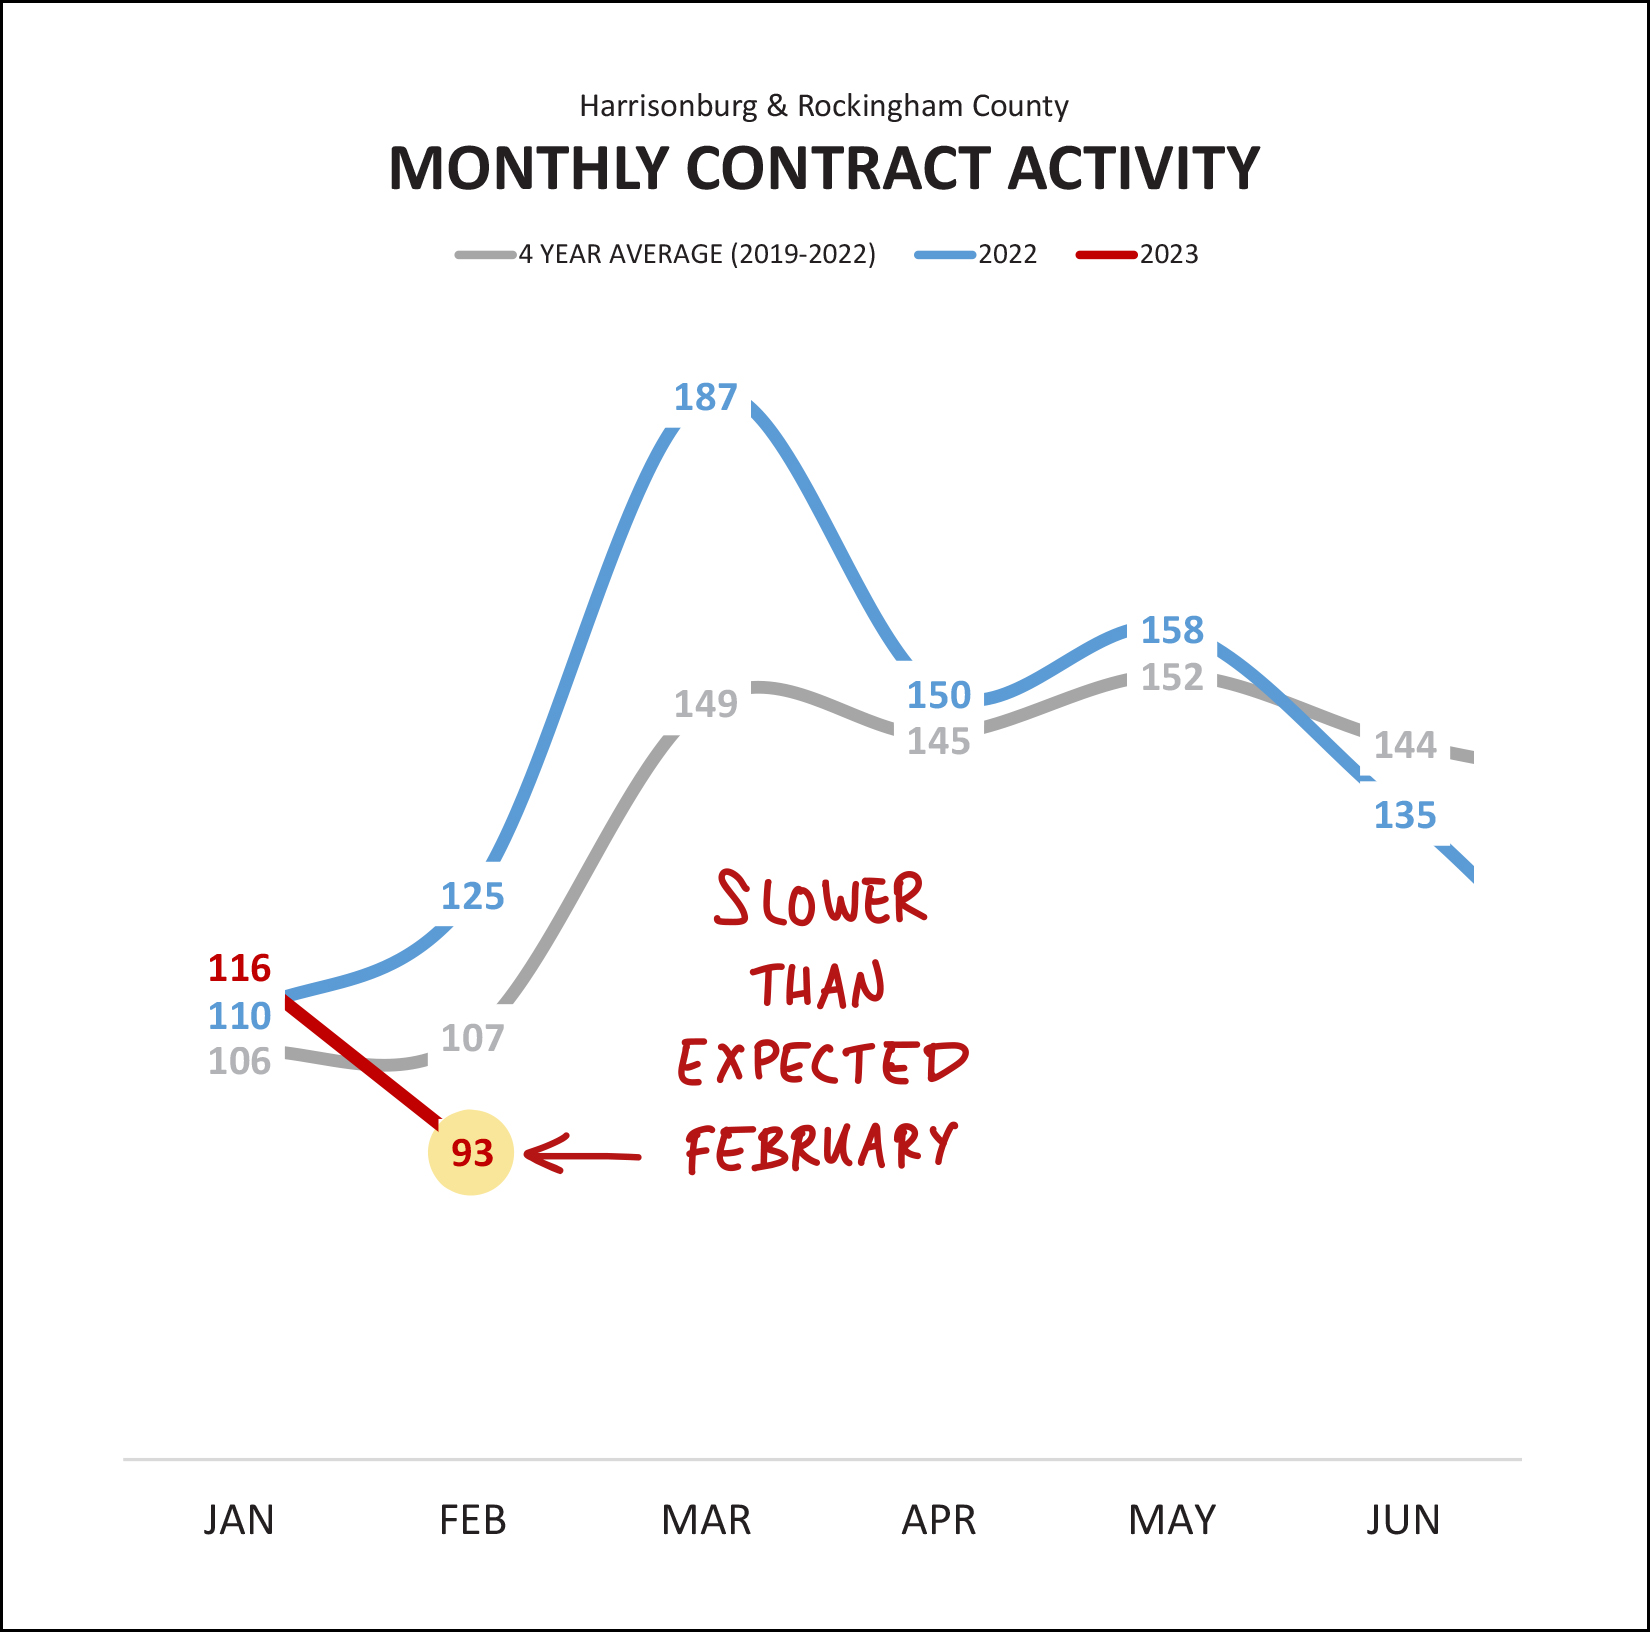 After a decent month of contract activity in January (116 this year compared to 110 last year) we saw a marked decline in contract activity in February. The 93 contracts that were signed in February 2023 was significantly lower than the 125 contracts signed last February, and also well below the four year average of 107 contracts in a typical February. Thus, it is unlikely that we'll start to see an increase in home sales in March, given the decline in contracts signed in February. Furthermore, the number of pending sales (homes under contract) also declined in February... 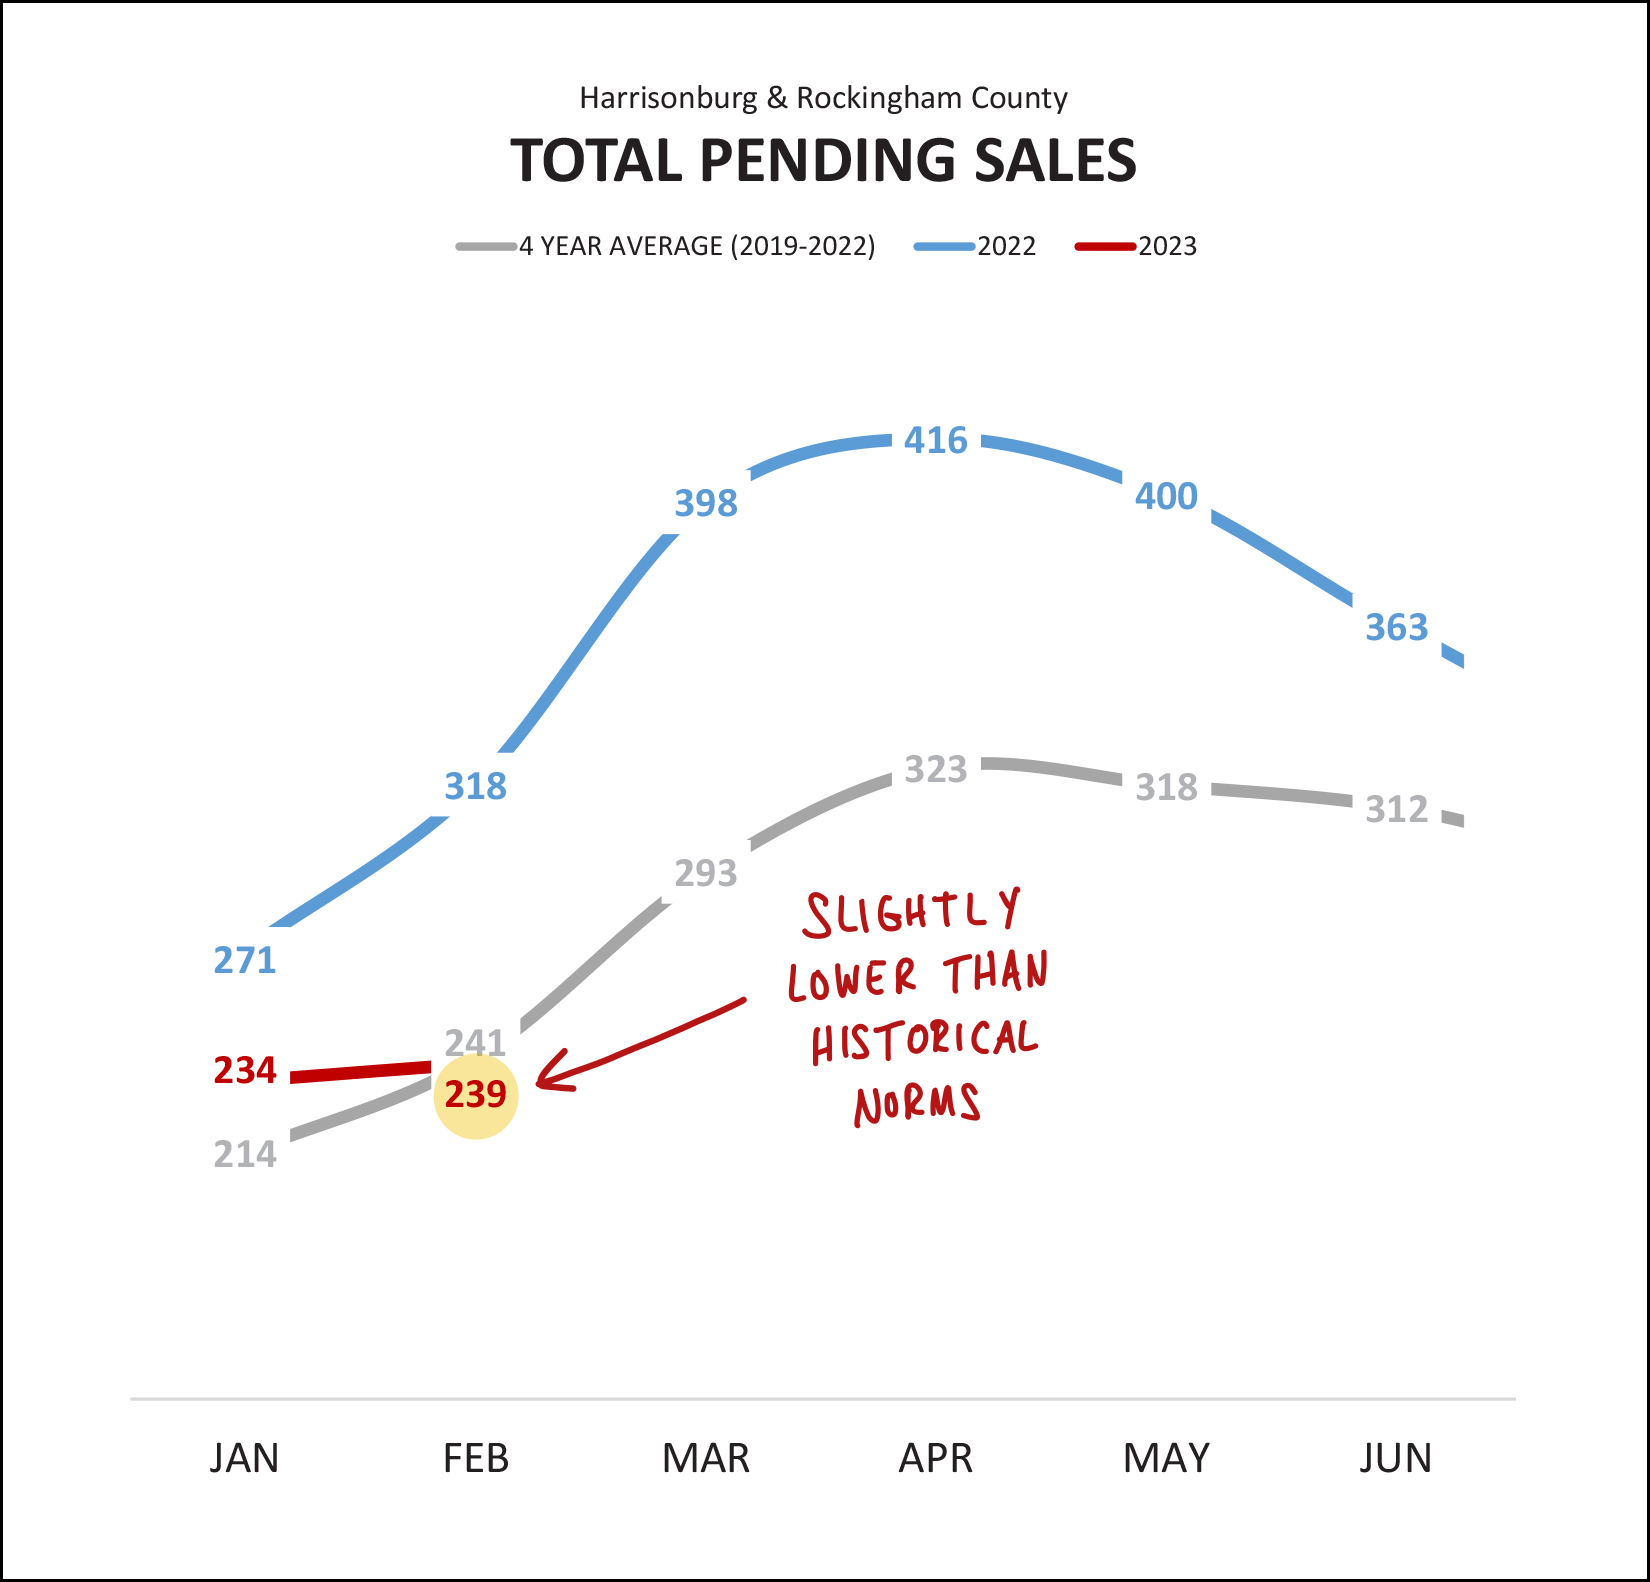 There are currently 239 homes under contract (pending) in Harrisonburg and Rockingham County which is quite a bit lower than a year ago (blue line) when there were 318 homes under contract... and is also lower than the four year average of 241 homes typically being under contract at this time of year. All of these different metrics are all showing the ways in which our market is cooling off -- as it pertains to the *number* of homes that are selling -- not as it relates to the value of homes in our area. Circling back to my headline this month... I think the cause of fewer home sales is mainly due to fewer sellers selling, which is resulting in fewer buyers buying, because... 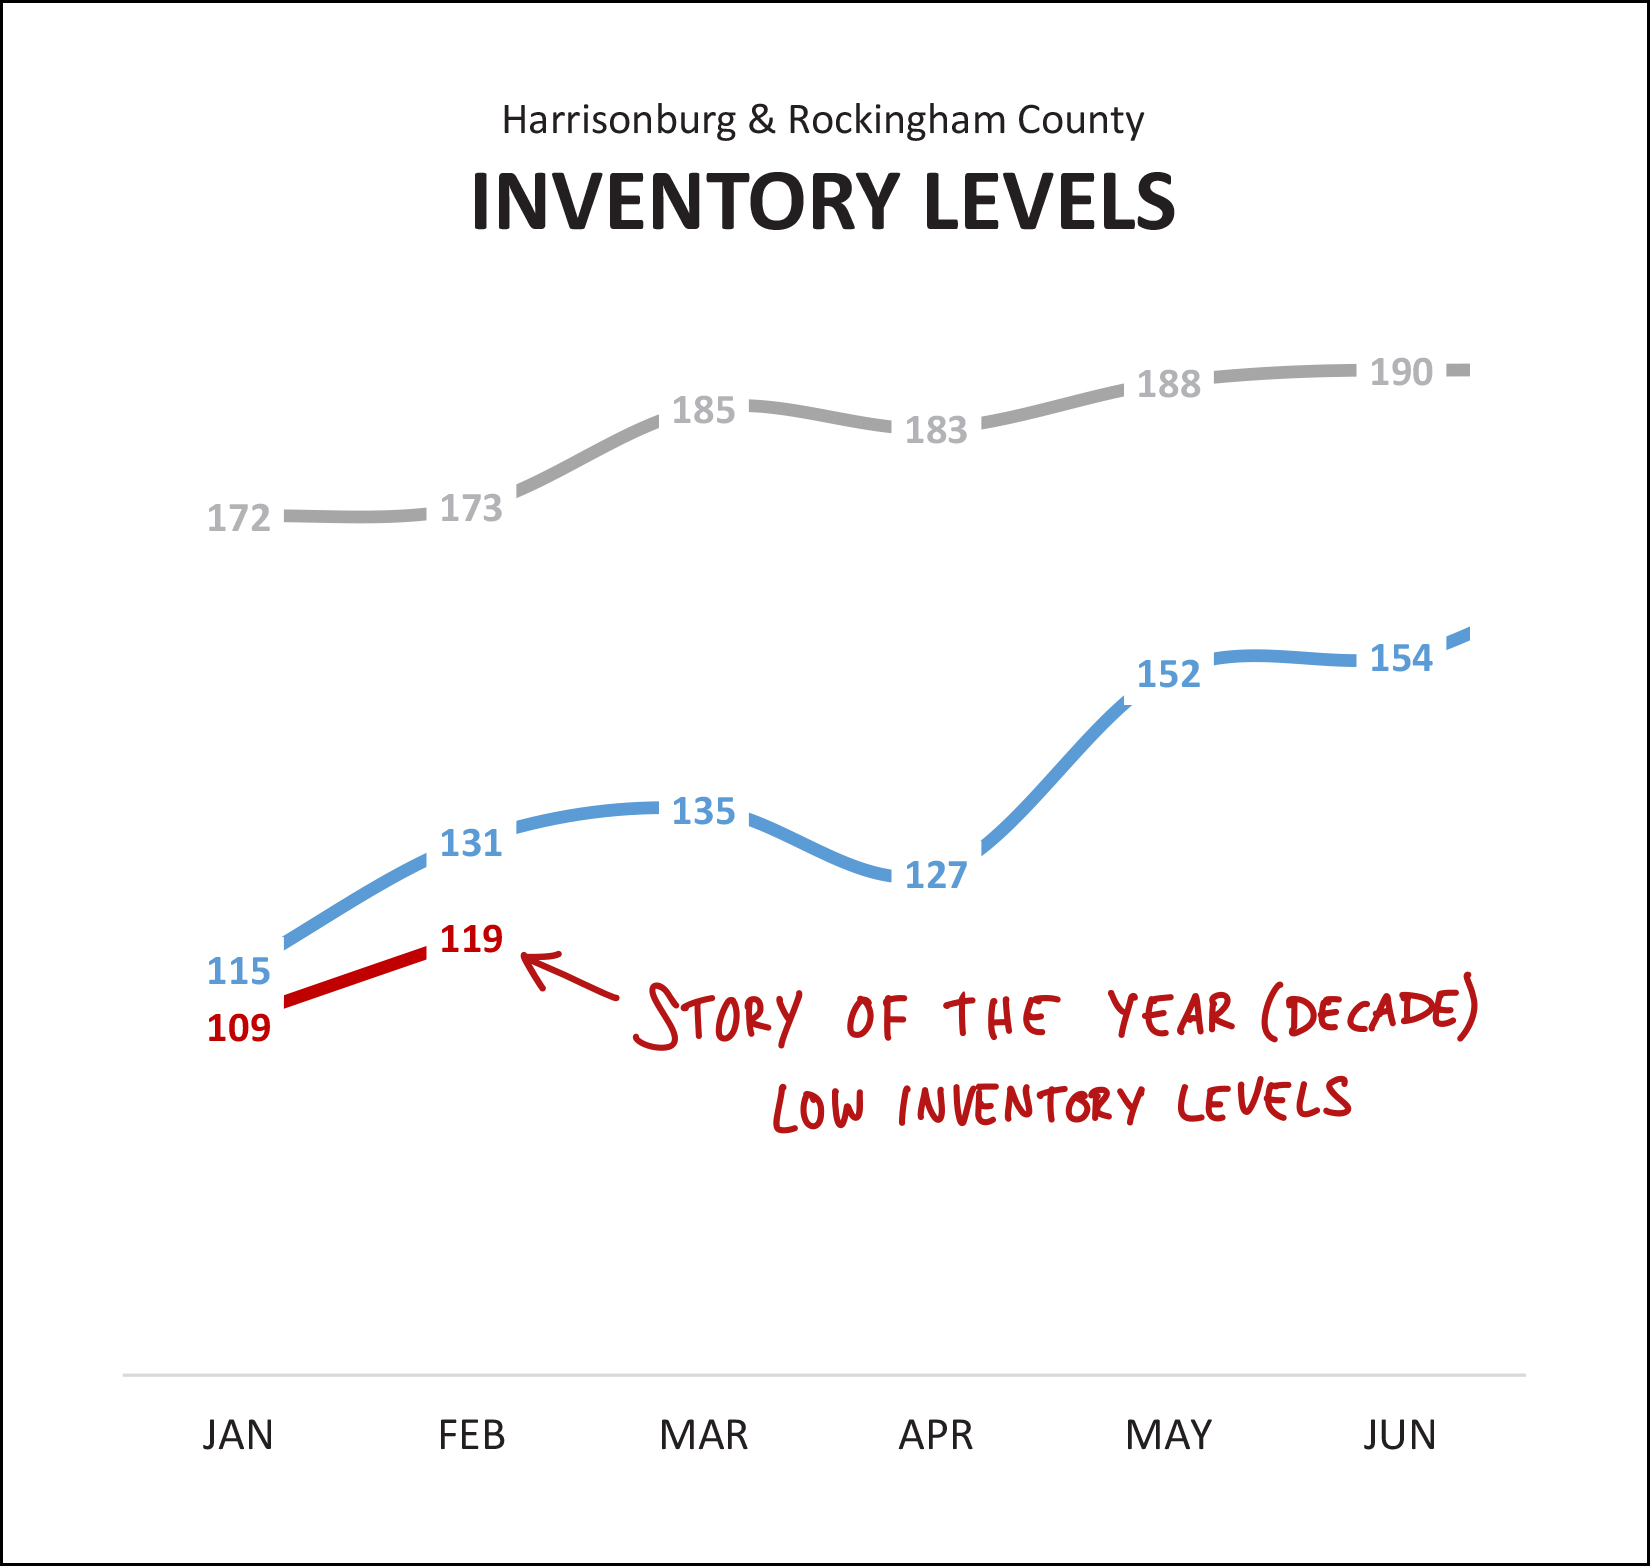 Inventory levels are lower than ever. There are currently 119 homes for sale (not under contract) in Harrisonburg and Rockingham County which is even lower than the inventory levels a year ago at this time of the year (131 for sale) and significantly lower than the four year average of 173 homes for sale at this time of year. If fewer buyers were buying... and just as many sellers wanted to sell... we would start to see inventory levels increasing. Fewer home sales, combined with ever lower home sales, is a very good indicator that the decline in the number of home sales is a result of fewer sellers being willing to sell -- more so than a result of fewer buyers wanting to buy. All that said, there is one trend in our local market that runs at least a bit counter to all of the other trends... 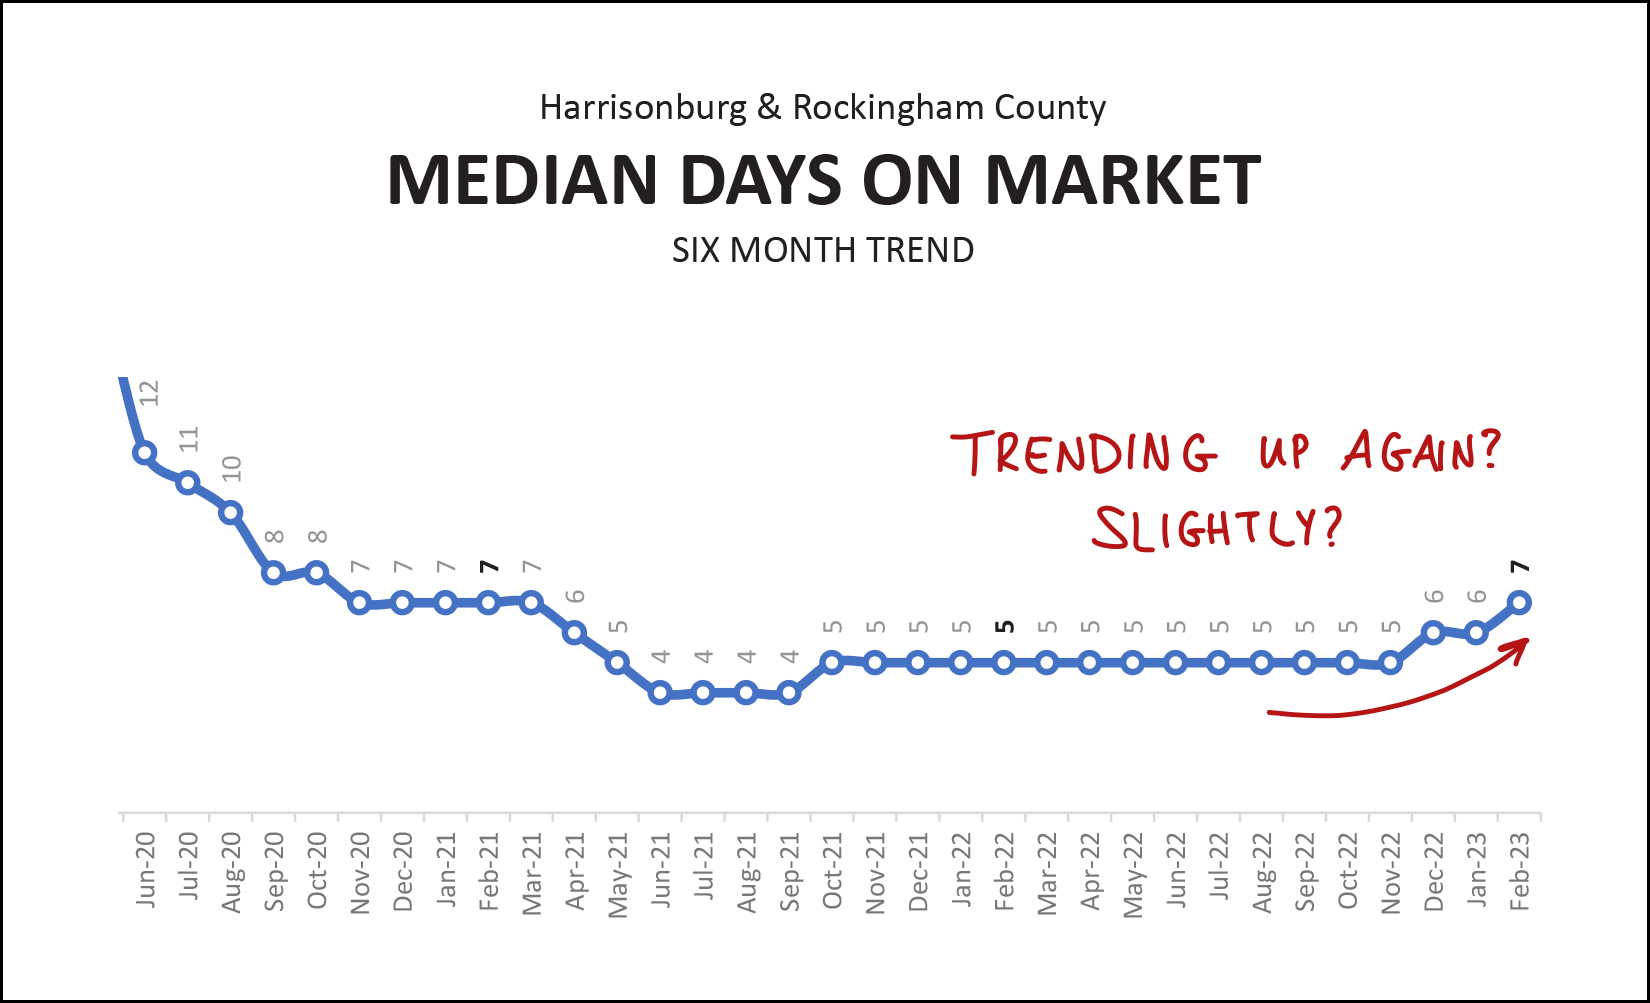 The median "days on market" figure has started to trend upwards over the past few months. For over a year, the median number of days it took for a home to go under contract was only five days. That has now drifted slightly upward to seven days. This means something... but maybe not much. Homes are going under contract *slightly* more slowly now than they were over the past few years. It is now taking them (as per the median calculation) about seven days to go under contract, instead of only five days. I'll continue to monitor this over the coming months to see if this trend continues when we get into the thick of the spring market. And one last graph... that looks like it had one too many cups of coffee this morning with all of its jittering all over the place... 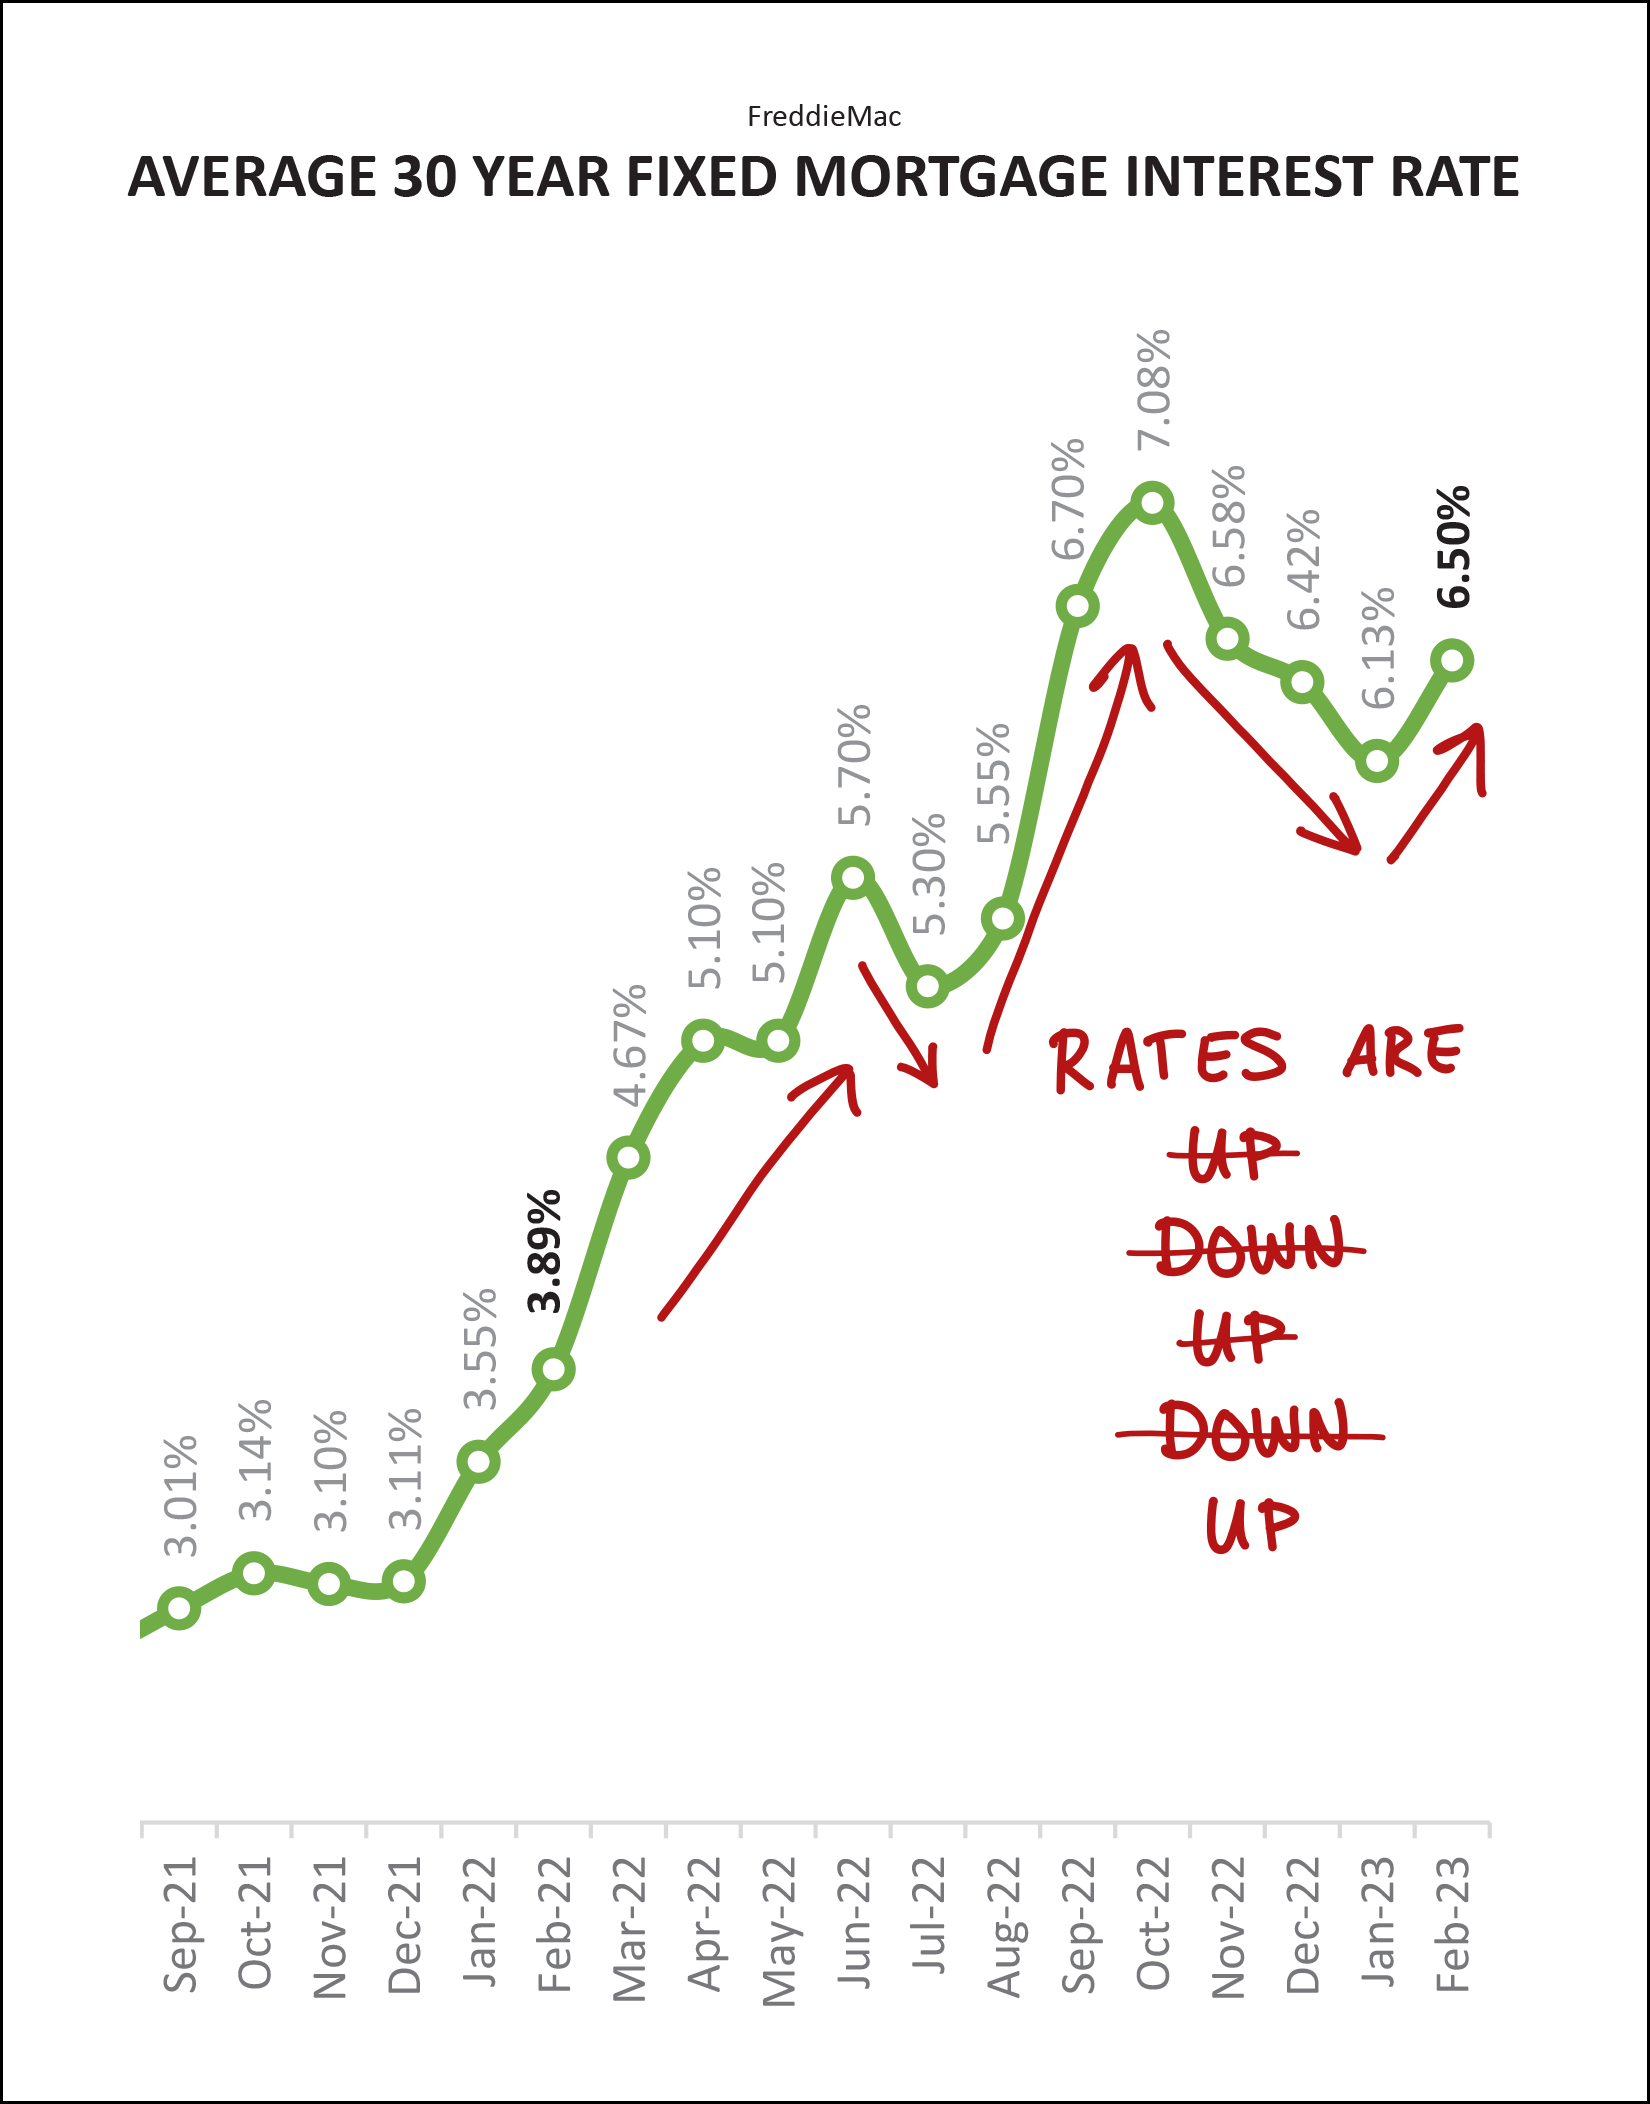 Mortgage interest rates have been all over the place over the past year. A year ago the average 30 year mortgage interest rate was 4%, and now it's 6.5%. But during the past year we have seen multiple months of increases and some decreases. It's hard to say what will happen next with mortgage interest rates. Perhaps the only reasonable prediction is that rates will go up and go down in the next six months. ;-) So... if you're looking to buy or sell a house in Harrisonburg or Rockingham County this spring, what should you conclude based on all of the data above? If you will be selling... [1] The market is still very favorable for home sellers. [2] Home prices have never been higher. [3] Half (or more) of homes that well are still going under contract in a week or less. [4] Diligent preparations, proper pricing and thorough marketing will likely still result in a speedy and favorable home sale for most sellers of most homes in most price ranges and locations. If you will be buying... [1] The market is still very competitive in most price ranges and for most property types. [2] It is still important to be pre-approved and to go see homes within the first day or two that they are on the market. [3] There will likely be fewer options for buying this year than last as fewer home sellers are seeming willing to sell. There's plenty more that we can discuss about your particular scenario if you are thinking of selling or buying, so feel free to reach out (call or text me at 540-578-0102 or email me here) if you'd like to chat or find a time to meet. If you're not quite ready to sell or buy yet, but have questions about the market or the process, I'd also be delighted to hear from you. Touch base anytime. That's all for today, folks. I hope that March treats you well and that you enjoy the suspense of not knowing whether we'll get that surprise March snowfall that we sometimes see in the Valley. ;-) Regardless of whether we get some snow or not, I hope you enjoy the changing of the seasons as we move through March. It is certainly a beautiful time in the Shenandoah Valley! P.S. If you want even more charts and graphs than I have included above, you'll find them here. | |
First Look At February 2023 Home Sales |
|
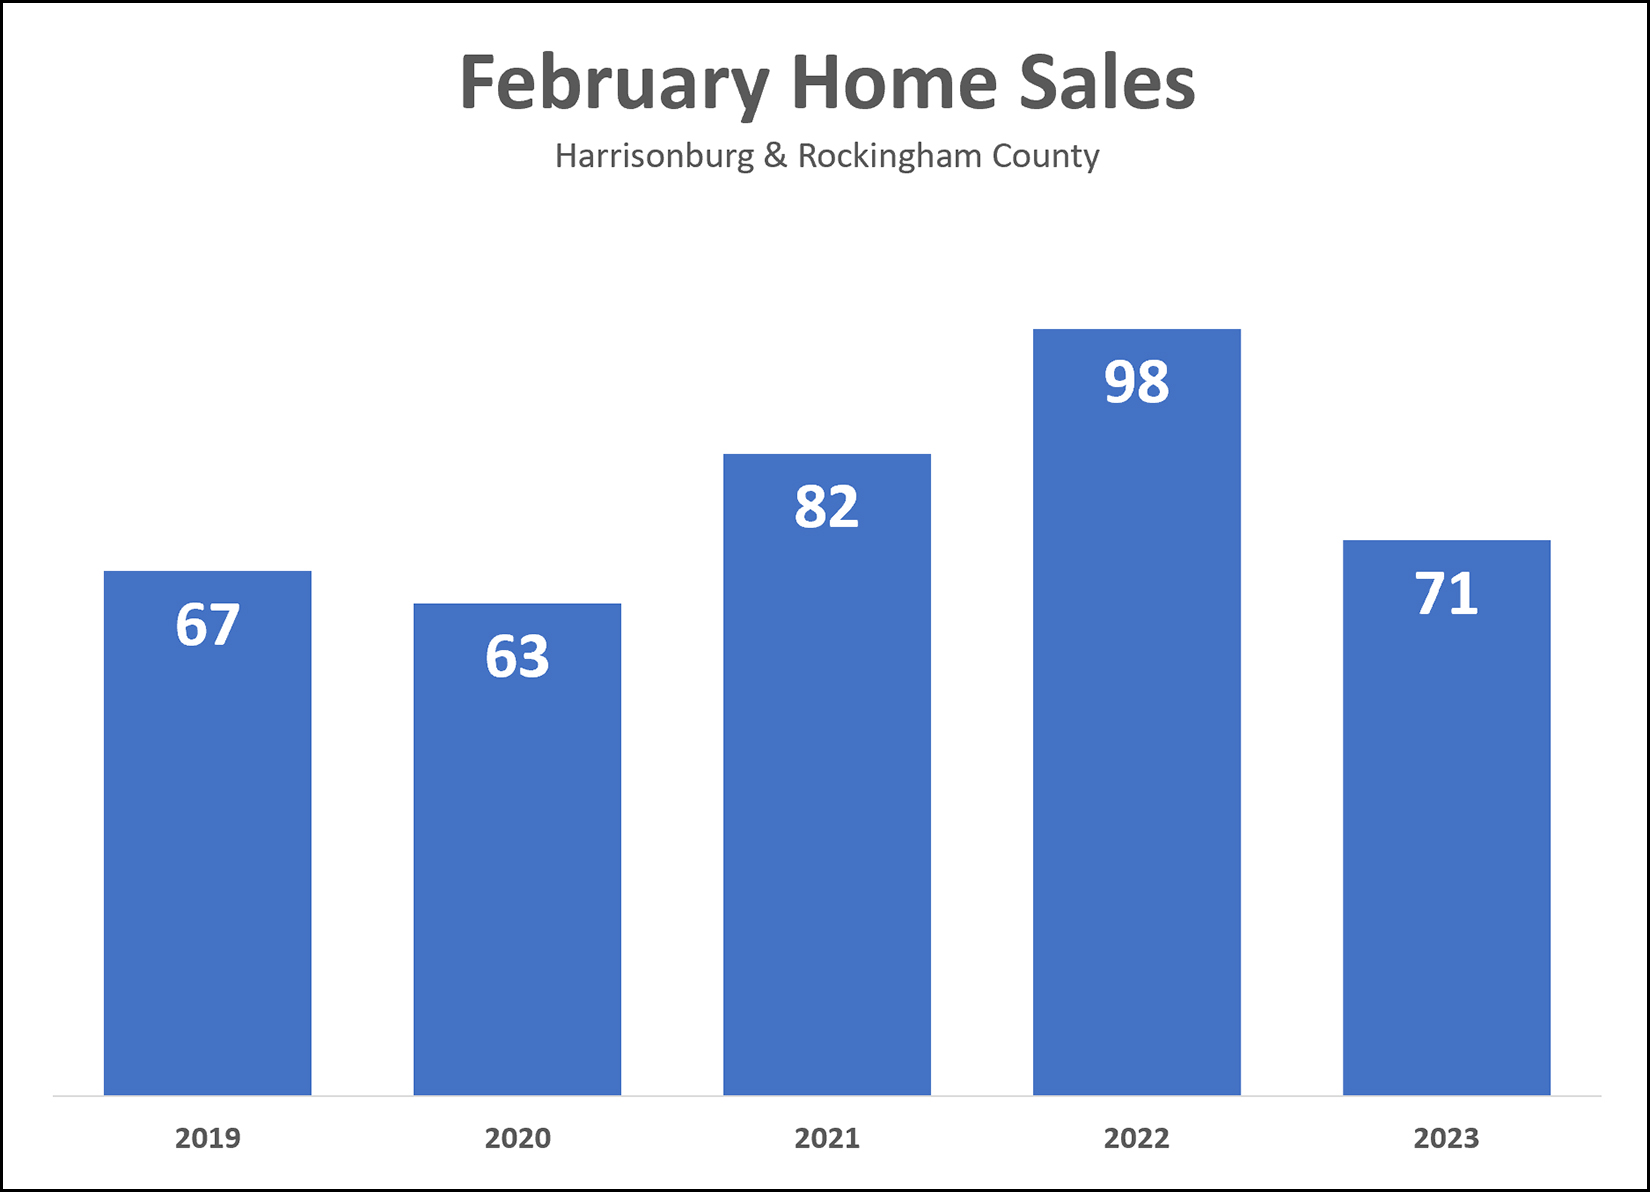 Perhaps unsurprisingly, February 2023 home sales don't quite match up to February 2021 or 2022. Of course, during 2021 and 2022 we were experiencing... [1] Surging buyer interest due to super low interest rates. [2] Many, many buyers trying to upgrade their living arrangements due to Covid induced life changes with working from home, etc. Interest rates are higher now, and there is a bit less urgency to upgrade ones living arrangements if you haven't already done so as we seem to be settling back into life after Covid. And what do you know... home sales in 2023 aren't quite as crazy high as they were in 2021 and 2022. I should also note that... [1] Home sales in February 2023 were (a bit) higher than in 2019 and 2020. [2] The decline in home sales is not (thus far) leading to an increase in housing inventory levels. Fewer buyers are buying... but fewer sellers are selling as well... so inventory levels are remaining low. I'll publish a full accounting of February housing market updates soon. | |
Home Sales Still Slowing, Home Prices Still Rising, In Harrisonburg, Rockingham County |
|
 Happy Friday morning, friends! We're about halfway through February, so it's time to take a moment to look back and see what we can learn about our local real estate market based on January's data. Thanks for joining me as I break things down so that we can all better understand the data and trends.  I hope you have had a fun start to your year. Some fun on our end included a quick extended weekend trip to the beach for Shaena, Luke, Emily and I a few weeks ago. I was reminded anew of the value of disconnecting (at least partially) from work for a bit, and spending time with loved ones. Whether it is the beach, the mountains, a long walk on an unusually warm February day, or relaxing on your back porch, I hope you find some time to disconnect from the busyness of life and spend time with those who you love in the coming days or weeks. Before I get into the market data, I also want to encourage you to check out my featured listing of the month, a newly renovated in downtown Harrisonburg pictured above and located at 142 Broad Street. Find out all about it at 142BroadStreet.com. Finally, a fun giveaway, just for you... Each month I offer a giveaway, of sorts, for readers of this market report, highlighting some of my favorite places, things or events in Harrisonburg. Recent highlights have included a Steel Wheels concert, Grilled Cheese Mania, and Walkabout Outfitter. This month... I'm giving away a $50 gift card to one of my favorite local restaurants, A Bowl of Good. If you haven't checked out A Bowl of Good yourself, make plans to do so - they have a delicious menu of comfort foods and many items with an international flair. Click here to enter for a chance to win the $50 gift card! And now, let's move on along to the most recent data on our local real estate market... 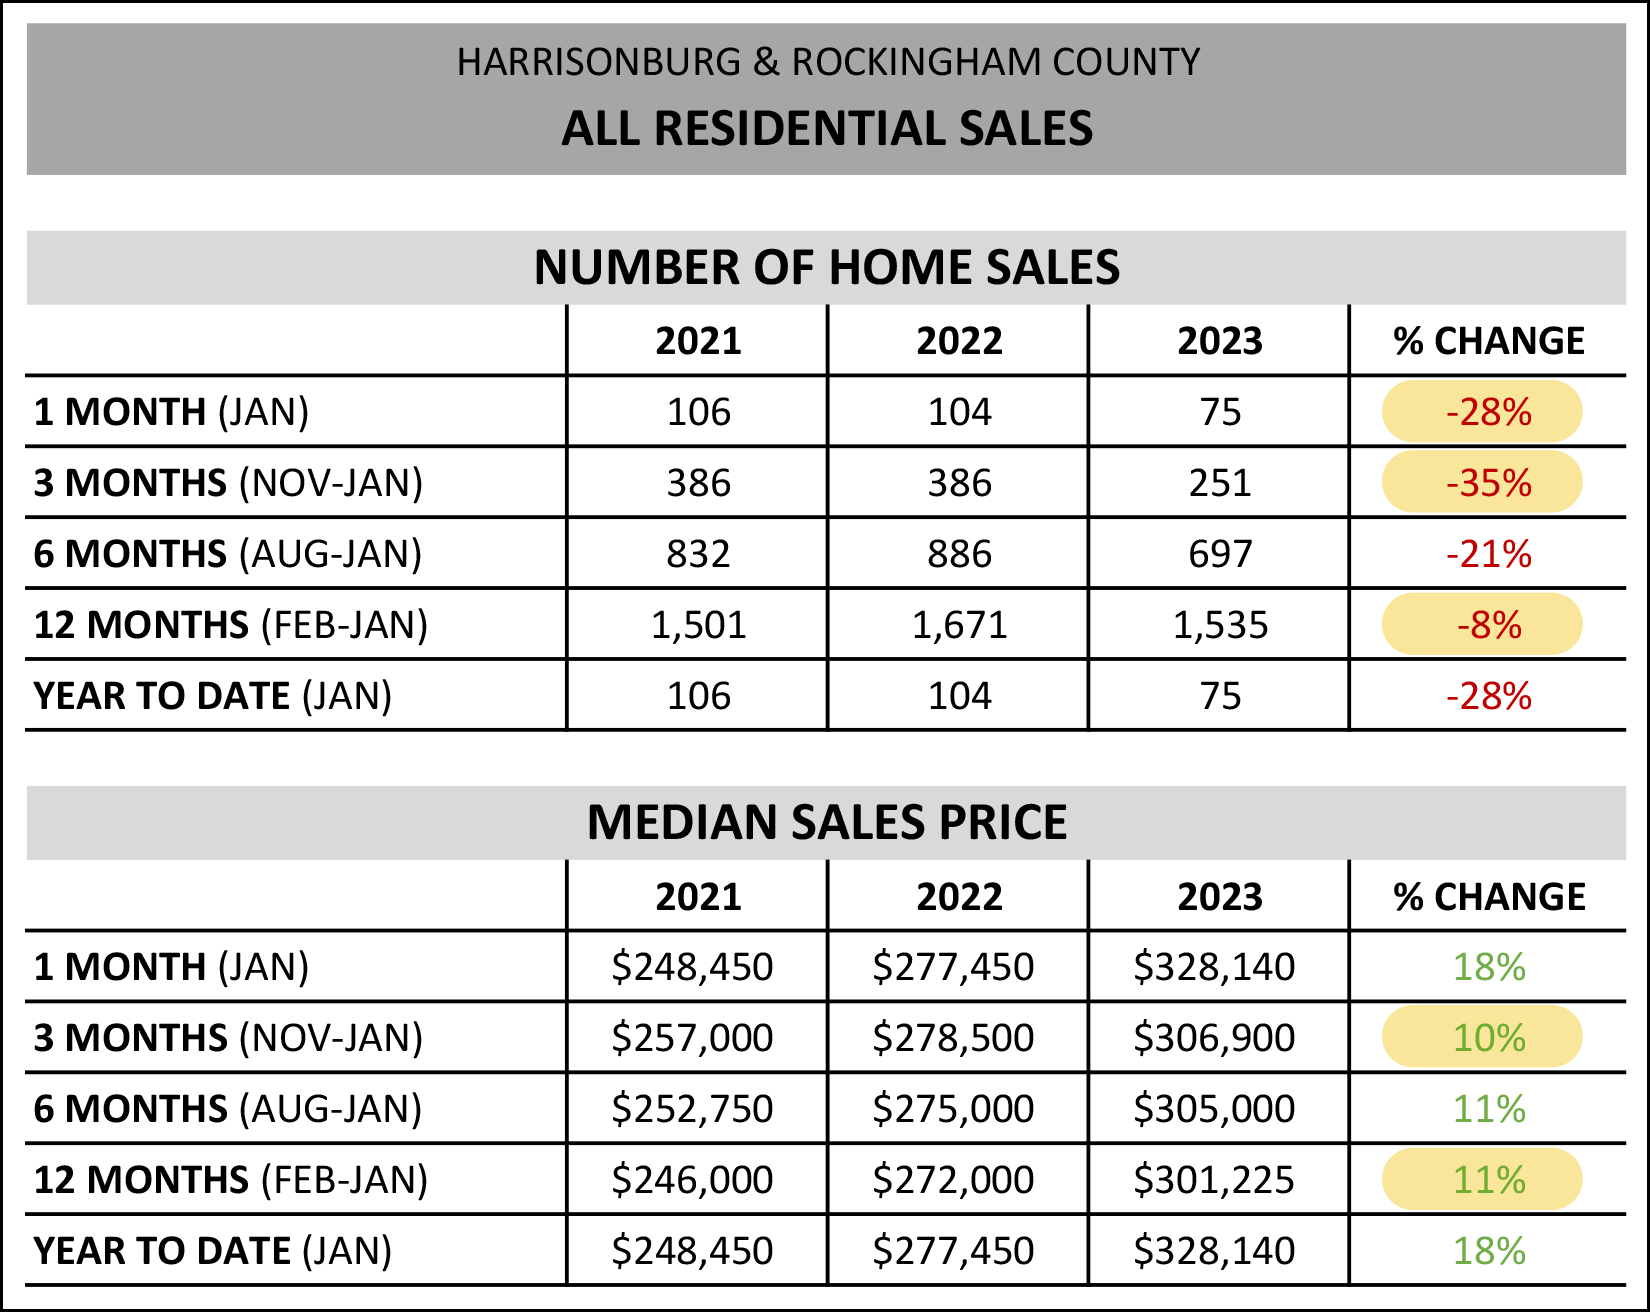 Looking first at the overall home sales data above, I'm noting a few things of interest... [1] Home sales are still slowing. We saw a 28% decline in home sales this January, with only 75 home sales as compared to 104 last January. When we stretch the window out a bit further to three months (November through January) we see an even larger, 35% decline in the number of homes selling in Harrisonburg and Rockingham County. [2] When we look at a full year of data (February through January) we see a smaller, 8%, decline in the number of homes selling in our market, though this may become a larger decline as we continue through the year. [3] Despite fewer homes selling, home prices keep on rising! The median sales price has risen 11% over the past year, and even if you narrow the focus down to the past three months (when home sales were slower) the median sales price was 10% higher than during the same three months one year prior. So, home sales are definitely slowing, but home prices are definitely still rising. Now let's start to slide into some graphs to further understand these most recent trends... 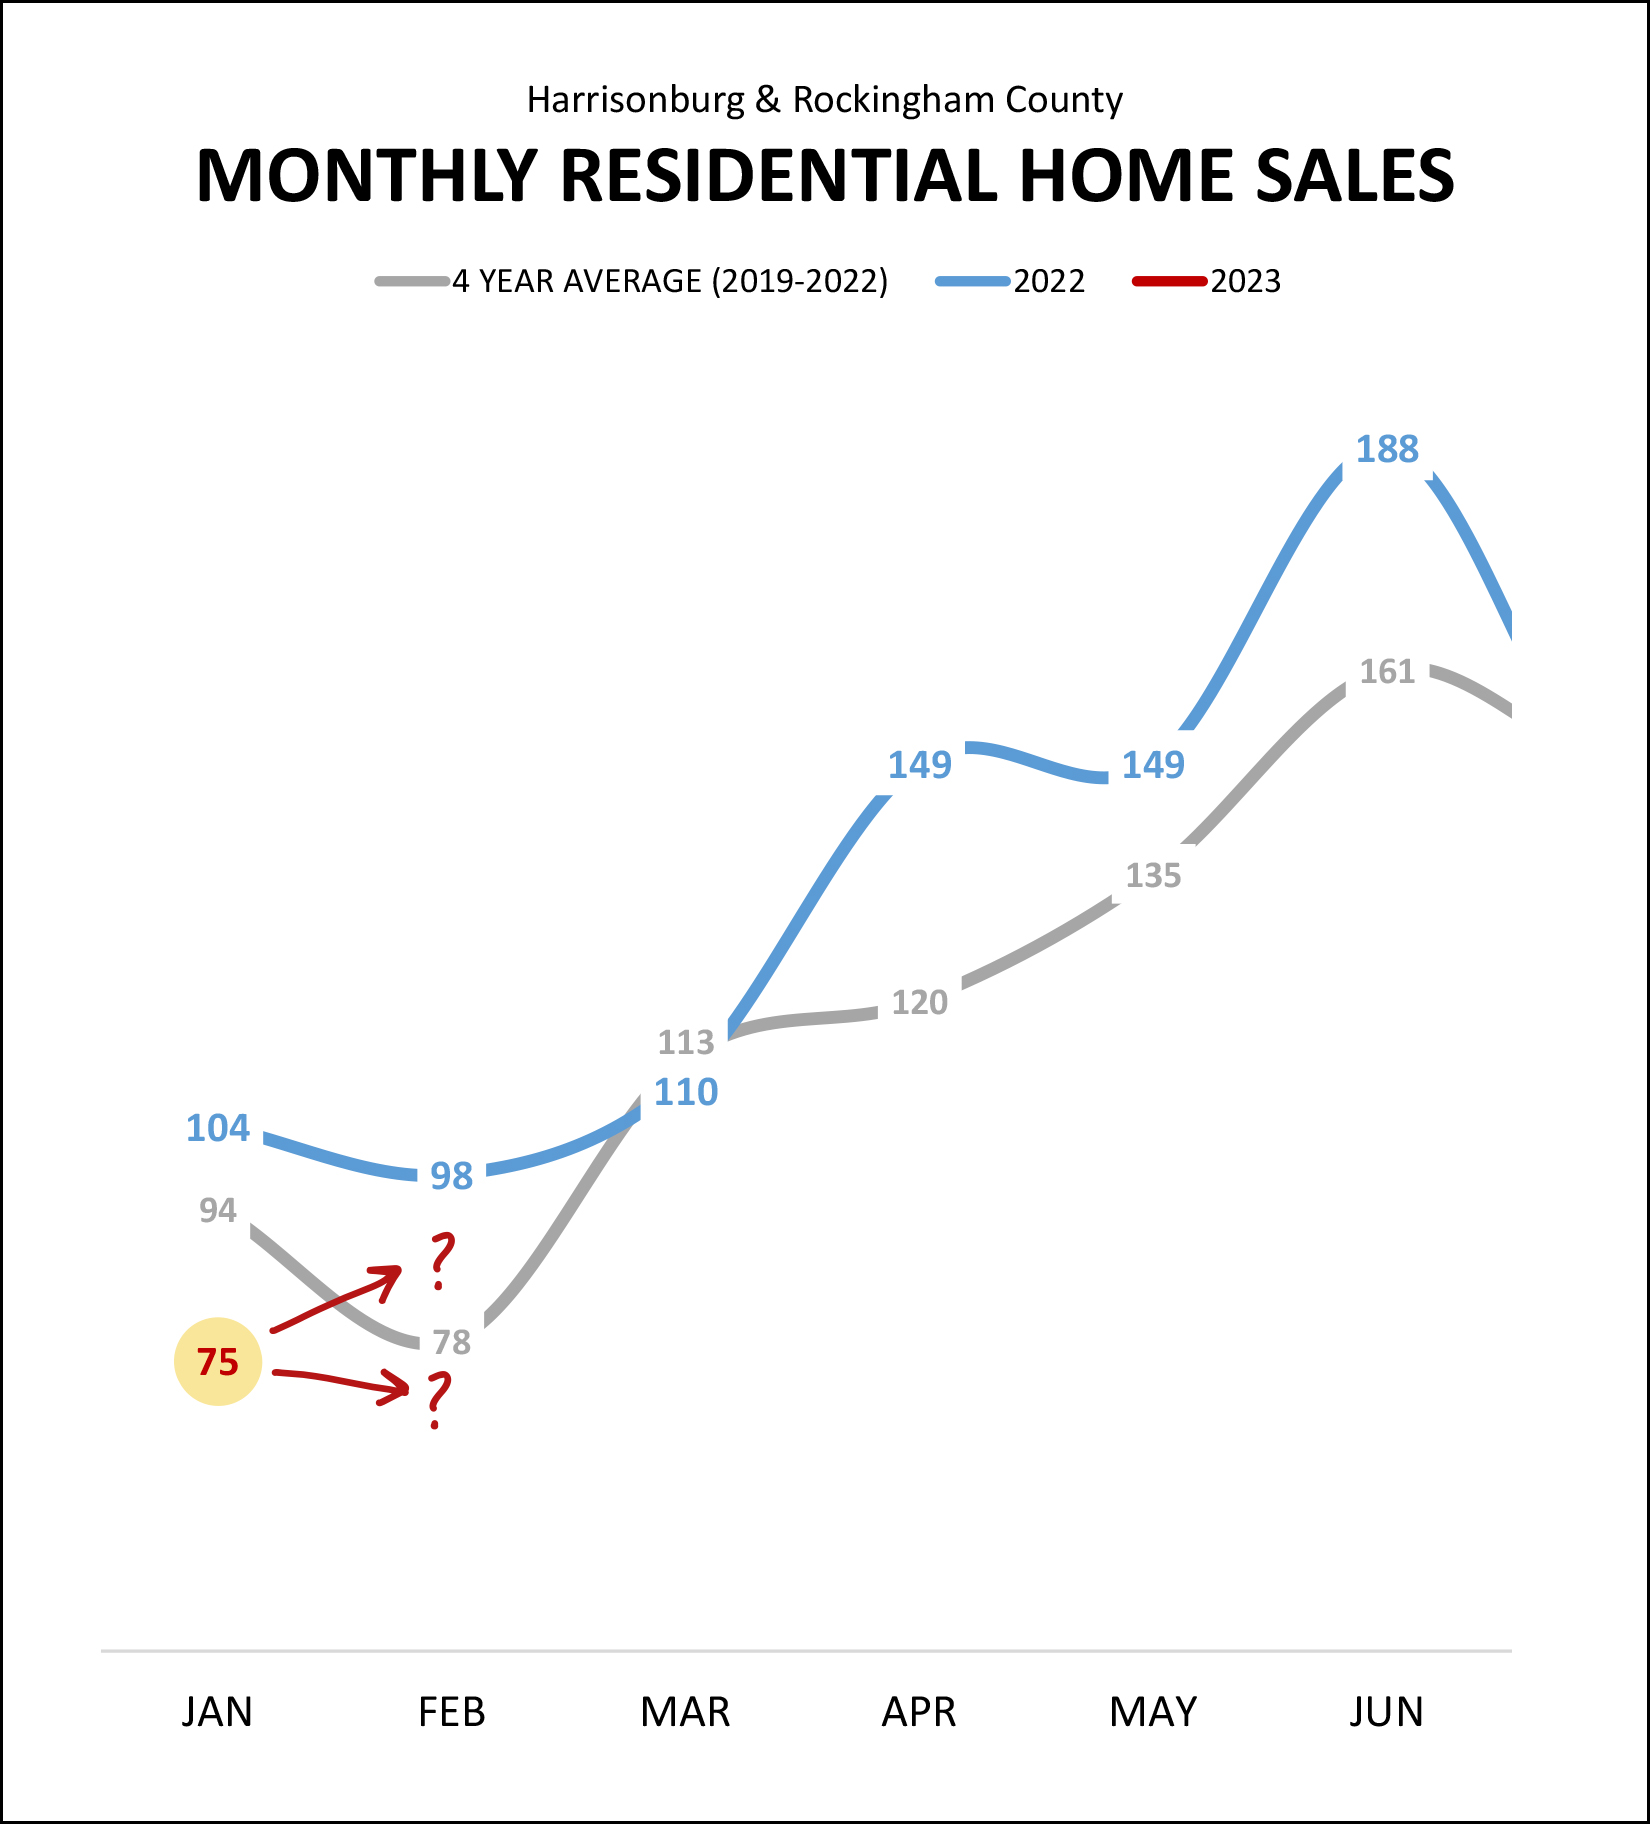 The 75 home sales seen in January 2023 (the red "75" above) marked a significant decline from last year's 104 January home sales. If we look back a bit further, and average out the number of January home sales between 2019 and 2022 we find an average of 94 home sales in January... and we also fell short of that bar in January 2023. Where do we go from here? Interestingly, we usually see a decline in home sales between January and February... so will we see fewer than 75 home sales in February 2023? Or will we see a reversal of that trend and see more than 75 home sales this month? Stay tuned! Here's a visual reminder of how much things have changed over the past two years... 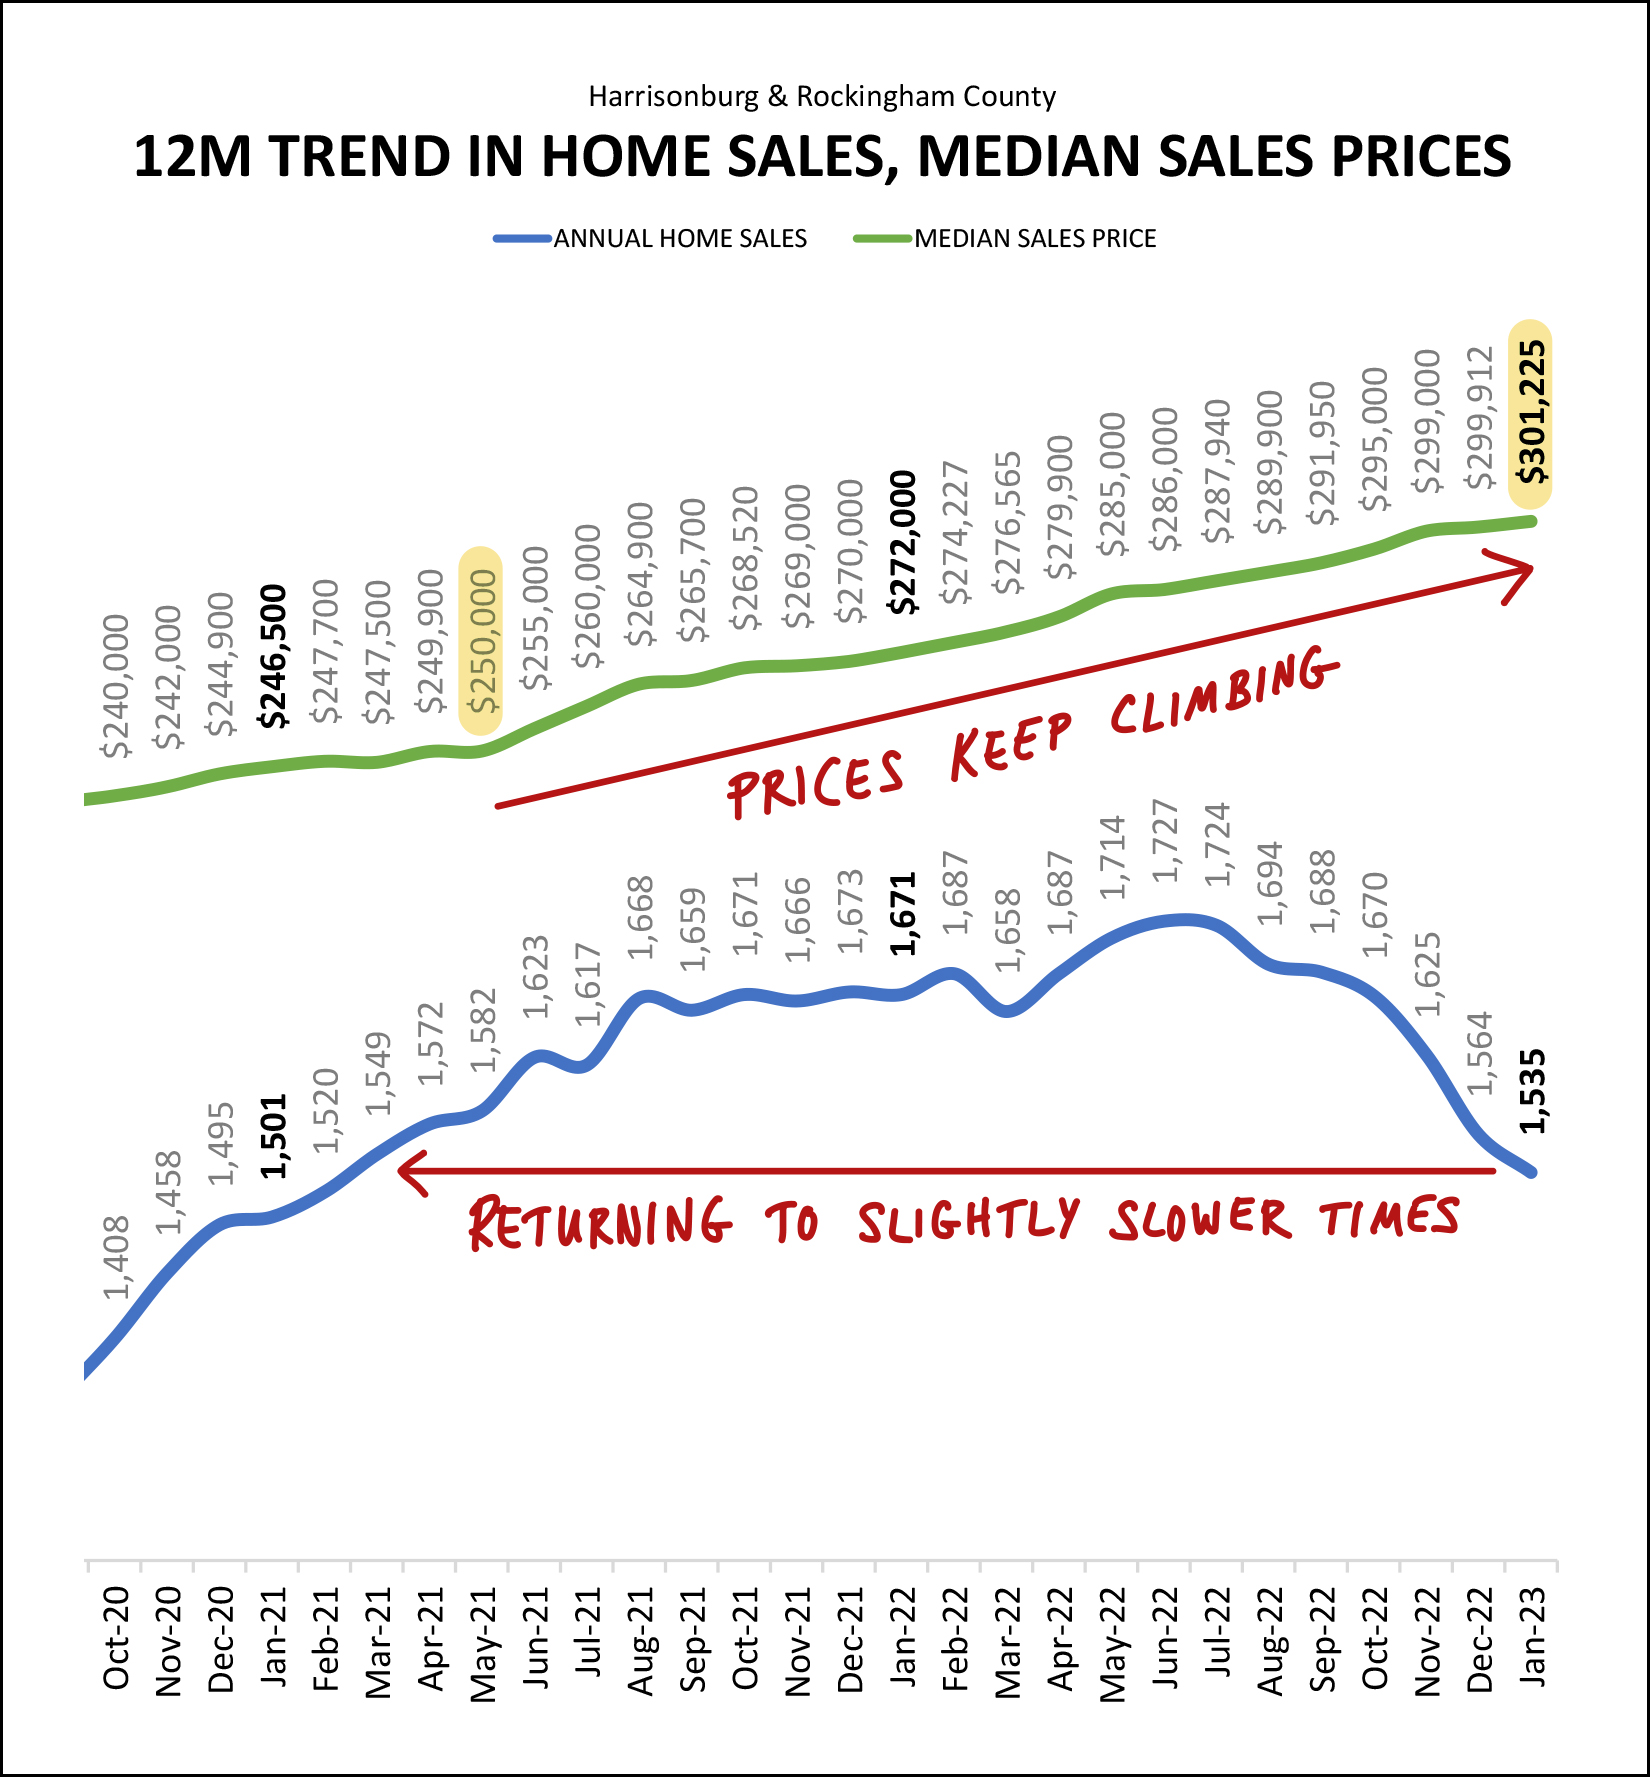 A little less than two years ago, the median sales price in Harrisonburg and Rockingham County was only $250,000. Now, less than two years later, it has just surpassed $300,000! But yet, despite the steady increases in the price of homes in our area, we have seen significant ups and downs relative to how many homes are selling. As per the blue line above, we flew past 1,500 home sales a year about two years ago -- saw that annual pace of home sales climb all the way up to 1,727 home sales per year -- before declining even more rapidly to the current annual pace of 1,535 home sales per year. What does the rest of 2023 have in store for us? I'm predicting that we'll see continued (slower) increases in the median sales price -- and continued (slower) decreases in the number of homes selling in Harrisonburg and Rockingham County. One interesting dynamic to watch in 2023 seems to be the mix between new home sales and existing home sales... 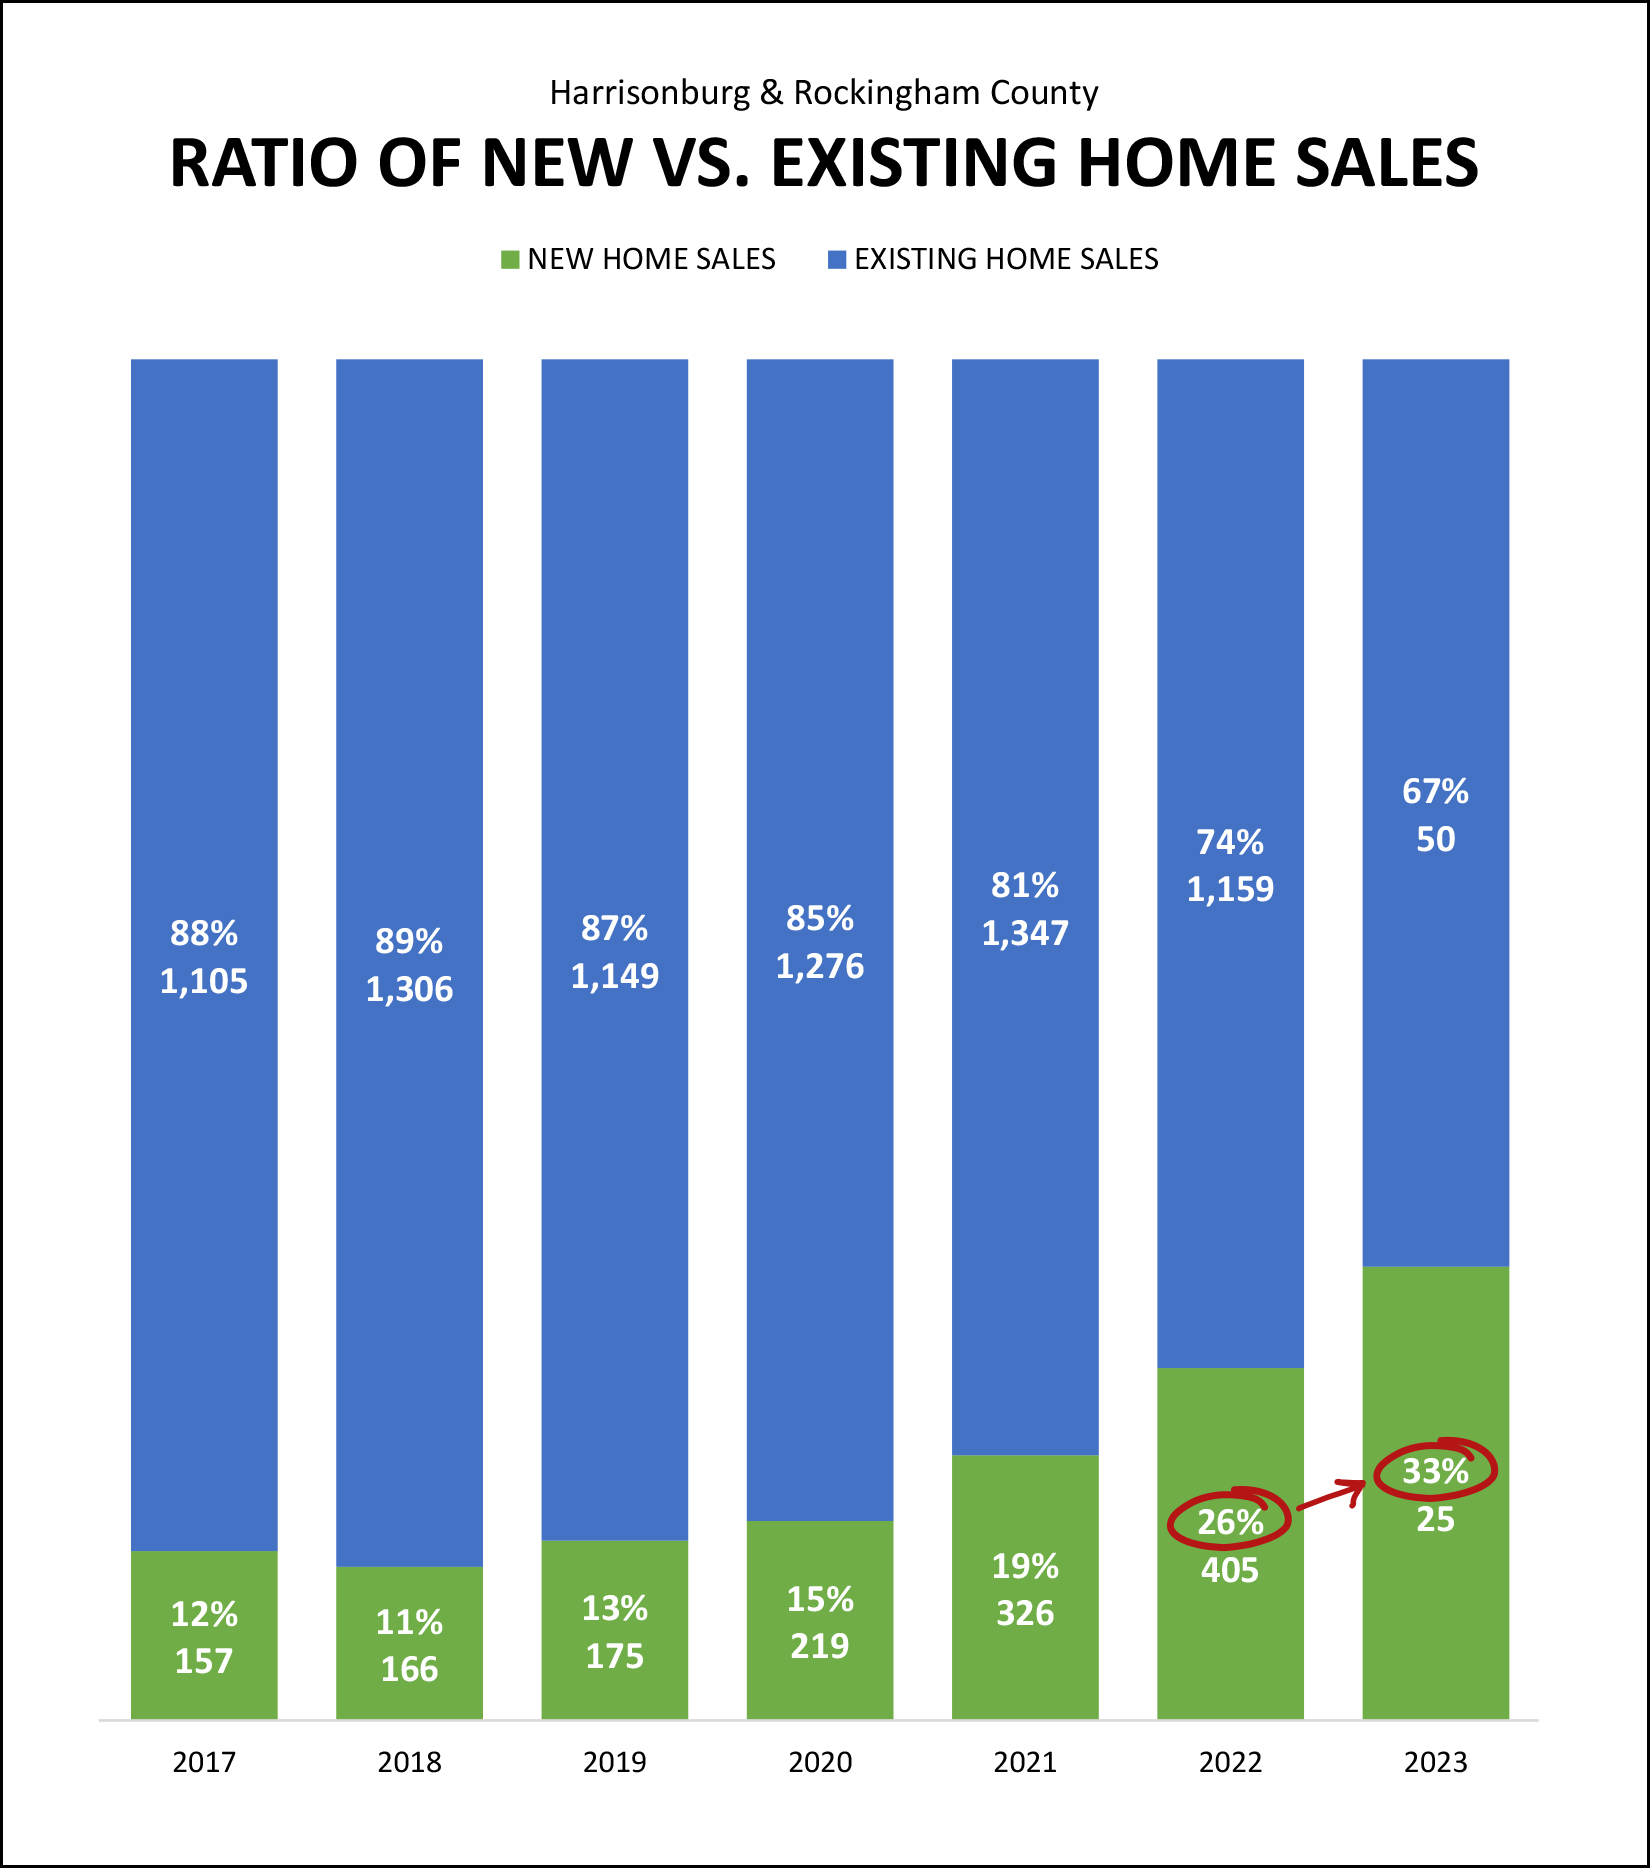 For each of the past four years we have seen an increase in the share of new home sales in Harrisonburg and Rockingham County. Back in 2018, only 11% of the homes that sold were new homes -- but last year (2022) that rose all the way up to 26% of home sales being new homes. With only one month of data thus far it is probably too early to draw any significant conclusions yet about 2023, but in January 33% of the homes that sold were new homes. To get some glimpse of what the next few months might look like for how many homes are selling, we can take a peek at contract activity... 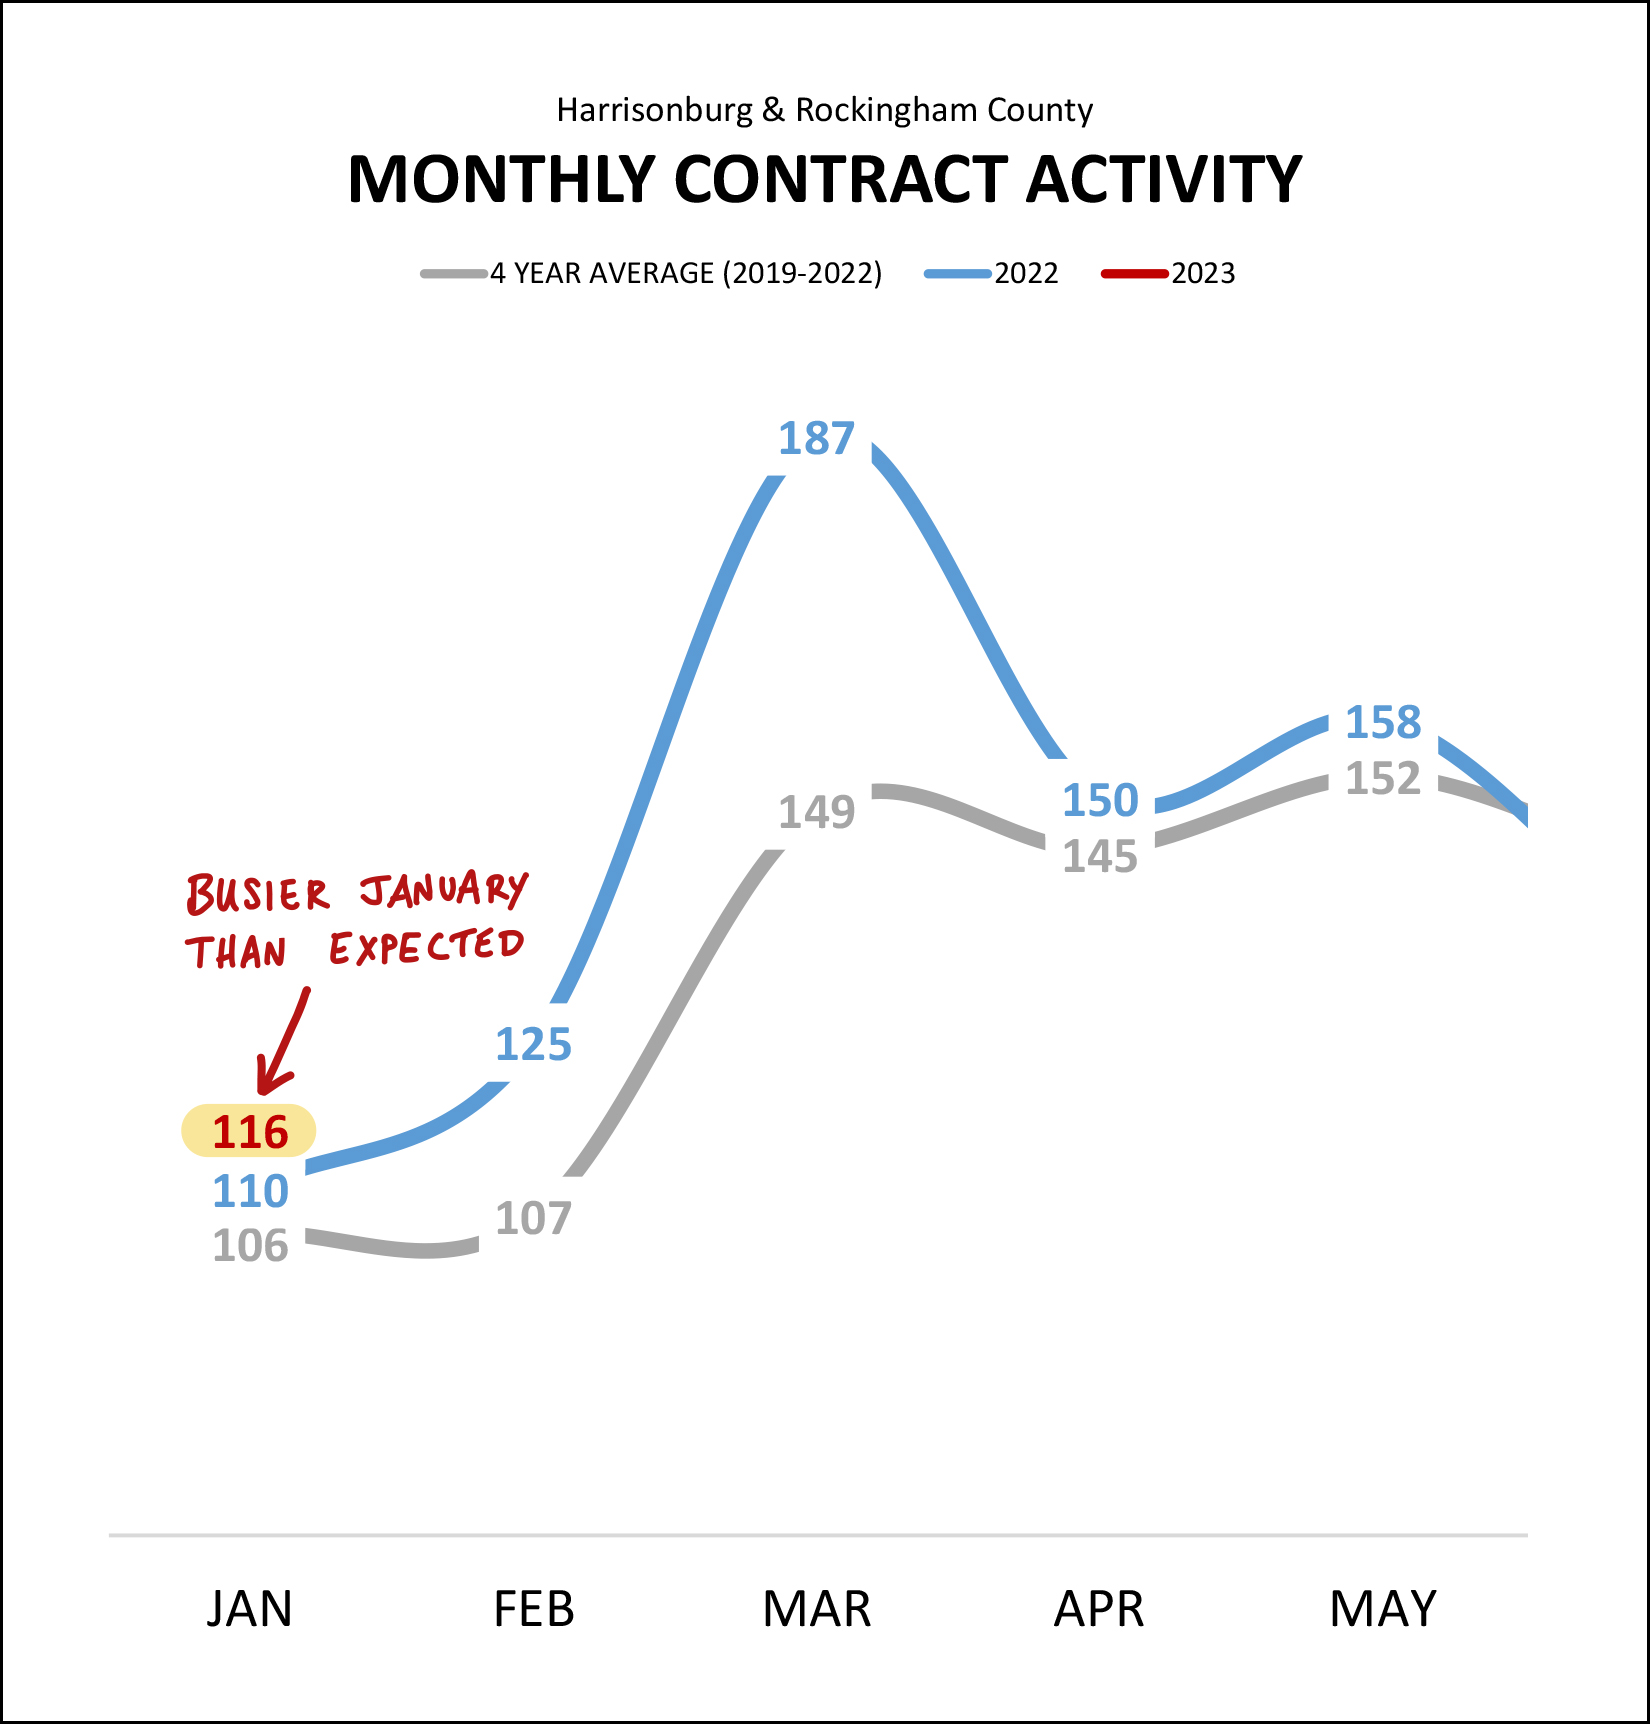 And... surprise! :-) Despite lower than expected home sales activity in January... we saw higher than expected contract activity! Over the past four years (2019-2022) we have seen an average of 106 contracts per month signed in January. Last January (2022) we saw 110 contracts signed. This January that monthly contract figure rose to 116, making it a busier January (for contract signing) than we might have otherwise expected. It's possible that declines in mortgage interest rates (referenced again later on) helped spur on some of that January contract activity. Another interesting trend to watch is the number of pending sales at any given time... 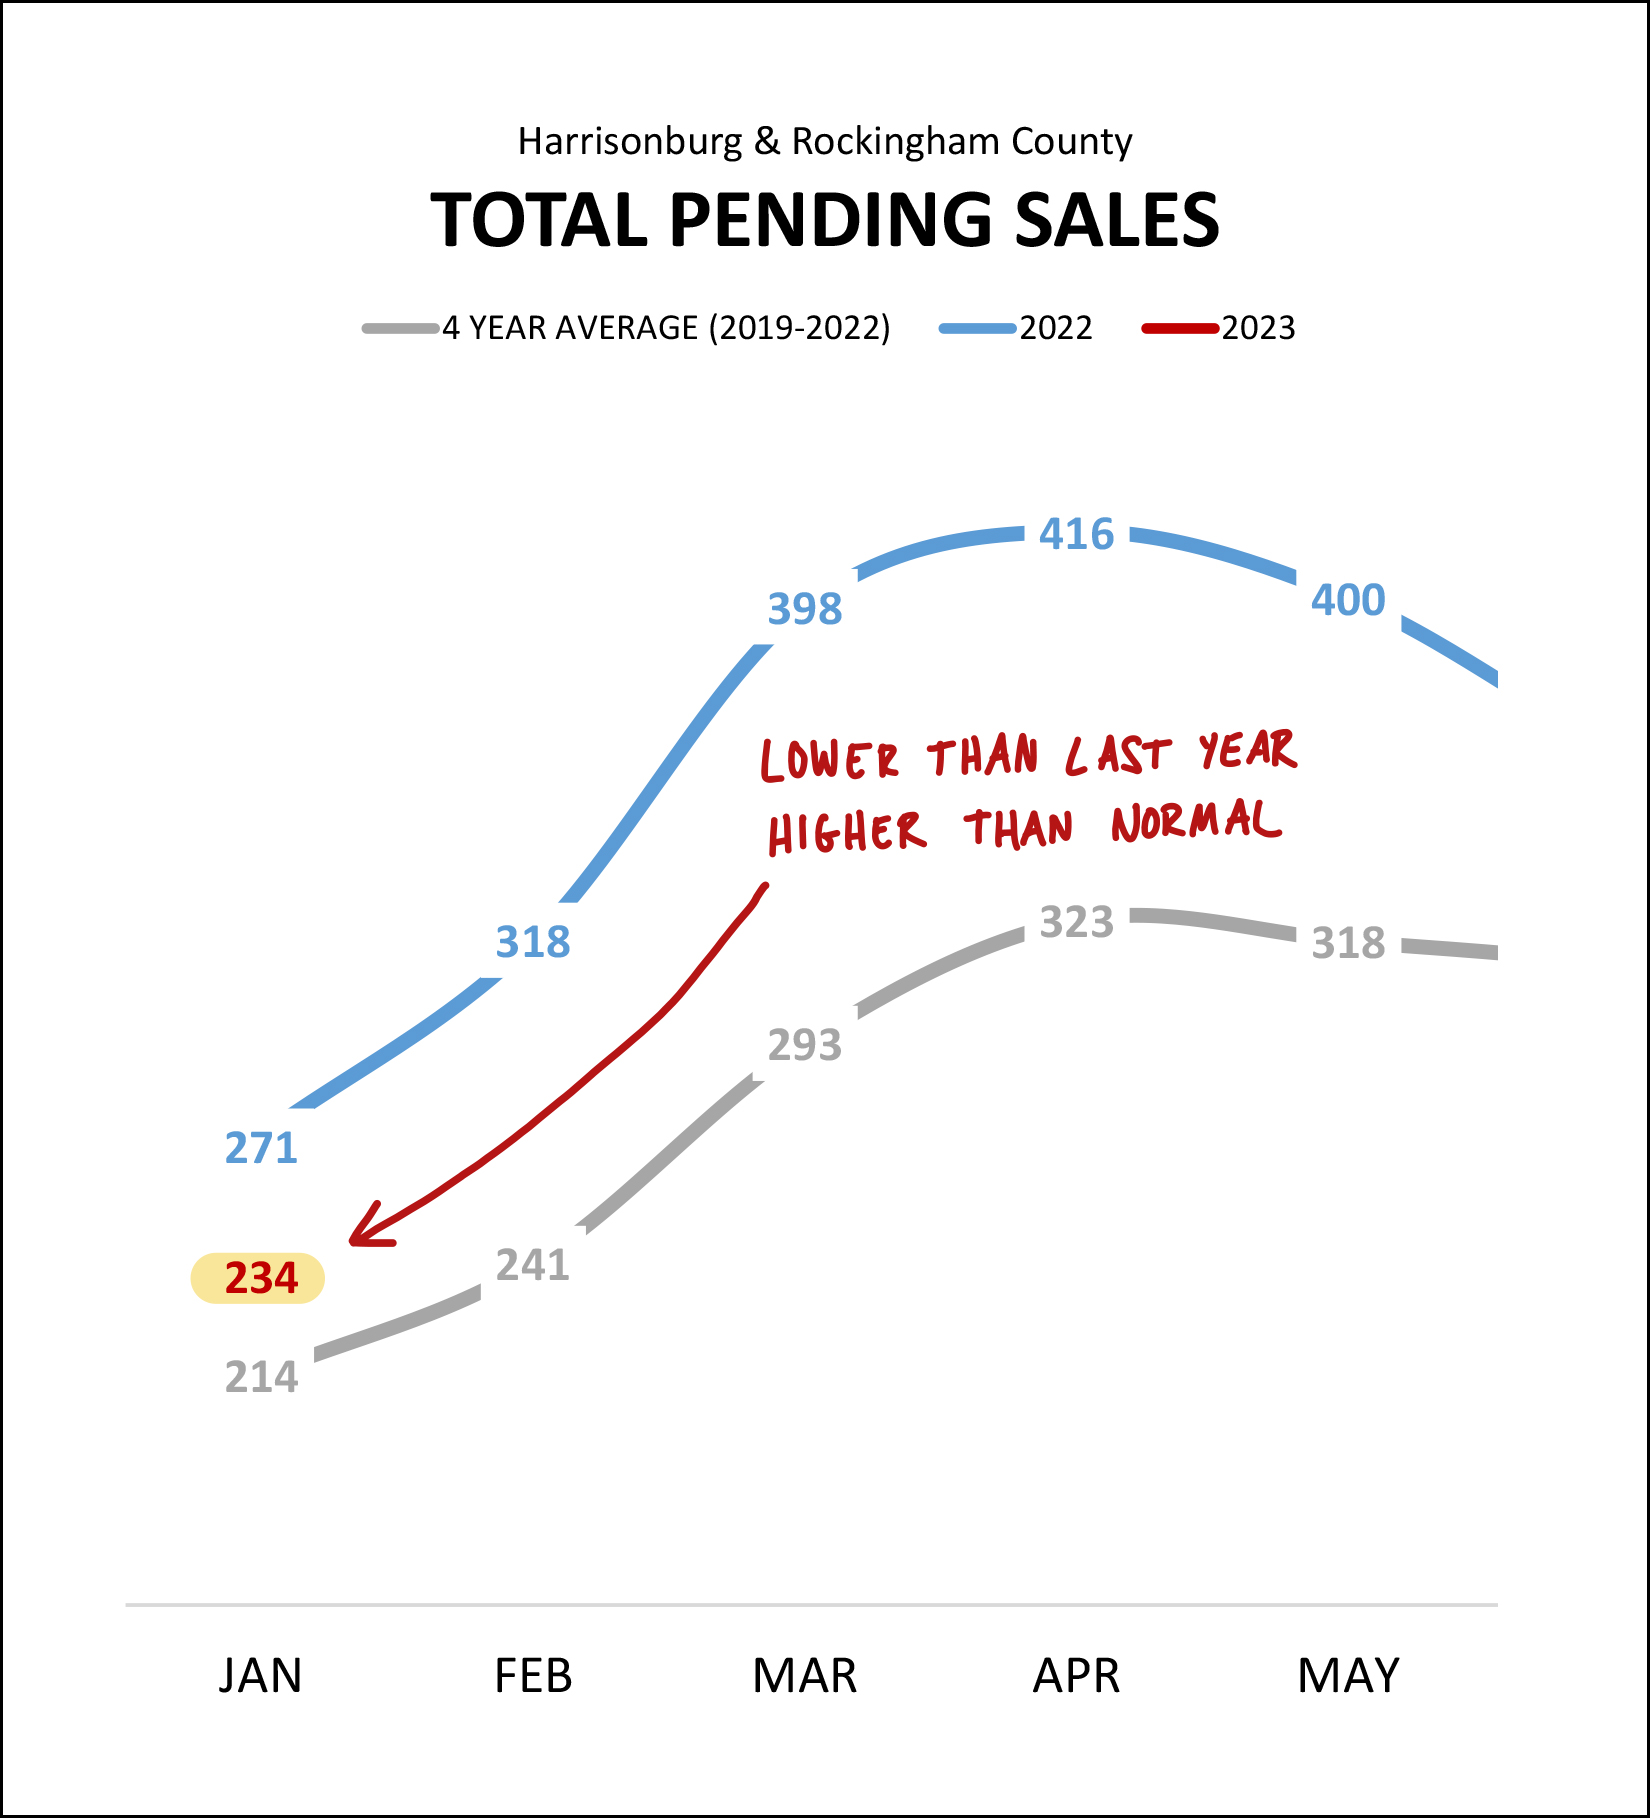 A "pending sale" is a house that is under contract, waiting to get to closing to become a home sale. One year ago there were 271 pending sales in Harrisonburg and Rockingham County. Today there are only 234 pending sales -- which is lower than where we were last year -- but is higher than the average January pending sales figure over the past four years. So, to roughly extrapolate from the past two data sets, home sales in 2023 seem likely to be lower than in 2022, but higher than the average of the past few years. But to be clear, in order for homes to sell, they need to be for sale... 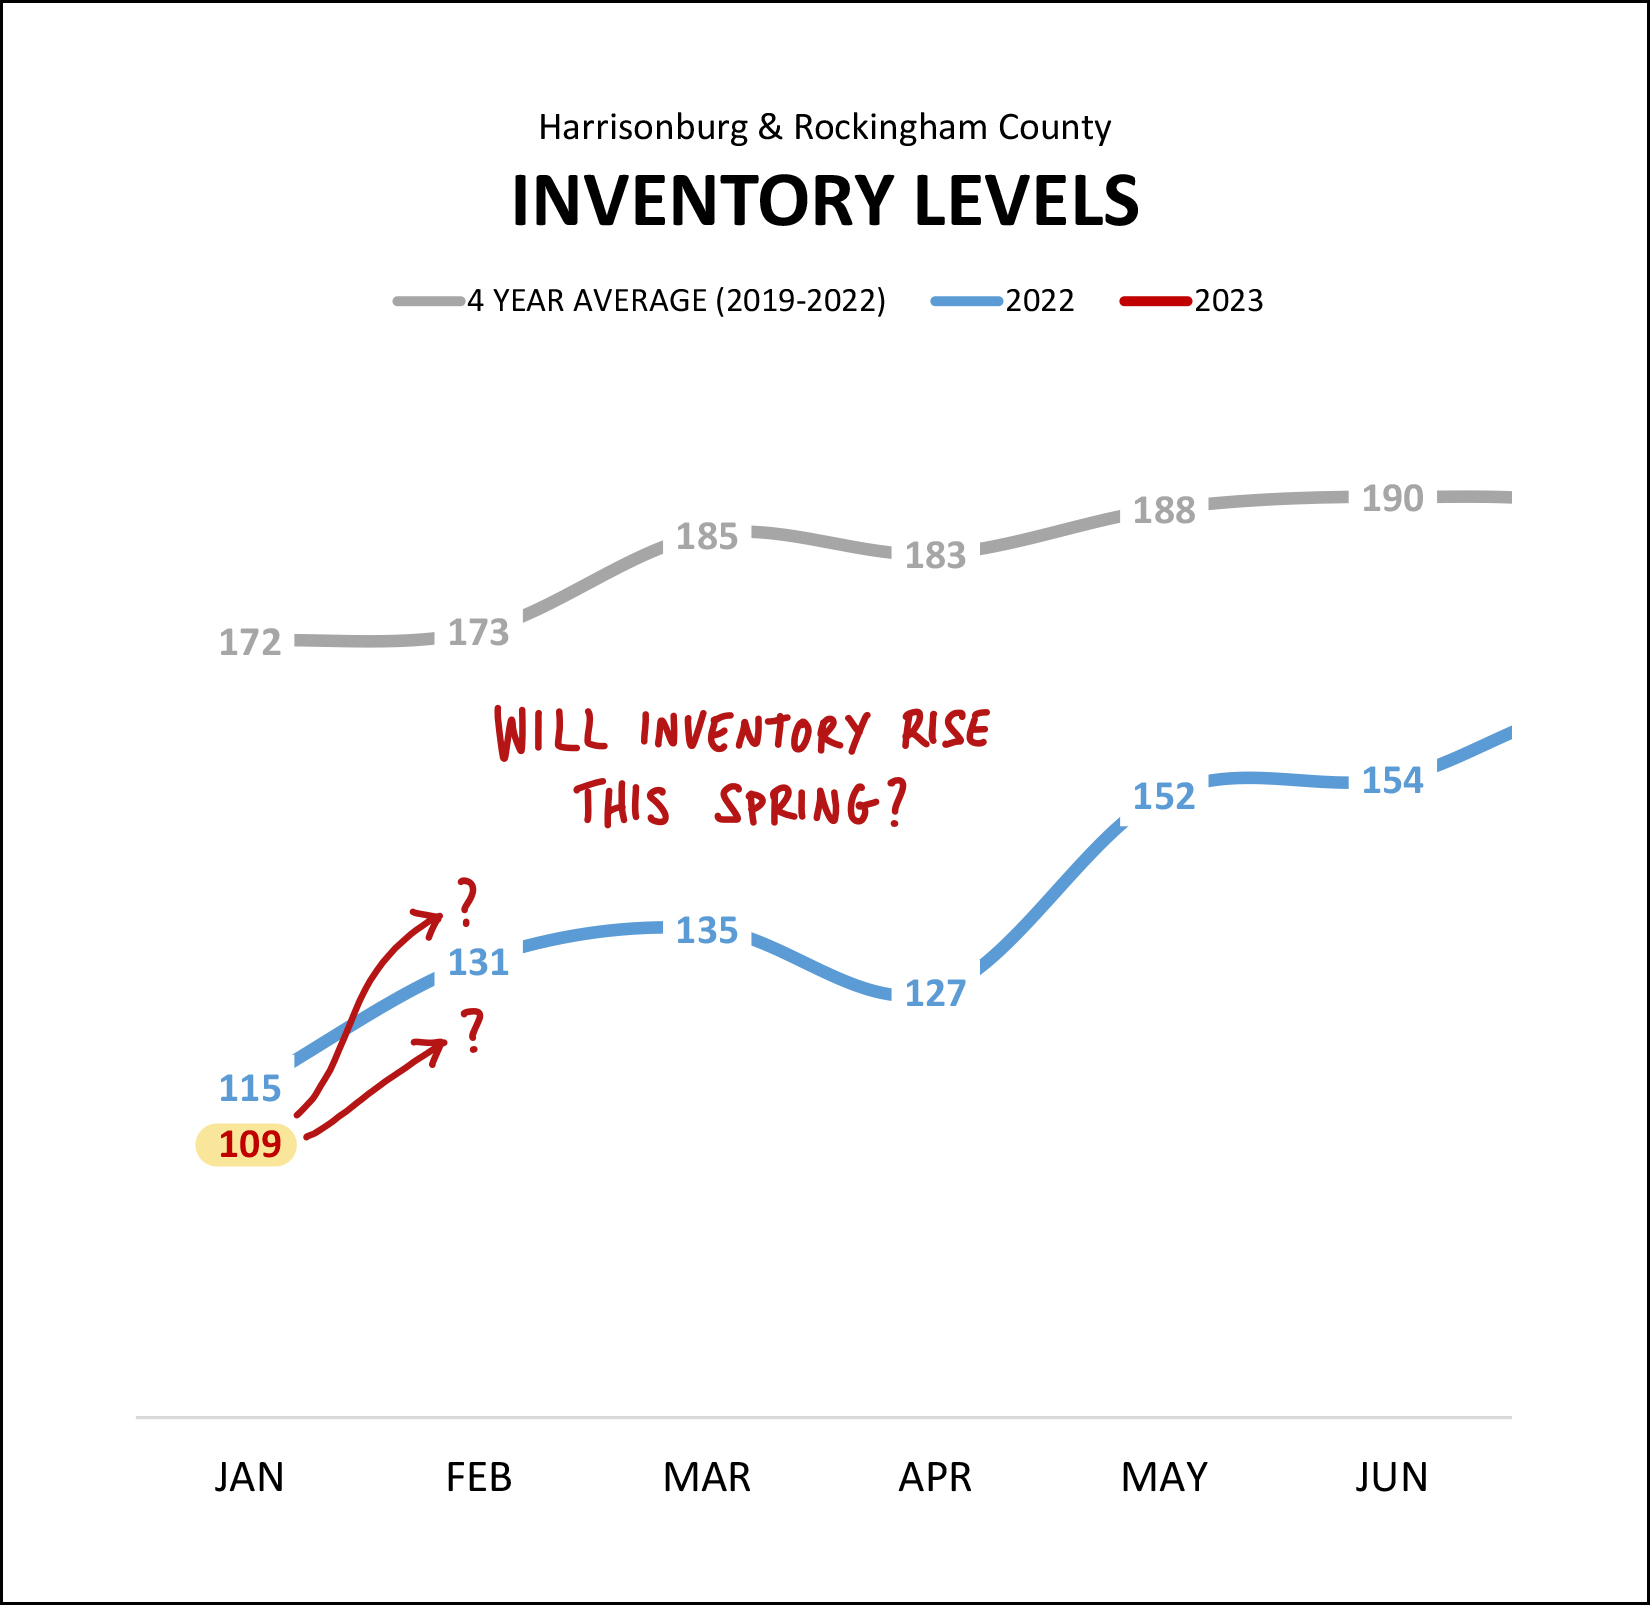 Some folks might observe a decline in sales activity and assume that inventory levels are starting to climb -- with sellers wanting to sell but buyers not wanting to buy. That is not what we are currently observing in the Harrisonburg and Rockingham County real estate market. Fewer sales may very well be equally caused by fewer buyers buying AND fewer sellers selling. There are currently 109 homes on the market for sale (not under contract) which is slightly less than a year ago (115) and much (!) much less than the average over the past four years of 172 homes being listed for sale at this time of year. The big questions for just about every buyer is whether we will start to see meaningful increases in inventory levels as we move into the spring months. Buyers should be encouraged to know that we typically see lots of new listings hitting the market in March, April and May -- but if there are still lots of buyers waiting in the wings for those new listings we may not see inventory levels rise all that much. Lots of new listings plus lots of new contracts will still equate to rather low inventory levels. I mentioned earlier that a slightly higher than expected number of contracts in January might have been related to mortgage interest rates. Take a look at why I'm guessing that might have been the case... 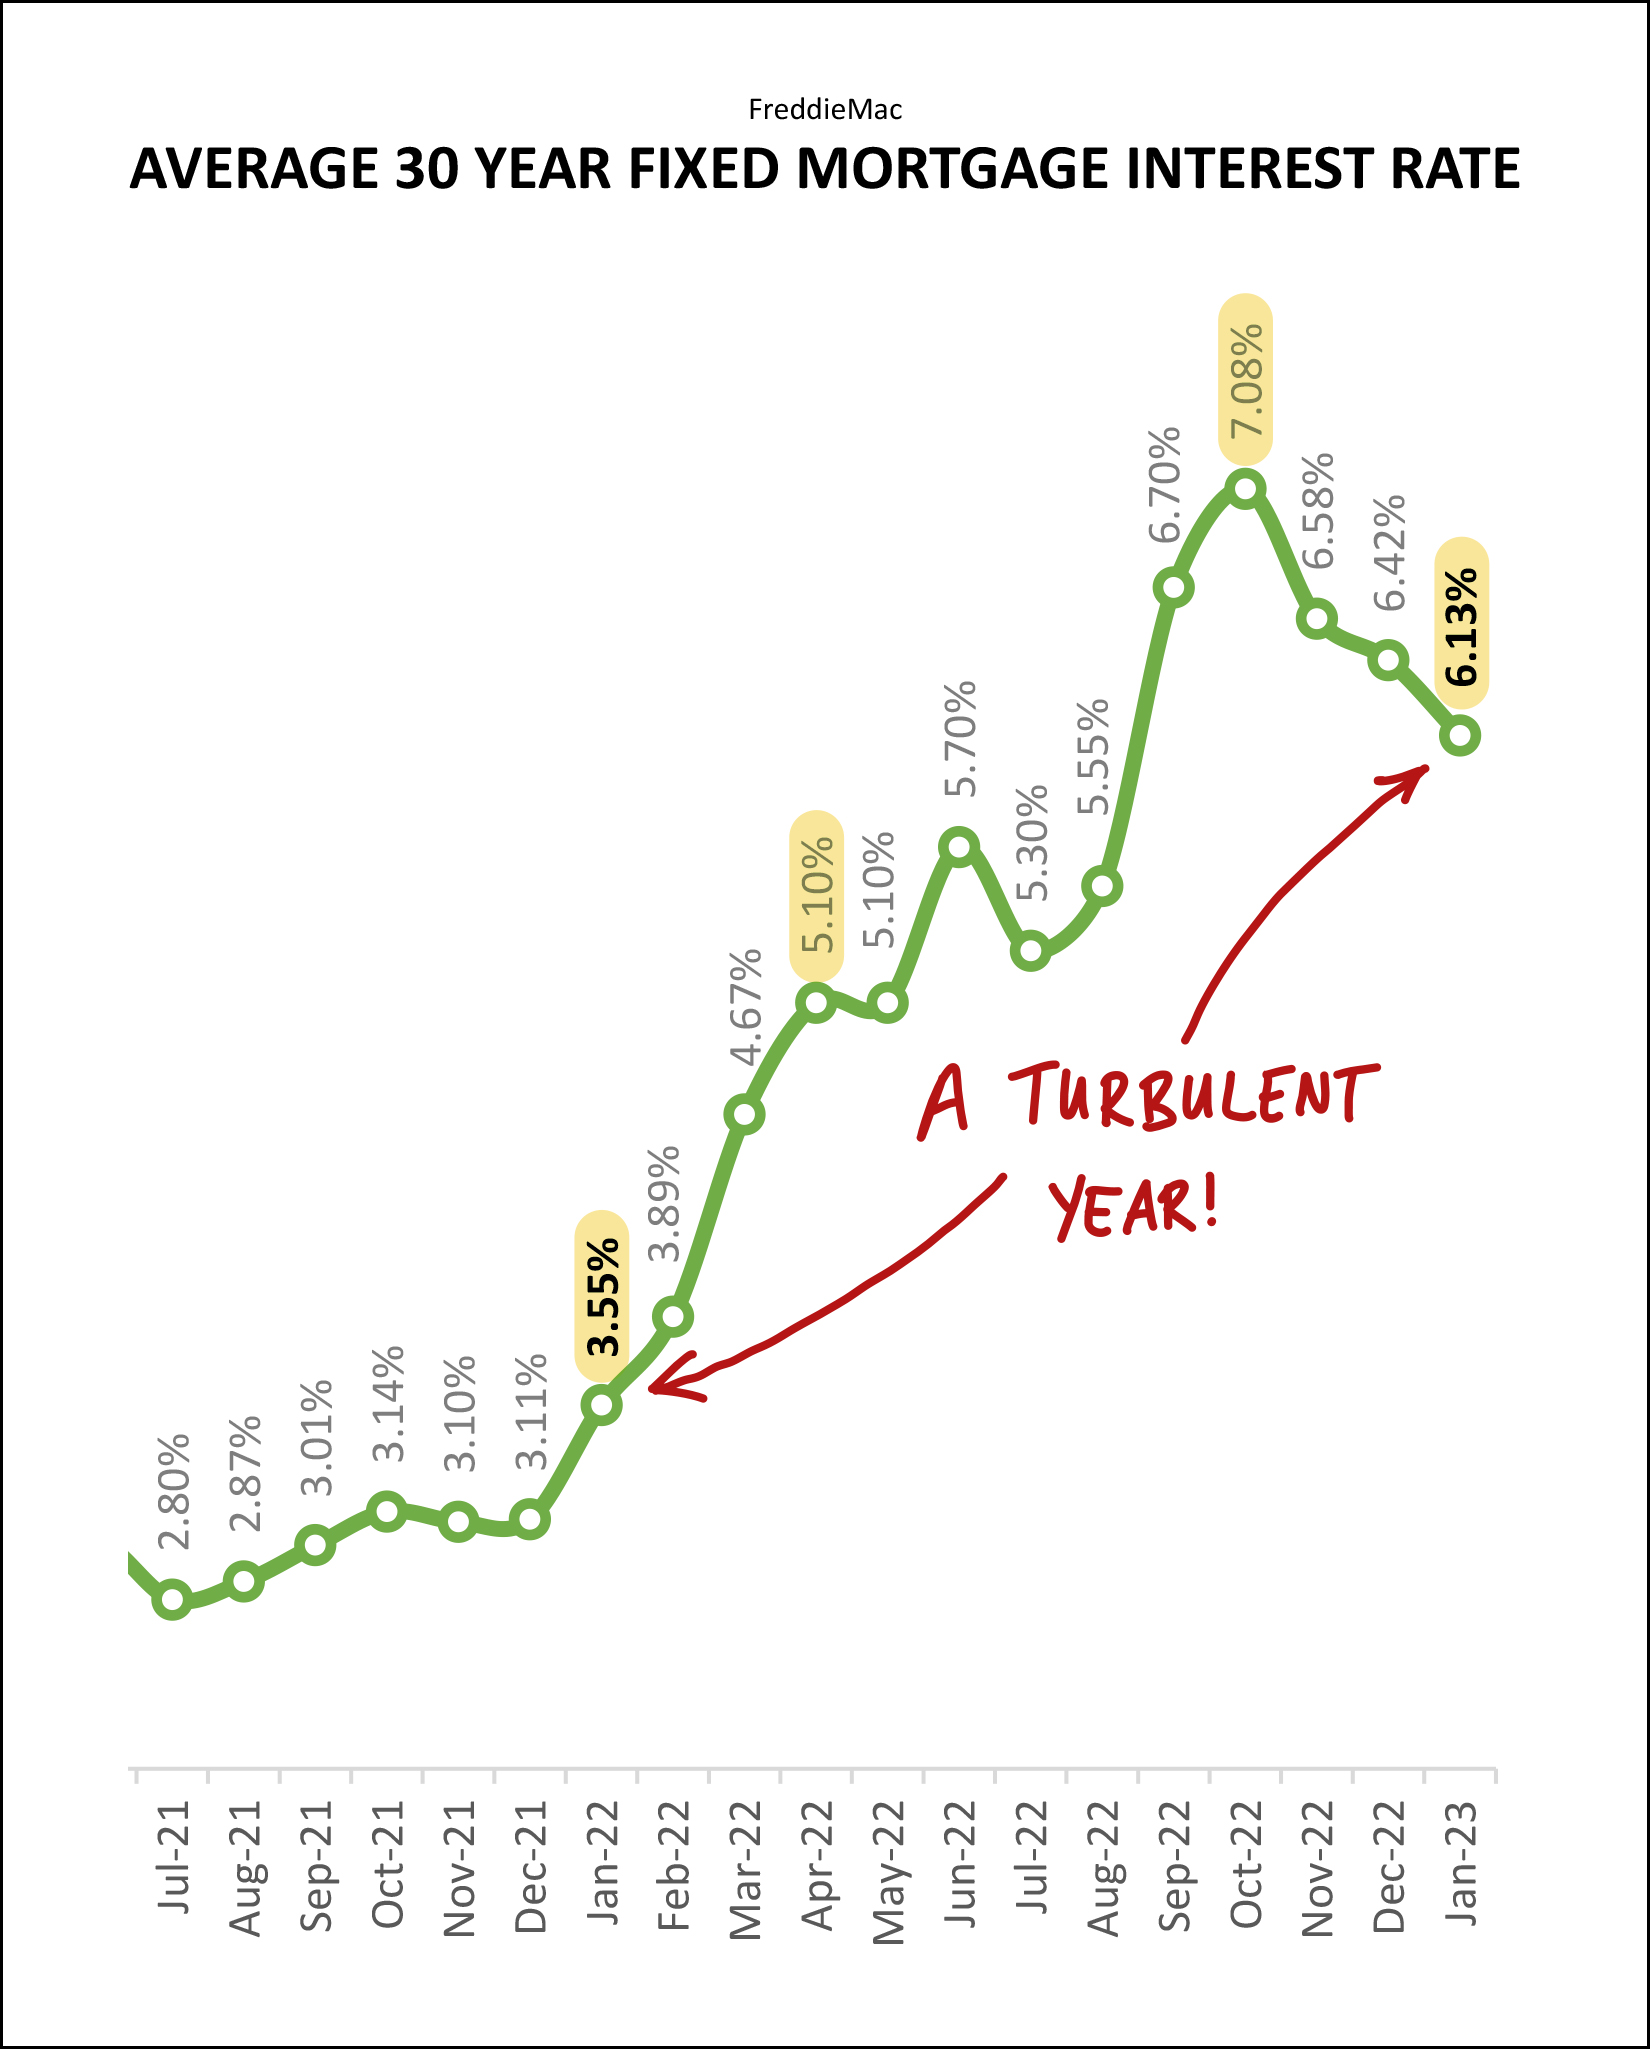 It has been a wild and crazy year with mortgage interest rates. Just a year ago, interest rates were below 4%, then climbed all the way up above 7% and have now decline back towards 6%. Those highest months of interest rates in September, October, November and December almost certainly contributed to the much slower (-35%) months of home sales in November, December and January. The decline over the past three months may have contributed to the increase in contract activity in January 2023. Where will mortgage interest rates be headed in 2023? Probably not above 7%. Probably not below 5%. Probably not anywhere for more than a few weeks in a row. Does that help? Probably not. ;-) Given all of the market data above, when I look ahead to the remainder of 2023, I believe the following will likely be true: [1] We will see fewer home sales than in 2022. [2] Home prices will likely be higher than in 2022. [3] Inventory levels will likely remain low most or all year. [4] The decline in the number of existing home sales will likely be larger than the decline in the total number of existing and new home sales. [5] Mortgage interest rates will likely close out the year lower than where they started the year. As you look ahead to 2023... do you hope to buy a home... or do you plan to sell your current home? If you are thinking about heading down either path, let's find a time to connect soon to talk about your hopes and plans and dreams and how they will be best accomplished amidst the market trends outlined above. Feel free to reach out to start that conversation by emailing me or texting or calling me at 540-578-0102. If you don't plan to buy or sell a home this year, but want to learn more about our local housing market... [1] You can review even more charts and graphs with further analysis of our local housing market here. [2] I publish a variety of articles about the market, new housing developments, and more over on my blog several times a week here. And that's a wrap, folks! I hope you have a wonderful Friday and weekend ahead. Please be in touch if I can be of any help to you -- with real estate or otherwise! | |
| Newer Posts | Older Posts |
Scott Rogers
Funkhouser Real
Estate Group
540-578-0102
scott@funkhousergroup.com
Licensed in the
Commonwealth of Virginia
Home Search
Housing Market Report
Harrisonburg Townhouses
Walk Through This Home
Investment Properties
Harrisonburg Foreclosures
Property Transfers
New Listings

