| Newer Posts | Older Posts |
What comes next for our local housing market? |
|
When viewed from a long term perspective, every real estate has peaks and valleys – some larger than others. Our local housing market experienced a tremendous peak in 2005/2006 with home sales doubling (2000-2005), and home prices increasing 66% in just six years (2000-2006). The valley that has followed that peak has been a rough ride back down, with home sales falling 55% (2005-2010) and home prices falling 11% (2008-2011). During the last several years (2012, 2013) we have finally seen some strength and stability returning to our local housing market, though many still wondering what will come next. HOME SALES – Before the real estate bubble began to inflate, there were around 1,000 homes selling per year in Harrisonburg and Rockingham County (through the HRAR MLS). The population of Harrisonburg and Rockingham County increased 16% between 2000 and 2010, so we might expect that 1,160 home sales per year may be the norm moving forward. While last year (2012) there were only 864 home sales in our local market, this year we seem poised to see around 1,050 home sales, based on the 22% year-to-date increase in sales activity. If we do indeed seen 1,050 home sales this year, we should be encouraged to observe that home sales likely could increase even further in 2014 towards that expected 1,160 – 1,200 range. HOME PRICES – Despite seeing a 66% increase in home prices from before the bubble (2000) to the peak of the bubble (2006) we have only seen an overall 8% decline in prices between that peak (2006) and today (2013 YTD). Furthermore, 2012 showed a 1% improvement in median sales prices, and this year we are seeing a 2% improvement in prices. Thus, it seems likely that the worst is behind us as far as price adjustments related to the housing boom and bust. That said, every neighborhood and price range is a bit different – there are still some price ranges (particularly high end homes) that are not yet seeing price recovery. INTEREST RATES – Arguably, the recent historically low mortgage interest rates have helped to spur on our local housing market over the past several years. The average mortgage interest rate for a 30 year mortgage dropped below 5% in late 2009, and then down below 4% in late 2011. After hitting an all-time low of 3.32% in late 2012, this average mortgage rate has risen to around 4.5%. Over the next year or two it seems safe to assume that we probably won't see rates as low as 4%, but we also probably won't see them rise as high as 6%. These rising interest rates have encouraged many buyers to go ahead and make a purchase if they have been considering doing so with an open ended time frame. Even if interest rates continue to rise to 5%, or even a bit beyond that, they will still be offering a great opportunity for buyers to lock in their housing costs at historically low levels. FORECLOSURES – Thankfully, our local area usually only sees 50 – 100 foreclosures per year based on what we were seeing between 2000 and 2007. After the real estate boom and bust, local foreclosures increased quite a bit, to a high of 270 in 2010. We are seeing significantly fewer foreclosures this year (141 YTD) which marks a decline from the highs of the last few years, but still a higher than normal level for our local area. A lower number of foreclosures in 2013 will help prices to stabilize in our local market, and with home sales and prices increasing, there are likely to be even fewer foreclosures per year as we move forward. Our local market is fortunate to have only seen small declines in home values as compared to many other housing markets across the country. Our diverse local economy has certainly helped to keep our local housing market relatively stable. Over the next few years, we are likely to see continued increase in the pace of home sales in our local market, as well as slow and steady increase in home values. | |
30 Year Fixed Mortgage Interest Rates Steady Around 4.5% |
|
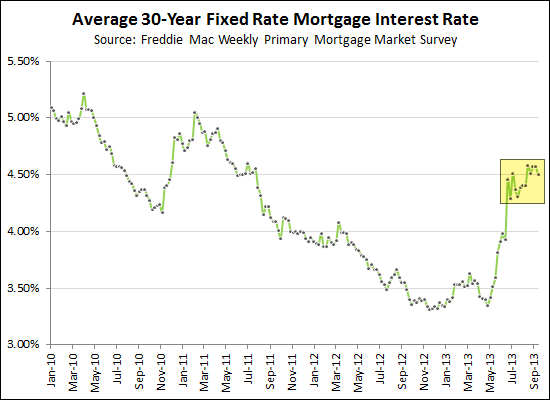 At least for now, 30 year fixed mortgage interest rates seem content to hover around 4.5%. After having stayed below 4% for a year and a half (Nov 23, 2011 - June 20, 2013) mortgage interest rates jumped up rather quickly this past June. Since that time, however, rates have stayed between 4.3% and 4.6% without too much variation from week to week. | |
Are you selling a house listed for more than $400K? |
|
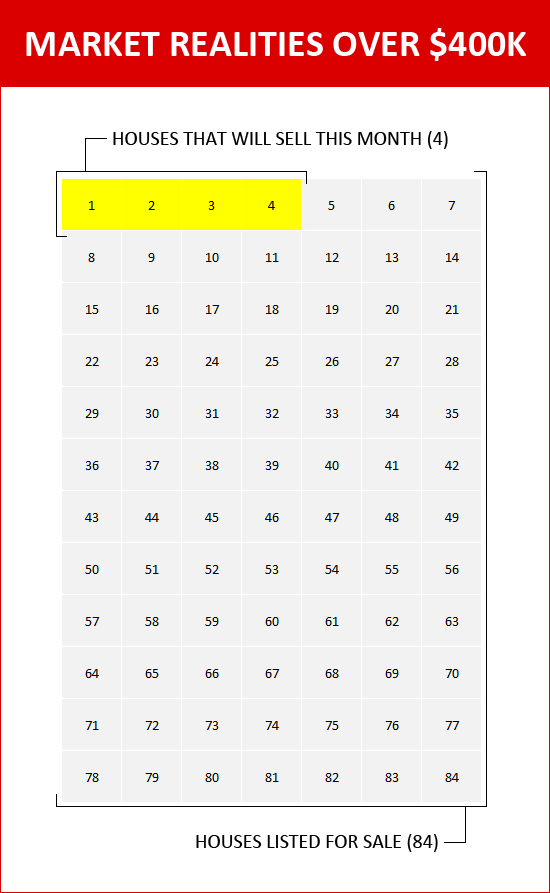 How then, does a seller of a house over $400,000 make their house stand out? How do you best position yourself to be one of the four houses to sell this month?
Bear in mind, of course, that some factors are outside of your control....
| |
What did home buyers buy in August 2013? |
|
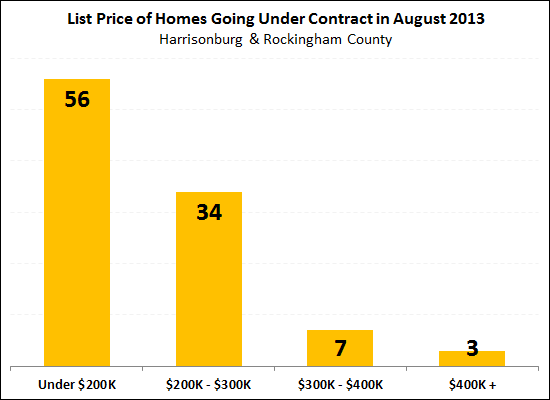 These are the 100 properties that went under contract in Harrisonburg and Rockingham County in August 2013. | |
Inventory levels down but headed up |
|
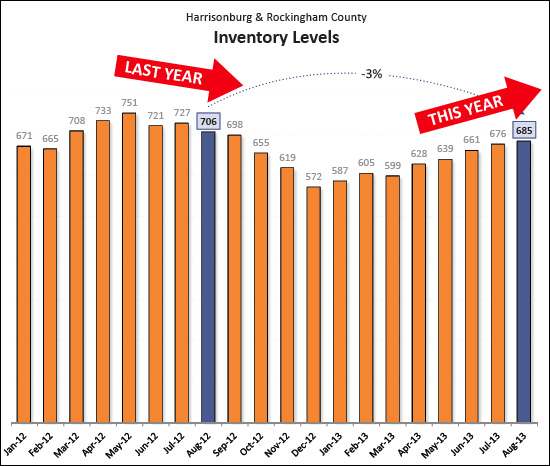 Inventory levels (the number of homes for sale) are down 3% as compared to this time last year. That said, inventory levels generally declined between May and September of last year --- whereas this year they have been increasing between May and September. Could this be an indicator that homeowners are excited to see our marketing starting to recover (22% increase in homes sales and 2% increase in sales prices) and are more optimistic about selling their homes now? | |
Real Estate Roller Coaster |
|
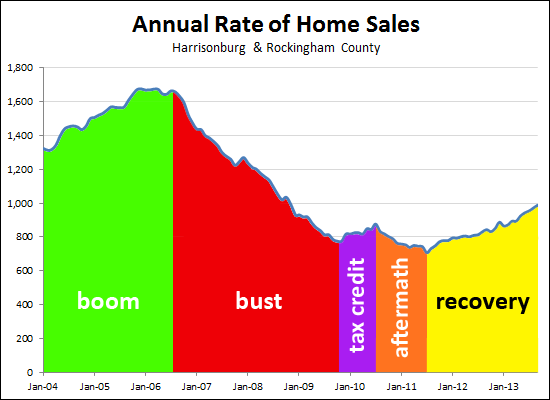 The graph above shows the annualized rate of home sales in Harrisonburg and Rockingham County. After an enormous boom (that actually started before 2004) and then a big bust, and then an attempted recovery via a federal home buyer tax credit, and then further post tax credit decline, we are finally seeing a sustained recovery in our local housing market. Over the past two years the annual pace of home sales has climbed from 706/year up to 989/year. | |
Home Sales Soar (+22%) and Prices Inch Upward (+2%) Though Mostly in Lower Price Ranges |
|
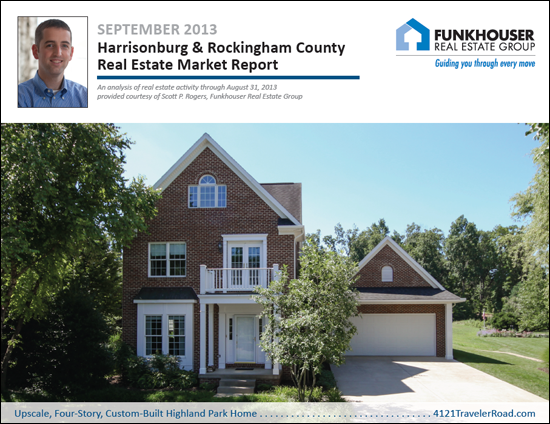 I have just released my September 2013 monthly market report covering the Harrisonburg and Rockingham County housing market. If you remember nothing else, remember this....
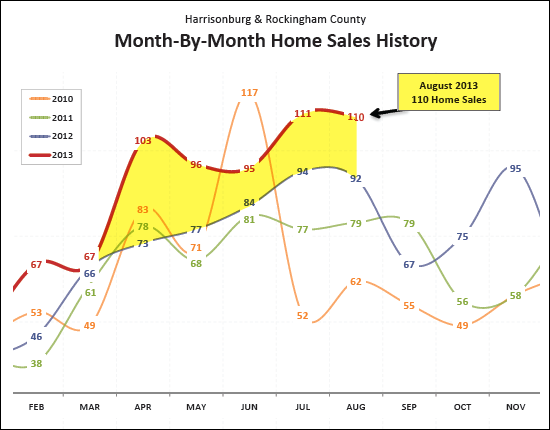 As can be seen above, April through August homes sales this year have been head and shoulders above last year --- contributing to an overall 22% increase in the pace of home sales. 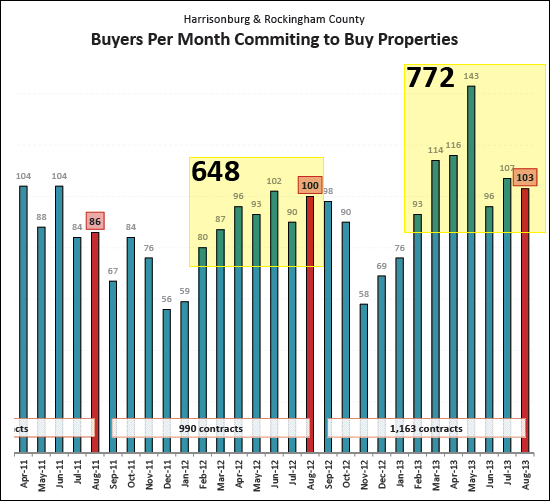 Buyer activity is much stronger this year (772 contracts in the past 7 months) as compared to last year (648 contracts in the same 7 months). 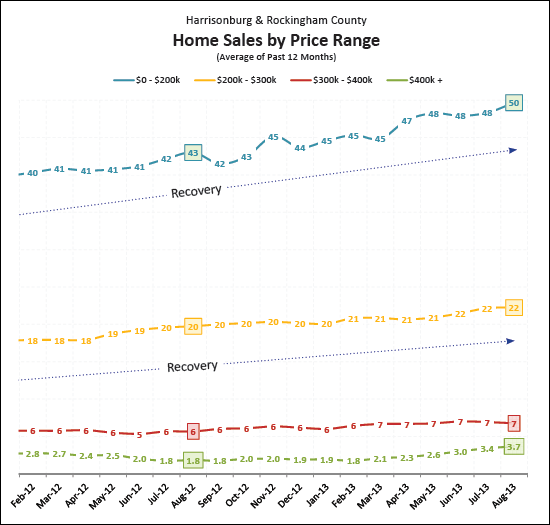 The recovery in our local housing market is not happening equally across all price ranges. The lowest two price ranges ($0 - $200K, $200K - $300K) are seeing the most sustained recovery. 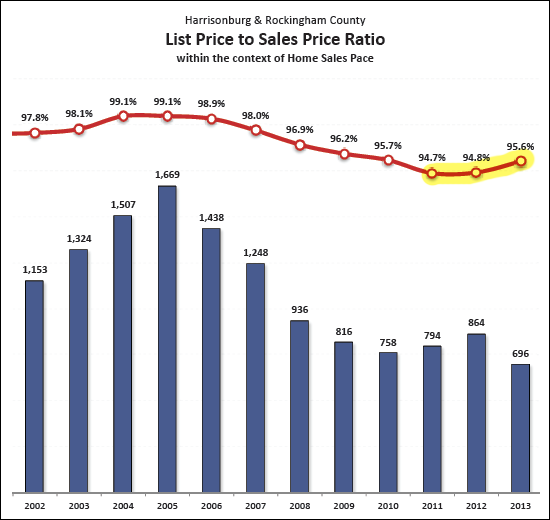 In yet another sign of recovery, the average list to sales price ratio is improving -- sellers (on average) are negotiating less off of their final list price. There is a LOT more the full report, so click here to download the full September 2013 Harrisonburg and Rockingham County Real Estate Market Report. And as always, if you're interested in talking to me about buying a home in Harrisonburg or Rockingham County.....or if you are interested in selling your current home.....just drop me a line by email (scott@HarrisonburgHousingToday.com) or call me at 540-578-0102. | |
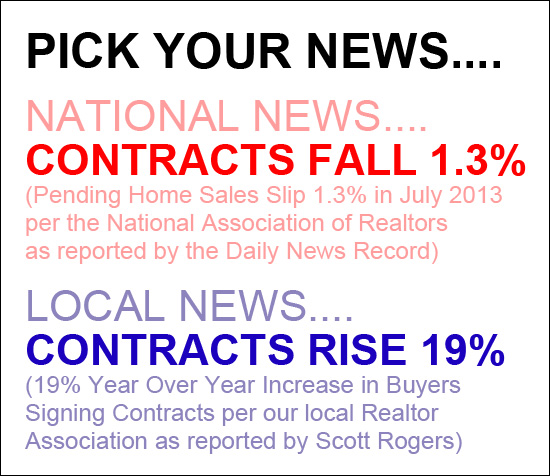
Which news do you prefer? |
|
Home prices less negotiable |
|
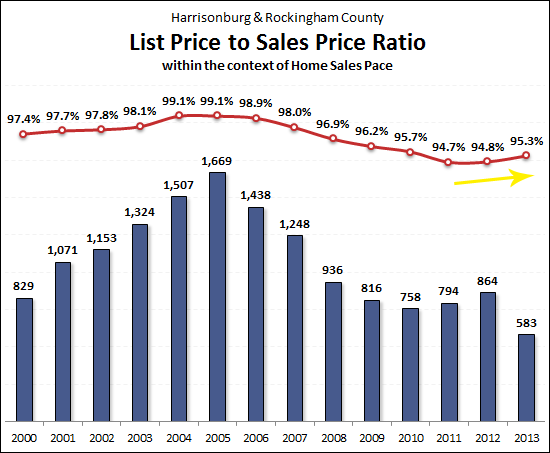 A few snippets buyers should be aware of....
| |
Million Dollar Homes in Harrisonburg, Rockingham County |
|
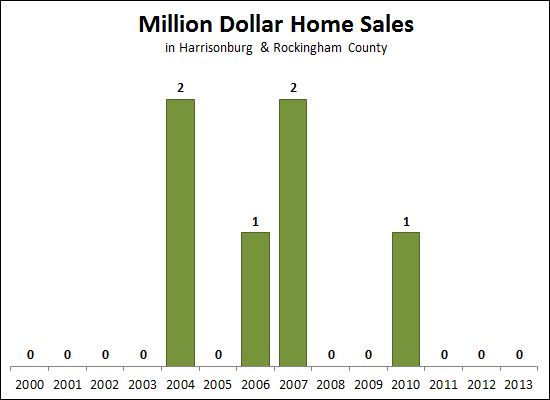 Not so often, it would seem, as shown above. There have only been six such sales in the past 12.5 years. View details of the six $1M+ sales. But even though it's been a few years since a buyer has paid more than $1M for a house in Harrisonburg or Rockingham County doesn't mean sellers aren't hopeful. View currently listed $1M+ homes for sale. Trying to keep your budget under $1M? Here are a few great options.... | |
[VIDEO] Overview of August 2013 Harrisonburg Real Estate Market Report |
|
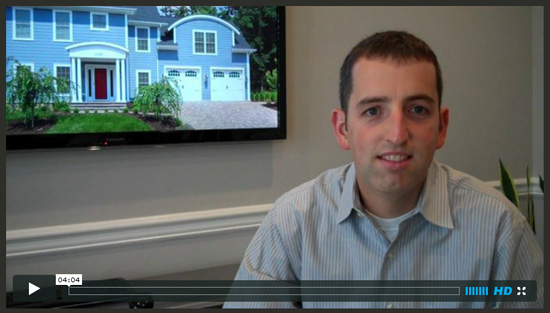 The video above (or click here) explores many of the trends we are seeing in our local housing market. Click here to watch the video OR click here to download the full August 2013 Harrisonburg and Rockingham County Real Estate Market Report. | |
Strong Home Sales (+21%), Improving Prices (+3%) in Harrisonburg, Rockingham County |
|
I have just released my August 2013 monthly market report covering the Harrisonburg and Rockingham County housing market. Click here to download the full report as a PDF, read on for some highlights, or click here to view more details on the cover home, 1032 James Place. 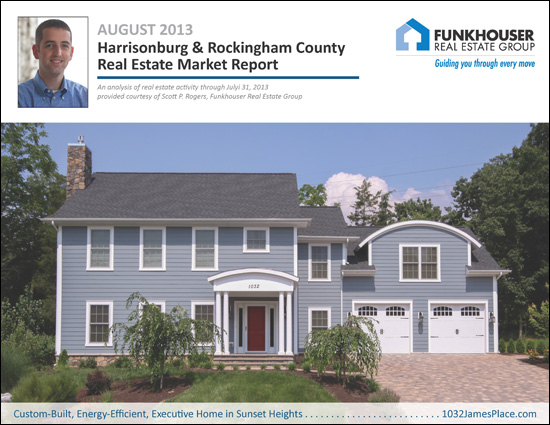 The big picture indicators in our local market are all positive when we look at January through July home sales in Harrisonburg and Rockingham County.... 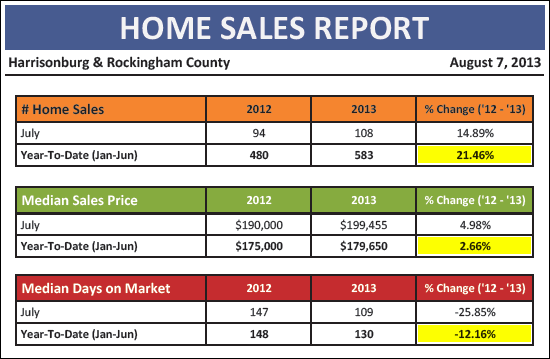 As shown above:
Assuming you are hoping for a strengthening local housing market, these are all great news for our local area. Below you can see the reason why the year-to-date home sales figures are so strong....
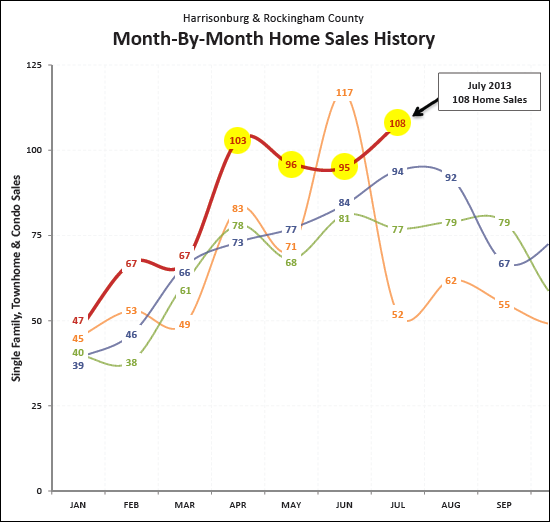
As you can see, above, the past four months of home sales (Apr, May, Jun, Jul) have been much stronger than any of the previous three years --- with the one exception of June 2010 when the federal home buyer tax credit expired. What, you might ask, should we expect for the next few months?
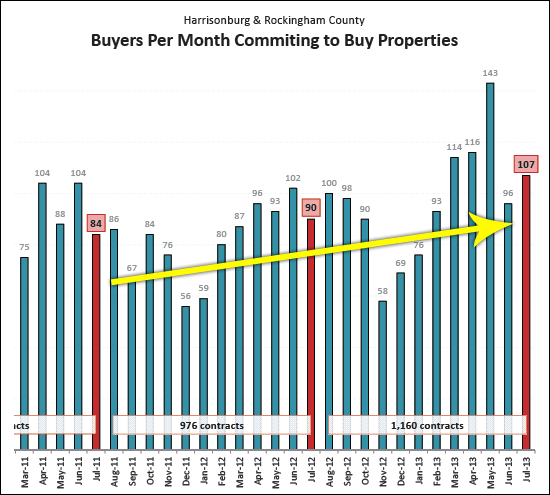
Based on the trend in signed contracts, shown above, I believe we will continue to see strong home sales over the next several months. It is also important to note that it's not just the short term indicators that are positive in our local housing market....
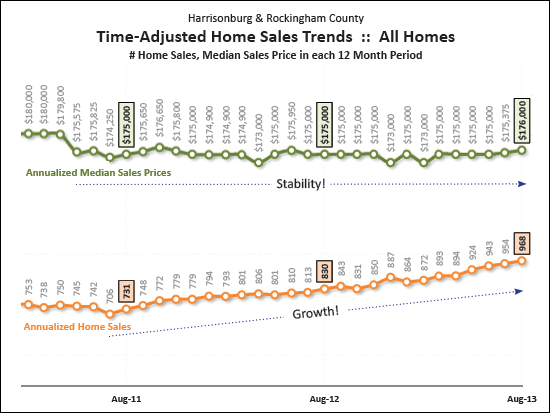
Each of the data points on the graph shown above takes 12 months of data into account --- thus these trends take a long time to show any substantial change, but they are excellent indicators of the overall shifts in a housing market. As can be seen, above, we are seeing steady growth in the pace of home sales, and stability in home values. There is a LOT more in my full report, including....
| |
Home Sales Price Distribution in Harrisonburg, Rockingham County |
|
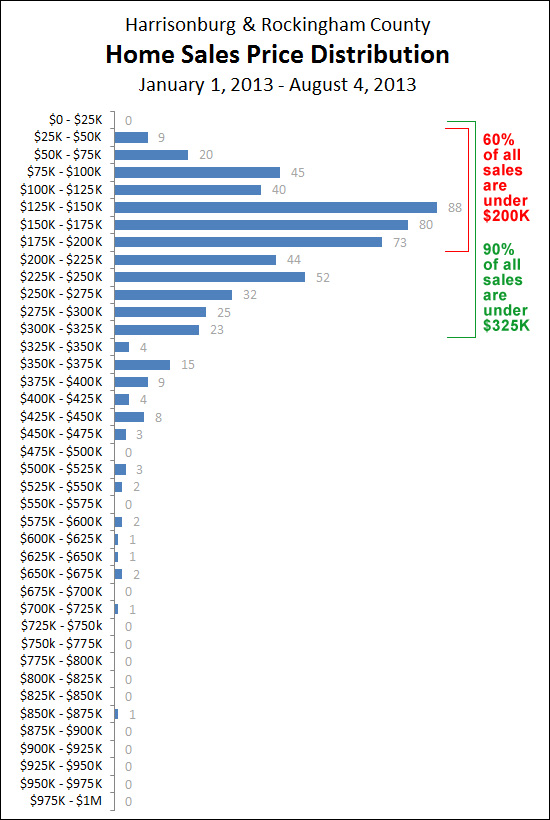 Thus far this year, 60% of all home sales have been under $200K......and 90% of all home sales have been under $325K in Harrisonburg and Rockingham County. | |
Are home prices up 12.2% in Harrisonburg and Rockingham County? |
|
 As you may have read about in the news, home values (nationally) are increasing.... USA TODAY: May home prices show 12.2% annual increaseSo, is that what we're seeing here in Harrisonburg and Rockingham County as well? As shown in the chart at the top, we have only seen a 0.2% annual increase in prices in Harrisonburg and Rockingham County. Review a full battery of local housing market trends here. | |
Priced Right, Marketed Well, It May Sell Quickly! |
|
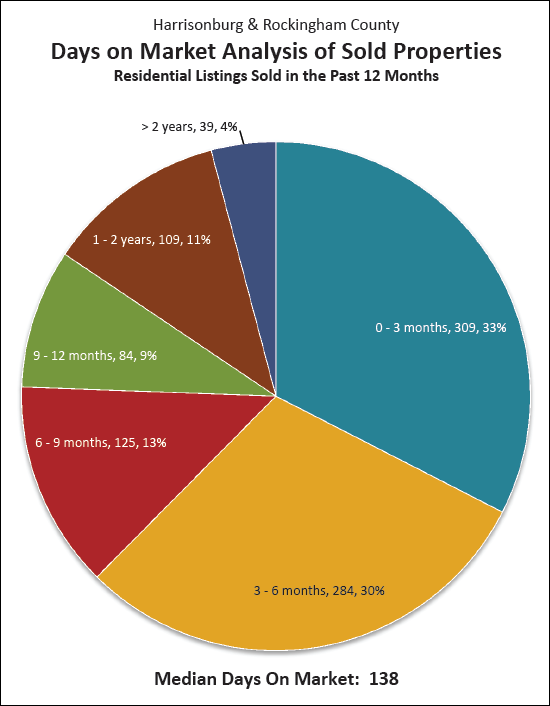 Above is a graph from my monthly market report that I haven't highlighted recently --- 1 in 3 houses that sold in the past year was on the market (list date to closing date) for less than 90 days. | |
Home Sales Up 22%, Foreclosures Down 26% |
|
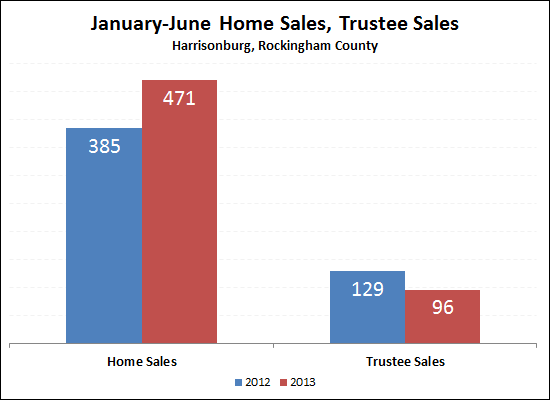 These are both great indicators for our local housing market --- home sales are up (22%) and foreclosures are down (26%) in the first six months of the year, as compared to the first six months of last year. | |
HarrisonburgTownhouses.com updated with 2013-Q2 sales data |
|
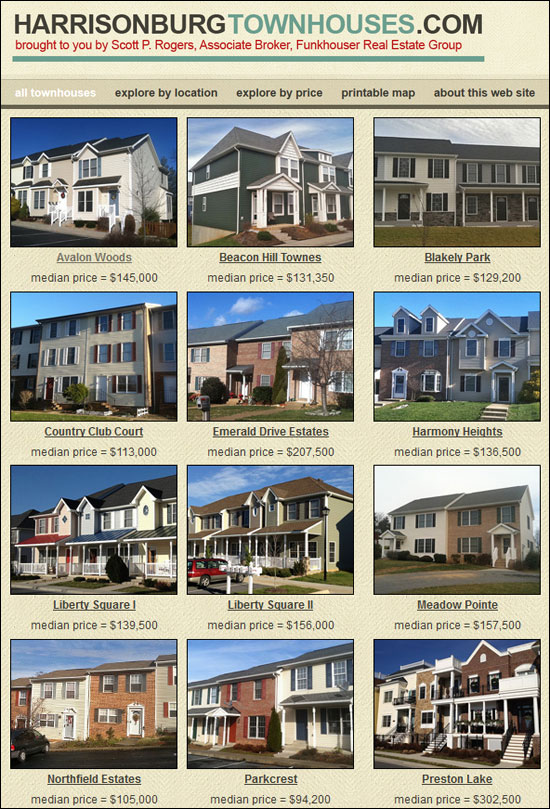 HarrisonburgTownhouses.com has been updated with sales data from 2013-Q2, and many townhouse communities are (finally) starting to see median prices increase again. So, are you wondering about property values in your townhouse community? Or considering purchasing an investment property? Whatever the reason for your interest in townhouses in Harrisonburg, you will likely find the information you need at HarrisonburgTownhouses.com, including (for each townhouse community):
The townhouse communities featured on HarrisonburgTownhouses.com include:
| |
Are rising interest rates slowing down buyer activity? |
|
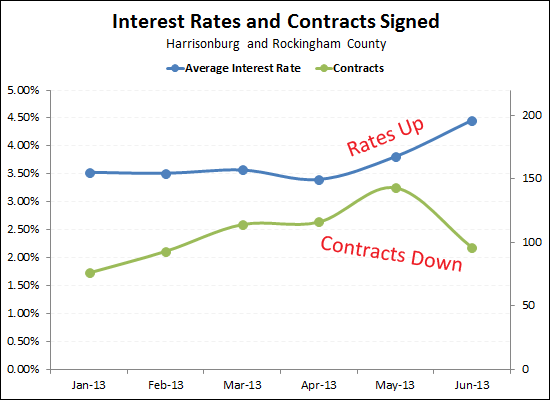 It seems quite possible --- see above. But remember folks, these are still ridiculously low interest rates from a historical perspective. | |
[VIDEO] Overview of July 2013 Real Estate Market Report |
|
Earlier this week I released my July 2013 report on our local housing market. The video above provides an overview of some of the main news surrounding this most recent report. Click here to view my video overview of the July 2013 housing market report. Click here to download the full market report (28 page PDF). Click here to read the report online. | |
Local Home Sales Up 22% Year To Date |
|
I have just released my July 2013 monthly market report covering the Harrisonburg and Rockingham County housing market. Click here to download the full report as a PDF, read on for some highlights, or click here to view more details on the cover home, 3100 Brookshire Drive. 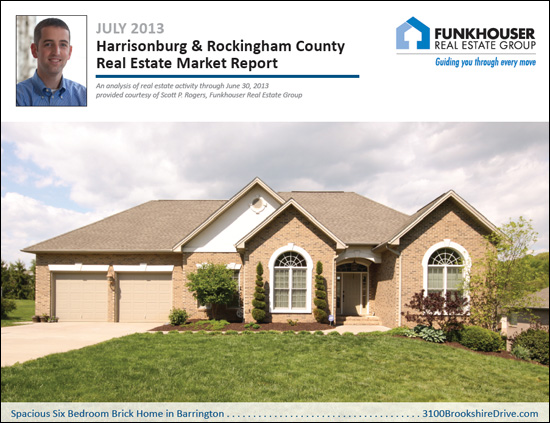 As can be seen below, we finally saw all three overall market trends head in a positive direction --- sales are up, median prices are up, and days on market are down! 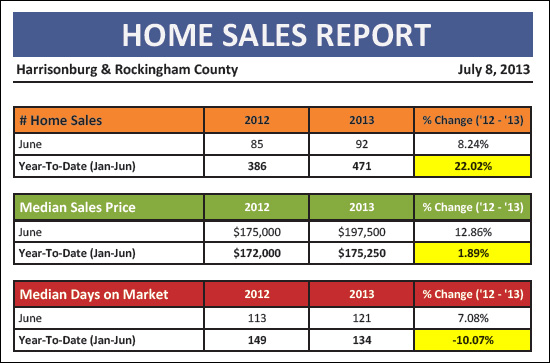 June marked another exciting month of home sales in Harrisonburg and Rockingham County. As shown below, this is the third month in a row where we have seen a significant increase in home sales over the same month last year. 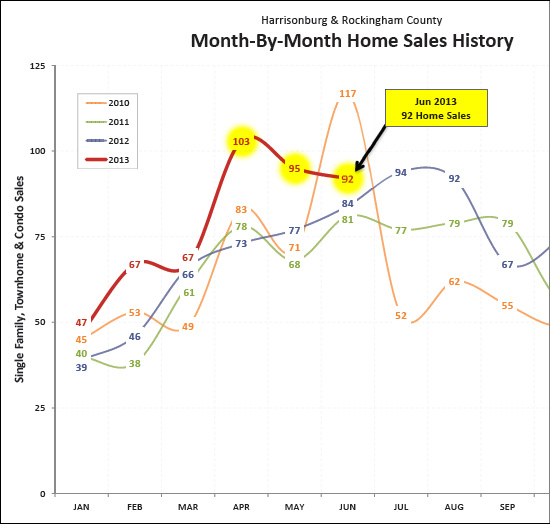 Interest rates are starting to creep up, even if they are still at historically low levels.... 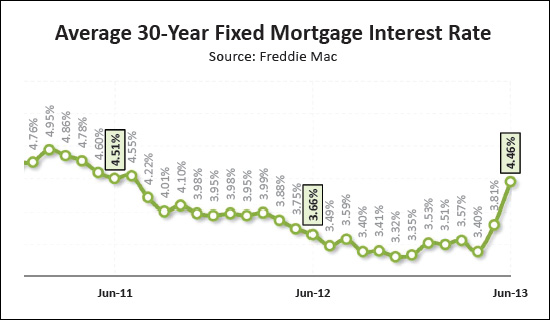 The rising interest rates may have cooled buyer activity a bit. After record setting months (April, May, June) buyer activity slowed in June. 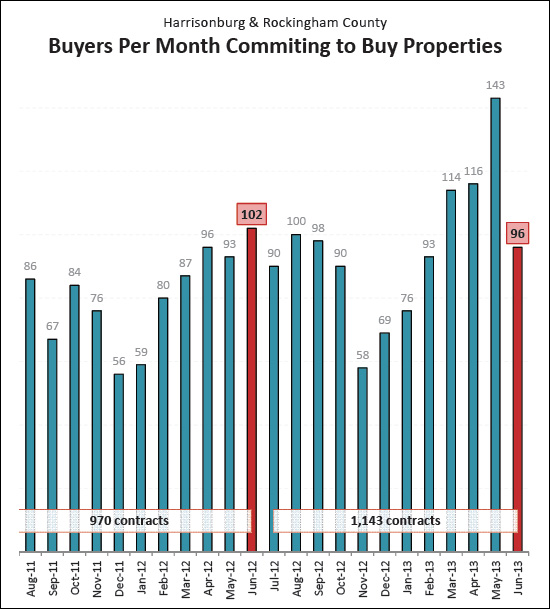 There is a LOT more in my full report, including....
| |
| Newer Posts | Older Posts |
Scott Rogers
Funkhouser Real
Estate Group
540-578-0102
scott@funkhousergroup.com
Licensed in the
Commonwealth of Virginia
Home Search
Housing Market Report
Harrisonburg Townhouses
Walk Through This Home
Investment Properties
Harrisonburg Foreclosures
Property Transfers
New Listings

