Analysis
| Newer Posts | Older Posts |
If At First You Do Not Sell, Reduce The Price! |
|
 Good News! Good News!
When considering all residential properties In Harrisonburg and Rockingham County:
To put this in a bit of a historical context, when I checked the same data nearly two years ago, 40% of homes for sale had experienced a price change. OF NOTE: Our MLS simply searches for price changes, therefor some of the 368 price changes could be price increases, though it seems doubtful. | |
The Buyers Rushed In, But Have Now Rushed Out (Or Have Been Pushed Out) |
|
Harrisonburg has steadily grown over the past ten years, and thus I would expect that we would see a gradual, steady increase of home purchases. The recent history of home sales has not followed the slow and steady theory for the last ten years. Below I have charted a gradually increasing rate of home sales (the red line) as I might expect them to be occurring. 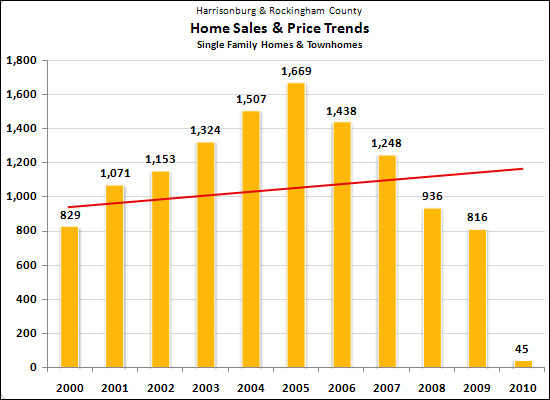 As you can see above, if there were approximately 900 home sales in 2000, I'd expect that we might be around 1100 home sales per year here in 2010. Let's examine why sales history strayed so far from this path.... 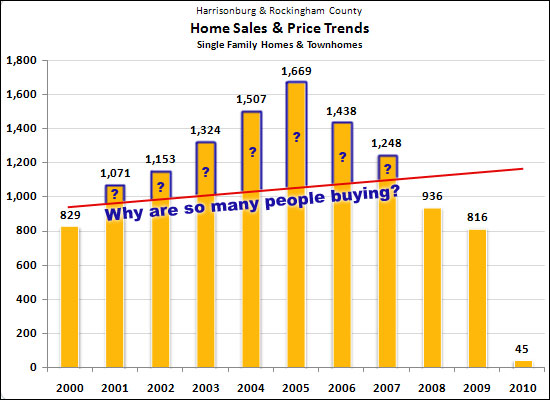 While I didn't think to ask this at the time, I now think it would have been reasonable to ask between 2001 and 2007 why there were so many people buying houses. The blue sections of the yellow bars show the unexpectedly high home sales levels (per my rough calculations). Here are my theories on why so many people were buying at that time:
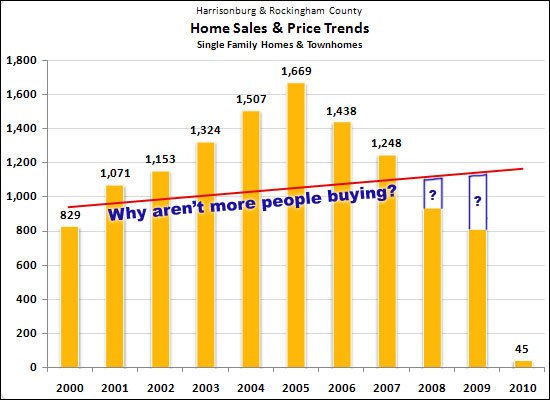 But now, as seen above, there are (if my red trend line is correct) fewer buyers in the market that could be or should be expected. If we flip around the three factors listed above, we'll understand why:
| |
Harrisonburg City Assessments Compared To Home Sales Prices |
||||||||||||||||||||||||||||||||||||||||||||||||||||||||||||||||||
The new 2010 real estate assessments are out and I thought it might be of interest to compare these new assessed values to the prices for which properties are actually selling. Below are the 12 properties in the City of Harrisonburg shown as sold in the HRAR MLS between January 1, 2010 and February 14, 2010.
As you can see, some properties sold above AND some sold below assessed value. On average, these 12 properties sold for 90% of assessment, and the median ratio was 87%. If we assume that assessed values are a VERY GOOD INDICATOR of market value, this analysis could mean that:
If I didn't walk in too many circles there, tell me what you think! | ||||||||||||||||||||||||||||||||||||||||||||||||||||||||||||||||||
So Far, So Good In January -- Lots Of Buyers Are Looking For Homes Online! |
|
With nearly 2 million page views on our company and agent web sites over the past year, we pay careful attention to trends in the number of people looking for properties for sale on our web sites. 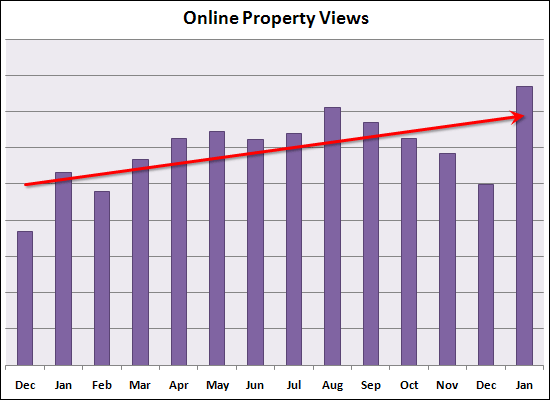 As you can see above, more properties were viewed in January 2010 than in any month over the past 13 months. February being a short month, we may see a slight dip this month, but this trend likely indicates that our real estate market is headed in a more positive direction! Join the crowd: Search for property now by clicking here! | |
Understanding The Sales Market Via The Rental Market |
|
 I was forwarded an article from CNN Money that offers an interesting perspective on understanding how home values may perform in the coming year(s).... "In normal times, people won't pay much less to lease a house than to own it. After all, if you're paying rent instead of a mortgage and taxes, you still get to enjoy the same rec room, chef's kitchen, and casita for visiting grandparents. So the surest sign of a frenzy appears when owning becomes far more expensive than renting. That's precisely what happened during the last bubble." This make sense to me. If it costs the same amount to buy as it does to rent, then someone would almost certainly buy instead of renting. "On average, DB [Deutsche Bank] found that families across America were spending about87% as much to rent as to own in 1999. Hence, they were traditionallywilling to pay a premium as homeowners, though not a big one." As one rough estimate, let's consider that new two-story Harrisonburg townhomes were selling for around $100k in 2000 (monthly cost of $720 with 100% financing at 6.75% fixed), and were leasing for around $725/month. Thus, per my rough estimates, the leasing and buying costs were quite similar. "But by mid-2006, with the craze in full swing, the figure fell below60%. At that point, Americans were spending an incredible 66% more toown than to rent." In 2006, these same townhomes were selling for $150k (monthly cost of $980 with 100% financing at 5.75% fixed), and were leasing for around $900/month. Thus, Harrisonburg also saw a shift in renting being much more affordable, but not nearly as significantly as in some areas. "So how did that happen? During the bubble, rents -- the real enginethat drives values -- were inching along at more or less their usualpace. From 1999 to 2007, apartment rents increased only 32%. But homeprices jumped more than three times as fast, around 105%." Per my numbers above, rents increased 24% in Harrisonburg (compared to 32% in the national study), and home prices jumped 50% (compared to 105% in the national study). "At the end of the third quarter of 2009, the overall number stood at83%, meaning renting was just a tad more attractive than owning." Interesting -- these townhomes are now selling at roughly $155k (monthly cost of $940 with 100% financing at 5% fixed), and are leasing for around $900/month. Still virtually equivant. "Given that analysis, it's likely that prices will fall another 5% or sonationwide. The drop could even be slightly greater. One reason: Rents,the force that govern housing prices, are still falling." Nationally, rental rates seem to be falling, though that is not largely the case in Harrisonburg. If prices had increased more drastically here, then prices would probably be falling more drastically here, and rental rates would also be falling more drastically. Yet again, the Harrisonburg and Rockingham County housing market seems to have performed, and be performing in a more healthy manner than much of the balance of the nation. | |
Get Ready: Lots Of Homes Will Be Coming On The Market Soon, Soon, Soon |
|
Or will they?? It's interesting, because most people assume that a LOT of sellers will be putting their homes on the market as we move into the spring and summer months. That is to some extent true --- look at the last two years of inventory levels (below) and you'll note that there are certainly more homes on the market between April and September than any other time of the year. 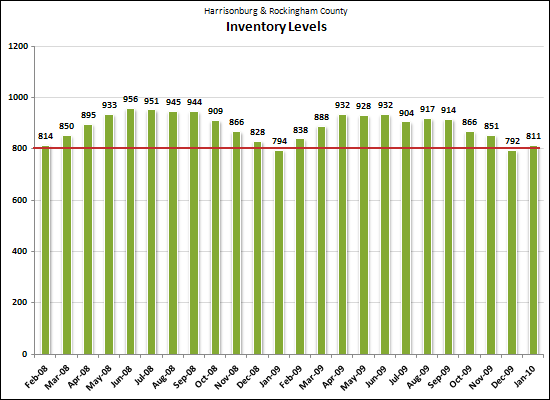 But wait --- the variation isn't actually very significant. The low inventory level has hovered around 800 for the past year, and the high around 940. While the spring/summer inventory levels are 17.5% higher than the fall/winter levels, here's how it translates into a buyer's perspective:
Furthermore, sellers ought not be overly concerned that they'll have dramatically more competition in the spring/summer months because of sky high inventory levels. | |
January 2010 Shows Positive Momentum In The Harrisonburg and Rockingham Real Estate Market |
|
Click here or on the image below to view the full February 2010 Harrisonburg & Rockingham County Real Estate Market Report (PDF). Read on below for a few highlights.  As can be seen below, January 2010 sales (45) topped January 2009 sales (38). Furthermore, each of the preceding three months (Oct '09, Nov '09 and Dec '09) showed equal or greater home sales than the same month in 2008. Could it be that the pace of our local real estate market is finally picking up again? 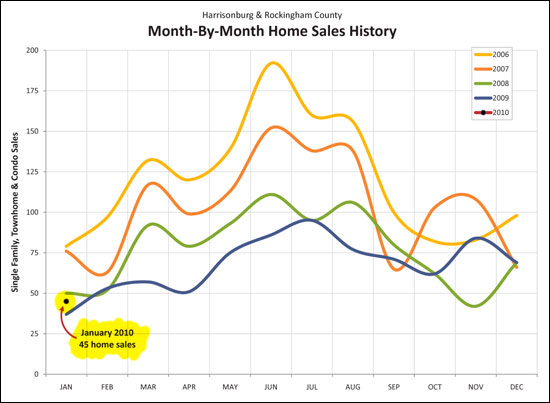 As a further indicator, the graph below shows a running 12 months of home sales since 2004. The most recent data point shows Feb '09 through Jan '10, the data point prior shows Jan '09 through Dec '09, etc. Each data point includes every month of the year, allowing for a normalized look at the activity in our local housing market. As can be seen, this metric has been falling since 2006, but over the past several months seems to have stabilized and started to increase again. 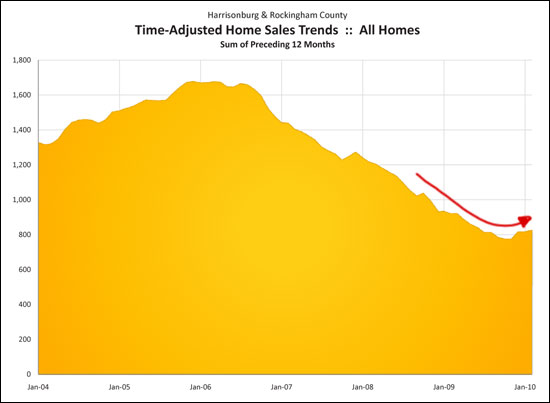 Read more about our local housing market by downloading the full February 2010 Harrisonburg & Rockingham County Real Estate Market Report (PDF). If you find the information in this report to be helpful....
| |
Our Local Real Estate Market vs. All Of Virginia |
|
A few days ago I compared the Harrisonburg and Rockingham County real estate market to our neighbors north, south and east of us. Now, let's see how we stack up to the state as a whole. The following data comes from the Virginia Association of Realtors 2009 year end market report. 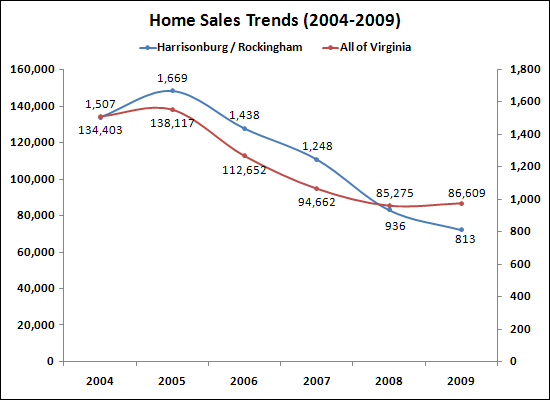 As you can see above, home sales in Virginia (overall), have started picking back up again --- with a 2% increase between 2008 and 2009. Harrisonburg and Rockingham County witnessed another 13% drop in the number of home sales between 2008 and 2009. 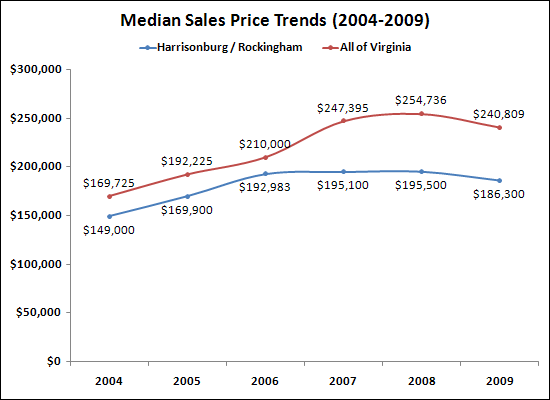 This graph is rather interesting -- Virginia and Harrisonburg and Rockingham County both witnessed roughly a 5% decline between 2008 and 2009. Harrisonburg and Rockingham County, however, have seen rather level prices for the past several years while the Virginia median price has actually had a decent increase during that time frame. | |
2000-2009: Population Up, Home Sales Down |
|
Over at hburgnews I noticed a link to a new study from the Weldon Cooper Center indicating that the Harrisonburg / Rockingham County MSA has grown roughly 13% between 2000 and 2009. [ read more at hburgnews ] Knowing that home sales have decreased during the same time period, I thought I'd see how the two data sets lined up. First, though, please note that:
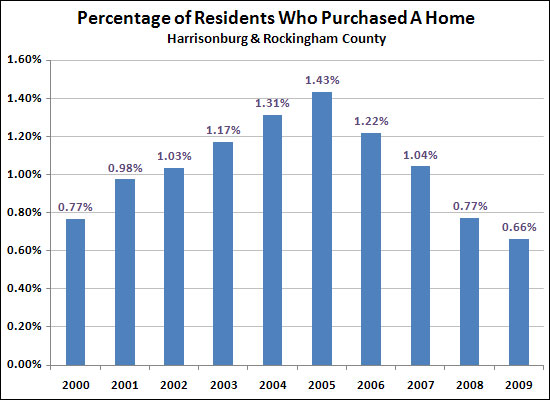 This graph shows something (somewhat) similar --- a higher percentage (1.43%) of our population bought a home in 2005 than the percentage in 2000 (0.77%) and 2009 (0.66%). As I ponder this data, I wonder what will be "normal" over the next 20 years as to what percentage of our population will buy a home in any given year. Is 0.77% the magic number (shown in 2000 and 2008)? If so, home sales were depressed in 2009 (how surprising). Or perhaps we should expect about 1% of our population to buy a home each year. The most pressing question in my mind is when we will start to see an increase again in home sales --- both as a raw number, and as a percentage of the population. I thought we'd see in 2008 (we did not). I thought we'd see it in 2009 (we did not). I think the third time might be the charm, and we'll see home sales (quantity, not sales prices) increase in 2010. What do you think? Also, another interesting way to look at the data above is as follows:
| |
Is the Harrisonburg and Rockingham County Real Estate Market Keeping Up With The Joneses? |
|
First, let's take a look at how we compared to our neighboring markets as to the number of home sales this past year (2009) compared to the prior year (2008). 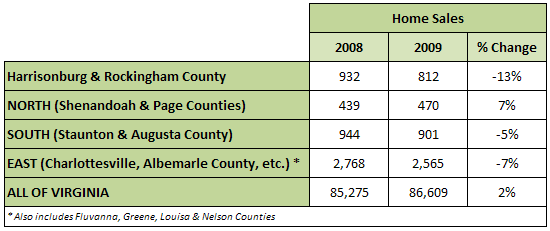 As you can see, the sum total of Virginia showed a 2% increase in the number of home sales. In comparison, Harrisonburg and Rockingham County aren't doing so well --- with a 13% decline in home sales. In fact, the markets north, south and east of our market have all shown a stronger performance as measured by the number of home sales. But what about home values, or median sales prices, you might ask . . . . 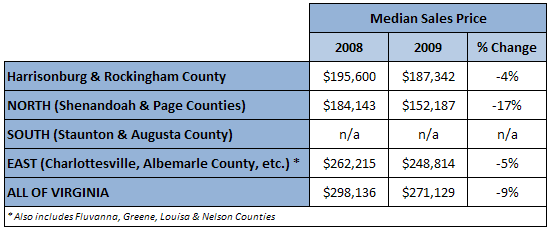 This is the area where Harrisonburg and Rockingham County has done well --- hmmmmm --- or at least we haven't done as poorly as our neighboring markets, and the state as a whole. Our market saw a 4% decline in median sales price, in comparison to 9% for the state as a whole, a whopping 17% decline north of our market, and a 5% decline to the east. This data is consistent with what I have been observing for the past several years --- home values are holding steadier in our market than in most areas, but home sales have been quite slow as a result. Now, what shall we predict for 2010 and 2011?? | |
Federal Tax Credit Boosts Home Sales (Daily News Record) |
|
The Daily News Record's take on our local housing market . . . . Federal Tax Credit Boosts Home Sales (Jan 30, 2010) Harrisonburg And Rockingham See Overall Buying Decline For The Year  By Jeff Mellott By Jeff MellottHARRISONBURG - The looming expiration of a federal tax credit for first-time homebuyers in November is being credited for a doubling of Harrisonburg and Rockingham County home sales when compared to November 2008. But while the news was good for those looking to sell before the original Nov. 30 deadline for buyers to qualify for an $8,000 tax credit, December was a return to more typical winter sales. In the city and county, home sales increased from 42 in November 2008 to 83 in November 2009, according to the Virginia Association of Realtors. But the numbers dropped into the mid-60s for December. The association also is crediting the buying incentive for boosting sales by 5.4 percent for the year in the Shenandoah Valley in 2009. The Valley reporting region comprises Frederick, Clarke, Warren, Page, Shenandoah and Rockingham counties and the cities of Winchester and Harrisonburg. The tax credit, which Congress has since extended, led to November being the third-highest sales month of 2009 for Harrisonburg and Rockingham County, said Scott Rogers, associate broker for Coldwell Banker Funkhouser Realtors of Harrisonburg. Typically, November is a slow month for home sales, Rogers said. Along with the tax credit, he said, some buyers have been encouraged about the overall home-buying climate because the amount of bad economic news has seemingly diminished. Decline While the number of sales received a boost for November, the increase was not enough to change an overall decline in sales and median prices for the city and county in 2009, according to Rogers, who also operates the Web site HarrisonburgHousingtoday.com. Rogers' analysis of the city and county real estate market showed the sale of 561 single-family homes in 2009, which was a 14 percent decline when compared to 654 homes in 2008. The median sales price of a home declined from $215,000 in 2008 to $204,900, for a nearly 5 percent drop. The latest figures were significantly below 2004 and 2005, when the number of single-family homes sold hovered at 1,025 before dropping off to 909 in 2006, according to the Web site. The median sales price of a single-family home jumped from $170,000 in 2004 to $210,000 in 2005, for a 24 percent increase, according to the Web site. Townhomes Many of the first-time homebuyers in November who took advantage of the federal tax credit bought relatively less expensive townhouses in Harrisonburg, Rogers said. Still, the overall sales and price of townhomes declined from 2008 to 2009, according to Rogers. The 282 townhomes sold in 2008 dropped to 252 in 2009. The median sales price went down from $167,250 to $161,888 last year. The numbers contrast sharply with 2005, the peak sales year of the decade. That year, 644 townhomes were sold but the median price was $134,950. Statewide, fourth-quarter home sales for 2009 increased by 18 percent from 2008, according to an association statement Monday. "There's no question that [the number of] first-time homebuyers had a significant increase," said Lisa Noon, Virginia Association of Realtors vice president Lisa Noon. The tax credit deadline has been extended to the end of June, Rogers said. To qualify, a homebuyer must have a home under contract by the end of April and close by the end of June, he said. Nationally, the Commerce Department reported Wednesday that sales of new homes fell unexpectedly in December. According to The Associated Press, last month's results were the weakest since March and were only 4 percent above the bottom last January. Many in the industry, however, expect sales to pick up as the April 30 deadline for the federal tax credit nears. Contact Jeff Mellott at 574-6290 or jmellott@dnronline.com | |
What Percentage Of Under Contract Homes Actually Sell? |
|
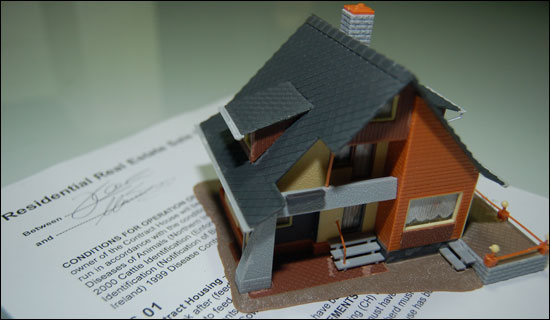 This was an interesting question from one of my clients --- relative to whether we should take the time to go look at a property that is currently under contract. Their perspective was that if quite a few contracts fall through, it could be worthwhile to go look at an under contract property -- but if most stay together, then maybe not. As it turns out, most homes stay under contract if they go under contract. In 2009, 818 homes went under contract. Only 77 homes came back from being under contract. 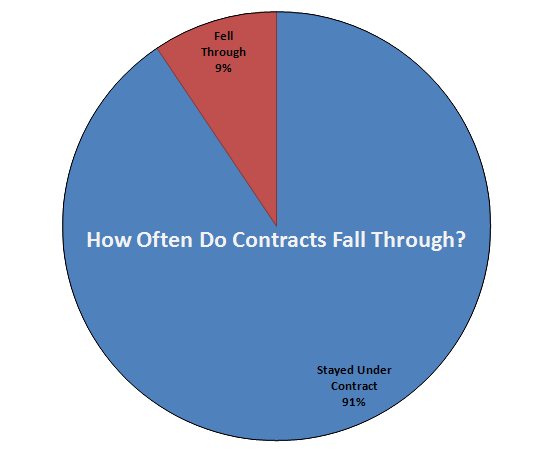 This contract success rate is a bit lower than past years, but much better than 2006!
| |
Looking For A Dutch Colonial In Rockingham County? |
|
Good Luck! There are only two listings on the market right now labeled as Dutch Colonial homes. Let's take a look at what IS for sale . . . . 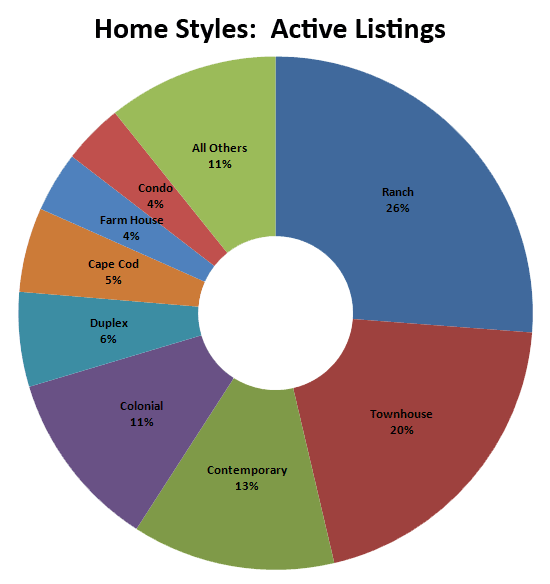 As you can see, ranches, townhomes, contemporary homes and colonial homes are your best (or at least most prolific) option in Harrisonburg and Rockingham County. Also of note, here's what sold in 2009 . . . . 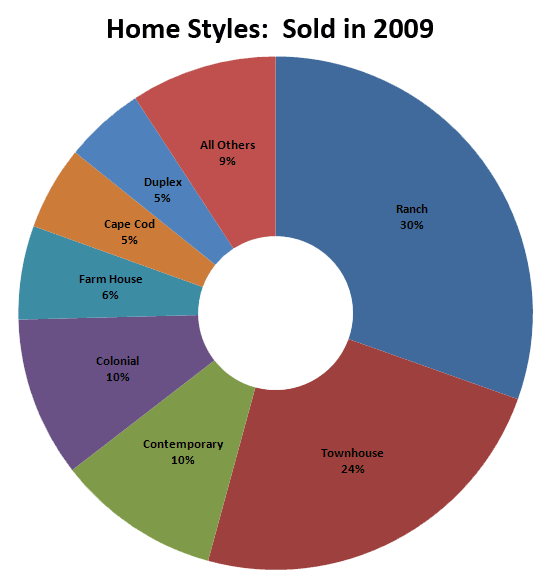 We find the same leaders -- ranches, townhomes, contemporary homes and colonials. Thus, we have a bit of a chicken/egg dilemma. Are these types of homes being sold because that's what people want, or because that's what is available. Here are the full numbers for those who are curious . . . . 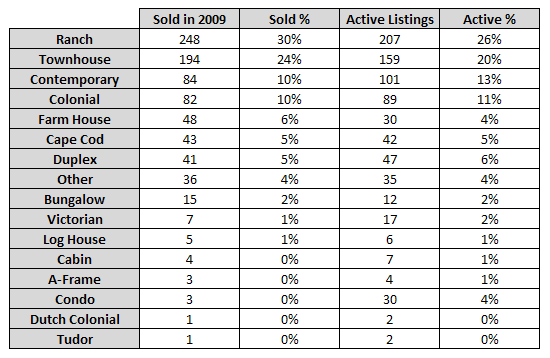 . . | |
Starter Home Buyers Increase, High End Home Buyers Decrease . . . And Prices Remain Constant?? |
|
Jennifer Chapman, one of my associates at Coldwell Banker Funkhouser Realtors brought some very interesting data to light yesterday. She noticed that there are fewer and fewer homes selling over $300k. I thought I'd take a look . . . . First, bear in mind that the median sales price has gone largely unchanged between 2006 and 2009, showing only a 3.5% decrease. (full market report) This would suggest (in some ways) that we've probably seen a roughly equivalent number of inexpensive and expensive homes selling over the past several years. This actually does not turn out to be true . . . . 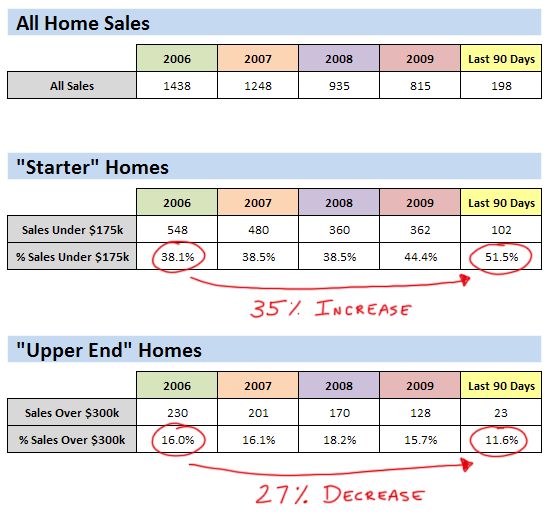 I can make plenty of guesses as to why we're seeing these shifts, including:
| |
2009 Real Estate Round Up: City vs. County, SFH vs. TH |
|
Earlier this week I published my monthly market report on the Harrisonburg and Rockingham County real estate market. While my report does examine how single family homes performed compared to townhomes, it doesn't examine how City properties compared to County properties. Let's take a look at how each category performed in 2009, as compared to 2008. 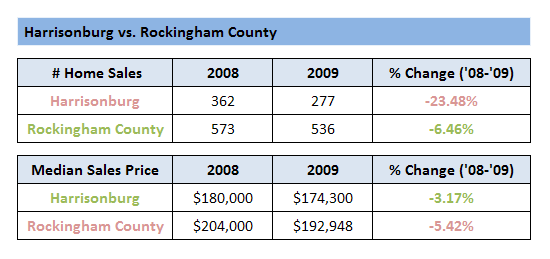 Interestingly, there was a much more significant drop off in the number of City properties (23% decline) as compared to County properties (6% decline). Yet, while fewer City properties sold, they seem to have (marginally) maintained their value better than those in the County. The median sales price of City properties declined by 3%, while those in the County declined by 5%. 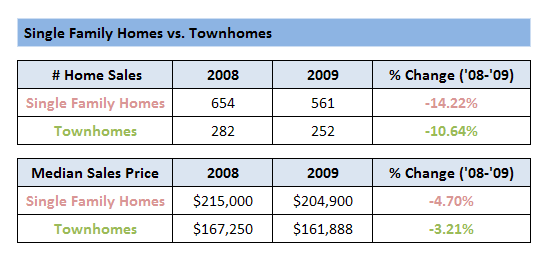 Above you will notice that townhomes outperformed single family homes in both measures I've calculated. There was a more significant drop off in single family homes (14%) as compared to townhomes (11%), and there was a more significant decline in single family home median sales prices (5%) than townhome median sales prices (3%). The conclusion here? City townhomes seem to be the general victor here, with County single family homes suffering the most. Interested in a different cut of the data? E-mail (scott@HarrisonburgHousingToday.com) or call me (540-578-0102) and I'll put it together for you! | |
January 2010 Harrisonburg and Rockingham County Real Estate Market Report: Prices Edge Down Slightly, Declines in Sales Pace Gently Slow |
|
Home sales finished out at a respectable level in 2009, showing only a 13% decline from 2008 as compared to the 25% decline in sales pace seen between 2007 and 2008. The area's median price, however, slipped 5% -- the first decline in full year median values that we've seen in this troubled market. 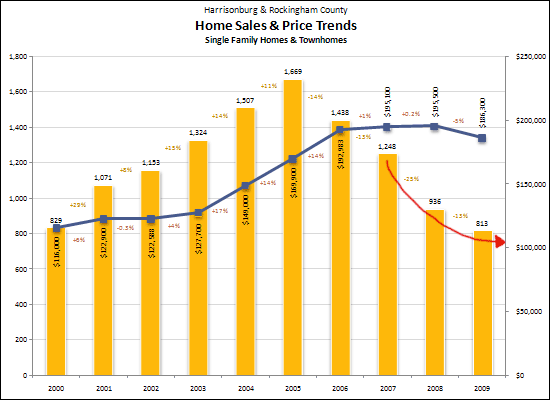 This past month's sales (67 in December) can't be used to predict too much in our market, because December sales were at roughly the same levels in 2007 and 2008 --- with significantly different months and years following those similar December values. That being said, five of twelve months in 2009 showed home sales at, above, or very close to the corresponding month in 2008. This may be an indication that the declining pace of home sales seen since 2005 may finally be slowing. 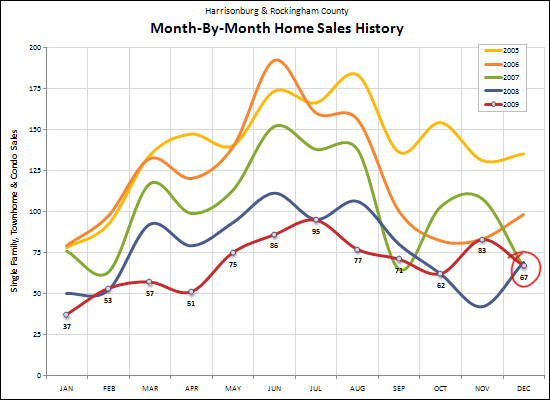 The local year over year housing inventory has declined slightly, from 828 homes at the end of last December, to 792 homes for sale at the end of this December. That small decline, however, is still not enough of a decline to help the significant oversupply of homes for sale we have been experiencing for over a year. 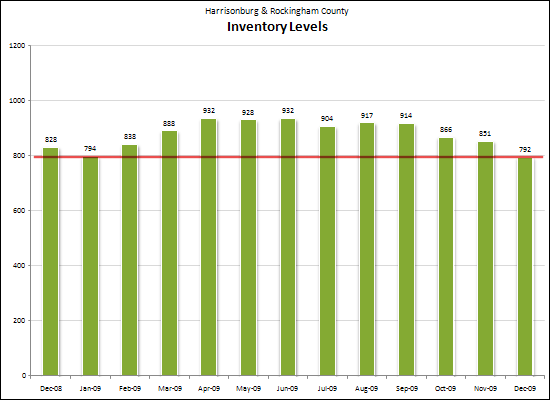 Read on, and dive into the details by reading the entire January 2010 Harrisonburg and Rockingham County Real Estate Market Report. Click the image below to download the PDF.  If you find the information in this report to be helpful....
| |
What Type Of Housing Is Being Built In Harrisonburg And Rockingham County |
|
 One way to take a look at what is being built in and around Harrisonburg is by examining the Harrisonburg / Rockingham MLS to analyze listings circa 2009+. First, or note, a full 14% of listings currently for sale in Harrisonburg and Rockingham County appear to be new construction. (113 homes out of 793 homes). Here's a big picture summary of these new homes for sale in our market:
Also . . . enjoy the first edition of Harrisonburg Real Estate Radio: Home Inspections via Harrisonburg Real Estate Radio [08:38] | |
Selling For A Profit All Depends On When You Bought! |
|
Thankfully, the value of homes in Harrisonburg and Rockingham County hasn't taken a nose dive like has happened in many other markets. As you can see below, modest (normal?) growth in values occurred between 2000 and 2003, unbelievable (and unsustainable) growth in values occurred between 2003 and 2006, and prices became stagnant between 2006 and 2009. 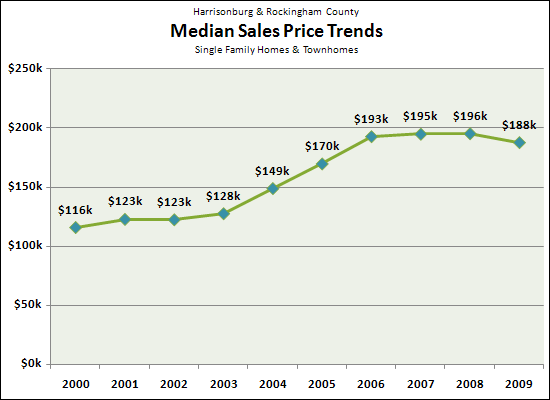 That being said, since we haven't seen consistent growth in home values since 2006, there are some homeowners who are unable to sell their house (after costs) for as much as they bought it. Conventional wisdom pre-2003 said that you should only buy a house if you knew you'd be living in it for 5 or more years. You see, with the principal balance of the mortgage declining SO SLOWLY at the start of a 30-year mortgage, it would take a full five years to have paid down the mortgage enough to cover the costs of selling. As you might imagine from the graph above (or from talking to your friends), some people bought in 2003, 2004 or 2005, and then sold a year later at a tidy profit. The market was going up so quickly that they could sell one year later with no financial detriment because of the high rate of appreciation. Let's take a look at how our market has performed over the past decade by imagining that someone has to sell three years after they buy. 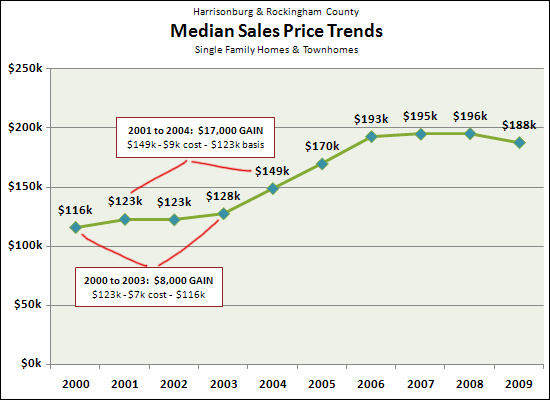 As per the chart above, a homeowner buying 2000 or 2001 would have been experienced a good sized gain. 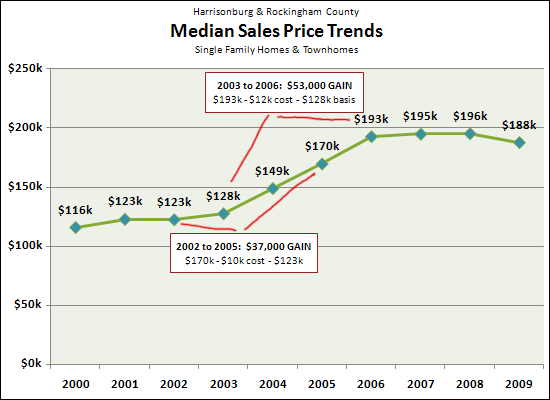 The gain is starting to be more and more unbelievable at this point. Buying in 2003 and selling in 2006 would have resulted in a whopping $53,000 gain, or roughly $18,000 per year. 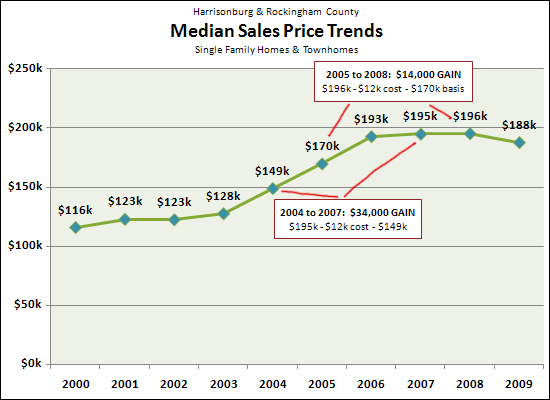 While things are starting to slow down, we see here that someone could have bought as late as 2005 and been just fine, given that there was such a big jump in median home values between 2005 and 2006. 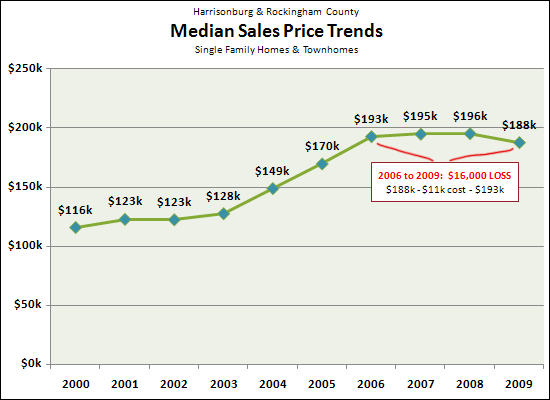 OOPS! Wait a minute! A $16,000 loss?? It's true --- if you bought in 2006 or anytime thereafter, and you want to sell your house, you'll need to prepare to do so at a loss, given the costs of selling. The big question: When will the median sales price start to stabilize? When the supply of homes for sale starts decreasing more rapidly than it has, I believe we'll start to see the median price inch upwards again --- though not at the pace it did between 2003 and 2006! | |
Pondering The Future Of The Harrisonburg and Rockingham County Real Estate Market |
|
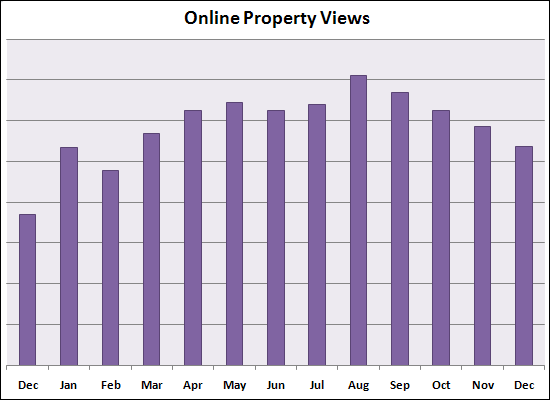 Over the last few days I have had quite a few discussions with developers, builders, buyers, sellers, and other Realtors regarding the exciting change of pace our local real estate market experienced in November 2009. To remind you of this astonishing news:
All of these are wonderful indicators, and we find yet another one at the top of this post, showing that while online property views (defined below) have been declining over the past few months, they are much higher than could be expected. In fact, there were more properties viewed online in November 2009 than in March 2009. Wow! We would typically expect that most buyers would be looking at properties online (and in person) at the start of the spring "buying season" -- but the graph above shows that there are still LOTS of buyers looking (at least online) at properties for sale. Online property views is the sum of all property views on the Coldwell Banker Funkhouser Realtors network of web sites, including our company web site, and all agent web sites. | |
The Most Frequently Used Driveway Materials in Harrisonburg and Rockingham County |
|
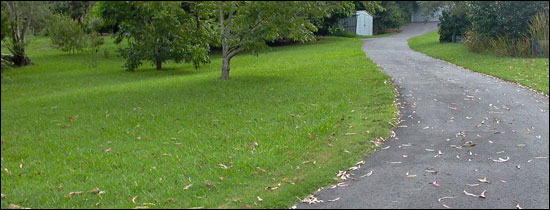 If you're building a home, what should you use as a driveway material? There are a lot of options!
Let's take a look at the most common types of driveways in Harrisonburg and Rockingham County. The data source for this analysis is the Harrisonburg/Rockingham Association of Realtors MLS, so it's an inexact analysis, but can still provide some helpful insights. 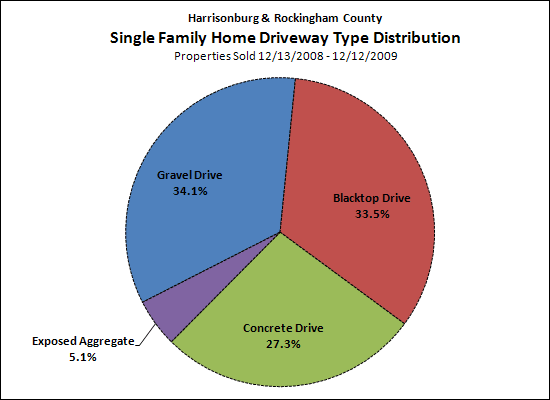 The chart above shows that the most common driveway material for single family homes in Harrisonburg and Rockingham County is gravel! Beyond gravel drives, which are likely found mostly in the County, the most frequently occurring driveway is an asphalt driveway. Let's take a closer look at driveways of single family homes in the City of Harrisonburg, to exclude the more "rustic" driveways found on homes further out in the County . . . 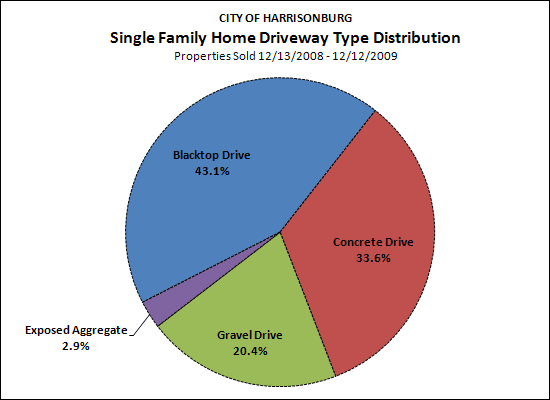 In the City of Harrisonburg, a full 1 in 5 driveways is still gravel, though asphalt driveways now lead the pack, with a full 10% greater market share than concrete driveways. 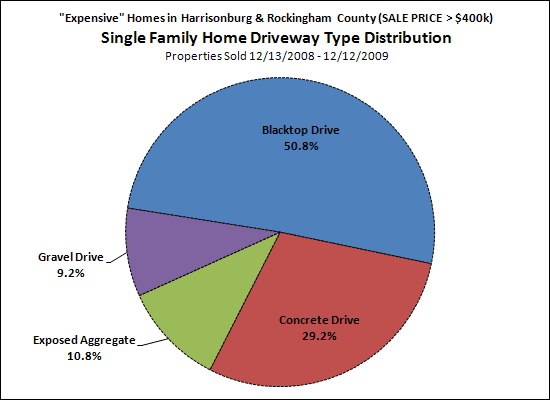 The graph above analyzes "expensive" homes --- those sold above $350k in the last year in Harrisonburg and Rockingham County. Here we find an even more overwhelming share of asphalt driveways, though we also see an increase in the percentage of exposed aggregate driveways. 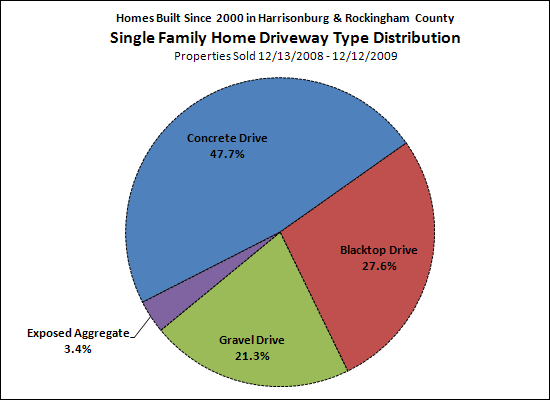 Perhaps most interesting is that when examining homes sold since Jan 1 2000, we find that most have had concrete driveways. Is this perhaps the sign of a growing trend in our area, or the nation as a whole? Notes: In the last year, 570 single family homes sold in Harrisonburg and Rockingham County (per the HRAR MLS), and the analysis above is based on the 534 sales where driveway data was present and usable. | |
| Newer Posts | Older Posts |
Scott Rogers
Funkhouser Real
Estate Group
540-578-0102
scott@funkhousergroup.com
Licensed in the
Commonwealth of Virginia
Home Search
Housing Market Report
Harrisonburg Townhouses
Walk Through This Home
Investment Properties
Harrisonburg Foreclosures
Property Transfers
New Listings


