
Analysis
| Newer Posts | Older Posts |
Are We Turning The Corner Towards More Positive Times? |
|
Take a look at home sales activity summarized by Quarter . . .  As you may notice, we've seen a steady decline in the number of residential sales in Harrisonburg and Rockingham County since 2005 . . . until the fourth quarter of 2009. Look again . . .  Please note, first, that the final fourth quarter 2009 sales figure is extrapolated based on data available as of November 30, 2009. So, my data could be wrong --- but I recently made some wild guesses about November 2009 sales (first I guessed 65, then I guessed 76) and they were both too low (the final figure was 82)! If we do see an year to year increase when comparing 2008-Q4 versus 2009-Q4, I think we can get excited about 2010 being the year when home sales finally started increasing again in Harrisonburg and Rockingham County. That being said, I will still allow for skeptics to blame it on the tax credit, or for other factors in the current market. Any skeptics out there? | |
Harrisonburg & Rockingham County Home Sales Soar in November 2009! |
|
Take a look at this graph and see if you notice anything . . .  I notice a few things that are quite exciting: November 2009 home sales were 95% higher than a year ago (November 2008). Furthermore, there was a 30% increase between October 2009 and November 2009, when most other years there has been a decrease between October and November. November 2009 outperformed every other month of 2009 except for June and July. November is typically a very slow month for home sales, but this year buyers came out in droves! Read on for more good, bad, and neutral news . . .  Click here to download the PDF. If you find the information in this report to be helpful....
| |
Re-visiting 2006 Real Estate Predictions for Harrisonburg and Rockingham County |
|
Much has changed in our local real estate market over the past threeyears, and yet, much has not changed at all. Let's examine today'smarket from the context of just three years ago. Back in November2006, my column in the Shenandoah Valley Business Journal includedthese excerpts: November 2006:"Today, many areas of the Shenandoah Valley are experiencing a buyer'smarket, which provides an excellent environment in which to buy a home
Today's buyers have the opportunity to aggressively negotiate on theirdream home." In today's market we find that nearly everyarea of the Shenandoah Valley, in every price range, is experiencing abuyer's market. The supply of homes far exceeds the demand, providingbuyers with plenty of choices and negotiating ability when purchasing ahome. November 2006: "The average 30-year fixed mortgage rate is currently 6.4%, more than an entire percentage point below 2000 levels." Today'srates are as low as 4.75%, with most buyer's rates hovering around 5%depending on their loan program and credit scores. It is indeedremarkable that the low interest rates from just three years ago arenow more than 1.5% lower today. November 2006: "With houses staying on the market longer, buyers have more choices than ever." Inmost cases, houses are now staying on the market even longer than theywere three years ago, providing even more choices for buyers. Thissupply has not yet shown signs of declining, though the sales pace maybe solidifying after several years of declining numbers of home sales. November 2006: "Today's buyers have the opportunity to obtain unprecedented assistance in buying their home." Thisstatement was in the context of sellers being willing to pay closingcosts, or to offer other incentives. There certainly wouldn't havebeen too many people, three years ago, who would have imagined that thefederal government would be offering an $8,000 tax credit to first timebuyers, and a $6,500 tax credit to long term owners of principalresidences. This statement from the past is true yet again, but in anew context buyers have yet more unprecedented assistance in today'smarket! November 2006:"With so many benefits to homeownership, plus the advantages offered bypresent market conditions, anyone who was considering buying in thenext one to two years should consider doing so now. The future islikely to offer higher prices, higher interest rates, fewer choices andfewer buyer incentives." Three years later, we aren't yetseeing higher prices, or higher interest rates, or fewer choices, orfewer buyer incentives. Thus, there are still great opportunities forbuyers in today's local real estate market --- but with one significantcaveat. Over the past three years, prices haven't fallen, which iswonderful, but they also haven't increased. Today's buyers, therefore,should only consider a purchase if they will stay in their home forthree or more (or five or more) years. The days of recent past when abuyer could sell a year later for a profit are certainly no longer areality. As always, in real estate, context is of utmost importance. Over the past three years, median home prices in Harrisonburg andRockingham have fallen by 1.5%. In a vacuum, this isn't overlyexciting or depressing. Consider that most other areas in the countryhave seen value declines of 20% in the same time period, and it's a bitmore exciting. Consider that our local home values increased by 51% inthe preceding three years (2003-2006), and it's even more exciting! | |
Reasonable Goals For Buying An Investment Property In Harrisonburg |
|
Every investor (or potential investor) comes to the table with different expectations for an investment property that they may choose to purchase. A few examples of this broad spectrum include: Having One's Cake And Eating It Too!
Put more specifically in today's context, most rental properties that an investor could purchase in Harrisonburg today will offer (how exciting!) negative cash flow --- even given a 20% down payment, self-management and self-maintenance. This leads me to two questions every potential investor should be asking.... 1. Should I be investing in real estate in Harrisonburg? If you are seriously considering investing in real estate, Harrisonburg is a great place to buy. While there are still some who believe our home values will eventually, somehow, start falling rapidly, we have seen relatively stable home values over the past several years despite the majority of the country seeing sharp declines. This is likely attributable to our low unemployment, a diverse economy, multiple local colleges/universities, and our proximity to D.C. --- all of which are great economic stabilizers that benefit real estate investors in this area. 2. What should I be buying as an investment property in Harrisonburg? And how should I be buying it? First, you'll need to be patient. As stated above, most properties currently for sale won't be very exciting, even given reasonable investment goals. However, there are, and there will continue to be some properties that can work well --- providing positive cash flow, likely appreciation, a stable tenant base, etc. To properly evaluate such opportunities, however, you'll want to (in my opinion) become comfortable with analyzing the properties and their potential financial benefits through several different lenses (cash flow, tax benefits, principal reduction, appreciation). Read up here for more details. If you are considering purchasing an investment property in Harrisonburg, I'd be delighted to assist you in that process. Get in touch (540-578-0102 or scott@HarrisonburgHousingToday.com) and we can start to discuss your situation and goals. | |
How Much Undeveloped Land Is Left In Harrisonburg? |
|
 Using data provided by the City of Harrisonburg, the information below is what I am finding on vacant land in the City of Harrisonburg. Bear in mind that there is a bit more vacant land than referenced below, but I chose to exclude land owned by educational institutions, local government, religious organizations, state government. Vacant Land In Harrisonburg:
 | |
Don't Sell! If You Can Keep Your First Home As A Rental Property, Do It! |
|
If you own your first home now, and are looking to move up to your next home --- I urge you to carefully examine the potential benefits (and risks) of keeping your current home instead of selling it. Your first home is likely an ideal rental property, and you can see enormous returns if you are able to keep your current home as a rental property when you purchase your next home. That being said, I know that many people need to sell their current home to use the proceeds of that sale to use as a down payment for their purchase. Scenario #1 -- Sell After Five Years We'll imagine that your home was a townhouse bought five years ago for $110k, which is now worth $155k. In selling the property, you will clear about $42k after closing costs. (Assumptions: 100% financing at 7% fixed, five years of principal reduction, 6% gross closing costs) Net Gain After 5 Years Of Residency = $42,000 As you can see, this is a hefty payoff after just five years. Certainly, even if you didn't need the funds to roll into your next purchase, it would be tempting to "cash out" by selling your first home. Scenario #2 -- Sell After Ten Years (total) We'll again imagine that your home was a townhouse bought five years ago for $110k, which is now worth $155k. However, instead of selling the property, you rent it for $875/month, with a super conservative 1% per year increase in rental rate. We'll also assume that your insurance, property taxes, and property value go up 3% per year. If you keep the property for another five years after moving into your new home, and then you sell it, in addition to getting the roughly $42k out that you would have netted after five years, you'll also likely experience:
Scenario #3 -- Sell After Thirty Years (total) But what if you kept it all the way until the end of the 30 year fixed rate mortgage? Then things would be looking excellent! In addition to getting the roughly $42k out that you would have netted after five years, you'll also likely experience:
The Risks Certainly, as in any investment scenario, there are risks. Here are a few:
The Benefits I believe the benefits CAN outweigh the risks, depending on your own personal financial scenario. Instead of cashing out after 5 years for $42k, you can have tenants pay off the remainder of your mortgage, while you get to enjoy the monthly excesses as rental rates go up, and you eventually get to realize the appreciation of the property. After 30 years, you are likely to have received a net of $353k instead of just $42k. Wow! | |
November Home Sales Soar In Harrisonburg, Rockingham County |
|
A few days ago I mentioned that I thought November sales would be strong, with likely around 65 home sales. I think I was wrong. I think we're going to see a big rise in home sales in November. We've already seen 49 home sales between November 1, 2009 and November 19th, 2009 --- which exceeds all of November 2008 sales. And if I extrapolate out based on how many occurred in the first 19 days of November last year, this is what we find . . . .  I'll try not to dwell on this too much . . . well, actually, maybe I will! | |
Did Our Area's Median Sales Price Increase Because Bigger Homes Were Being Built And Sold? |
|
This is another great question about the Harrisonburg and Rockingham County market! The graph below shows how the median sales price has increased over the past 10 years (the blue line).  The hypothesis would be as follows:
 First, check out the graph above. The median price per square foot has tracked at a relatively similar growth and decline pace as the median sales price. If the increase in price had been a result of more sales of large homes, we would have seen price per square foot stay relatively level. We do not see that. Second, if the above hypothesis were true, we would see a significant run-up in the number of large homes sold up until 2006, and then a decline. Take a look . . . This graph shows all home sales:  Next, we see that "large" homes didn't actually decline as much as the rest of the market between 2006 and 2009:  And if we create an overlay of the two graphs we'll note that despite the vast number of large homes that are for sale, that segment of the market has actually picked up pace in the recent past as compared the rest of the market:  | |
We're Seeing The Effects Of The $8,000 First Time Buyer Tax Credit In Harrisonburg, Rockingham County! |
|
I rarely make real estate sales predictions --- mainly because in the rare occasion that I do, I'm usually wrong. More on this in a few days. That being said, I believe we're seeing the specific effect of the $8,000 first time buyer tax credit (that was recently extended) here in Harrisonburg and Rockingham County. Check out how November sales figures will likely play out . . .  We've already seen 34 home sales in Harrisonburg and Rockingham County in the first 17 days of November. Compare that to how many occurred in Nov 1-17, 2008 versus Nov 18-30, 2008, and I have extrapolated a final sales count of 65 home sales this November. I will likely be wrong --- I think it will be even higher. The second version of the first time buyer tax credit was to end on November 30th, so there are quite a few purchasers already in the queue waiting to close at the end of this month. Do you want further evidence? The median sales price of the homes that have sold this month is $177,623, compared to the year to date median of $190,000. We're seeing more inexpensive (first time buyer type) homes selling this fall. Any counter prediction out there? What do you think? And what do you think we'll see in those typically stagnant months of December and January?? | |
Do Townhomes in Harrisonburg Hold Their Value? |
|
This is a fascinating question, asked by a potential townhouse buyer who is concerned that townhouse values might be more volatile than single family homes because there have been so many townhouses built in the Harrisonburg area over the past several years. Here is my best attempt at evaluating how townhouses in Harrisonburg hold their value compared to single family home . . . Most of the new townhome communities in and around Harrisonburg have been built during the past six years, so I began by comparing how the median price of townhomes changed over the past six years (2003-2009) as compared to the median price of single family homes. I found that townhomes increased in value by 51% during this time period, while single family homes only increased in value by 42%.  Next, I thought it might be interesting to see how each property type has fared in the most recent three years (2006-2009) in a tough market with very little price appreciation. Comparing median price changes between 2006 and 2009, I found that townhomes increased in value by 1% during this time period, while single family homes LOST 8% in value.  Finally, just for good measure, I thought I'd stretch back even further and look at how the median prices of townhomes have changed over the past nine years (2000-2009) as compared to single family homes. I found that townhomes increased in value by 83% during this time period, while single family homes only increased in value by 70%.  Having examined value trends in a 3-year, 6-year and 9-year window, I'm quite comfortable asserting that townhomes grow in value, and maintain their value better than single family homes. Or, at least, they have in Harrisonburg and Rockingham County for the first nine years of this decade! Median price data source: October 2009 Harrisonburg & Rockingham County Real Estate Market Report | |
The Puzzle (To Buyers) Of A Low List Price |
|
 It can be difficult to price property as a seller, but another interesting puzzle is how a buyer should respond to a low (super-low) asking price. There are several scenarios where a list price might be quite a bit lower than expected:
The problem, of course, is that buyers are making a decision about an asking price in a vacuum! They don't know if there will be multiple offers, if any of the offers will be as high as asking price, if they will be above asking price, etc. The best solution, in my mind, is to use a relic from the recent past --- the escalation clause. This allows a buyer to make a bid that they hope will win the day, but also to provide an automatic method for increasing that offer should another outbid them. More specifically, if a house is listed at $125k that we think should sell at $225k, a serious buyer might want to:
My question, in that situation, is this --- if the above referenced property were not one with a low list price, but instead were listed at $229k, would you not be highly interested if you knew you could negotiate it down to only $185k? The issue at hand, I believe, is that it is hard to be comfortable with exceeding the asking price of a property in a buyer's market. | |
It's A Tough Time To Be Pricing Real Estate As A Seller |
|
 You just can't win! The experience I'm having, on the ground, is this:
For our example, let's assume that the three most recent comparable sales are $220k, $225k and $230k. Certainly, this would indicate that the value is quite likely $225k based on what has recently sold. Then, if we look at what's available now, we might find something priced at $225k, $235k and $240k. Conventional wisdom would thus suggest that we price the house at either $229,900 ($230k) or $234,900 ($235k). This would allow for some negotiating room down to the perceived value of $225,000, and yet would still be appealing compared to other properties that are currently available. What I'm seeing these days is that if you're priced above the perceived value, you often will get traffic, but not offers. Thus, if the home is priced at $230k or $235k buyers will come to look at the home, but they won't make an offer because they perceive the value to be $225k, expect to thus pay $215k to $220k, and then don't make an offer because it would require $10k to $20k of negotiating. If we accept all of that to be (generally) true, the next logical step is to list the property at either $224,900 ($225k), or perhaps even $219,900 ($220k) depending on how motivated you are to move the property. But the problem here is that you'll then likely have buyers who want to pay $210k or $215k --- WAY below where you perceive the value to exist. Just to bounce back to that "value" (because some people would question it) --- if your three neighbors just sold for $220k, $225k and $230k, would you really reasonably think you'd have to sell at $210k or $215k to make the sale?? What is a seller to do? It is a tough call in any regard --- my counsel in a real live scenario differs from client to client and from property to property depending on the urgency of a homeowner's situation, the particular comparable competing properties, etc. There are ways to successfully navigate this market as a home seller, but they require careful analysis, and patience. | |
The October 2009 Harrisonburg and Rockingham County Real Estate Market Update . . . for auditory learners. |
|
Enjoy this brief video segment discussing real estate market conditions in Harrisonburg and Rockingham County as of the close of October. What do you think? Why has our market remained stable? What will we see for the balance of 2009? | |
Has The First-Time Buyer Tax Credit Pulled More Buyers Into The Market In Harrisonburg, Rockingham County? |
|
Warning: This analysis, though numerically and statistically based, is an abstract answer to a nearly impossible question.  The question, raised today by Chad, is whether the first-time buyer tax credit (that was set to end on November 30, 2009 but has now been extended) has pulled any additional buyers into the market. I say.....maybe, but.... The chart above shows how I attempted to answer that question. For each year between 2000 and 2009, I determined the percentage of home sales that were at or below 80% of the median sales price that year. We can assume that most first time buyers are going to be in that general price range (under $93k for 2000, and under $152k for 2009). The chart, thus, shows how that segment of the market has fluctuated in relative size over the decade that is coming to a close. As you'll notice, the portion of supposed first-time buyers dropped off between 2005 and 2007 --- likely because home prices were increasing (mostly between 2005 and 2006) and lending requirements were becoming more restrictive (mostly between 2006 and 2007). But....the trend then reverses starting in 2008, and then continues in that new trajectory in 2009. There are thus (perhaps) more first-time buyers in our market today because of the tax credit, then there otherwise would have been. Yes, I know --- lots of mental leaps there. The additional caveat that I offered Chad is that while I believe the first-time home buyer tax credit did and is pulling buyers into the market now who might have otherwise waited until 2010 or 2011 to purchase --- I also think there have been first-time buyers that would have purchased in 2008 and 2009 that were waiting because of the economy. Thus --- the tax credit is borrowing buyers from the future who really would have been today's buyer anyhow. Again --- all of this is largely speculative, as I can't truly tell you the number of first-time buyers in our market, but hopefully this analysis sheds a bit of light on the topic. I welcome your suggestions for additional analysis to answer this question. | |
October 2009 Harrisonburg & Rockingham County Real Estate Market Report - Sales Steady, Prices Inch Lower |
|
 I just published my monthly market report on Harrisonburg and Rockingham County. Read on for a summary, or jump right into the report by reading it online or downloading the PDF. Just a year ago, I was reporting that when comparing Jan-Oct 2007 to Jan-Oct 2008:
The decline in median and average sales price is also quite troubling --- at first --- until we put that into the context of how home values have changed in other parts of Virginia and the United States. First, though, I do understand that every homeowner wants the value of their home to increase, always, every year, without exception --- and I don't fault you for that desire. That being said --- home values in our nation have declined quite significantly over the past several years, and many markets in Virignia also saw those drastic declines. Yet, somehow, the Shenandoah Valley (thus far) has remained largely unscathed. We have seen a slight, slow decline in home values (as measured by median and average sales price), but home values increased 51% between 2003 and 2006 and have only declined 1.5% between 2006 and 2009. Let me repeat that for emphasis, because it is astonishing given what has happened nearly every other housing market in the nation.... Home values in Harrisonburg and Rockingham County increased 51% between 2003 and 2006, yet have only declined 1.5% between 2006 and 2009. What does the future hold, you might ask? I showcased a few scenarios last week which you can review here. Beyond the numbers, I believe we will continue to see small declines in home values over the next 12 months, and that over the next 6 to 18 months we will see the pace of sales start to solidify and then slowly increase. To learn more about the details of our local housing market, review the entire October 2009 Harrisonburg & Rockingham County Real Estate Market Report: Read Report Online | Download PDF. If you find the information in this report to be helpful....
| |
What is, isn't, and will be (or not) in the Harrisonburg and Rockingham County real estate market |
|
Each month I publish a real estate market report for Harrisonburg and Rockingham County, which includes this graph:  Overly simplified, you'll notice in this graph that sales are slow, but prices are steady:  Certainly better than the many markets (even in Virginia) where the pace of sales is increasing, but prices took a huge hit: 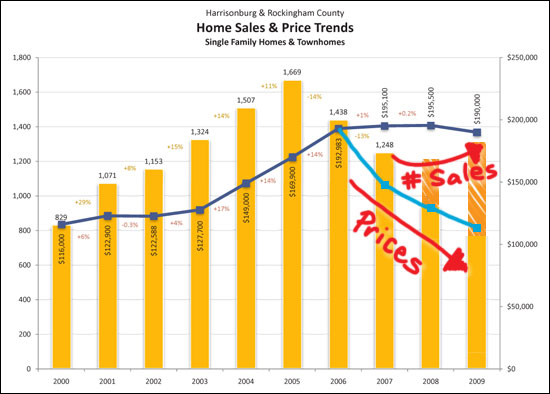 At the same time, our market could have transitioned more gracefully than it did --- perhaps if prices had dropped a bit more, sales wouldn't have slowed down so much:  The big question now, is WHAT IS NEXT for our local real estate market. I think another big drop in sales and a significant drop in prices is likely overly pessimistic:  Yet it's also probably too optimistic to think we'll see sales pace and prices rebound overnight:  My best guess? We'll see another year of negligible changes in price, but we'll see a small increase in sales pace:  But what do YOU think?? ** Of note, the 2009 bar is extrapolated from Jan-Sept 2009 sales. | |
Predicting Home Sales Using Online Property Views |
|
Can we predict home sales by examining the number of properties viewed on the network of Coldwell Banker Funkhouser Realtors web sites? Possibly....  Above you'll see a graph that tracks home sales per month in tandem with the number of properties viewed each month on the Coldwell Banker Funkhouser Realtors network of web sites (my web site, the company web site, all other agent web sites). I think there does seem to be a general correlation between the two sets of data. That being the case, we should expect to see home sales level out or decline as we move into the next few months --- which is winter, and typically slow. However ---- an extension and expansion of the home buyers tax credit is being considered, which, if passed, could incent more buyers to get into the market, causing an increase instead of a decrease in the number of home sales in Harrisonburg and Rockingham County. | |
Are Smaller Homes Faring Better Than The Overall Market In Harrisonburg and Rockingham County? |
|
My hypothesis was that smaller homes were performing better in Harrisonburg and Rockingham County than the market at large. After all, there is a significantly greater supply of homes for sale in the higher price ranges --- which would suggest that the real winners are the lower priced and smaller homes. Plus, the $7500 followed by $8000 tax credits were certain to bring lots of new buyers into this segment of the market.... The data, however, shows otherwise....  As shown above, the overall market experienced a 44% drop in home sales between 2005 and 2008. However....  As shown above, the market defined as homes with less than 1,500 square feet experienced a 47% drop in home sales during the same time period. Now, let's look at prices....  As shown above, median sales prices of all residential properties have decreased by 1.5% between 2006 and 2009. However....  As shown above, the market defined as homes with less than 1,500 square feet experienced a 4.5% drop in median sales price during the same time period. How could this be?? The best explanations for this (slightly) lower performing segment of the market (1,500 SF or less) that I can offer are....
| |
Price Right From The Start, Unless You Find Great Joy In Waiting |
|
 As referenced yesterday, we're seeing quite a few price changes --- nearly 700 so far in 2009 --- so let's examine why they are happening, and whether they are necessary. First, most (but not all) price changes are reductions. Price reductions happen primarily because a house isn't selling at the existing asking price, and the hope is that more interest and activity (and perhaps an offer??) will be generated by lowering the price. Put another way, a price reduction is an indication that the original asking price was too high. So.....why is it so important to get your price right from the get go? Mainly because if you don't, you're house will sit on the market until you do. That's right --- my slightly scientific analysis (below) indicates that your house won't sell until you get the asking price set properly. It's a long and arduous task to examine price reductions in detail via our Multiple Listing Service, so I was only able to analyze trends based on a small sample size --- the 60 most recent home sales in Harrisonburg and Rockingham County. Here's what I found.... The 35 homes that did not reduce their asking price:
Thus, if a home is "worth" $200k, there would be two options:
| |
Sellers Must Really Be Dropping Their Prices, Right??? |
|
Sort of....but maybe not effectively?? The chart below shows the number of price changes per year of homes that have sold for each of the past nine years. Some houses that sold may have had multiple price changes --- these figures show the total number of price changes, counting each change on each property.  There was a sharp increase (+29%) in price changes in 2006 (compared to 2005), which would be expected because it was the first year of a reduced number of home sales. However, there was also a sharp increase (+22%) in 2005 (compared to 2005) when the market was still peaking. Perhaps of even more interest is that the number of price reductions per year has slowly decreased over the past several years (-4% in 2007, -7% in 2008). This may be explained by the declining number of home sales, as the number of price changes shown above only accounts for price changes of listings that have sold. This year there have been approximately 600 home sales, and roughly 200 price changes of those homes that have sold . . . but nearly 700 price changes when we include the many houses that are still on the market. Stay tuned for more analysis of how price changes affect the sale of your house. | |
| Newer Posts | Older Posts |
Scott Rogers
Funkhouser Real
Estate Group
540-578-0102
scott@funkhousergroup.com
Licensed in the
Commonwealth of Virginia

Home Search
Housing Market Report
Harrisonburg Townhouses
Walk Through This Home
Investment Properties
Harrisonburg Foreclosures
Property Transfers
New Listings