Market
| Newer Posts | Older Posts |
Timing The Sale Of Your Rental Property |
|
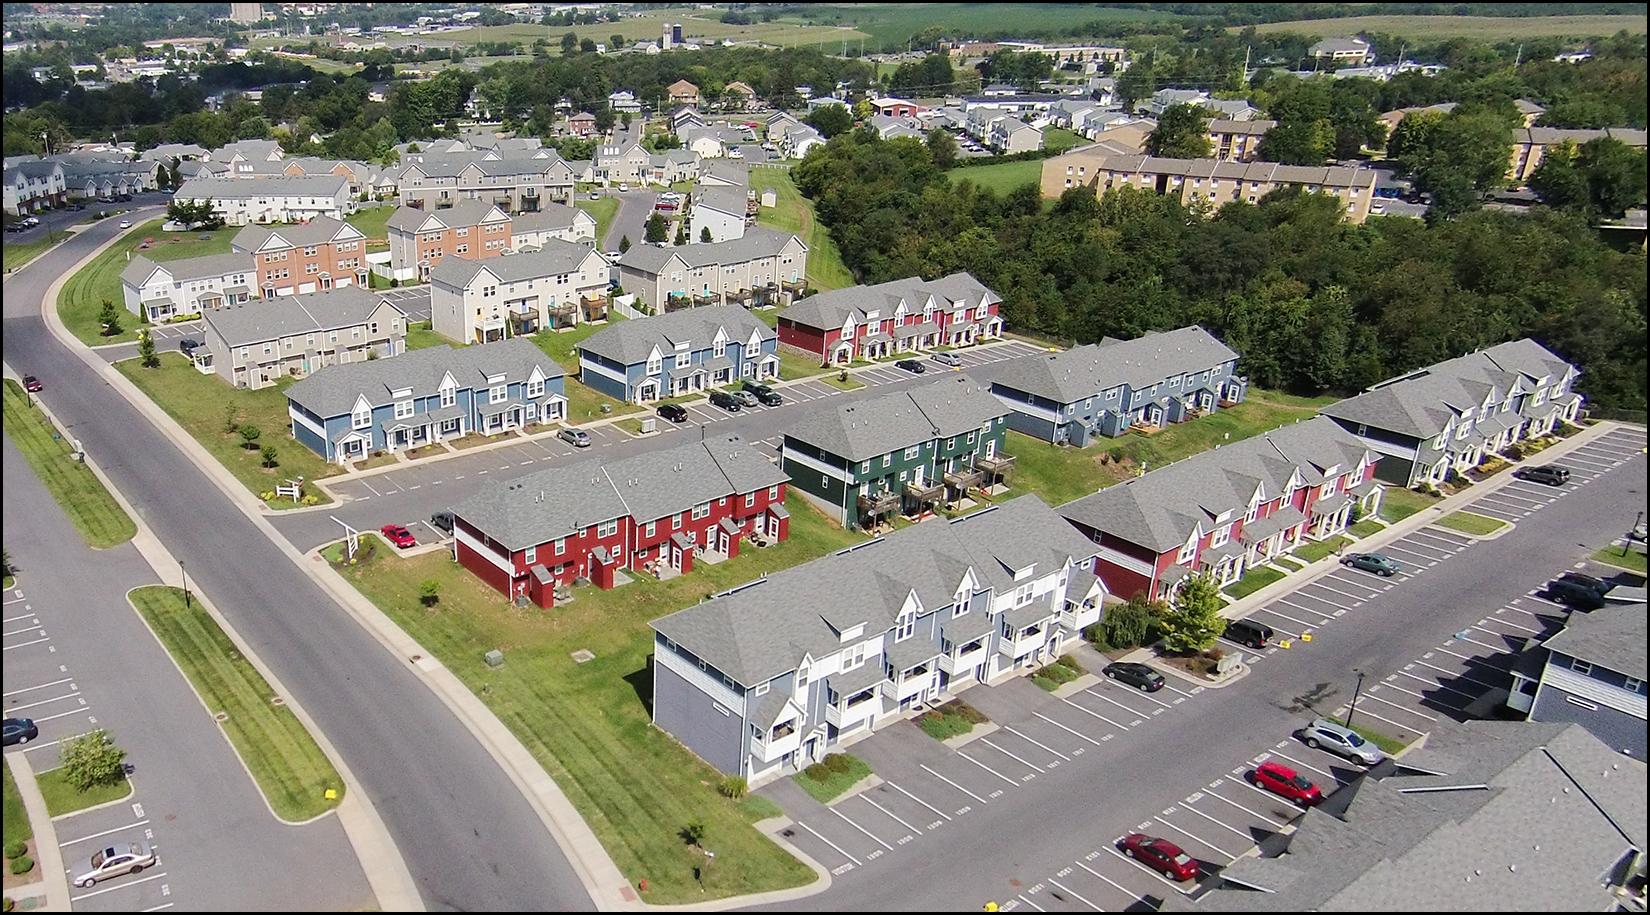 Do you own a property in Harrisonburg occupied by a tenant? When you are ready to sell it, how will you go about that process? In the past, many landlords would try to secure a buyer for the home before their tenant moved out -- because they did not want a potential gap of several months without rental income while they waited to see if the rental property would sell. These days, if you'd like to sell your rental property, I'd suggest... 1. Give your tenant a notice of the non-renewal of the lease. 2. Once the tenant moves out, do any necessary minor cleaning or repairs and consider whether it would make sense to paint the interior of the property and/or replace any flooring. 3. List your property for sale. 4. Get overwhelmed by an incredibly high number of showings and likely a multitude of offers. 5. Gleefully select the offer with the most favorable terms and the fewest contingencies. 6. Proceed quickly and smoothly to closing. It won't always go this way -- of course -- but the market is starved (!) for new listings right now, especially in the price range where many tenant occupied properties fall. If you have a rental property that you would consider selling in 2022, let's talk! | |
Home Buyers Just Entering The Market Should Despair, Then Rejoice |
|
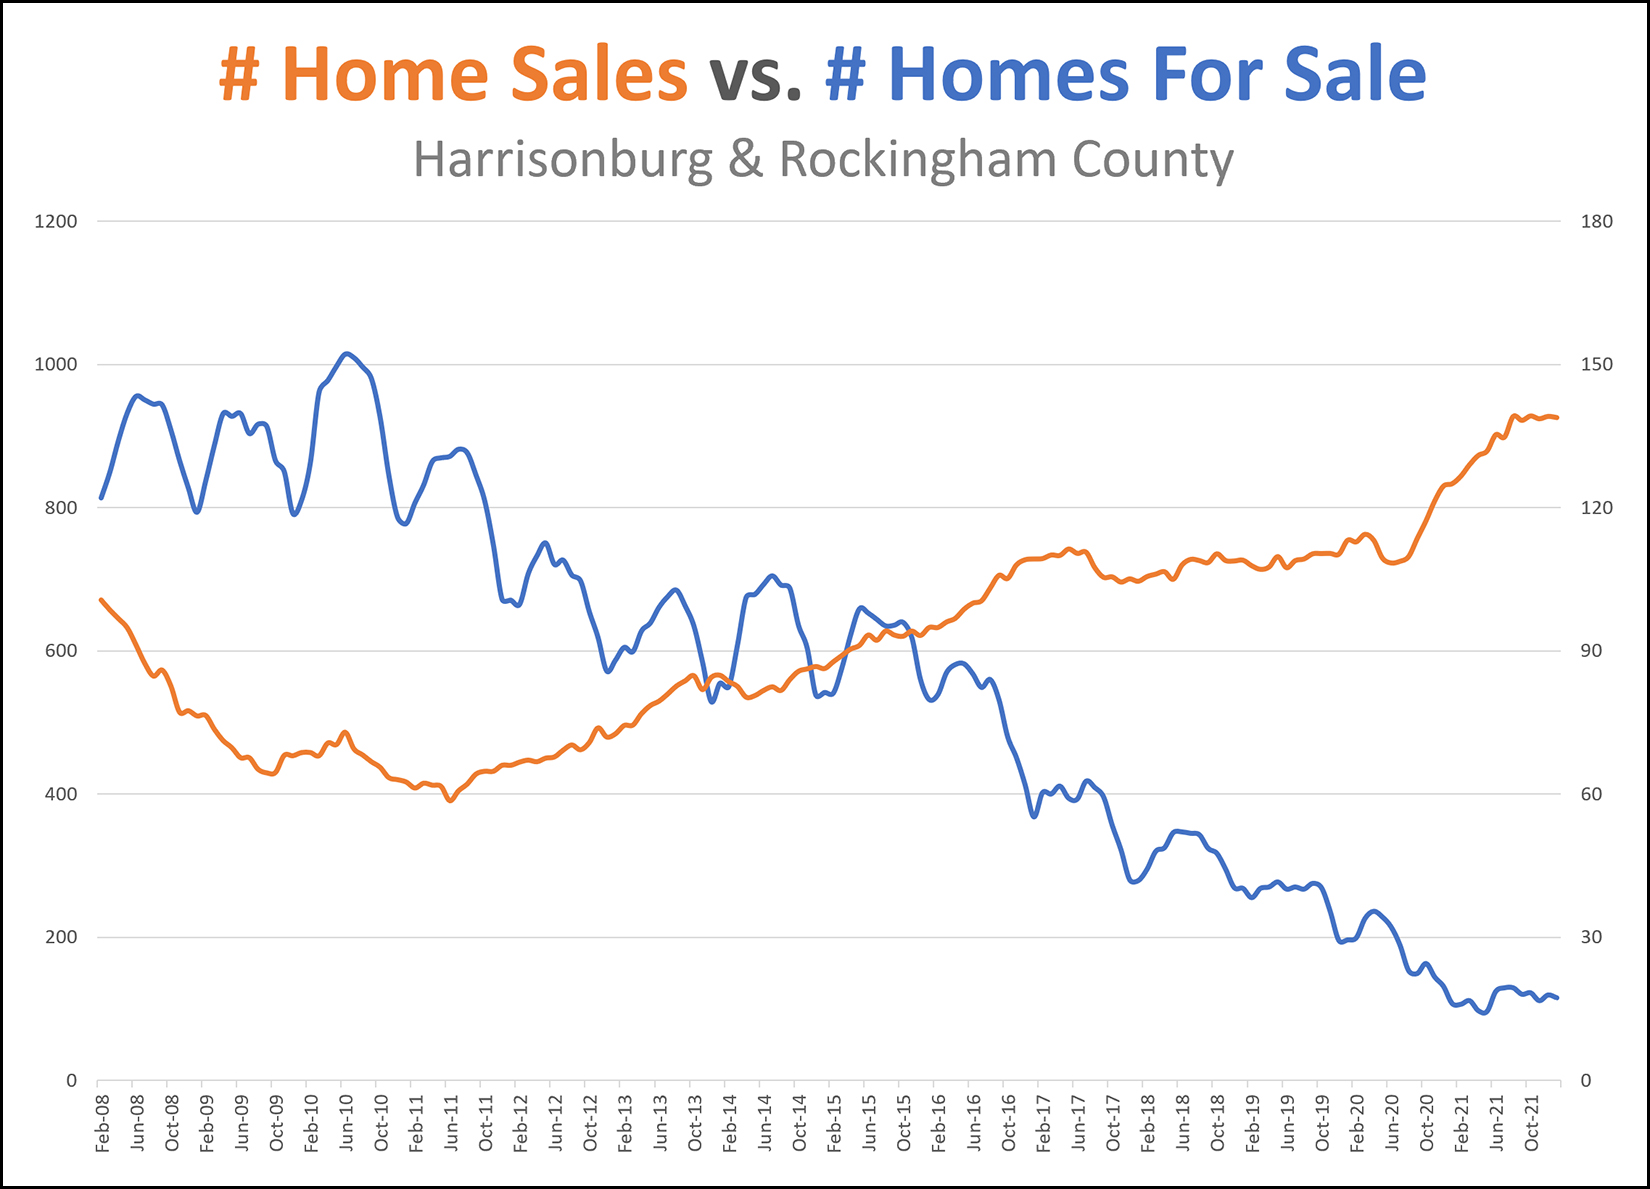 Blue Line = Despair Orange Line = Rejoice As any buyer in today's market will tell you... there is very little on the market to buy right now. That's the blue line. Over the past 13 years there have been fewer, and fewer, and fewer homes for sale at any given time. But... more homes than ever before (in the past 13 years) sold in the past year, so there are very likely to be plenty of options of houses to buy coming on the market in future weeks and months. That said, they will likely go under contract - quickly - leaving us with low inventory levels all over again. So... would be home buyers... despair only for a moment about the lack of current inventory, and then rejoice that spring is coming and there will likely be plenty of homes to consider purchasing! | |
Each Year, 10% - 15% Of Home Buyers Pay Cash In Harrisonburg, Rockingham County |
|
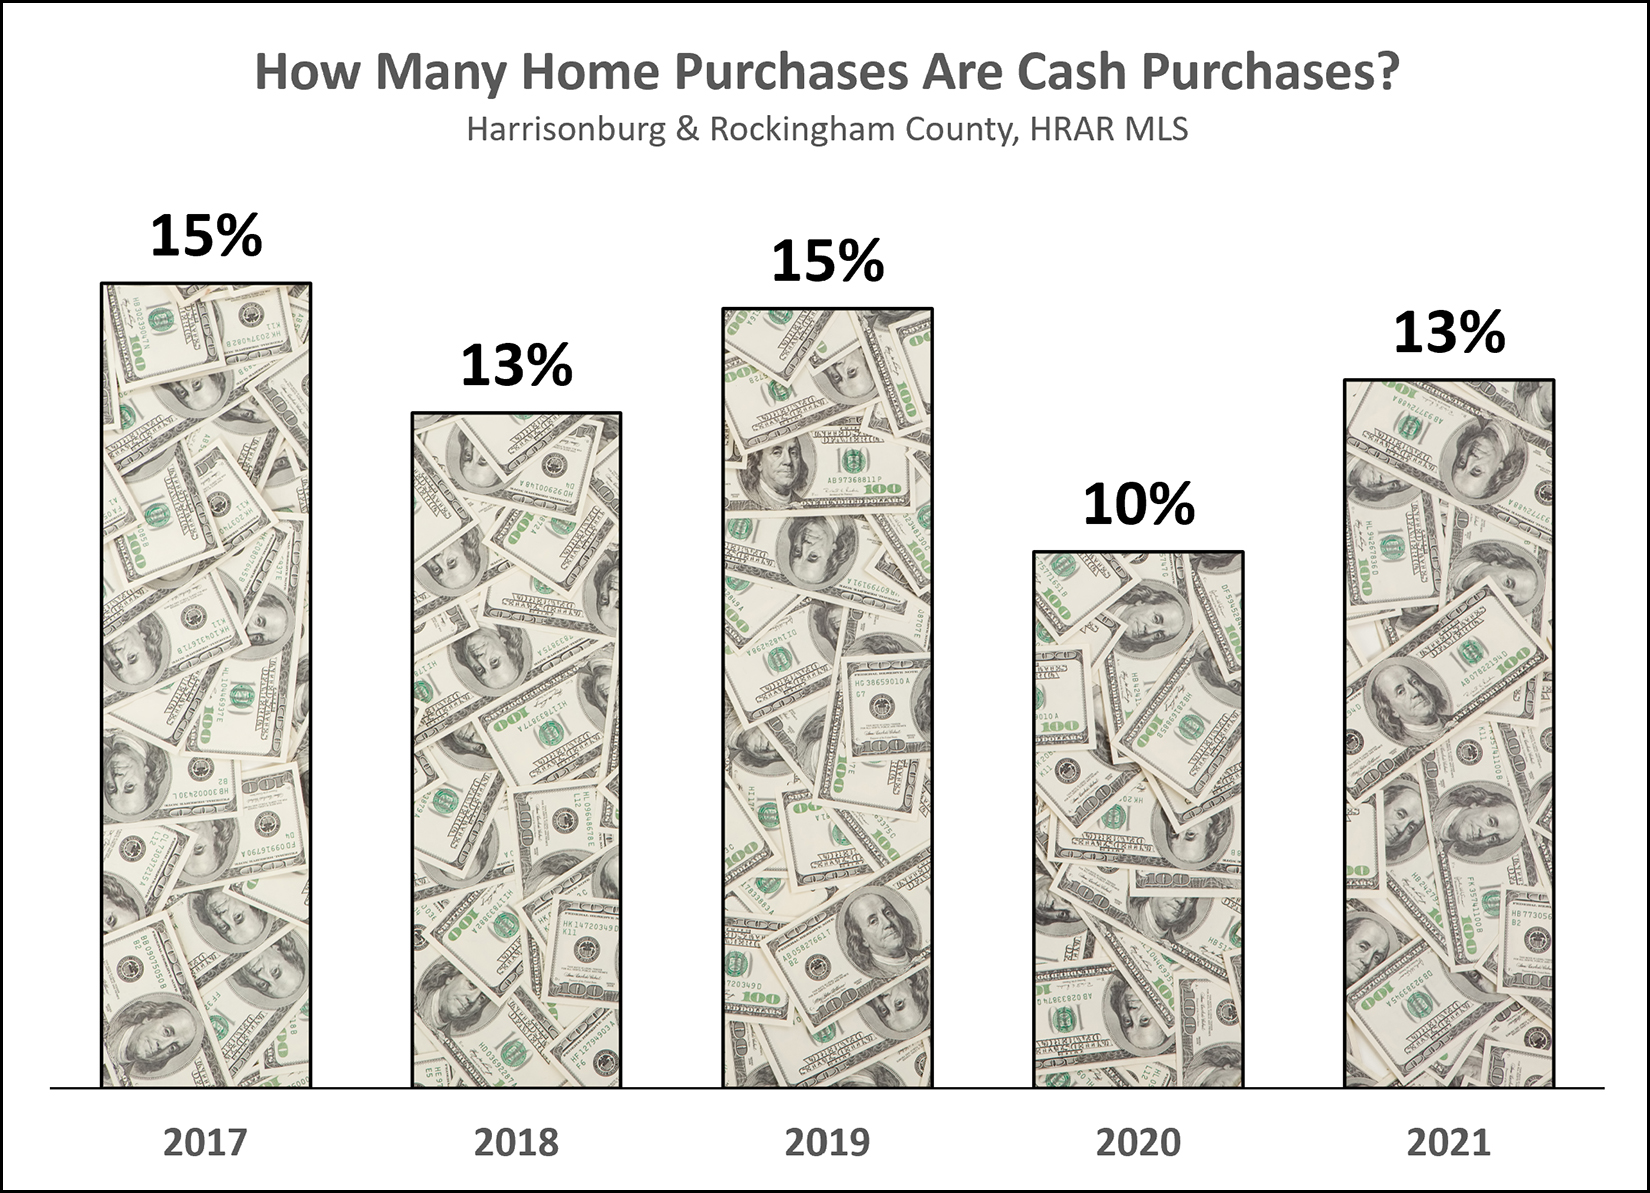 How often are home buyers paying cash for their homes in this area? It seems between 10% and 15% of home buyers are doing so each year according to data from the HRAR MLS. When a home sale is reported to the MLS, one of the required details is whether the purchase was made with cash or with financing. As shown above, 2021 feel right in the middle of the pack as far as the portion of home buyers who paid cash for their homes. So, what do you say, will you pay cash for your next home purchase? ð | |
12 Million Dollar Sales In The Past 12 Months |
|
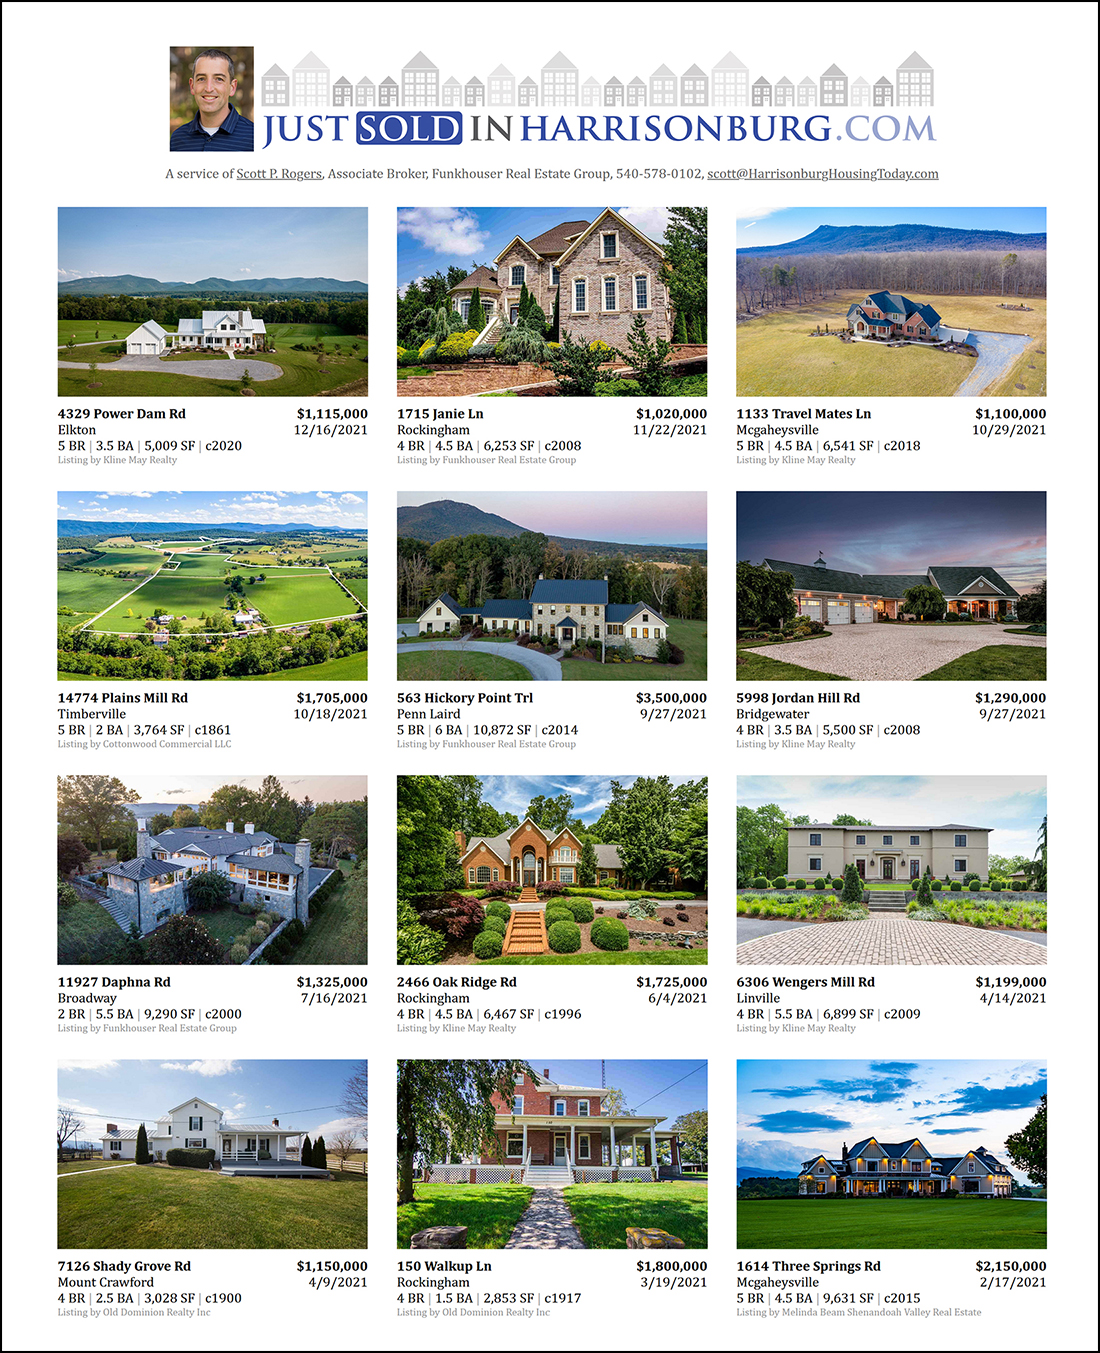 There have been (12) million dollar home sales over the past (12) months in Harrisonburg and Rockingham County as recorded in the HRAR MLS. For context, here ...
So... it turns out there have been twice as many homes sales over a million dollars in the past year than there have been over the entire decade before that! Wow! Explore the past year of million dollar home sales here. | |
New Homes are an Increasing Share of Total Home Sales in the Harrisonburg Area |
|
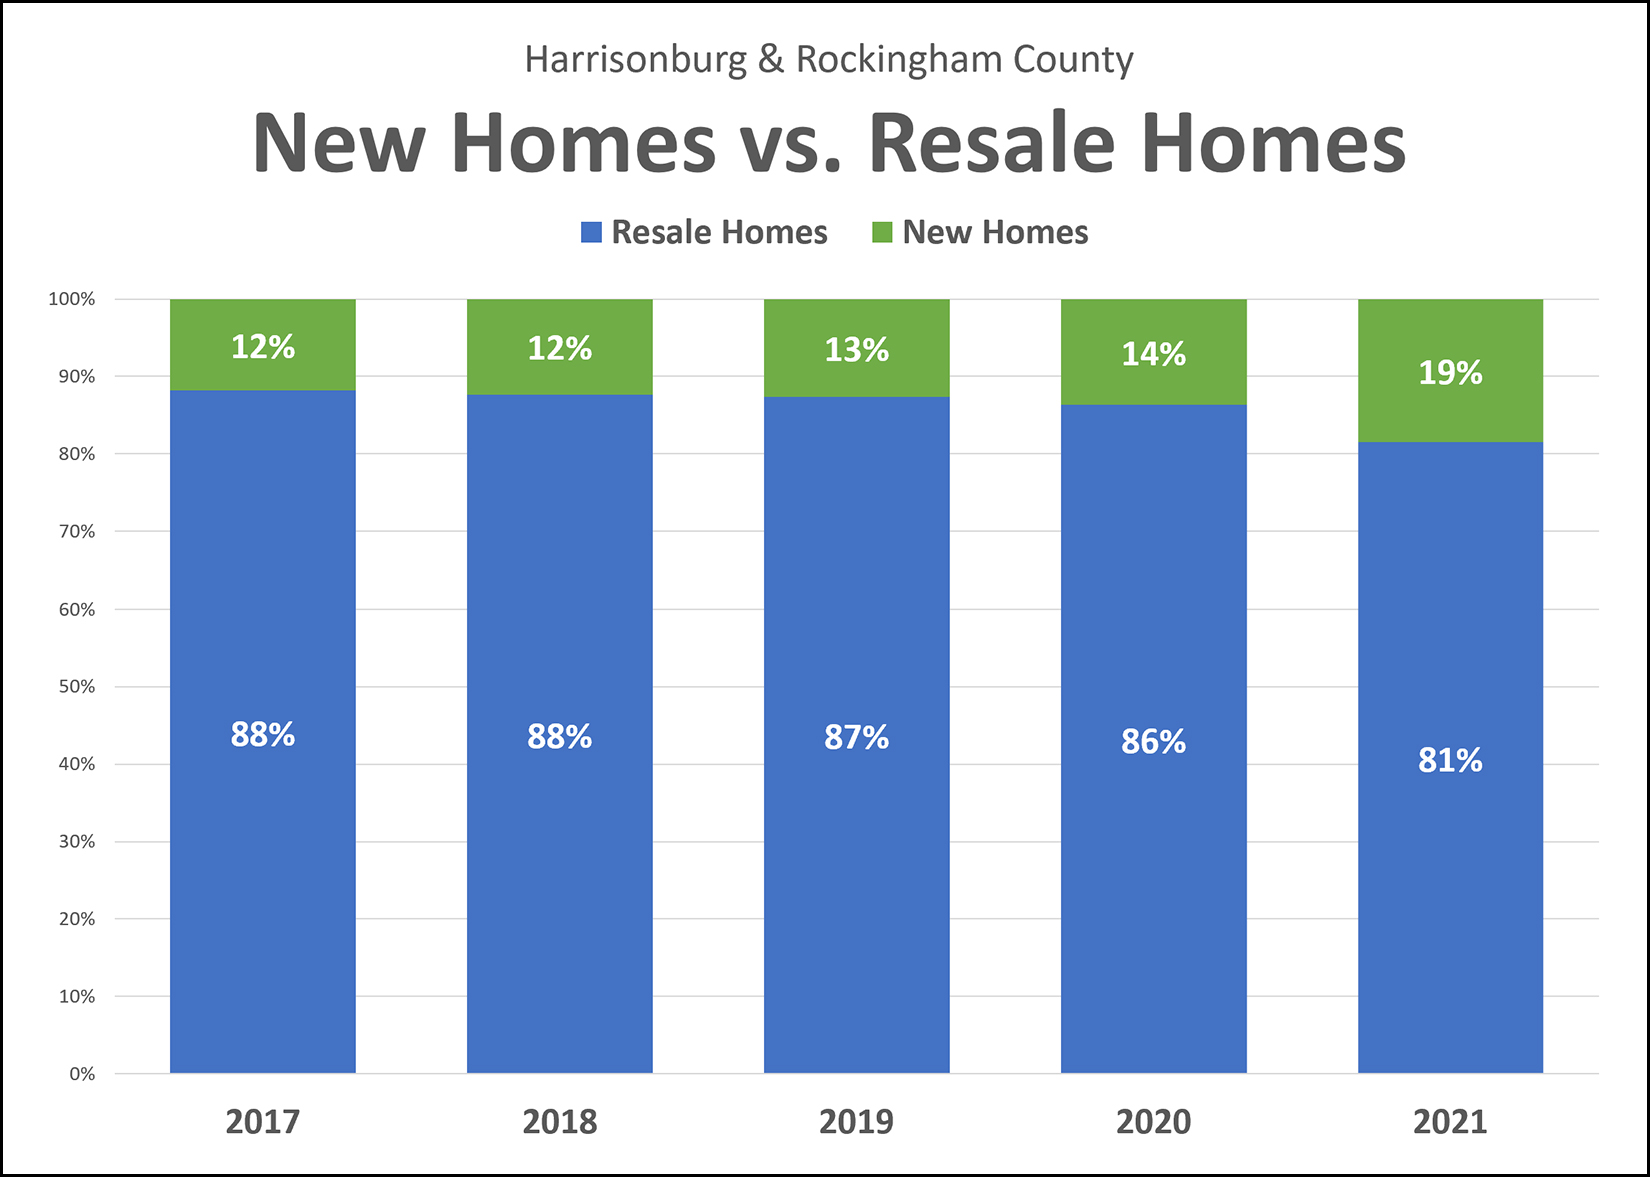 First, some raw data... Resale Home Sales:
So, there have been more and more resale homes selling over the past five years. New Home Sales:
There have also been more and more new homes selling over the past five years. The graph at the top, though, tells a third story -- an increasing portion of home sales are new home sales. Between 2017 and 2020 new home sales comprised 12% - 14% of all home sales. Then, in 2021, that jumped up to 19% new home sales. Thus, last year, approximately one in every five homes sold was a new home. This would seem to be good news, generally, as there is an ever increasing number of people who want to buy homes and make Harrisonburg their home -- so we'll need to see more new homes to help provide that housing. | |
Slightly Fewer Home Sales, Much Higher Sales Prices In January 2022 |
|
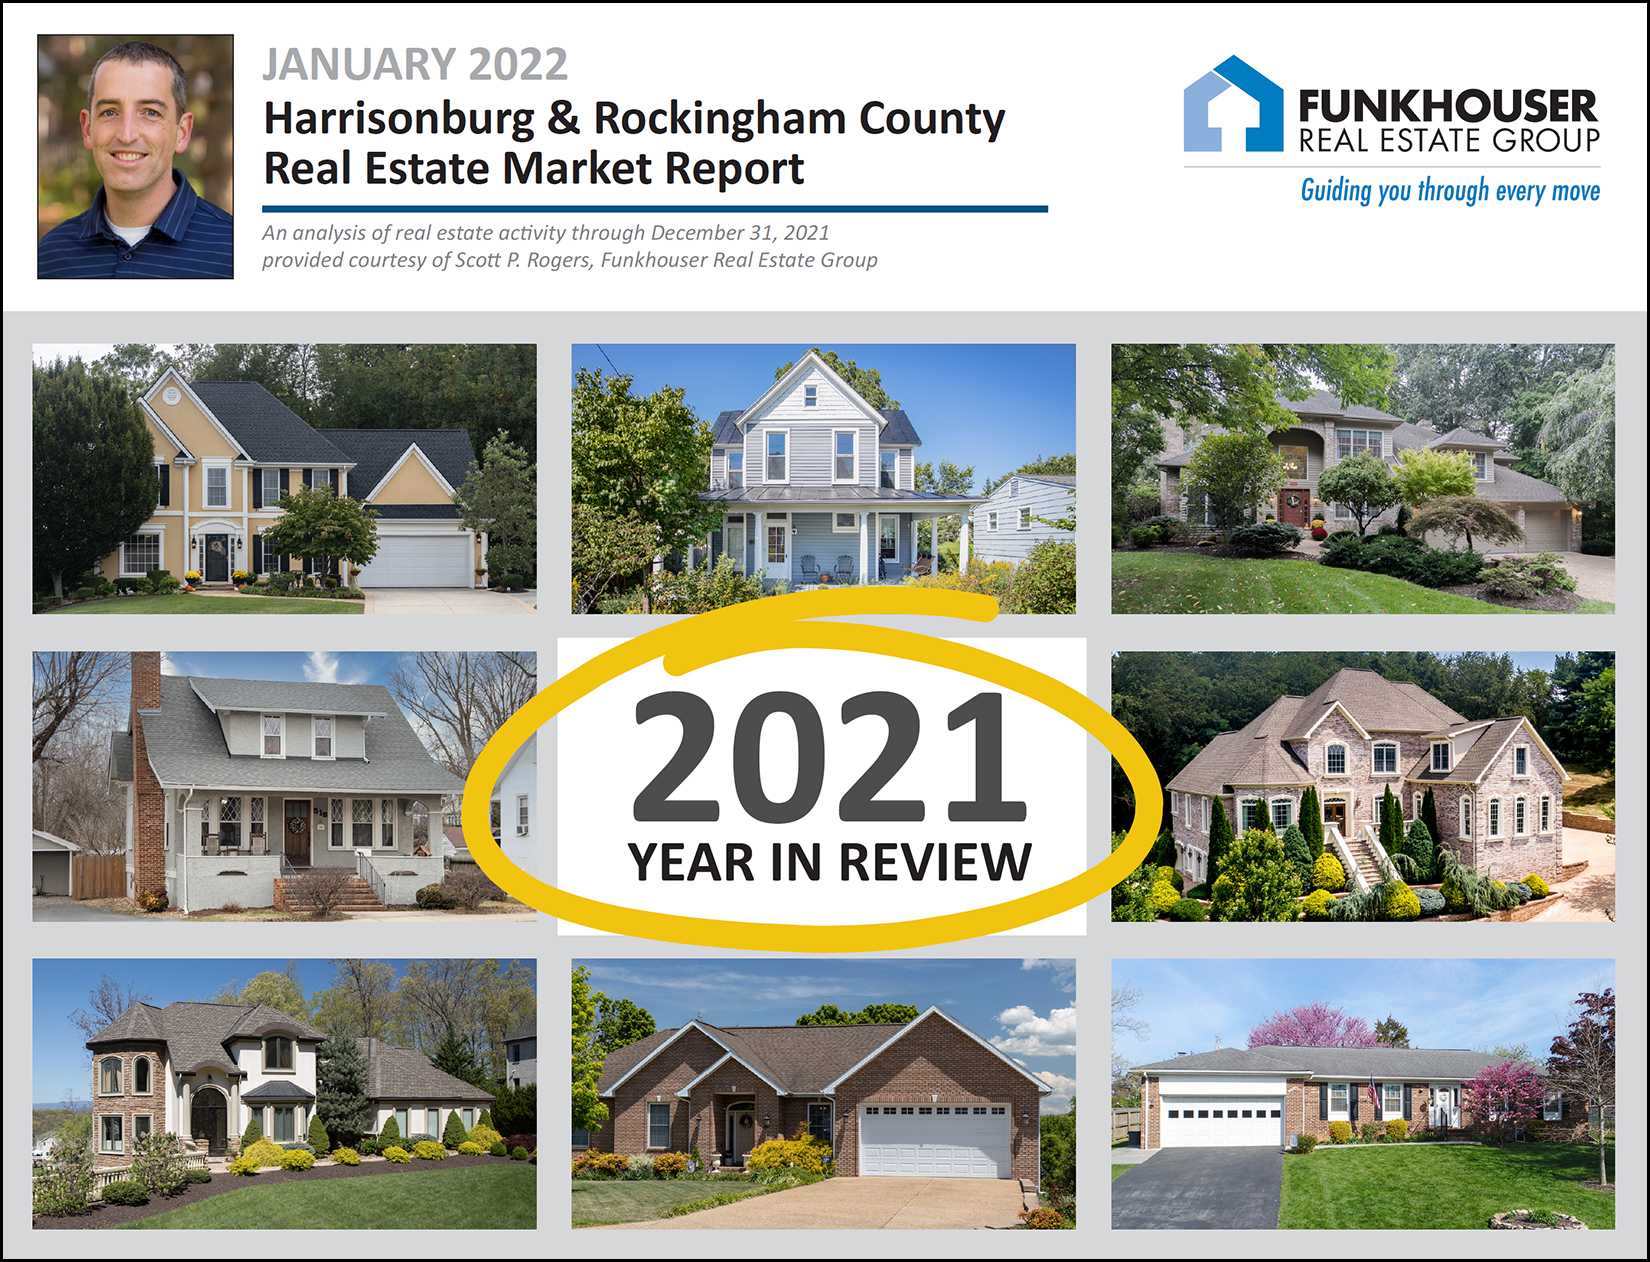
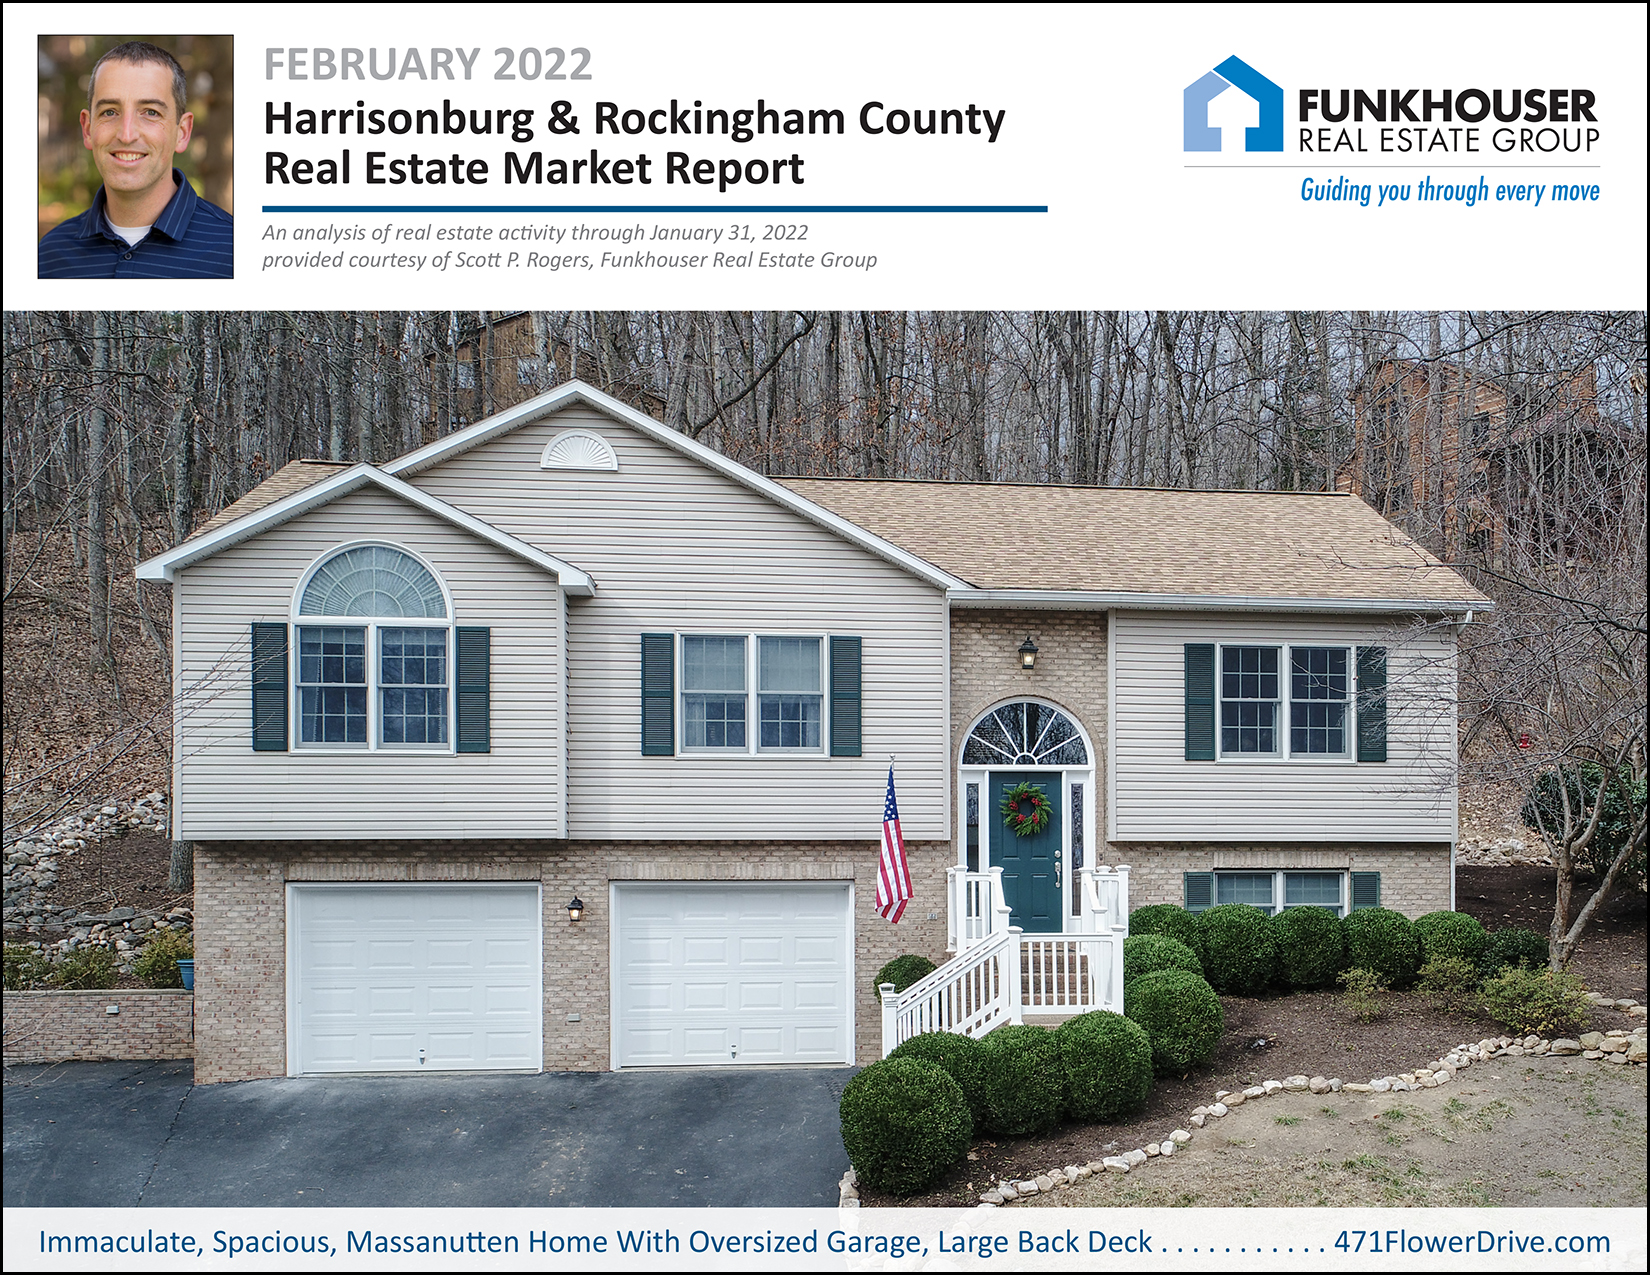 Happy Snowy Monday Morning! This is my favorite kind of snow... beautiful everywhere... but not sticking to the road... 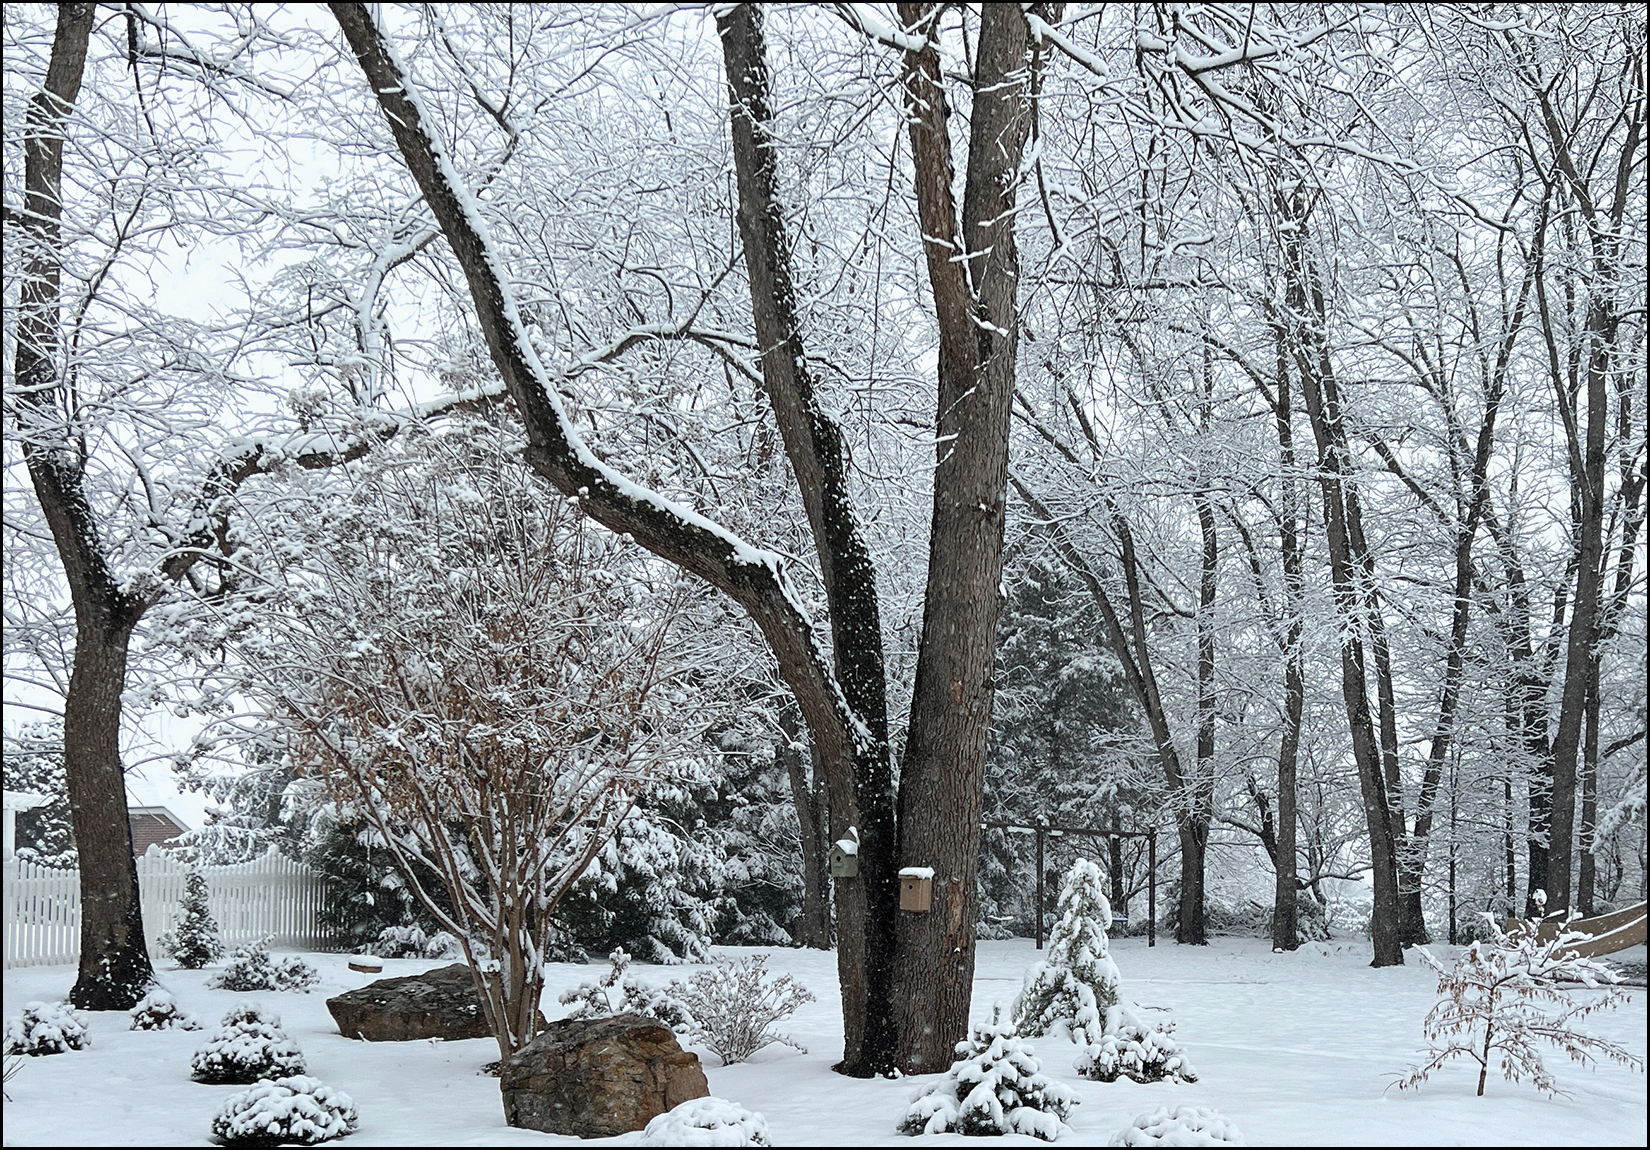 I hope you stayed warm inside yesterday and that enjoyed the Super Bowl last night. Hopefully your favorite team won... or you enjoyed the commercials... or you enjoyed the half time performance... or you enjoyed spending time with family and friends while partaking in all of the above!? It seems like the year just started, but we're already one eight of the way through the year! Before we get started, two quick links of interest... [1] The beautiful home featured on the cover of this month's market report is located at 471 Flower Drive at the base of Massanutten Resort is and currently for sale. [2] You can download all of the graphs and charts from my monthly report here. Now, onto the data... 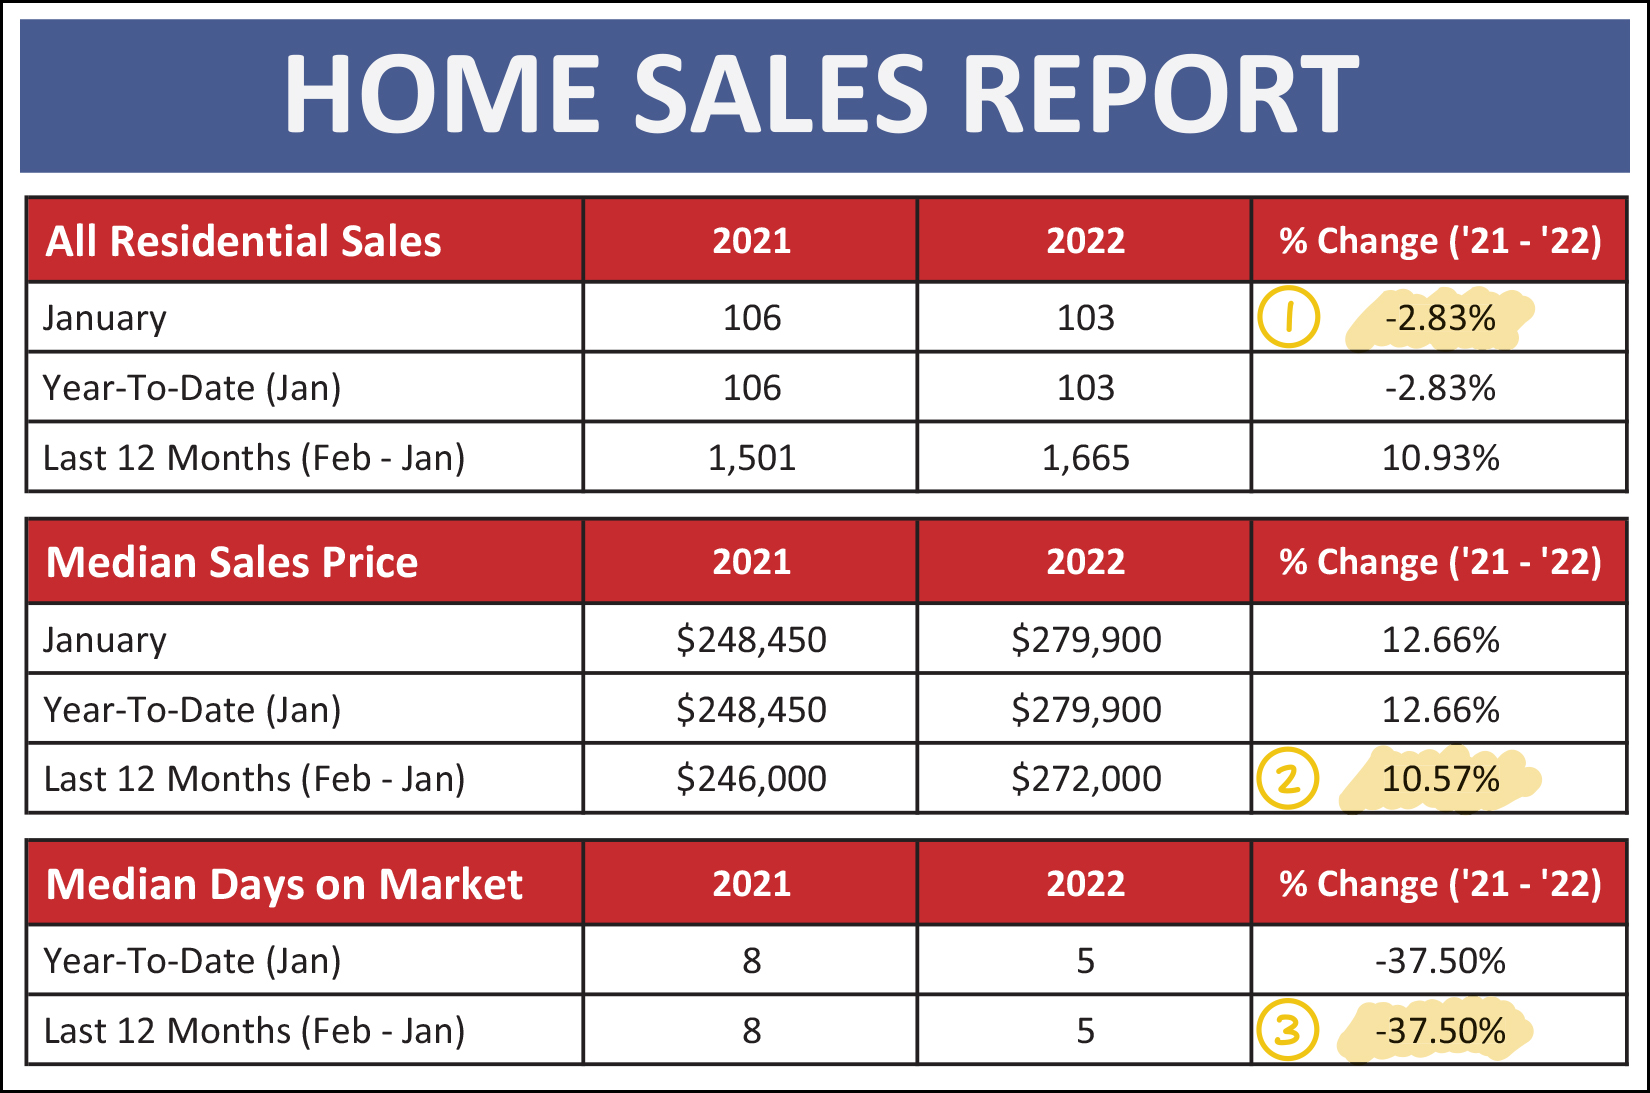 We're only looking at data for one month - and the slowest month of the year, so it's hard to draw many conclusions thus far, but here are a few things I am noticing... [1] There were slightly fewer home sales this year (103) than last year (106) during the month of January. [2] The median sales price over the past 12 months was $272,000 which is nearly 11% higher than the median sales price of $246,000 during the 12 months before that. [3] Homes are currently selling (going under contract) very quickly with a median of five days on the market - which is a 37.5% decline from the eight day pace a year ago. It is likely helpful to put this January in the context of other months of January, and other months, generally... 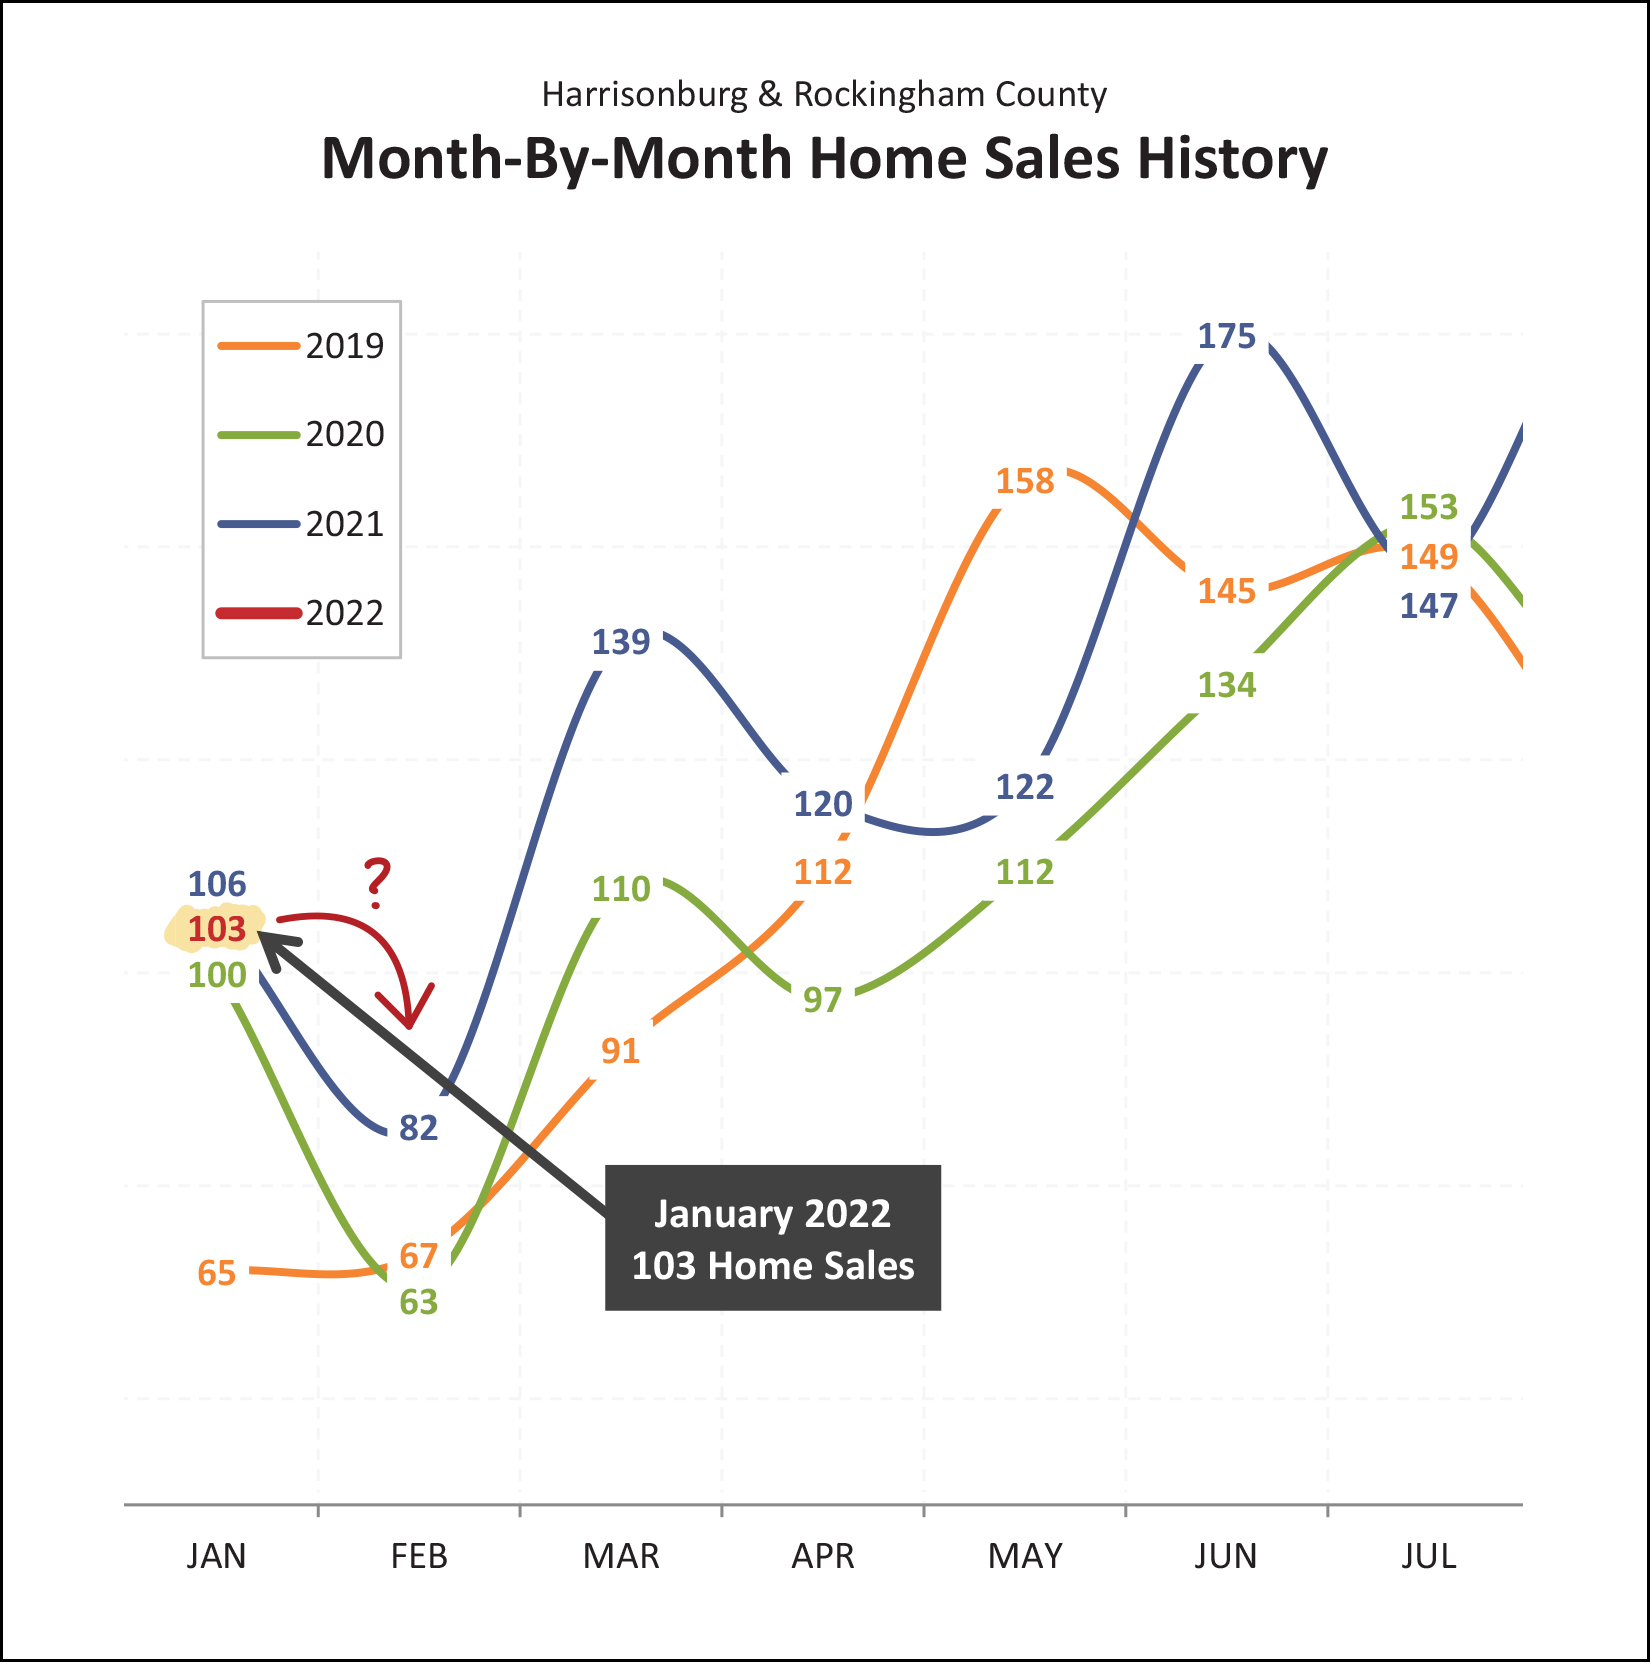 As you can now see, the 103 home sales this January landed right between the 100 sales in January 2020 and the 106 sales in January 2022. So, it was a typical January based on the past few years - though well above the 65 home sales seen in January 2019. Furthermore, we should likely expect to see sales drop in February as they have each of the past two years. January tends to be the second slowest month of the year for home sales with February leading the pack. Once we then head into March we should start to see a steady increase in the monthly pace of home sales. Now, a historical observation that I hadn't noticed until now... 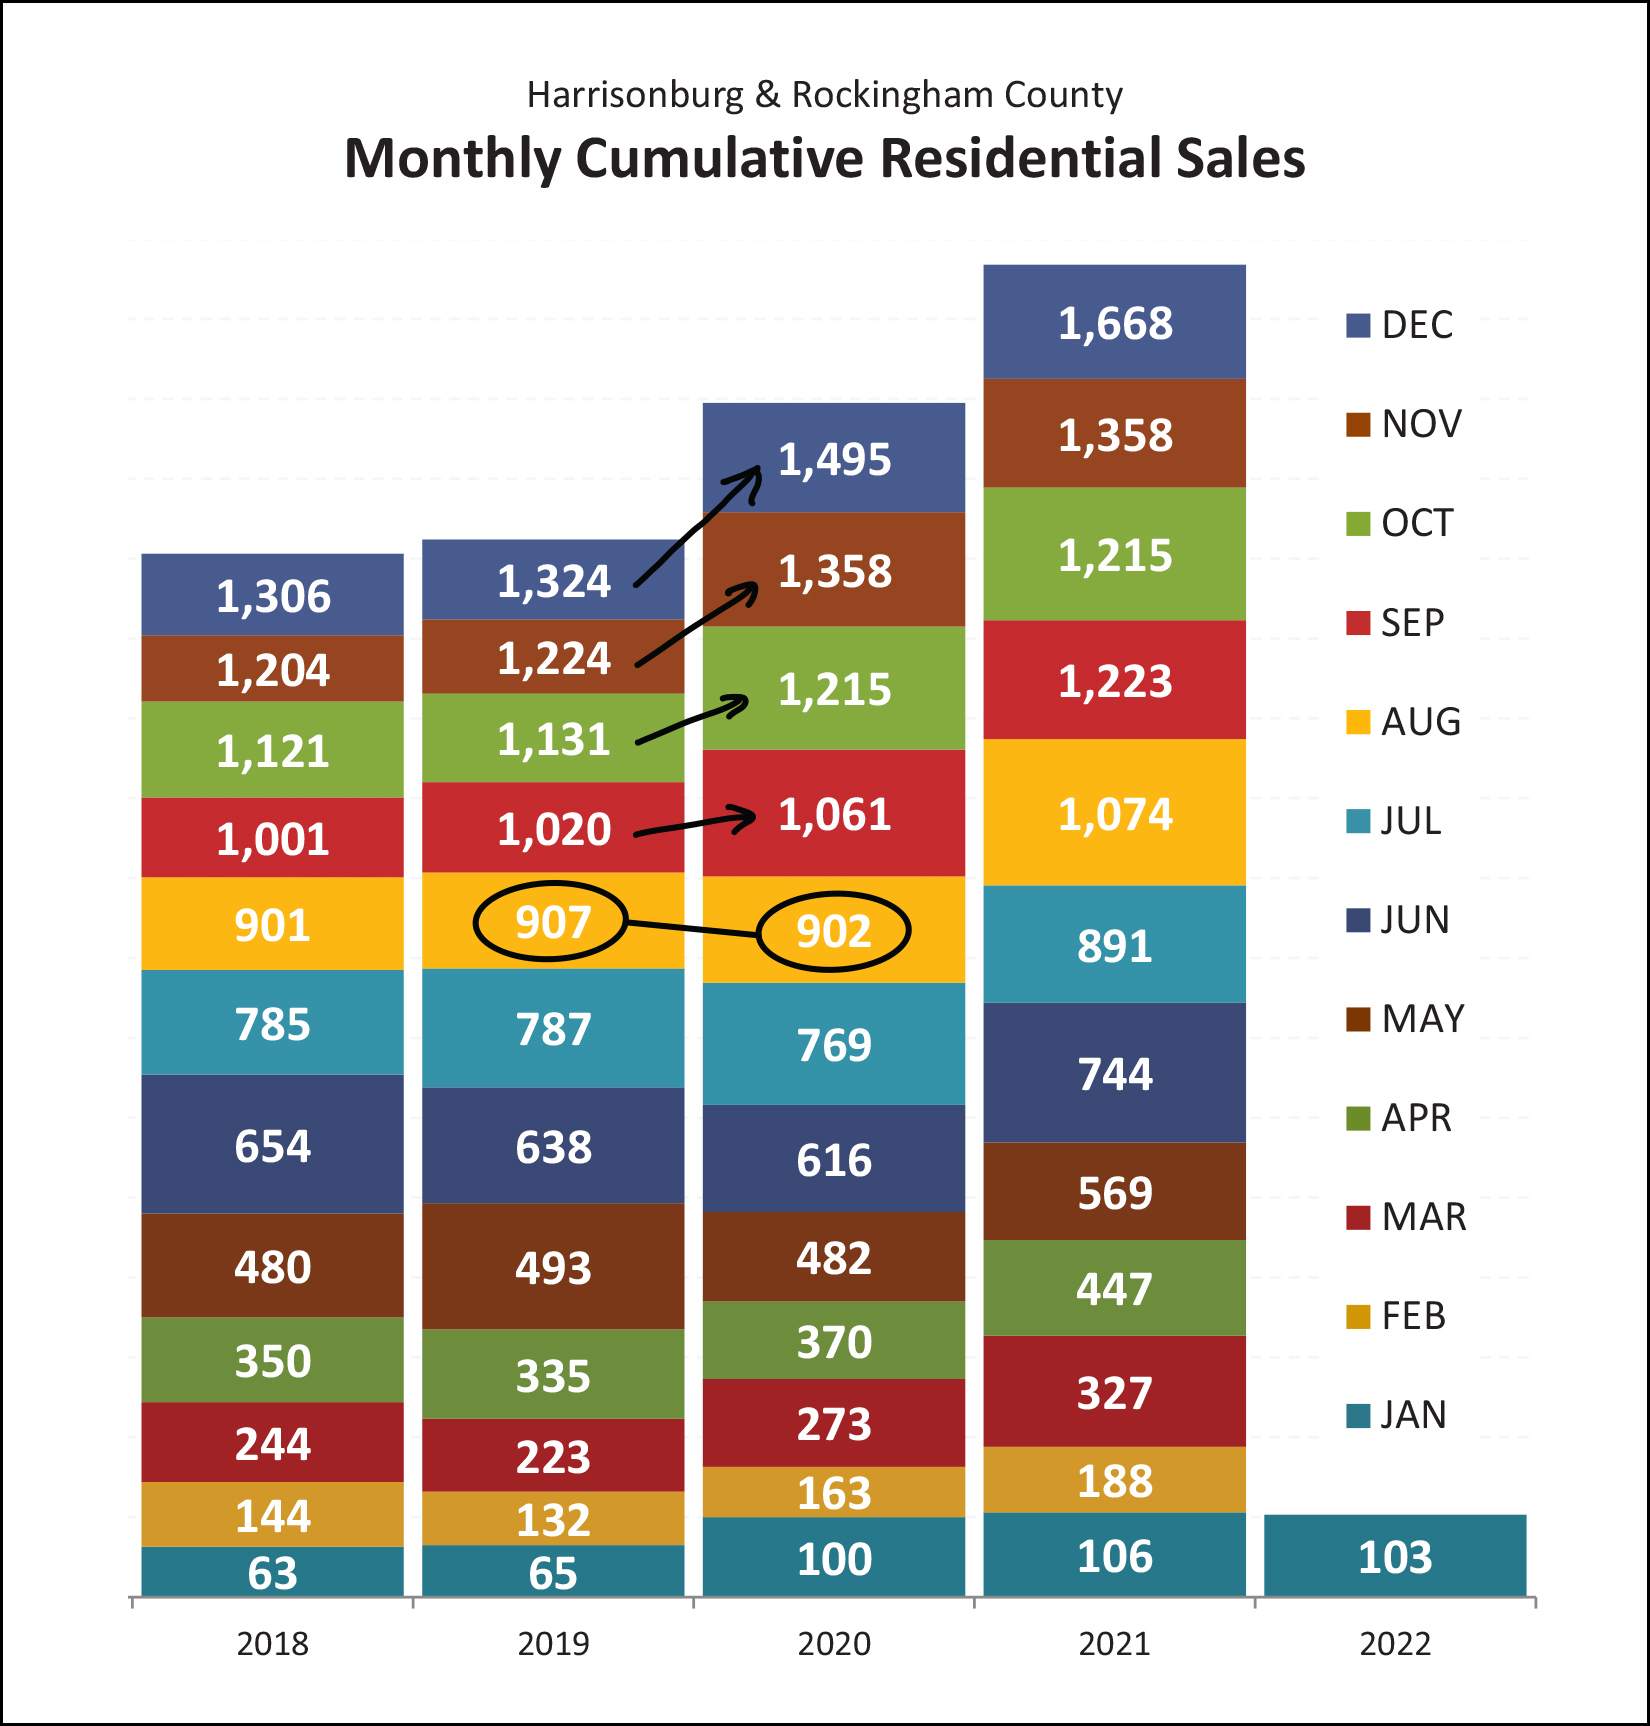 This is one of the graphs I show you most months that allows us to look at how monthly home sales each year are stacking up compared to prior years. It seems the local housing market in 2020 was on par with 2019 all the way through August 2020 -- and then, the pace of home sales took off in the last four months of 2020, and have been accelerating ever since that time! But... maybe the pace of sales is leveling off a bit? 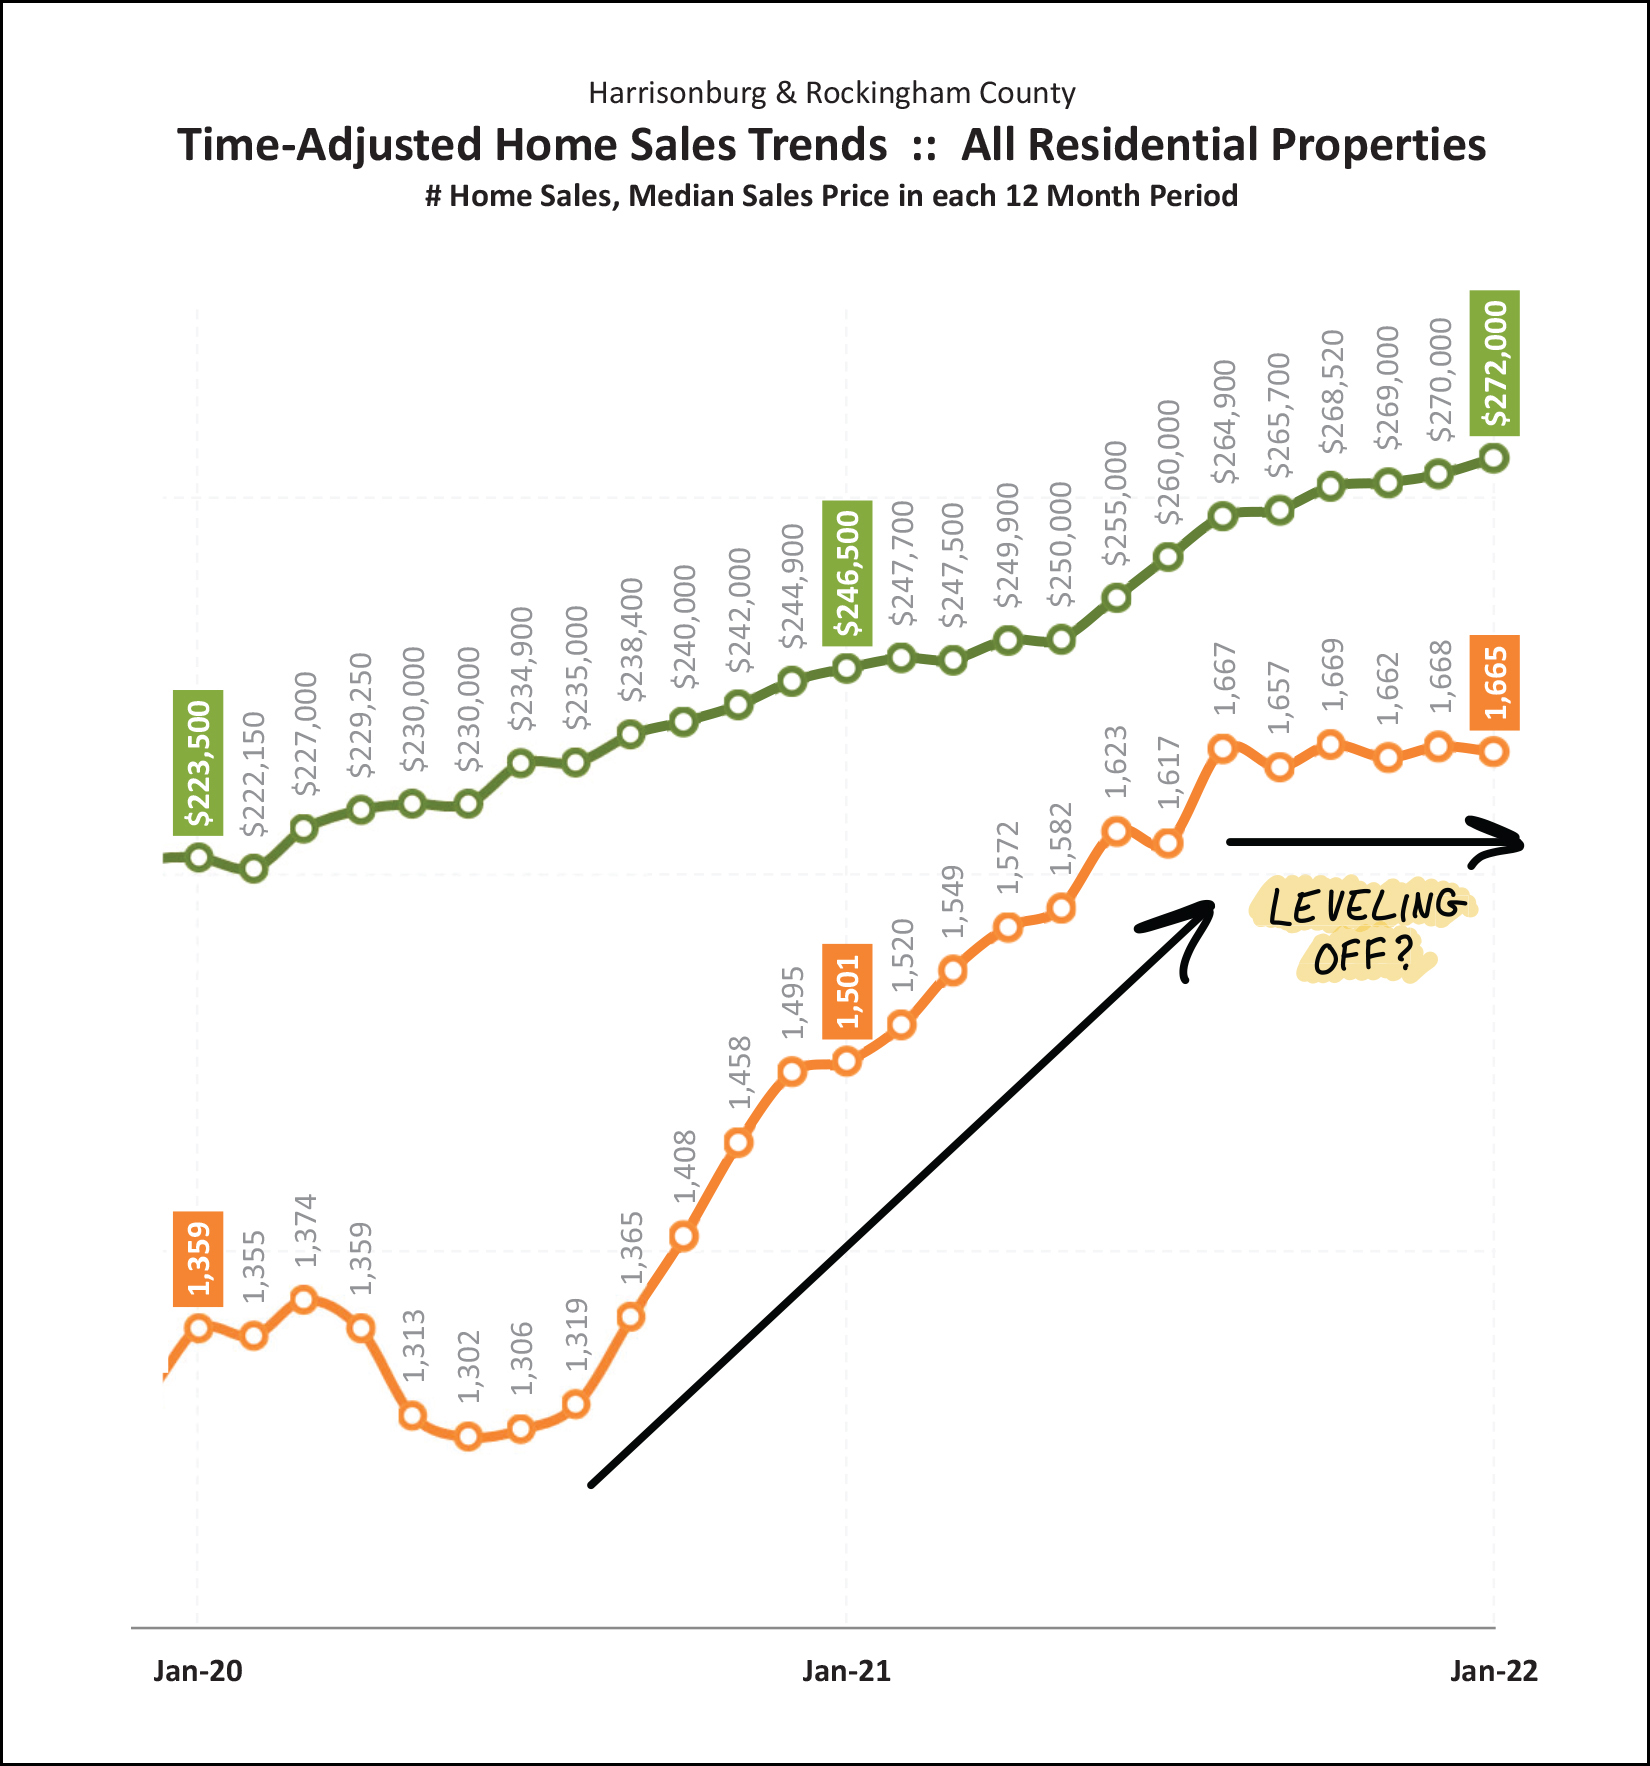 As you can see, the annual pace of home sales accelerated quickly from 1,300 sales per year up to 1,600 sales per year between mid 2020 and mid 2021. Over the past six months, however, the annual pace of home sales seems to have stabilized right around 1,650 sales per year. It will be interesting to see whether this trend continues as we continue through 2022. Now, then, looking at contract activity - which typically precedes the closing of a home sales by 30 to 60 days... 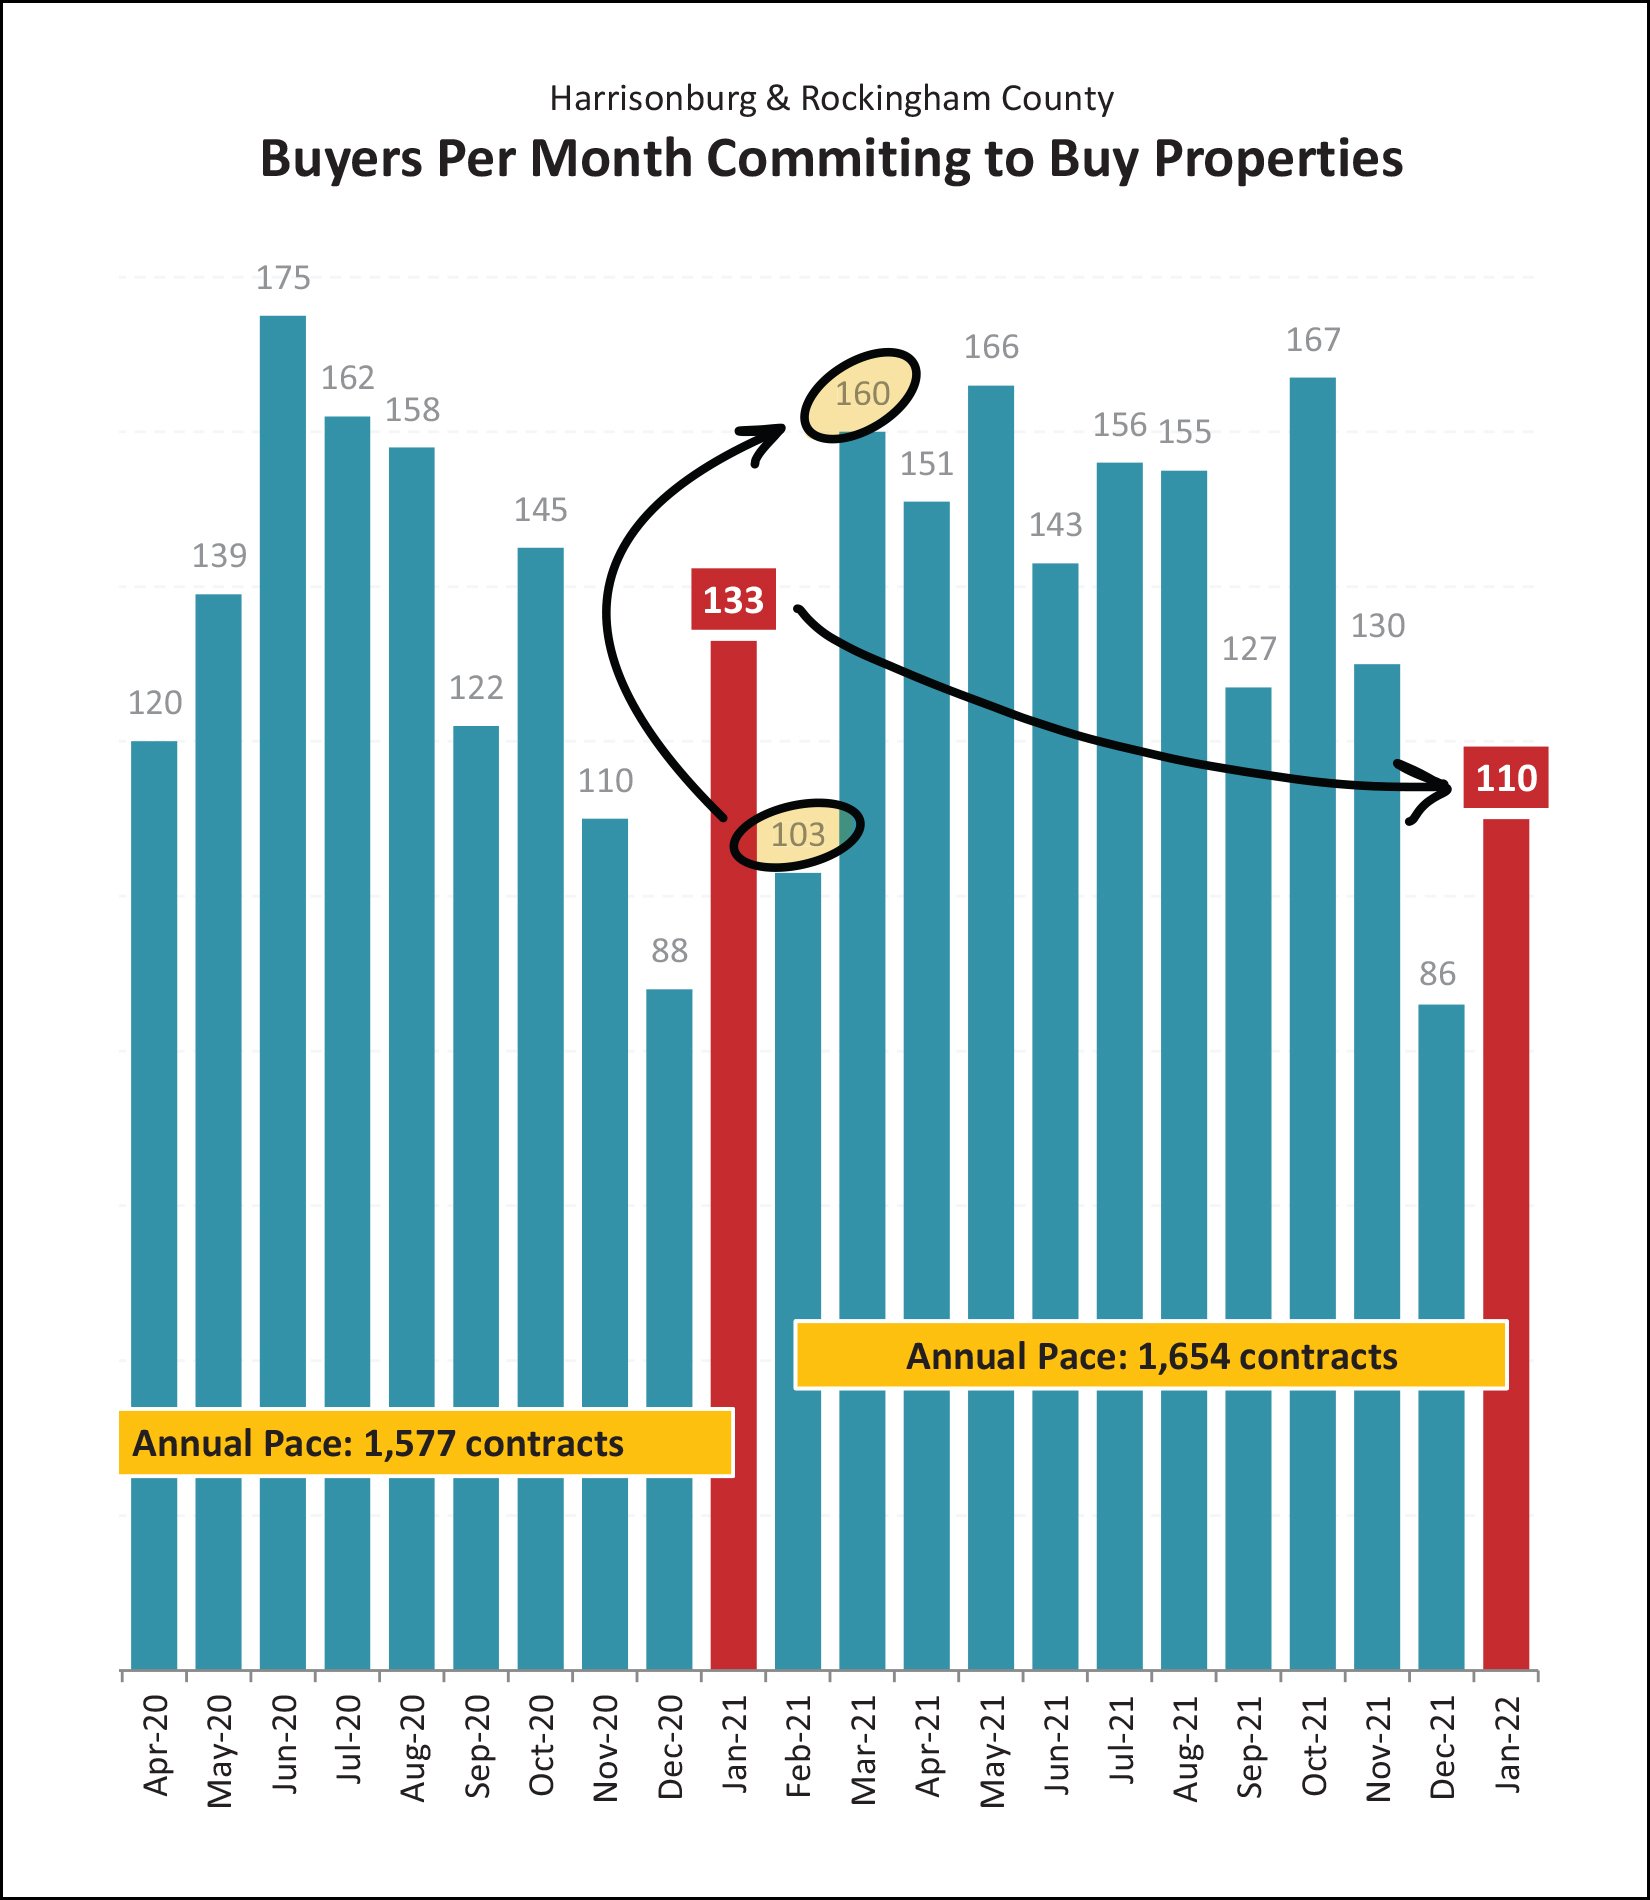 Two things to note about contract activity... [1] Last January we saw 133 buyers and sellers sign contracts to buy and sell houses in Harrisonburg and Rockingham County. This January, only 110 contracts were signed. This means that we will likely see a bit of a drop off in closed sales come February. [2] Looking back at last February and March we should note that we will likely also see a decline in contract activity between January and February before we see a large increase in March. So, expect a continued "slower" pace of market activity for at least the next few weeks before things potentially start accelerating in early or mid March. Another story line to be watching in 2022 is what happens with inventory levels... 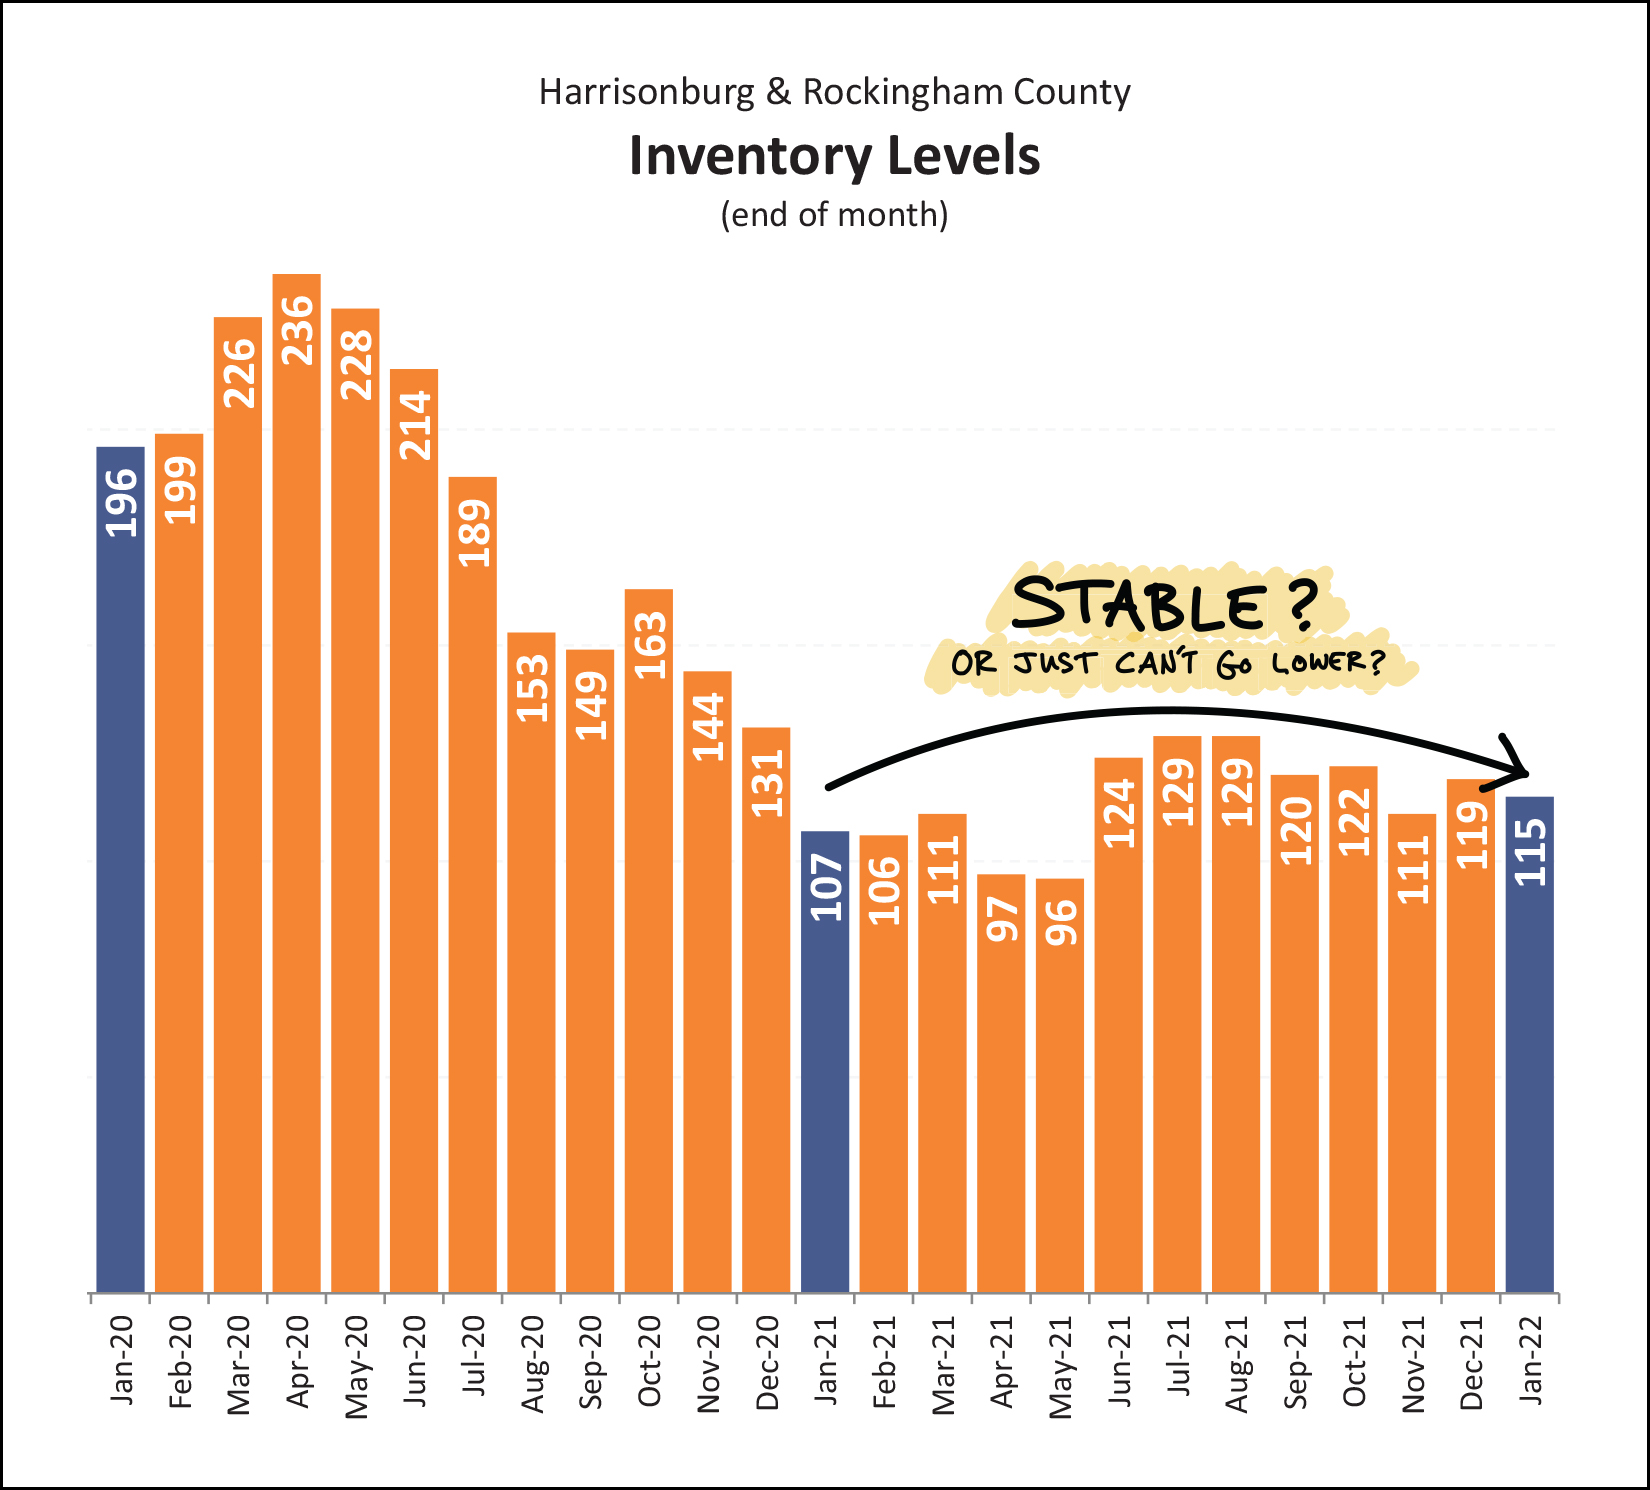 Inventory levels have been declining for several years, most notably above through all of 2020. But during 2021, inventory levels remained relatively stable, and did not decline further. Maybe because they can't? There will always be some homes on the market as I don't think we'll get down to only five or ten or twenty five homes for sale. The floor, in this case, might be right around 100 homes for sale. It will be interesting to see whether we continue to see a range of around 95 to 130 homes for sale all year this year like we did last year. Part of the reason why inventory levels don't seem to be able to increase is because homes are going under contract so quickly... 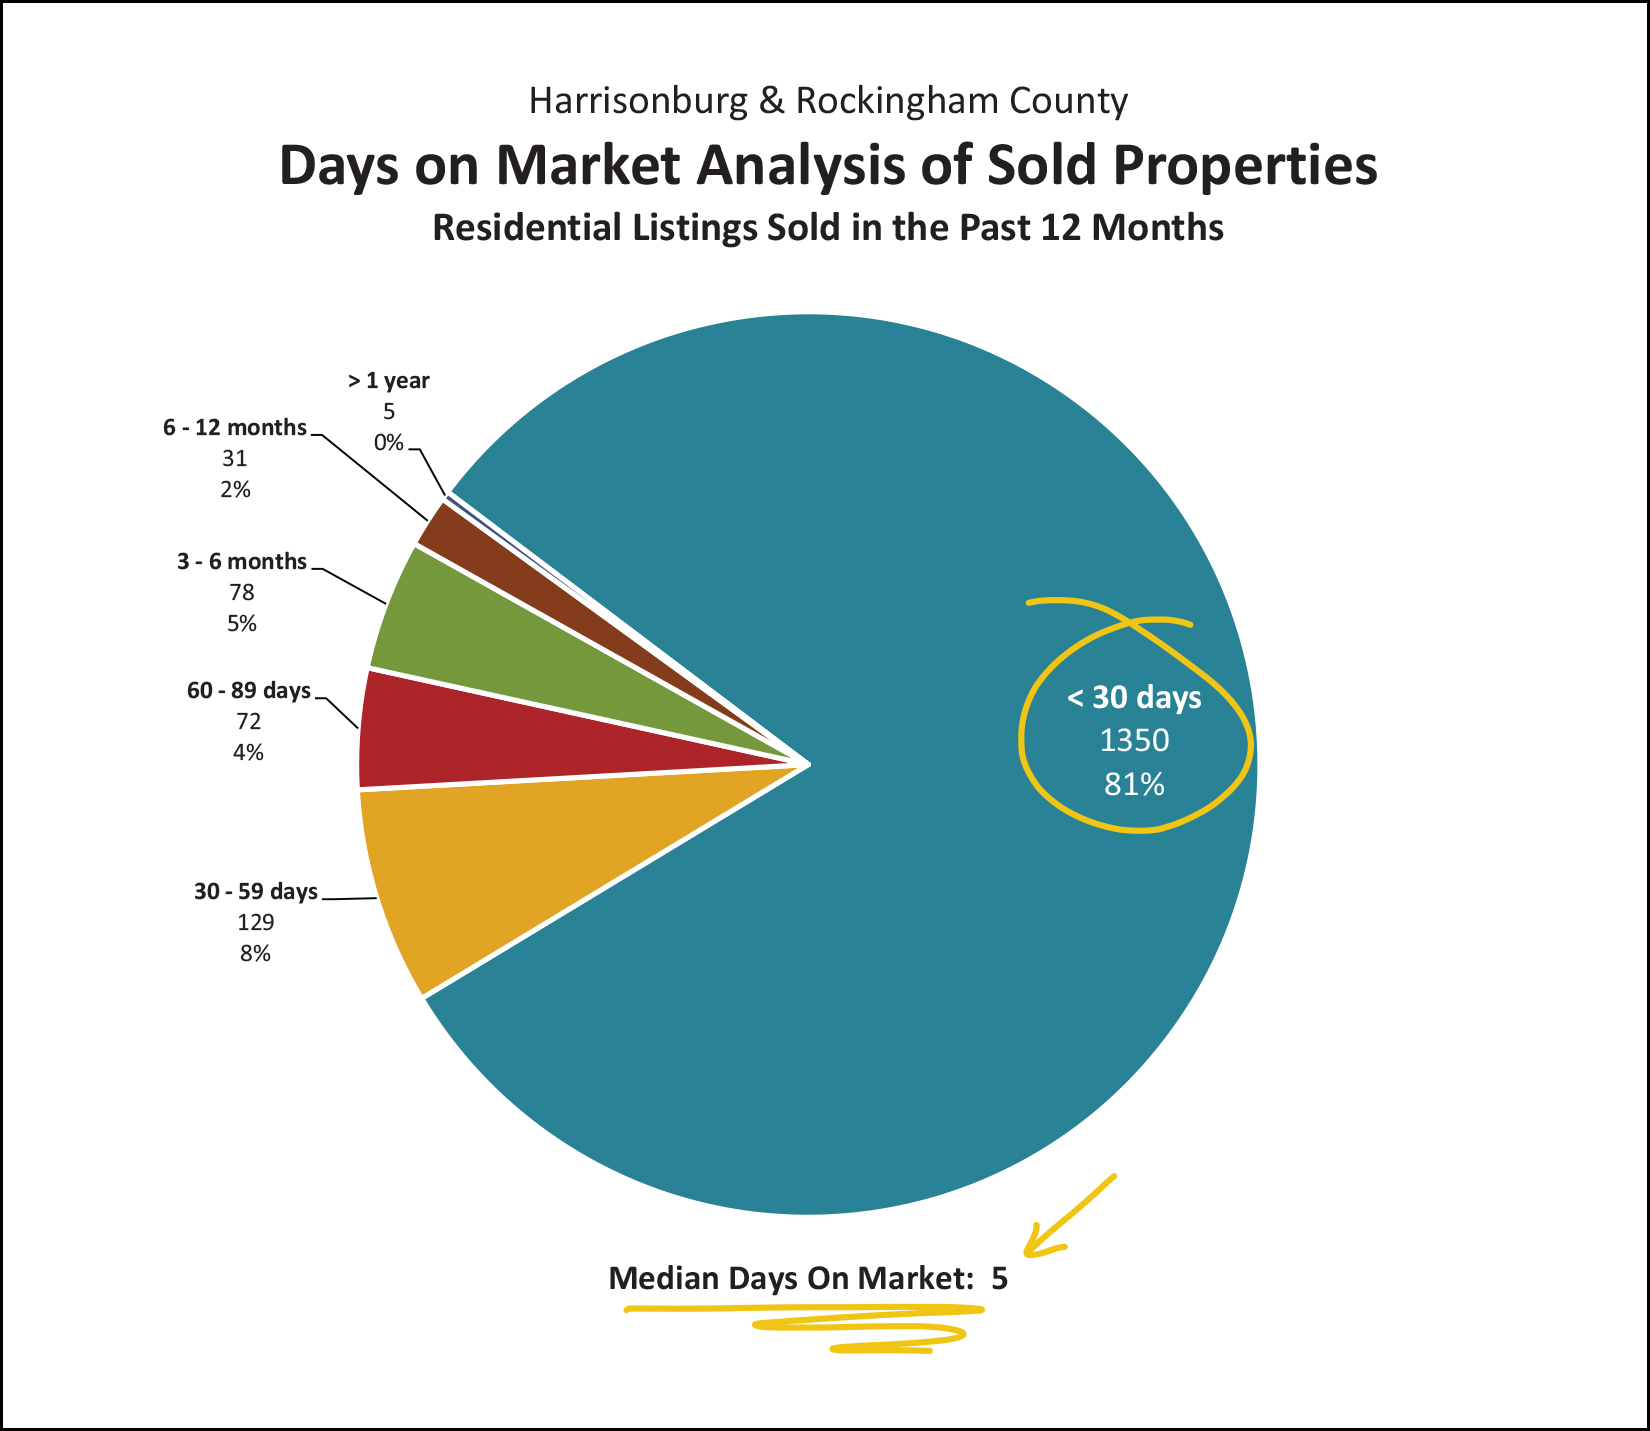 As shown above, 81% of homes that sold in the past year went under contract within 30 days of being listed for sale. Going a bit further, we also see that half of the homes that sold last year went under contract within only FIVE days of being listed for sale given the median of five days on the market. With homes going under contract so quickly, it is not surprising that inventory levels did not manage to increase much through 2021. Here, then, is another visualization of the speed at which homes are going under contract... 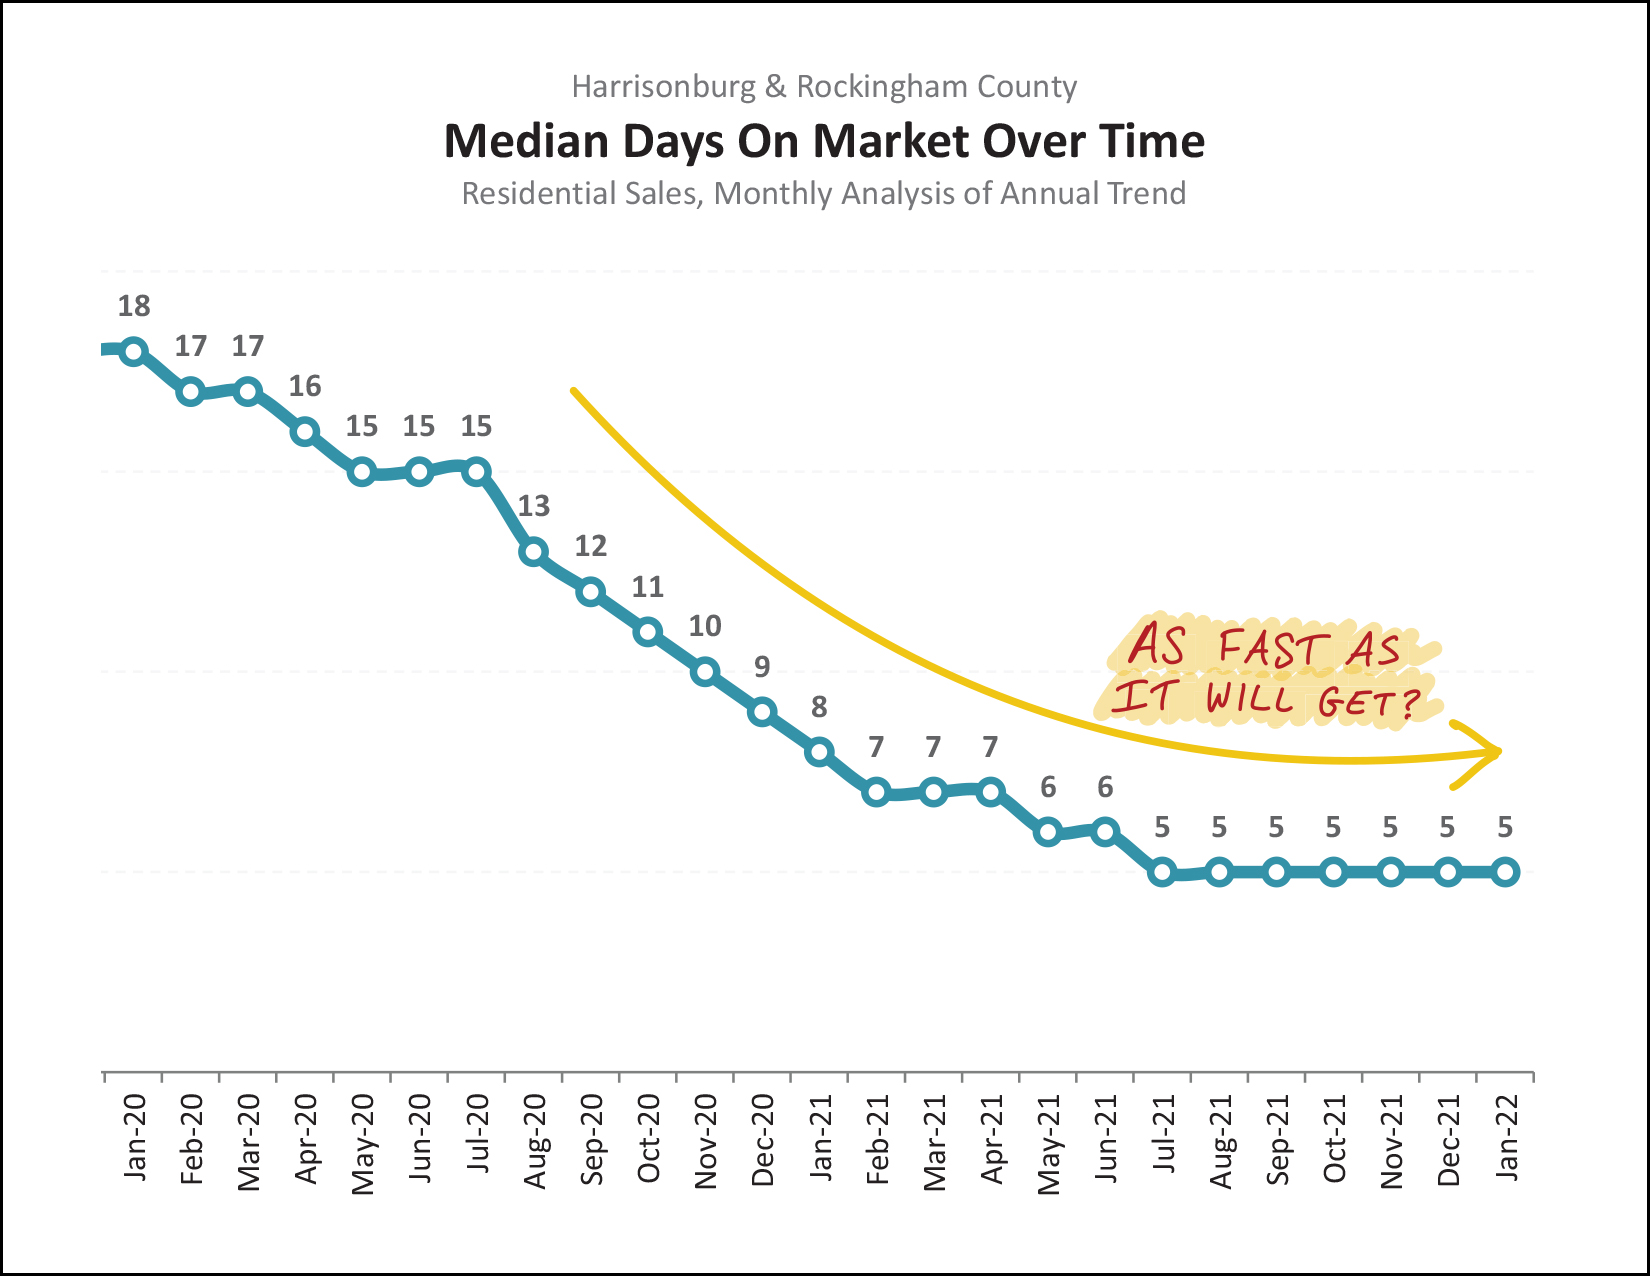 As you can see, two years ago the median days on market was 18 days. That median days on market figure then speedily declined through summer 2021 when it hit just five days on the market. Since that time, it has leveled off at five days on the market, calling into question whether it could actually get any faster. As we continue through 2022 I will be monitoring this trend to see if the market seems to be slowing at all. Thus far, it is not. And, yet another story line to be following in 2022... 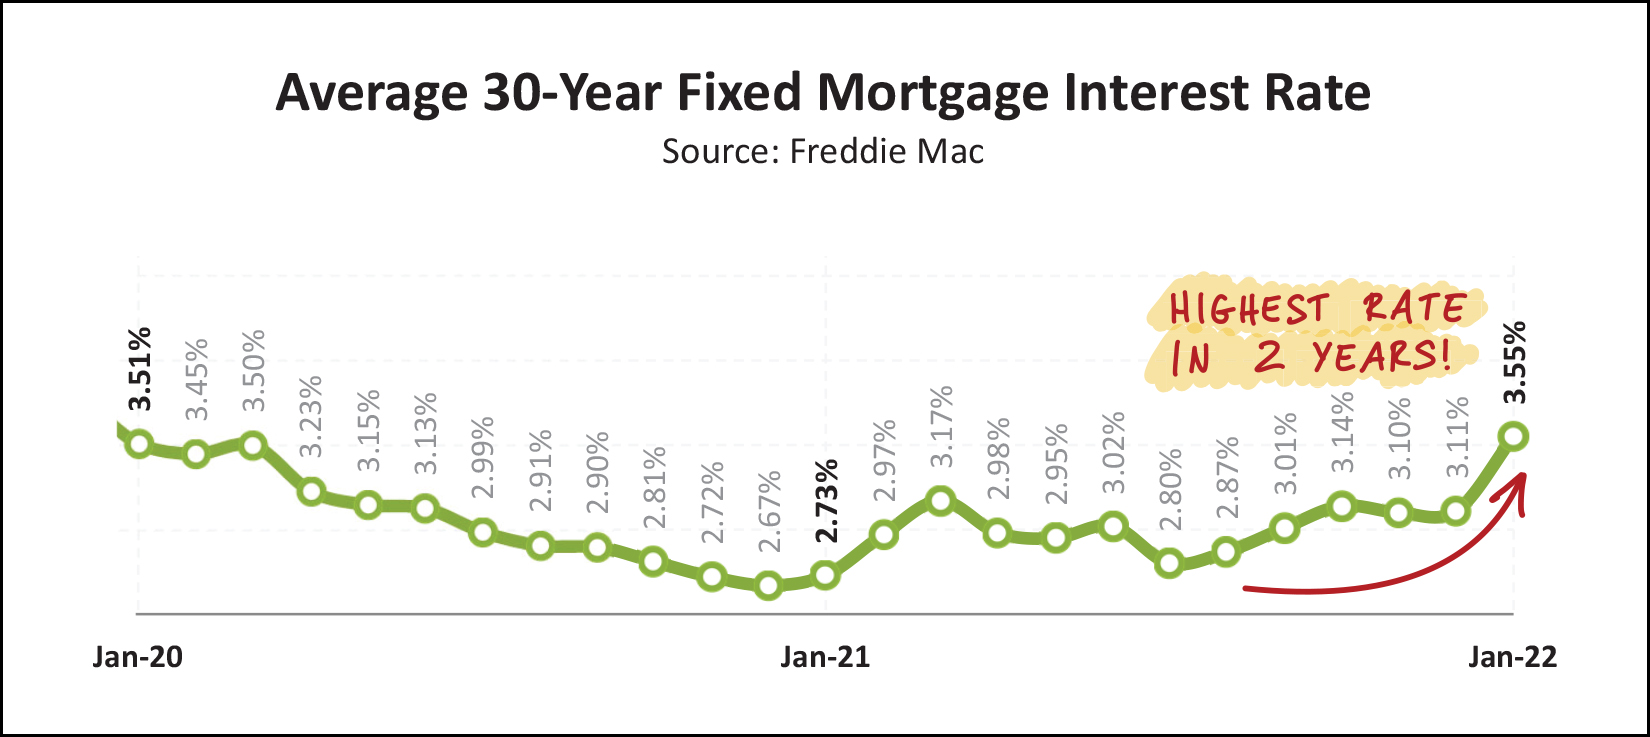 The average 30 year mortgage interest rate hit an all time low in late 2020 of 2.65%. Average rates closed out 2021 just above 3%, but have now climbed, within a month, to above 3.5% and they have continued to climb during February 2022. As rates increase, a buyer's mortgage payment increases depending on how much of a purchase price they are financing. At some point, rising interest rates will affect housing affordability -- for some buyers buying some houses. We will have to continue to observe this trend through 2022 to see if rising interest rates seem to be affecting the local housing market. So, as described above, there are plenty of possible developing trends in our local housing market. Stay tuned through 2022 to see if the market can and will stay just as strong in 2022 as it was in 2021. If so, it will continue to be a thrilling time for home sellers, and a bit of a challenging time for home buyers. If you are planning to buy a home, or sell a home, in 2022 let's connect soon to start talking about the process, the market and your goals and timing. Just reach out by email, phone or text (540-578-0102) and we can set up a time to meet. Until next time, enjoy the beautiful snow while it lasts -- it looks like temperatures will be starting to warm up come Wednesday! P.S. Happy Valentine's Day! | |
200 Home Buyers Paid More Than 5% Over Asking Price For Their Homes In The Past Year |
|
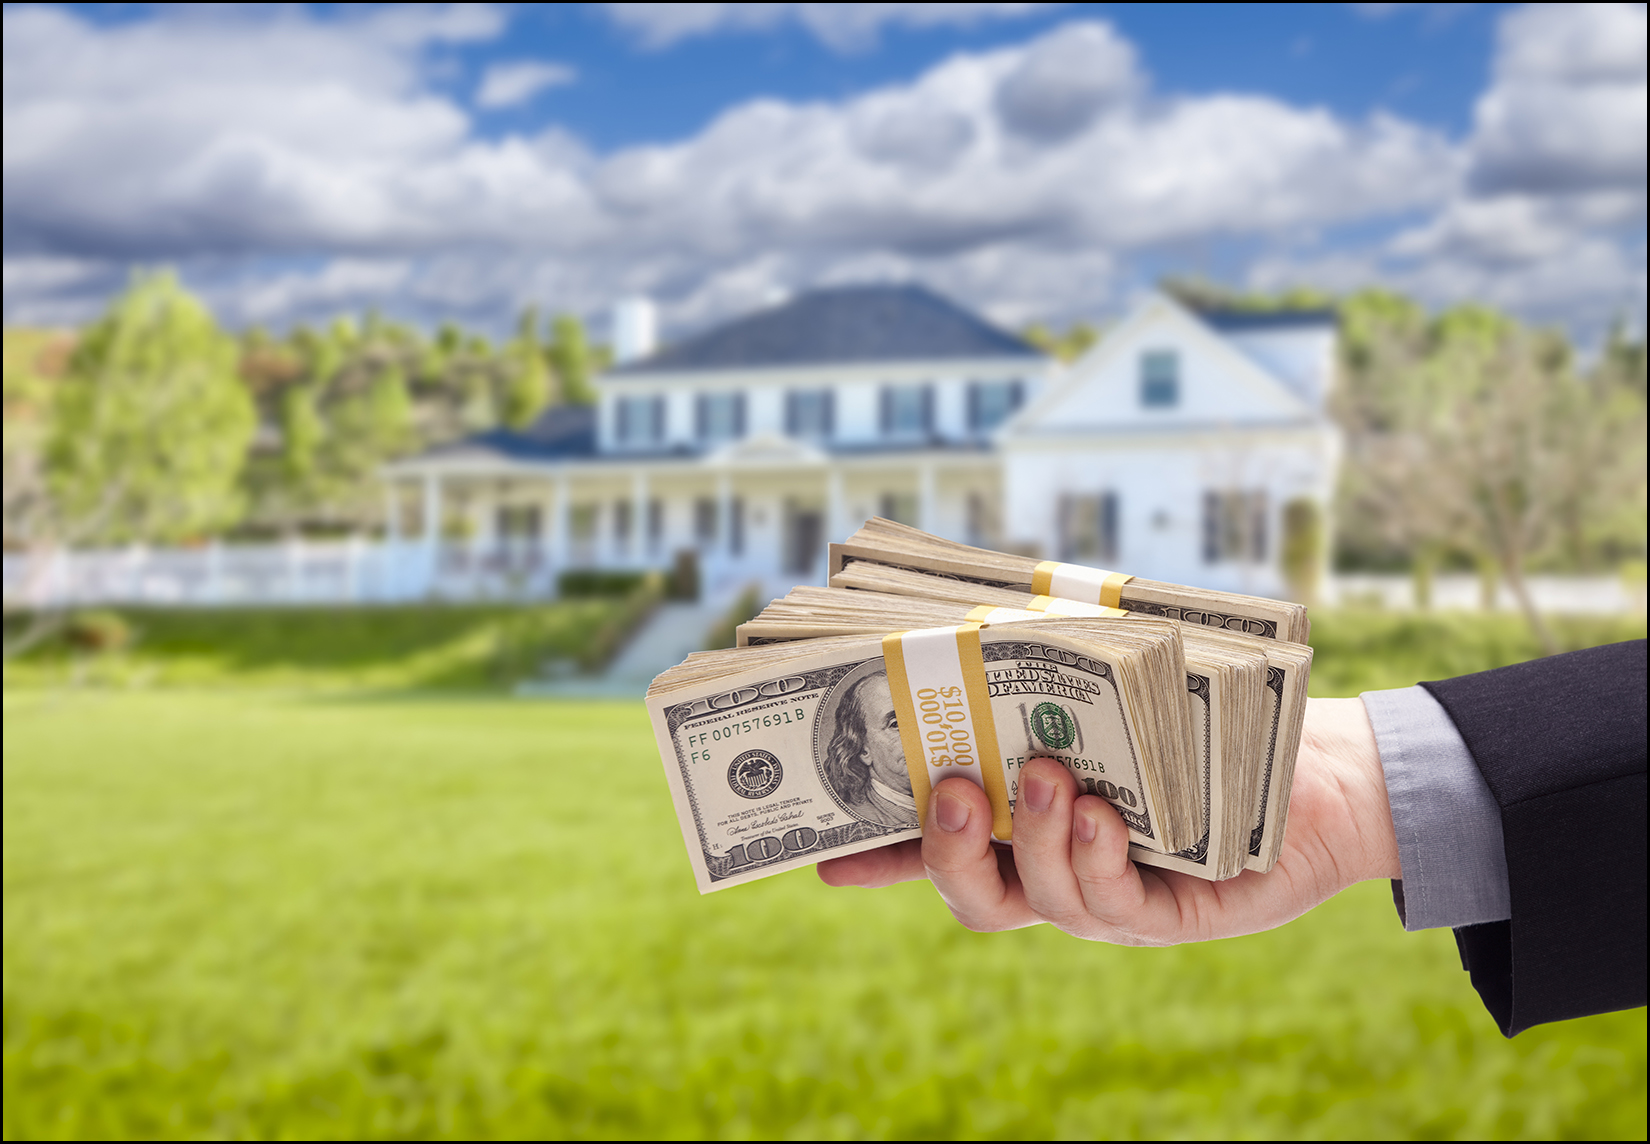 Sometimes, you have to be willing to pay the price to get the house... Over the past year-ish (Feb 7, 2021 - Feb 6, 2022) there have been 1,660 home sales in Harrisonburg and Rockingham County. As noted earlier this week, 73% of buyers paid full price or more for their home -- which is 1,229 of those 1,660 home sales. But going a bit further... 200 buyers paid more than 5% over the asking price for the home they purchased in the past year. Looking just at those 200 transactions where buyers paid more than 5% over the asking price... on average, buyers paid $25,561 over the list price! How does that number strike you? It was much higher than I thought it would be... I guess the guy in the photo above is holding out $40,000 of cash -- slightly higher than the average of $25,561 noted above -- sorry for my illustrative exaggeration. ;-) | |
74% of Homes Sold for Full Price or Higher in the Past 12 Months! |
|
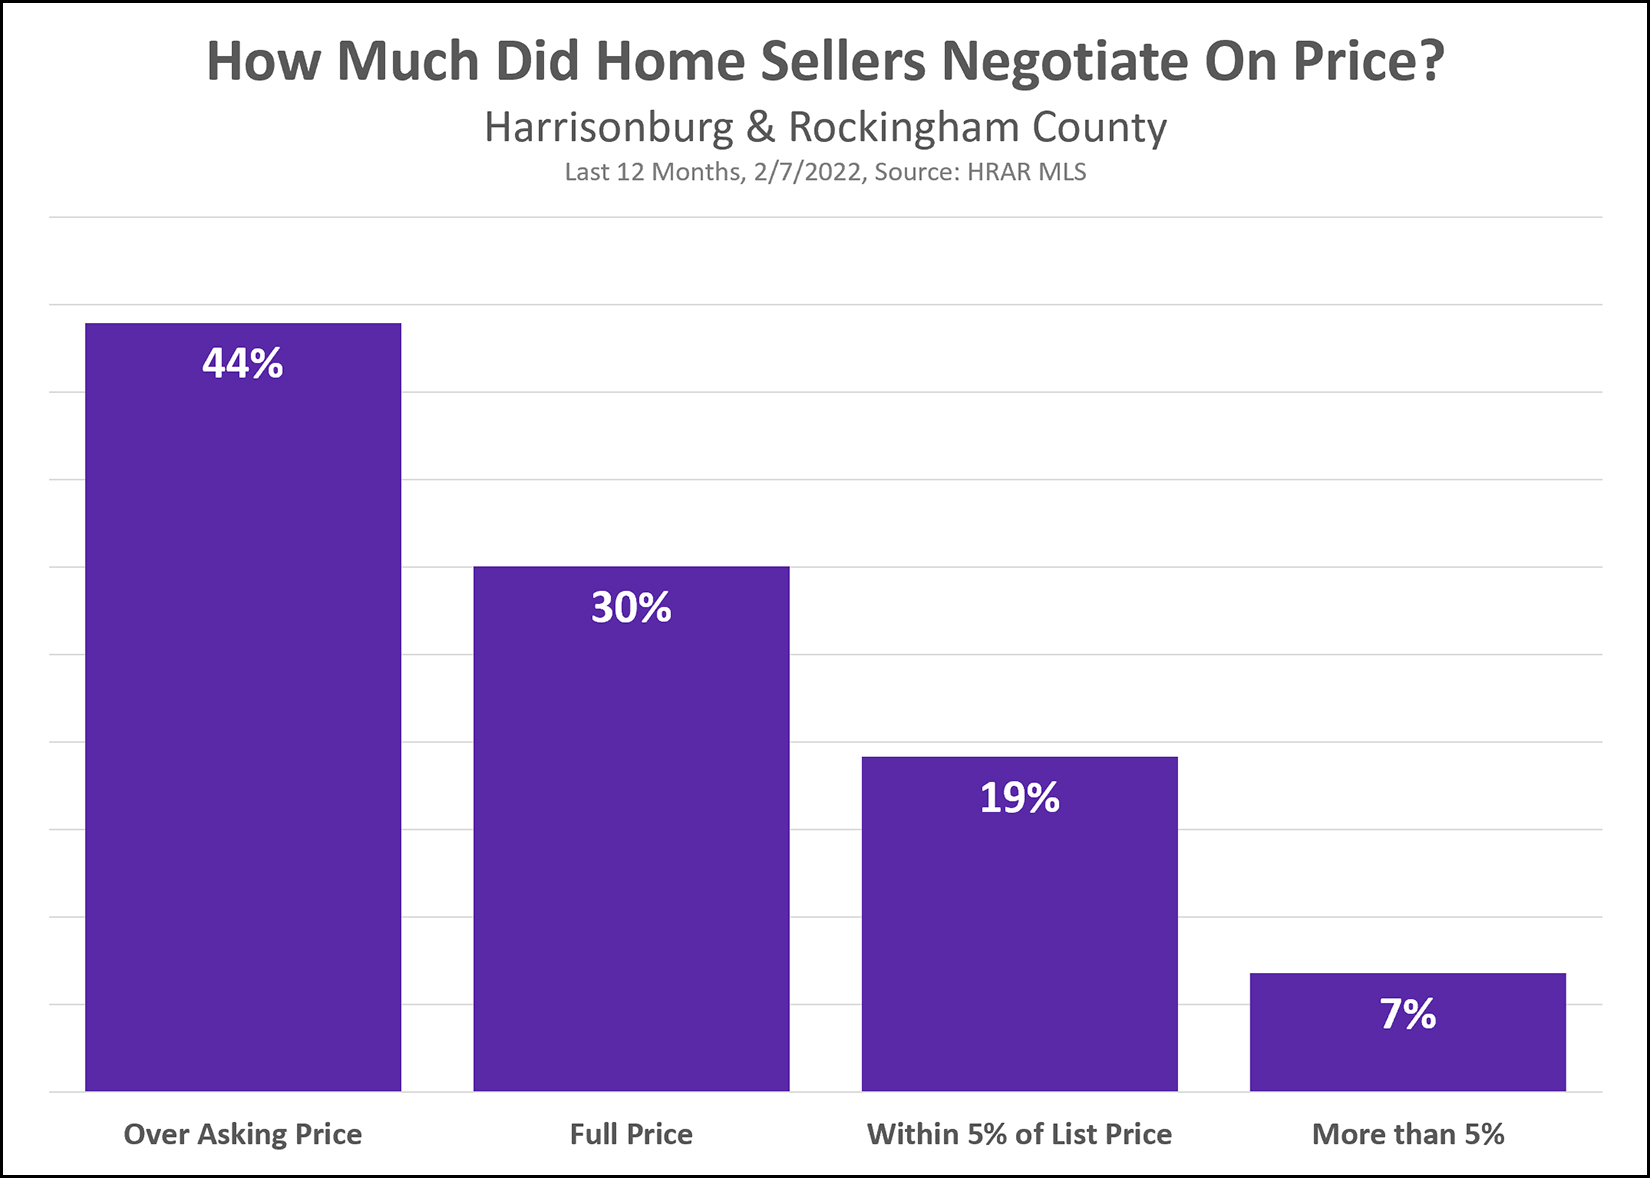 A somewhat shockingly high number of homes sold at or above asking price over the past year...
So, what does that mean for you if you are selling or buying in 2022? SELLERS: If you want to sell for $400K, you likely don't need to list your home for $420K in order to leave yourself room to negotiate down on price. Listing it for $400K will likely do the trick, and might result in the house selling for more than $400K. BUYERS: Understand that you are likely to need to pay full price or higher for the house you plan to buy -- though that needs to be put in the context of the value of the home. Certainly, if a $400K house is listed for sale for $475K then you shouldn't pay full price or higher... Understanding the local real estate market is more important than ever for buyers and sellers in 2022! | |
January 2022 Home Sales, Like the Temperature, A Bit Cooler Than 2020, 2021 |
|
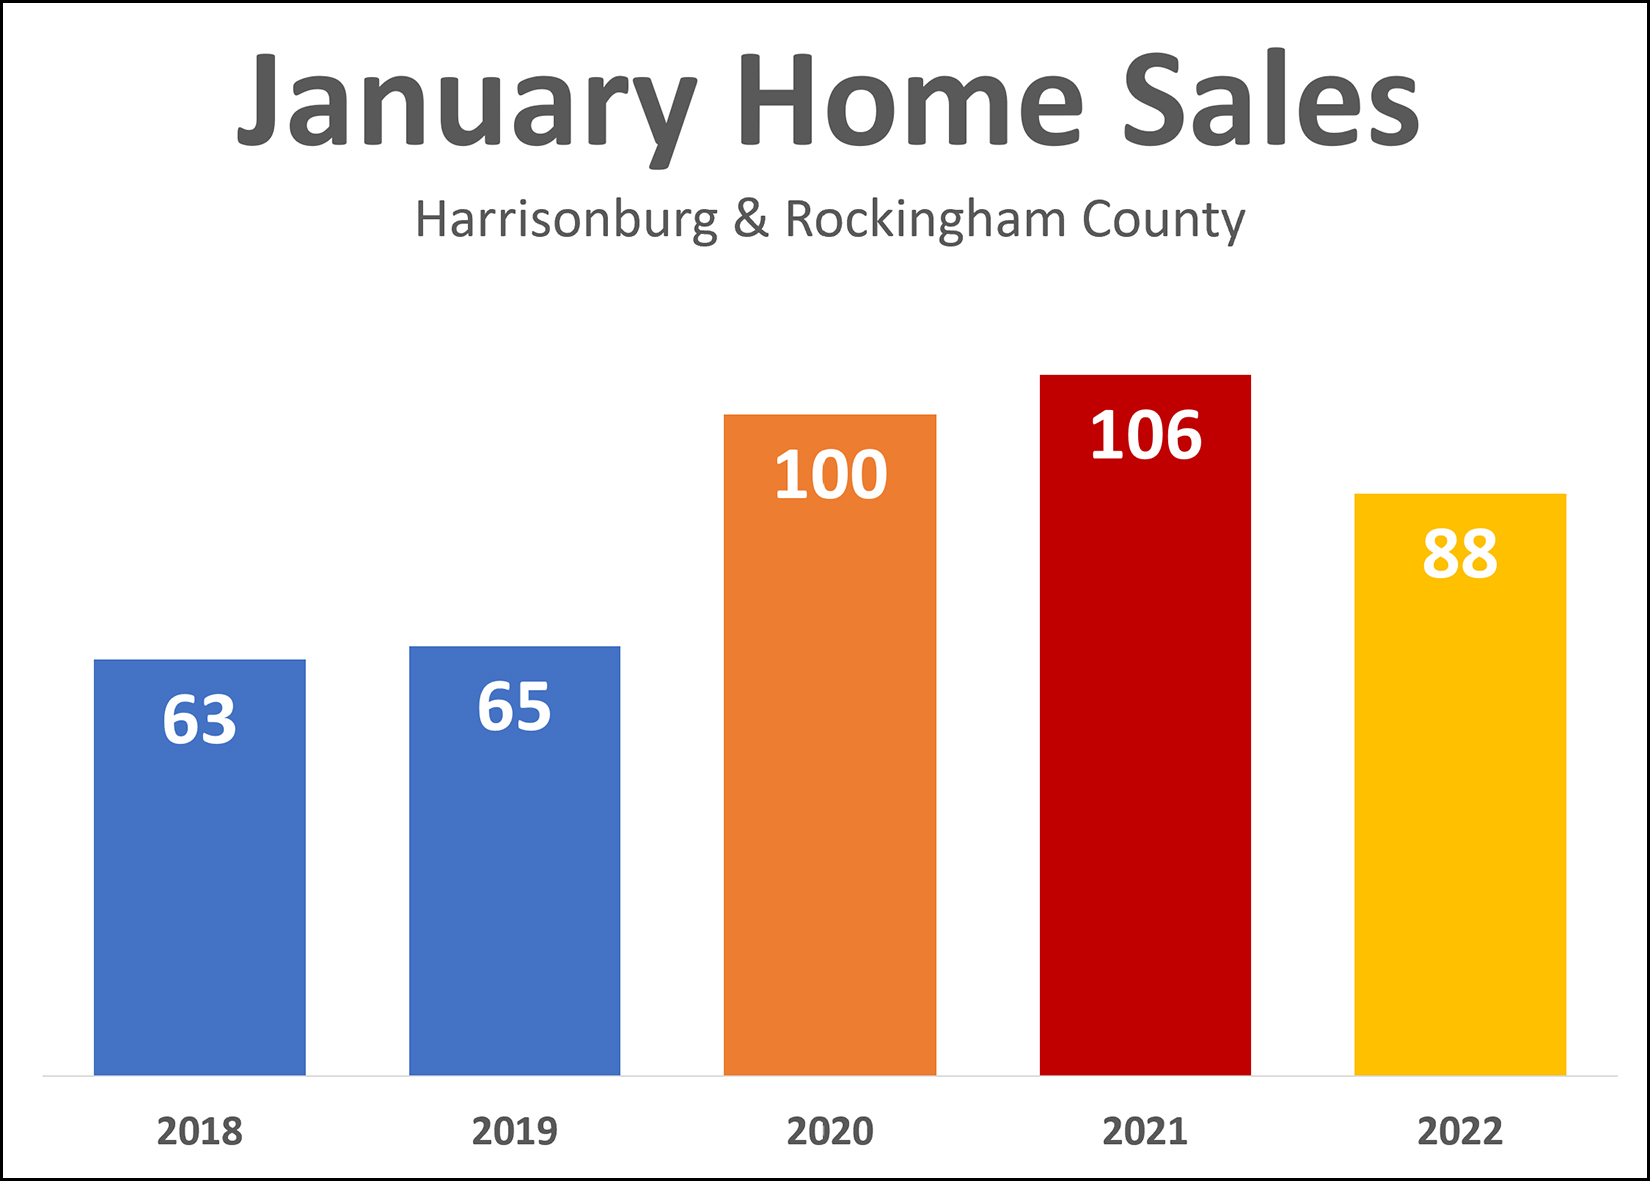 I'm sure a few more January home sales will still show up in the data before I put my market report together, but a first look at January home sales in Harrisonburg and Rockingham County indicates that the pace of home sales cooled a bit (like the temperatures) this January as compared to the last to months of January. Before the COVID surge (of home sales) we were often seeing 60 to 70 home sales in January, but there were more than 100 home sales in Harrisonburg and Rockingham during January of 2020 and 2021! Stay tuned for a full report of January home sales later this month, but it seems they will have dropped off a bit from last January. | |
Will Home Prices Drop As Mortgage Interest Rates Rise? |
|
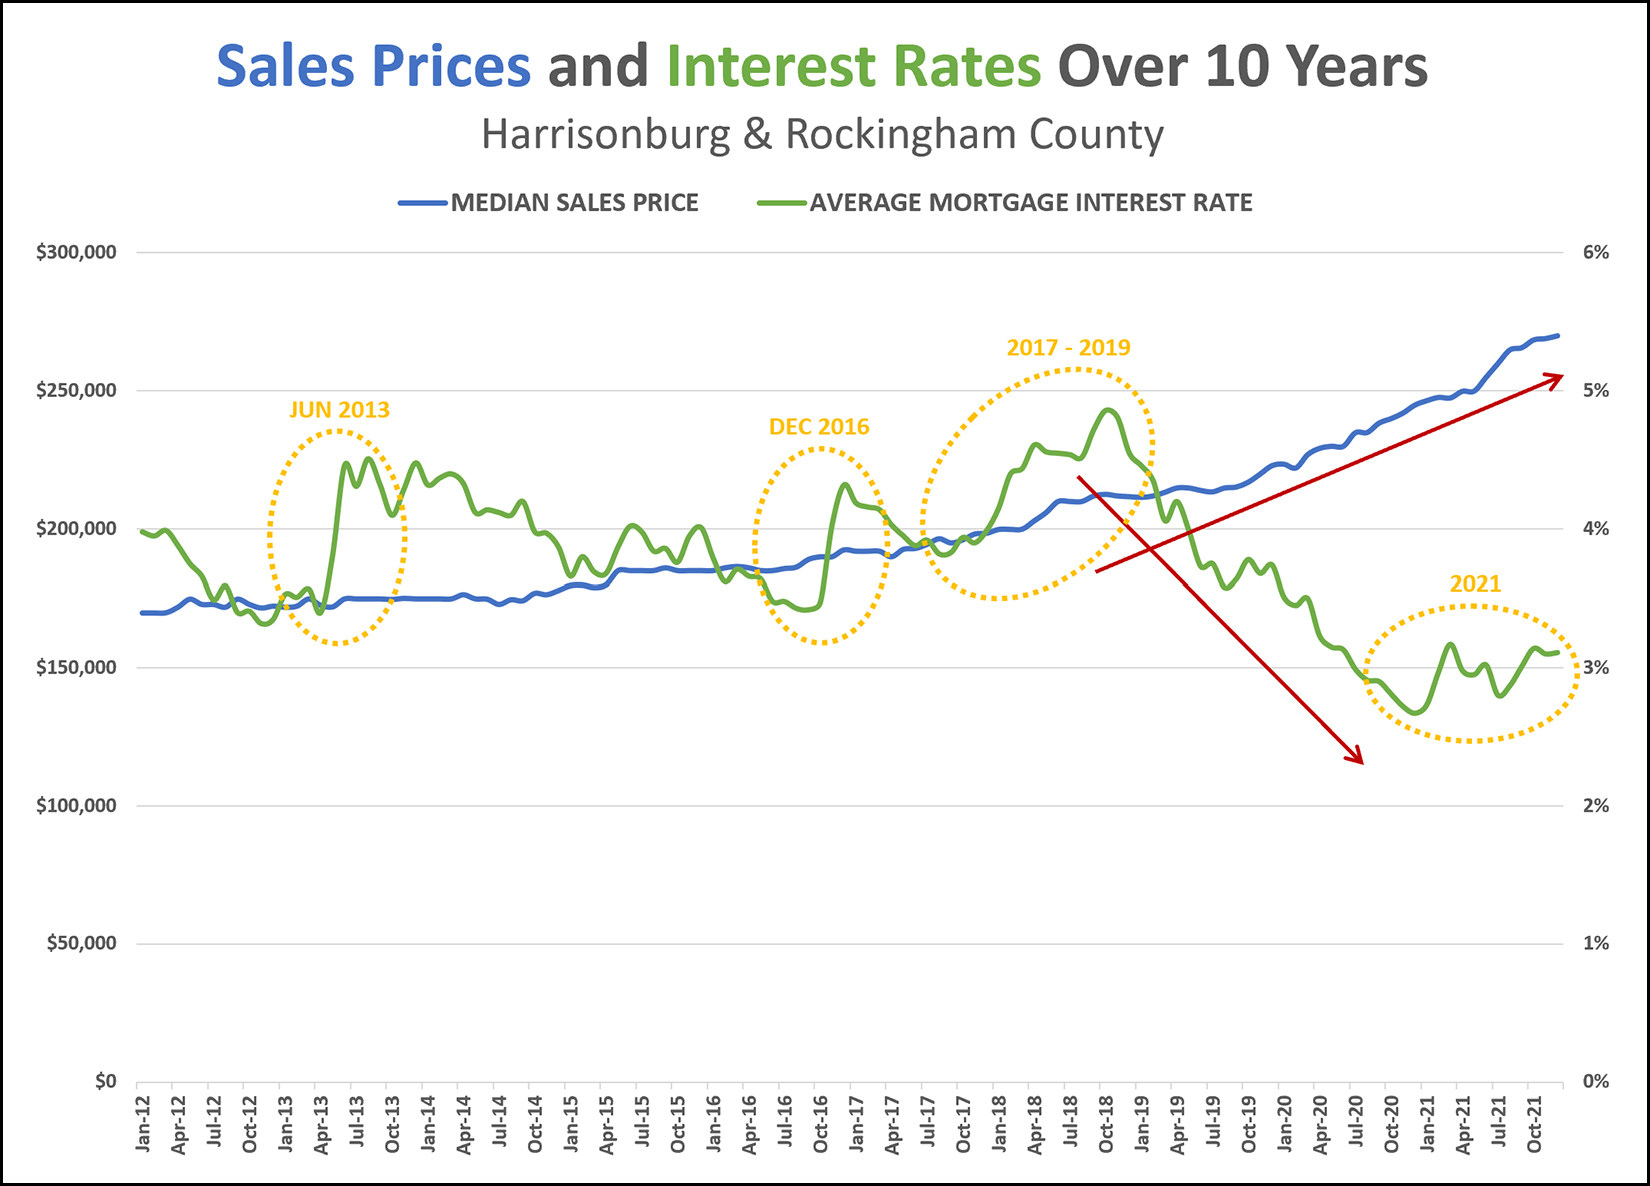 Question... Will Home Prices Drop As Mortgage Interest Rates Rise? Short Answer... I don't think so Long Answer... Above you'll find a graph showing the median sales price in Harrisonburg and Rockingham County over the past ten years, shown in blue, and the average mortgage interest rate during the same timeframe, shown in green. A few things to point out... [1] Yes, it is accurate to observe (see the red arrows) that while the median sales price was increasing rather quickly over the past four years, the the average mortgage interest rate was also dropping steadily. Did prices only rise because rates dropped? No, that does not seem likely at all. Did prices continue to rise as much as they did at least partially because rates were so low? Yes, that seems relatively likely. [2] Interest rates rose sharply in June 2013 and December 2016 (see the first two yellow circles) and sales prices did not start declining -- though, those increases in rates were followed by prolonged periods of declining interest rates. [3] Interest rates rose steadily (!) between mid-2017 and early 2019 (see the third yellow circle) and sales prices did not decline. [4] Interest rates started rising, and falling, and rising, and falling through pretty much all of 2021 (see the fourth yellow circle) and prices kept right on climbing. So... as we head into 2022 and as we start to see mortgage interest rates rising... will home prices decline? It seems unlikely that an increase in mortgage interest rates, alone, would cause home prices to decline. Yes, it is true that a buyer's potential mortgage payment will increase with higher interest rates, so that might reduce their buying capabilities - but plenty of home buyers, in this area, these days, seem to be buying below the top of what they could afford to buy -- so slightly higher mortgage payments may not affect them as much as we'd think. That was a lot of thoughts -- about a lot of numbers -- if you have thoughts of your own, feel free to email me as I welcome a variety of opinions and perspectives! | |
2021 Harrisonburg Area Home Sales Were Amazingly High, But Not Quite Record Breaking! |
|
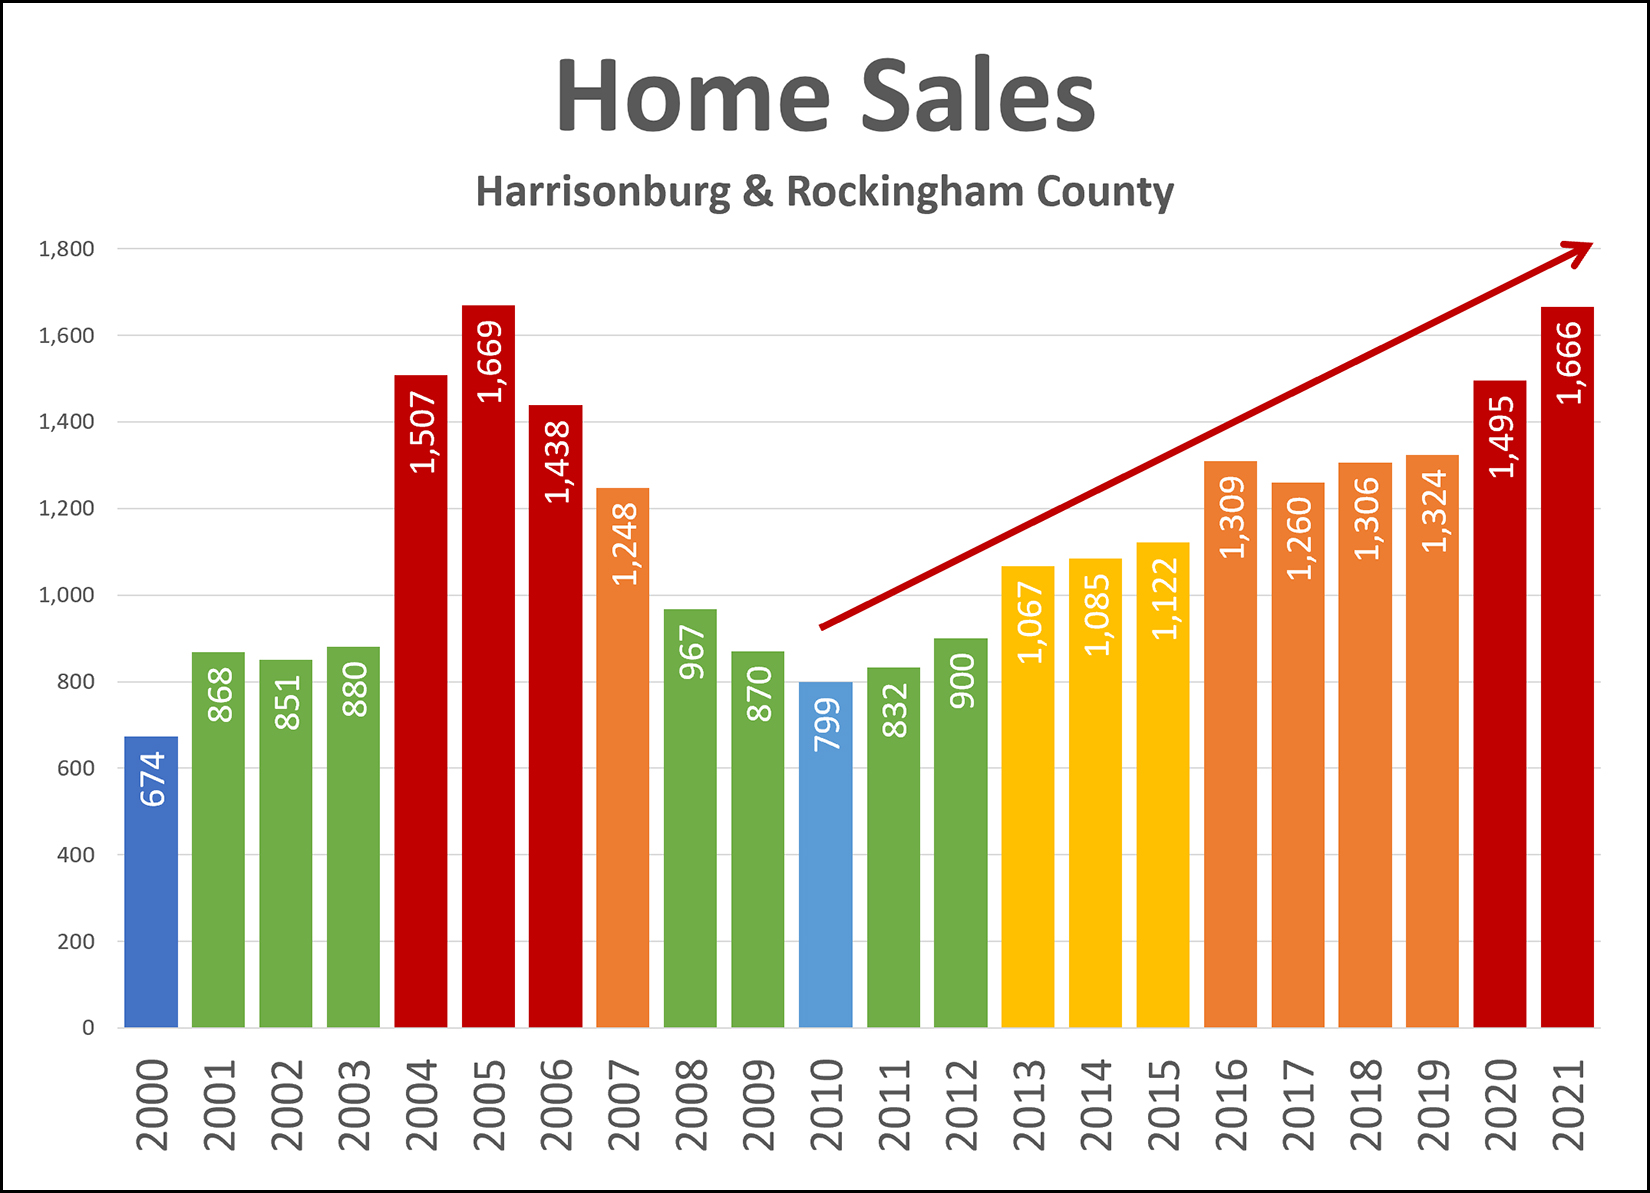 Nice try, 2021, but you didn't quite set a new record after all... Home sales have been on a roll for the past decade, increasing in pace almost every year between 2010 and 2021, and more than doubling in that timeframe. Way back in 2010 there were only 799 home sales in Harrisonburg and Rockingham County, and last year (2021) there were 1,666 home sales! But... that shocking 1,666 sales in a year was not quite a record. :-) Back in 2005, there were... 1,669 home sales! So, nice try, 2021... should have tried just a little bit harder. Will we see an actual all time record in 2022? Could we really see 1,670 home sales (or more) in Harrisonburg and Rockingham County? Stay tuned to find out. ;-) | |
Wow! Yes, You Read That Correctly, Local Home Prices Increased 40% In Five Years |
|
 The median sales price five years ago (2016) was $192,500. Last year, five years later, it was $270,000. That's a 40% increase in the median sales price over five years! A variety of thoughts come to mind as a result...
| |
Two Thirds of Buyers Purchased Single Family Homes Last Year in Harrisonburg, Rockingham County |
|
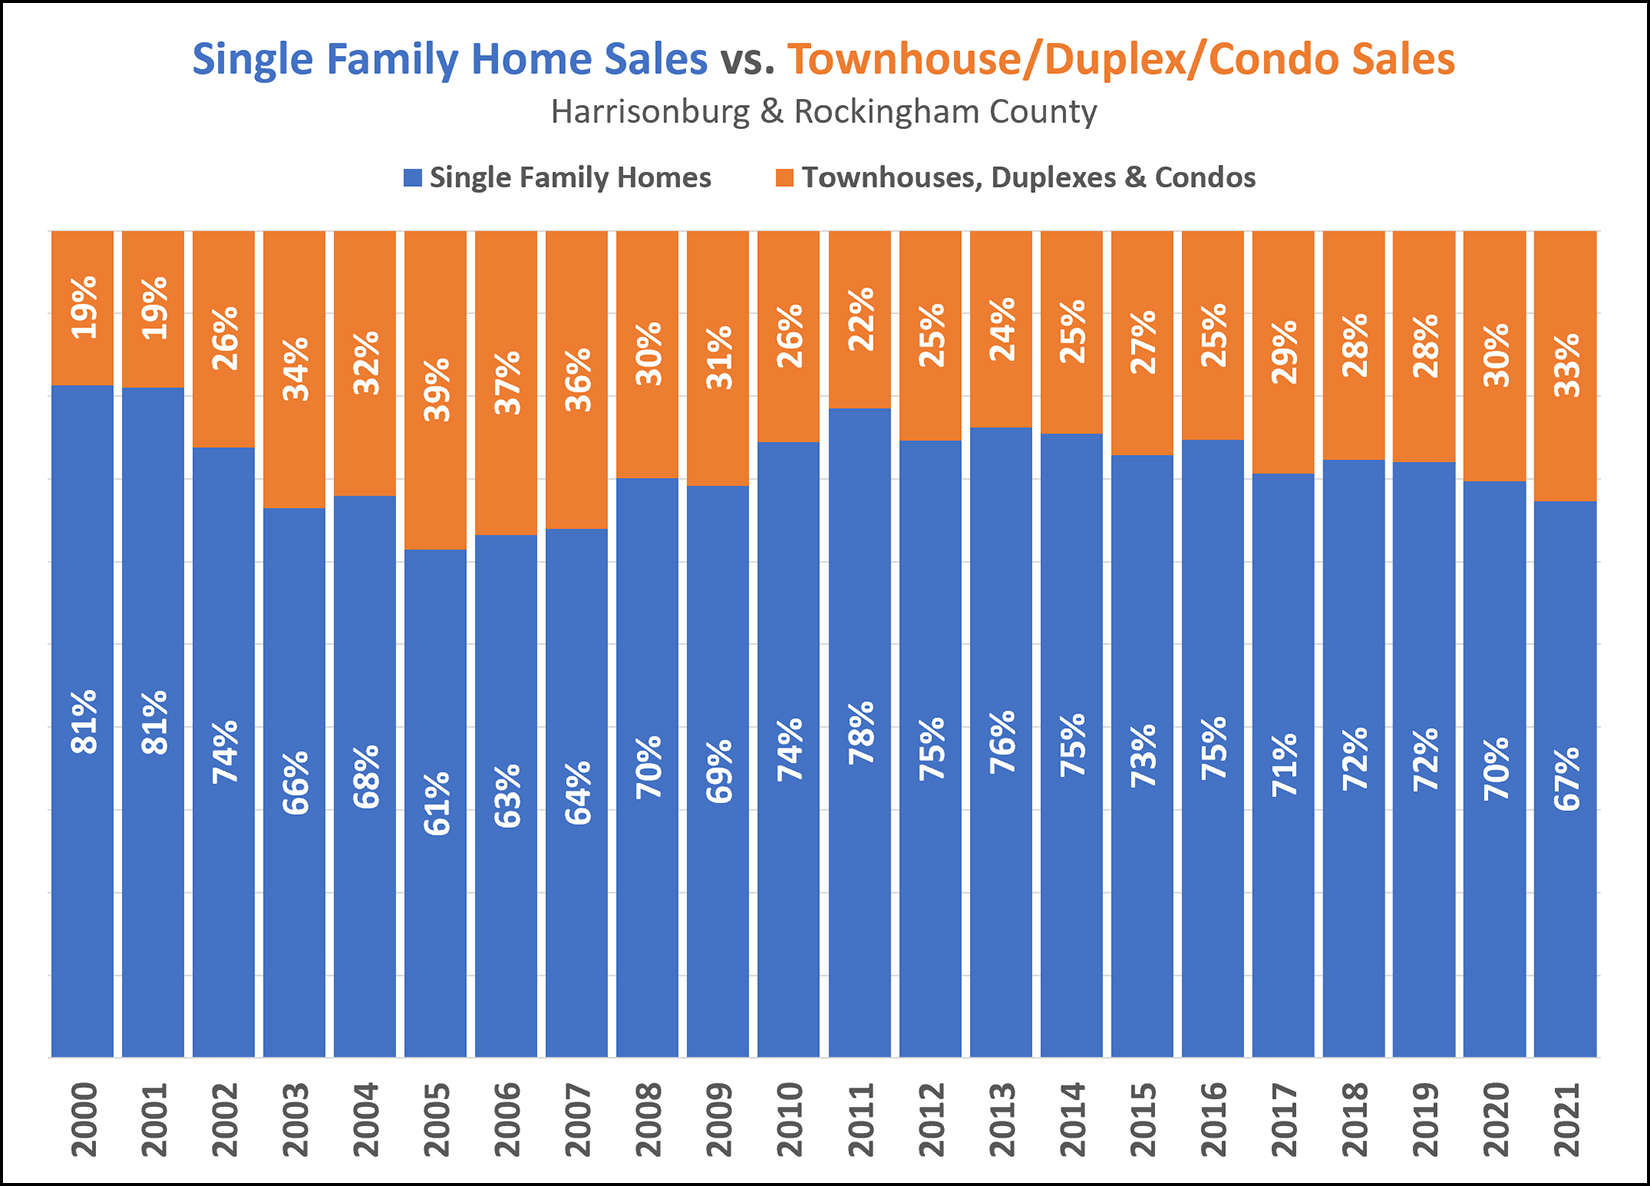 Last year (2021) two thirds of buyers purchased detached single family homes in Harrisonburg and Rockingham County. The other third of home buyers bought townhouses, duplexes or condos. It's interesting to see how this breakdown between detached and attached homes has fluctuated over the years. Way back in 2000 and 2001 four out of five buyers (81%) were buying detached homes. 2005, 2006 and 2007 were the years with the highest proportional share of home sales falling into the attached categories. Lots of townhouses were being built in that timeframe in many new (at the time) townhouse developments in the City of Harrisonburg. Now, we are seeing townhouses (and other attached homes) gaining more momentum again as their share of the market has increased from 72% to 67% between 2019 and 2021. Finally, it is interesting to see how this breakdown differs between the City and County for 2021 home sales... City AND County = 67% single family homes (33% not) City = 49% single family homes (51% not) County = 75% single family homes (25% not) Yes, you read that correctly, more attached homes (townhomes, duplexes, condos) than single family homes sold in the City of Harrisonburg last year. | |
2021 Year In Review in the Harrisonburg Area Real Estate Market |
|
 Happy New Year, Friends! I hope you had a delightful, relaxing, fun and healthy holiday season and New Year celebration. Today I am coming to you with a "year in review" of the Harrisonburg area real estate market in 2021. Before we get started, though, I'll introduce you to the sponsor of this month's market update. ;-) This month's market update is brought to you by... cookies!!!  A delicious part of our family's holiday celebration is the annual Christmas Cookie Contest and this year there were some fantastic entries! The photo above actually only shows six of the ten cookies from this year's 19th Annual Christmas Cookie Contest - and it does not show the winning cookie - congrats, Aiden! As you reflect back on your holiday celebrations, I hope you are reminded (as I am) of plenty of delicious food, and even better... wonderful, cherished time with family near and far! Now, though, let's dive into some real estate data to better understand how exactly the year wrapped up in the Harrisonburg and Rockingham County real estate market. For those that like to check out every graph, even those not in this narrative summary, download the PDF with all the graphs here. 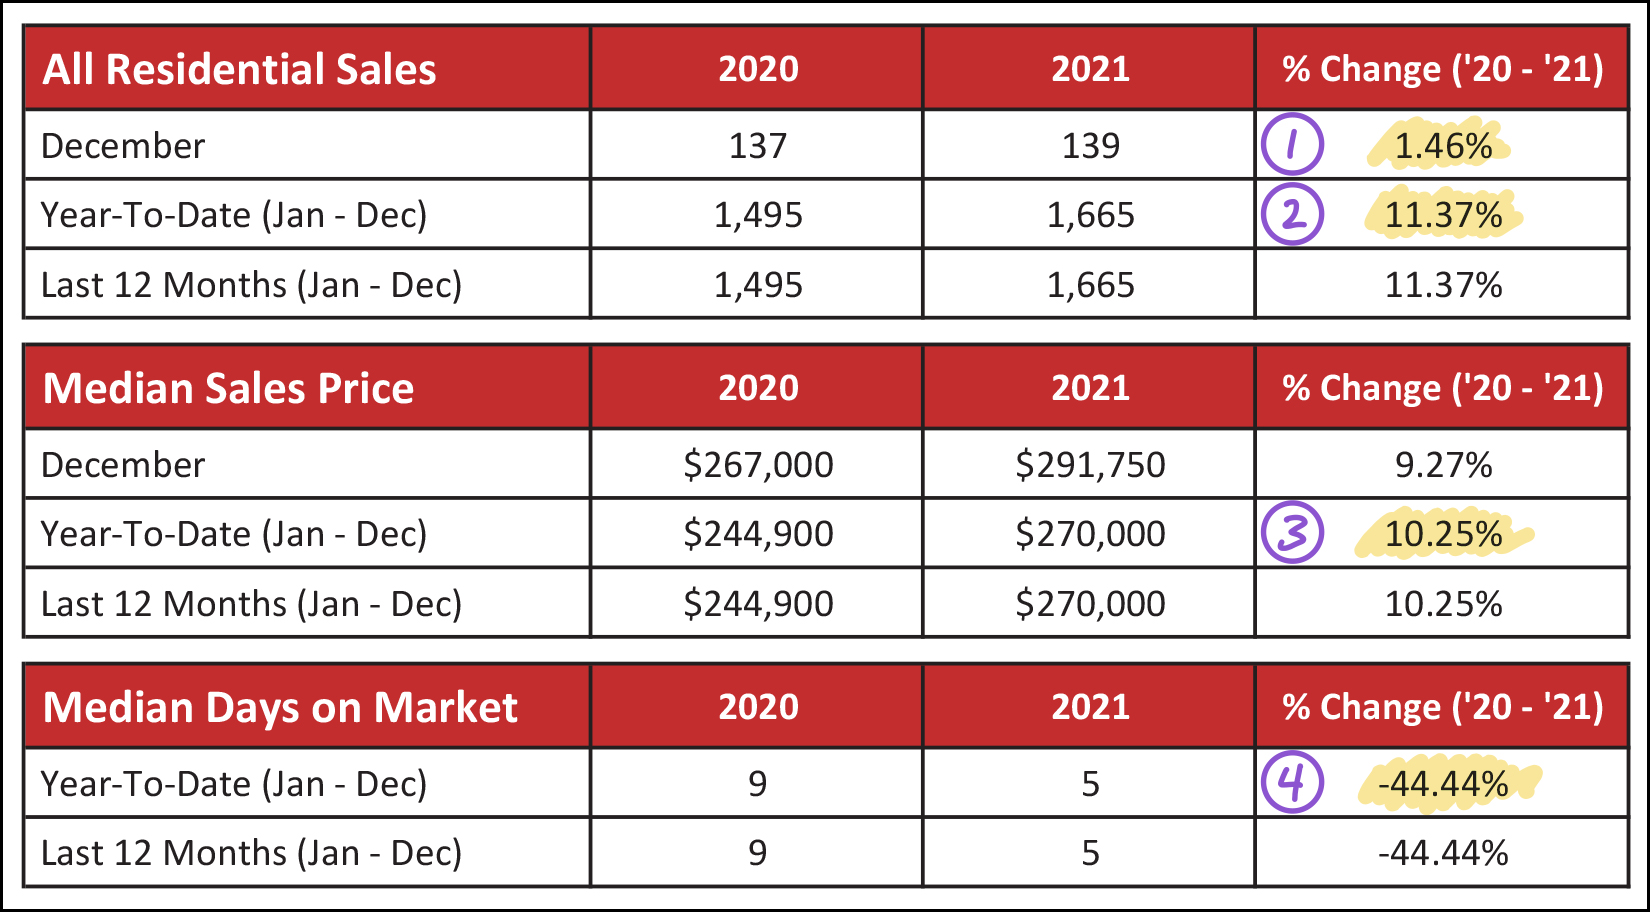 The chart above quickly gets us into the big picture for our real estate market. First (1) you'll see that home sales ticked upwards a bit in December with a 1.46% increase over December 2020. But the numbers you've all been waiting for are shown as 2, 3 and 4 above... Home Sales Increased 11% in 2021. Sales Prices Increased 10% in 2021. Time On The Market Decreased 44% in 2021. So, a rather strong year for our local housing market! It was a fast paced market, with homes usually going under contract in less than a week. We saw more sales than in 2020, and prices were (as noted above) 10% higher in 2021 than 2020. I do think, however, that slicing and dicing this overall data a bit can be helpful. Let's first break it down by detached vs. attached, and then by City vs. County. Here is a summary of 2021 sales of detached homes...  As shown above, there was an almost 8% increase in the pace of detached home sales in Harrisonburg and Rockingham County in 2021. This increase (8%) is slightly less than the overall market-wide 11% increase, meaning that a greater share of the increase home sales were of attached homes. The median sales price of detached homes in 2021 was $291,500... up 8% over the median of $269,000 in 2020. A few thoughts here... first, the 8% increase in the median sales price of detached homes is less than the overall market-wide 10% increase, meaning that the sales prices of attached homes must have *really* increased in 2021. Stay tuned for that. Secondly, it is pretty wild to see the median sales price of a detached home now approaching $300,000. That means that in 2021, only slightly fewer than half of home sales were over $300,000! Now, then, about those attached homes, which includes townhouses, duplexes and condos...  Indeed, as predicted above... The pace of attached home sales increased more than that of detached home sales and more than the market as a whole. There were 20% more detached home sales in 2021 than we saw in 2020! The increase in the median sales price of these attached homes also increased much more in 2021 than the median price of detached homes. The median sales price of an attached home increased 17% from $193,000 to $225,000 in all of Harrisonburg and Rockingham County! So, half of buyers paid more than $225K for a duplex, townhouse or condo in 2021! Now, looking a bit more closely at the City vs. the County... 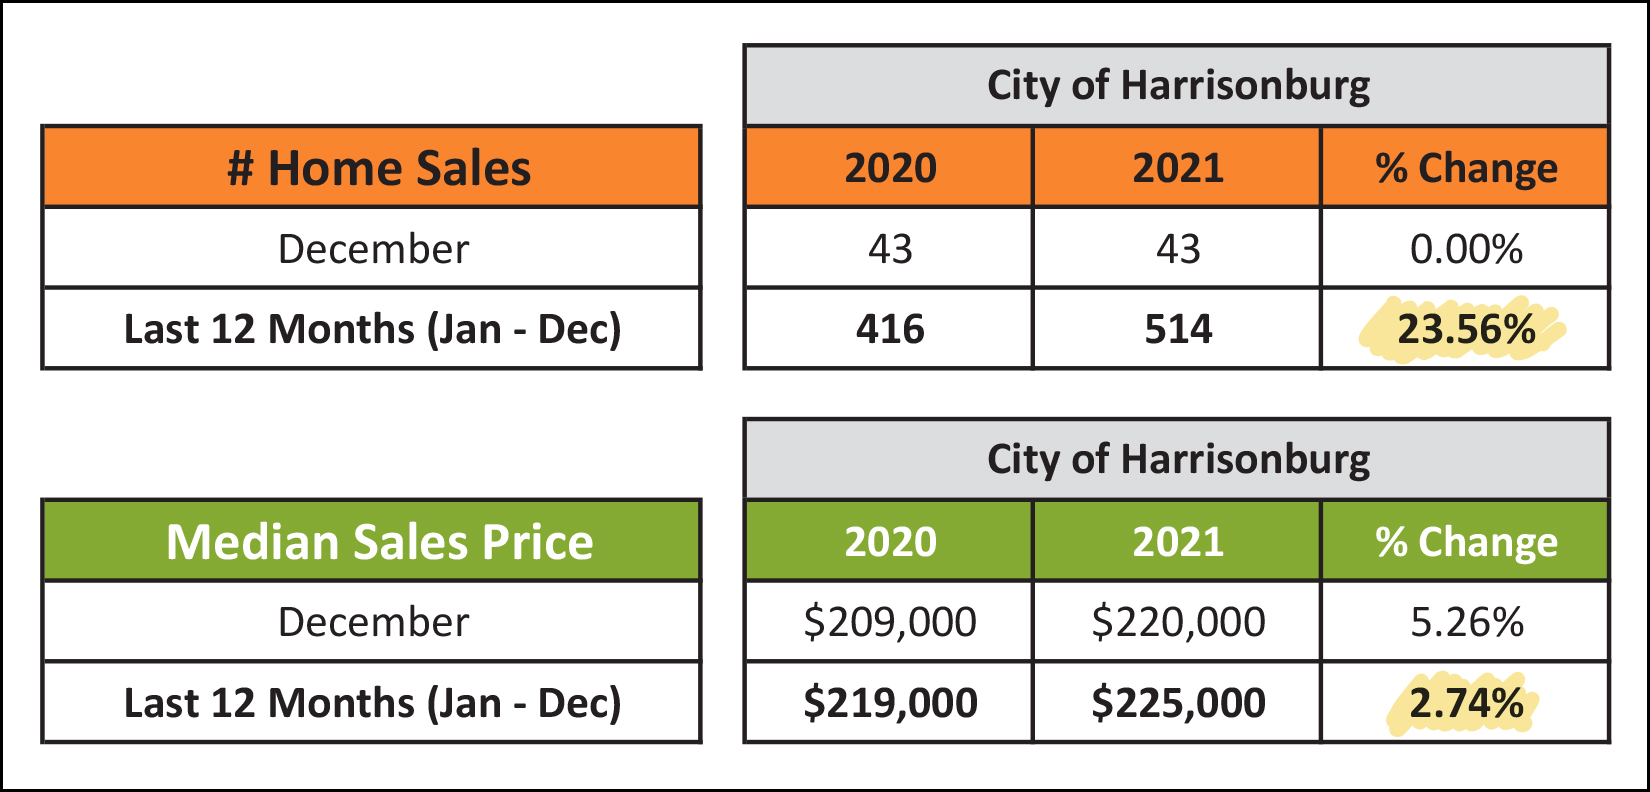 Despite seeing very few homes on the market for sale in the City at any given time through most of 2021, we managed to see a rather large (!) increase in the number of City homes selling in 2021. After only seeing 416 City home sales take place in 2020, there were 24% more in 2021... with a total of 514 home sales. Despite this significant increase in the number of City homes that sold in 2021, we actually only saw a 3% increase in their median sales price. The median sales price of City homes selling in 2021 was only $225,000. This is somewhat striking in comparison to the market-wide (City + County) median sales price of $270,000. So, then, how about the County? 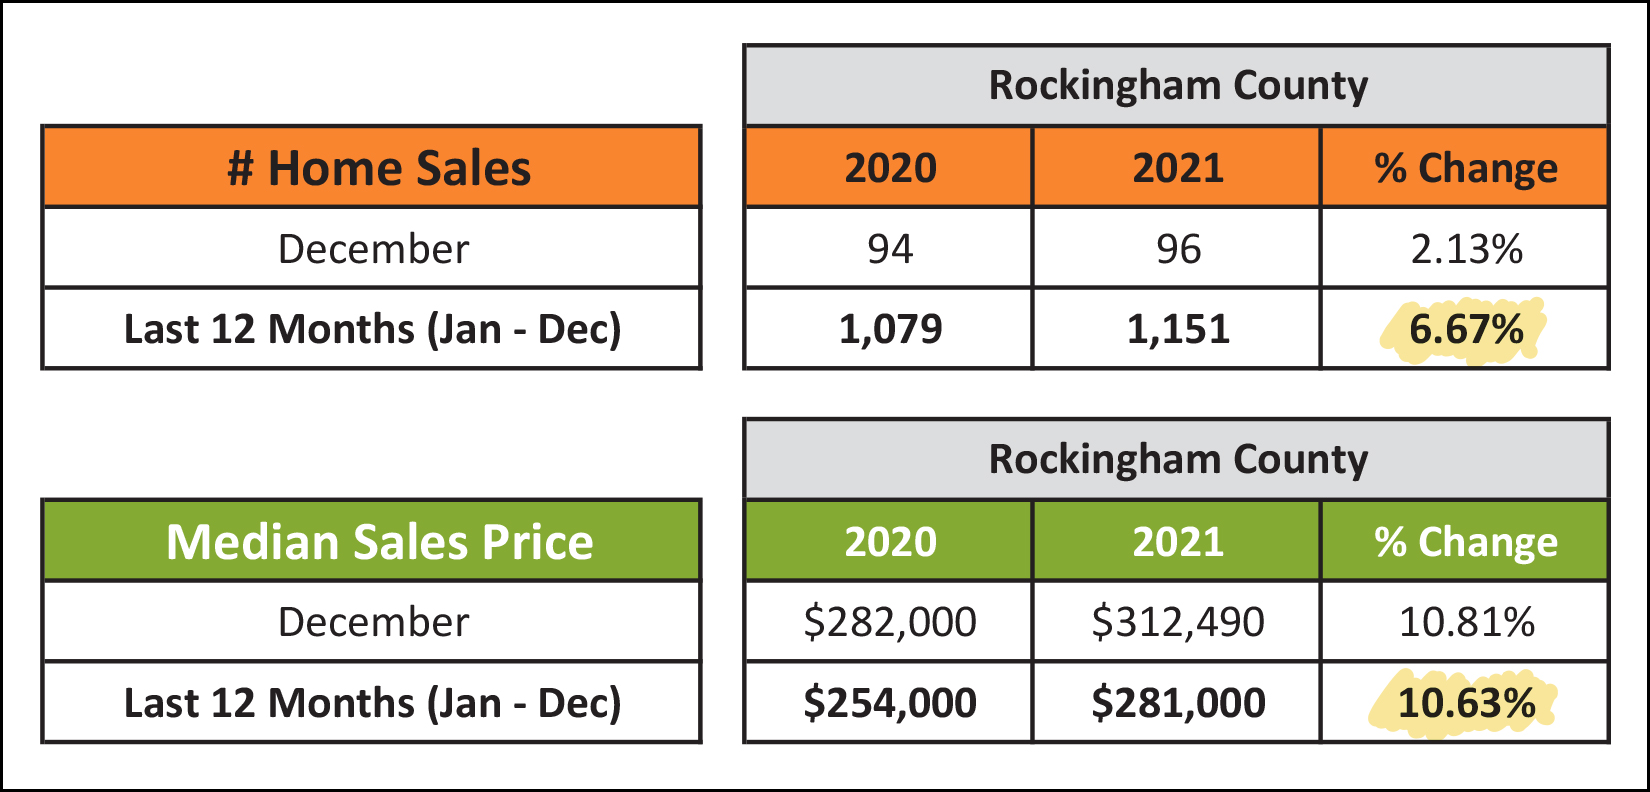 Over the past year we actually saw a smaller increase in the pace of home sales, with only 7% more home sales in 2021 than in 2020. The median sales price of those County homes increased quite a bit more, though, with an 11% increase in the median sales price -- which moved up from $254,000 in 2020 to $281,000 in 2021! So, the pace of home sales increased more in the City than the County -- but the median price of those home sales was higher in the County than the City -- and that median price increased more, year-over-year, in the County than the City. Do what you will with that newfound comparative understanding of our local housing market. ;-) Next, looking at one of my favorite monthly graphs, the pace of monthly sales seemed to be just as chaotic as many of the other constant changes in our lives in 2021... 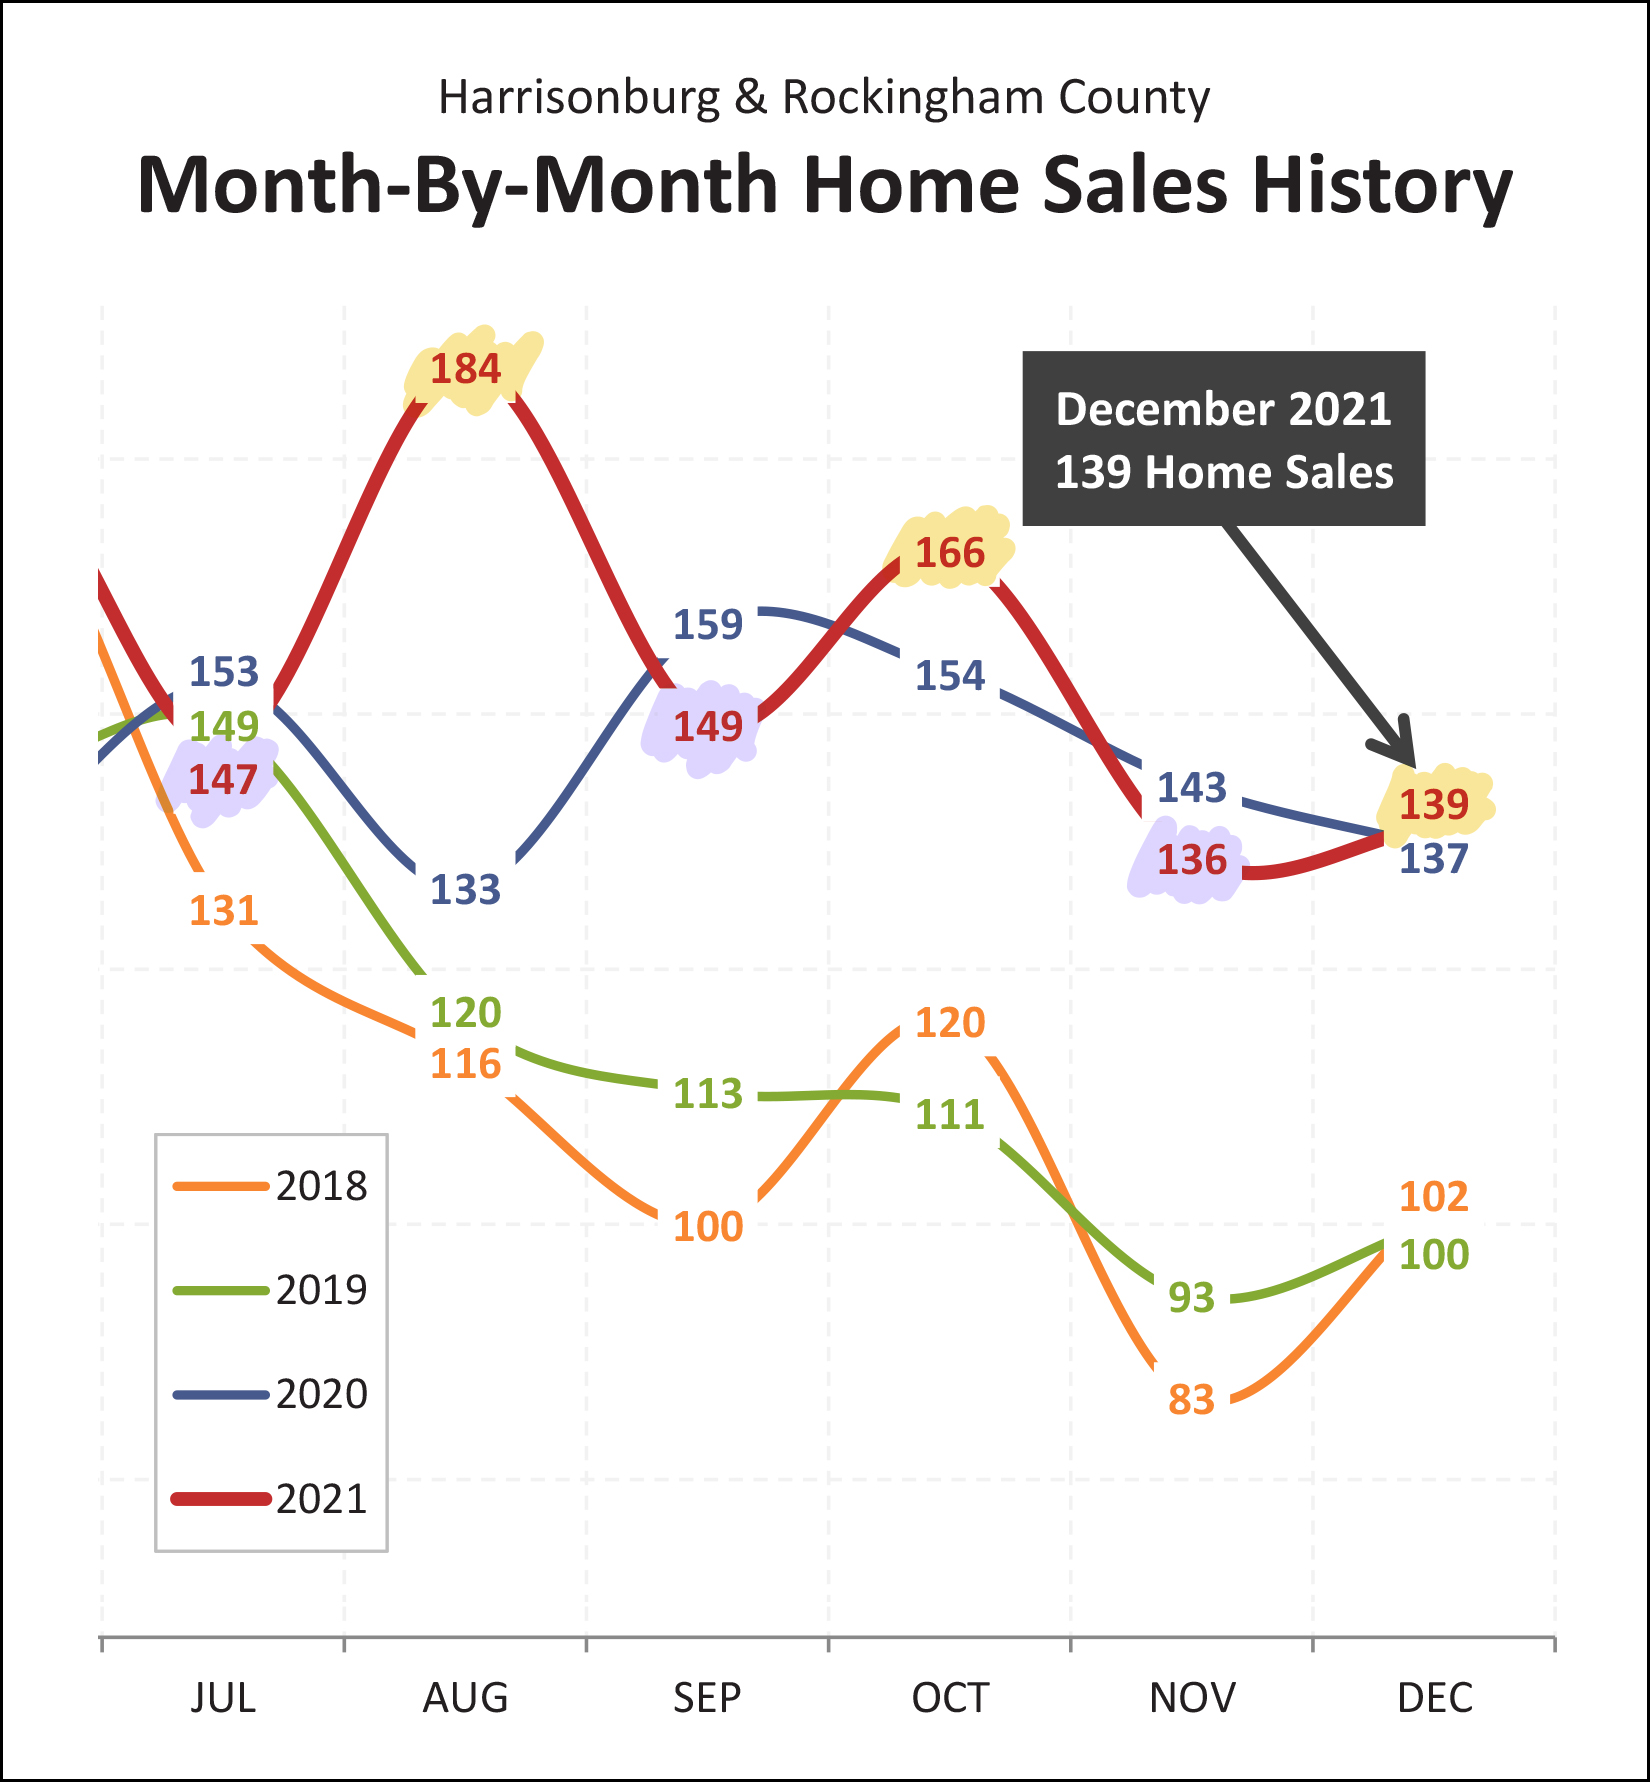 Monthly home sales were *anything* but predictable in 2021. They bounced all around, jumping to record new highs, usually followed immediately thereafter by surprising lows. The market seemed to want to take an "every other month things will be crazy" approach to the timing of sales through out the year!? And what if I told you that the market "slowed down" in 2021? 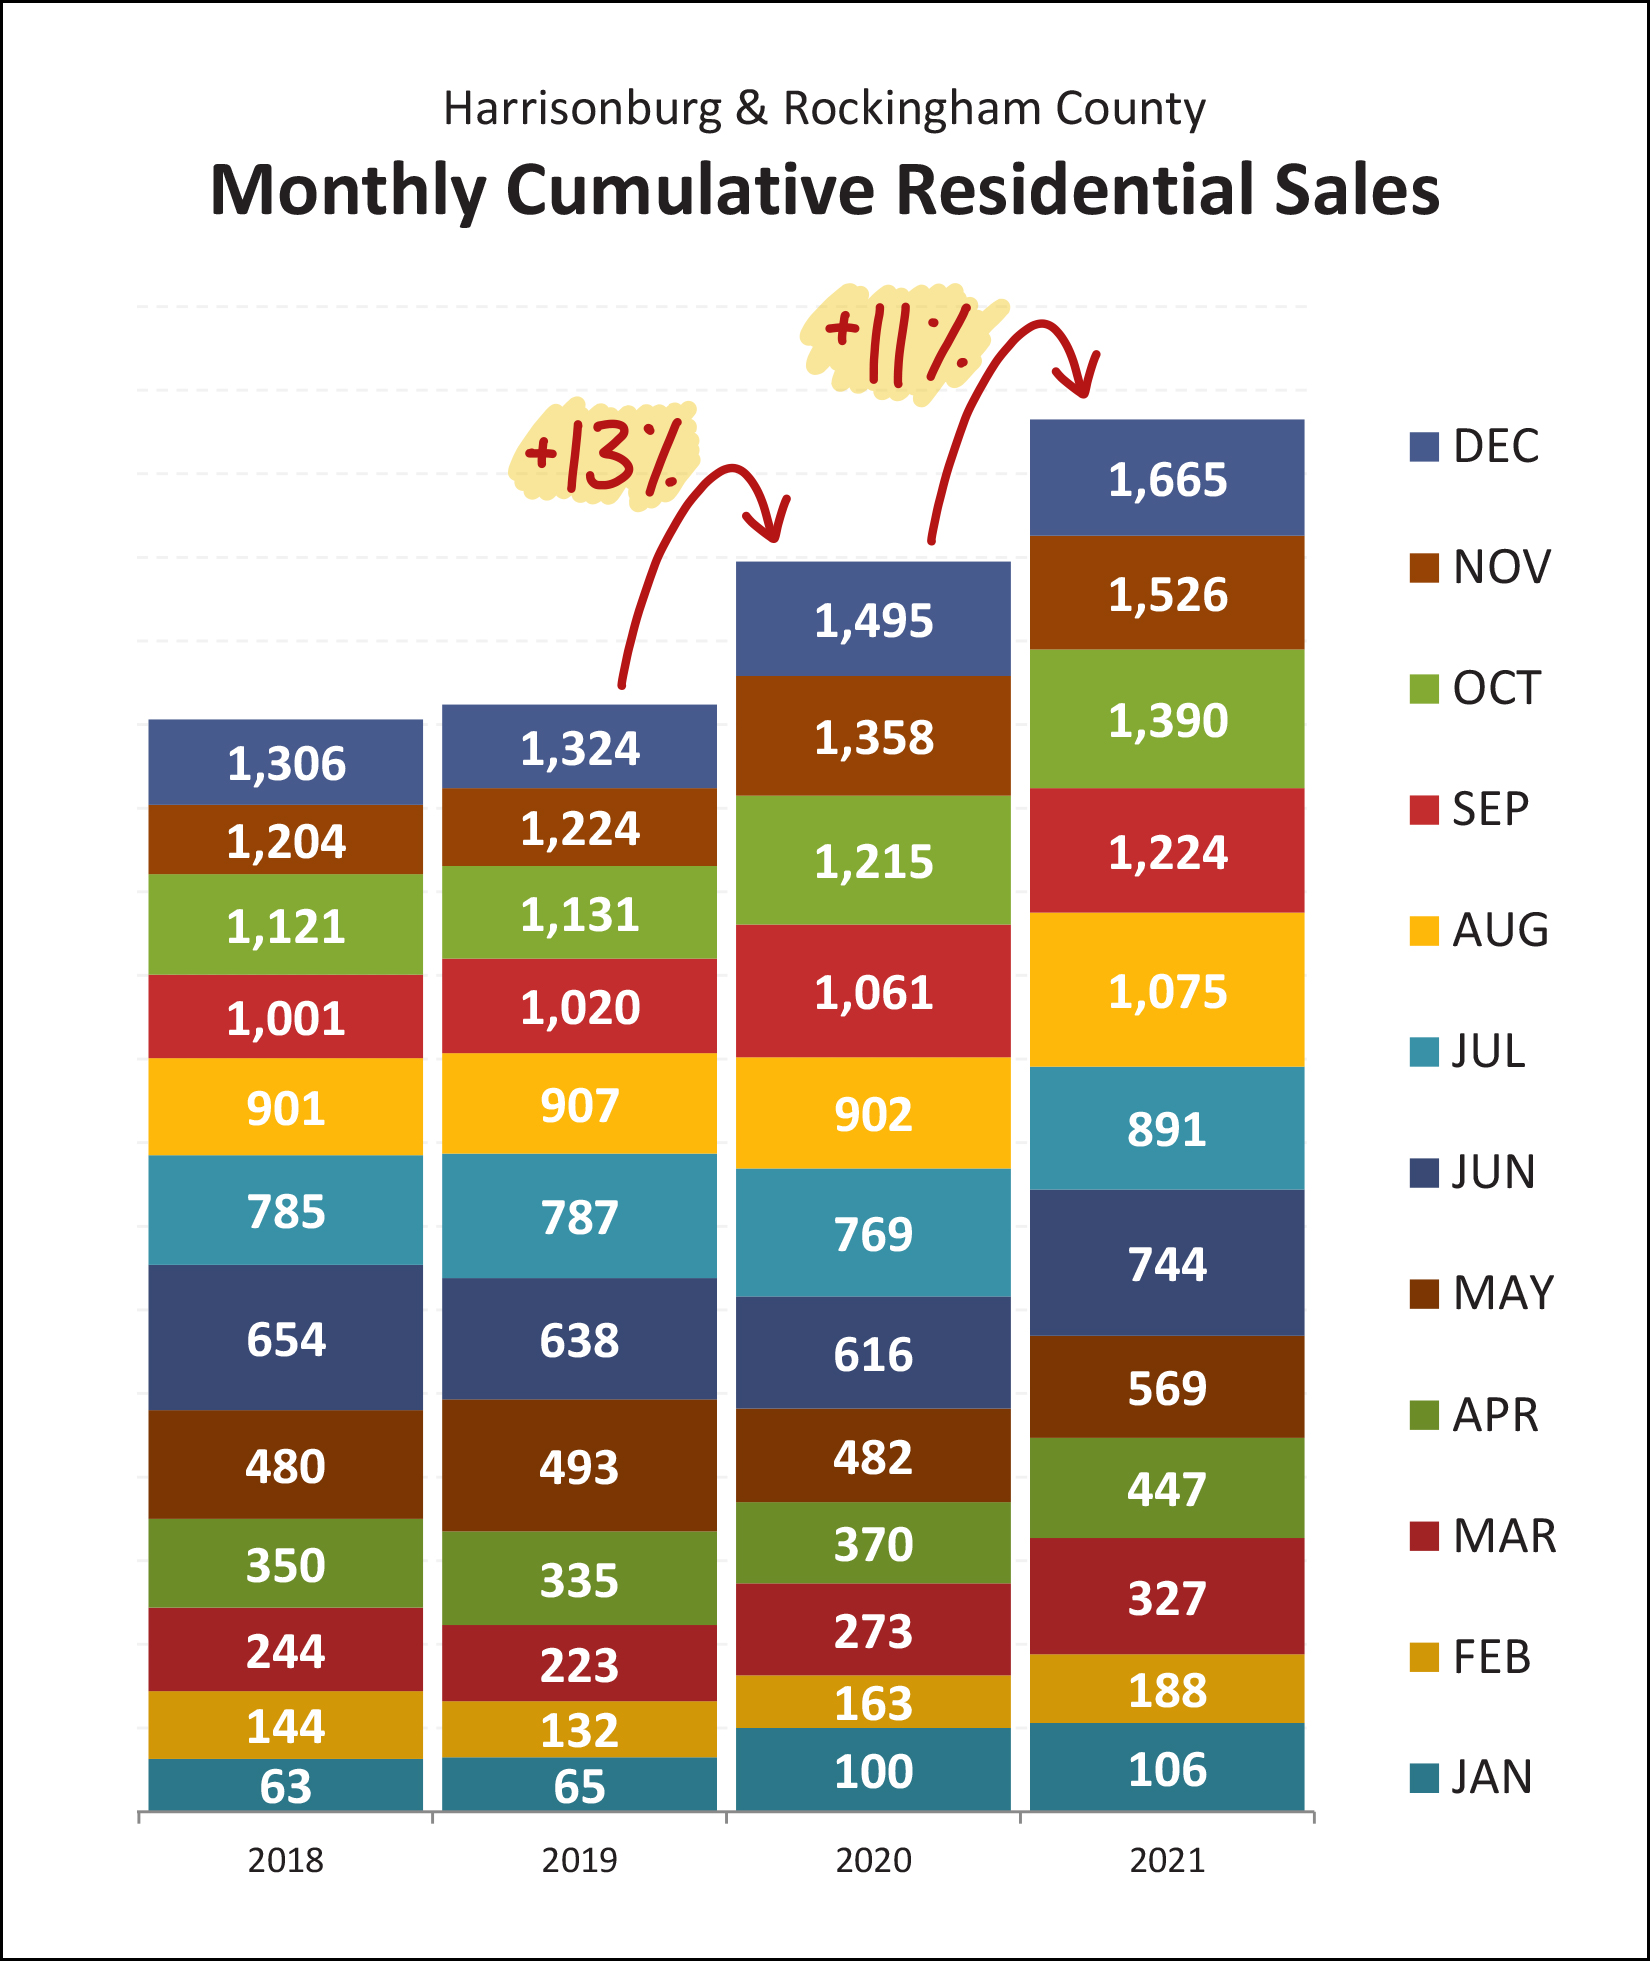 Yes, yes, I know, it's a bit of a stretch. Home sales rose 11% in 2021, so that's not really slowing down, right? Right. But... home sales increased 13% in 2020... and only 11% in 2021... soooo... slowing down, right? ;-) That's probably not an objective characterization of the market. By all accounts, the market sped up in 2021, even if the definitely-faster-than-normal acceleration was slightly slower than in 2020. We'll go with that. Looking now, at detached home sales trends on a graph... 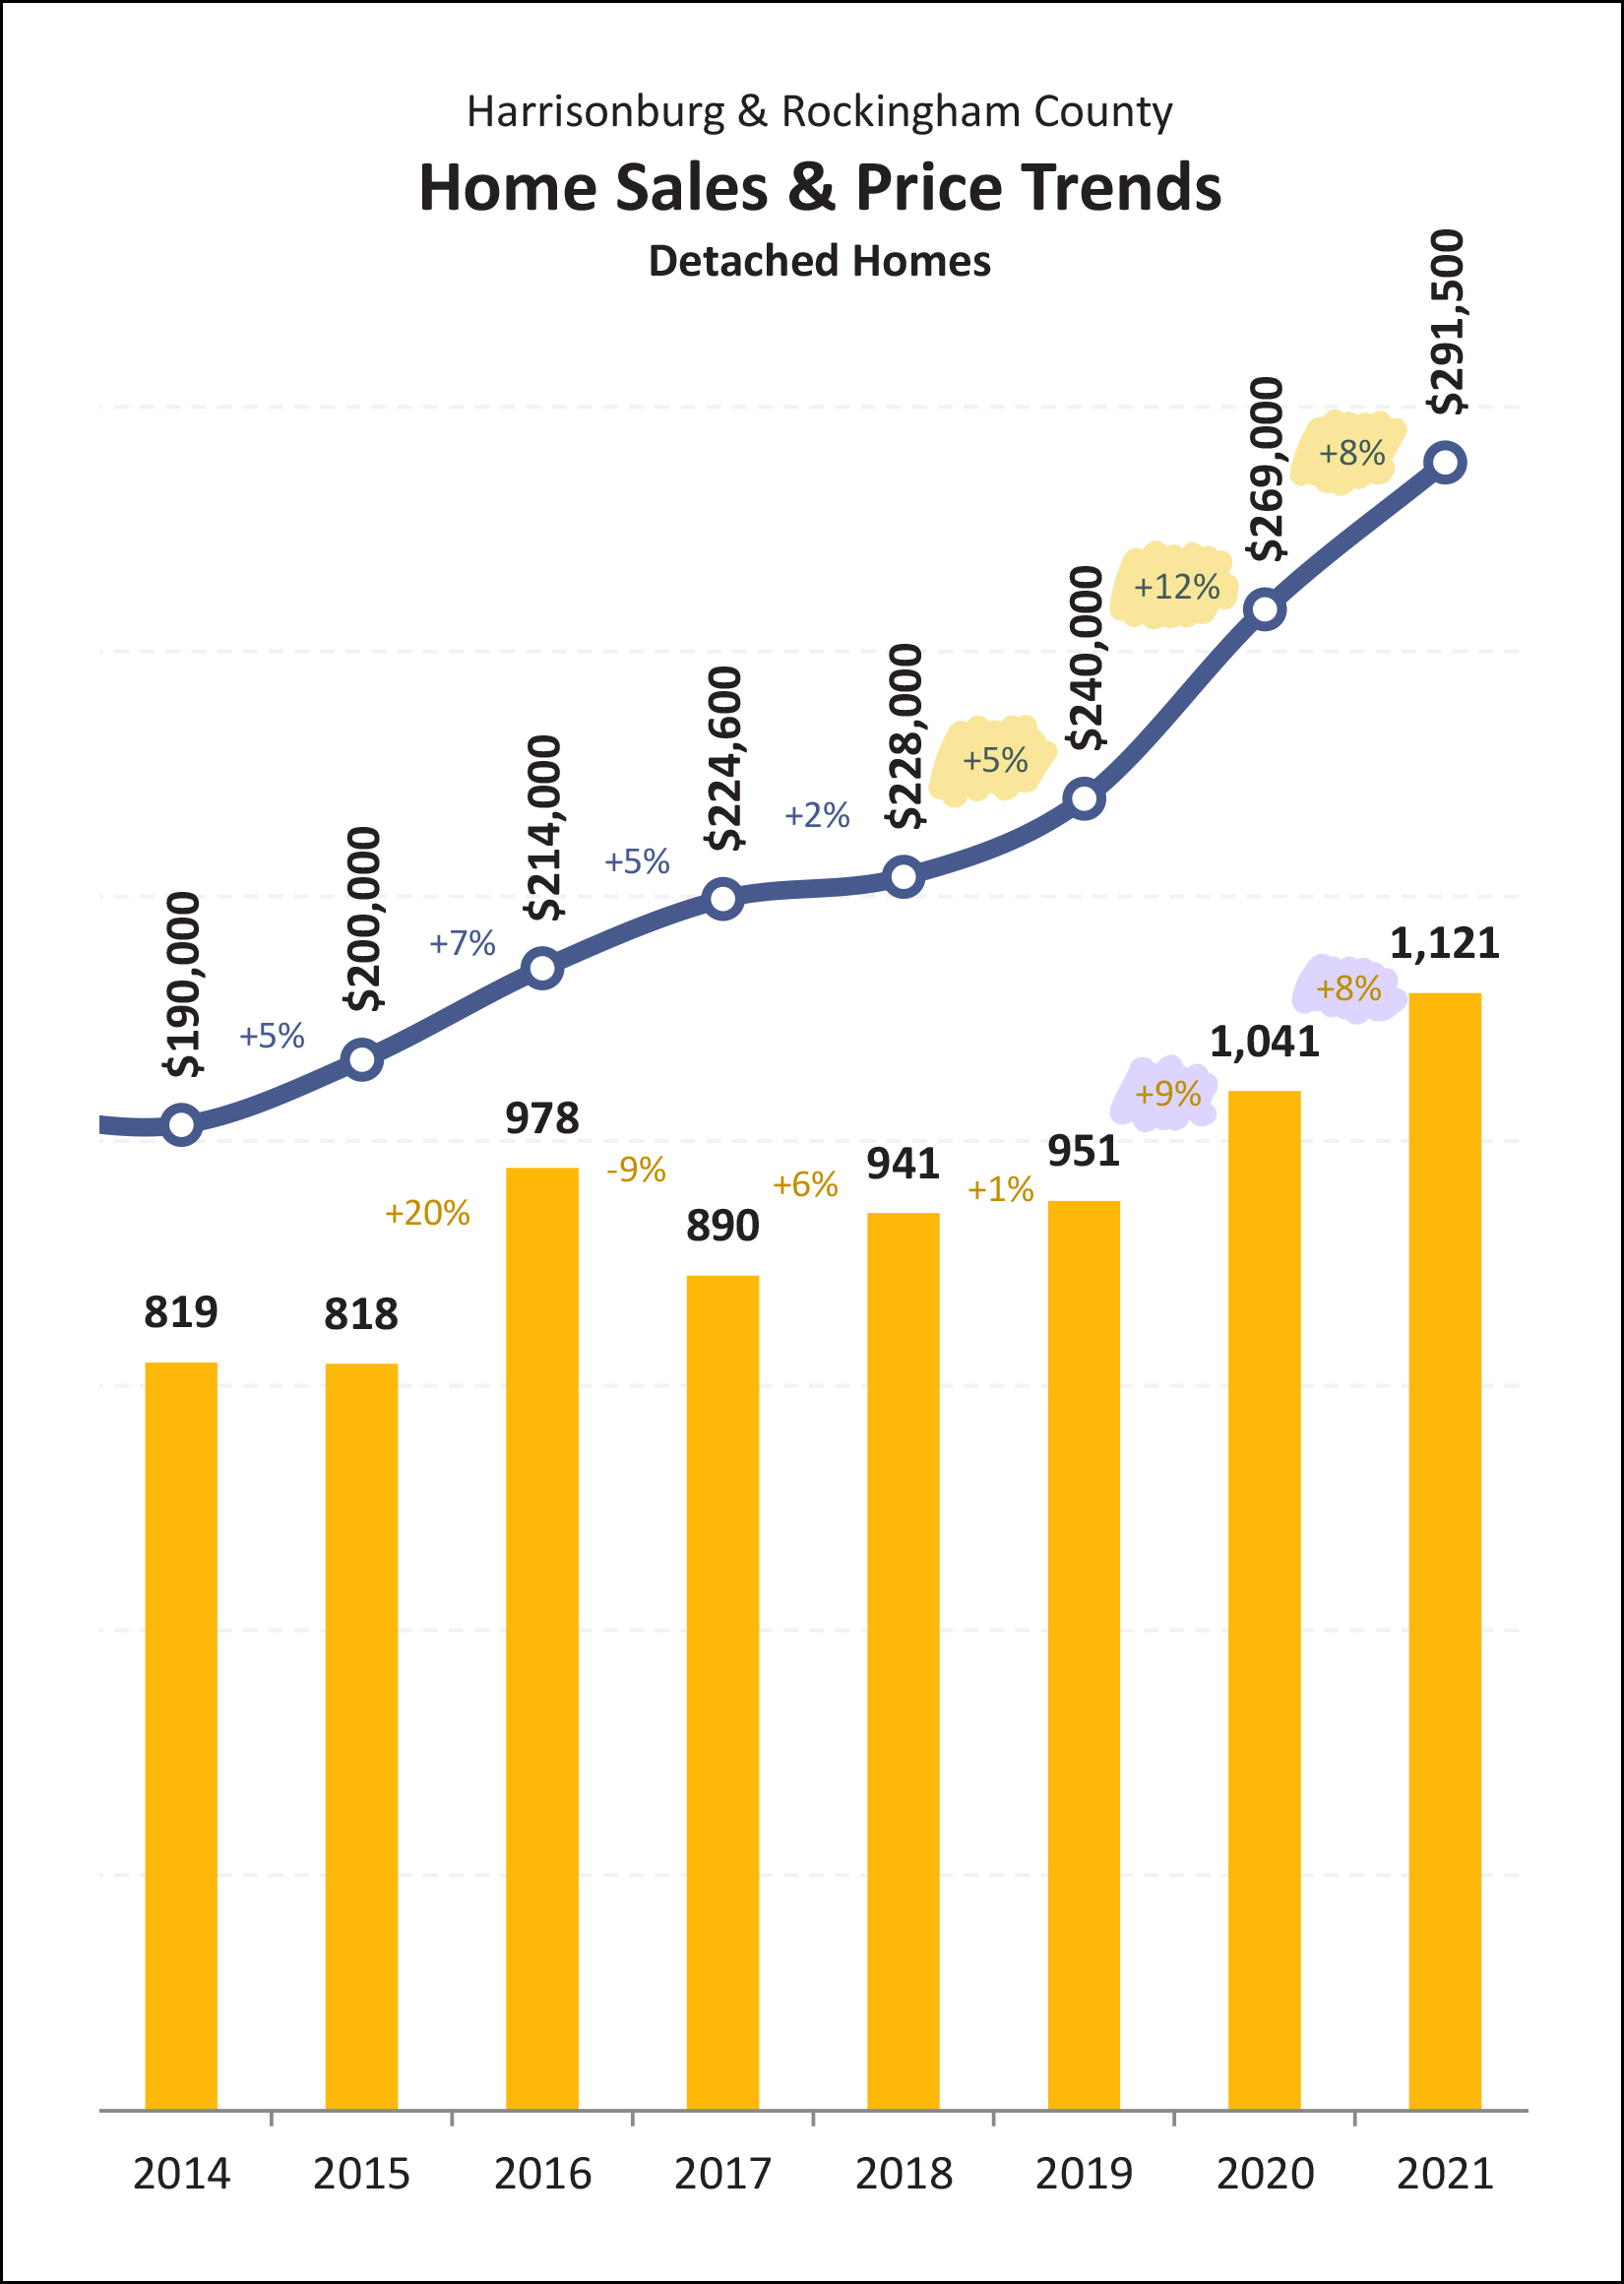 When looking at detached home sales only: The pace of detached home sales increased 8% in 2021... after having increased 9% in 2020. The median price of detached home sales increased 8% in 2021... after having increased 12% in 2020. So, maybe flattening out, barely, slightly, slowly? Or maybe not. And how about the attached home sales market? 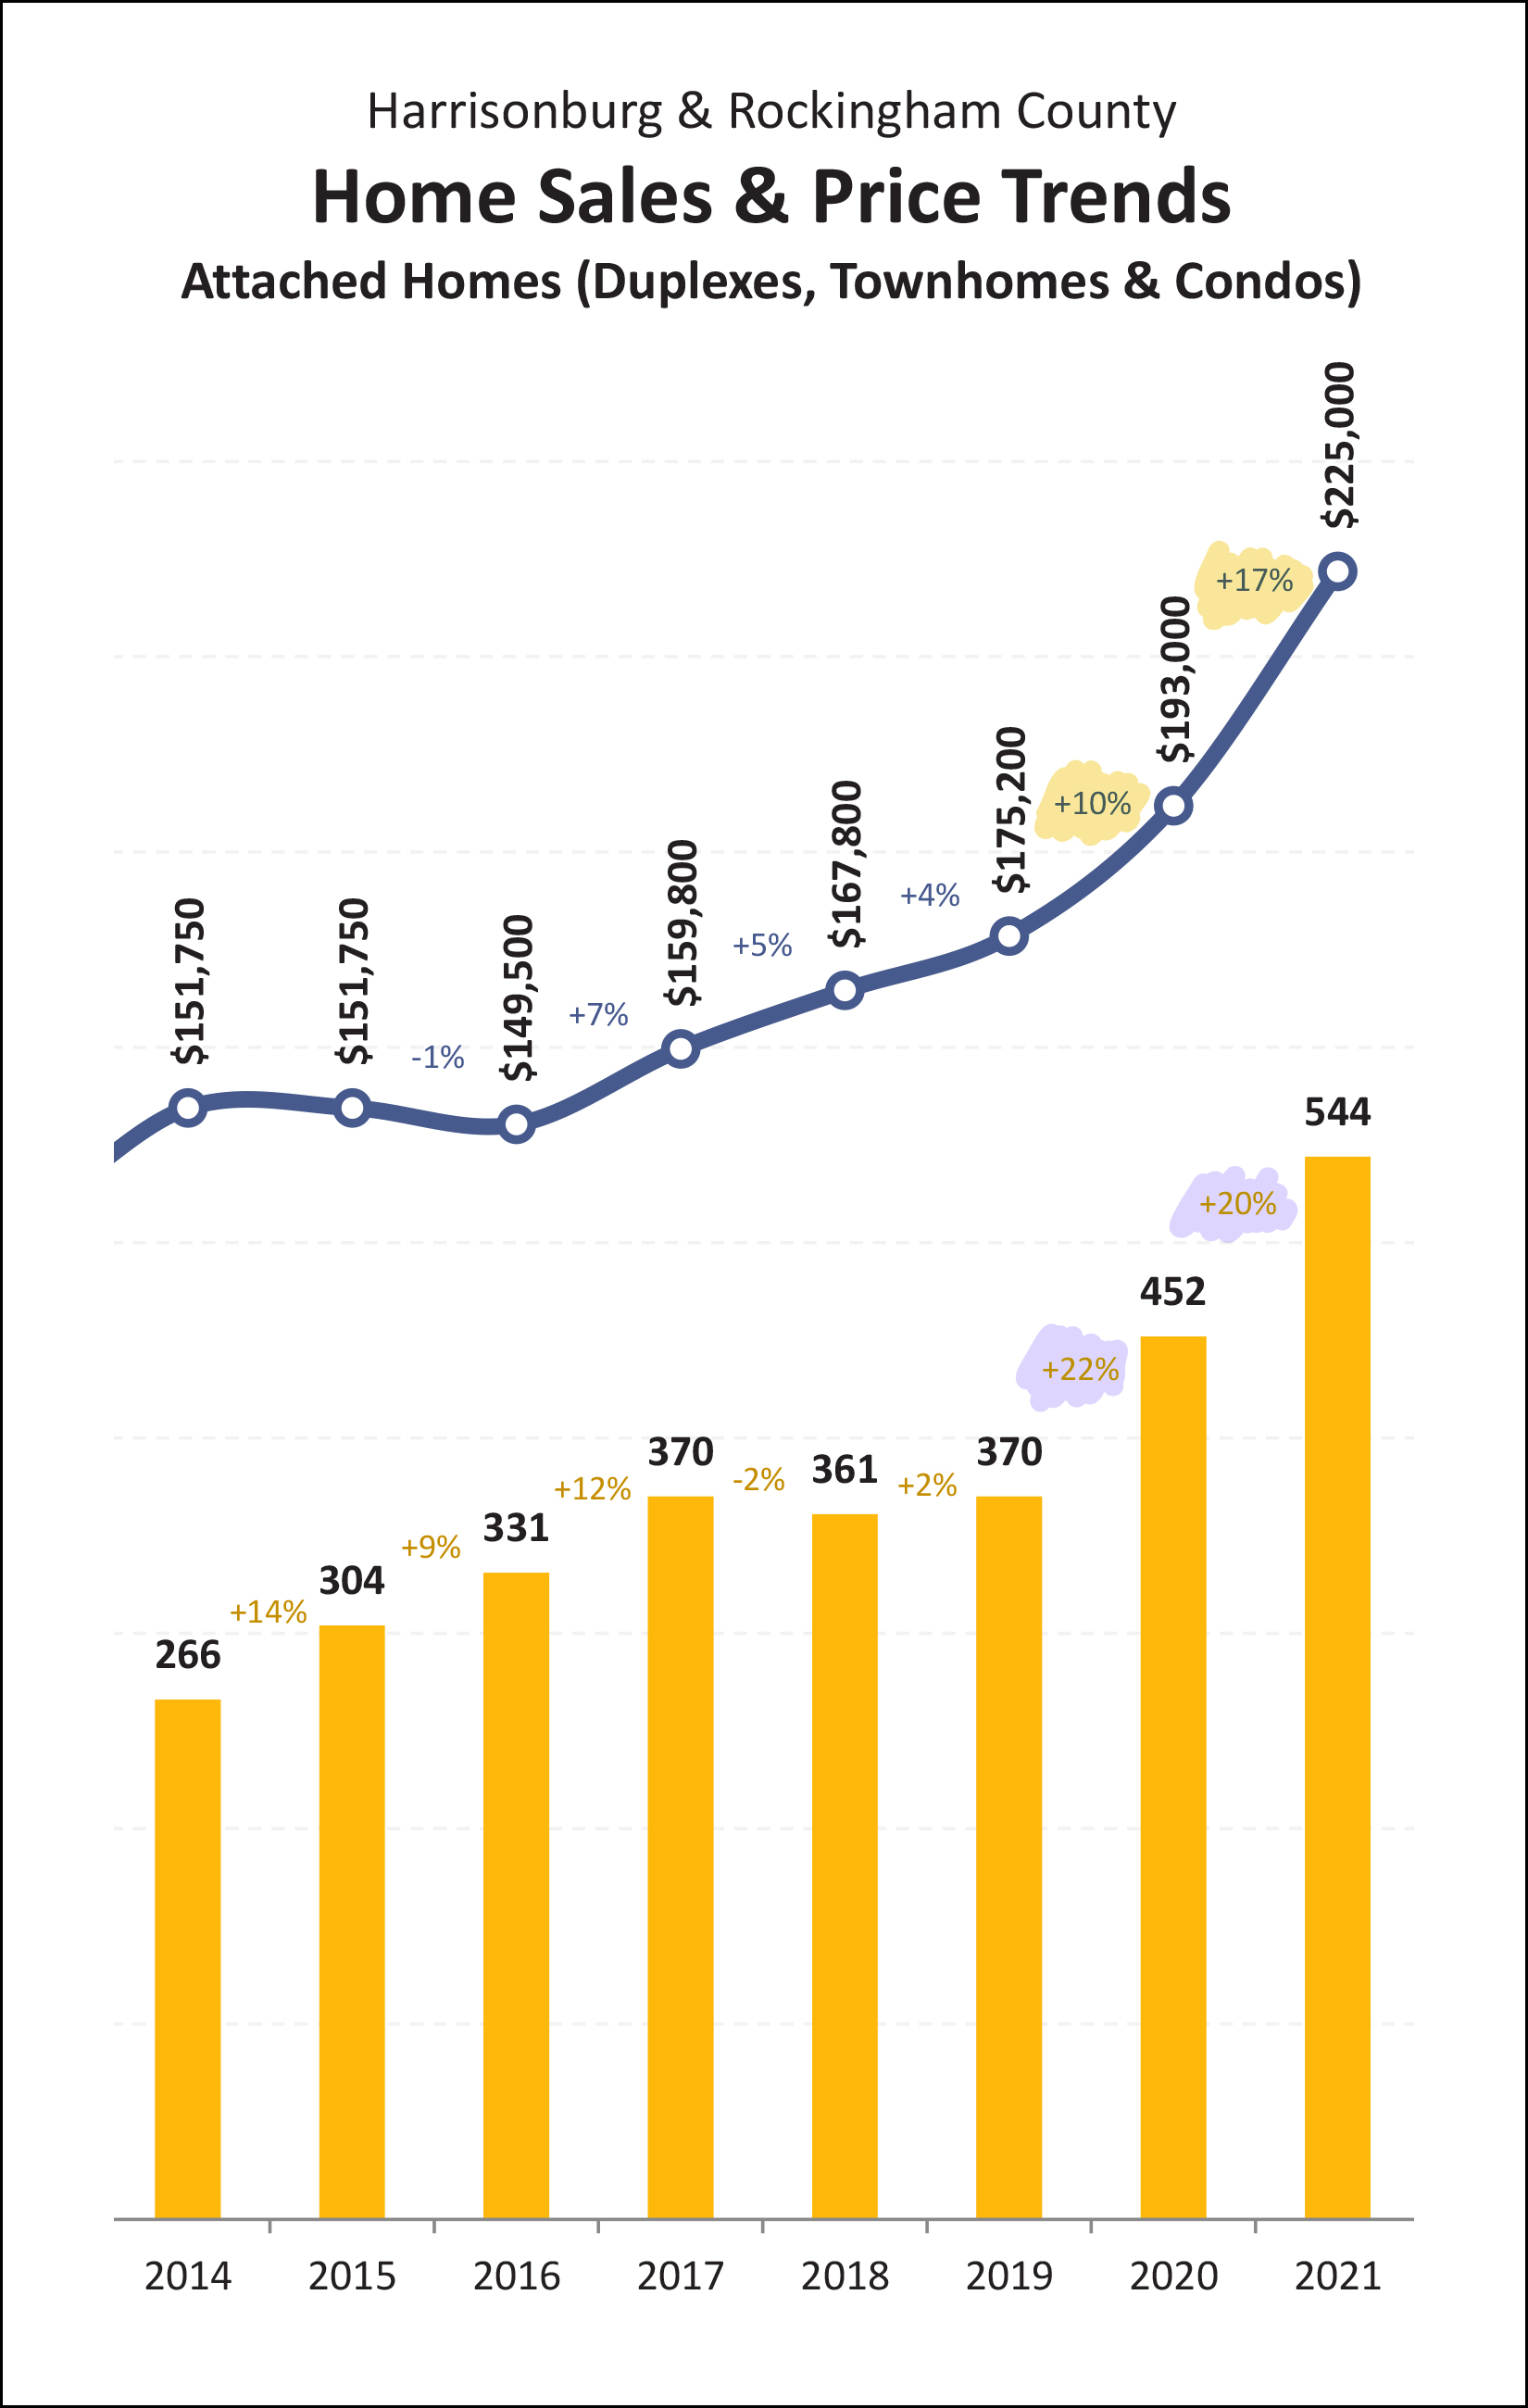 When looking at attached home sales only: The pace of attached home sales increased 20% in 2021... after having increased 22% in 2020. The median price of attached home sales increased 17% in 2021... after having increased 10% in 2020. Right, so, in such a strong seller's market are sellers having to negotiate much? 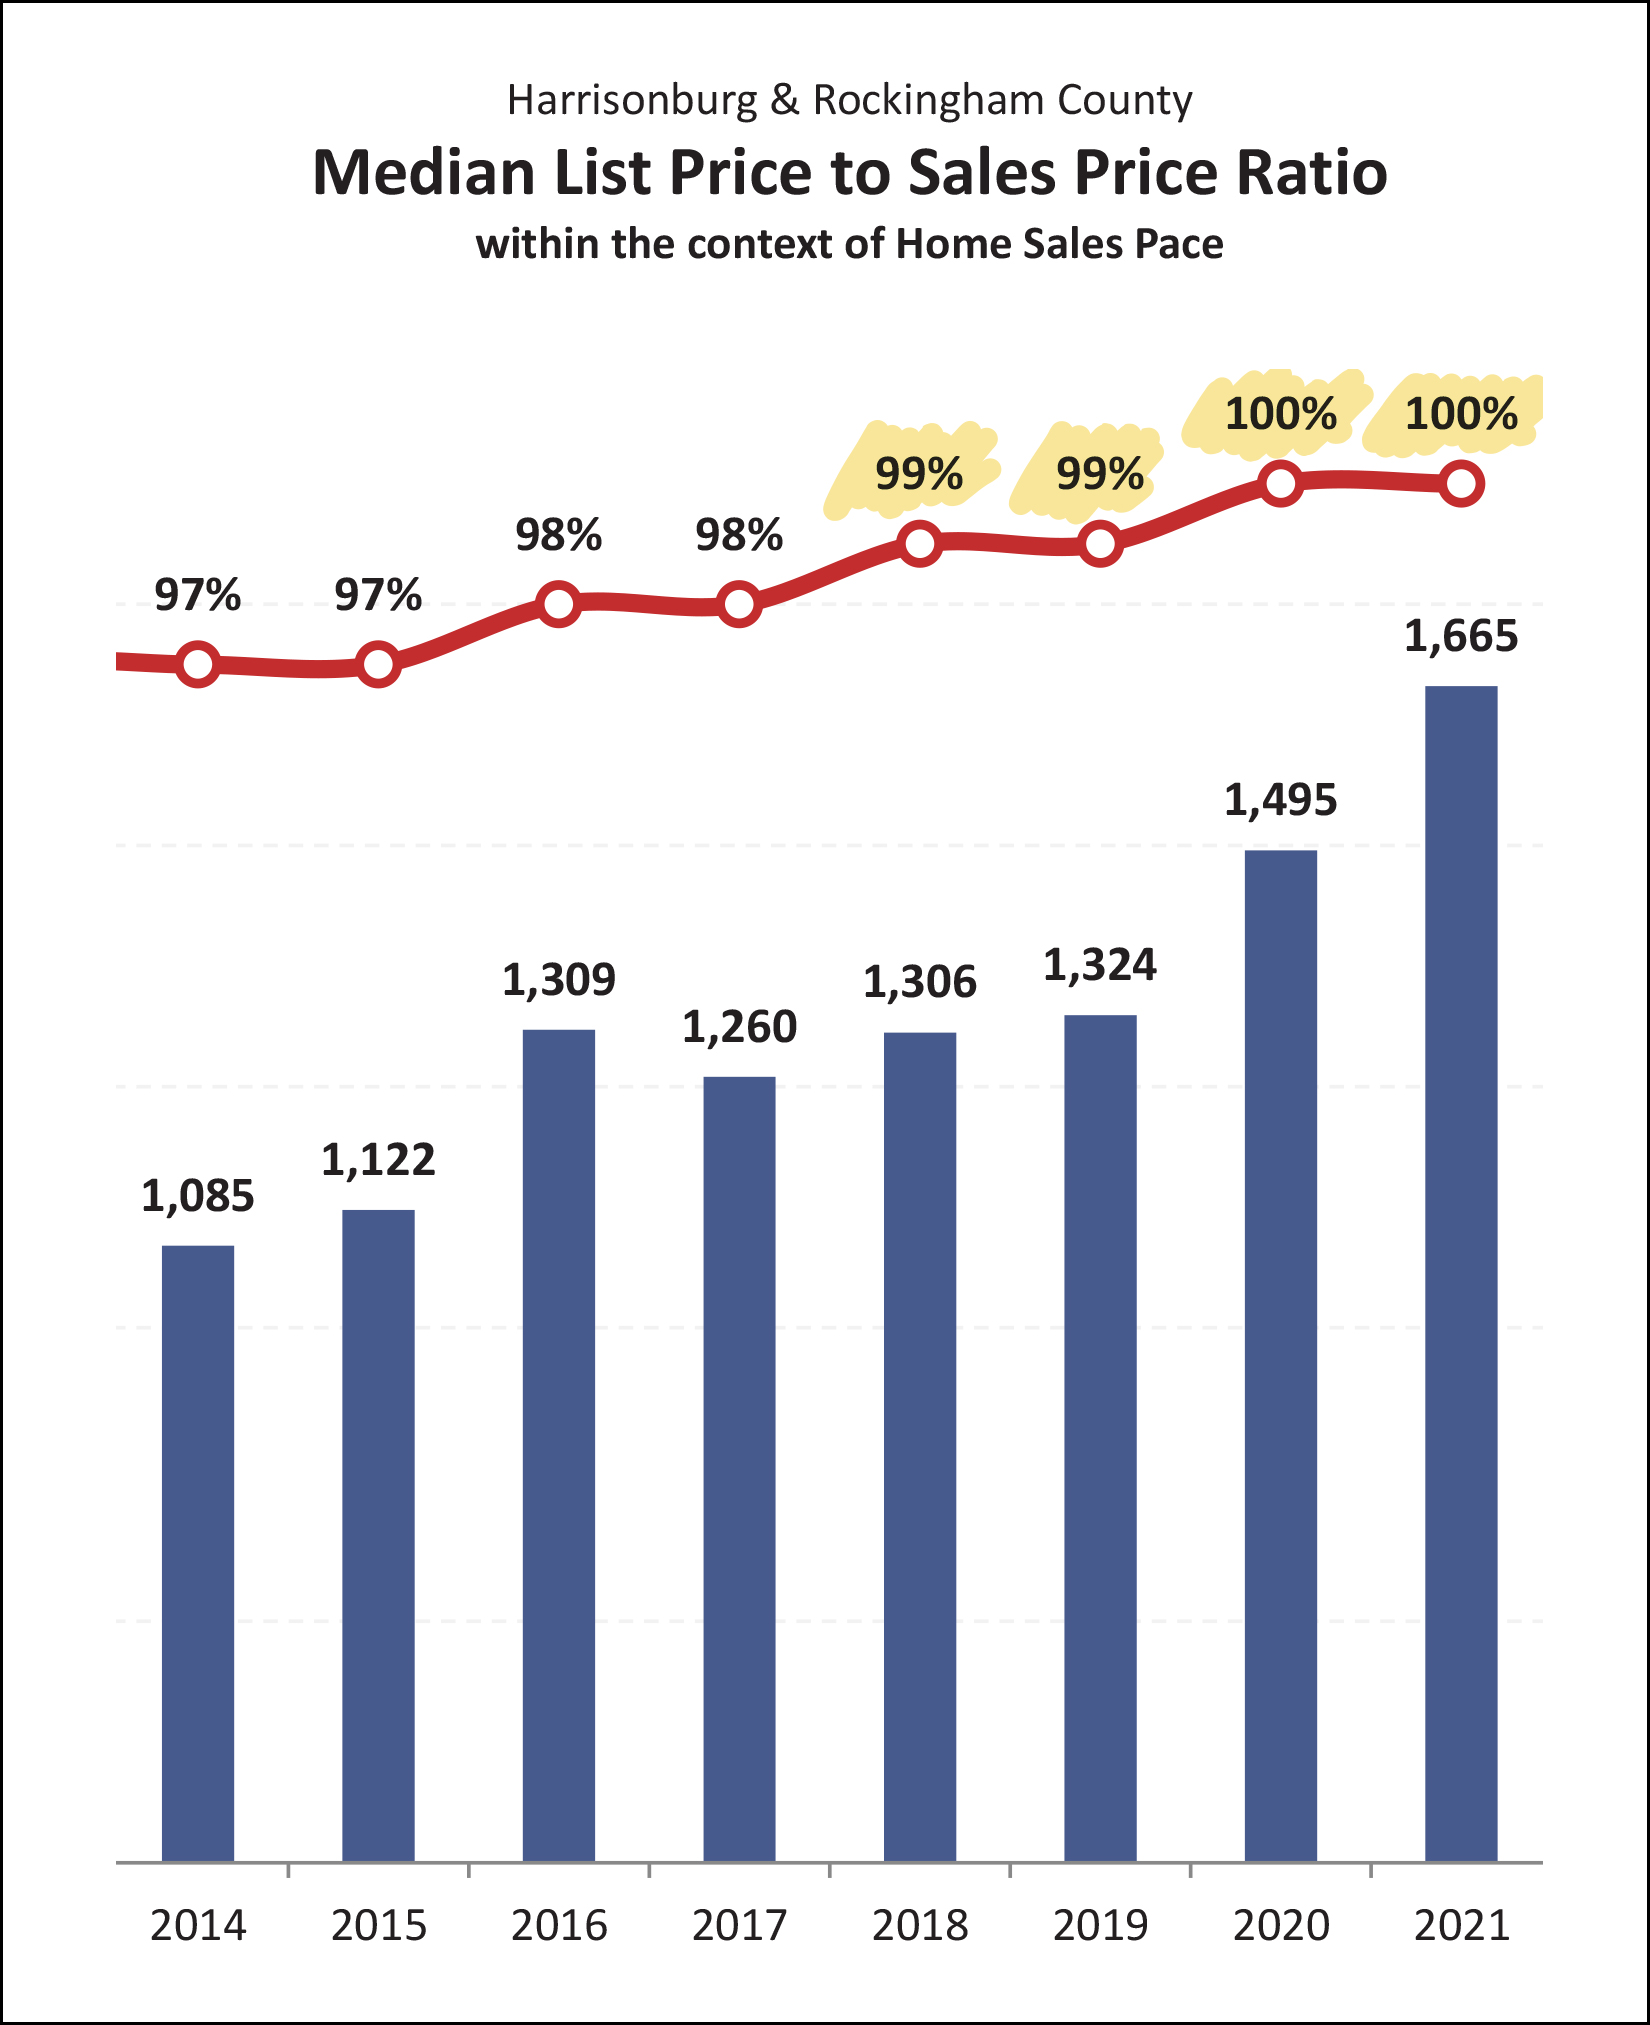 We'll say "nope" -- sellers are decidedly NOT negotiating much, at all! Half of buyers paid 100% or more of the list price of the house that they purchased in 2021... following the same trend as in 2020! So, unless a house is obviously overpriced, and perhaps has been on the market for weeks or months, you likely won't be negotiating much if any as a buyer. Sooooo much buyer interest and activity has lead to inventory levels falling, and falling and falling... 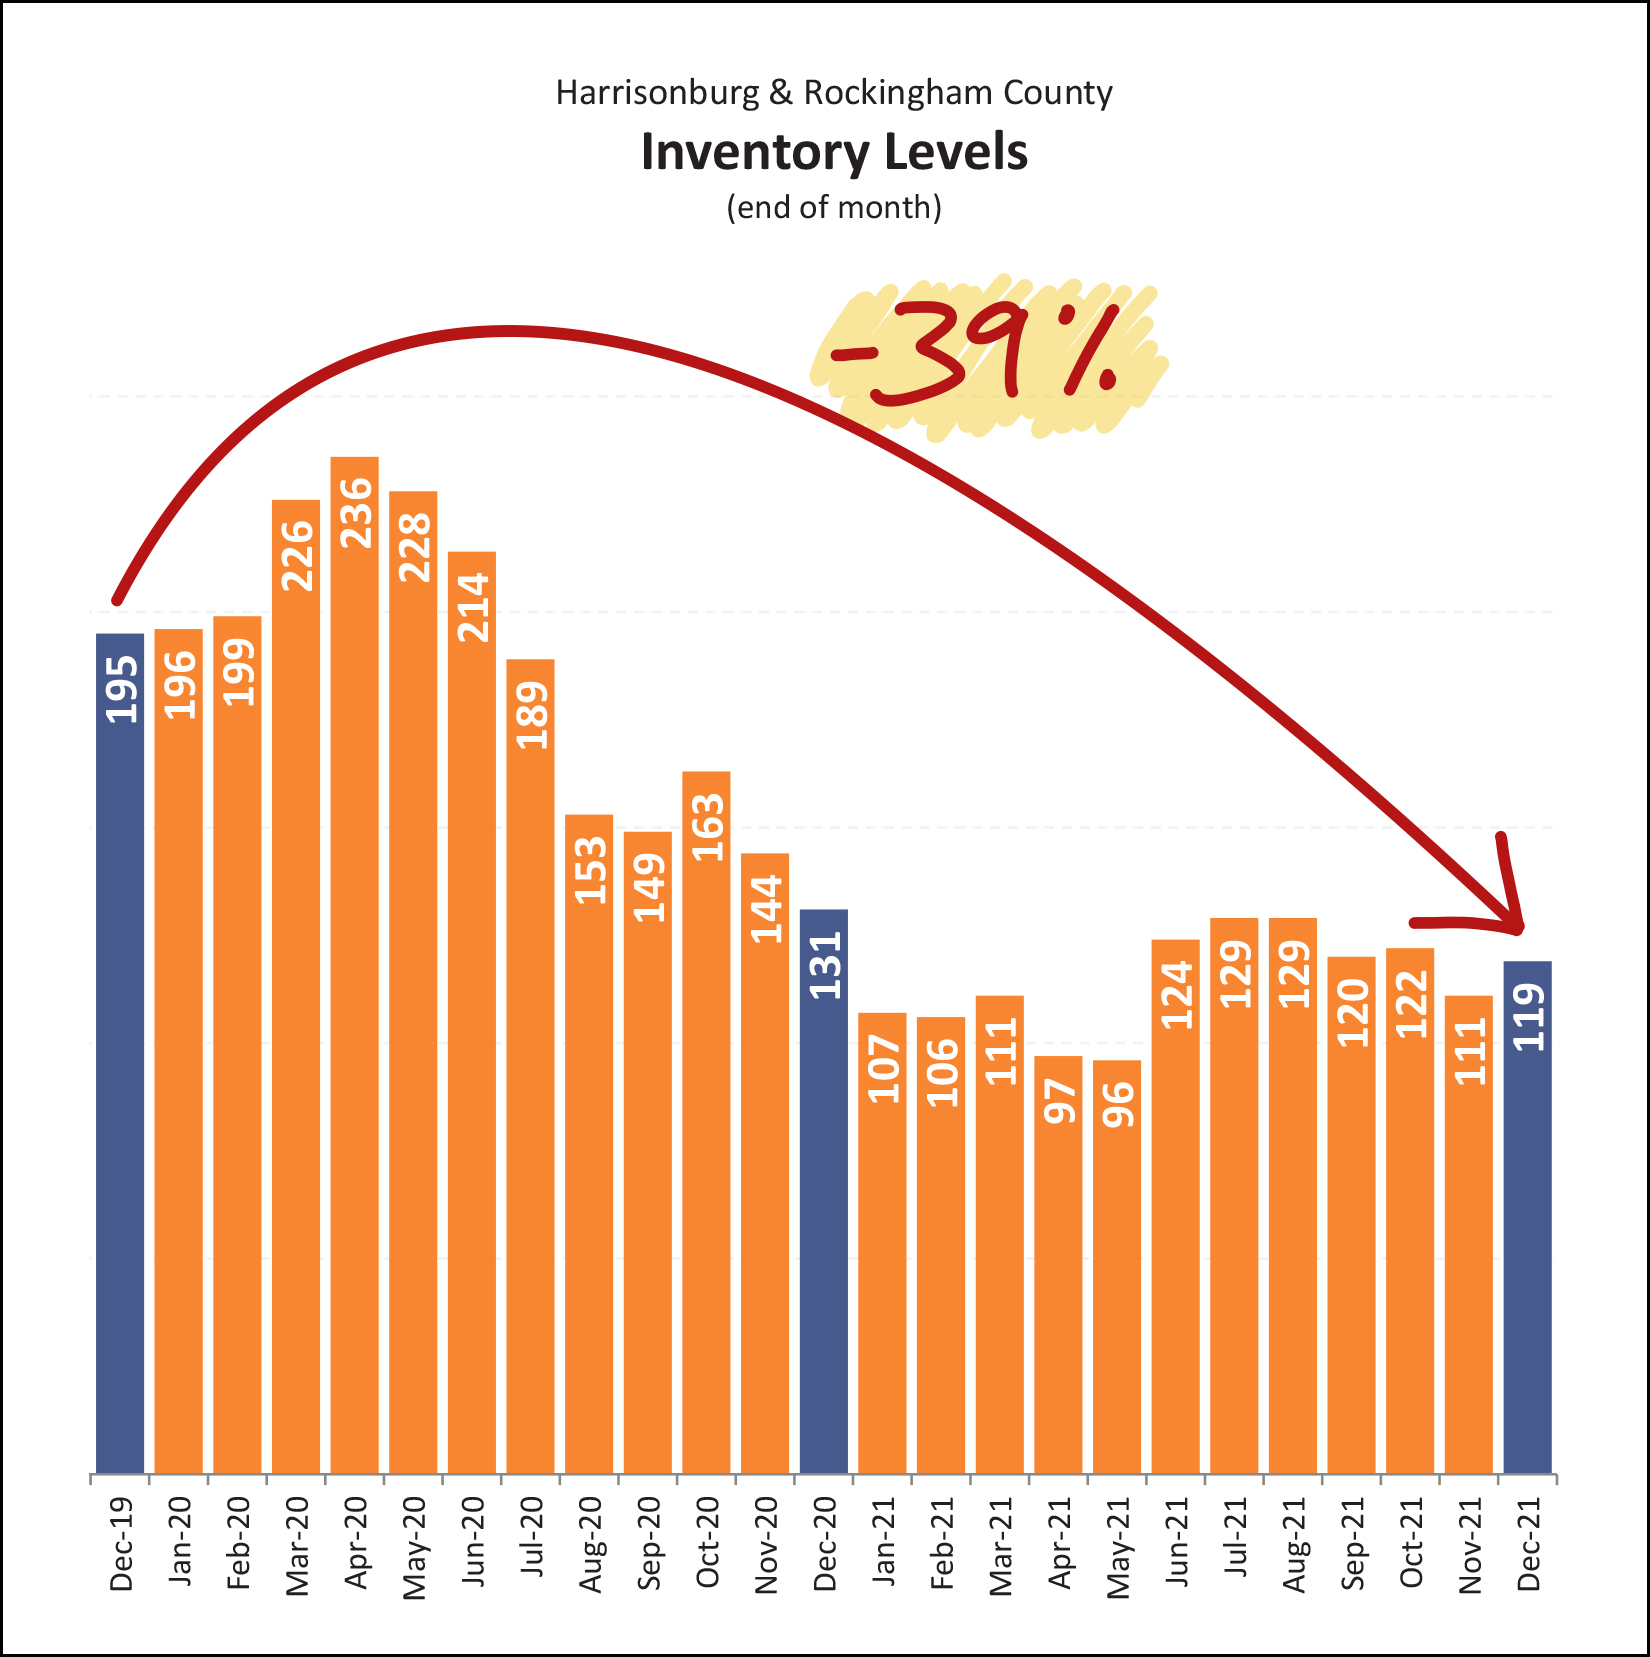 We are now experiencing (and have been for the past year) the lowest inventory levels I've ever seen. There are currently only 119 homes on the market in all of Harrisonburg and Rockingham County, which is 39% fewer options for buyers (at any given time) than where we were just two years ago! Which is probably why listings are going under contract SO quickly... 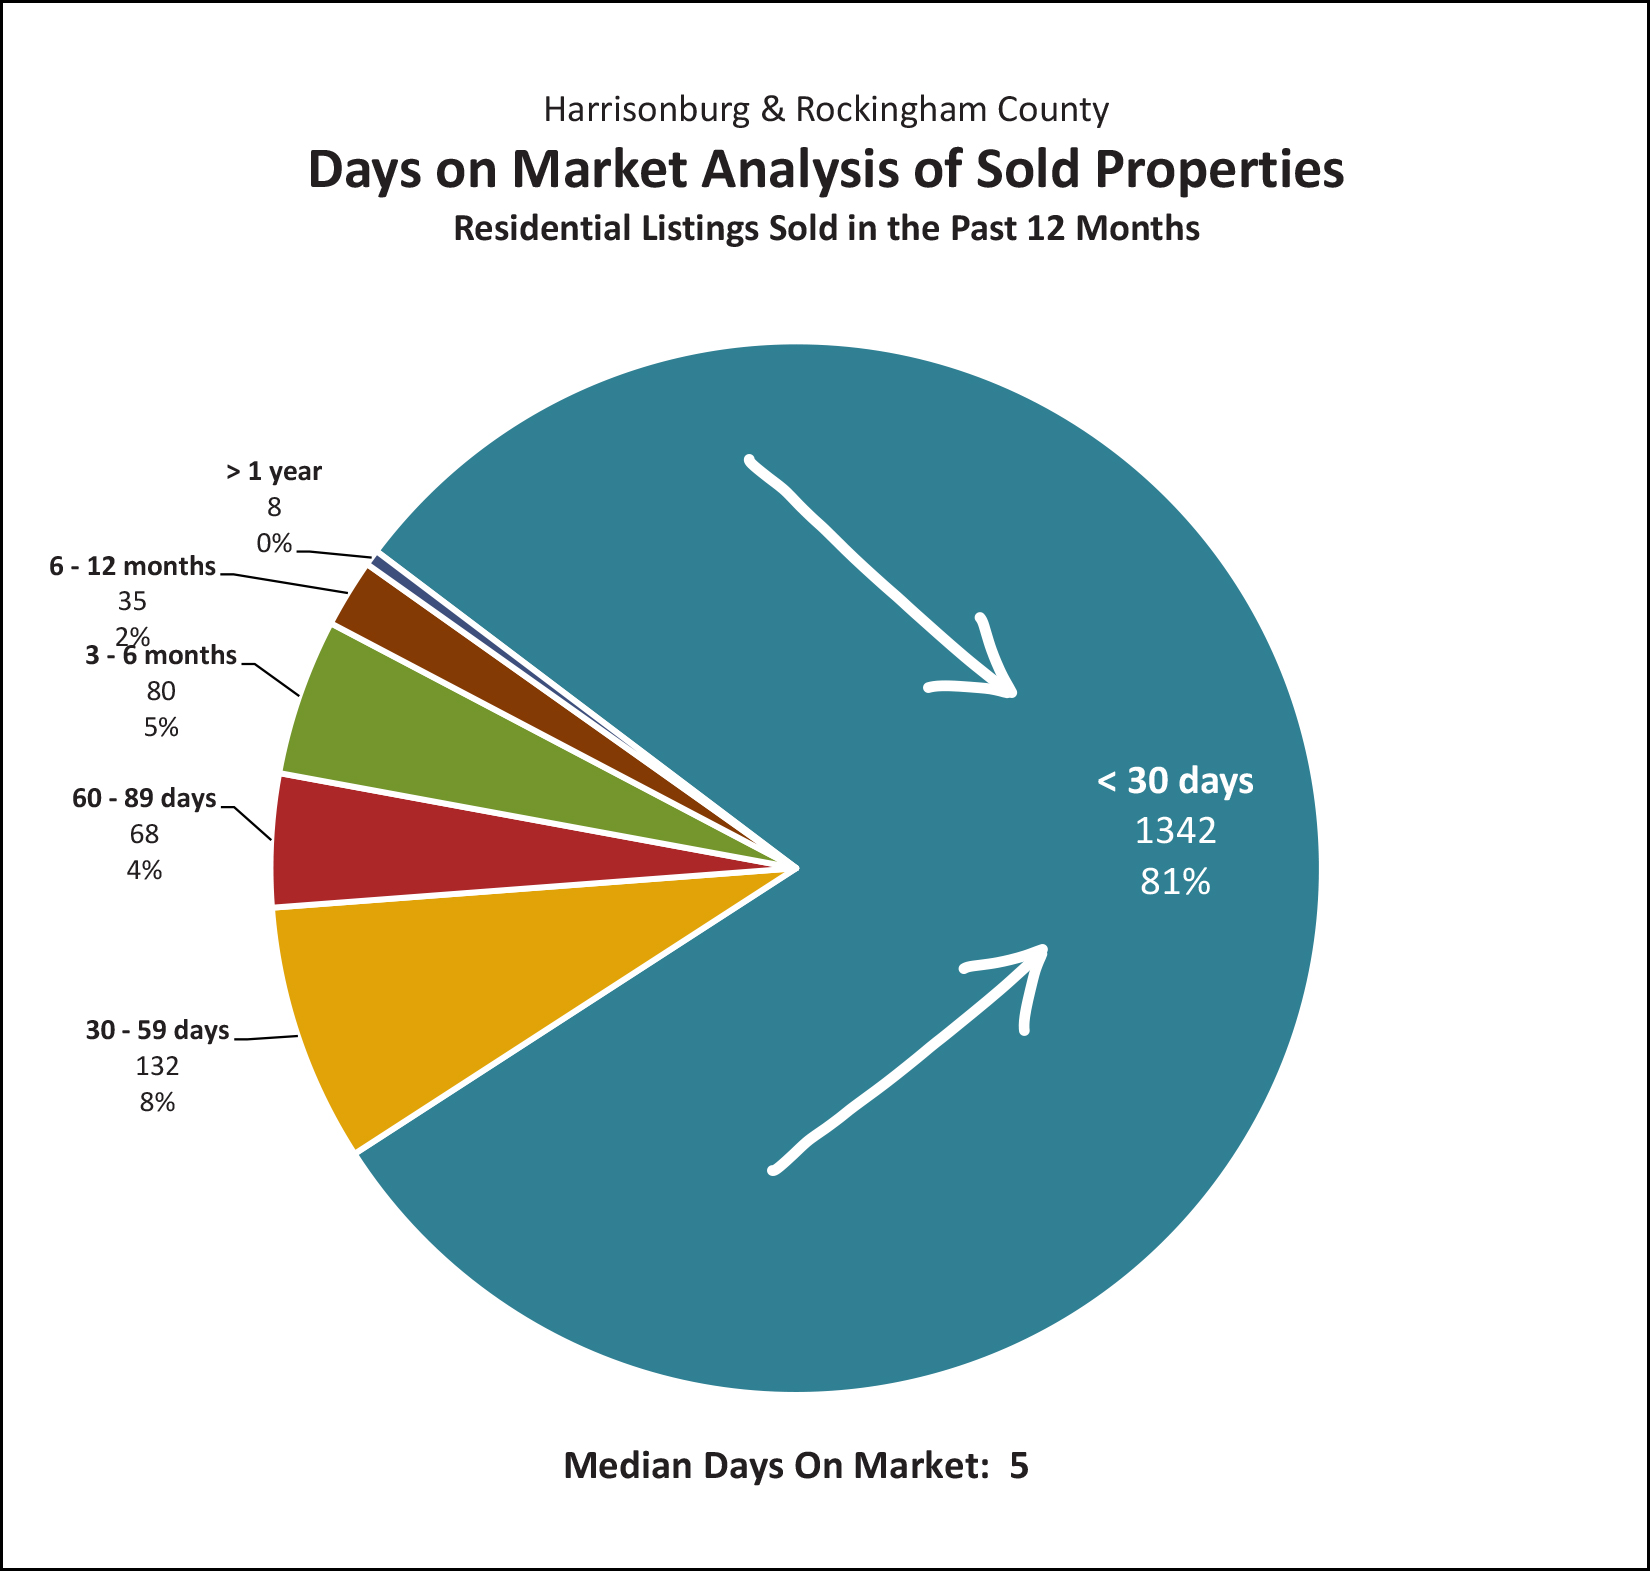 A whopping 81% of all houses that sold in 2021 went under contract in the first 30 days of being listed for sale. And as mentioned earlier, the median is five days... so half of properties sold are going under contract in five or fewer days. Speedy! 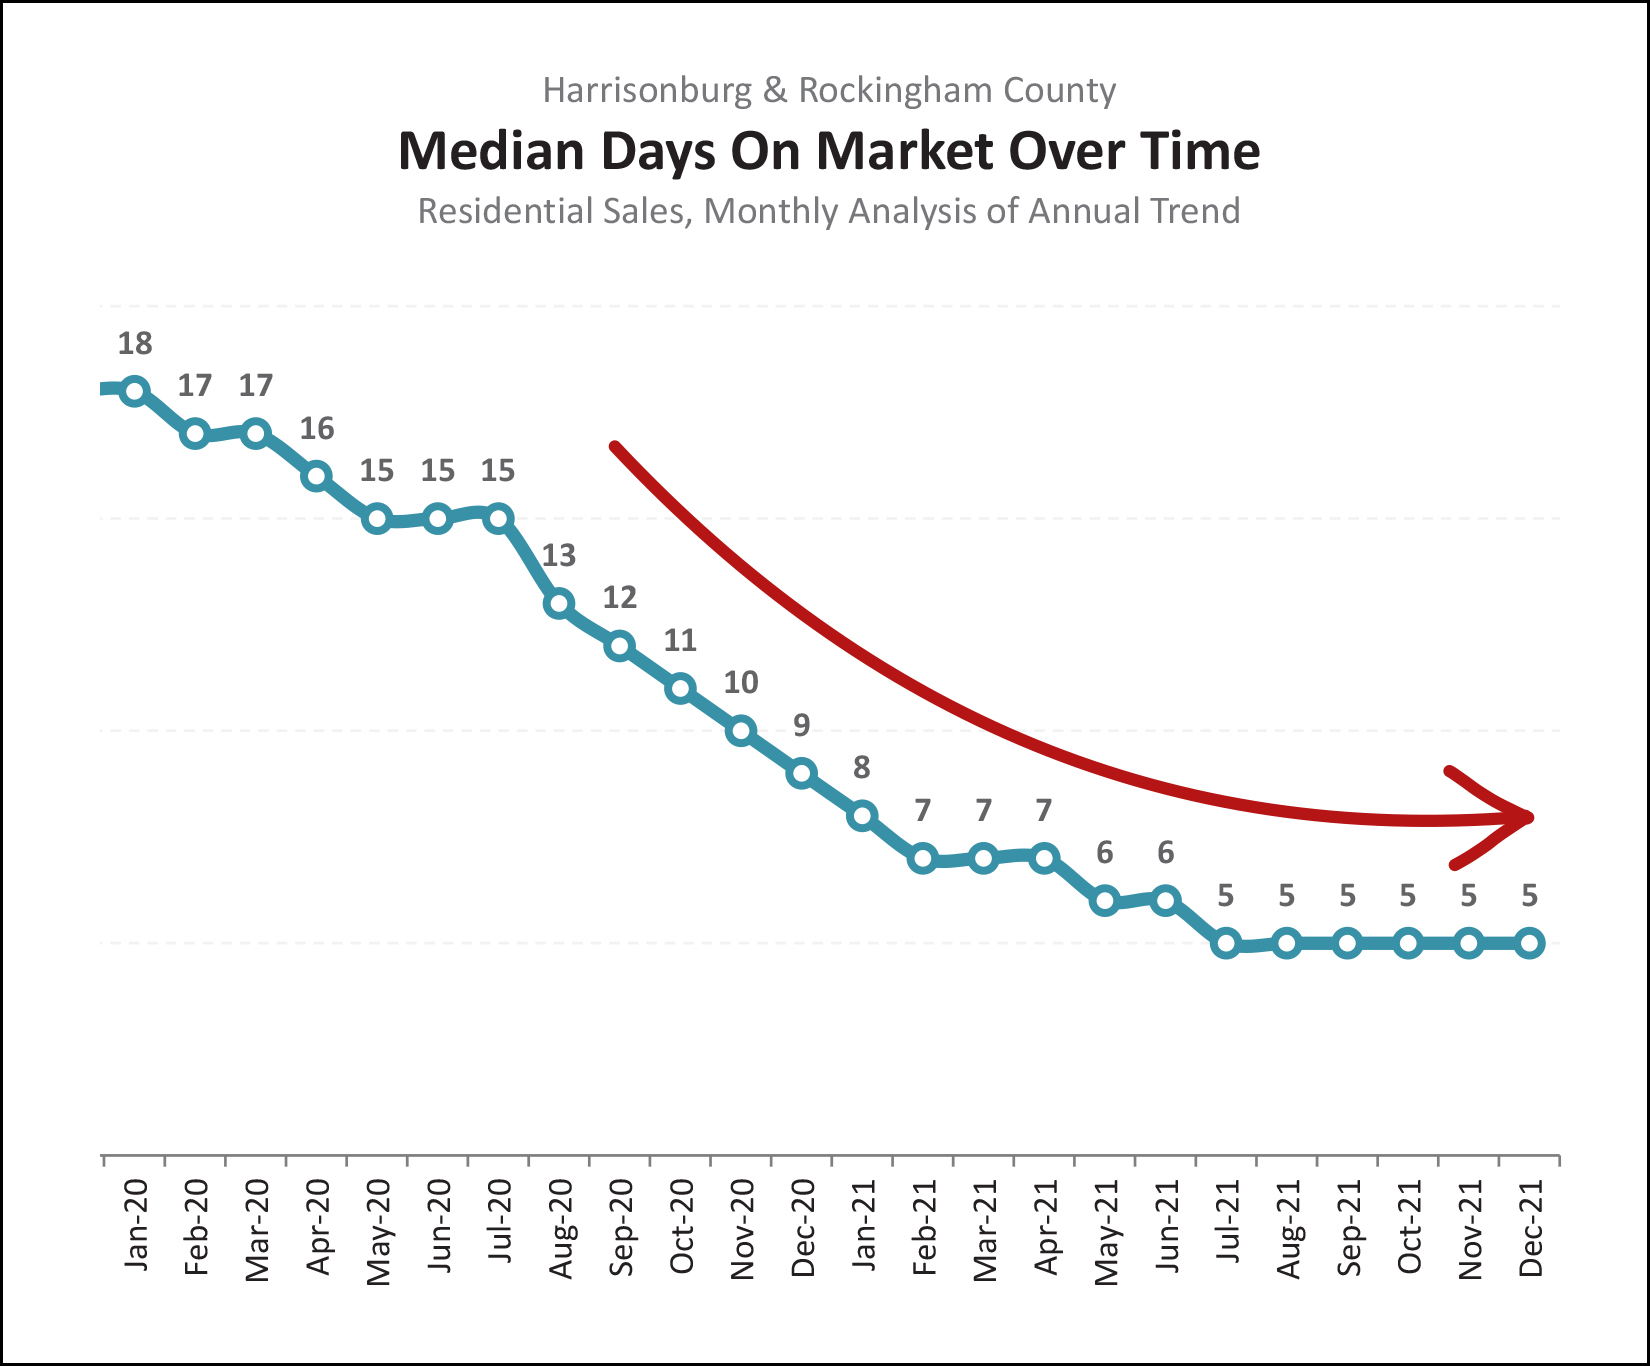 Visualized slightly differently, the graph above shows the annual trend in median days on market... so... homes have been going under contract faster and faster and faster over the past year and a half. It doesn't actually seem that they can go under contract any faster than they are now. If or when the market starts to slow down, we'll likely see it first in a change in this metric of how quickly homes are selling. Finally, did you hear mortgage interest rates are rising? 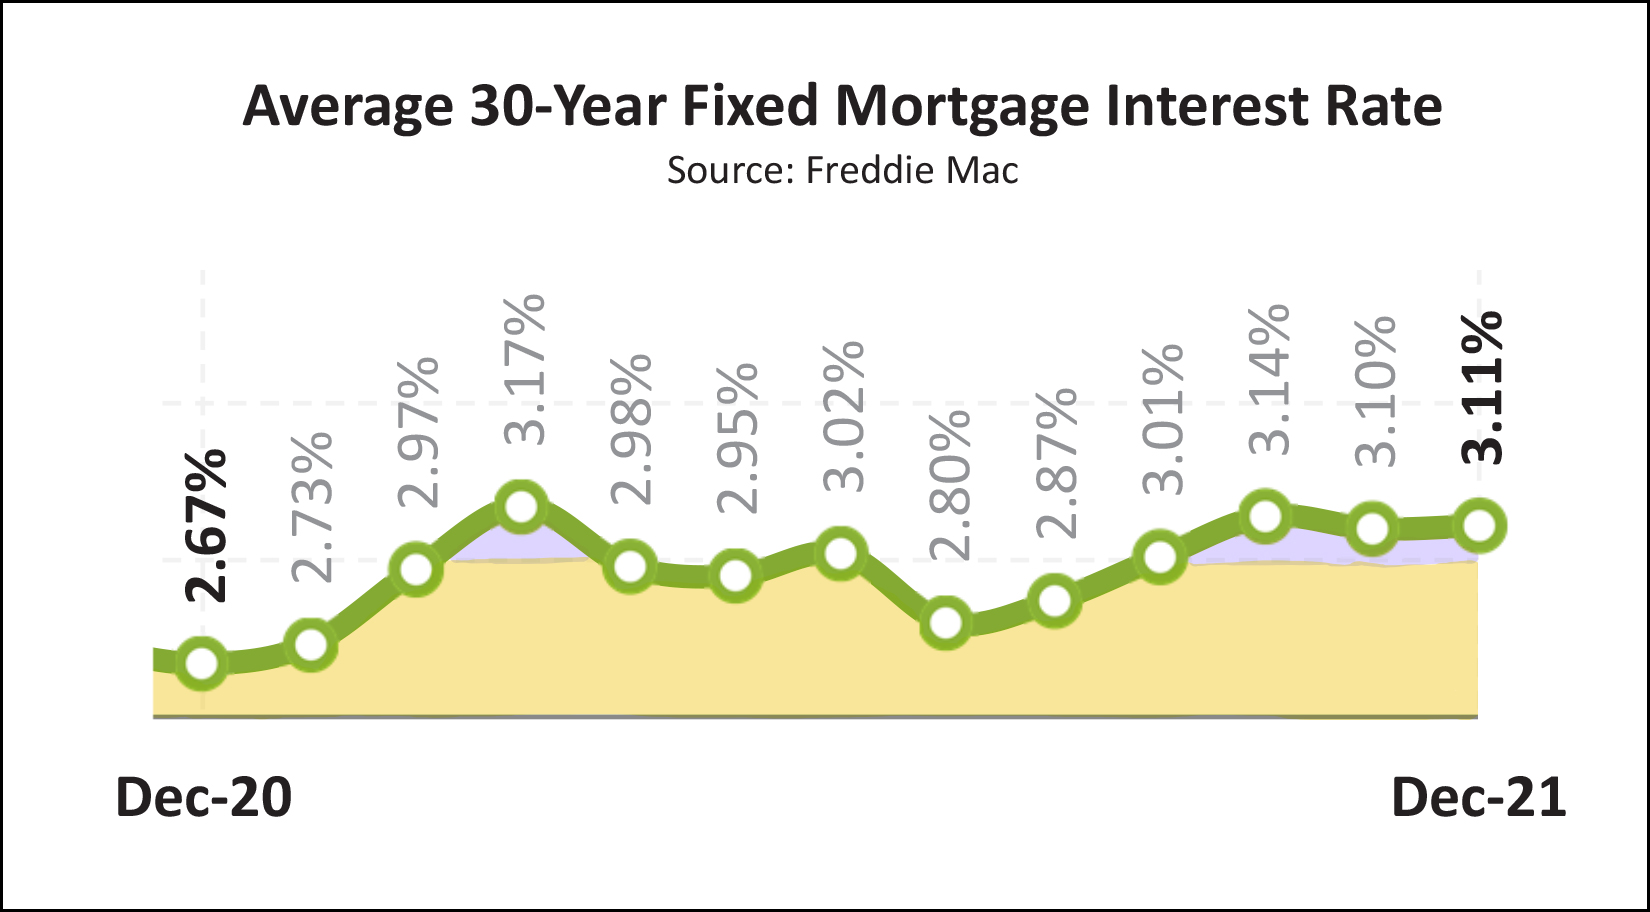 Ha ha, sort of, kind of, but not meaningfully. Mortgage interest rates stayed below 3.25% for the entirety of 2021! This is so low in any historical context, that an increase over the past six months from 2.8% to 3.1% is not overwhelming or concerning to most buyers. As shown above, the average mortgage interest rate was actually at or below 3% (!) for most of the year! And... just like that... we have reached the end of my recap of the 2021 housing market in Harrisonburg and Rockingham County. Do you have questions about this data or these graphs? Or do you have questions that this data and these graphs did not answer? Ask away... just reply to this email! Finally, if 2022 will be the year that you hope to buy or sell a home, let me know if I can be of help to you with that process. I'd be delighted to work to help you accomplish your goals of buying or selling this year. Just reach out by email, phone or text (540-578-0102) and we can set up a time to meet to discuss your dreams, goals and timing! Now, go find that snow shovel and start doing some stretches to prepare for some extended shoveling time... they're now calling for 11 inches of snow for the Harrisonburg area on Sunday! | |
My Predictions for the 2022 Real Estate Market in Harrisonburg and Rockingham County |
|
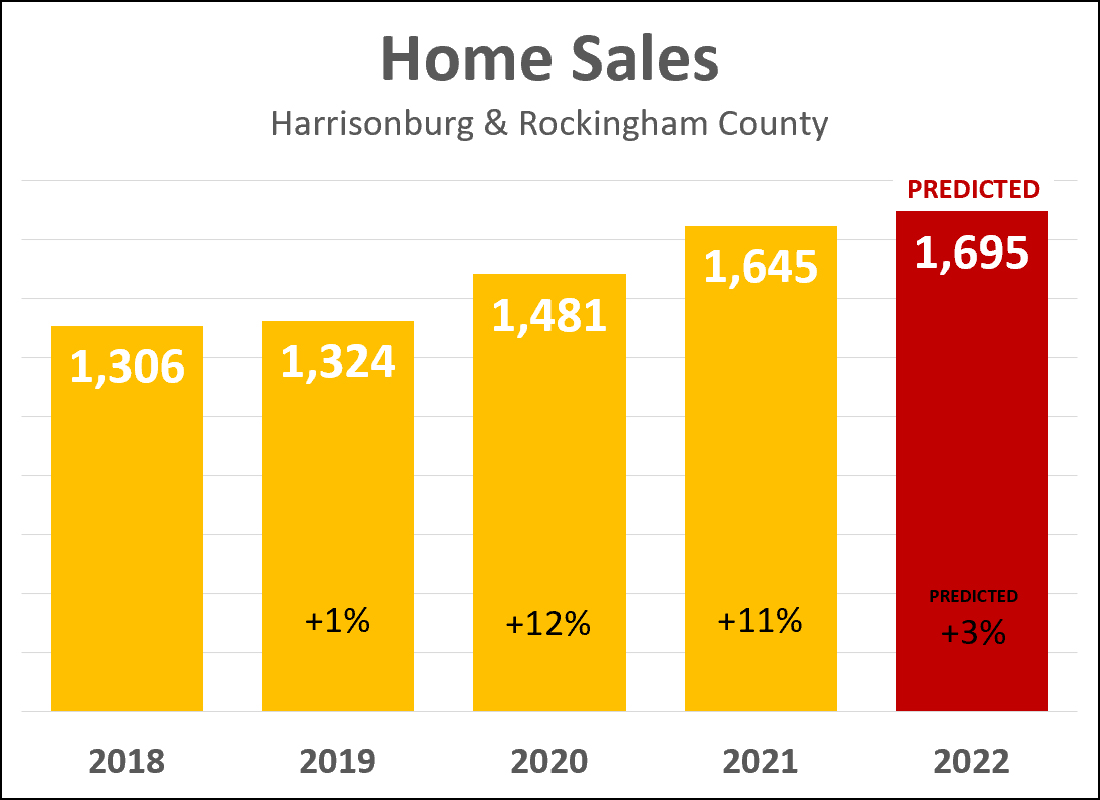 Keep in mind as you read this that I was horrendously off target with my 2021 predictions for our local housing market. :-) But, that being said, here's what I'm predicting and why... As shown above, there have been big gains in the number of home sales per year over the past few years in Harrisonburg and Rockingham County.
Why, then, am I being so conservative and predicting that we'll only see a 3% increase in the amount of homes selling in this area in 2022?
The usual disclaimer applies - I am very comfortable in saying that I might be completely wrong with this prediction...
Now, then, where will prices be headed in 2022? 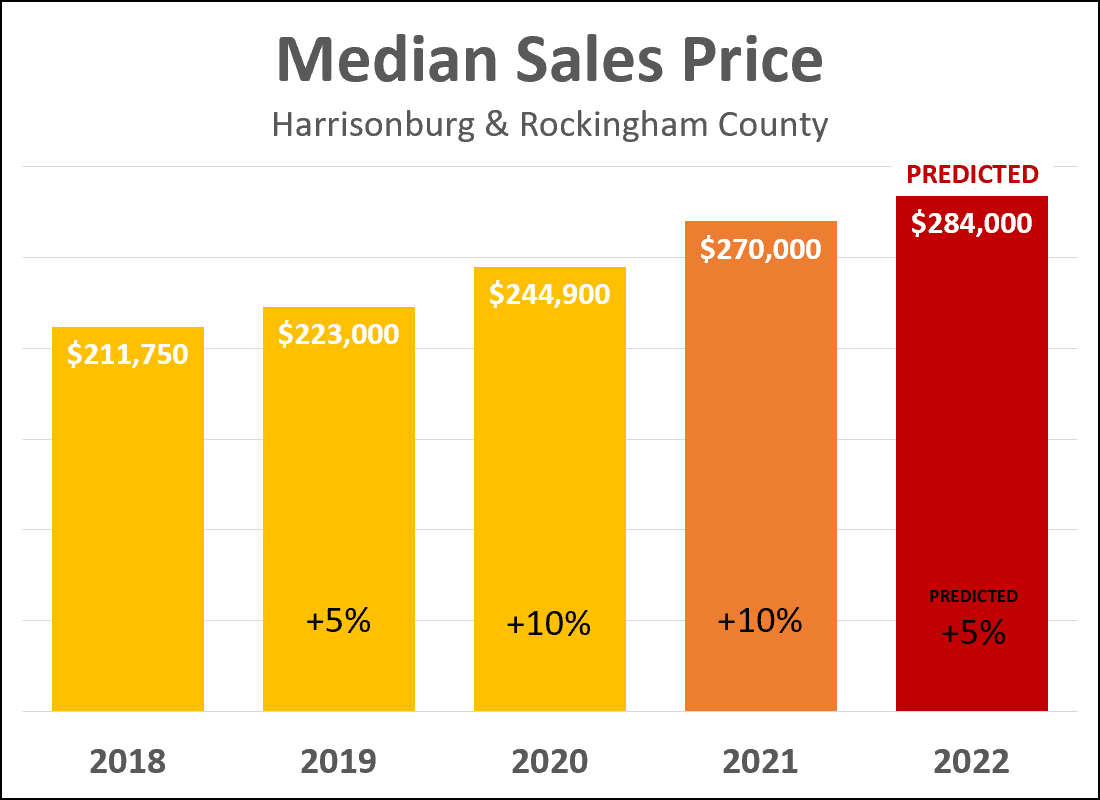 Sales prices of homes in Harrisonburg and Rockingham County increased dramatically over the past two years...
You'll note above that I am predicting a 5% increase in the median sales price over the next year. I'm actually split between two theories, and I ended up averaging them out for my prediction. :-)
So, which of these changes will we see this year in the median sales price? Will it be 0% or 2% or 5% or 10%? You'll note that I am not predicting a decline in the median sales price. Some (not many) home buyers seem to be thinking or hoping or theorizing that home prices will eventually come back down if they wait long enough. That seems relatively unlikely -- so I am not including declining sales prices as one of my predictions for 2022. Well, that about sums it up... I think we'll see 3% more home sales in 2022 at prices 5% higher than in 2021. But I'm ready to be wrong... quite wrong! What do you think? Where will sales and prices head as we move into 2022? | |
My Predictions for the 2021 Harrisonburg Real Estate Market Were Terribly Inaccurate |
|
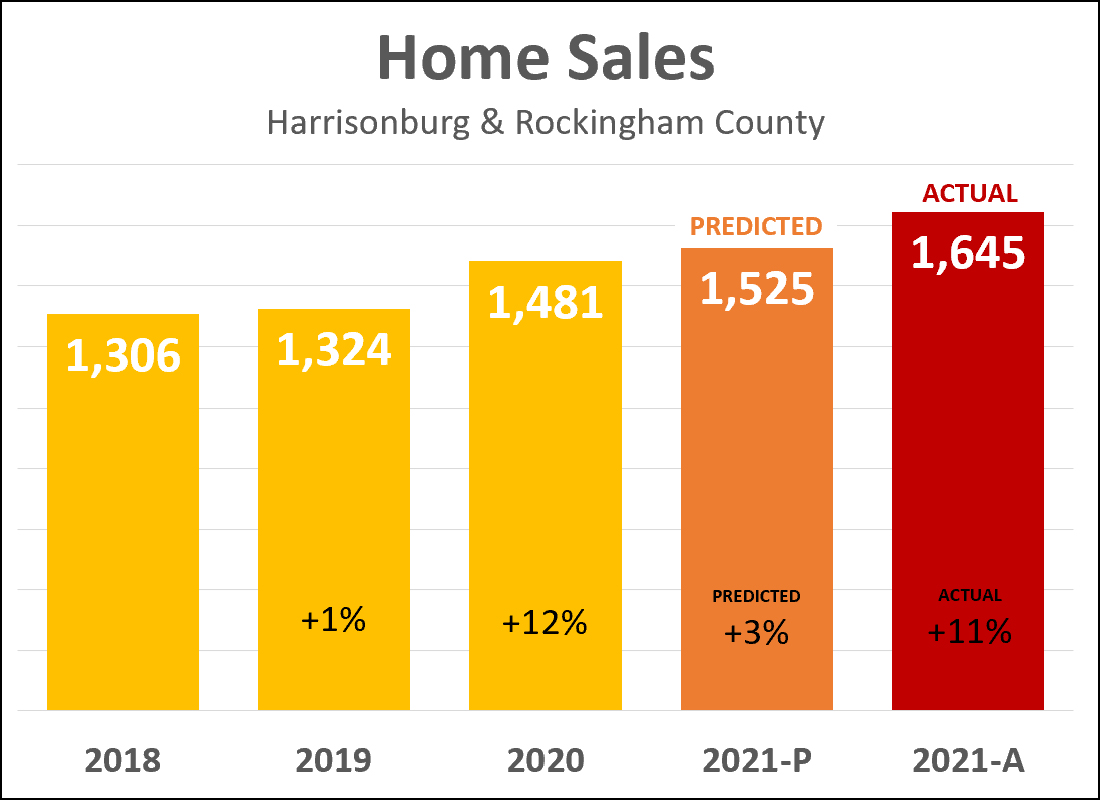 It seems I have been much too conservative in my predictions for our local housing market over the past few years. After a 12% increase in the number of home sales in Harrisonburg and Rockingham County during 2020, I thought we'd see a much smaller increase in 2021. I predicted we would see 3% more home sales in 2021 than in 2020. In actuality -- we saw 11% more home sales in 2021! This was the second year in a row of double digit (12%, 11%) growth in the number of homes selling in the Harrisonburg and Rockingham County area via the HRAR MLS. And how about those sales prices? I was also terribly wrong on this prediction... 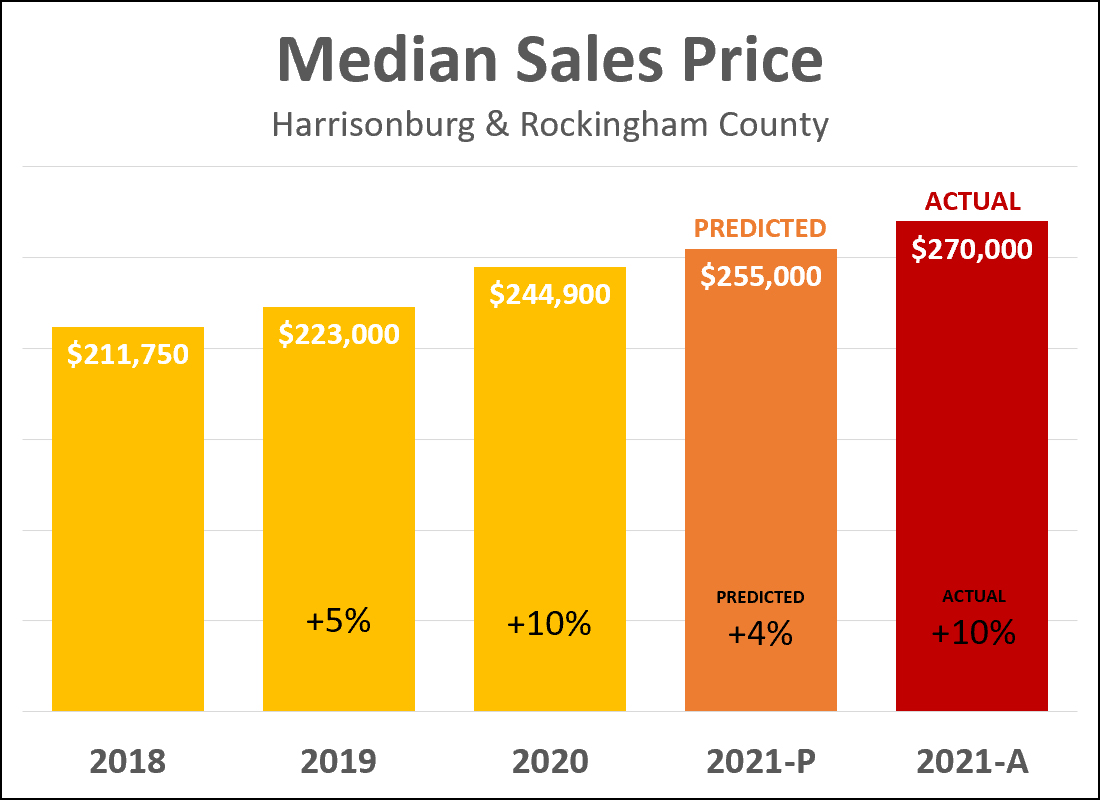 Again, we saw a big increase in 2020 -- with a 10% increase in the median sales price -- which led me to believe we'd see a smaller (4%) increase during 2021. Not so. The median sales price increased *another* 10% in 2021 up to $270,000 in Harrisonburg and Rockingham County. So -- in summary -- my predictions were not at all accurate. While 100% of the data is not recorded yet, it seems we saw an 11% increase in home sales during 2021 and a 10% increase in the median sales price! Stay tuned for my predictions for the 2022 real estate market -- which -- might be just as inaccurate as my 2021 predictions!? :-) | |
City of Harrisonburg Housing Inventory Levels Fall Below 20 Homes For Sale... For First Time Ever!? |
|
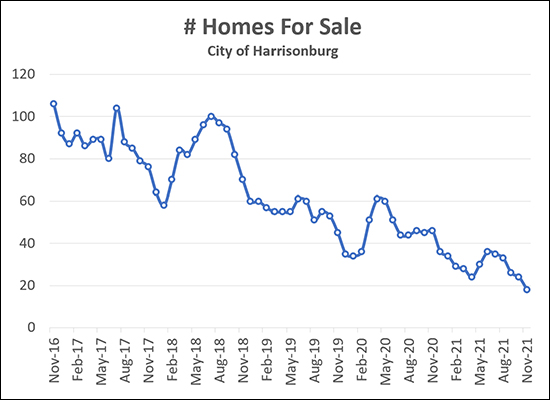 There are now fewer than 20 homes for sale in the entire City of Harrisonburg! As you can see, above, the number of homes for sale at any given time has been falling rather consistently over most of the past five years. The several times when you see inventory levels rising are typically in the spring season. These extremely low inventory levels do not mean that fewer houses have sold in the City over the past five years. Here are the annual City home sales during that timeframe...
So -- plenty of homes are selling in the City this year -- more, in fact, than any of the past five years. These extremely low inventory levels thus mainly mean that as soon as City homes are coming on the market they are almost always quickly going under contract -- keeping inventory levels at any given moment QUITE low! | |
Median Sales Price of Detached Home Up $50K Over Past Two Years! |
|
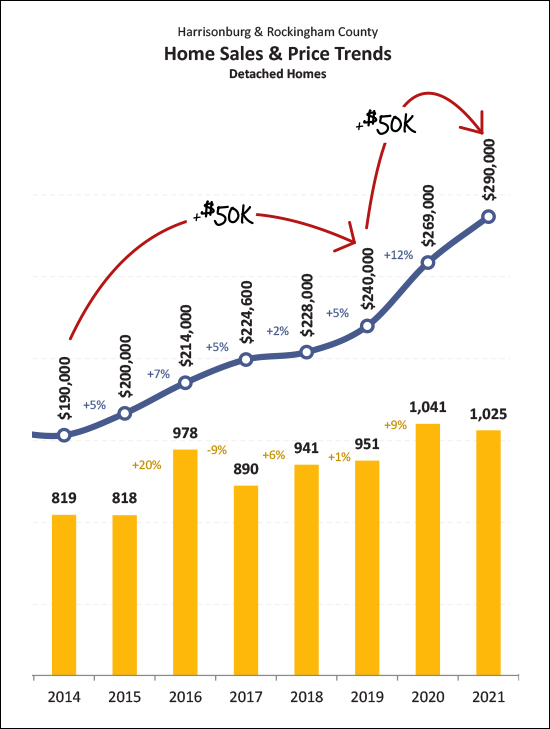 This graph was in my full market report yesterday but it sort of deserves a bit of special attention by itself. Over the past two years, the median sales price of detached homes selling in Harrisonburg and Rockingham County has increased by $50,000. Before that, it took five years to increase by $50,000. As such, over the past seven years the median sales price has increased by $100,000. So... if you bought a median priced detached home seven years ago ($190K in 2014) it very well might be worth $100,000 more today! These are startling changes in property values in our area over the past seven years, especially if you haven't been reading my monthly report each month for the past 84 months! ;-) | |
Harrisonburg Housing Market Is Hot, Hot, Hot In 2021 |
|
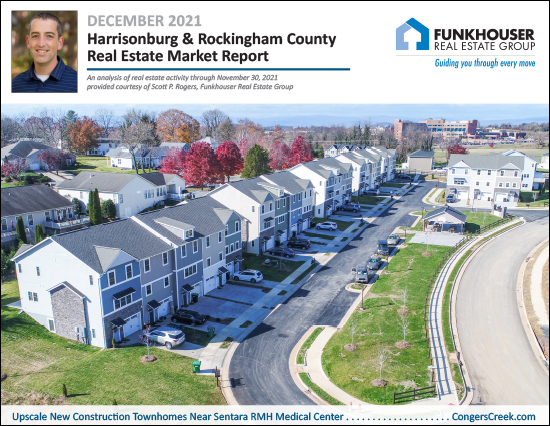 Happy Tuesday Morning, and welcome to day two of another surprisingly warm December week in the Shenandoah Valley! This month's market report is brought to you by... fire...  Why fire, you ask? Partly because the local real estate market is... on fire! ;-) OK, perhaps that one was too obvious. Secondly, though, because it's a great time of year to gather around a fire in the evening and spending time talking about the important things in life. Be that around the fireplace in your home... or huddling around a fire pit, barely staying warm as an evening stretches on. The fire above is in our recently built fire pit in our backyard... where I recently gathered with several friends and we talked and laughed well into the night. However you spend your evenings in the coming weeks... around a fire, or otherwise... I hope it is a time of conversation and connection with those who matter most in your life. But now, back to that local real estate market... which, yes, is on fire... The photo on the cover of this month's market report is an aerial view of Congers Creek where new townhomes are being built and offered for sale near Sentara RMH Medical Center. Also, before I start into the charts and graphs, you can also download a full PDF of my market report here. Now, let's throw another log on the fire and sort through this month's data... 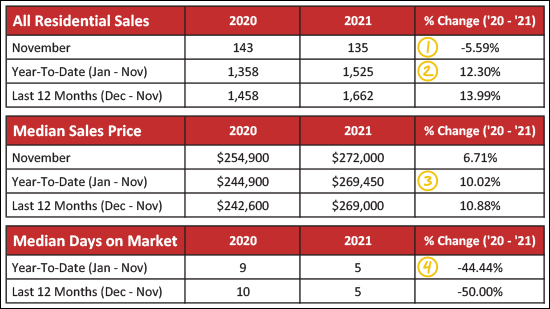 A few things to point out in the data table above... [1] Home sales were actually a bit slower this November than last. We saw 135 home sales this past month -- compared to 143 last November. [2] Despite a slightly slower November, we have seen quite a few more home sales in the first 11 months of this year than last. There were only 1,358 home sales in the first 11 months of last year and we've seen 1,525 home sales in the same timeframe this year. [3] The median sales price of homes sold in Harrisonburg and Rockingham County is 10% higher this year (Jan-Nov) than last year... having risen from $244,900 to $269,450! [4] Homes are selling almost twice as fast this year (5 days) as last year (9 days) as per the change in the median days on market. Now, just to point out a few differences in the market for detached homes and attached homes, which includes townhouses, duplexes and condos... 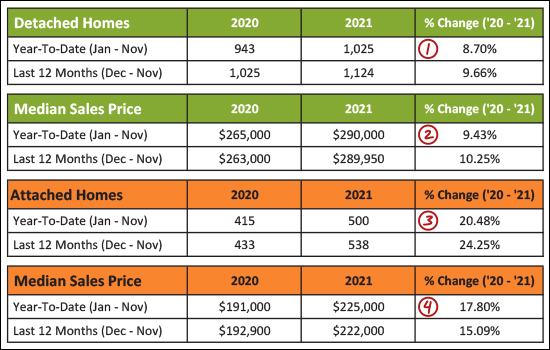 As shown above... [1&3] We've seen almost a 9% increase in the number of detached home sales selling this year as compared to last year -- but a much more significant 20% increase in the number of attached homes that have sold. [2&4] The median sales price of detached homes has risen 9% this year -- but -- wait for it -- the median sales price of attached homes has risen 18% over the past year. This is a significant increase for attached homes, from a median sales price of $191,000 up to $225,000. When we start looking at month to month sales data, things get a bit odd... 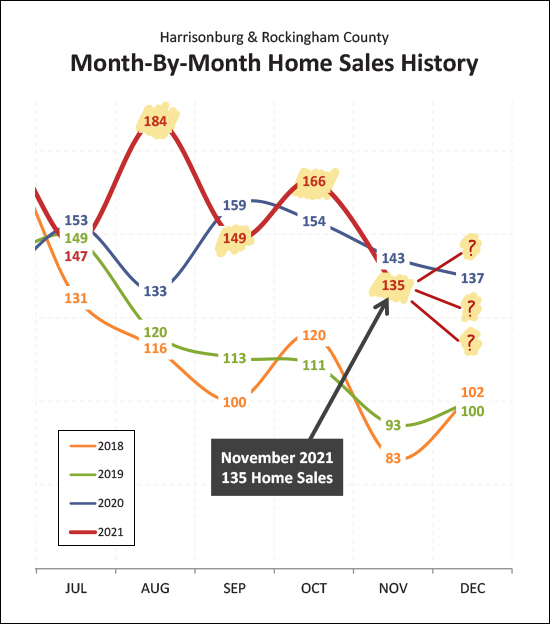 Perhaps everything is a bit odd this year? :-) The red line above shows the number of home sales each month in Harrisonburg and Rockingham County, as compared to the blue line which is showing 2020 home sales. As you can see, home sales were extraordinarily strong in August and October... and then slower than last year in September and November. So... what does December hold in store for the local housing market? It's anyone's guess! :-) But regardless of what happens in December... this year has already outperformed last year... 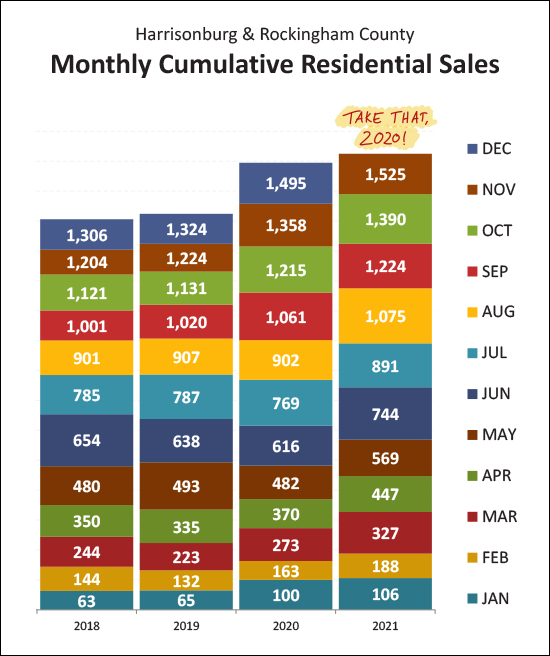 Indeed, after just 11 months this year we have seen 1,525 home sales as compared to only 1,495 in all of 2020. There was a significant increase in local home sales in 2020 and in early 2021 there were doubts as to whether 2021 could really stay on pace with such a robust year last year. Well, 2021 is finishing out strong.. already having broken through the high water mark set last year. Now, a quick -- startling -- observation about the changing values of detached homes in our area...  Maybe you already picked up on it based on the graph above... but... WOW! [1] Over the course of five years (2014-2019) the median sales price of detached homes increased by $50,000. Then, over the course of only two years (2019-2021) it did it again! ...and... [2] Over the past seven years (2014-2021) the median sales price of a detached home in Harrisonburg and Rockingham County has increased by $100,000... from $190,000 up to $290,000! These are startling changes in property values in our area over the past seven years, especially if you haven't been reading my monthly report each month for the past 84 months! ;-) Now, moving beyond what's selling, let's look for a moment at current inventory levels of homes that are available for sale. Remember, though, that these figures are showing "moment in time" inventory levels. There have been plenty of homes offered for sale in recent months even if very few are on the market now. First, let's look at houses for sale by property type... 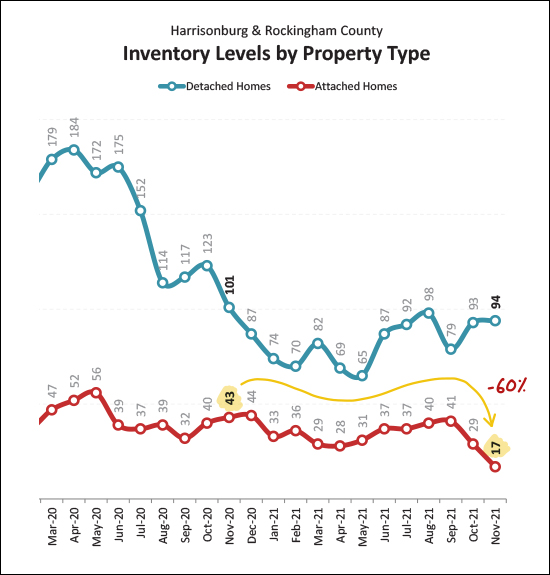 This one surprised me. I knew that inventory levels were dropping, but I didn't know how far they had declined when it came to attached homes -- townhouses, duplexes and condos. A year ago there were 43 attached homes on the market for sale -- now, only 17 are currently available for sale. This 60% decline means that buyers are snapping up attached homes faster than sellers are listing them for sale or building them. But wait, there's more. Take a look at this breakdown between the City and County... 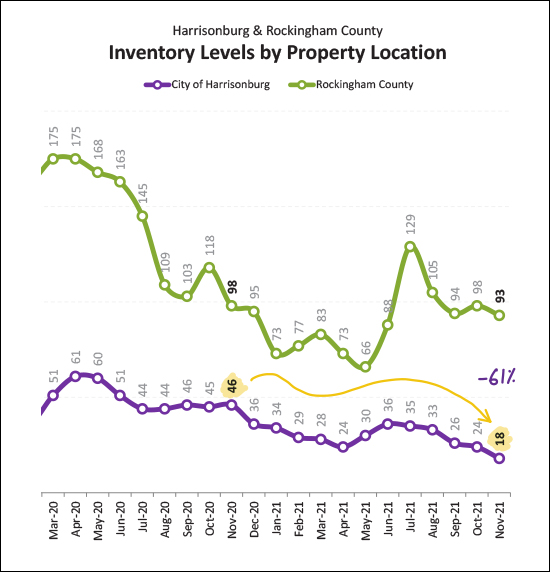 Again, this graph reveals a rather surprising trajectory. A year ago there were 46 homes for sale (detached or attached) In the City of Harrisonburg. Today there are only 18 homes for sale in the City. Read that twice, perhaps. There are only 18 homes (detached homes, townhouses, duplexes, condos) currently available for sale in the City of Harrisonburg. Again, this is an indication that buyers in the City are snapping up homes more quickly than sellers are selling them. Despite the 50 to 60 degree temperatures of late, you might be wondering if the market is remaining strong as we head into the winter... 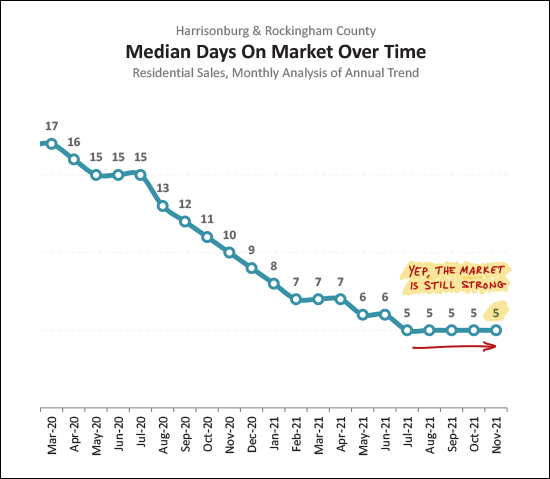 Indeed, the market is remaining strong. The graph above shows the median number of days it took for houses to go under contract - with each data point calculated from the properties going under contract in the previous 12 months. As you can see, we have sort of bottomed out at a median of five days on the market here over the past five months. If the market is starting to cool off or slow down, this graph is one of the places we are likely to first see that show up in the data. Given the low availability of houses to purchase, are some buyers thinking about building a house? 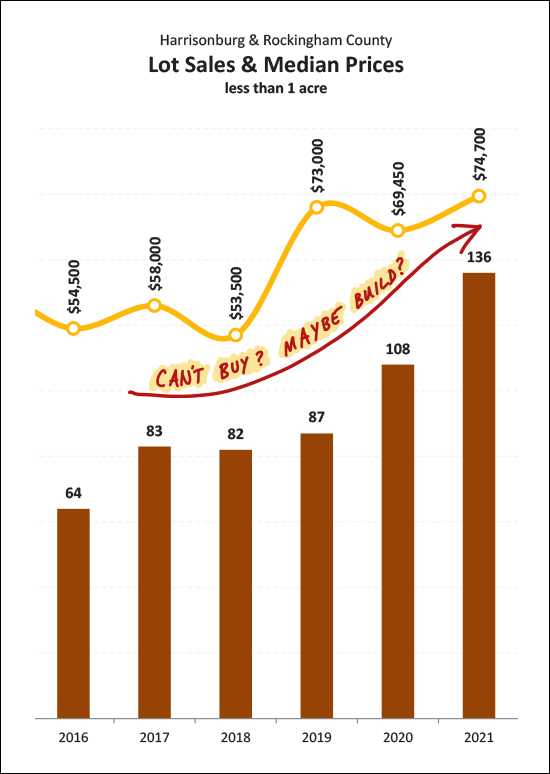 Maybe so! The graph above shows the number of building lots (of less than an acre) sold per year over the past six years. As you can see, the market demand for building lots has been increasing for several years now. Unfortunately, construction costs are also increasing, which may make it at least somewhat difficult for these lot buyers to build a home and stay on budget -- but at least they will have a bit more control over getting the house they want, as compared to competing with many other buyers in the resale market. One last graph and then I'll let you go out in your backyard to start gather kindling for the fire you plan to have this evening. ;-) 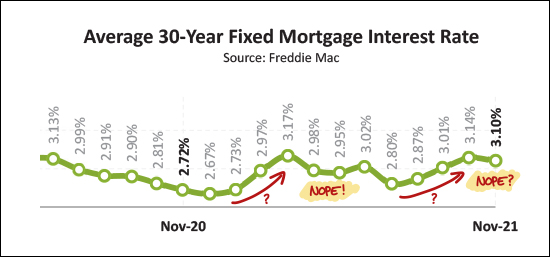 For years I've been thinking mortgage interest rates will be starting to increase. It keeps not happening. Over and over. This year, it seemed -- again -- they were definitely going to increase. Back in January through March it seemed we were headed that way -- but, nope. Then again in August, September and October, but then, maybe not. So, the cost of money is still extremely low! Alright, that brings this month's overview of our local housing market to a close. Thanks for hanging in there with me if you made it to the end, and I hope the information and context I have provided has been either helpful or entertaining, or both! I hope the last two-ish weeks of 2021 go well for you, and that you are able to enjoy some down time with family and friends. If you enjoy some time around a fire, maybe you can make a s'more for me -- I like the marshmallow to be toasted very, very, very slowly and thoroughly until it is a golden brown on the outside and completely gooey in the middle -- constant rotation of the stick helps. I also find it best to leave the chocolate resting on the graham cracker next to the fire while I toast my marshmallow so that the chocolate will start to melt as well. I know, I know. It's overwhelming to get both gourmet outdoor cooking tips AND real estate updates at the same time. ;-) Finally, as we all look towards 2022, if you are contemplating a home purchase or a home sale in the New Year, let's find a time to talk further about your plans. You can reach me via phone/text at 540-578-0102 or by email here. | |
Strong Contract Activity In Local Housing Market, Again, In November |
|
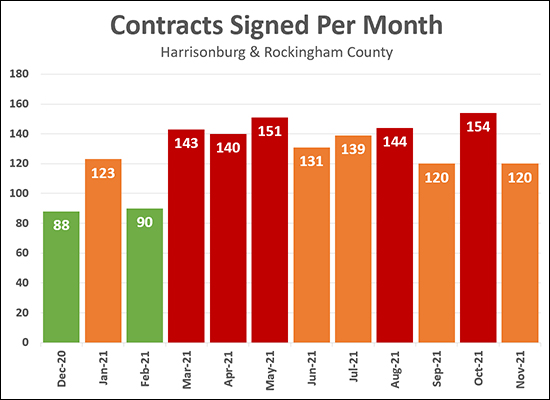 Another month -- lots more contracts. 120 buyers (and sellers) signed contracts to buy (and sell) homes in Harrisonburg and Rockingham County during November 2021. One might have thought it would have been a slow month for contracts, but not so. This puts it in the 120-139 range, along with January, June, July and September. In the past year, the two slowest months for contracts being signed were December and February. Perhaps this December will follow suit and also will be slow -- or maybe it will be another unexpectedly strong month of contract activity. | |
| Newer Posts | Older Posts |
Scott Rogers
Funkhouser Real
Estate Group
540-578-0102
scott@funkhousergroup.com
Licensed in the
Commonwealth of Virginia
Home Search
Housing Market Report
Harrisonburg Townhouses
Walk Through This Home
Investment Properties
Harrisonburg Foreclosures
Property Transfers
New Listings

