Monthly Market Analysis
| Newer Posts | Older Posts |
July 2011 Harrisonburg and Rockingham County Real Estate Market Update |
|
I just completed my monthly analysis of the Harrisonburg and Rockingham County real estate market. Click here for a PDF of the 25-page report or read on for some highlights. While the local housing market hasn't fully recovered yet, there is plenty to be excited about from the most recent market data below.... 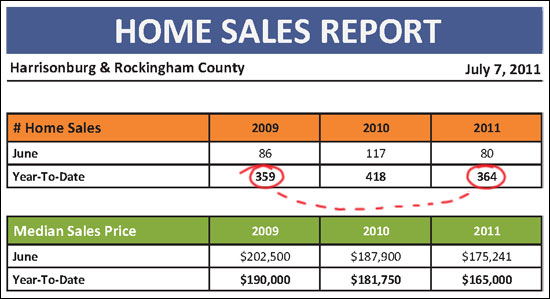 While year to date home sales (364) are a good bit below last year (418), we're on track with a 2009 sales pace. The thing to remember about 2010 is that many home sales were pushed into the first half of the year because of the expiration of the federal home buyer tax credit. Thus, as we continue through 2011, we stand a good chance of catching up with (or surpassing??) the pace of 2010 home sales. Median sales prices are still declining, but if the sales pace stabilizes and starts to increase, it will lead to a stabilization of sales prices and home values. 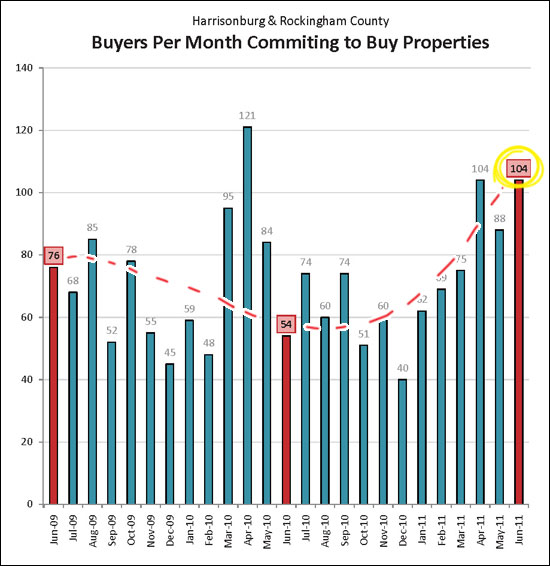 June 2011 was a FANTASTIC month of contracts -- the second month this year with over 100 contracts signed. This is a strong indicator that we will see strong home sales in July and August. 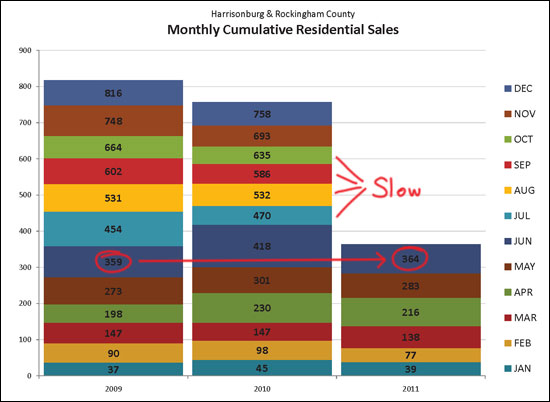 The graph above explores the number of cumulative month-by-month home sales --- you ought to note that last July, August, September and October were quite slow after the expiration of the home buyer tax credit. I believe we're poised to see some strong performance in the local real estate market over the next three to six months --- and hopefully well beyond that time!  You'll find even more exciting news in my full market report (click here for the PDF) --- and some not so exciting news to keep you well balanced. As always, if you have questions about this report, or if I can be of assistance with real estate that you own, or that you'd like to own, please be in touch. You can reach me most easily at 540-578-0102 or scott@HarrisonburgHousingToday.com. | |
Home sales pace, sales price decline in Harrisonburg and Rockingham County |
|
I just completed my monthly analysis of the Harrisonburg and Rockingham County real estate market. Click here for a PDF of the 24-page report or read on for some highlights. While there are several indicators that Harrisonburg and Rockingham County might be starting to see a recovery in the housing market, there are still plenty of trends that are not as hopeful. 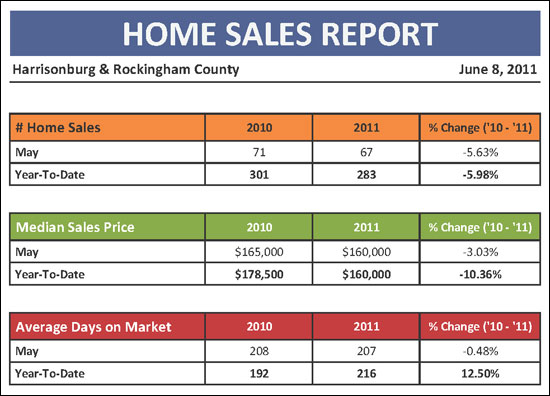 Above you will note that sales are still lower this year than in 2010, with a 6% decline in May 2011 sales (compared to May 2010) and a 6% decline in year-to-date home sales. Median prices also continue to decline, with a rather steep 10% decline in median sales price over the past year (Jan-May 2010 vs. Jan-May 2011). 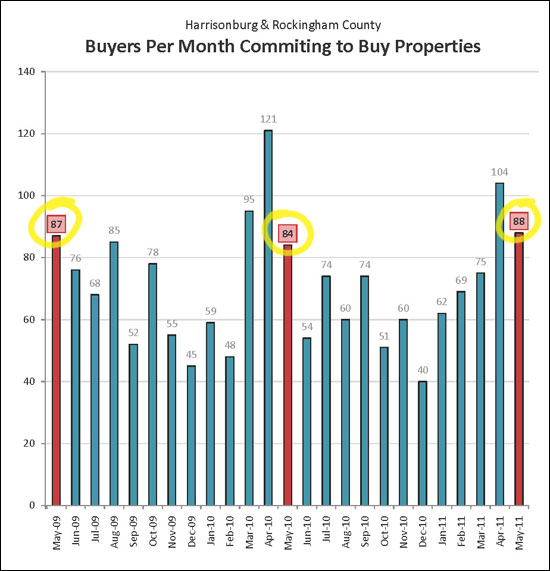 Despite a downward trend in the pace of home sales and in median prices, we are still on a several-month run of lots of buyers committing to buy homes in Harrisonburg and Rockingham County. This should, in theory, help to stabilize the pace of home sales over the next few months. May 2011 contracts exceeded both May 2010 and May 2009! 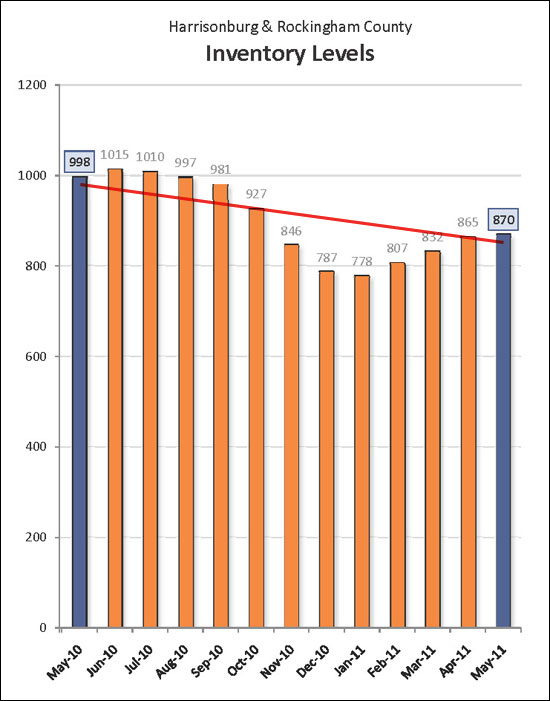 The graph above (inventory) is one trendline that we're happy to see decline. There are currently 13% fewer homes on the market as compared to a year ago! This helps to balance the market, though there are still many more sellers in the market than buyers. 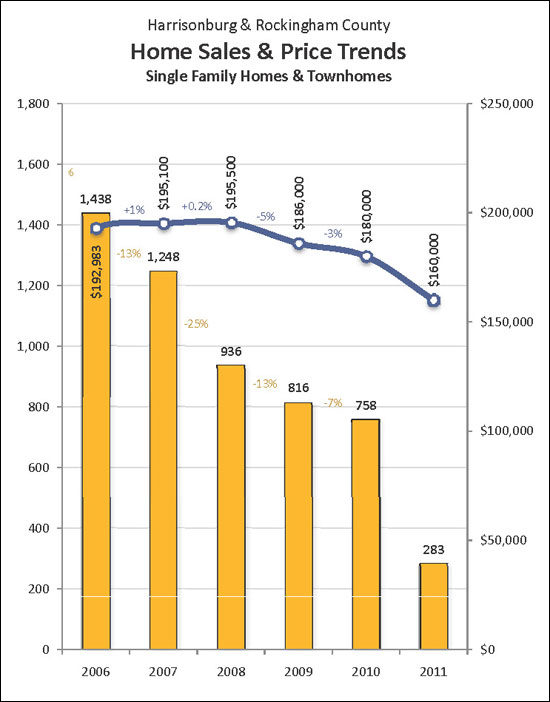 Over the past five years, the pace of home sales has declined almost 50% in Harrisonburg and Rockingham County. Despite this tremendous decline in the number of home buyers in our market, the median price did not start declining until 2008, and even then, only had a slight decline (8%) through the end of 2010. As 2011 finishes out, we'll get a better idea of how these two trends (pace, price) will perform. For more reading, click here to download the full Harrisonburg & Rockingham County Real Estate Market Report as a PDF. As always, if you have questions about this report, or if I can be of assistance with real estate that you own, or that you'd like to own, please be in touch. You can reach me most easily at 540-578-0102 or scott@HarrisonburgHousingToday.com. | |
Strong Sales, Stronger Contracts, Fewer Homes For Sale |
|
Taking a look at the first four months of 2011, there are some signs of good news in our local market.....and certainly still some indicators that are not quite as positive. Click here to download the full Harrisonburg & Rockingham County Real Estate Market Report as a PDF, or read on for some highlights.... 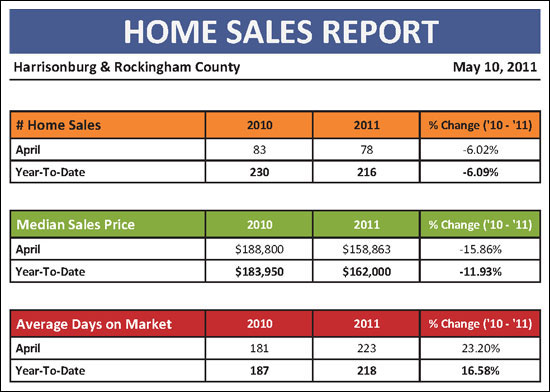 As seen above, year-to-date sales are only down 6% -- though median prices are down 12% as compared to a year ago. 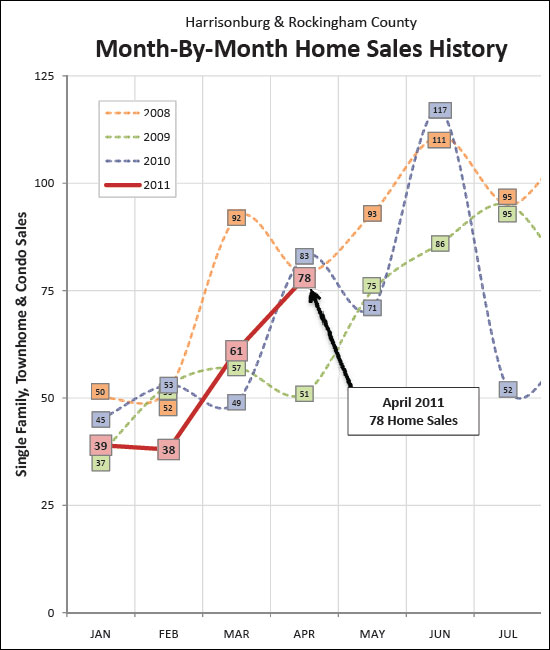 Home sales have been going strong through March and April (the red line above), after a slow start in January and February. Hopefully we will continue to see a sales trajectory that will exceed May 2010, and perhaps come close to June 2010. 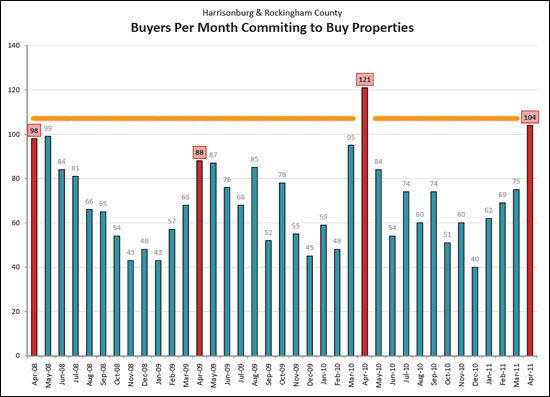 Buyers were QUITE active in April 2011 --- the number of contracts written (104) was the highest month of contracts in the past three years with the exception of last April. This bodes well for strong sales numbers in May and June! 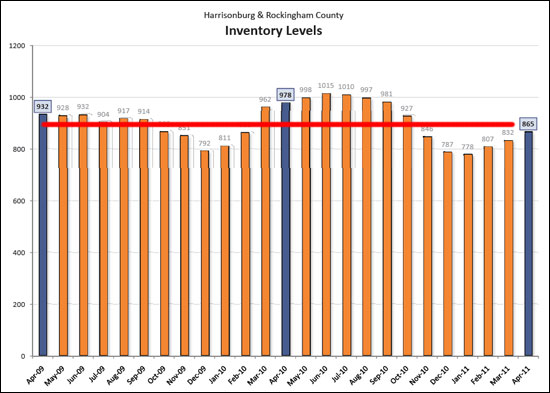 Even better news is that while buyer activity is increasing, seller activity isn't getting too out of hand. We have significantly lower numbers of listings this spring as compared to the past two springs. Our real estate market still has a long way to go before it is stable -- but April 2011 market activity seems to indicate that we are headed in that direction. For more reading, Click here to download the full Harrisonburg & Rockingham County Real Estate Market Report as a PDF. As always, if you have questions about this report, or if I can be of assistance with real estate that you own, or that you'd like to own, please be in touch. You can reach me most easily at 540-578-0102 or scott@HarrisonburgHousingToday.com. | |
Home Sales Strong Despite (or because of) Price Declines |
|
March 2011 home sales show plenty of positive indicators, though the local market is still a ways off from a full recovery. 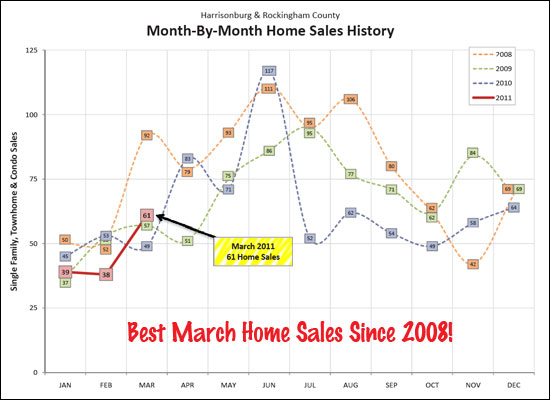 After mediocre performance in January and February, the Harrisonburg and Rockingham County housing market finally witnessed some growth in March 2011. March's 61 home sales exceeded March 2010 (49 sales) and March 2009 (57 sales), and contributed to an overall decline in home sales of only 6% between 2010 (YTD) and 2011 (YTD). 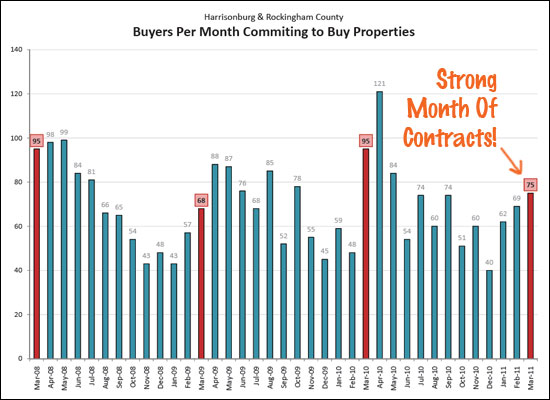 Not only did buyers close on properties in March, they also contracted on properties --- though probably not the same buyers. March 2011 showed another strong month of contracts (75), exceeding March 2009 figures (68). Last March's contract figures (95) were significantly affected by the home buyer tax credit. 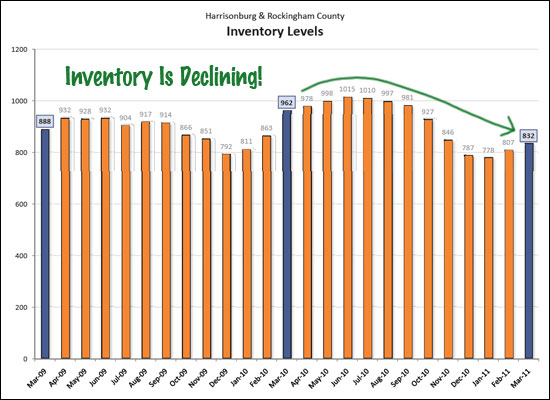 Despite increases in inventory over the past two months, it appears that 2010's peak of over 1,000 properties for sale will not be met this year. We have seen an overall decline of 13.5% over the past year in the number of residential properties for sale, which can help restore balance to the market. 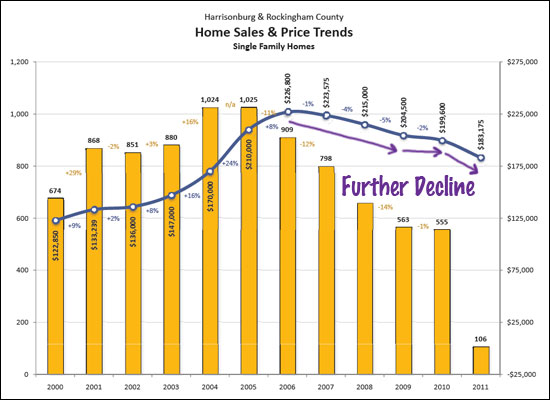 Despite the strong indicators noted above, we do see that the median sales price of single family homes has started to decline again more sharply after a relatively steady year last year. We may not be totally out of the woods yet.  There's plenty more news in my monthly housing market report -- click on the image above (or here) to download and view the full PDF. As always, if you have questions about this report, or if I can be of assistance with real estate that you own, or that you'd like to own, please be in touch. You can reach me most easily at 540-578-0102 or scott@HarrisonburgHousingToday.com. | |
Home Sales Down, Prices Down, Is There A Silver Lining? |
|
Despite many negative indicators in our local housing market, there may be hope for better news in the coming months. Click here to view a PDF of my most recent market report on the Harrisonburg and Rockingham County Real Estate Market, or read on for several excerpts.... 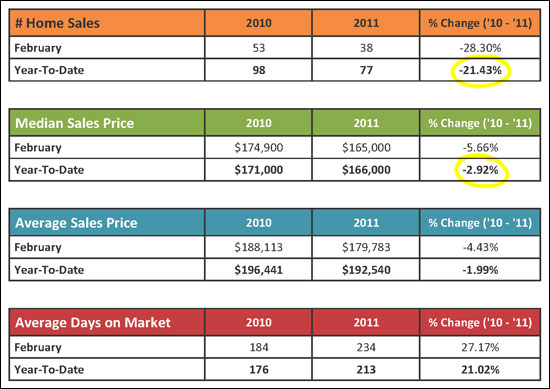 As can be seen above, sales have dropped significantly as compared to a year ago -- both in February alone (28% decline) and in year-to-date figures (21% decline). Furthermore, we continue to see declines in both median sales prices (3% decline) and average sales prices (2%). As would be expected, this has lead to an increase (21%) in the time it takes to sell a house. 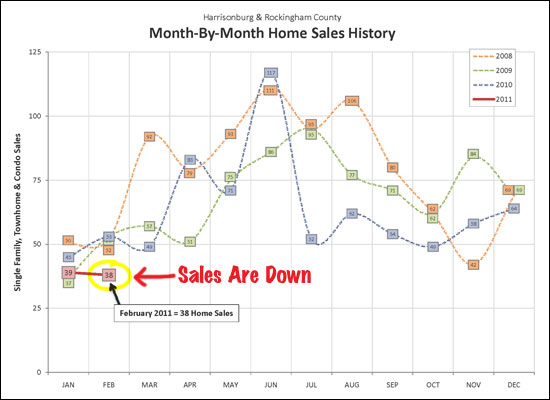 Above you will note that January home sales (39) were roughly equivalent to previous years' January sales. February 2011 home sales however (38) were significantly lower than February sales in 2008, 2009 and 2010. Thus far, the trend line for 2011 home sales is headed in the wrong direction -- if you're one of those people who likes to see positive improvement.! 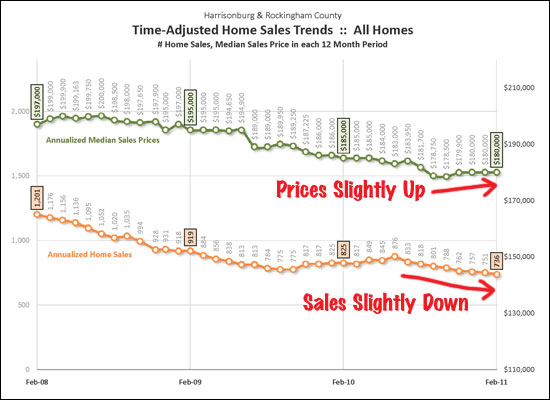 The pace of home sales has declined steadily for three years (orange line above), as has the median sales price in this area (green line above). Of note, the median sales price has actually stabilized and increased somewhat over the past six months. 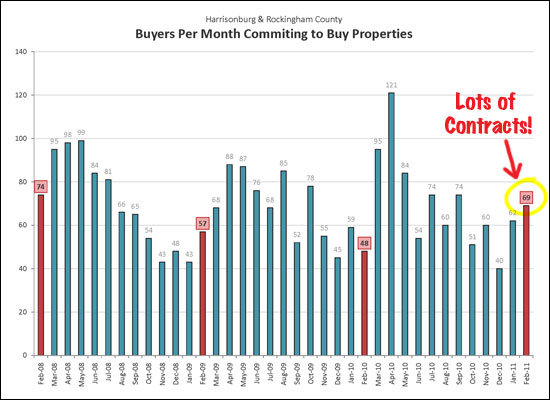 Above (in red and blue, instead of silver) is the silver lining of this month's housing market report. Buyers were out in full force in February 2011 --- with a full 69 properties going under contract. This marks a 44% increase over February 2010, which should lead to strong sales figures in March and April.  There's plenty more news in my monthly housing market report -- click on the image above (or here) to download and view the full PDF. As always, if you have questions about this report, or if I can be of assistance with real estate that you own, or that you'd like to own, please be in touch. You can reach me most easily at 540-578-0102 or scott@HarrisonburgHousingToday.com. | |
Mixed Signals From January Housing Market Activity in Harrisonburg and Rockingham County |
|
My most recent market report (excerpts below, full report here) shows a variety of mixed market indicators when examining market data through January 31, 2011:
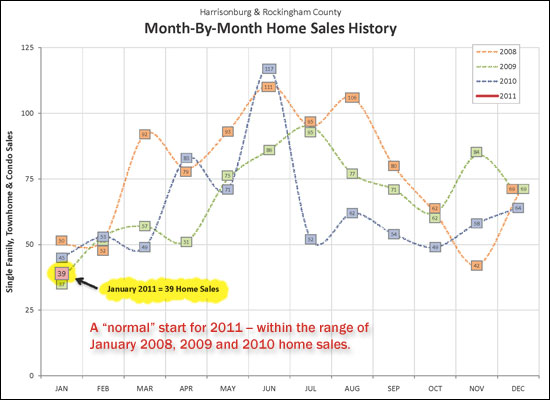 Home sales in January 2011 (39 sales) were down compared to the 45 sales in January 2010 -- but up compared to the 37 sales in January 2009. This is a relatively even start for 2011, and if the past three years are any indicator, we'll have around 50 home sales in February. 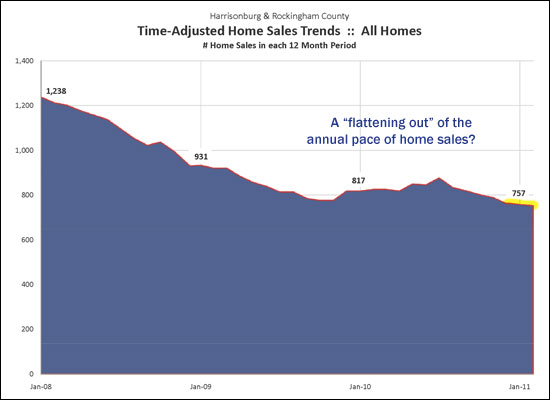 This graph shows a rolling 12 months of home sales -- and you can see that the annual pace of home sales has been declining for several years other than the temporary respite offered by the home buyer tax credit last year. The last several months, however, seem to be offering some leveling out of this indicator. 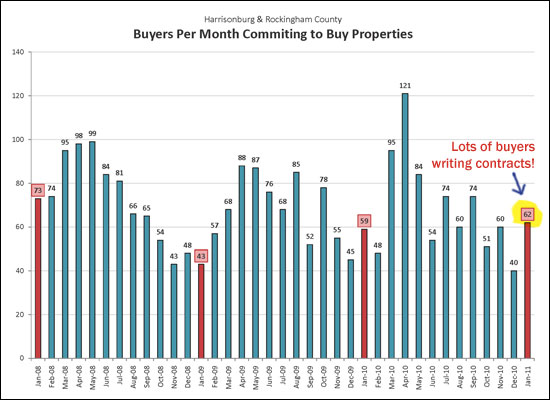 Buyers were out in full force in January 2011 -- 62 properties went under contract. This is an increase over January 2010 (59 contracts), an increase over January 2009 (43 contracts) and an increase over last month (40 contracts). This could be a strong spring market. 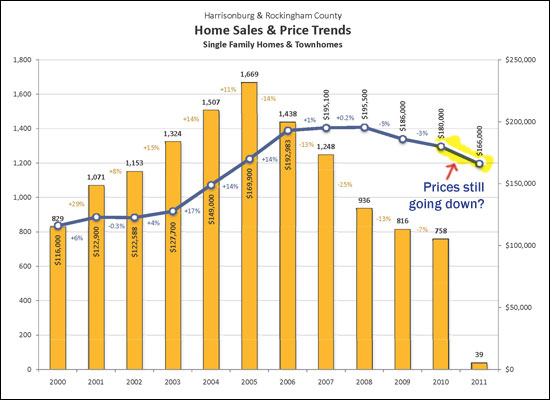 Perhaps due to a small sample size, the median sales price continues to decline in January 2011. 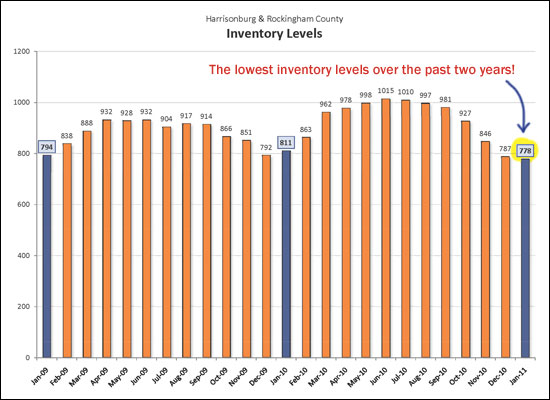 We are currently seeing the lowest inventory levels that we have seen over the past two years. This can help the market to stabilize, unless the market is flooded with listings in March and April.  Click the image above (or here) to read the full report. If you have questions about this report, or if I can be of assistance with real estate that you own, or that you'd like to own, please be in touch. You can reach me most easily at 540-578-0102 or scott@HarrisonburgHousingToday.com. | |
Harrisonburg Housing Market Steadies in 2010, Except Townhomes |
|
I have just published my most recent real estate market report with lots of information about the Harrisonburg and Rockingham County real estate market to help you make more informed real estate decisions in 2011. Click here to download the PDF, or read on.... 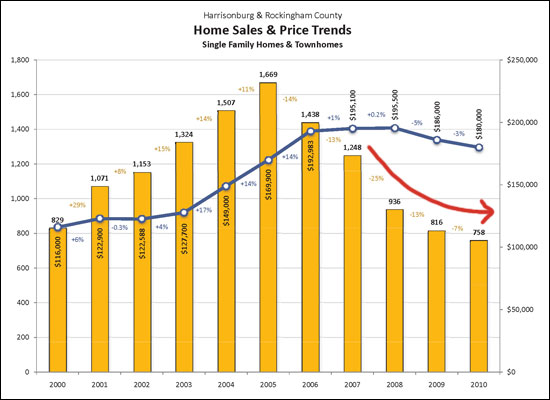 While there were even fewer home sales in 2010 than in 2009, we seem to be nearing the bottom of a gradual decline we have been experiencing since 2005. After 14%, 13%, 25% and 13% year over year declines, there was only a 7% drop in sales between 2009 and 2010. Perhaps 2011 will finally be the year when we meet or exceed the prior year's sales count. 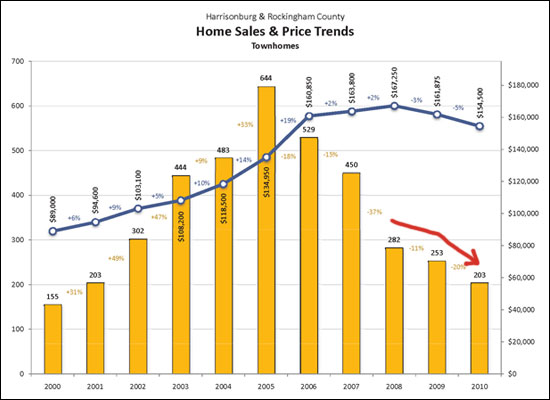 While the overall market may be recovering, the townhouse market continues to struggle to pick up any momentum. After only an 11% decline in the number of townhome sales between 2008 and 2009, we saw a full 20% drop between 2009 and 2010. And yes, this was amidst the first time buyer tax credit season! 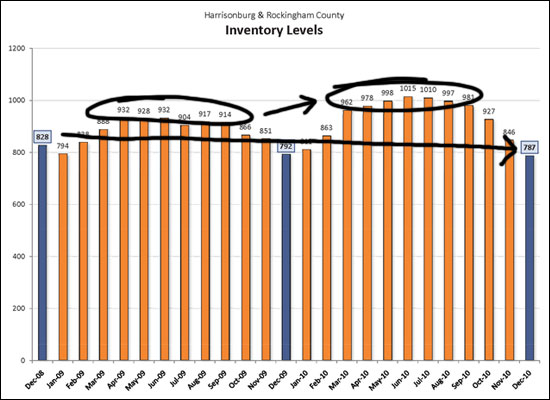 While inventory levels were higher for most months of 2010 than in the same months in 2009, we have seen a significant decline in inventory over the past six months. After a high of 1,015 homes for sale in June 2010, the market is now down to only 787 homes for sale --- the lowest in the past two years. 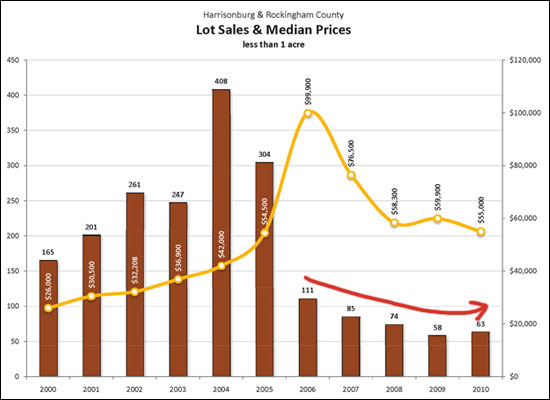 Lot sales finally recovered -- at least in their pace, if not their price. After several very (VERY) slow years of lot sales, 2010 lot sales exceeded 2009 sales -- just barely. These sales are of lots smaller than an acre. Prices, as you can see, have dropped quite a bit over the past several years, down to the current median lot price of $55,000.  Click the image above (or here) to review the entire market report. If you have questions about this report, or if I can be of assistance with real estate that you own, or that you'd like to own, please be in touch. You can reach me most easily at 540-578-0102 or scott@HarrisonburgHousingToday.com. | |
Housing Market Report: Sales Increase, Prices Increase, Contracts Increase in Harrisonburg, Rockingham County |
|
Below you will find several highlights from my December 2010 Harrisonburg and Rockingham County Real Estate Market Report, available as a PDF by clicking here. Our local real estate market still has a ways to go before recovering, but there are some positive signs this month. 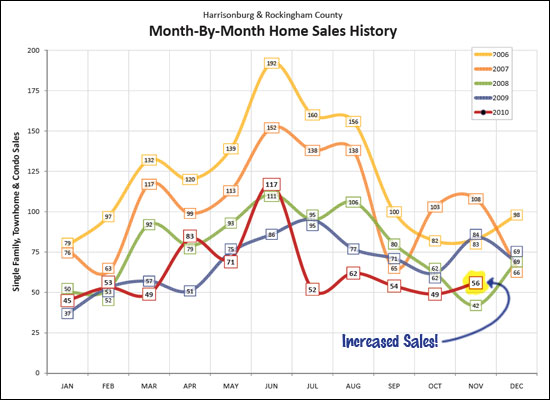 First, you'll note (above) that home sales increased in November 2010 as compared to the previous month (October 2010). Sales in November were lower than in November 2009, but last November had the benefit of being the intended deadline for the home buyer tax credit -- thus lots of extra buyers closed in November. 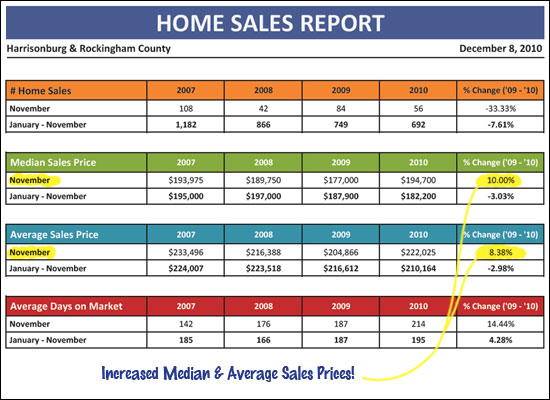 Median sales prices and average sales prices both increased in November (10%, 8%). This, however, is likely because the median and average sales prices were much lower than normal last November as a result of so many first time buyers closing (on properties with low purchase prices) during November. Year to date figures still show a 3% year over year decline in prices. 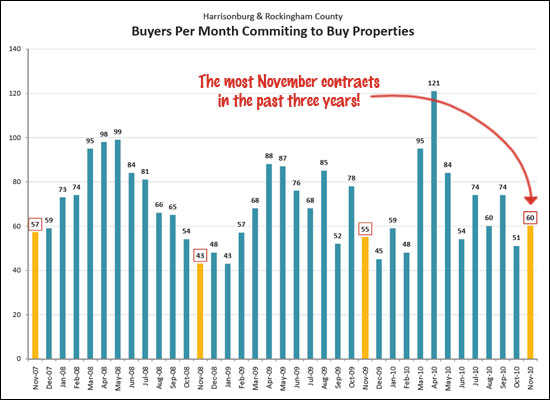 More buyers committed to buy properties in November 2010 than we have seen in the past three Novembers! Hopefully we'll see a strong December as well.  Click the image above (or here) to review the entire December 2010 Harrisonburg and Rockingham County Real Estate Market Report. If you have questions about this report, or if I can be of assistance with real estate that you own, or that you'd like to own, please be in touch. You can reach me most easily at 540-578-0102 or scott@HarrisonburgHousingToday.com. | |
Despite Slow Sales, Home Values Remain Relatively Stable in Harrisonburg and Rockingham County |
|
Read on for several highlights of the November 2010 Harrisonburg and Rockingham County Real Estate Market Report. Or click here to view the PDF. 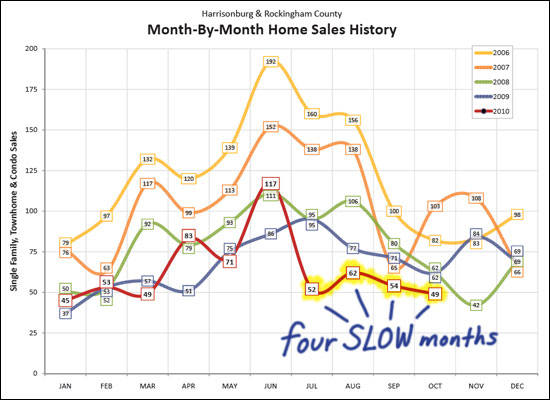 Despite early gains in 2010 (particularly in April and June) home sales have stagnated over the past several months. July, August, September and October of 2010 have been the slowest such months during the past five years. Despite these low sales figures, however, year-to-date sales are only 4% below last year's sales. 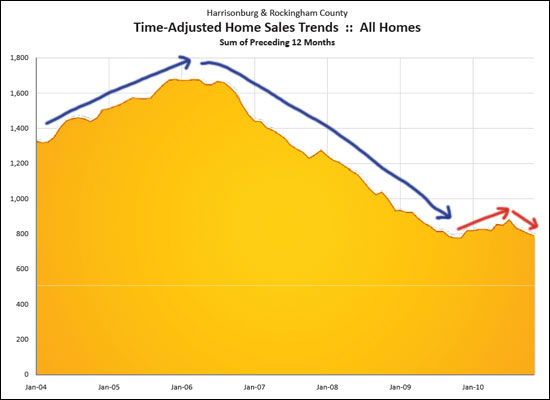 Late 2009 through mid 2010 showed some promise. After several years of declining home sales (pace, not values) it seemed that our local market had finally turned around. Now looking back, that increase in sales pace may have been largely related to the home buyer tax credit, as the pace of sales is now on the decline yet again. What surprises lie in store for us in 2011? 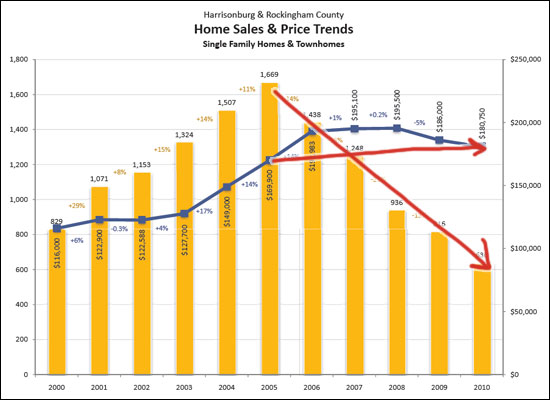 As demand falls, prices should fall --- isn't that what I learned back in my economics class at JMU? Not so in the Harrisonburg and Rockingham housing market!?! Fewer and fewer buyers have been present in the market over the past six years (demand fell) but prices have not fallen in the way that that shift in demand would suggest. Calling all economists....how can we explain this? 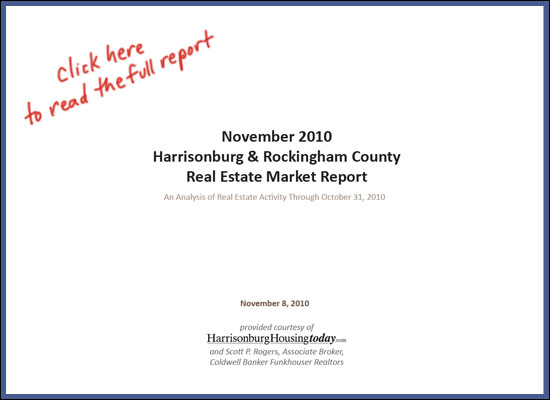 Click the image above (or here) to review the entire November 2010 Harrisonburg and Rockingham County Real Estate Market Report, complete with an all new Executive Summary this month. If you have questions about this report, or if I can be of assistance with real estate that you own, or that you'd like to own, please be in touch. You can reach me most easily at 540-578-0102 or scott@HarrisonburgHousingToday.com. | |
Harrisonburg Home Sales Decrease, Contracts Increase, in September 2010 |
|
Below are several highlights from the October 2010 Harrisonburg & Rockingham County Real Estate Market Report. Read on, or click here to download a PDF of the entire report. 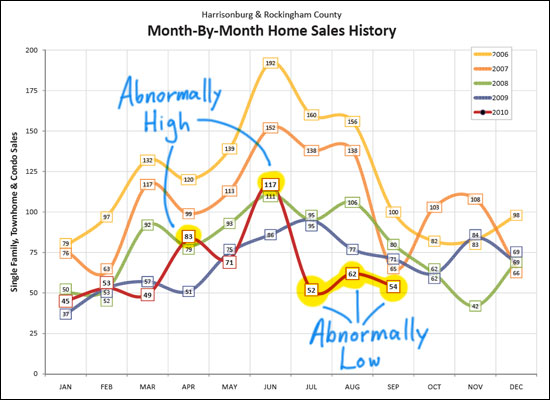 As you'll note above, there were very few home sales in September 2010. In fact, there were very few home sales in in July, August and September! That was, however, after very high home sales in April and June. Thus, it would seem that the home buyer tax credit certainly rearranged the timing of 2010 home sales, regardless of whether it brought new buyers into the market nor not. The question now, of course, is how many of the October, November and December closings were borrowed by the first half of 2010. 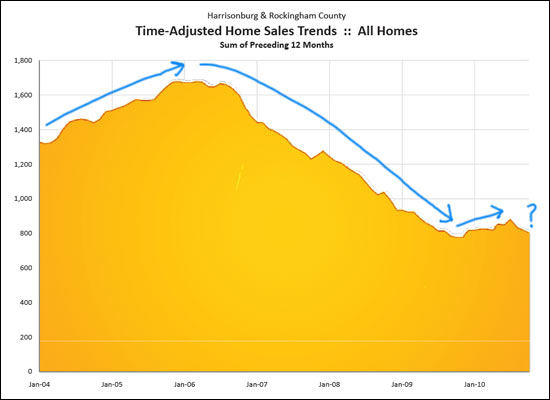 After multiple years of a declining sales pace, the graph above shows that we were finally seeing a reversal for the first six months of this year. However, the past three months of slow sales has turned us back around into a declining market again. The fourth quarter of 2010 will be quite indicative as to a reasonable 2011 forecast. 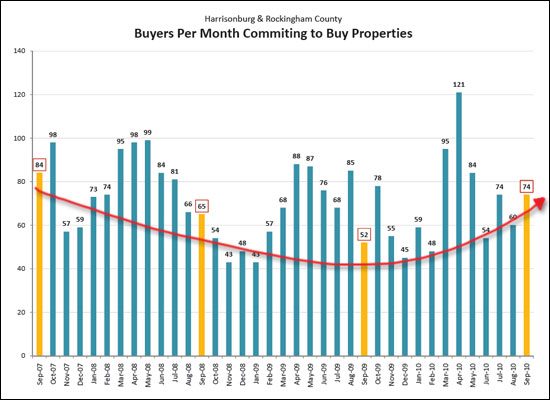 Please note, above, the silver lining. Despite a lower than normal number of closings in September 2010 -- the buyers were out yet again, contracting to buy real estate. In fact, with 74 properties going under contract, buyers in our market outpaced the past two Septembers. This should be a good indicator for the coming months. 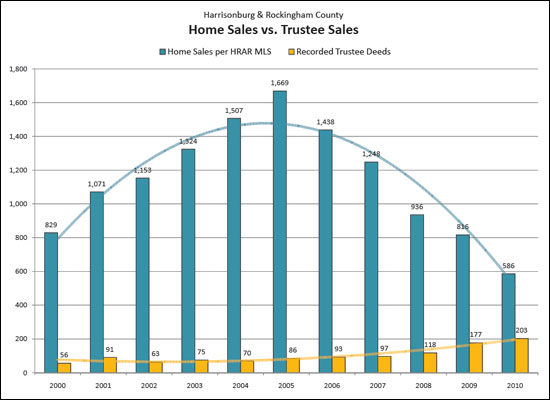 Above you'll see a decade-long comparison of two imprecise measures. The blue bars show the number of home sales recorded in the HRAR MLS -- this does not include private sales (sans Realtor), and some new home sales. The yellow bars show the number of Trustee Deeds recorded during each of the past 10+ years. Some of these foreclosed properties (203 in 2010) then show up in the blue bar when they are listed and then sold as bank owned properties. It would seem that foreclosures have increased nearly four-fold over the past ten years, and now make up somewhere between 15% and 26% of all home sales. 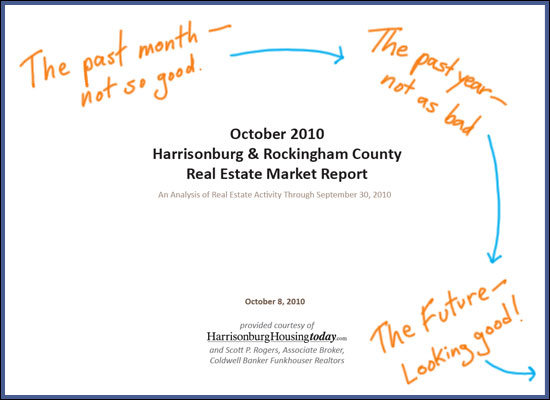 My full market report (click above -- or here -- for a 20 page PDF) includes LOTS more analysis to help you make informed real estate decisions. Read through it and let me know if you have any questions, or if any additional information would be helpful to you. You can contact me (nearly) anytime at 540-578-0102 or scott@HarrisonburgHousingToday.com. | |
Local Home Sales Slow in August, Still Strong YTD |
|
Below are several highlights from the September 2010 Harrisonburg & Rockingham County Real Estate Market Report. Read on, or click here to download a PDF of the entire report. Home sales in Harrisonburg and Rockingham County... Are they up? Down? Stable? 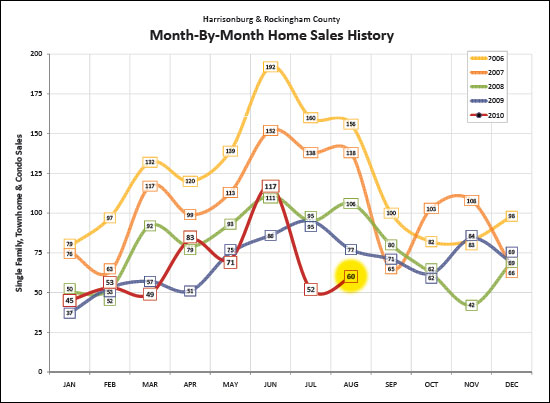 In fact, they are up, down AND stable! A mix of indicators this month:
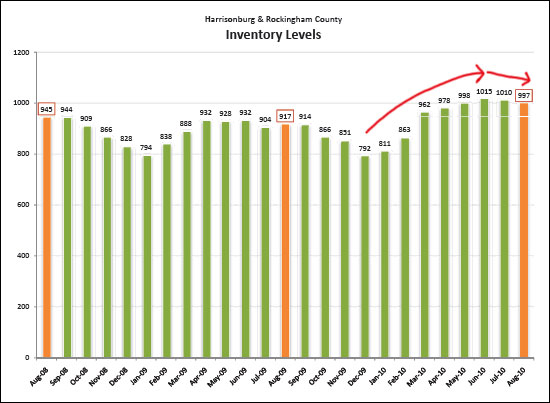 Another good indicator, as shown above, is that the local housing inventory has peaked --- at least for now. A few months ago the number of homes for sale in Harrisonburg and Rockingham County broke 1,000 for the first time -- but it has now started to decline again, as is typical for this season of the year. 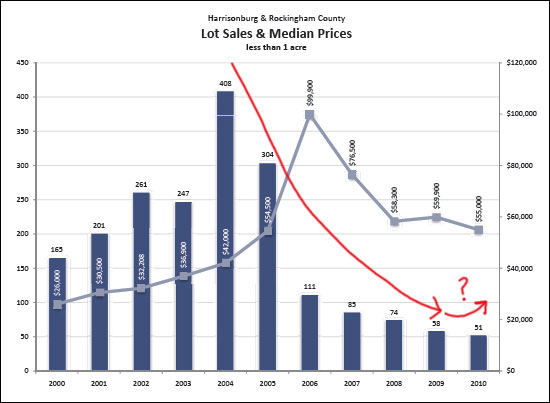 Lot sales (less than an acre) have been very, very slow over the past several years, falling from a peak in 2004 of 408 lot sales to only 58 lot sales last year. As shown above, lot sales might actually rebound this year! There is even more in the 19-page September 2010 Harrisonburg & Rockingham County Real Estate Market Report. Download the entire report by clicking on the image below.  Thanks for reading, and if you have any questions, or if I can assist you with buying or selling real estate in Harrisonburg or Rockingham County, please contact me at 540-578-0102 or scott@HarrisonburgHousingToday.com. | |
Harrisonburg and Rockingham County Home Sales Fall Dramatically In July 2010, But The Future Still Looks Bright (Really!) |
|
Click here for the full August 2010 Harrisonburg & Rockingham County Real Estate Market Report. If we only looked at July 2010 home sales (and ignored several other key indicators, and the bigger picture) we might get a little worried about our local housing market. 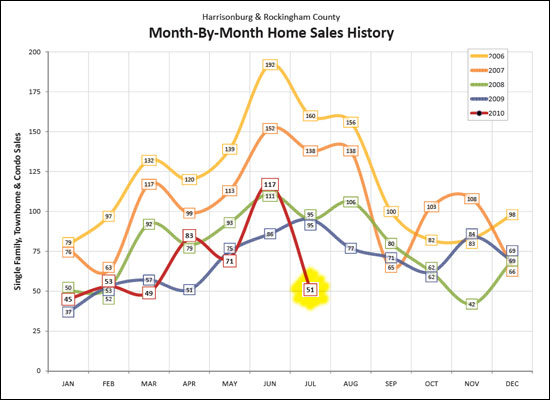 As can be seen above, there were very few home sales in July 2010. This is likely because of the original June 30th deadline for closing under the home buyer tax credit (the deadline has now been extended to September 30th). But after a very slow July, we'll probably start to see things pick back up, since contracts looked healthy in July 2010. 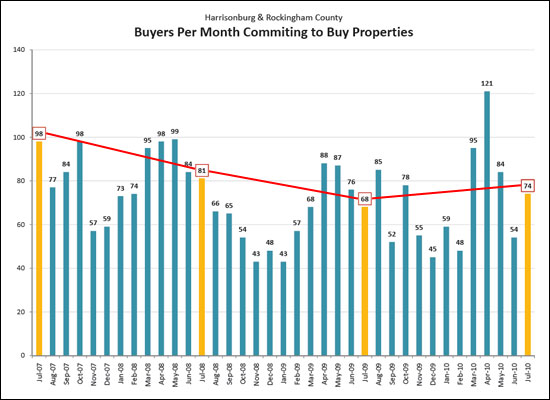 As can be seen above, there weren't too many buyers committing to buy properties last month, but there was a return to the contract-signing-table in July 2010. This month's buyer commitments actually exceeded last July's data, showing a reversal of the downward trend of the last several years. For another reversal, read on. 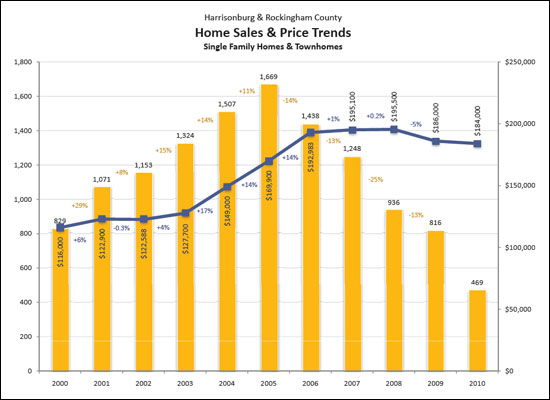 The yellow bars above show the number of home sales over the past ten years -- it is very likely that after four years of declining home sales, we might finally see an increase in 2010. Year to date, 2010 shows a 3% improvement over 2009 to date. The blue line above shows the change in median sales price over the past ten years. The median sales price declined by 5% between 2008 and 2009, but the decline appears to be much smaller this year. Learn even more about what's going on in the Harrisonburg and Rockingham County real estate market by reading the full report.  Do you have questions about this report, or about the Harrisonburg and Rockingham County real estate market? Or about your house? Or about a house you might buy? Be in touch . . . Scott Rogers | 540-578-0102 | scott@HarrisonburgHousingToday.com | |
Home Sales (and Inventory) Soar in June 2010, Contracts Decline |
|
Click here for the full July 2010 Harrisonburg & Rockingham County Real Estate Market Report. We're not out of the woods yet, but several indicators are quite positive in the Harrisonburg and Rockingham County housing market. 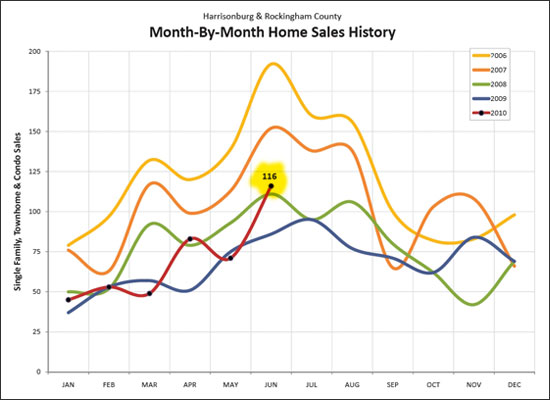 As can be seen above, June 2010 home sales soared up to 116 transactions -- the highest number of monthly sales we have seen in almost three years. Many of these home sales were likely a result of the home buyer tax credit deadline, so we may see a decline in July home sales. 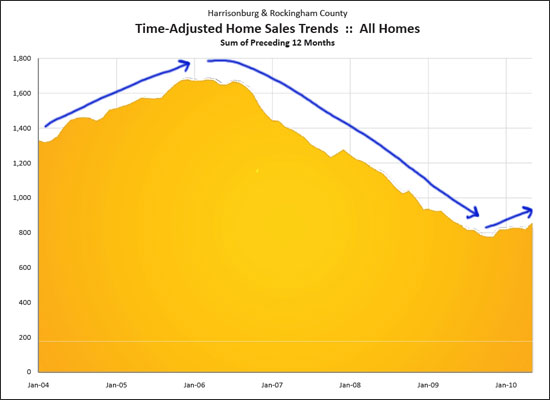 Above, you will note that long term indicators continue to trend very positively. This graph shows a rolling 12-month sum of home sales to remove the seasonal variation in sales. After several years of a declining market (in number of home sales), we have now seen a stabilization and increase for over six months. 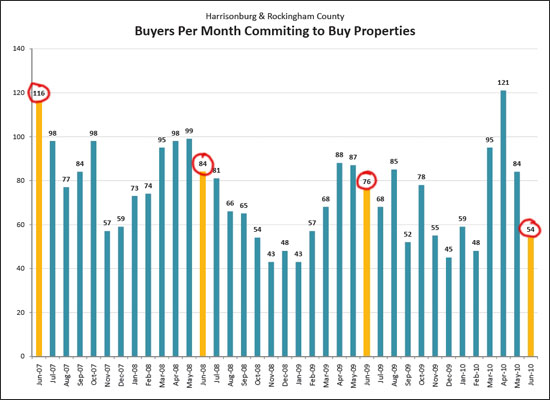 Despite good signs as far as closed home sales go, the number of buyers committing to buy during June 2010 (contracts signed) declined, both compared to the last several months, as well as compared to the past three months of June (2007, 2008, 2009). This will likely result in lower levels of home sales in July and August. 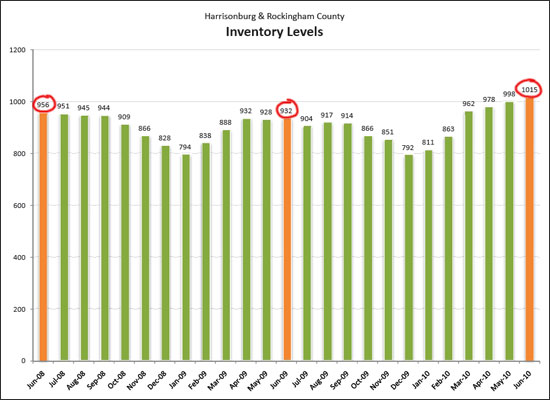 In addition to home sales, inventory levels also soared in June 2010 -- cresting above 1,000 homes for sale for the first time in recent past (and maybe the first time ever). We should see a decline in inventory over the next six months based on historical seasonal trends. Learn even more about our local housing market: click here for the full July 2010 Harrisonburg & Rockingham County Real Estate Market Report. 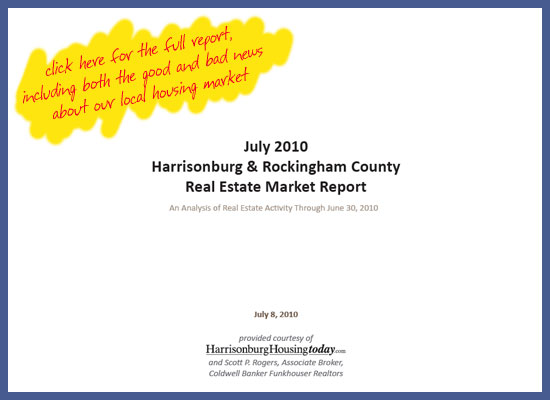 Do you have questions about this report, or about the Harrisonburg and Rockingham County real estate market? Or about your house? Or about a house you might buy? Be in touch . . . Scott Rogers | 540-578-0102 | scott@HarrisonburgHousingToday.com | |
Local Home Sales Up 10% in 2010, Prices Down 4% |
|
Click here to view my full June 2010 Harrisonburg & Rockingham County Real Estate Market Report. Exciting Fact #1 --- May 2010 home sales declined 5% as compared to May 2009, but year-to-date sales (January through May) are up 10% over last January through May. 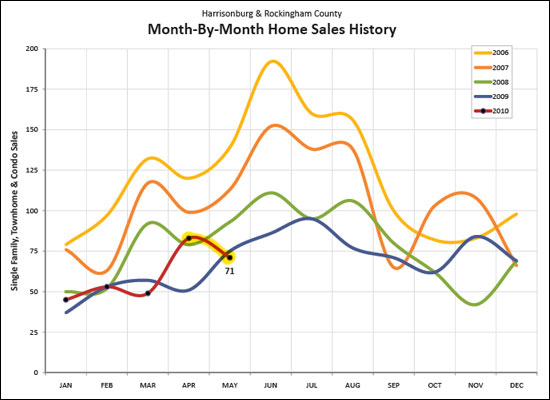 Exciting Fact #2 --- After three and a half years of steadily declining home sales (quantity, not prices), we have now seen stabilization or increases in home sales for over six months. 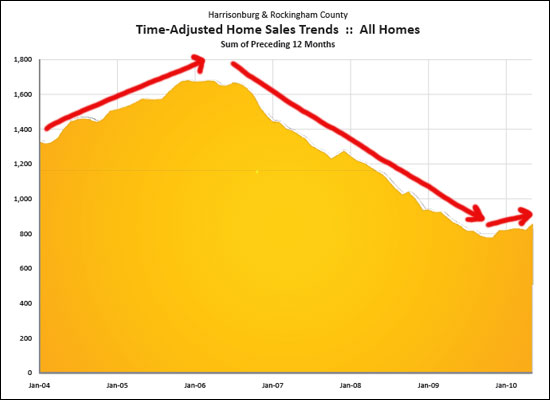 Not-So-Exciting Fact #3 --- Sales volume has declined sharply for four years now (red line), and median home values have declined gradually for two years (green line). Despite early positive indicators for the past several months, we're not out of the woods yet. 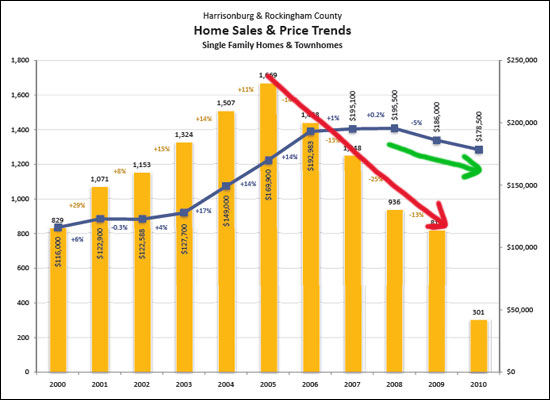 Other tidbits that you'll discover in my June 2010 Harrisonburg & Rockingham County Real Estate Market Report include:
 | |
Local Real Estate Market Recovery? |
|
I have been waiting a long time to have tangible, factual, good news to share about a recovery of the Harrisonburg and Rockingham County housing market. I think that time is coming, and here's why --- April 2010 home sales increased 62% compared to April 2009! (see graph below) 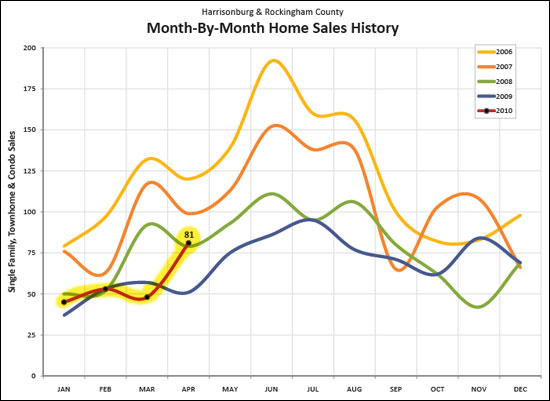 Long term home sales indicators continue to show stabilization and growth! (see graph below) 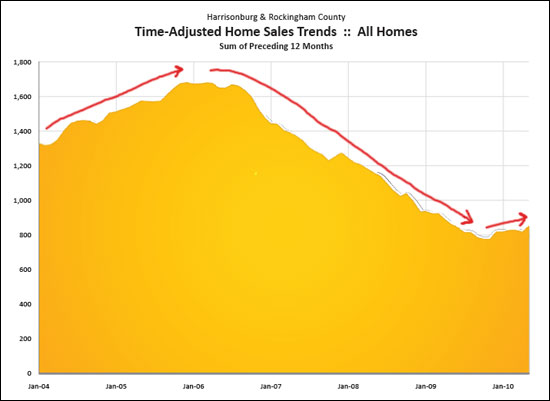 Home buyers committed to buy homes in record numbers in March and April 2010! (see graph below) 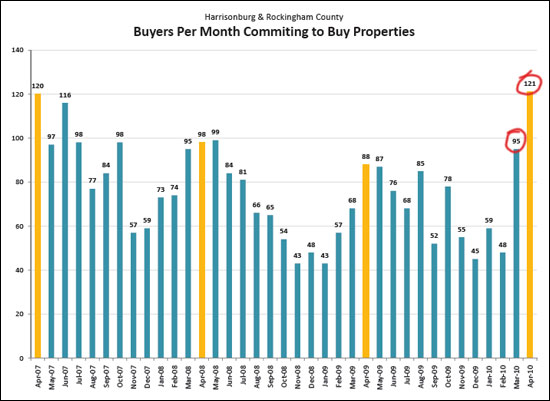 Learn more about our local housing market by clicking the image below to read my full market report.  | |
Home Sales Slow, Prices Remain (Somewhat) Steady In Harrisonburg, Rockingham County |
|
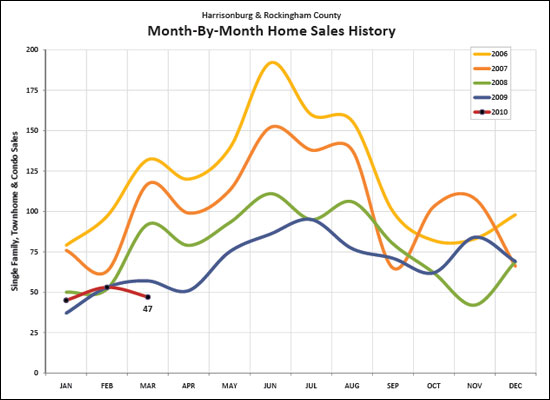
Click here or on the image below to view the full April 2010 Harrisonburg & Rockingham County Real Estate Market Report (PDF). Read on below for a few highlights.  Mixed indicators this month . . .
  Also of note, we have seen a steady increase in Inventory over the past several months. Lots of options for buyers --- lots of competition for sellers! Also of note, we have seen a steady increase in Inventory over the past several months. Lots of options for buyers --- lots of competition for sellers!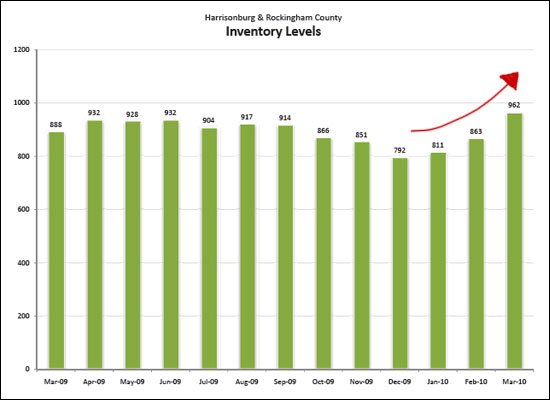 Don't delay -- get all of the exciting (and not as exciting) details and beautiful charts by downloading the full April 2010 Harrisonburg & Rockingham County Real Estate Market Report (PDF). If you find the information in this report to be helpful....
| |
Standing Firm: The Harrisonburg and Rockingham County Real Estate Market Holds Steady In February 2010 |
|
Click here or on the image below to view the full March 2010 Harrisonburg & Rockingham County Real Estate Market Report (PDF). Read on below for a few highlights.  Some high level February 2009 to February 2010 observations include:
 Don't delay -- get all of the exciting (and not as exciting) details and beautiful charts by downloading the full March 2010 Harrisonburg & Rockingham County Real Estate Market Report (PDF). If you find the information in this report to be helpful....
| |
January 2010 Shows Positive Momentum In The Harrisonburg and Rockingham Real Estate Market |
|
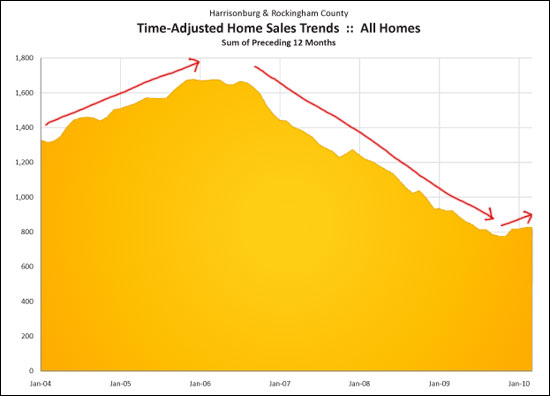
Click here or on the image below to view the full February 2010 Harrisonburg & Rockingham County Real Estate Market Report (PDF). Read on below for a few highlights.  As can be seen below, January 2010 sales (45) topped January 2009 sales (38). Furthermore, each of the preceding three months (Oct '09, Nov '09 and Dec '09) showed equal or greater home sales than the same month in 2008. Could it be that the pace of our local real estate market is finally picking up again? 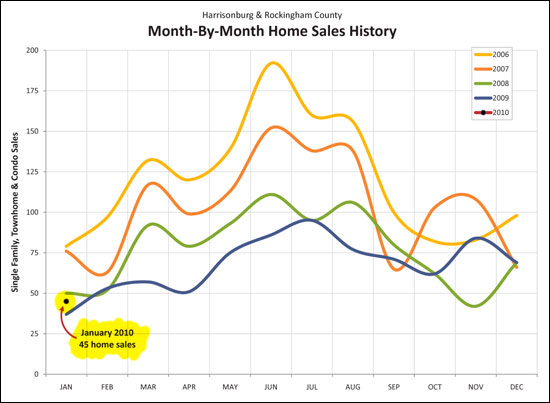 As a further indicator, the graph below shows a running 12 months of home sales since 2004. The most recent data point shows Feb '09 through Jan '10, the data point prior shows Jan '09 through Dec '09, etc. Each data point includes every month of the year, allowing for a normalized look at the activity in our local housing market. As can be seen, this metric has been falling since 2006, but over the past several months seems to have stabilized and started to increase again. 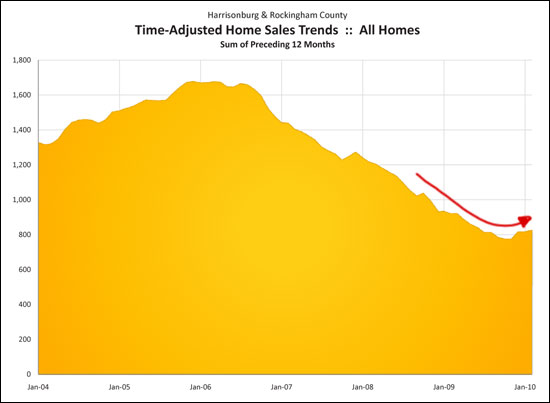 Read more about our local housing market by downloading the full February 2010 Harrisonburg & Rockingham County Real Estate Market Report (PDF). If you find the information in this report to be helpful....
| |
January 2010 Harrisonburg and Rockingham County Real Estate Market Report: Prices Edge Down Slightly, Declines in Sales Pace Gently Slow |
|
Home sales finished out at a respectable level in 2009, showing only a 13% decline from 2008 as compared to the 25% decline in sales pace seen between 2007 and 2008. The area's median price, however, slipped 5% -- the first decline in full year median values that we've seen in this troubled market. 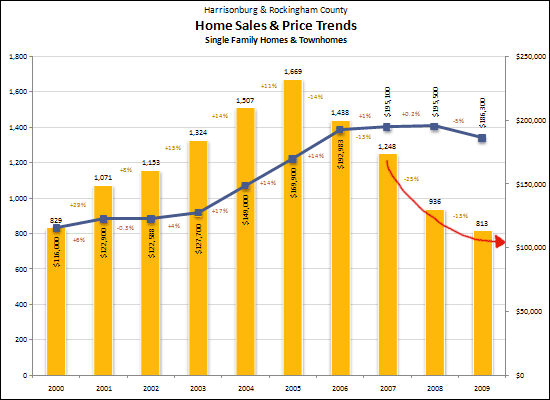 This past month's sales (67 in December) can't be used to predict too much in our market, because December sales were at roughly the same levels in 2007 and 2008 --- with significantly different months and years following those similar December values. That being said, five of twelve months in 2009 showed home sales at, above, or very close to the corresponding month in 2008. This may be an indication that the declining pace of home sales seen since 2005 may finally be slowing. 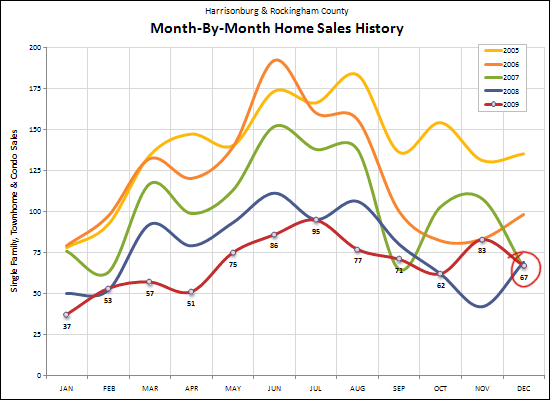 The local year over year housing inventory has declined slightly, from 828 homes at the end of last December, to 792 homes for sale at the end of this December. That small decline, however, is still not enough of a decline to help the significant oversupply of homes for sale we have been experiencing for over a year. 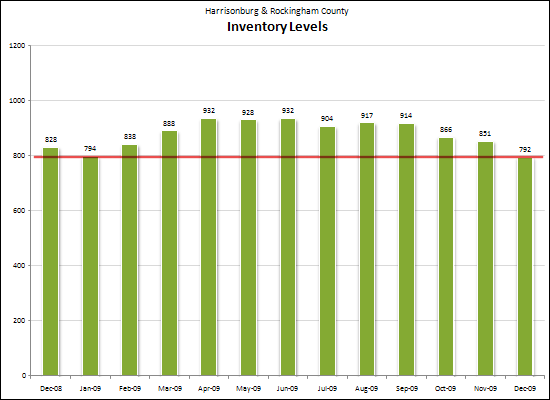 Read on, and dive into the details by reading the entire January 2010 Harrisonburg and Rockingham County Real Estate Market Report. Click the image below to download the PDF.  If you find the information in this report to be helpful....
| |
Harrisonburg & Rockingham County Home Sales Soar in November 2009! |
|
Take a look at this graph and see if you notice anything . . . 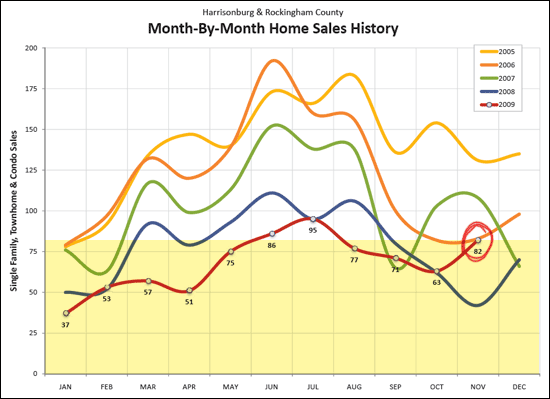 I notice a few things that are quite exciting: November 2009 home sales were 95% higher than a year ago (November 2008). Furthermore, there was a 30% increase between October 2009 and November 2009, when most other years there has been a decrease between October and November. November 2009 outperformed every other month of 2009 except for June and July. November is typically a very slow month for home sales, but this year buyers came out in droves! Read on for more good, bad, and neutral news . . .  Click here to download the PDF. If you find the information in this report to be helpful....
| |
| Newer Posts | Older Posts |
Scott Rogers
Funkhouser Real
Estate Group
540-578-0102
scott@funkhousergroup.com
Licensed in the
Commonwealth of Virginia
Home Search
Housing Market Report
Harrisonburg Townhouses
Walk Through This Home
Investment Properties
Harrisonburg Foreclosures
Property Transfers
New Listings

