Monthly Market Analysis
| Newer Posts |
October 2009 Harrisonburg & Rockingham County Real Estate Market Report - Sales Steady, Prices Inch Lower |
|
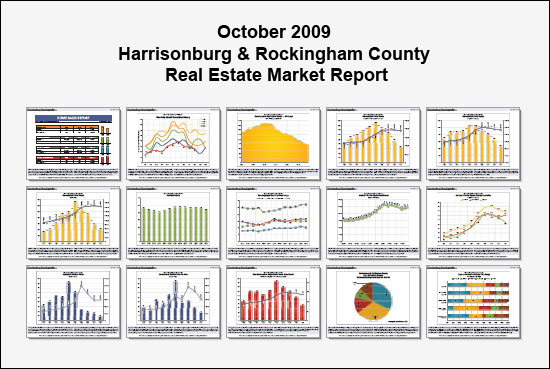 I just published my monthly market report on Harrisonburg and Rockingham County. Read on for a summary, or jump right into the report by reading it online or downloading the PDF. Just a year ago, I was reporting that when comparing Jan-Oct 2007 to Jan-Oct 2008:
The decline in median and average sales price is also quite troubling --- at first --- until we put that into the context of how home values have changed in other parts of Virginia and the United States. First, though, I do understand that every homeowner wants the value of their home to increase, always, every year, without exception --- and I don't fault you for that desire. That being said --- home values in our nation have declined quite significantly over the past several years, and many markets in Virignia also saw those drastic declines. Yet, somehow, the Shenandoah Valley (thus far) has remained largely unscathed. We have seen a slight, slow decline in home values (as measured by median and average sales price), but home values increased 51% between 2003 and 2006 and have only declined 1.5% between 2006 and 2009. Let me repeat that for emphasis, because it is astonishing given what has happened nearly every other housing market in the nation.... Home values in Harrisonburg and Rockingham County increased 51% between 2003 and 2006, yet have only declined 1.5% between 2006 and 2009. What does the future hold, you might ask? I showcased a few scenarios last week which you can review here. Beyond the numbers, I believe we will continue to see small declines in home values over the next 12 months, and that over the next 6 to 18 months we will see the pace of sales start to solidify and then slowly increase. To learn more about the details of our local housing market, review the entire October 2009 Harrisonburg & Rockingham County Real Estate Market Report: Read Report Online | Download PDF. If you find the information in this report to be helpful....
| |
Harrisonburg and Rockingham County Median and Average Sales Price Increase in September 2009, but . . . |
|
Perhaps as a result of the $8,000 tax credit, this month's home sales were not as low as could be expected given the year-to-date trends. During the first nine months of this year, we have seen an overall decline of 21% in home sales, yet September 2009 versus September 2008 only shows a 11% decline. Furthermore, both the median sales price and average sales price increased when comparing September 2009 sales to September 2008 sales. The year-to-date median and average sales prices are still showing declines (4%, 2%), so we won't call this a trend yet -- but hopefully a sign of positive changes to come. To learn more, review the entire September 2009 Harrisonburg & Rockingham County Real Estate Market Report: Read Report Online | Download PDF.  If you find the information in this report to be helpful....
| |
Everything You Need To Know About The Residential Real Estate Market In Harrisonburg & Rockingham County |
|
Below you will find an embedded version of my August 2009 report on the residential real estate market in Harrisonburg and Rockingham County. SUMMARY: The pace of home sales continues to slow, home values continue to stay relatively steady, and thus we haven't turned the corner yet to head back to more hopeful times. Click here to access a larger version, download a PDF, share it with a friend, etc. Do you have questions? Suggestions for other analysis? Do you disagree with the perspectives I offer? Feel free to leave a note in the comments section, or e-mail me at Scott@HarrisonburgHousingToday.com. Enjoy! | |
July 2009 Harrisonburg & Rockingham County Real Estate Market Report |
|
Embedded below is my full report on the Harrisonburg and Rockingham County real estate market as of July 2009. Click the link below to read the report, and please use the comment section below to provide me with feedback or to ask any clarifying questions. July 2009 Harrisonburg & Rockingham County Real Estate Market Report Click here to download the full report as a PDF. | |
Slower Home Sales, Stable Home Values per the June 2009 Harrisonburg & Rockingham County Real Estate Market Report |
|
I hope you enjoy this brief overview of the June 2009 market report... Read on for a full review of the state of the Harrisonburg and Rockingham County residential real estate market. Or....download the full report: June 2009 Harrisonburg & Rockingham County Real Estate Market Report 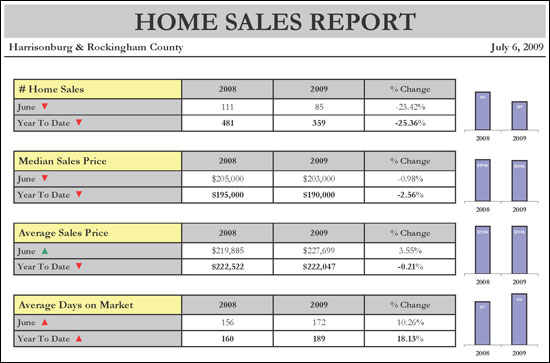 While the pace of home sales continues to decline (25% lower in 2009 than in 2008), the median and average sales price continue to stay relatively steady in our local real estate market --- showing a 2.5% decline (median) and 0.2% decline (average) when comparing the first six months of 2008 to the first six months of 2009. Our market continues to out-perform most other markets in Virginia, evading the 20% - 40% loss in home values seen in many areas. 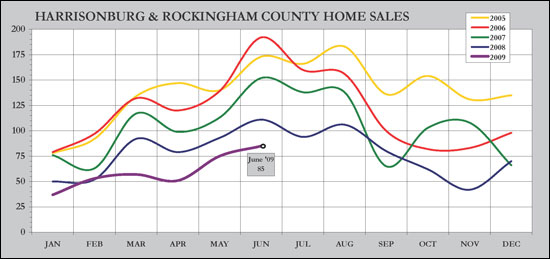 In this graph, we see that 2009 sales volume (purple line) is still hovering well below 2008 sales volume (blue line) --- but we are seeing the predictable seasonal increase in home sales during the summer months. The remainder of 2009 will be interesting to observe, as many first time buyers close on properties prior to December 1st to obtain the $8,000 tax credit. July always takes a slight dip, so we'll see if that holds true for 2009. 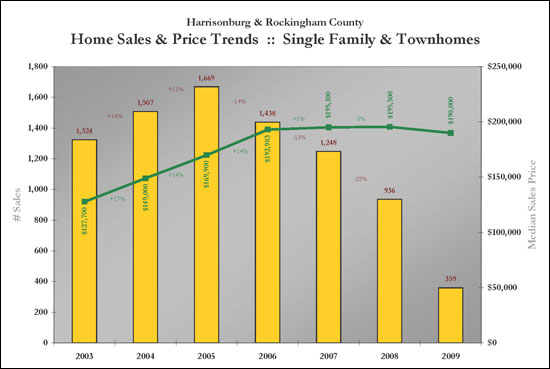 This graph captures all residential real estate activity as reflected in the Harrisonburg/Rockingham MLS. The 2009 year-to-date sales figures now include six months of sales data, and show only a slight decline in median sales prices ($195,500 to $190,000). They sales volume (yellow bars), however, continue to decline. 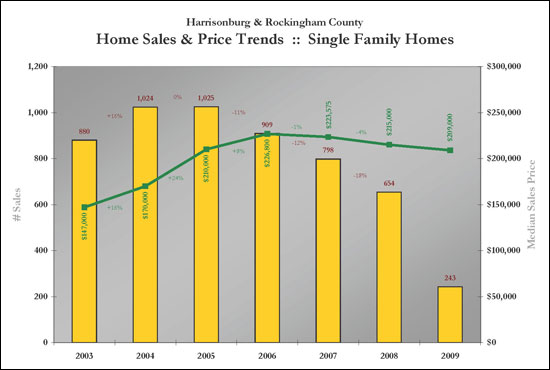 When examining only single family home sales in Harrisonburg and Rockingham County we see that the median sales price continues to decline at a relatively slow rate (1%, 4%, 3%) when comparing 2009 to 2008 -- the good news is that single family homes (as a whole) aren't losing value as they are in many other markets. 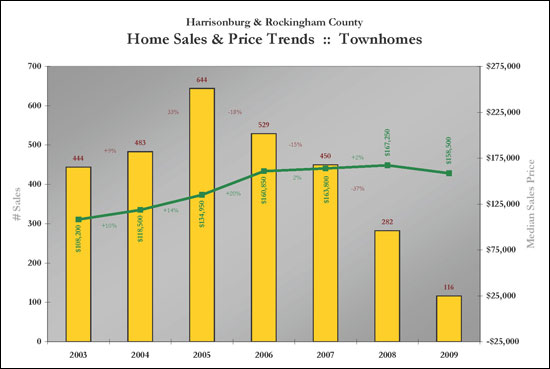 When examining only townhome sales in Harrisonburg and Rockingham County we note that while the sales volume has dropped dramatically since 2005 (-18%, -15%, -37%), the median sales price has gained during that time period (2005 vs. 2009) and has stayed relatively steady between 2006 and 2009. 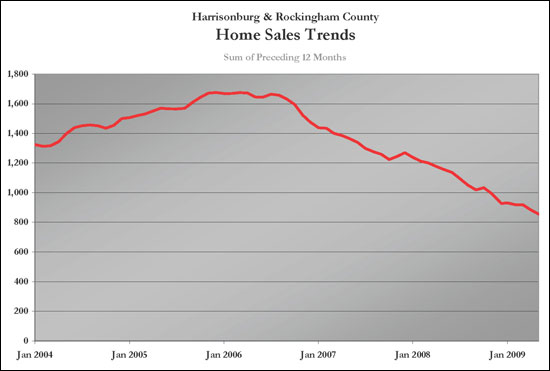 This graph shows a normalized trend of home sales by charting the ongoing sum of the preceding 12 months' sales. We continue to see a decline in this metric, and likely will until the pace of sales stops its decline. 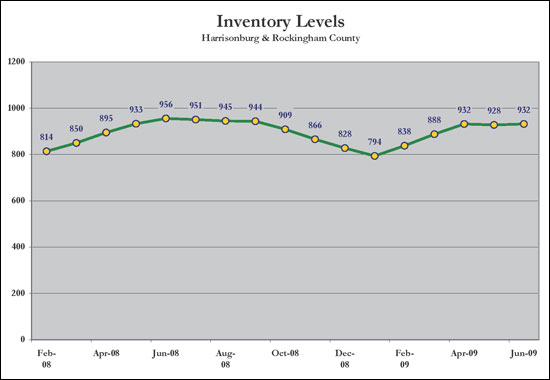 Inventory levels have stayed relatively level over the past three months, and have declined as compared to a year ago (932 vs. 956). Lower inventory levels will (slowly) lead to a healthier local real estate market, as a balance between buyers and sellers returns. 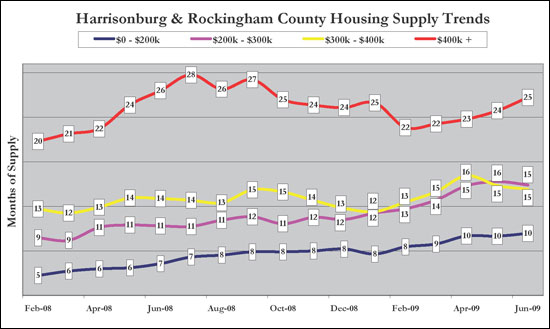 With inventory levels holding steady, the number of months of supply of homes in the three lower price ranges noted above has stayed relatively steady. We continue to see an increase in supply of $400k+ homes as compared to the sale pace of these homes. 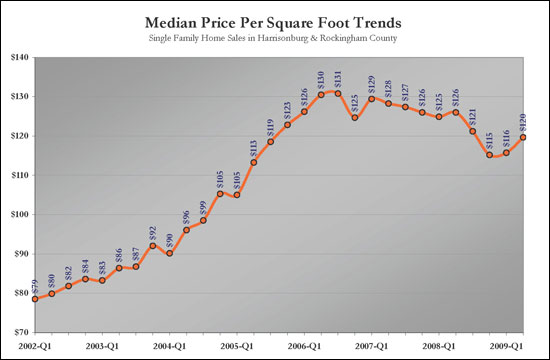 After a relatively sharp decline in median price per square foot between 2008-Q2 and 2008-Q4, we have now seen an increase over the past two quarters in this metric. This may be any early indicator of the stabilization of our local market, as the price that buyers are willing to pay per livable space stabilizes.  The chart above examines time on market for homes sold in Harrisonburg and Rockingham County during the past six months. Homes with the lowest price points are selling the quickest, and homes in the upper price ranges are taking the longest time to sell. For example, overall only 11% of homes took longer than 1 year to sell, but 26% of homes selling over $400,000 took longer than a year to sell. Of note, the average days-on-market has actually declined since last month's market report. Last month's report showed an average of 193 days, compared to the new overall average of 188 days. 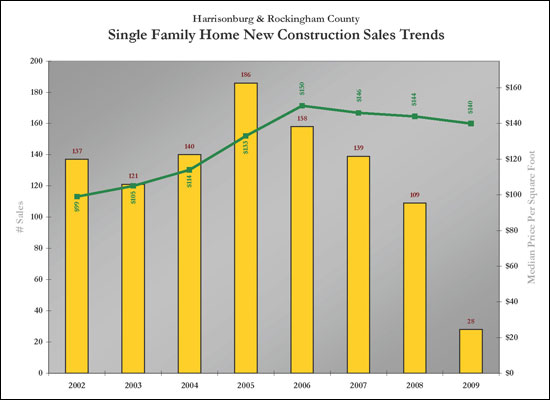 When examining new single family homes in our local market, we see a steady decline since 2005 in the number of homes that are selling (yellow bars) accompanied by a slow decrease in the median price per square foot since 2006 (green line). Of note, the current median price/sf is still well above the 2005 level. 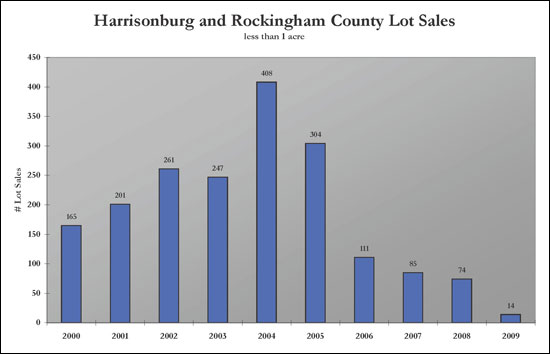 The graph above depicts the number of lots (less than 1 acre) selling in Harrisonburg and Rockingham County since 2000. We continue to see only a small number of buyers in the market for building lots, with only 14 such closings having occurred during the first six months of this year. 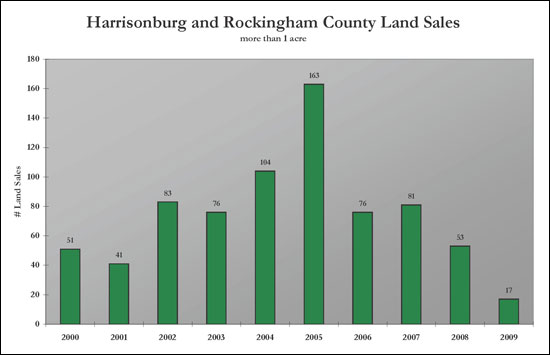 Land sales (tracts larger than 1 acre) have also markedly decreased since 2005, but aside from the spike of activity in 2005, the pace of these land sales remained relatively constant between 2002 and 2007. Last year, and the projected figures for this year show that there are very few buyers in the market for land at this time. Download the full report here: June 2009 Harrisonburg & Rockingham County Real Estate Market Report | |
May 2009 Harrisonburg & Rockingham County Real Estate Market Report |
|
View a video introduction to the May 2009 Real Estate Market Report: Read on for a full review of the state of the Harrisonburg and Rockingham County residential real estate market. Or....download the full report: May 2009 Harrisonburg & Rockingham County Real Estate Market Report 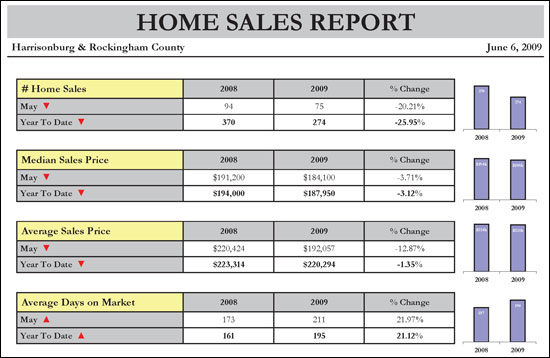 The four most commonly referenced measures of our local housing market (sales volume, median sales price, average sales price and average days on market) are all in worse shape in May 2009 than they were a year ago. However, the median sales price is likely the most meaningful of the measures, and it continues to show a decline of only 3% when comparing May 2008 to May 2009, or when comparing January-May 2008 to January-May 2009. 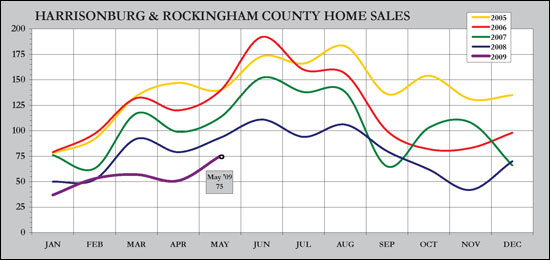 In this graph, we see that 2009 sales volume (purple line) is still hovering well below 2008 sales volume (blue line) --- but the gap closed slightly in May as compared to March and April. Perhaps we are seeing a normalizing trend, and sales volume in June, July and August of this year will be much closer to 2008 sales levels. Greater stability will return to our market when sales volume stops declining. 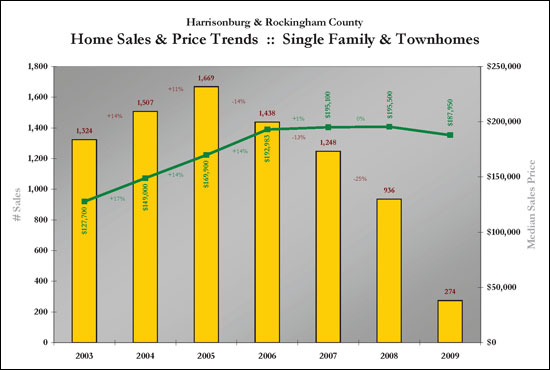 This graph captures all residential real estate activity as reflected in the Harrisonburg/Rockingham MLS. The 2009 year-to-date sales figures now include five months of sales data, and show only a slight decline in median sales prices. Of note, the median residential sales price has not significantly changed since 2006. 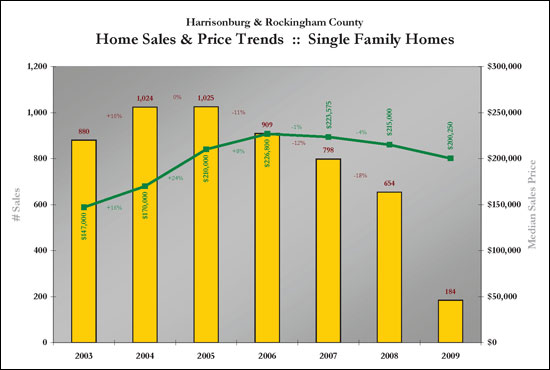 When examining only single family home sales in Harrisonburg and Rockingham County we see that the median sales price continues to decline at a relatively slow rate (1%, 4%, 7%) when comparing 2009 to 2008. Amidst these slight declines, the pace of sales (yellow bars) continues to decline drastically. 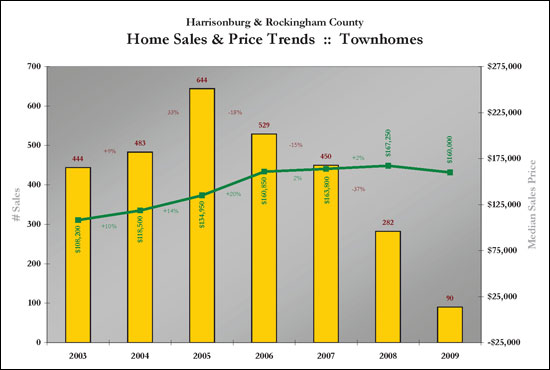 When examining only townhome sales in Harrisonburg and Rockingham County we note that while the sales volume has dropped dramatically since 2005 (-18%, -15%, -37%), the median sales price has gained during that time period (2005 vs. 2009) and has stayed steady between 2006 and 2009. 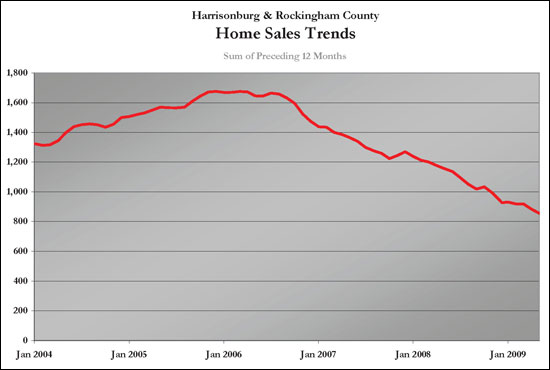 This graph shows a normalized trend of home sales by charting the ongoing sum of the preceding 12 months' sales. We continue to see a decline in this metric, and likely will until the pace of sales stops its decline. 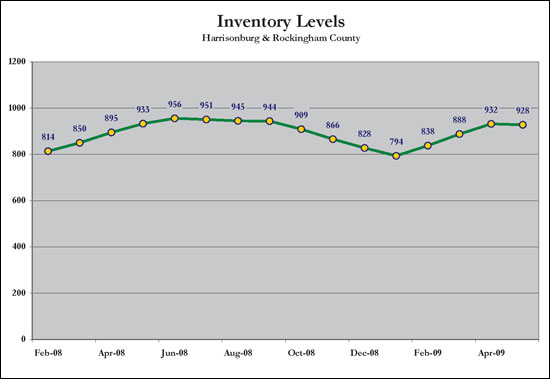 Of note, inventory declined slightly between the end of April and the end of May. This is great news for the overall health of our market, as it will reduce the high inventory levels and slowly start to balance out our market. This is a surprising trend for the early summer months! 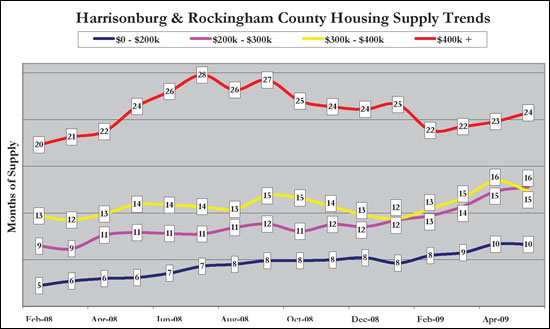 With inventory levels holding steady, the number of months of supply of homes in each price range noted above has stayed relatively steady. Of note, this is the first month that any of these trend lines have crossed, as can be noted between the $200k-$300k and $300k-$400k lines. 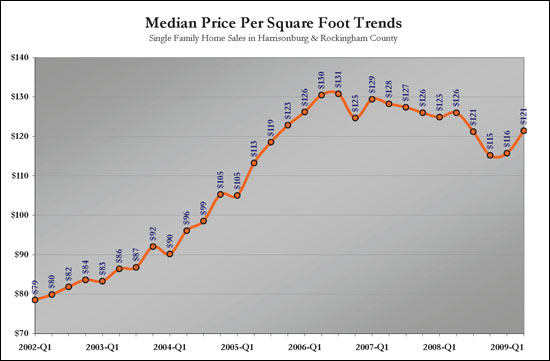 The median price per square foot of all single family homes sold since 2002 in Harrisonburg and Rockingham County shows that homes have started selling at a somewhat higher rate over the past several quarters when examining their cost per functional space. 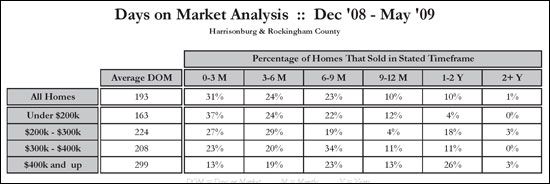 The chart above examines time on market for homes sold in Harrisonburg and Rockingham County during the past six months. Homes with the lowest price points are selling the quickest, and homes in the upper price ranges are taking the longest time to sell. For example, overall only 10% of homes took longer than 1 year to sell, but 26% of homes selling over $400,000 took longer than a year to sell. In contrast, only 13% of these homes over $400,000 sold in the first three months, while 37% of homes selling for less than $200,000 sold in the first three months of being on the market. 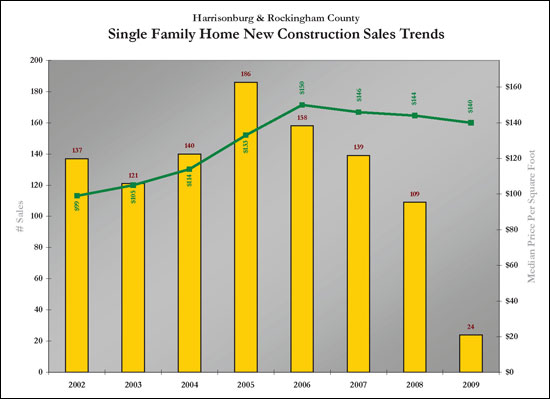 When examining only new single family homes in Harrisonburg and Rockingham County, we can see a steady decline since 2005 in the number of such homes that are selling (yellow bars) accompanied by a slow decrease in the median price per square foot since 2006 (green line). 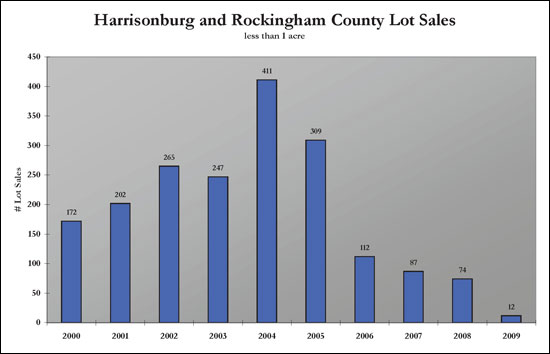 The graph above depicts the number of lots (less than 1 acre) selling in Harrisonburg and Rockingham County since 2000. The last several years have been unbelievably slow for lot sales, likely because many builders have been holding back on starting construction on new homes given the trends in the residential sales market. 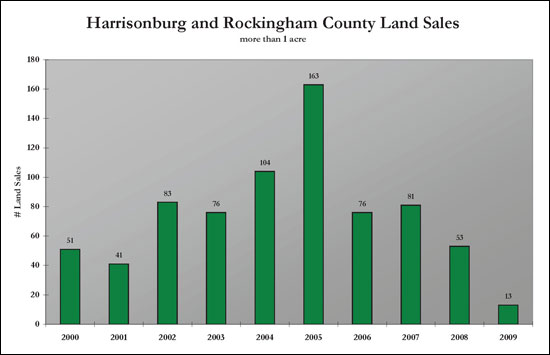 Land sales (tracts larger than 1 acre) have also markedly decreased since 2005, but aside from the spike of activity in 2005, the pace of these land sales remained relatively constant between 2002 and 2007. Last year, and the projected figures for this year show that there are very few buyers in the market for land at this time. Download the full report here: May 2009 Harrisonburg & Rockingham County Real Estate Market Report | |
April 2009 Harrisonburg & Rockingham County Real Estate Market Report |
|
Read on for a full review of the state of the Harrisonburg and Rockingham County residential real estate market. Or....download the full report: April 2009 Harrisonburg & Rockingham County Real Estate Market Report 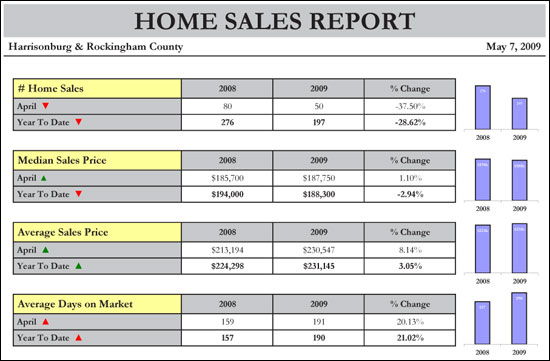 Homes in Harrisonburg and Rockingham County are continuing to sell more slowly than in recent years -- when examining January 2009 - April 2009, we see a 29% decline compared to 2008. However, we continue to see median and average sales prices staying relatively level, with a 3% decline in median sales price and a 3% increase in average sales price. The homes that have sold this year took, on average, 21% longer to close than in 2008. 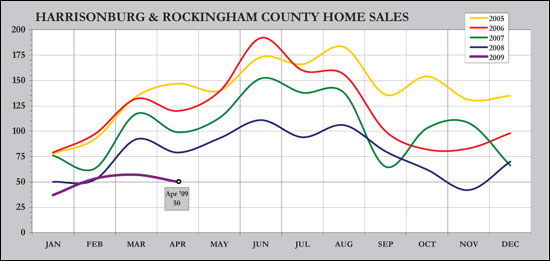 As with each of the past three years, we saw a decline in home sales as compared to last month (March). April 2009 home sales (50 sales) were 38% lower than April 28 (80 sales). We will likely start to see an increase in May, as we have each of the past three years. The important thing to note will be how quickly sales increase, and whether we will be able to match the 2008 sales pace. 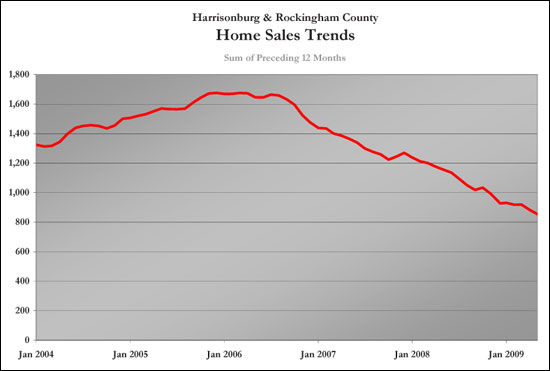 This graph shows a normalized trend of home sales by charting the ongoing sum of the preceding 12 months' sales. We continue to see a decline in this metric, and likely will until the pace of sales stops its decline. 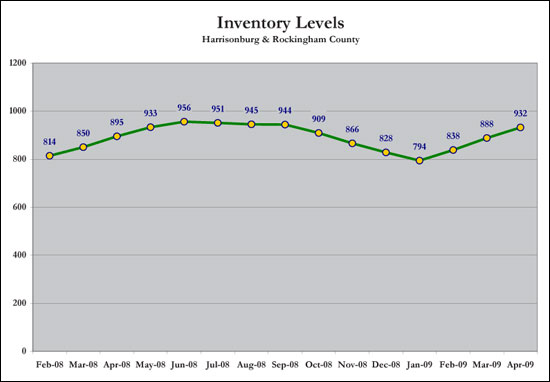 Some people have noticed an increase in activity in the real estate market, but it is likely simply an increase in homes for sale that they are noticing. These increasing inventory levels are not welcome news to sellers, as it continues to over saturate our market. 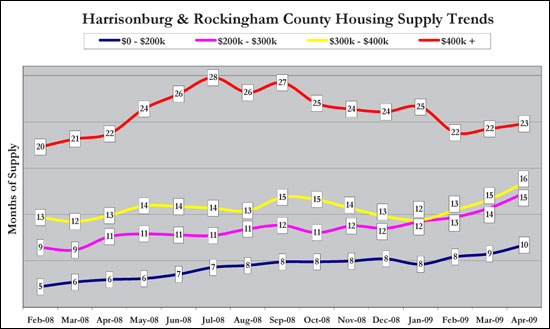 Unfortunately, the increased inventory of homes on the market over the past several months has not been matched by a corresponding increase in sales. Thus, the number of months of supply has started to increase again in all price ranges. 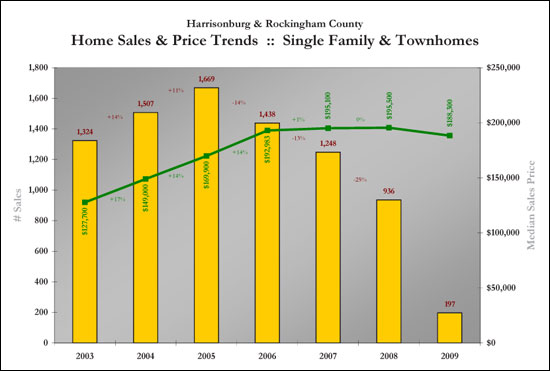 This graph captures all residential real estate activity as reflected in the Harrisonburg/Rockingham Multiple Listing Service. The 2009 year-to-date sales figures now include four months of sales data, and show only a slight decline in median sales prices. This is positive, however, the pace of sales continues to decline. 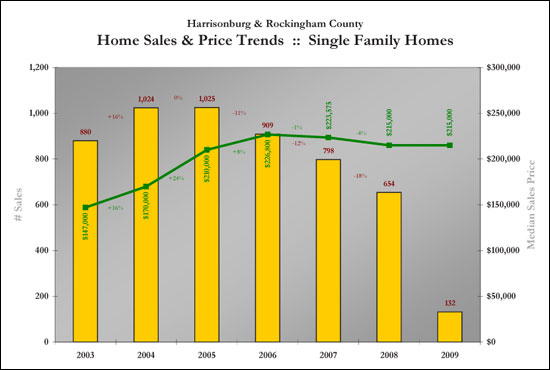 When examining only single family home sales in Harrisonburg and Rockingham County we see that the median sales price is holding steady as compared to last year and has not had a significant net increase or decrease since 2006. This is occurring despite a drastic reduction in sales pace between 2006 and 2009. 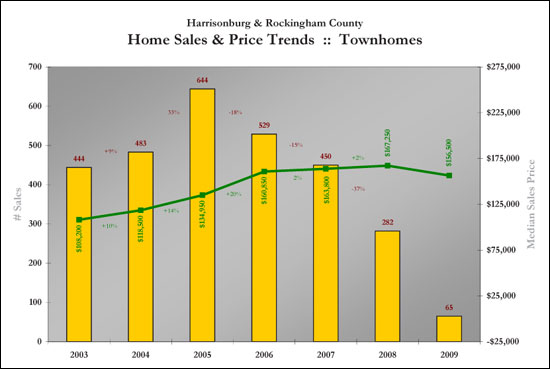 Sales of townhomes in Harrisonburg and Rockingham County continue to slow, and median prices have started to slip ever so slightly down to $156,500. This marks a median value slightly below the 2006 median value of $160,850, and is coupled by a continued decline in sales pace for townhomes. 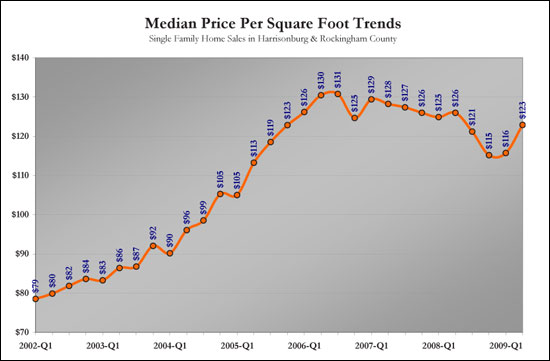 Examining the median price per square foot of sold single family homes in Harrisonburg and Rockingham County shows that homes have started selling at a somewhat higher rate when examining their cost per functional space. We are now approaching mid-2005 levels, at $123 per square foot. 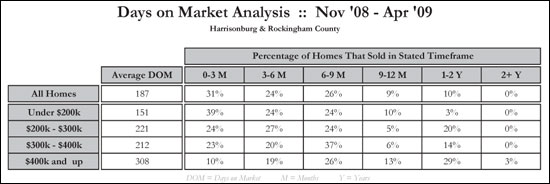 The chart above examines time on market for homes sold in Harrisonburg and Rockingham County during the past six months. Homes with the lowest price points are selling the quickest, and homes in the upper price ranges are taking the longest time to sell. For example, overall only 10% of homes took longer than 1 year to sell, but 34% of homes selling over $400,000 took longer than a year to sell. In contrast, only 10% of these homes over $400,000 sold in the first three months, while 39% of homes selling for less than $200,000 sold in the first three months of being on the market. Download the full report here: April 2009 Harrisonburg & Rockingham County Real Estate Market Report | |
March 2009 Real Estate Market Report for Harrisonburg and Rockingham County |
|
Click here to view a PDF of this entire report. Enjoy! 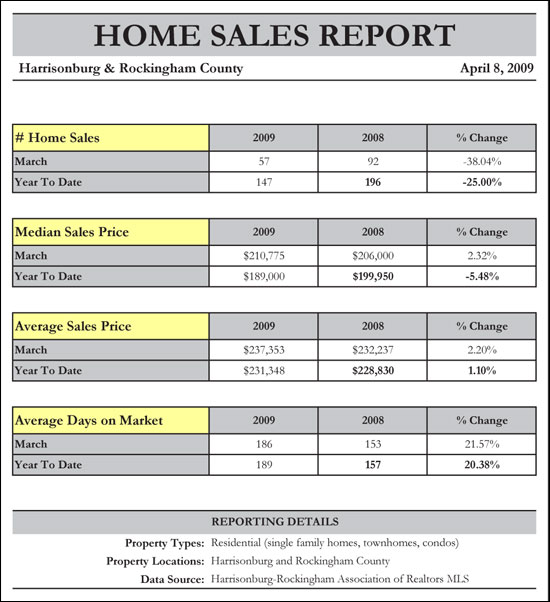 The pace of home sales in Harrisonburg and Rockingham County continues to decline --- with a 25% drop in sales pace when comparing Jan-Mar 2009 to the same time frame last year. Home values, however, seem to be holding relatively steady despite this drop in sales activity. Median home prices have dropped 5% since last year and average home prices have increased 1%. The next three months will be indicative of the overall health of our market, as we should see an increase in home sales as a result of seasonal trends, historically low interest rates, and the $8,000 first time buyer tax credit. Given this information, sellers should price their homes carefully, market them aggressively, and be flexible within reason when it comes to negotiating a contract. Buyers in our current market should look for good opportunities to buy at a reasonable price, but likely won't find too many opportunities to buy at a significant discount. If we start to see a more significant decrease in average or median home sales prices, buyers will be able to negotiate more effectively. 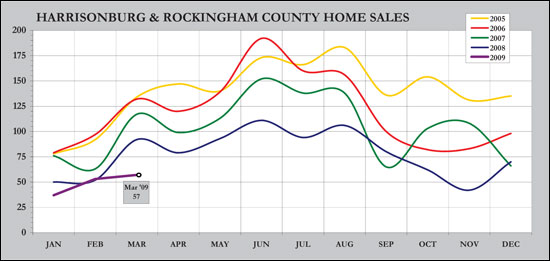 Home sales in March 2009 (57) were decidedly slower than last March (92) -- a bit of a surprise after an exceptionally strong month of sales in February 2009. We will likely still see an increase in sales over the next four months (as we see each year at this time) but we will have to wait to see whether we can match last year's overall sales pace --- I am optimistic that we will be able to, given the $8,000 first time buyer tax credit. 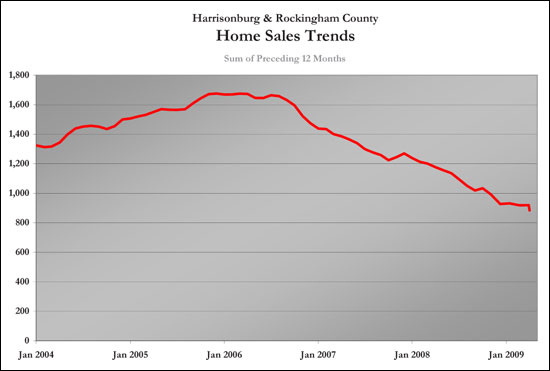 This graph shows a normalized trend of home sales by charting the ongoing sum of the preceding 12 months' sales. The drop we see this month is a result of March 2009 sales being markedly lower than March 2008 sales. 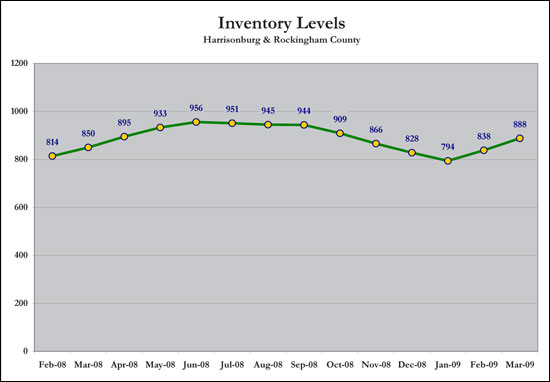 Active inventory continues to rapidly increase, likely as a result of homeowners' anticipation of more buyers in the spring/summer market. This continued increase, however, will not help bring our market back into a balance between buyers and sellers. 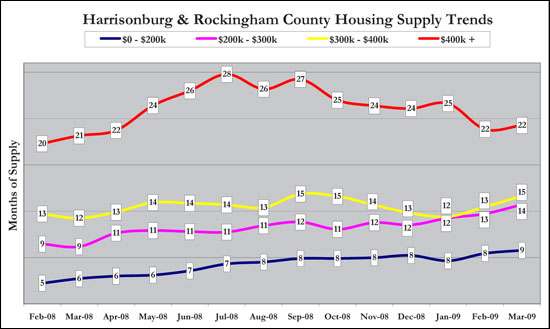 Unfortunately, the increased inventory of homes on the market over the past several months has not been matched by a corresponding increase in sales. Thus, the number of months of supply has started to increase again in all price ranges. 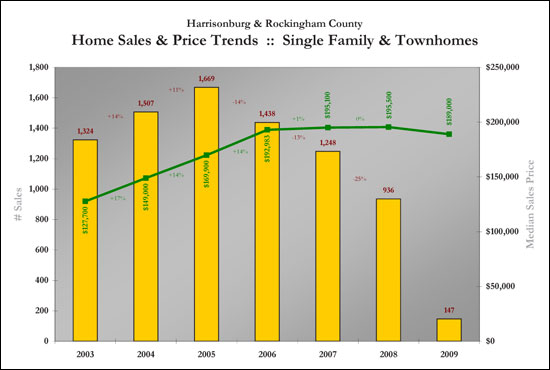 This graph captures all residential real estate activity as reflected in the Harrisonburg/Rockingham Multiple Listing Services. The 2009 year-to-date sales figures now include three months of sales data, and show only a slight decline in median sales prices. This is good, however, the pace of sales continues to decline. 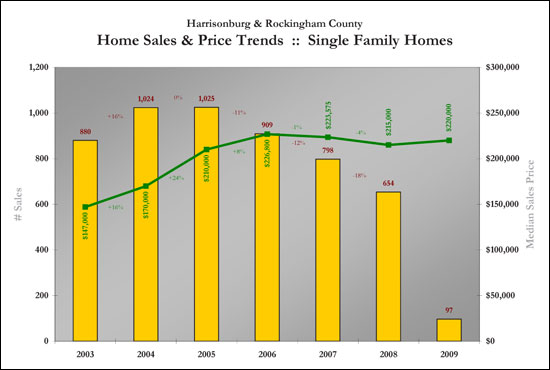 When examining only single family home sales in Harrisonburg and Rockingham County we see a slight increase in median sales price, though this median sales price has not had a significant net increase or decrease since 2006. During the same time, the sales pace has decreased drastically -- 28% between 2006 and 2008. 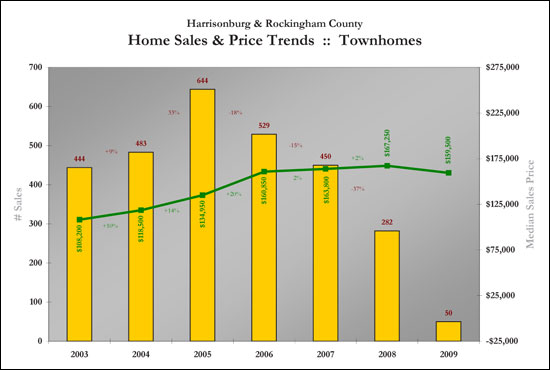 Sales of townhomes in Harrisonburg and Rockingham County continue to slow, though median sales prices continue to stay relatively steady. We have seen an amazing 56% decline in townhome sales between 2005 and 2008 --- with even more of a decline likely to be evident by the end of 2009. 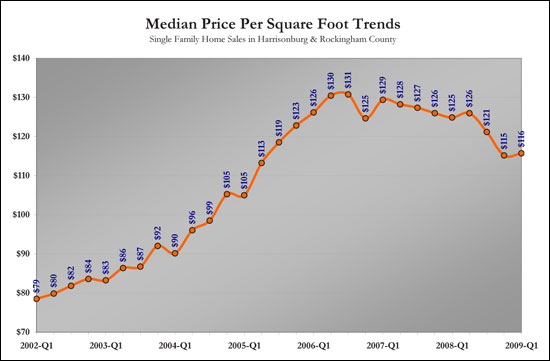 Examining the median price per square foot of sold single family homes in Harrisonburg and Rockingham County reveals a gradual (small) decline in home values (as defined by this metric) between 2006-Q3 and 2008-Q4. Over the past three months, however we have started to see an increase again. Click here to for a printable PDF of this entire report. | |
Home sales increase in February, is our local market poised for a recovery? |
|
Click here to view/print a PDF of my real estate market report. Enjoy! 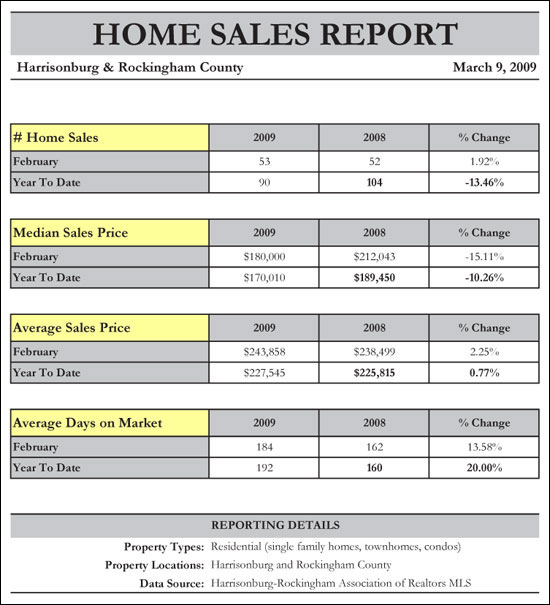 This month's home sales report (above) has several surprises, the first ofwhich is the increase in sales in February 2009 compared to February2008. Though only a modest increase, we have only seen this type ofincrease in sales (compared to the same month the prior year) 3 timesin the past 14 months. Median sales prices have fallen considerably when comparing Jan/Feb2009 with Jan/Feb 2008. This is, however, solely based on two monthsof data (a small sample size), and thus these figures may be affectedby the sales price distribution of the properties that have closed inthese two months. Somewhat contradictory to the median sales pricetrends, we see that average sales prices have increased when comparingJan/Feb 2008 to Jan/Feb 2009. Average Days on Market has increased somewhere between 14% and 20%during the past year, which is likely no surprise to sellers, many ofwhom have experienced a longer than typical length of time on themarket. 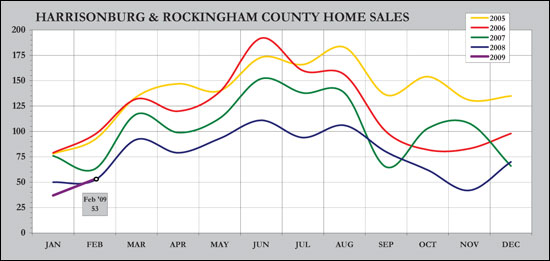 Home sales in February 2009 (53) were stronger than in February 2008 (52), perhaps suggesting that we may see 2009 turn into just as strong of a year as 2008. After several years of consecutive declines in real estate activity, February's sales figures should be an encouragement for homeowners --- perhaps the pace is finally increasing again in our local residential real estate market. 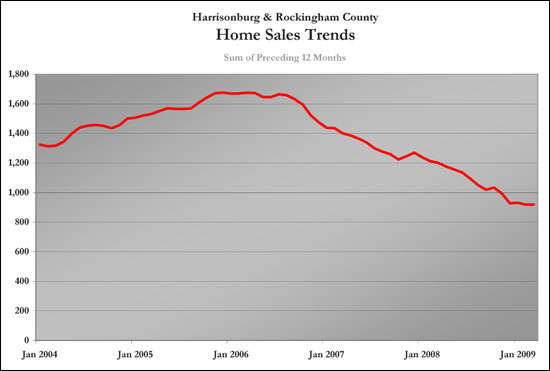 This graph shows a normalized trend of home sales by charting the ongoing sum of the preceding 12 months' sales. This normalized trend line is now showing a leveling off of home sales, perhaps indicative that the market is becoming more stable. 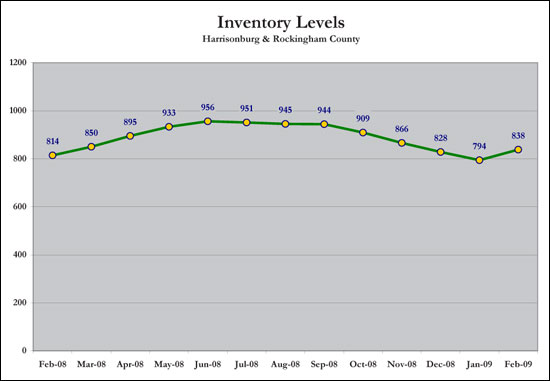 Likely as a result of the coming spring real estate market, inventory levels are now headed back up. If we continue to see an increase in the number of homes on the market, buyers will have even more negotiating power as we move forward. 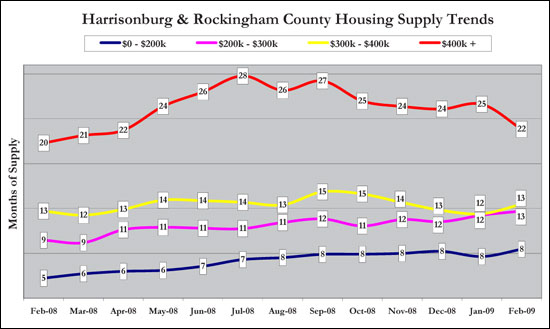 Supply levels in the $400,000+ price range dropped significantly (from 25 months to 22 months) --- due in large part to a significant increase in sales in this price range. We continue to see the healthiest supply levels in the lowest price ranges. 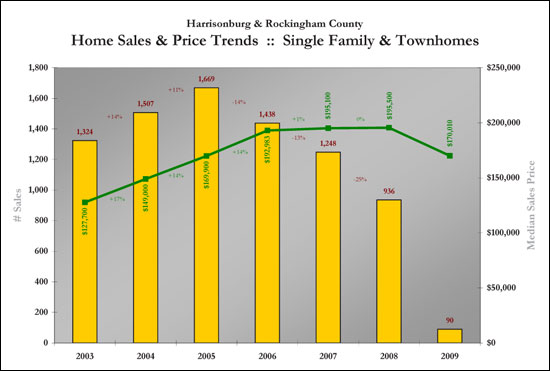 This graph captures all residential real estate activity as reflected in the Harrisonburg/Rockingham Multiple Listing Services. The pace of home has decreased significantly over the past four years, but home values have continued to stay level or increase slightly. 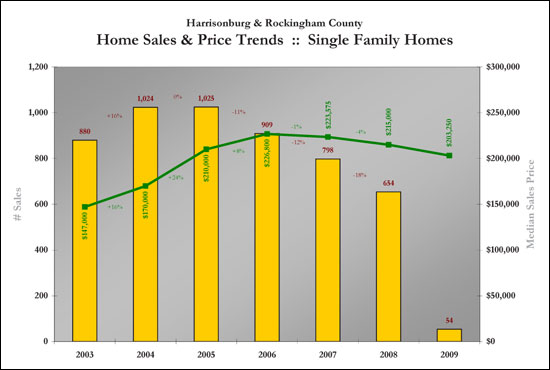 When we examine solely the single family home market we find a somewhat more significant decrease in median sales price (4% between 2007 and 2008), but we don't see as much of a drop off in the number of sales taking place. Of note, the record growth in median sales prices was 2004 when we saw a 24% increase. 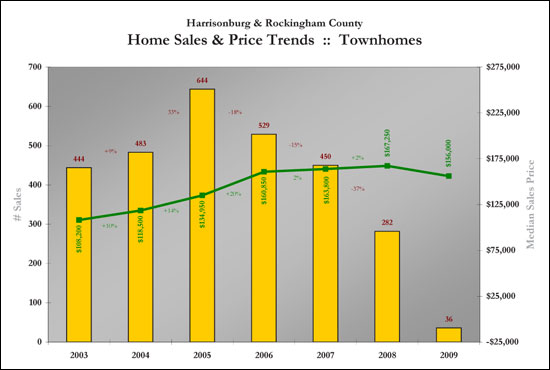 Sales in the townhouse market have drastically decreased, with a 37% decrease just between 2007 and 2008. Sales of townhouses are now down below even 2003 levels. The good news, however, is that the median sales price of townhouses continues to increase, with a 2% increase between 2007 and 2008. 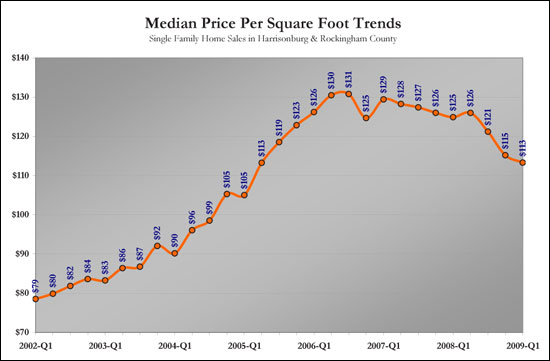 Examining the median price per square foot of sold single family homes in Harrisonburg and Rockingham County reveals an overall decline in home values (as defined by this metric). We are now at 2005 First Quarter prices per square foot, which is a decline of 14% since the peak in 2006. | |
Signs of Resilience in the Local Real Estate Market - December 2008 Real Estate Market Report |
|
The December 2008 Real Estate Market Report for Harrisonburg and Rockingham County is now available. Click here for a printable PDF of this report. 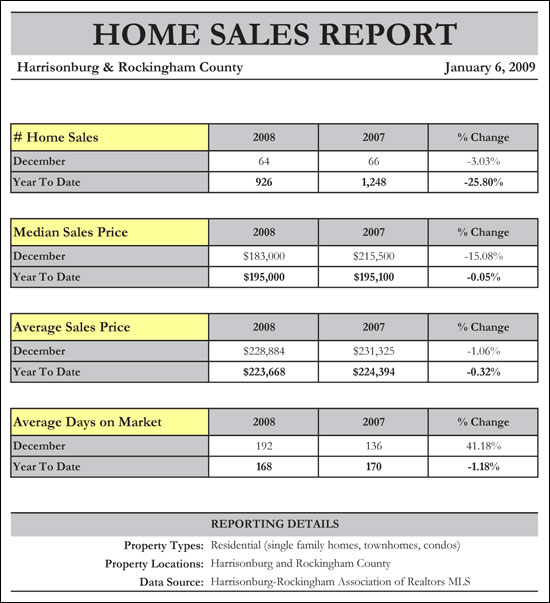 The local market showed a 26% decline (year over year) in sales pace, and yet a December to December comparison only shows a 3% drop in sales pace. This could be a good indicator of the pace of market activity increasing. While December to December comparisons of Median Sales Price and Average Days on Market show some abnormalities, full-year data (2008 vs. 2007) does not show a significant shift in Median Sales Price, Average Sales Price or Average Days on Market. Given the current national economic stresses, this is a sign of a resilient local real estate market. 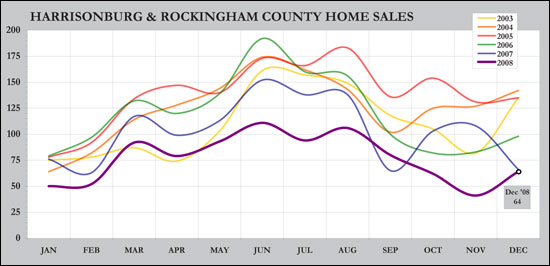 Harrisonburg and Rockingham County home sales finished the year out strong in 2008, with 64 residential sales. This brings the December 2008 sales pace up almost to last December's pace of 66 sales, and is also a 56% increase in sales as compared to the 41 home sales in November 2008. Do note, however, that both November 2008 sales and December 2007 sales were abnormally low in comparison to their surrounding months. 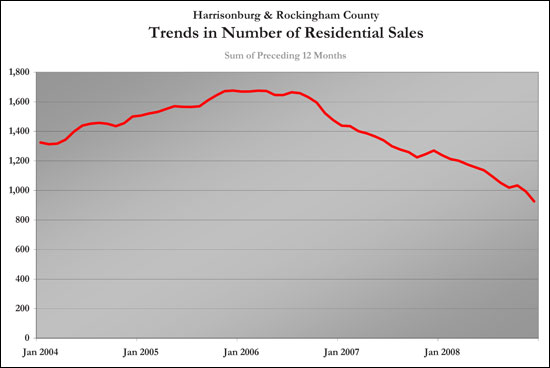 This graph shows a normalized trend of home sales by charting the ongoing sum of the preceding 12 months' sales. As can be expected, the long term sales trend continues to show a decline in home sales activity as we finish out 2008. 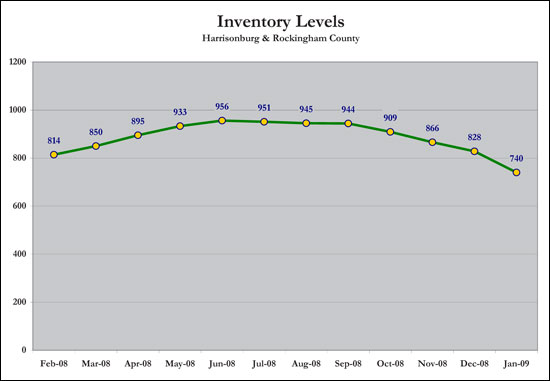 One sign that our market is returning to a somewhat healthier state is that inventory continues to decline -- as a result of home sales as well as homes being taken off the market. We are now well below inventory levels from 11 months ago, with no end to this decline in sight. 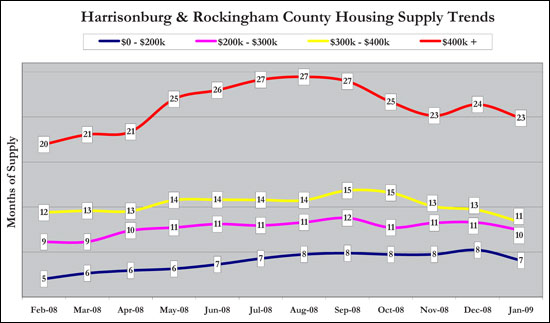 As inventory levels fell over the past month, so has the months of supply of all price ranges. This trend will also help our real estate market return to a healthier balance. Six months of supply is considered by many to be a healthy supply that favors neither buyers nor sellers. Again, here is a printable PDF of the December 2008 Real Estate Market Report for Harrisonburg and Rockingham County. | |
November 2008 Home Sales Report for Harrisonburg & Rockingham County |
|
The November 2008 Harrisonburg & Rockingham County Real Estate Market Report is now available. Click here for a printable PDF of this report.  November 2008 sales (40) show a drastic drop (-63%) compared to a (higher than normal) month of sales in November 2007 (108). However, even with a slower sales pace, year to date average sales prices and median sales prices are holding relatively steady.  The pace of home sales has steadily declined since August 2008. November 2008 sales (40) were especially low compared to a surprisingly strong November 2007 (108 sales). A decline at this time of year is not atypical, but a 40-sale month is the lowest sales figure we have seen in six years. December has showed an increase over November in four of the past five years, so we may yet see an influx in buyers this year.  This graph shows a normalized trend of home sales by charting the ongoing sum of the preceding 12 months' sales. Despite an increase in sales pace for October 2008, this month we again see a continued decrease in this long-term sales trend.  Inventory levels have dropped to February 2008 levels, which will likely help the health of our local market. We have seen an oversupply of properties for sale for many months, and a decrease in supply (even amidst a decrease in sales pace) is a good sign.  Supply levels across most price ranges have stayed steady this month, except in the $400k+ price range. Six months of supply is often seen as a healthy balance between a seller's and buyer's market, so we still have some adjustments before we reach such a balance. | |
October 2008 Harrisonburg & Rockingham County Real Estate Market Update |
|
The October 2008 Harrisonburg & Rockingham County Real Estate Market Report is now available. Click here for a printable PDF of this report.  Sales continue to be slow compared to last year, but overall prices continue to slowly and steadily increase. Both the median and average sales price increased when comparing January through October of last year versus this year.  After a strong September (compared to last September), October's sales figures are lower than expected. October's sales (62) were 40% lower than last October's sales (103). Perhaps last year's fall months (October & November) were an anomaly with their strong increase.  This graph shows a normalized trend of home sales by charting the ongoing sum of the preceding 12 months' sales. Despite an increase in sales pace last month (October 2008), this month we again see a continued decrease in this long-term sales trend.  Inventory continues to decline in Harrisonburg and Rockingham County --- this month down to 866 active single family, townhome and condo listings. This is a 9% decrease compared to June 2008's inventory level of 956 active properties.  As inventory continues to decline, likewise the number of months of housing that is on the market has also declined. The top two price ranges ($300k-$400k, $400k+) both are headed back down towards (somewhat) healthier supply levels. | |
September 2008 Harrisonburg & Rockingham County Real Estate Market Update |
|
The September 2008 Harrisonburg & Rockingham County Real Estate Market Report is now available. Click here for a printable PDF of this report. 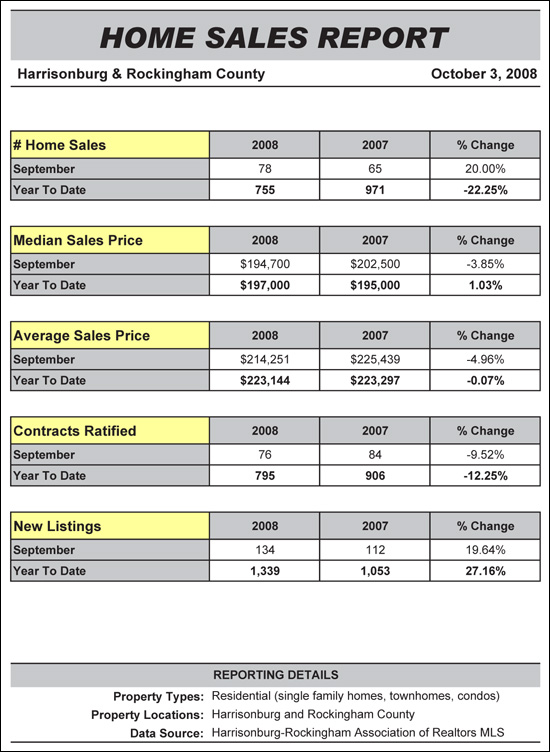 When comparing September 2008 to September 2007, both median and average sales prices show declines, of 3.85%, and 4.96% respectively. However, when comparing Jan-Sept 2008 to Jan-Sept 2008, the median sales price still shows an increase of 1.03%. 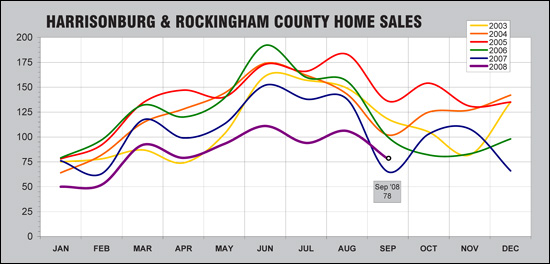 Each year for the past six years, September sales have been slower than in August, and 2008 was no different. However, September 2008 sales were stronger than September 2007, which, combined with the typical increase in October sales, make this a good trend to watch. 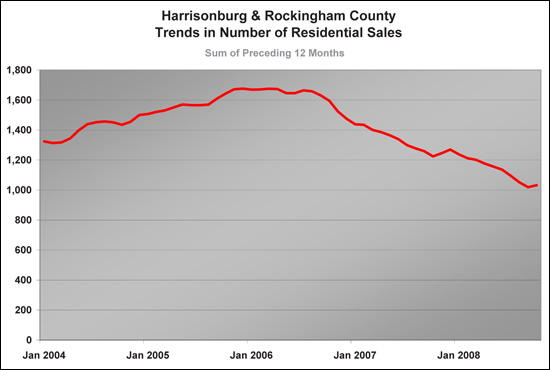 This graph shows a normalized trend of home sales by charting the ongoing sum of the preceding 12 months' sales. Pay close attention this trend next month, as the September 2008 sales trend figure (Oct 1 ‘07 - Sept 30 ‘08) shows an increase in sales. 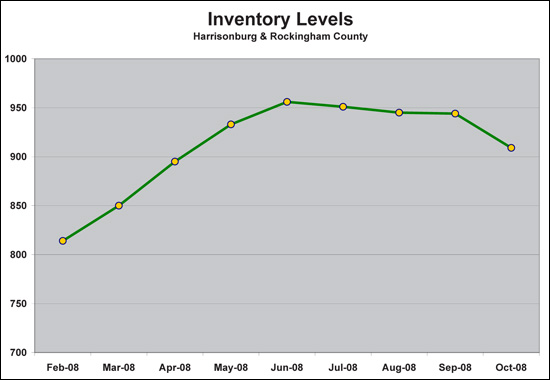 For quite some time, we have seen an elevated level of inventory -- thus, it is healthy to see a decrease in inventory levels. Yet, we may also be observing a seasonal trend in inventory that we will see continue through the winter. 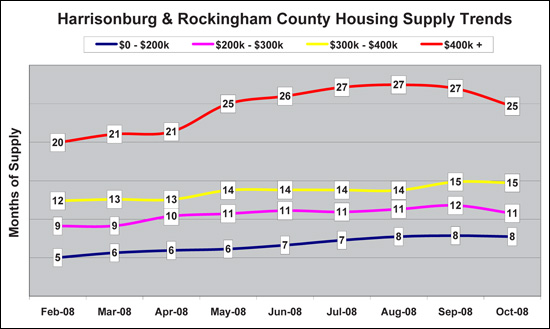 Inventory has declined since August, and likewise, the number of months of housing that is on the market has also declined. The sub-$200k supply has remained stable for several months, but the price range with the most extreme over-supply ($400k+) has declined. | |
August 2008 Real Estate Market Report for Harrisonburg & Rockingham County |
|
Click on any of the charts or graphs below for a printable PDF of the August 2008 Real Estate Market Report for Harrisonburg & Rockingham County. Perhaps of most interest is that buyers are committing to buy properties at an almost equivalent rate as they were last year. Last August, 77 properties went under contract, and this August 76 properties went under contract. This seems to indicate that either we will see closed transactions pick up as the year continues, or that fewer buyers are able to get from contract to closing on a property. 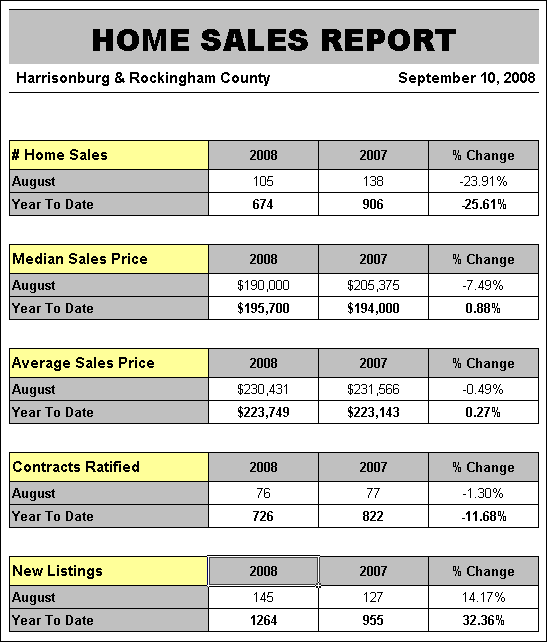 We are in a buyers market. In many markets around the country, which are also in buyers markets, prices have declined significantly over the past 18-24 months. However, we continue to see average and median sales prices staying relatively level. Both average and median sales prices increased (by less than 1%) when comparing Jan-Aug 2007 to Jan-Aug 2008. 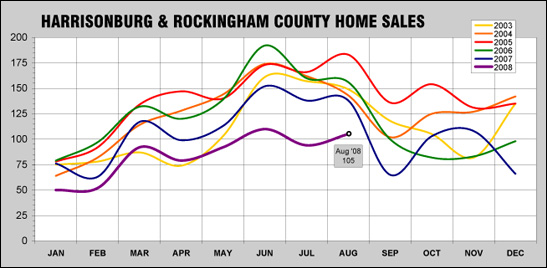 Home sales continue to be largely seasonably predictable. Sales increased in August (as compared to July) as they have in most previous years. September, October and November will be interesting months to observe, as last year October and November showed a modest increase in sales activity. 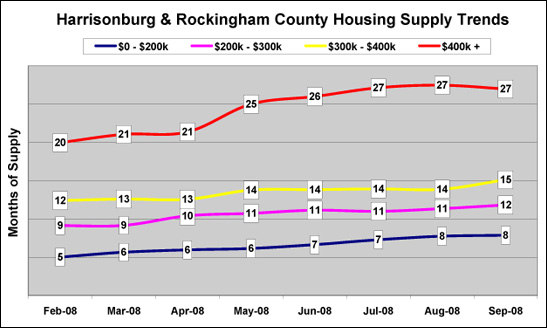 Housing supply is holding steady, or increasing slightly in all price ranges. The lowest price range ($0-$200k) continues to have the healthiest relationship between buyers and sellers, with the most expensive price range being the most out of balance. If you are interested in a more specific analysis of a particular segment of the Harrisonburg or Rockingham County real estate market, please call (540-578-0102) or e-mail me. | |
| Newer Posts |
Scott Rogers
Funkhouser Real
Estate Group
540-578-0102
scott@funkhousergroup.com
Licensed in the
Commonwealth of Virginia
Home Search
Housing Market Report
Harrisonburg Townhouses
Walk Through This Home
Investment Properties
Harrisonburg Foreclosures
Property Transfers
New Listings

