Trends
| Older Posts |
November Home Sales Surge with 12% Year Over Year Growth and 5% Increase in Median Price |
|
 Happy Friday morning, friends! It's hard to believe there are only 19 days remaining in 2024! This year has flown by, and we'll soon be ringing in the New Year! Speaking of new beginnings, I'm excited to let you know about the latest news in our family - our son, Luke, is now also a Realtor! Luke looks forward to helping individuals and families navigate the real estate market in the Harrisonburg and Rockingham County area and is also continuing his studies at JMU, pursuing a dual degree in Independent Scholars and Communication Studies with minors in Entrepreneurship and Honors Interdisciplinary Studies. In some other fun news, The Steel Wheels are hosting another Winter Roots concert in February at JMU's Wilson Hall. You can find the details of the concert here, buy tickets here... and... enter to win a pair of free tickets here! And now... after all that... let's hit the real estate data... 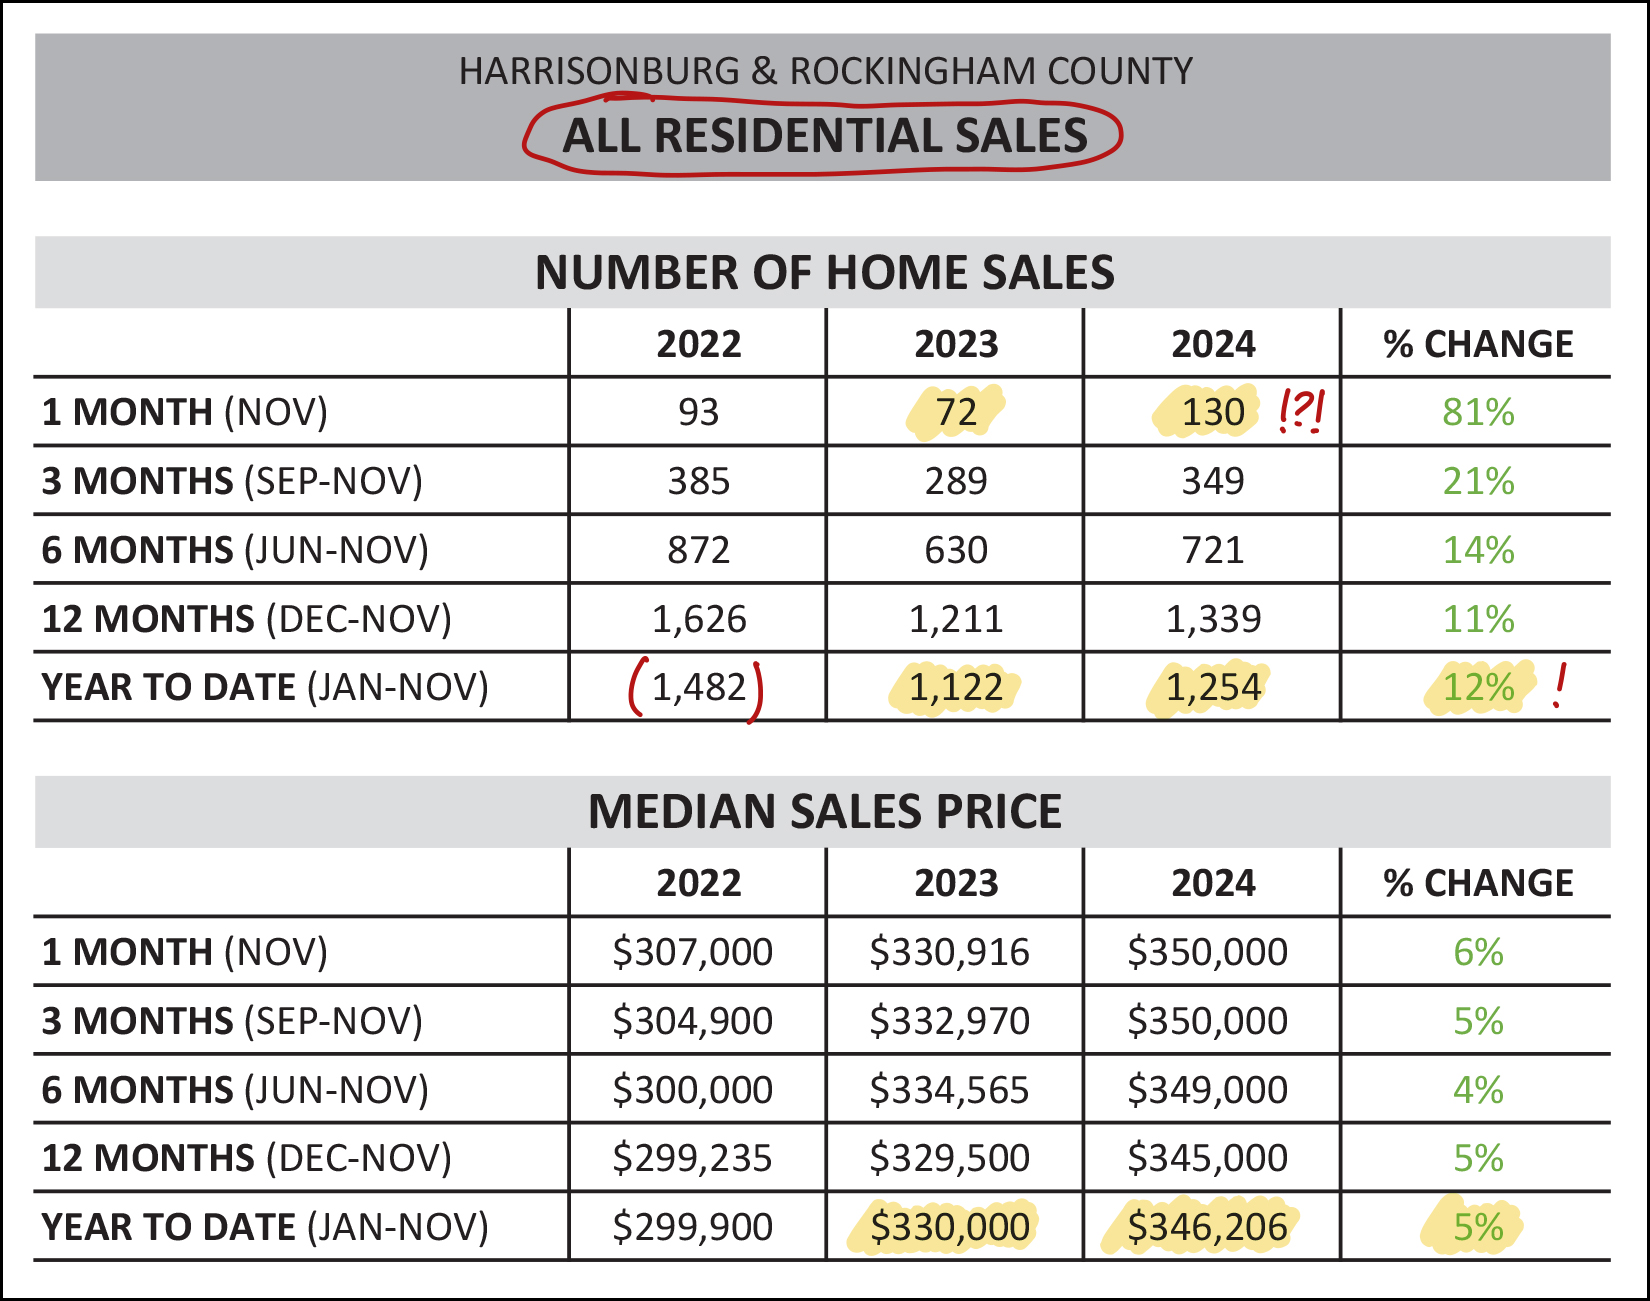 First up... look at those November home sales!?! Last November there were only 72 home sales in Harrisonburg and Rockingham County... this November... 130 home sales!?! This took me by surprise. Even if we considered November 2023 to be a bit slower than normal, when we look back at November 2022 there were only 93 home sales... so this November was certainly a surprising surge of home sales for our market. This surge of home sales in November lead to -- no surprise here -- continued improvement in how this year's home sales compare to last year. We have now seen 12% more home sales this year than last in Harrisonburg and Rockingham County when looking at 11 months of data. Of note... the 1,254 home sales seen thus far in 2024 is still quite a bit lower than the 1,482 home sales seen in the first 11 months of 2022. And how about those prices? The median sales price for all homes sold in 2024 in Harrisonburg and Rockingham County is now approaching $350,000... which is a 5% increase compared to the median of $330,000 seen last year. Moving on to look at few sub-sections of the market, first let's see what's happening in the detached home market - which excludes townhouses, duplexes and condos... 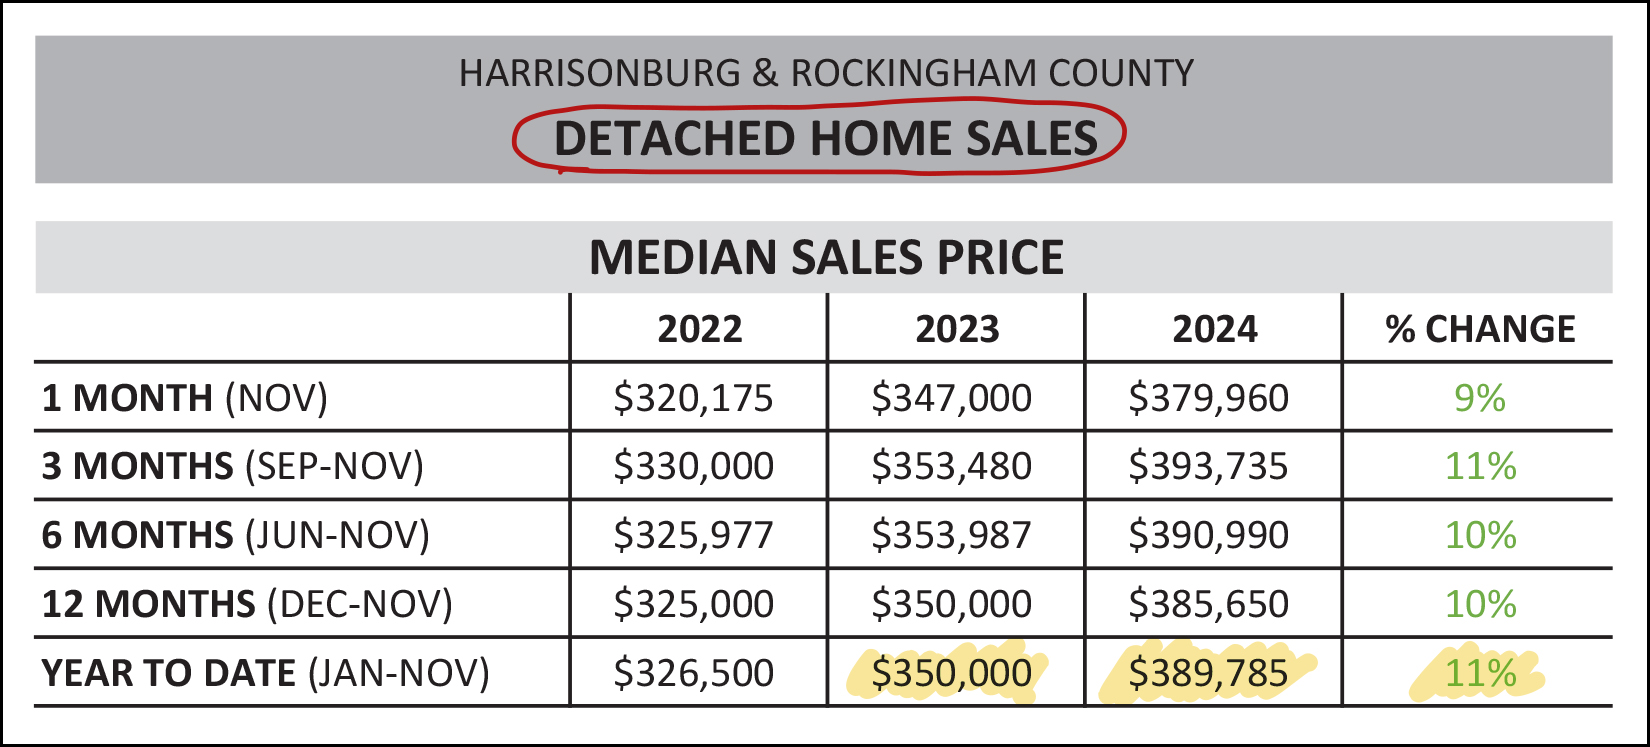 The main metric I have highlighted above is the median sales price in 2024 compared to 2023. A year ago the median sales prices of detached homes was $350,000... and we are now quickly approaching a median sales price of $400,000 in Harrisonburg and Rockingham County! This marks an 11% increase in the median sales price in the course of a year. Meanwhile, in the "attached homes" market -- which mainly includes townhouses but also duplexes and condos... 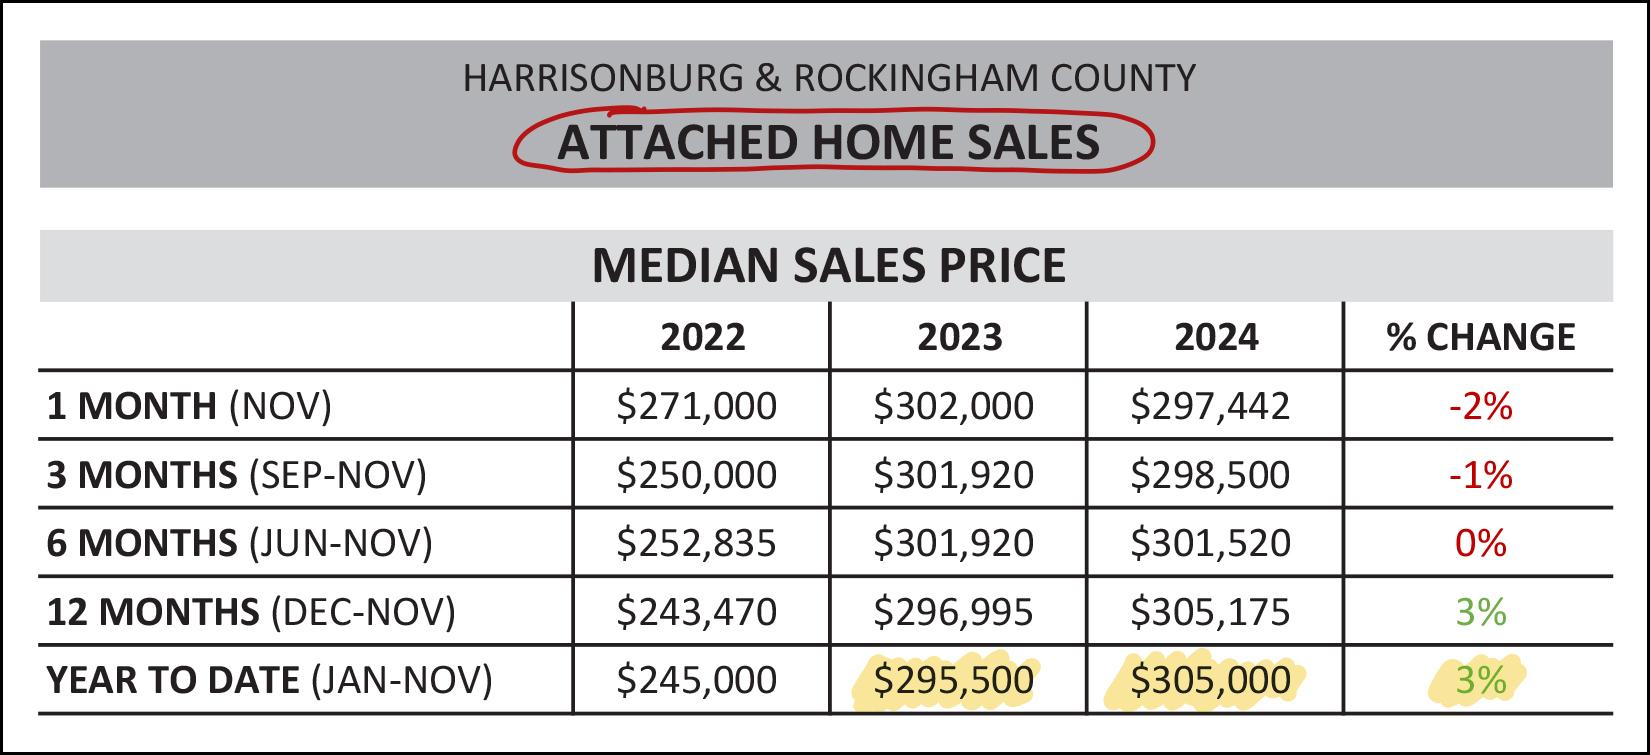 The median sales price is not climbing quite as quickly for townhouses, duplexes and condos... but that median sales price has eclipsed $300,000 for the first time in 2024. We can also learn a bit more about the nuances of the local real estate market but breaking things down between the City of Harrisonburg and Rockingham County. Here are the numbers for the City... 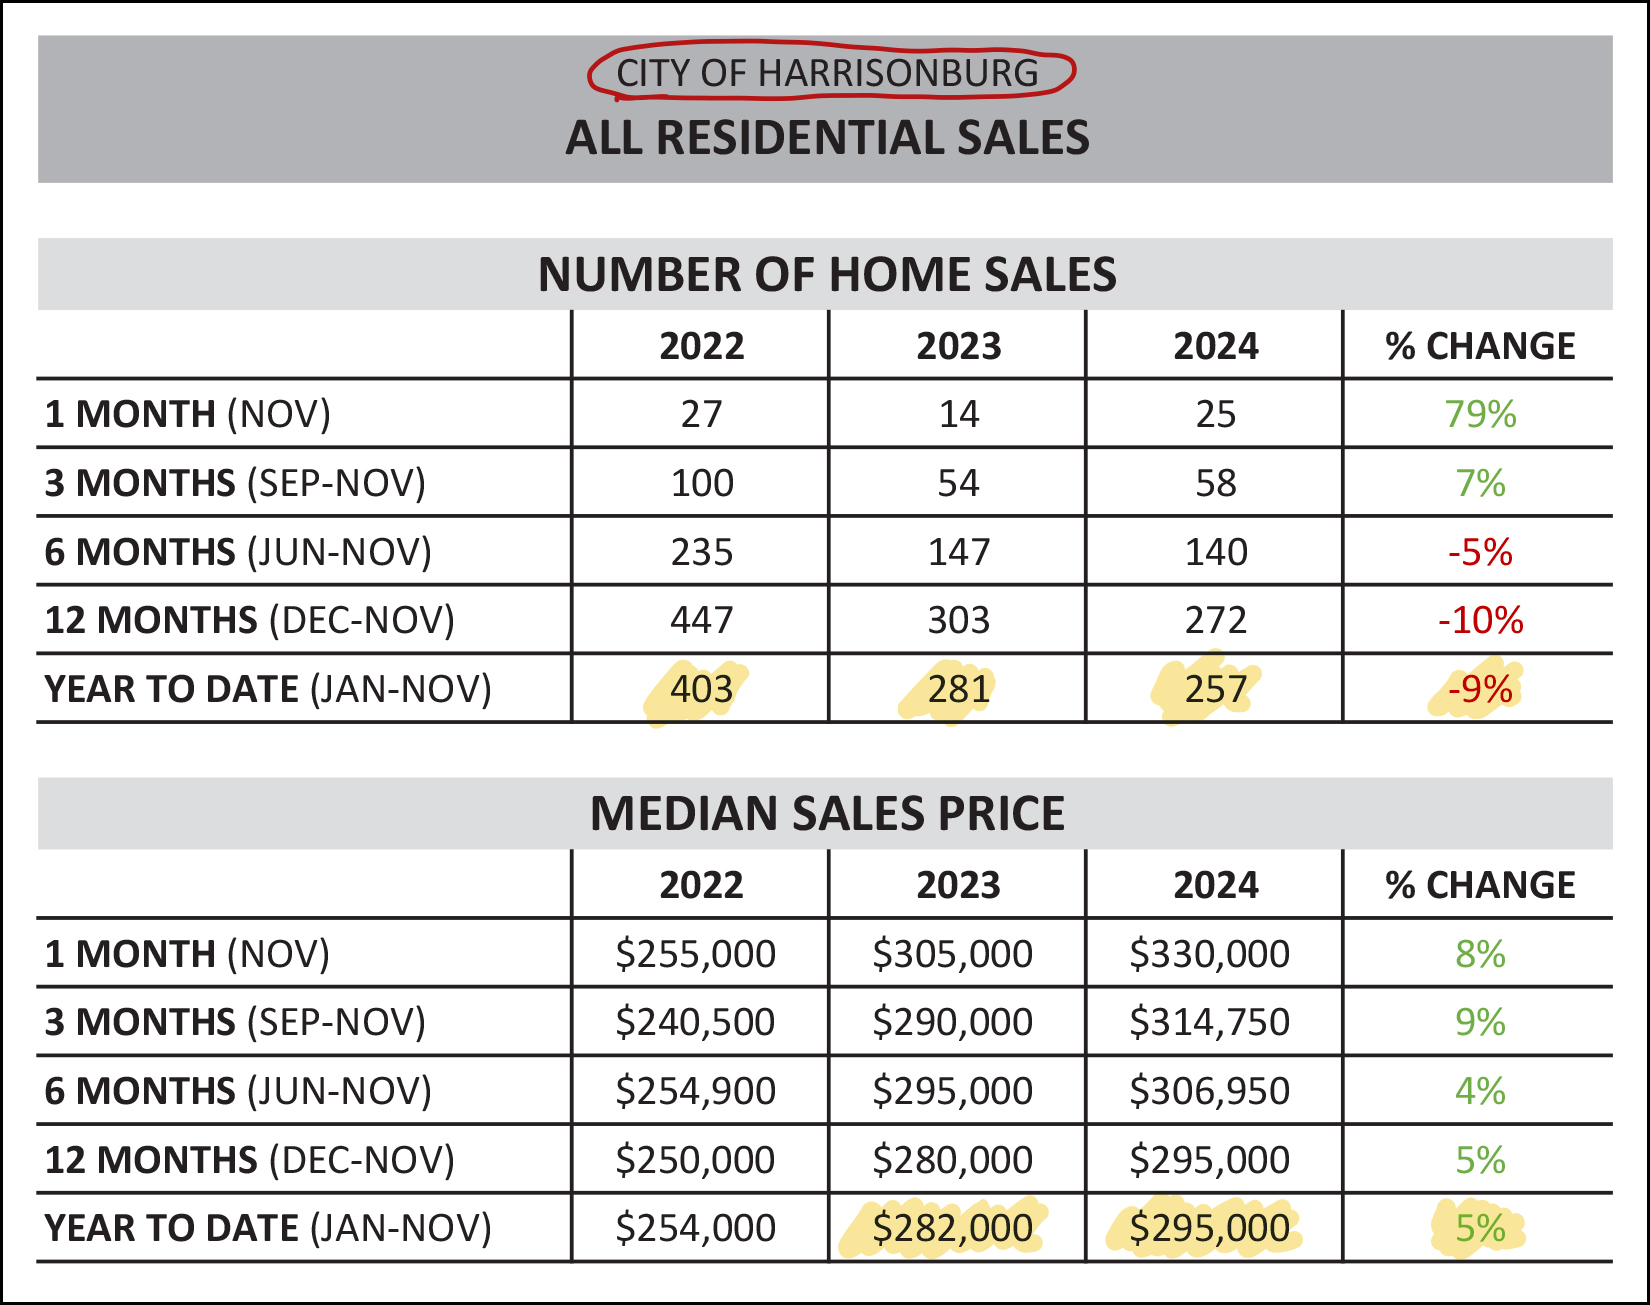 As you will note in the top half of the chart above... we have seen 9% fewer home sales in the City of Harrisonburg this year compared to last year... but as shown in the bottom half of the chart above... the median sales price has risen 5% to $295,000. Let's compare these figures to Rockingham County... you'll find they are quite a bit different... 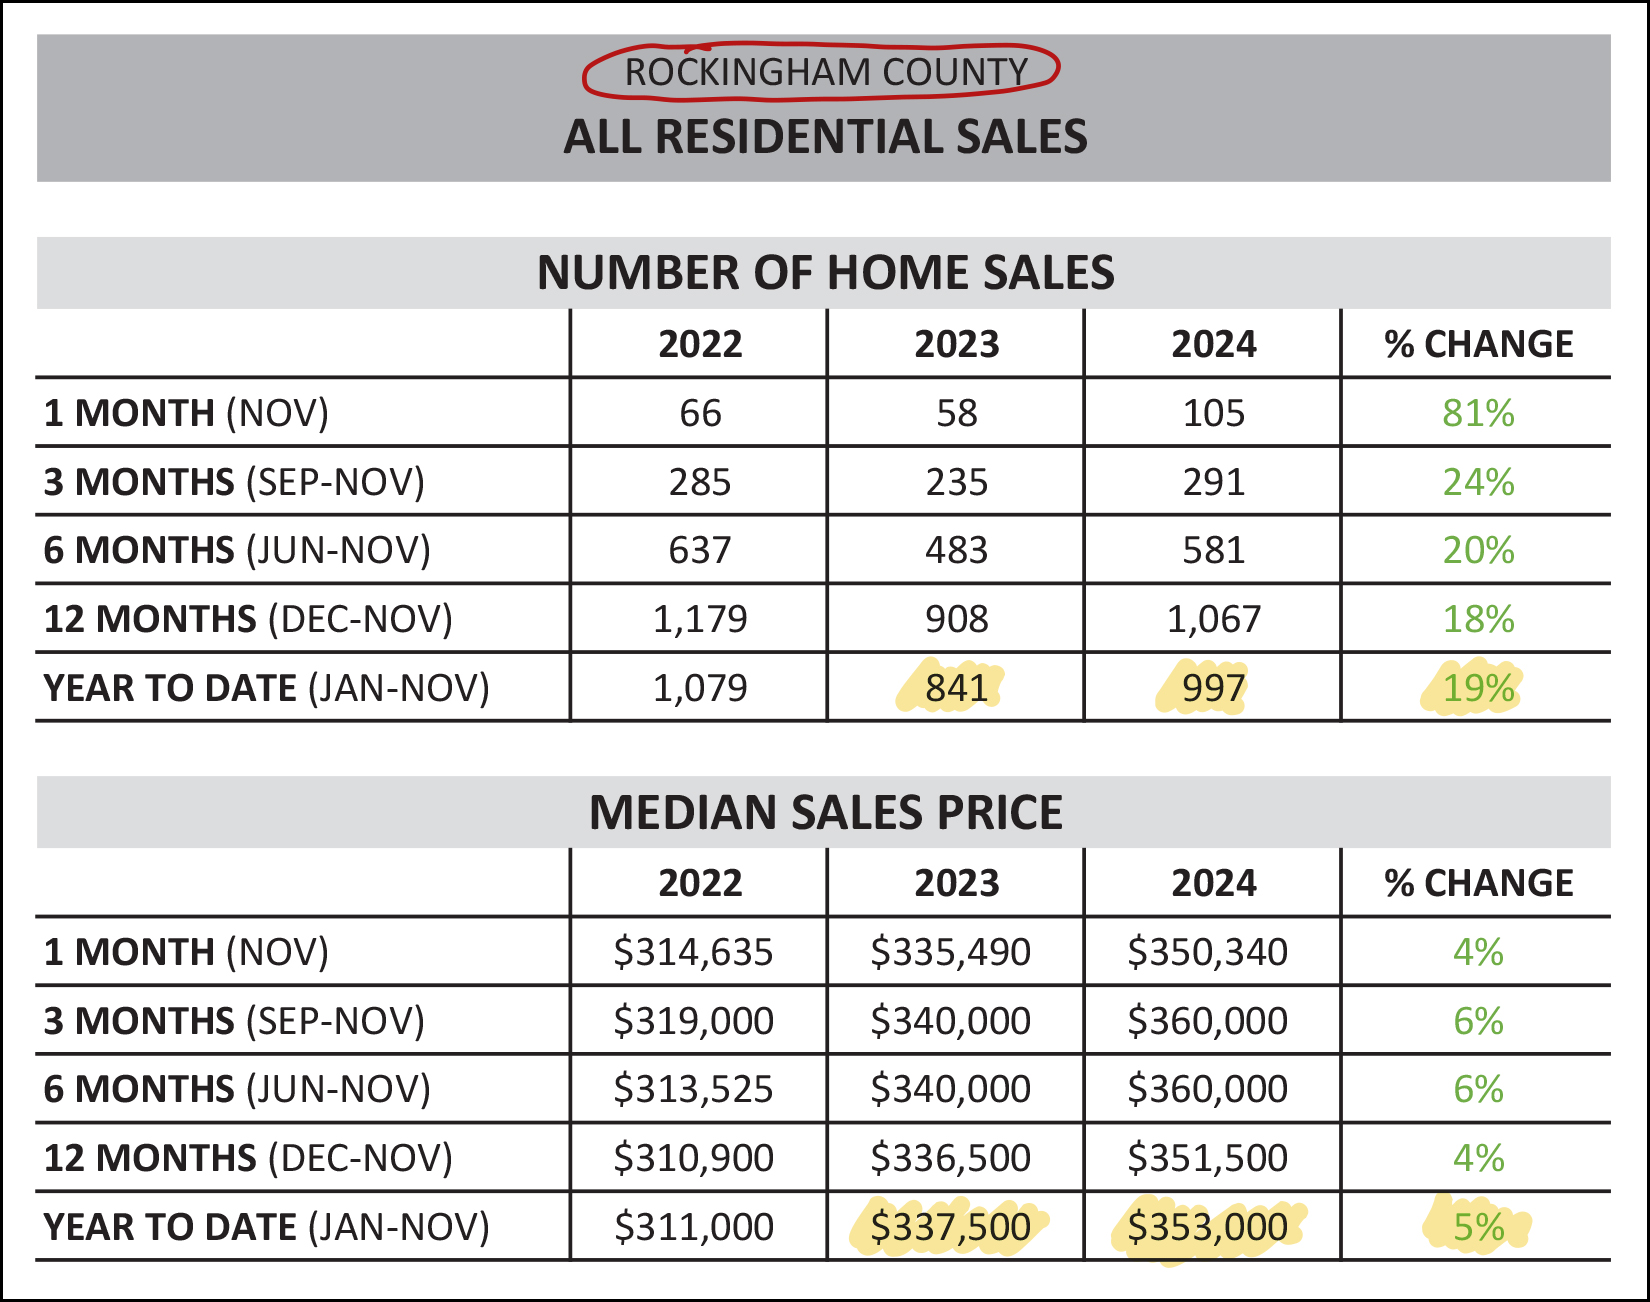 In contrast to the 9% decline in the number of City sales... we're seeing a 19% increase in the number of County sales -- though the median sales price in the County has increased by 5% over the past year, just as the City price has increased by 5%. Slicing and dicing the data one more time, let's look at new home sales compared to existing (resale) home sales. First up, new home sales... 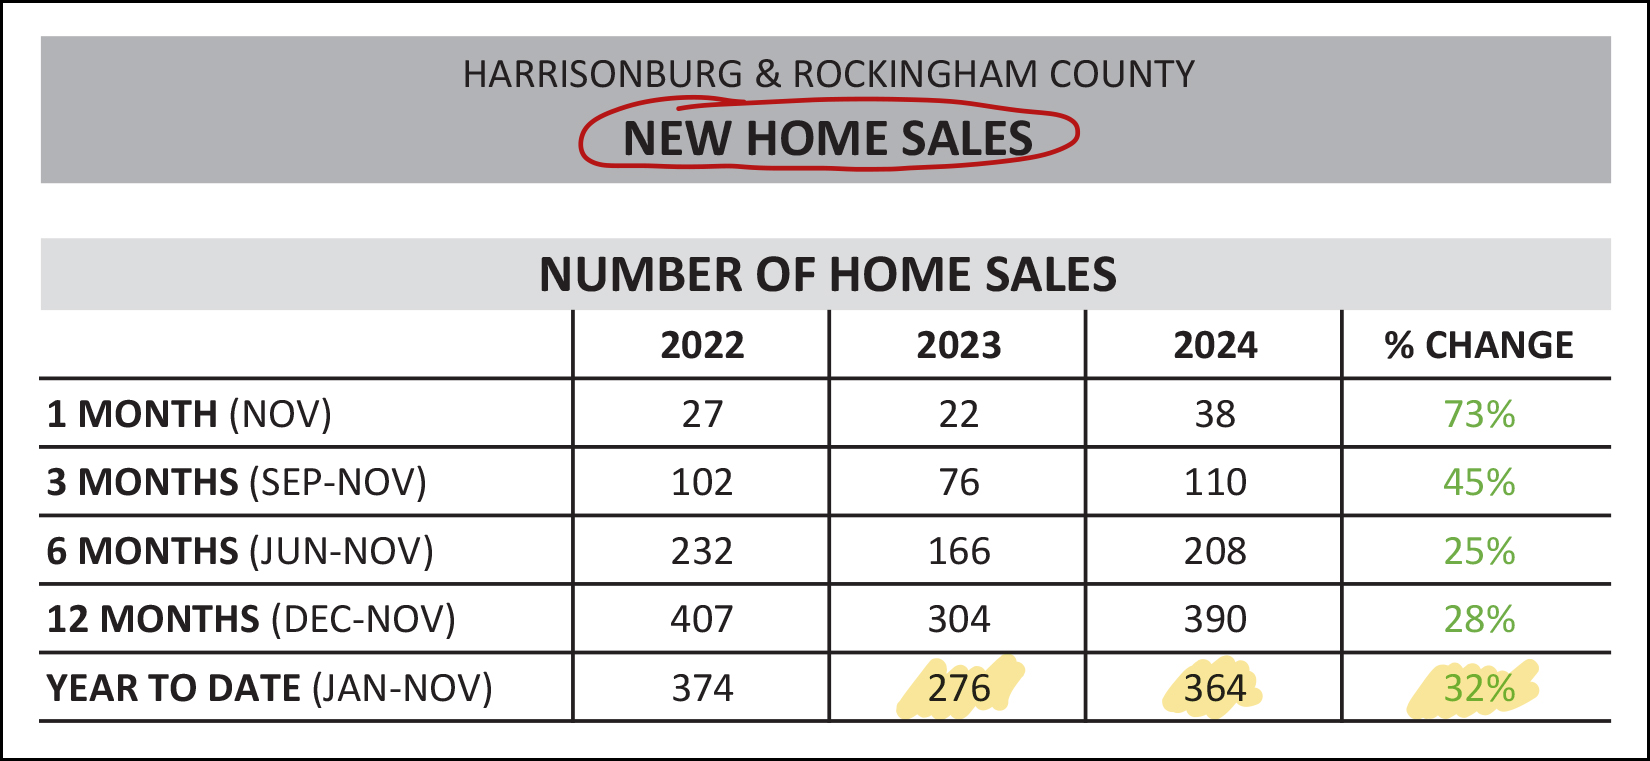 My oh my how the new homes are being built, and are selling. We have seen a 32% increase in the number of new homes that have sold in Harrisonburg and Rockingham Count this year (364) compared to last year (276) though - interestingly - we're right back to about the level (374) where we were two years ago. The existence of newly built homes in our community continues to be a significant factor in our overall housing market. And the existing home sales... did they increase by 32% Nope... 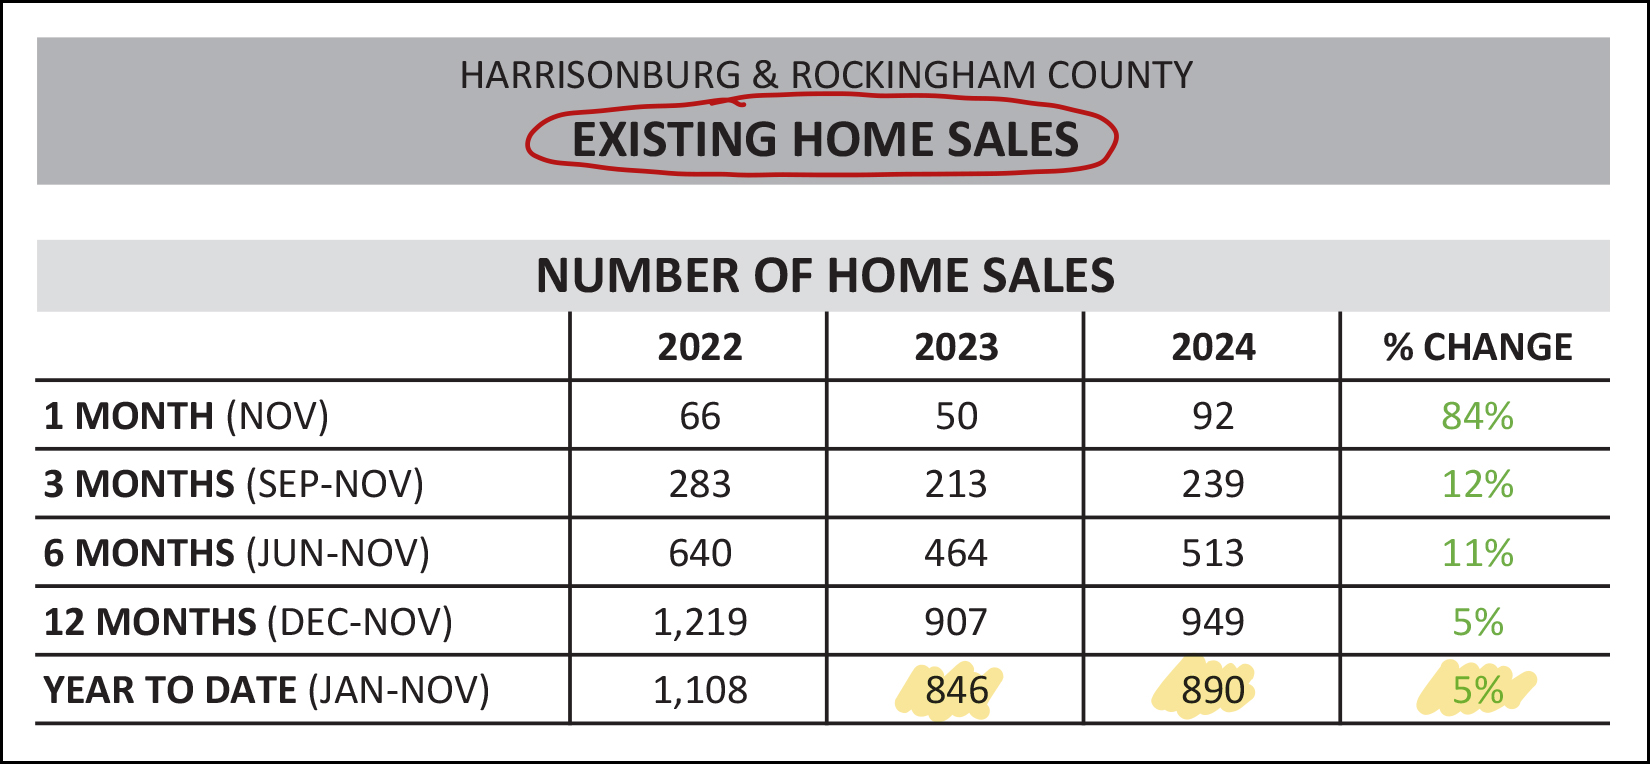 We are seeing an increase in existing home sales (+5%) this year... but nowhere near the 32% increase seen in new homes. This is not too surprising, as many homeowners simply do not want to sell their homes right now given the super low mortgage interest rates that many homeowners still have on their current mortgages. Now, then, you made it past the charts... let's see what we can learn from some graphs showing the latest trends in our local market... 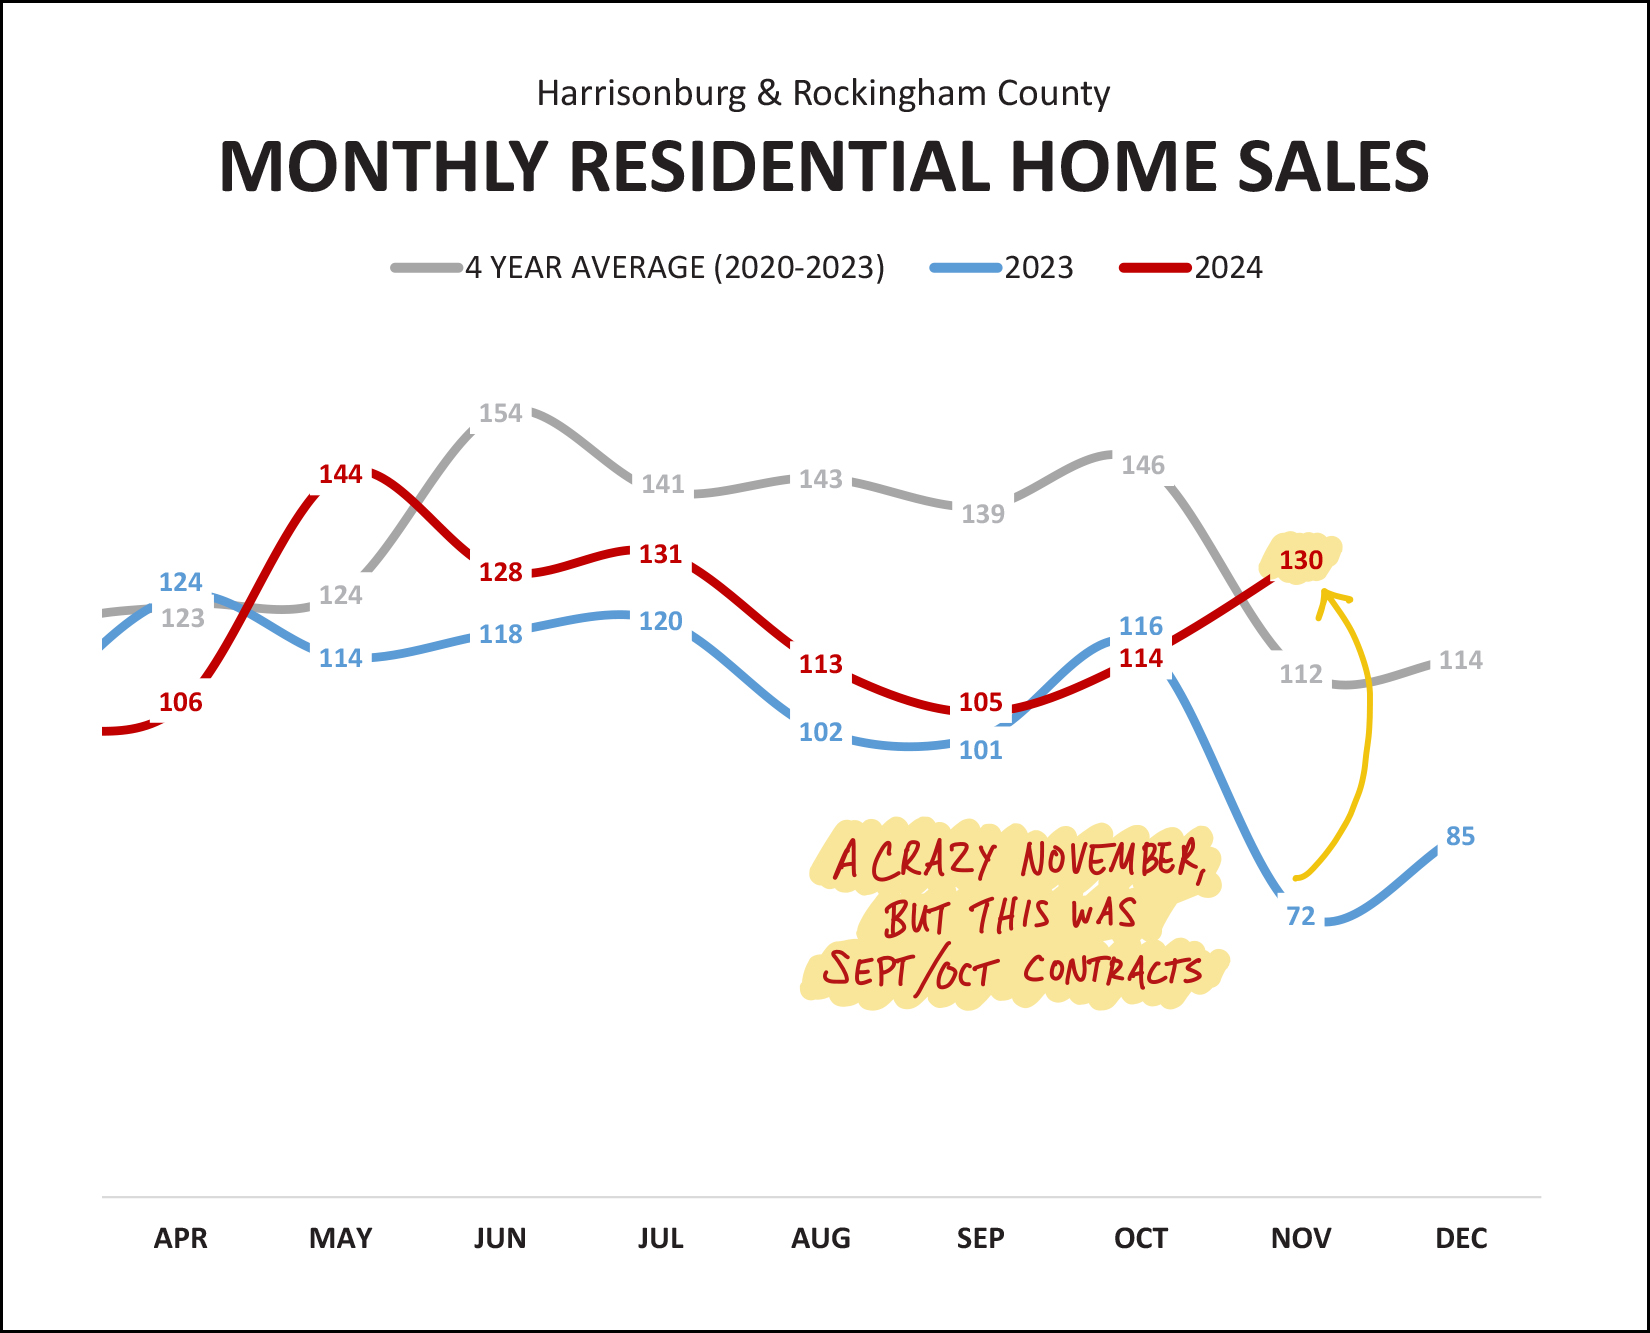 This graph (above) paints the picture more clearly than the chart of data earlier on -- the 130 home sales in November 2024 was unexpectedly high -- way higher than last November (72 sales) and also well above the average (112) of 2020 through 2023. But, remember, this high number of closed sales in November 2024 would have been the result of buyers (and sellers) signing contracts in September or October... since it takes some time to get from contract to closing. Thus, we'll look ahead a bit further on in this report to see what contract activity took place in November 2024 to better predict home sales activity in December 2024. But first, how is 2024 stacking up compared to prior years? 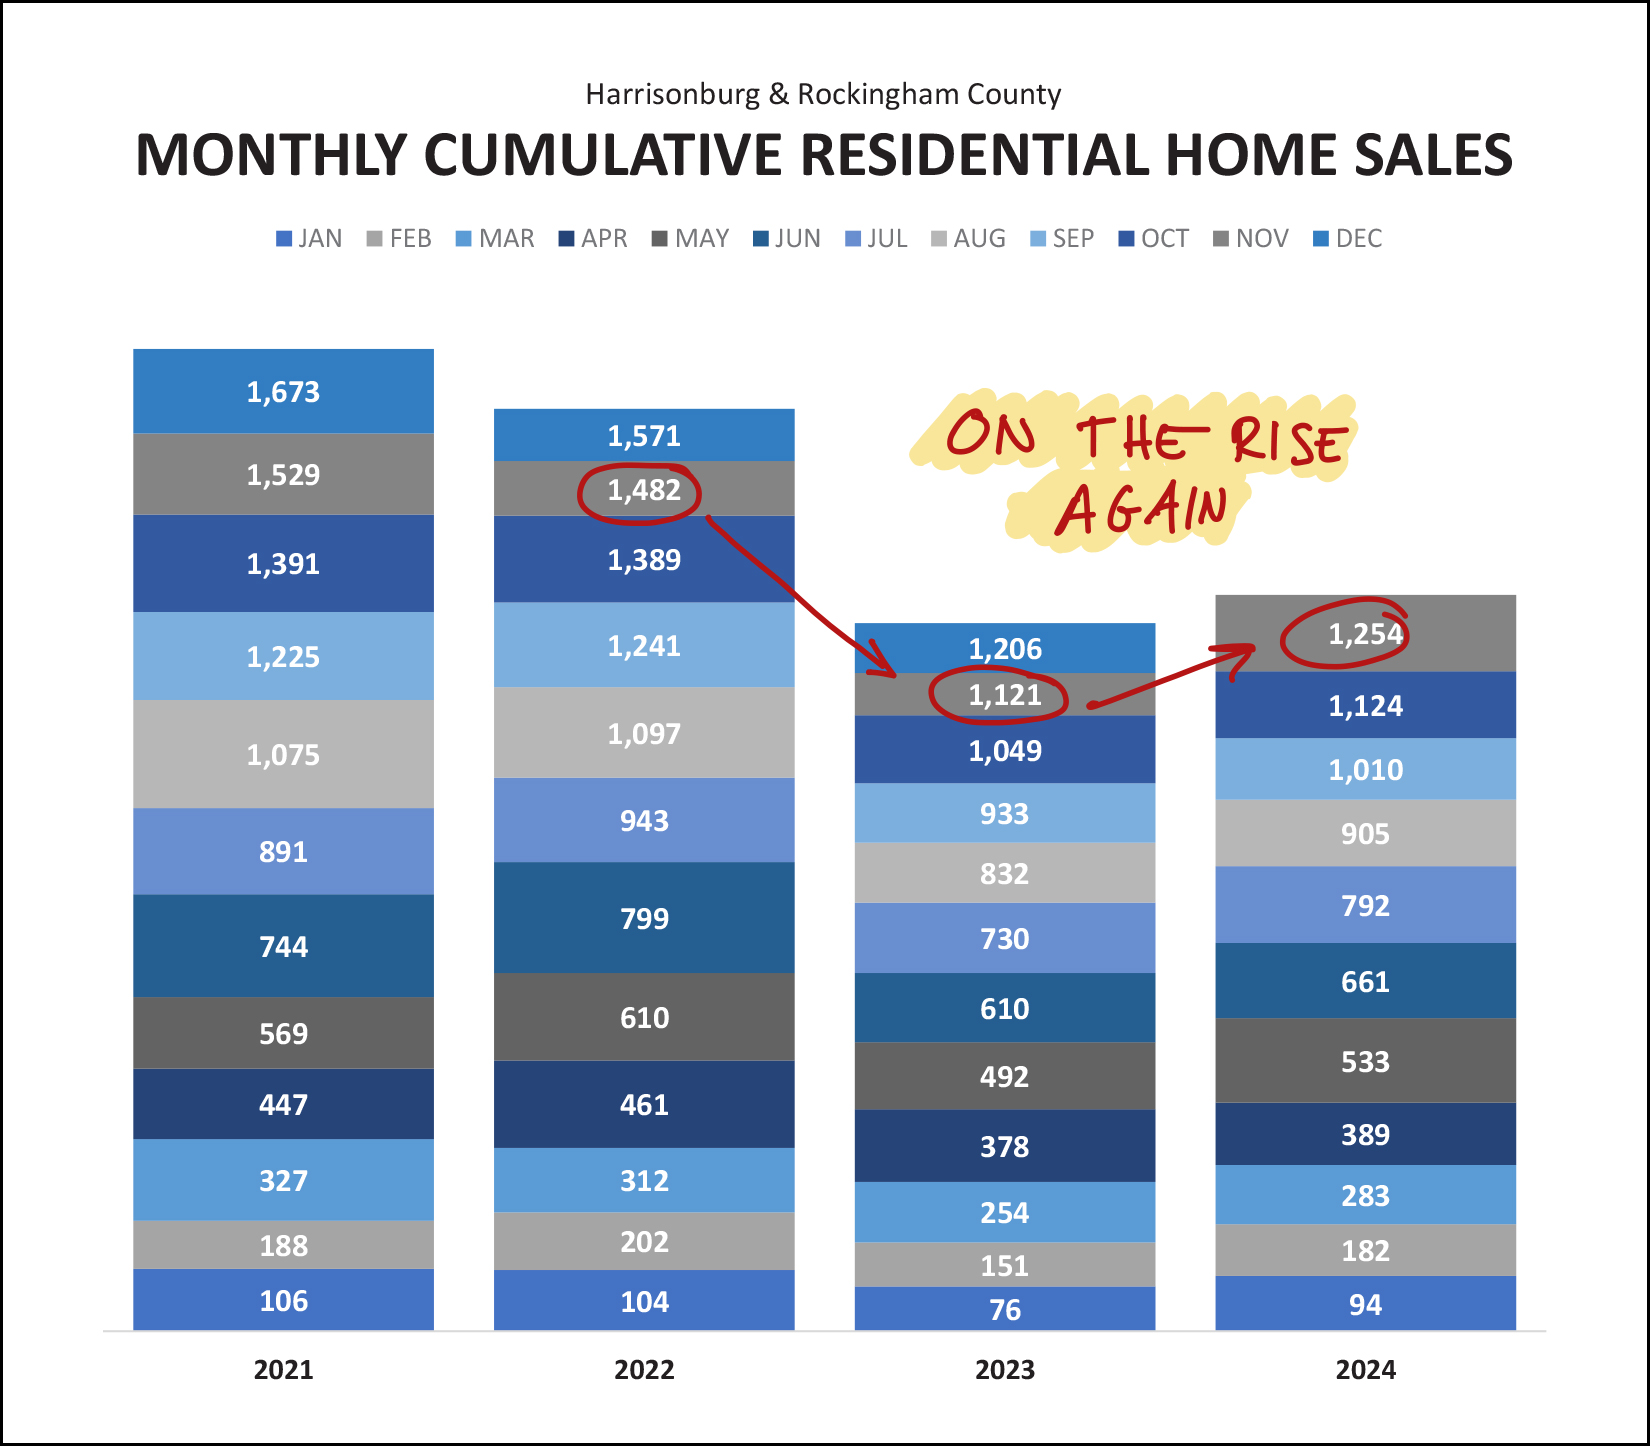 Home sales are on the rise again! After declining in 2022 and 2023, we are now seeing an increase in the number of home sales taking place in Harrisonburg and Rockingham County. The 1,254 home sales seen in the first 11 months of 2024 puts us 12% ahead of last year. Visualized differently, here's how the trajectory of home sales and home prices have changed over the past year... 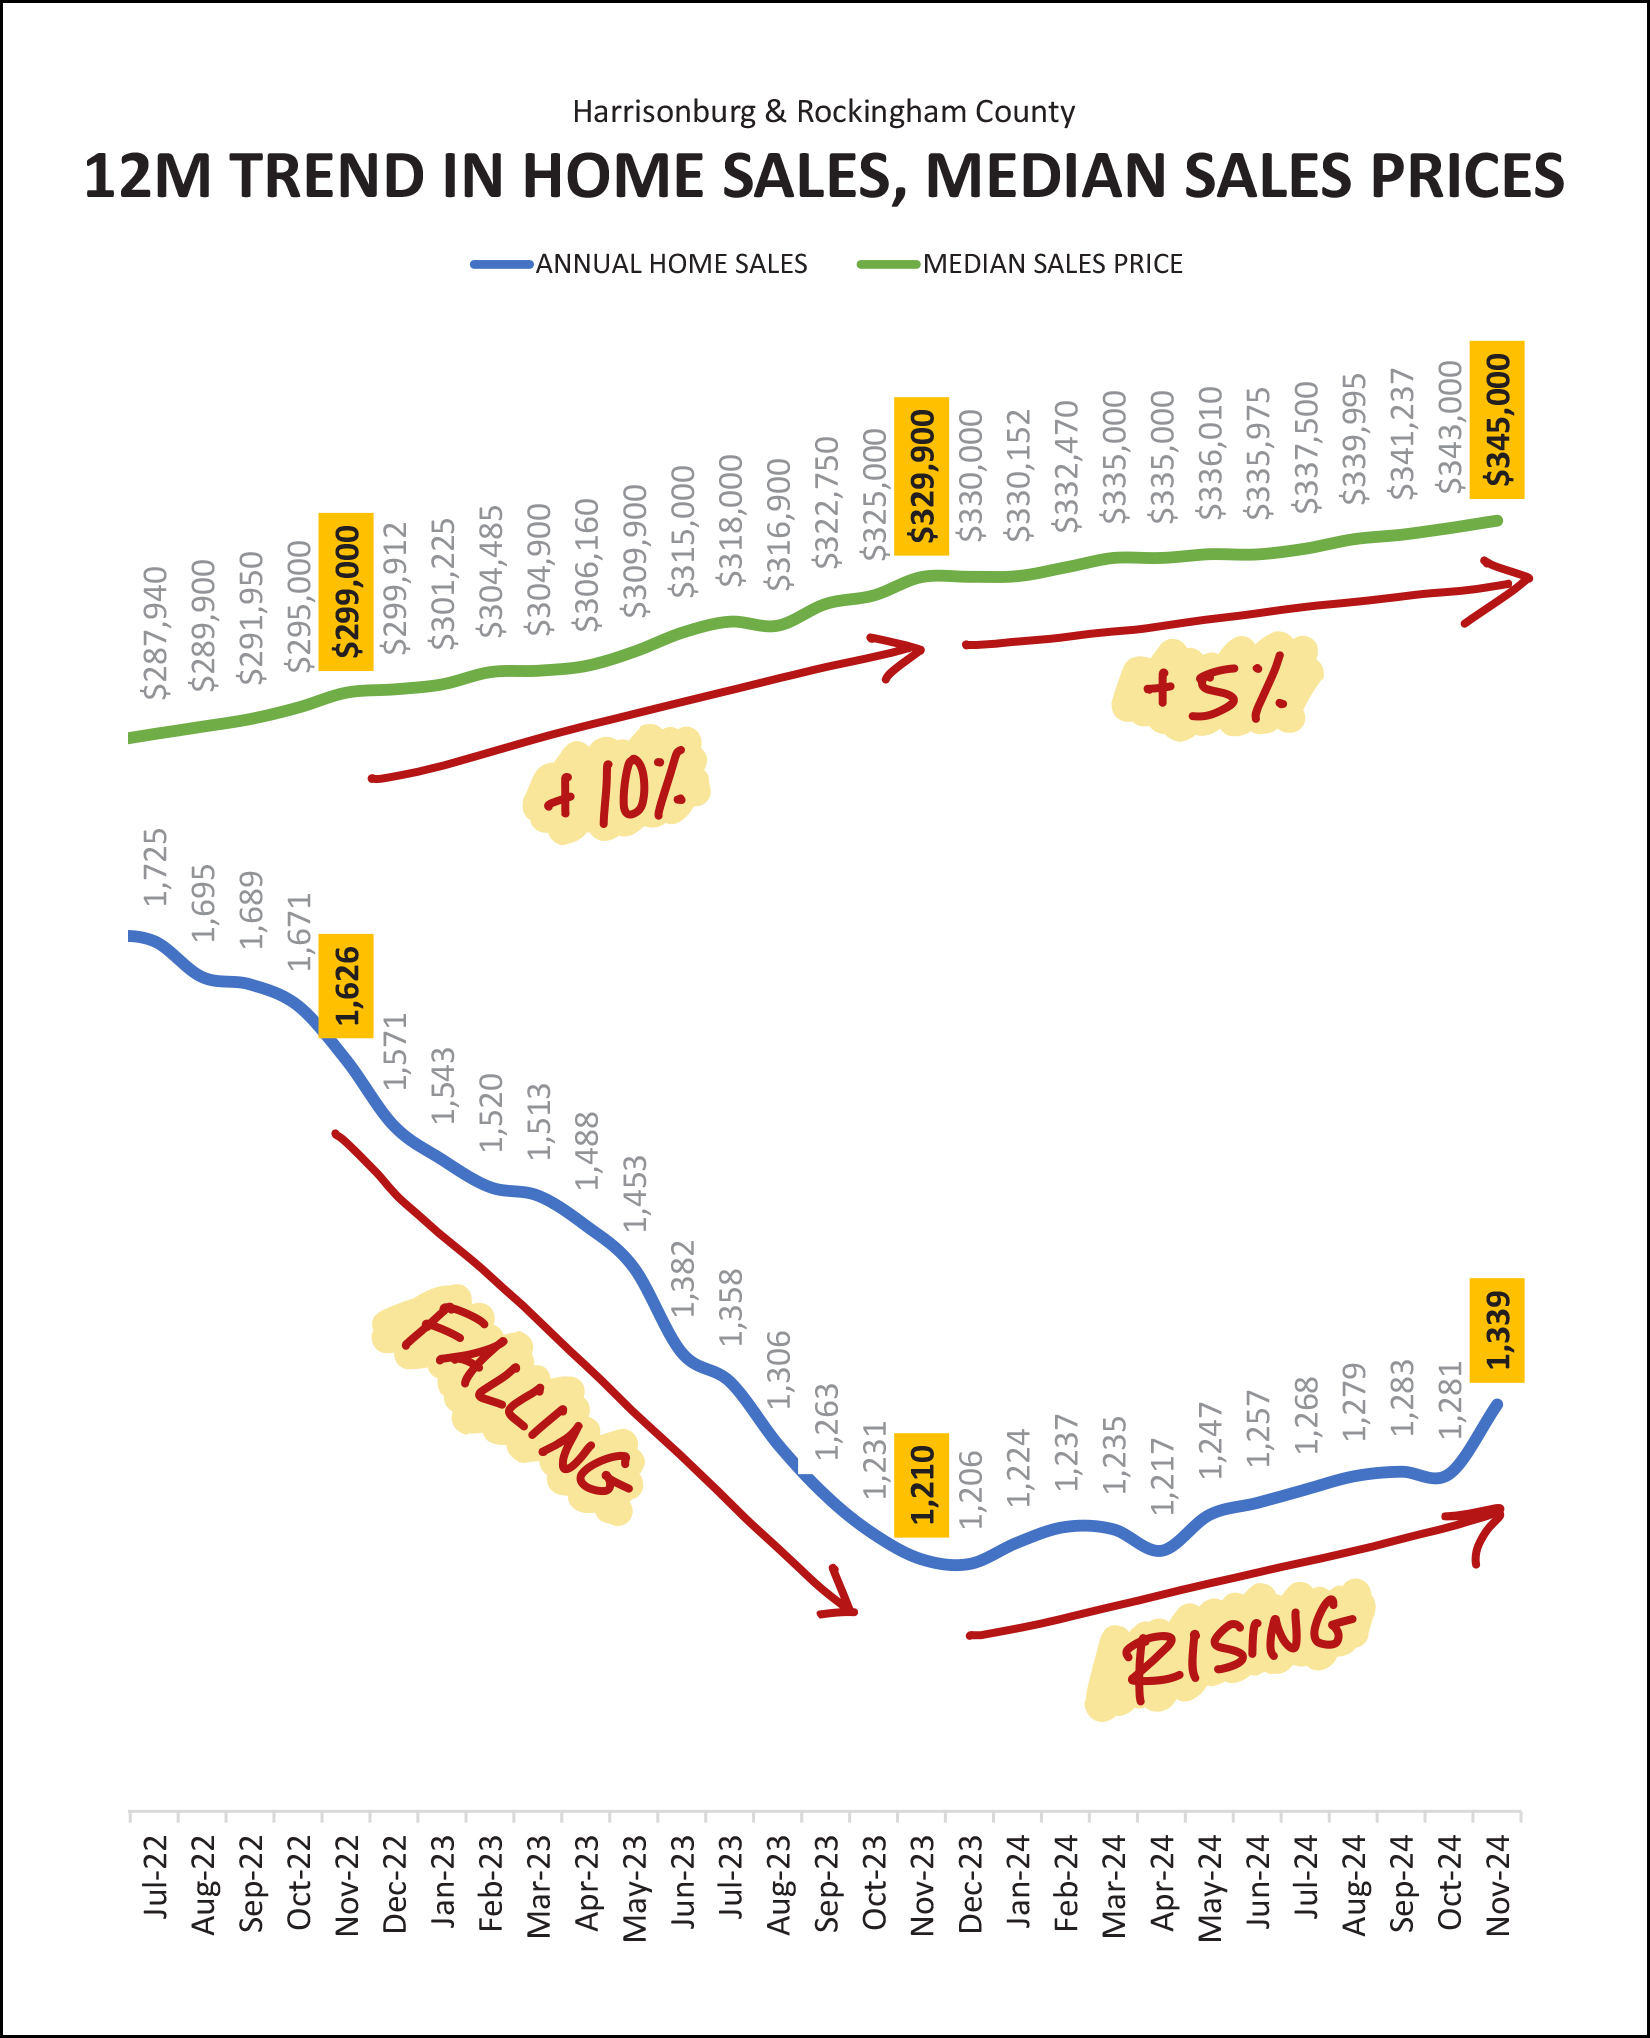 After multiple years of 10% annual increases in the median sales price (only one year of that type of increase is pictured above) we are now seeing a more modest 5% increase in the median sales price over the past year in Harrisonburg and Rockingham County. I think this is more likely to be what we see moving forward as well -- a 5% (ish) increase in prices over the course of a year. Meanwhile, the number of homes selling has certainly rebounded over the past year... bottoming out around 1,206 annual home sales a year ago, and now back up to 1,339 annual home sales. How does the current number of home sales compare to some past years, particularly pre-Covid? Let's take a look... 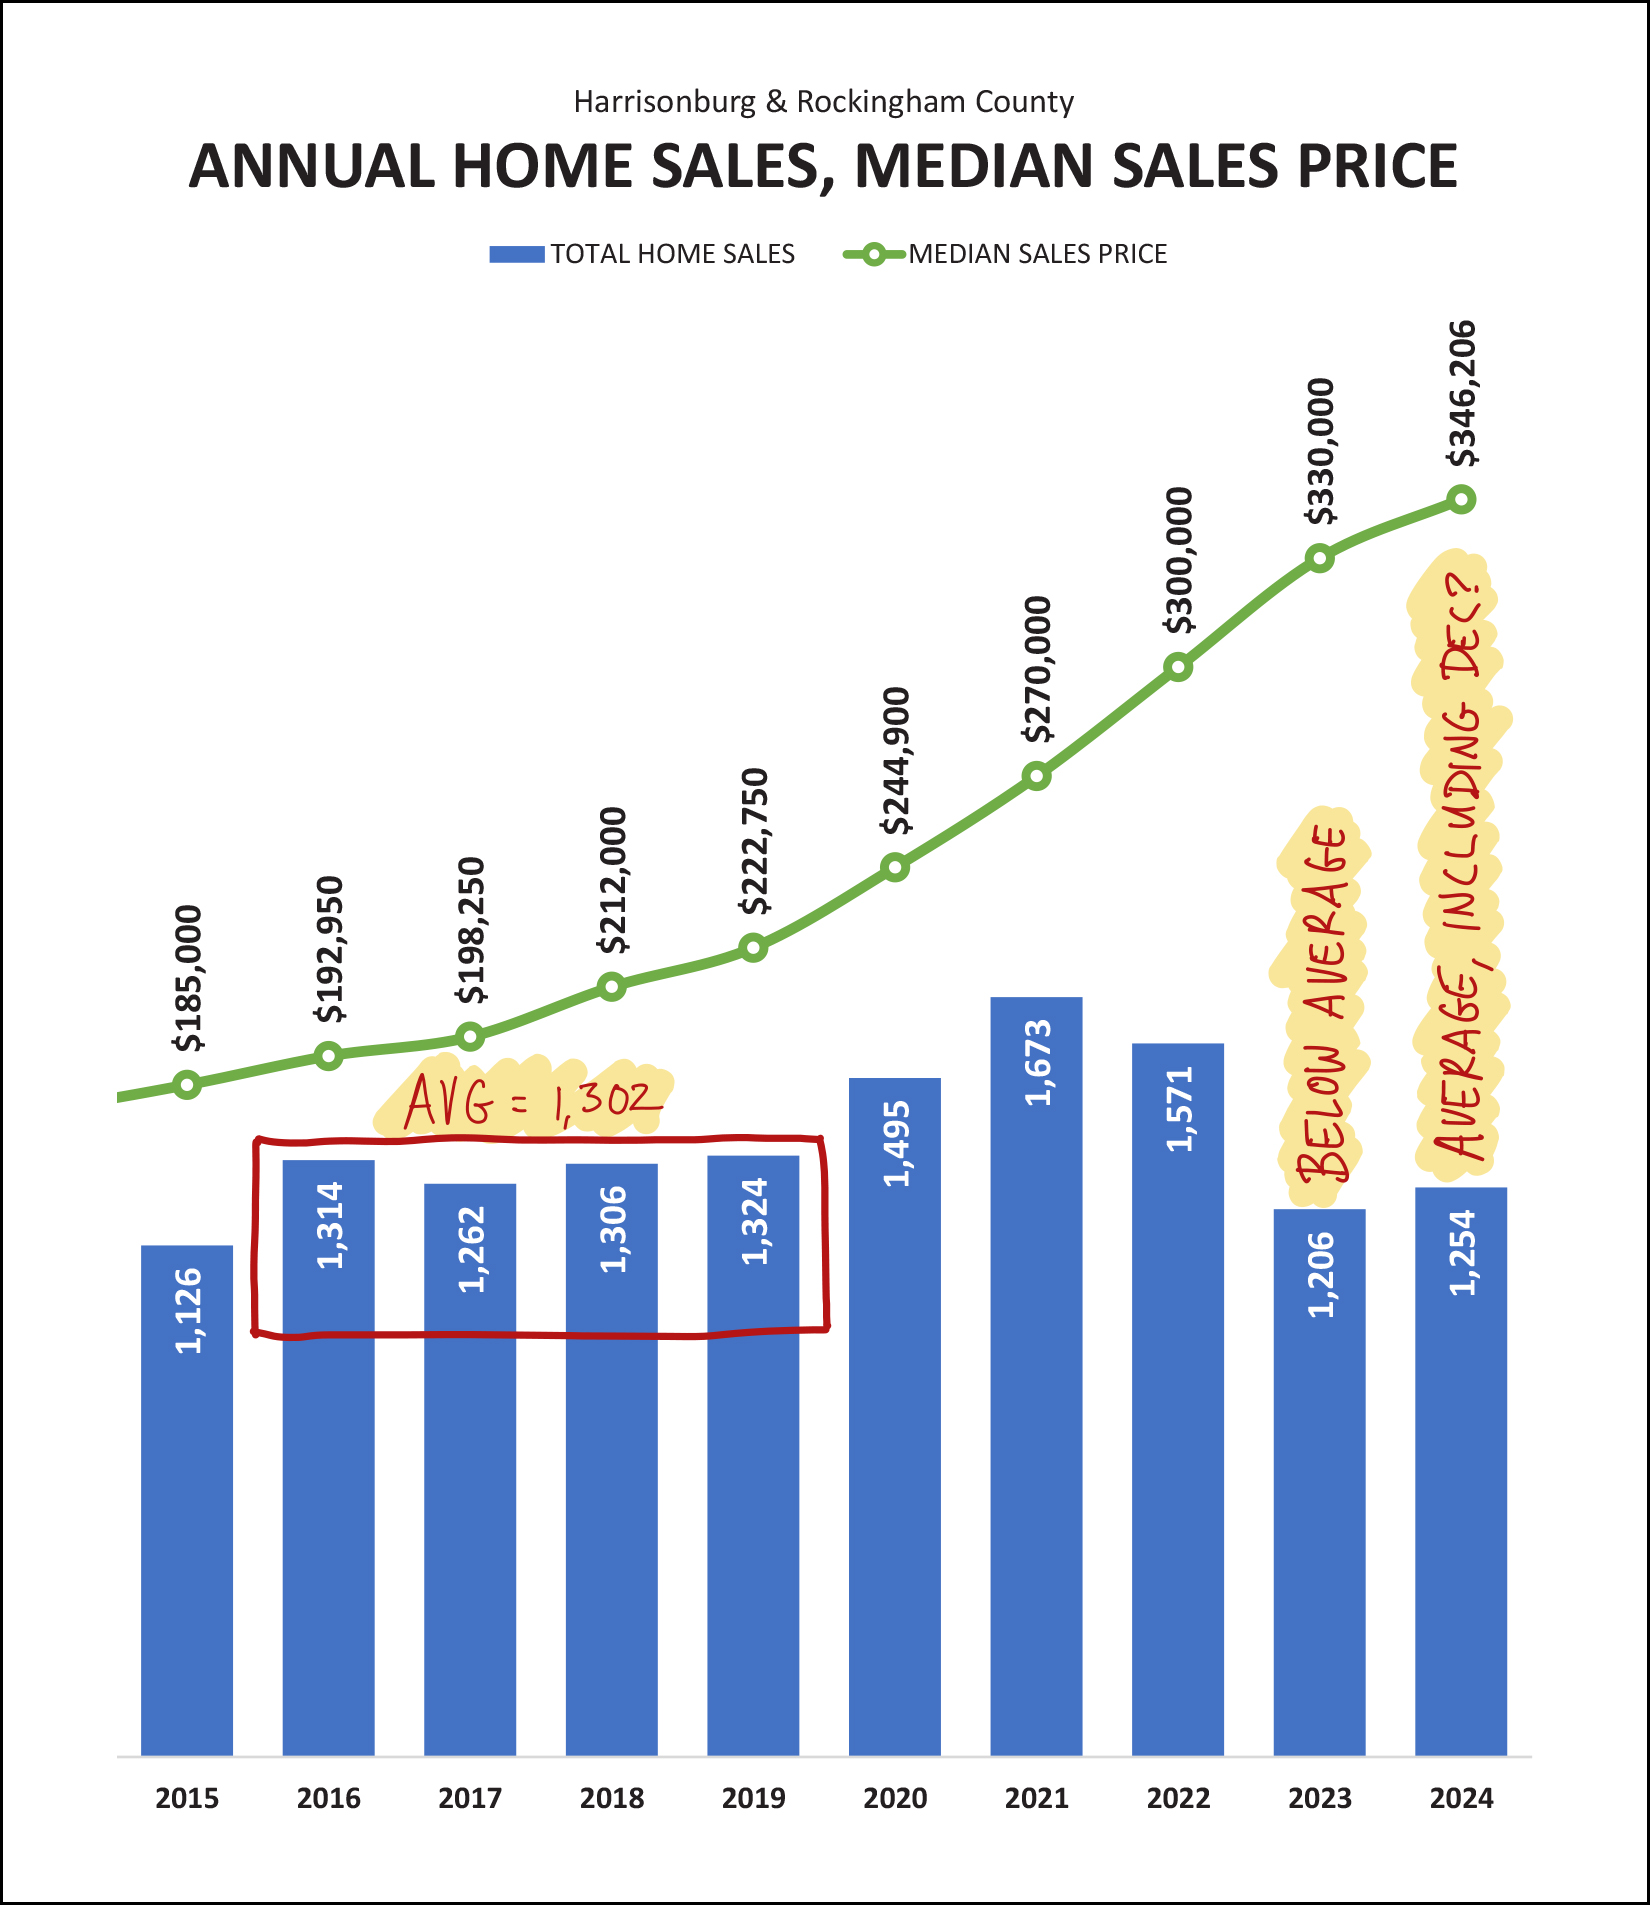 Looking back to the pre-Covid days (2016-2019) we were seeing an average of about 1,300 home sales per year in Harrisonburg and Rockingham County. Then, Covid. During the pandemic and it's aftermath, which included super (super) low mortgage interest rates -- we saw the annual pace of home sales quickly climb above 1,400 then 1,500 then 1,600 to then crest at 1,673 in 2021. But then, as mortgage interest rates rose (and home prices rose) the number of home sales fell rather quickly - back down to 1,206 in 2023. This year, however, with 1,254 home sales in the first 11 months, it seems likely we will get back to that 1,300-ish level by December 31. So, maybe we are now back to the 1,300 home sales a year range, after having been quite far above it, and then a good bit below it. Stay tuned in 2025 to see how this plays out. Now, about that contract activity... 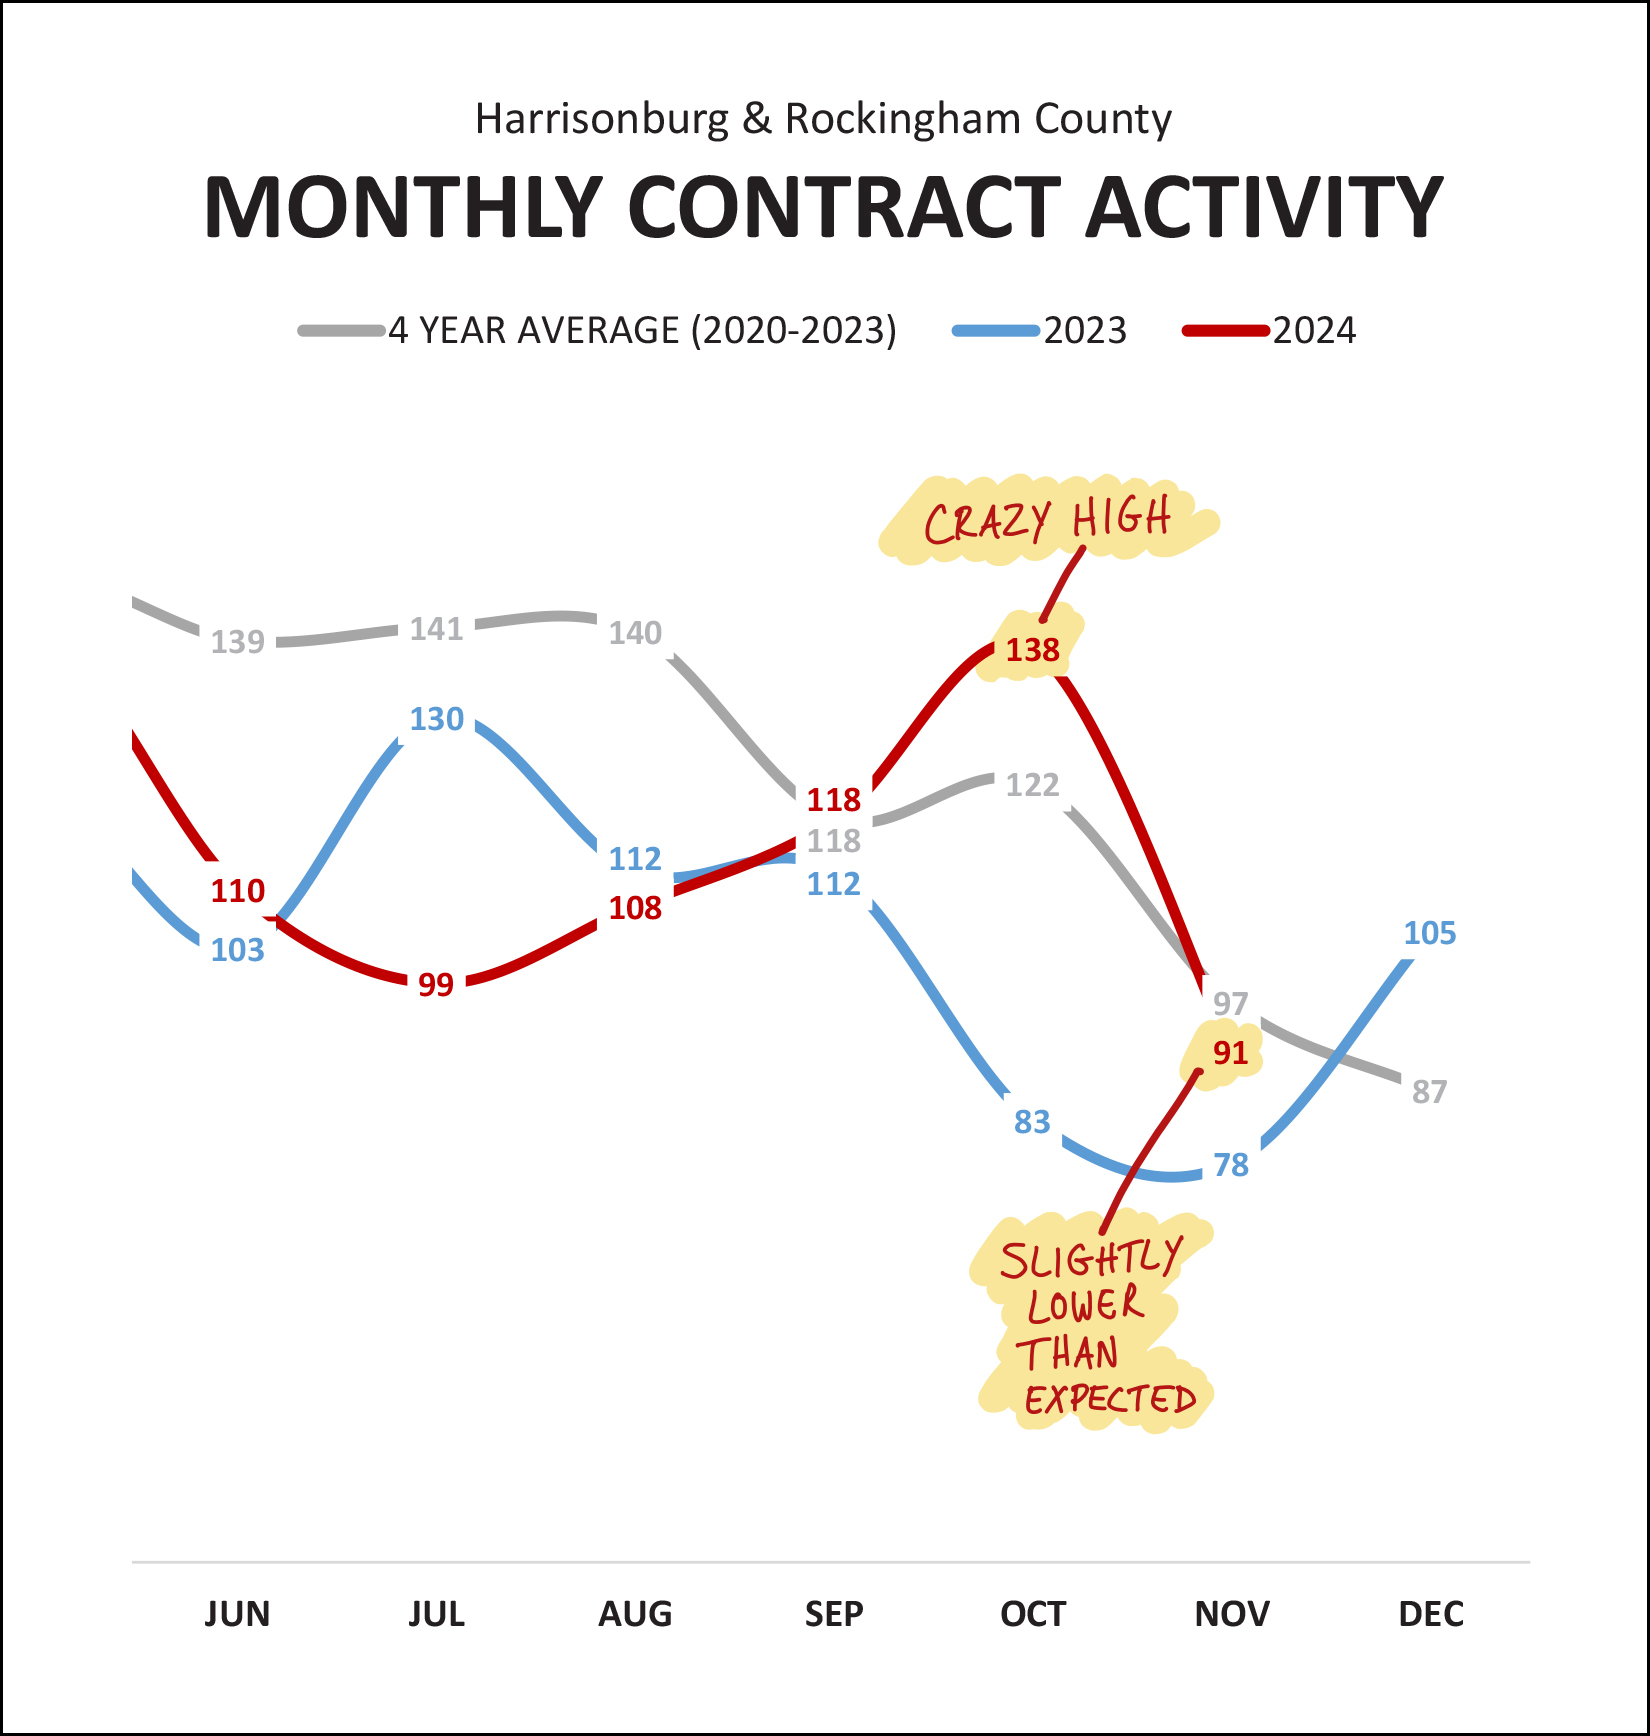 You can see it clearly here (above) that a crazy high number of contracts in October 2024 was what lead to the crazy high number of closed home sales in November 2024. So what shall we expect over the next few months? The 91 contracts signed in November 2024 was a normal-ish number of contracts for a November -- it was higher than the 78 we saw last year, but slightly lower than the 2020-2023 average of 97 contracts. Thus, we should likely see around 80 - 95 home sales close in December 2024. With all of those closings in November, are there still quite a few homes under contract right now? Sort of, kind of... 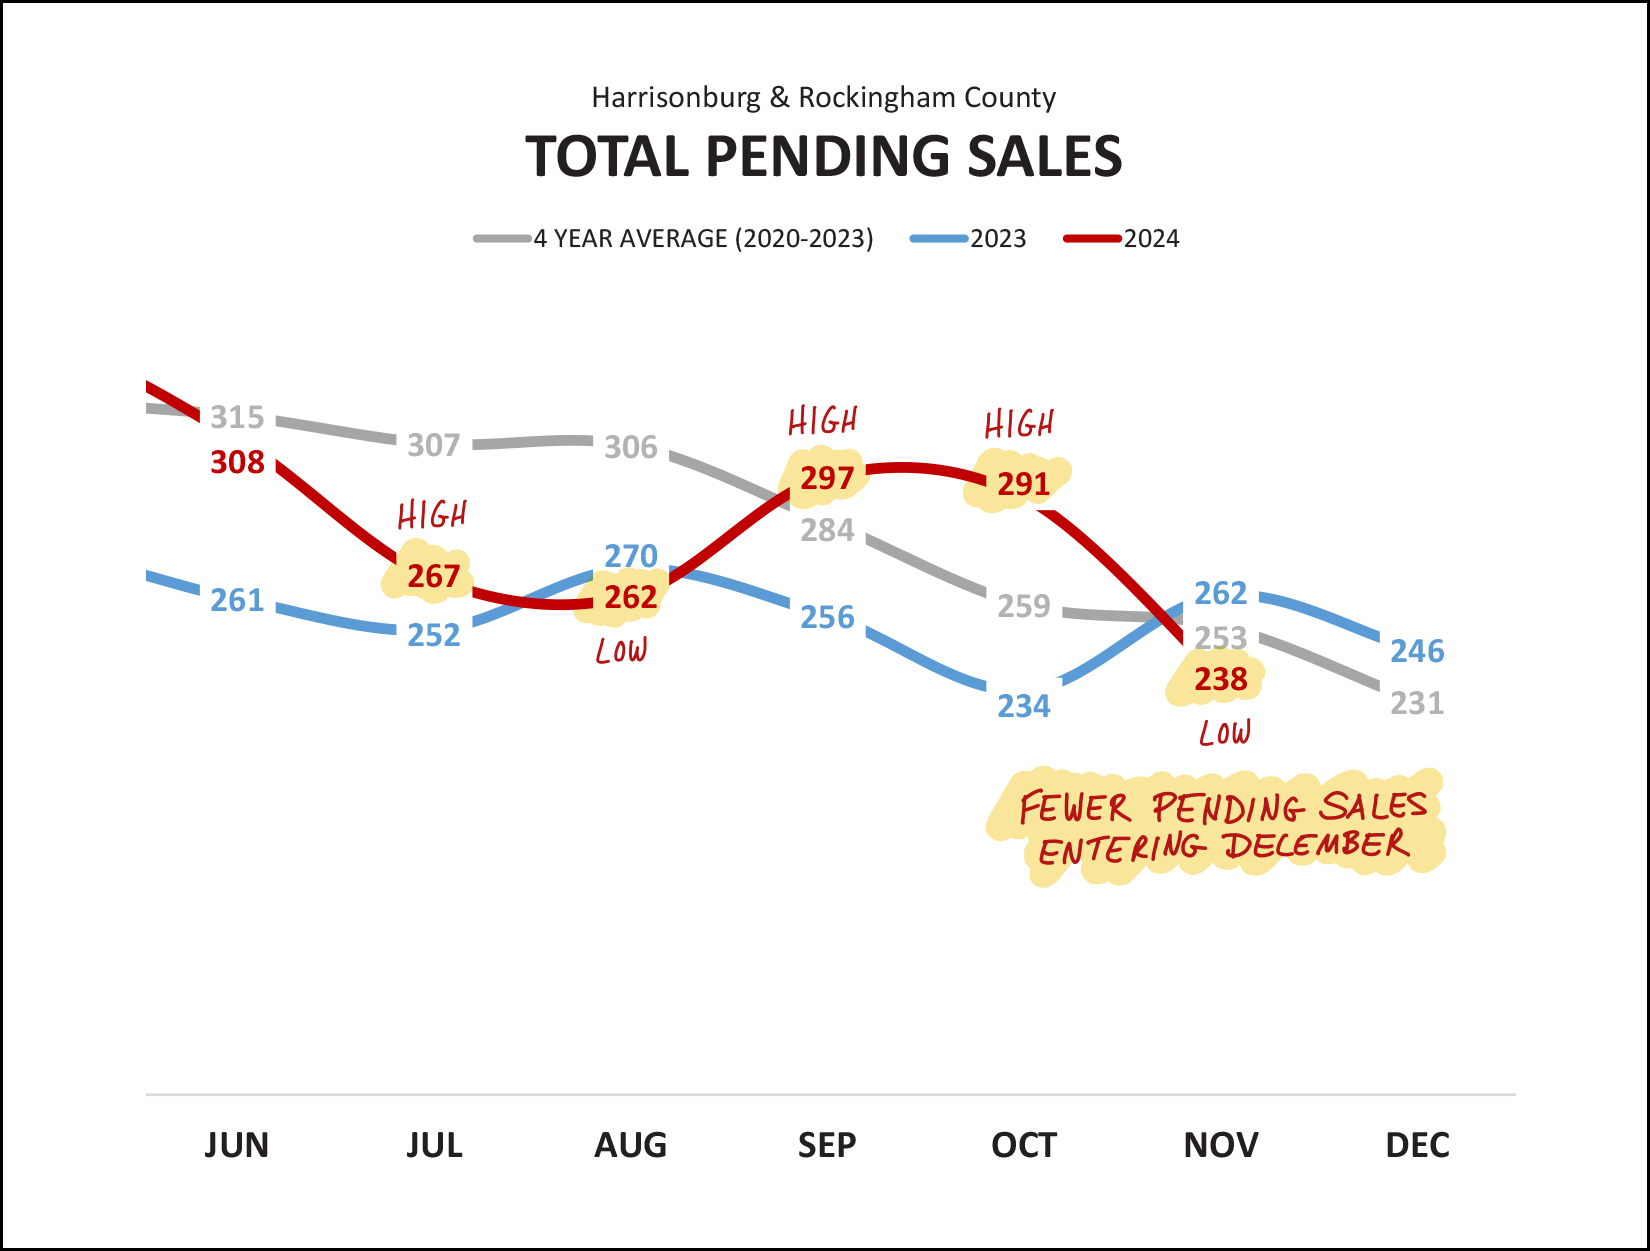 Pending sales were higher than expected at the end of September and end of October... but perhaps unsurprisingly because of all of the closed sales in November... the pending sales count is lower at the end of November than we might have otherwise expected. This is also an indicator that we'll see a bit of a slower month of closed sales in December and likely in January -- though this is somewhat to be expected in these winter months. And inventory levels -- how do they compare to last year? 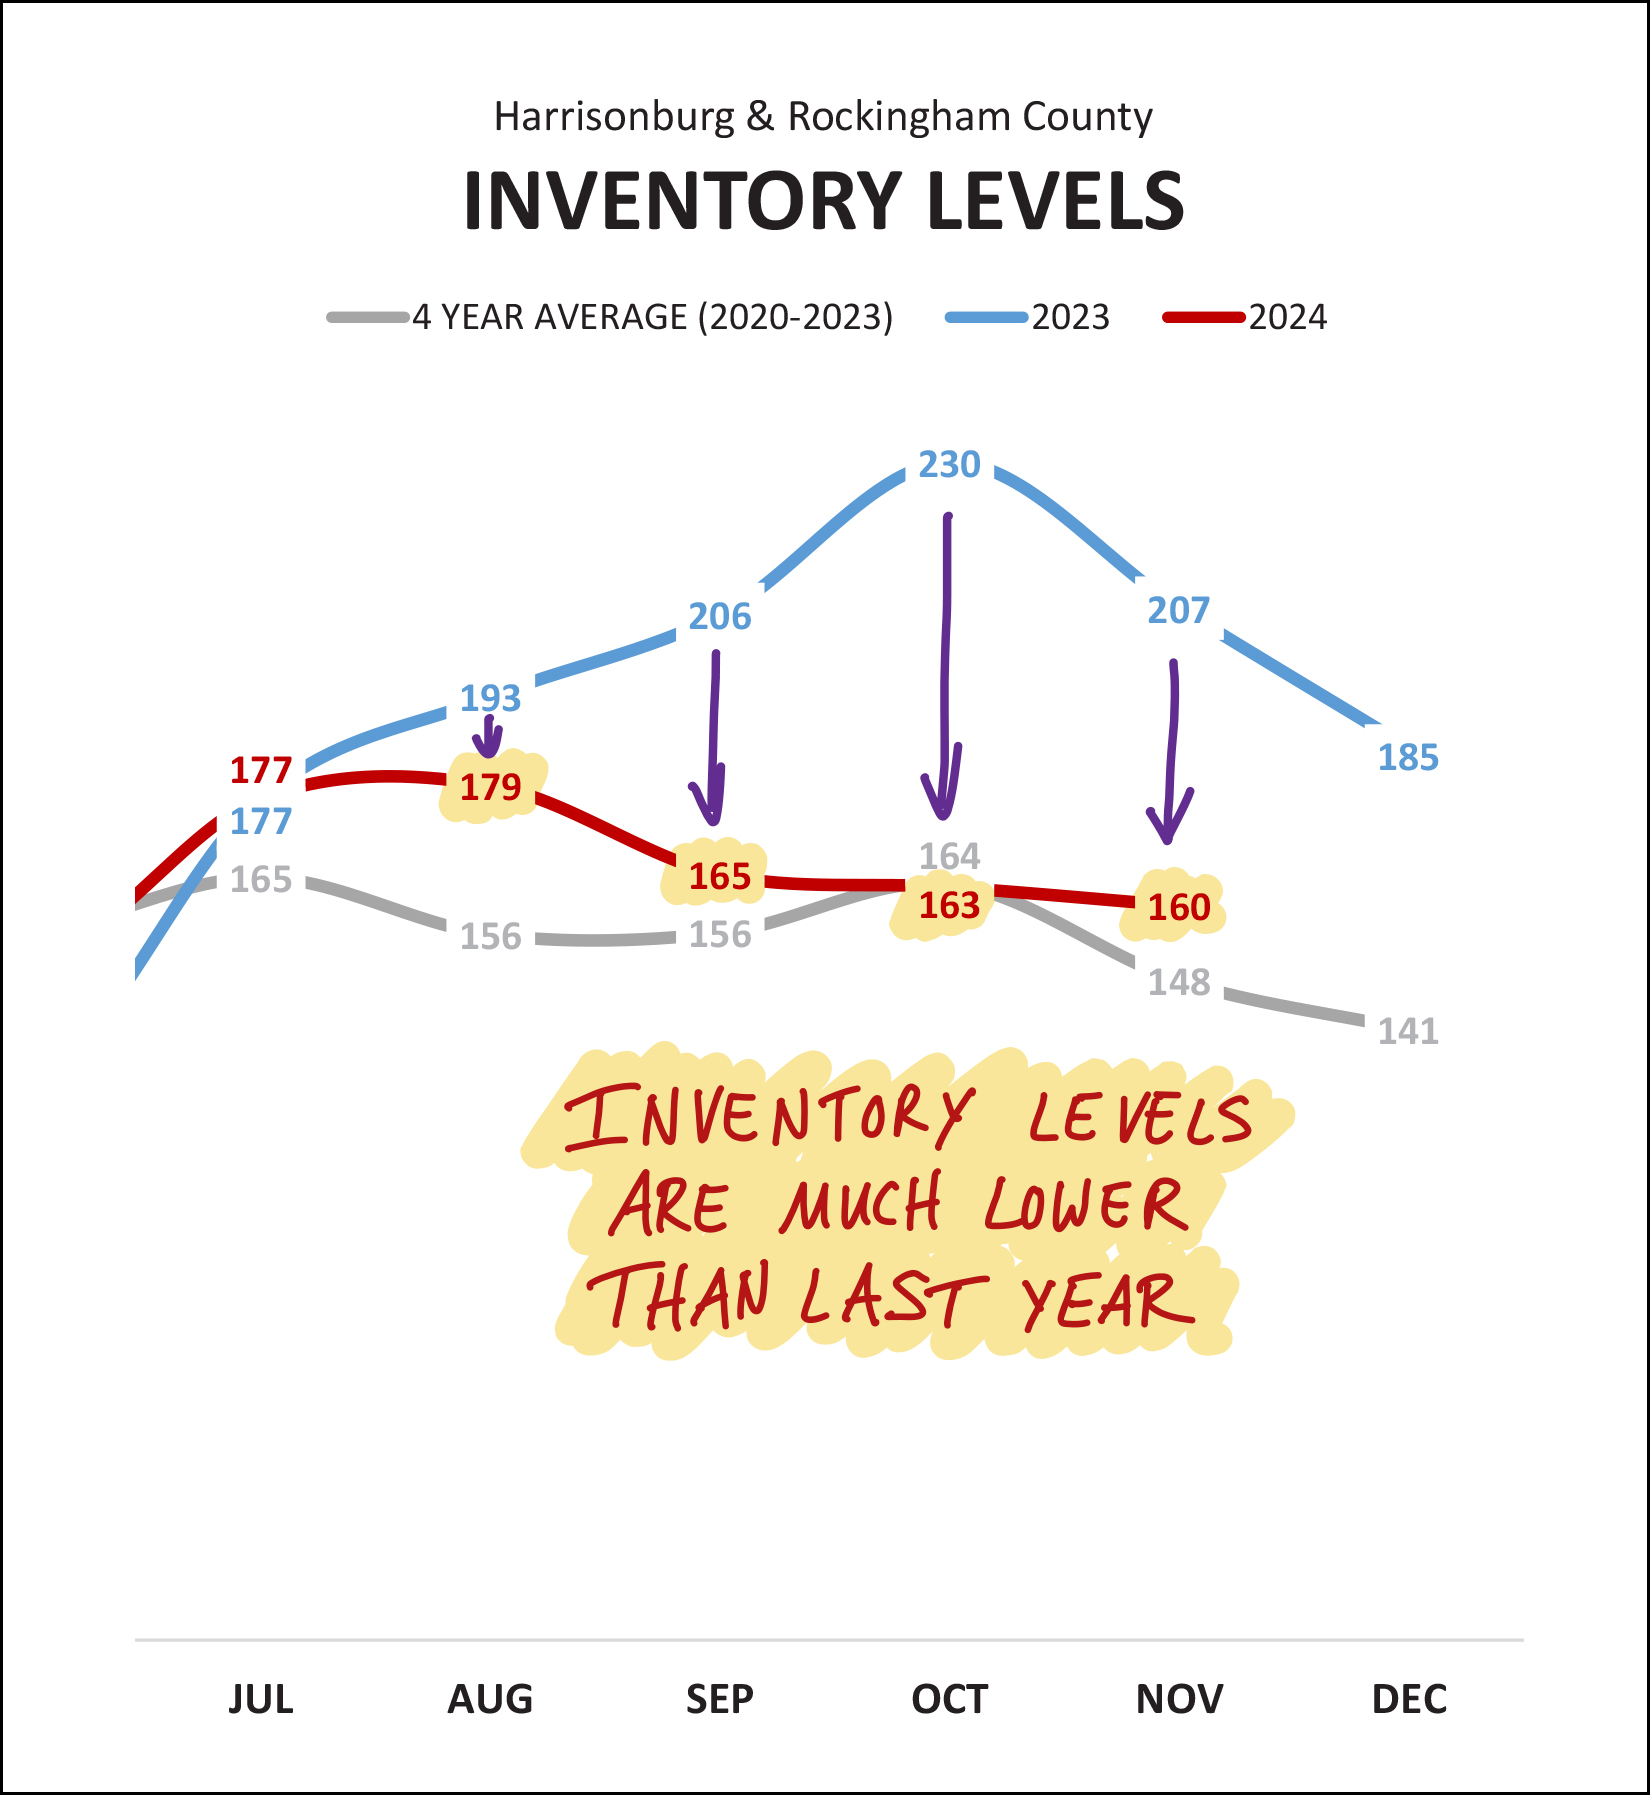 There are significantly fewer homes on the market now as compared to a year ago. Last September through November we saw inventory levels of 206 to 230 homes for sale -- while we are seeing a more consistent 160 to 165 homes for sale during the same timeframe this year. Last year's higher inventory levels were mostly a result of rapidly increasing mortgage interest rates that slowed the market, causing inventory to start building. About those mortgage interest rates... 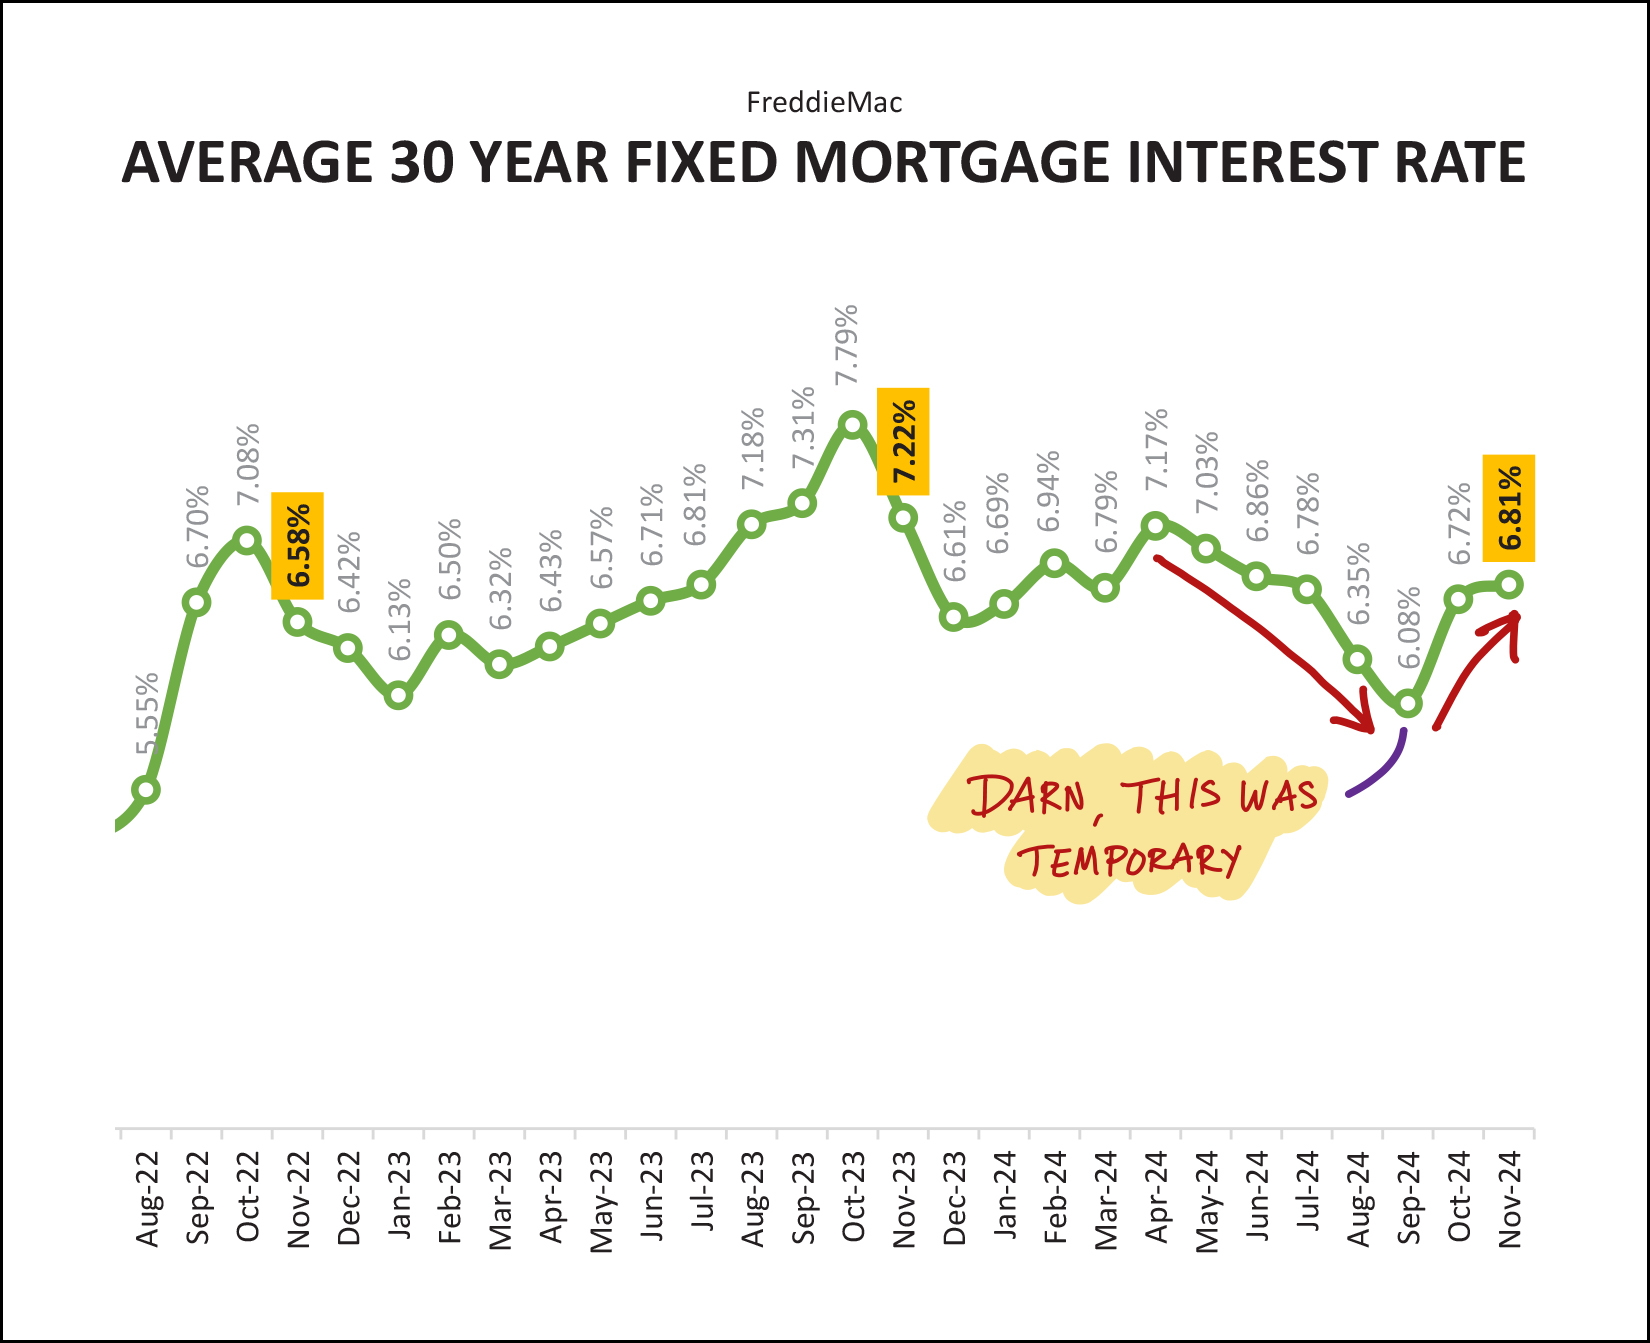 They've been up, they've been down, they've been all around!?! Mortgage interest rates were steadily declining for quite a few months in the middle of 2024 (May - Aug) but they have now increased again, getting closer to 7%. I think we will likely see mortgage interest rates continue to fluctuate between 6% and 7% over the course of the next year. If you're waiting to buy until rates get below 6%, it might be a long wait. Now, for a brief summary of the big picture and the latest trends in the Harrisonburg and Rockingham County real estate market... [1] We are seeing 12% more home sales this year than last. [2] The median sales price has increased by 5% over the past year. [3] Detached homes are increasing in value faster than attached homes. [4] We are seeing a decrease in City home sales and an increase in County home sales. [5] We are seeing a much larger year over year increase in new home sales than existing home sales. [6] Inventory levels remain relatively low. [7] Mortgage interest rates continue to stick between 6% and 7%. So, as we prepare for 2025... Home Buyers should connect with a great lender, get a preapproval letter in hand, and go see houses within the first few days that the hit the market. Home Sellers should be realistic in the pricing of their homes given that prices are not increasing as quickly and mortgage interest rates are remaining quite high. Homeowners who do not plan to sell should enjoy their home, their likely low mortgage interest rate, and enjoy not having to engage in what can be a hectic and/or stressful process of selling and buying a home. As you think about YOUR year ahead, if it might include a housing transition (buying, selling, both) feel free to reach out so that we can chat about the market, the process, your hopes and dreams and so that I can know how to best support you in that potential move. You can contact me most easily by phone/text at 540-578-0102 or by email here. Until next year (!) have a wonderful remainder of 2024 - and I hope that you have the opportunity to spend some quality time over the next few weeks hanging out with, laughing with, having fun with, the people in your life who bring you joy! | |
Low Housing Inventory Levels Did Not Sneak Up On Us Overnight |
|
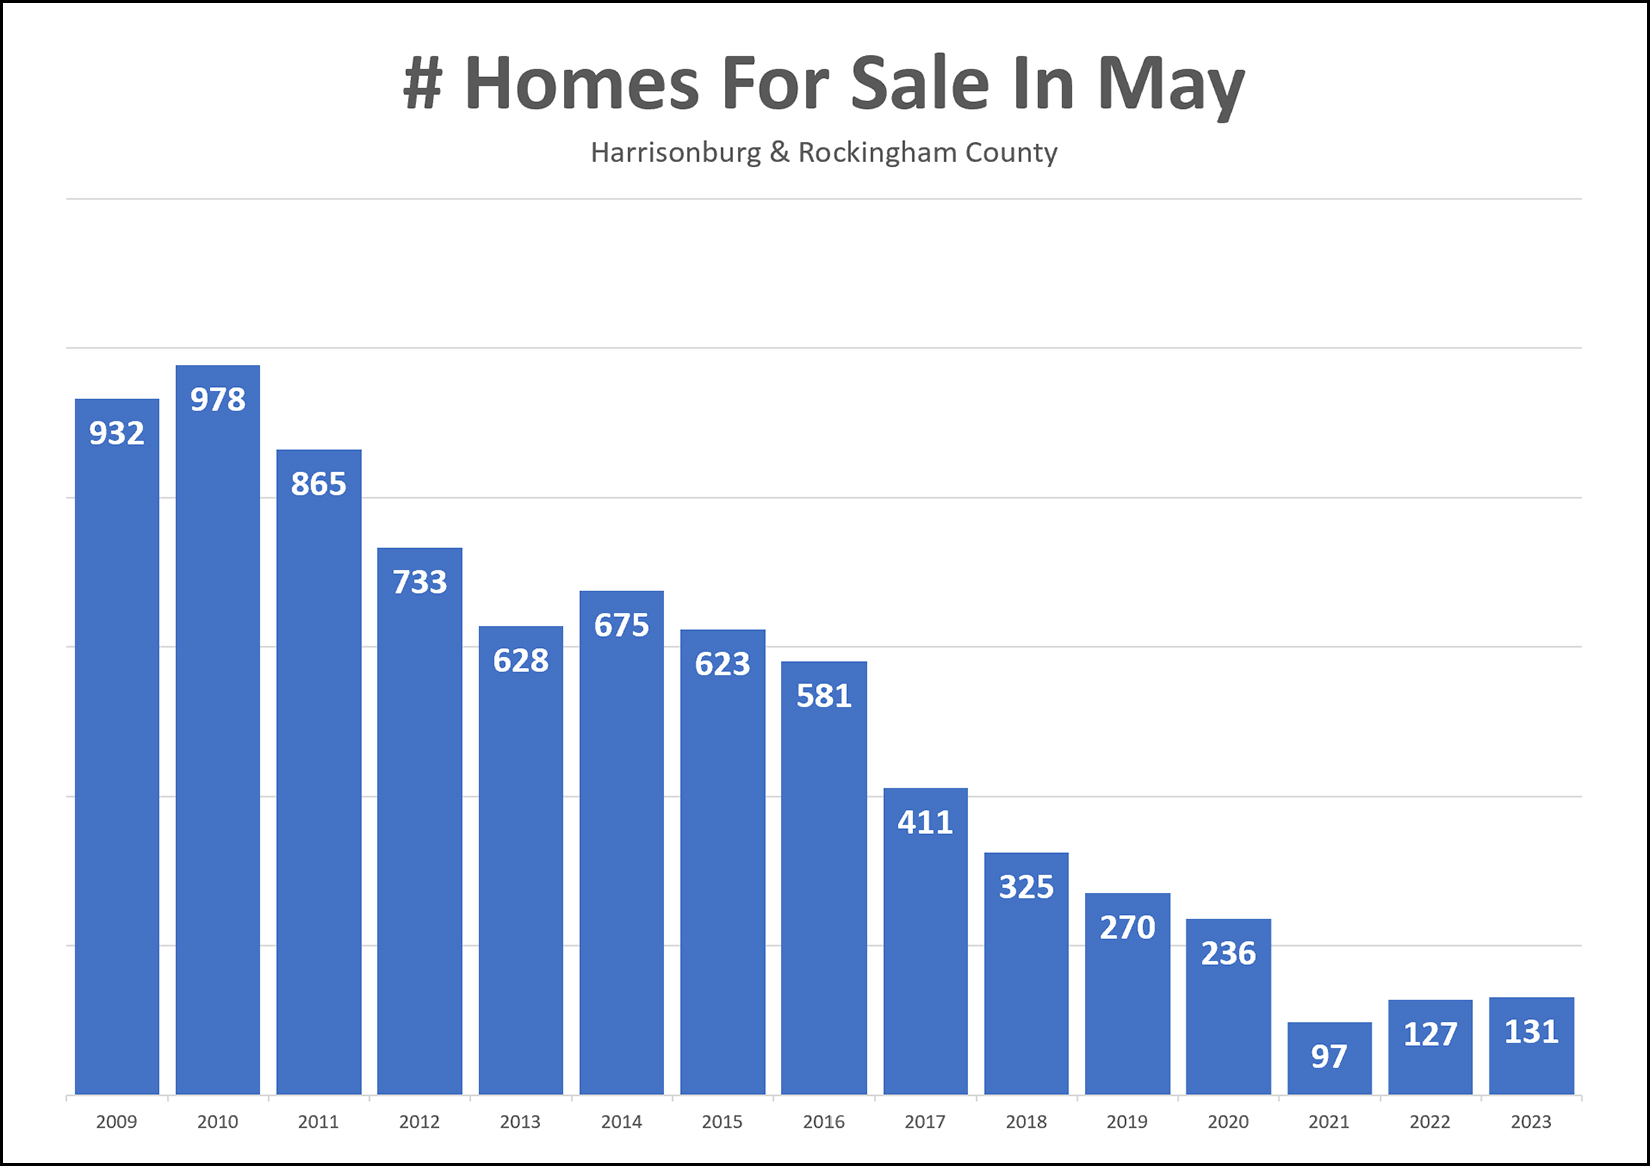 Low housing inventory levels did not sneak up on us overnight -- nor are they a new phenomenon that just came to be during Covid. As show above, we have seen a general decline in housing inventory levels for more than a decade now. This graph shows how many homes are actively for sale at this time (early May) each year, starting in 2009. Why have inventory levels declined so much over the past decade plus? Basically, the number of buyers who want to buy in this area has been larger than the number of sellers who want to sell combined with the number of new homes being built. If, for example, every year for the past 14 years...
...then we would see a 100 home decline in inventory levels each year. New Inventory = Existing Inventory + 700 New Listings + 100 New Homes - 900 Buyers Buying ...would mean that... New Inventory = Existing Inventory - 100 Moving forward, assuming the Harrisonburg area continues to be just as popular as it has been over the past decade and a half... and assuming there isn't a mass exodus of homeowners (creating inventory by selling but not buying) then the only way we'll get out of this low inventory situation is by building more new homes. | |
Inventory Levels Have Been Dropping For Almost An Entire Decade |
|
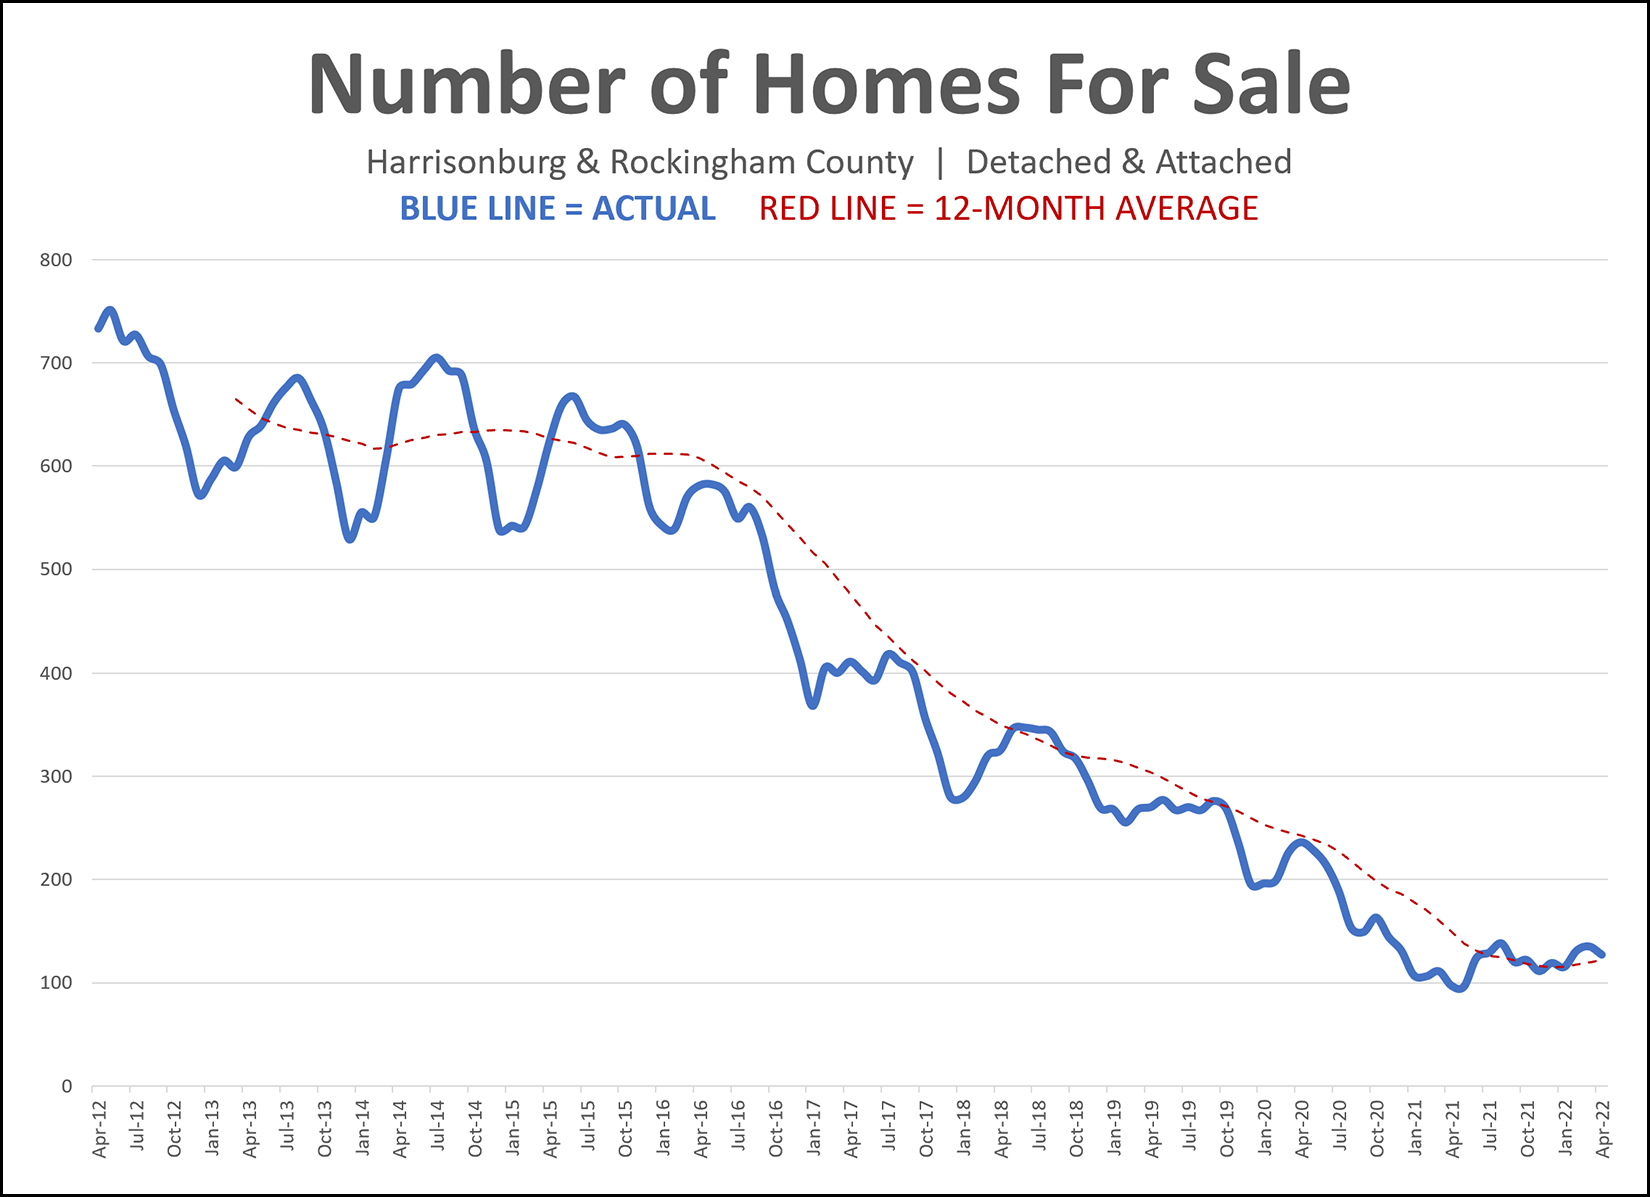 At the end of last month there were only 127 homes for sale in Harrisonburg and Rockingham County. Five years ago, at the end of April 2017, there were 411 homes for sale. Five years before that, at the end of April 2012, there were 733 homes for sale. Home buyers over the past year have had fewer options of what to buy at any given point in time than ever before in the past decade, and possibly ever before, ever. The low inventory levels don't mean fewer buyers are buying -- in fact, more buyers are buying on an annual basis than ever before. The low inventory levels are an indication that there is much more buyer demand than seller supply, so new listings get scooped up (go under contract) within a matter of days -- thus, not contributing to the inventory levels at the end of the month. | |
Home Price GROWTH Seems Likely To Decline In 2022 |
|
 It seems likely that we will see a decline in home price GROWTH in 2022. Here are the changes in the median sales price over the past five years... 2017 = +3% 2018 = +7% 2019 = +5% 2020 = +10% 2021 = +10% While I don't think we will see the median home PRICE decline in 2022... ...I do think we will see the GROWTH in the median home price decline. Given quickly rising mortgage interest rates, it seems more likely than not that we will NOT see another 10% increase in the median sales price of homes in Harrisonburg and Rockingham County this year. I think we are likely to still see the median sales price increase, but perhaps not as quickly as it has over the past two years. | |
Homeowners In Harrisonburg, Rockingham County, Likely Improved Their Net Worth By Approximately $25,000 Over The Past Year |
|
 This fits into the category of...
The median value of a home sold in Harrisonburg and Rockingham County was $244,900 in 2020. One year later, in 2021, it was $270,000. This marks a $25,000 increase in the value of a median priced home over the course of a single year. So, if you have owned a home in Harrisonburg or Rockingham County over the past year you have likely seen a $25,000 increase in your net worth... or more if you own a home valued above the median sales price... or less if you own a home valued lower than the median sales price. So... Homeowners: Be thankful for the value of your home increasing so heartily over the past year. Would Be Home Buyers: Keep trying. It's a competitive market, but it is worth continuing to try to buy a home. Everybody Else: Some people may not be in a position to buy a home because of their job or income situation, because they are working to pay off debt, because they might need to move within the next few years, or for any number of other reasons. That's OK. But if you haven't bought a home and aren't planning to... but you could afford to do so, and you plan to live here for awhile... maybe we should chat. | |
Is The Local Housing Market Starting To Cool Off? |
|
 Several local agents have recently said, conversationally, that they think the local housing market is starting to cool off. Is it? Maybe yes and no, depending on what you mean, and how you measure it? ;-) No - After only seeing 148 home sales in September 2021, there were even more (158) in October 2021! No - After seeing only 125 contracts signed in September 2021, there were 156 contracts signed in October 2021! Yes - It took a median of five days for homes to go under contract in September 2021 and a median of six days in October 2021. Slower. Much slower. By a day. Gasp! Maybe - Six to twelve months ago it was not uncommon to have 2, 5 or 10 offers on a house within 48 hours of the property hitting the market. Now, I'm often, but not always, seeing fewer offers within the first few days. This is definitely anecdotal, not based on data. So, is the market cooling?
| |
Are Increasing Home Prices In 2021 A Sign Of A Housing Bubble? |
|
 There's a great article over at NPR / Planet Money related to whether current high home prices are an indication of a housing bubble. Thanks, Andy, for sending me this article! Home Prices Are Now Higher Than The Peak Of The 2000s Housing Bubble. What Gives? You should read it. All of it. It addresses...
Read the whole article here... Do you think we are in a bubble? Translated: Do you think home prices will decline sometime in the next 1 to 5 years? Email me and let me know what you think. | |
Why Did So Many Homes Sell In Our Area In 2020? |
|
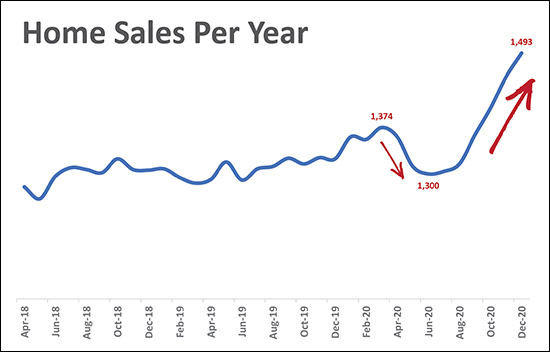 As shown above, the annual pace of home sales took a nose dive in April 2020 related to COVID, but has taken off since August 2020 and quickly accelerated the market to a pace of almost 1,500 home sales per year. Why is this happening? Here are some of my best guesses... Pre-COVID, most of us likely spent the minority of our waking hours in our homes. We would be at work much of the time. During COVID, many folks find themselves spending 90% or more of their waking hours in their homes. For many people, this made them quickly realize that their home was no longer working for their needs or those of their family. If you're working from home and your kids are learning from home, you suddenly have higher expectations for the space and spaces that your home offers. I suspect this "being at home much more than normal" dynamic caused more people to decide to sell their home and buy a new home during 2020. Mortgage interest rates have been dropping throughout most of 2020, making it an excellent time to buy a home from a monthly mortgage payment perspective. These lower rates likely made it pretty easy for the "my home doesn't work during COVID" buyers to consider upgrading to a new home. There is an extraordinary amount of pent up buyer demand in our area. Perhaps more sellers than usual listed their homes in the second half of the year, most of which were scarfed right up by eager buyers, thus leading to higher than normal home sales. This also seems to have lead to higher sales prices! What do they say? The whole is greater than the sum of its parts? It seems that... more buyers wanting to upgrade to a new home + super low interest rates + pent up buyer demand + quickly rising home prices = a red hot real estate market in 2020! As one other aside, it is also possible that we may have seen more second home purchases in 2020 than in other comparable years. More and more people found they could work from home, or from out of town, and this likely drove at least some number of new buyers of second homes into our market. | |
Spring and Summer Looked A Bit Different This Year In Our Local Housing Market |
|
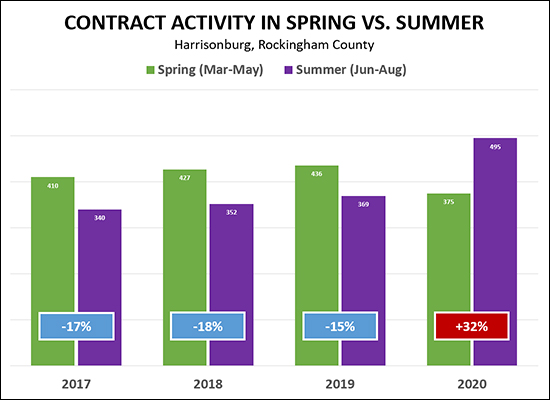 We always (I mean, always!) see more contract activity in the spring than the summer. More buyers contract to buy homes between March and May than between June and August. Always. For sure. Definitely. But not in 2020. Over the past three years we have seen a 15% - 18% decline in contract activity when comparing summer to spring - but this year contract activity INCREASED 32% when comparing summer to spring! This certainly had a lot to do with COVID-19. Plenty of buyers and sellers were feeling a bit uncertain this spring, which slowed down the pace of sales in our real estate market. But -- everything came roaring back this summer! Who knows what fall will look like this year in our local real estate market, but summer was certainly unusual! Yes, and I suppose spring was as well. :-) | |
20 Year History of Harrisonburg Area Median Home Sales Price |
|
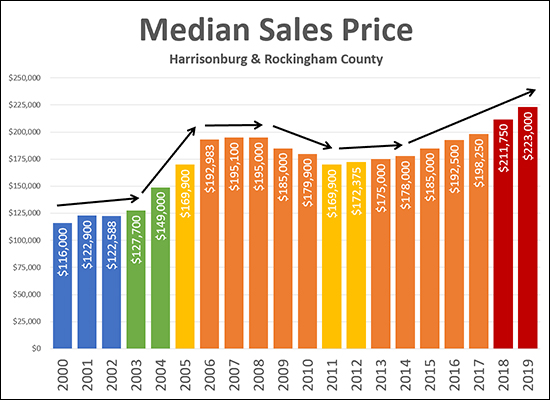 Here's a really long look back at the median sales in Harrisonburg and Rockingham County. There have been a variety of different stages in the market over the past twenty years...
Where do we go from here? I think we'll see another solid increase in the median sales price in 2020 and likely over the next few years. What do you think? Email me at scott@hhtdy.com. | |
My Predictions for the 2020 Real Estate Market |
|
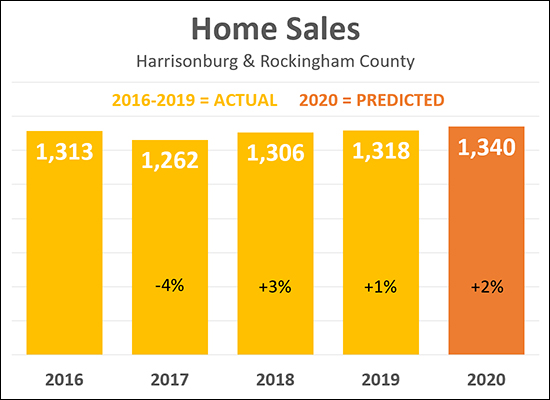 As is my annual tradition, I am making some predictions about what we'll see in the Harrisonburg and Rockingham County real estate market in 2020. Above, you'll note that there was only a 1% increase in home sales between 2018 and 2019 -- and I am predicting a 2% increase between 2019 and 2020. A few thoughts along those lines...
So -- I'm betting on another increase, albeit a small increase, in the number of home sales in Harrisonburg and Rockingham County in 2020. And how about those prices... 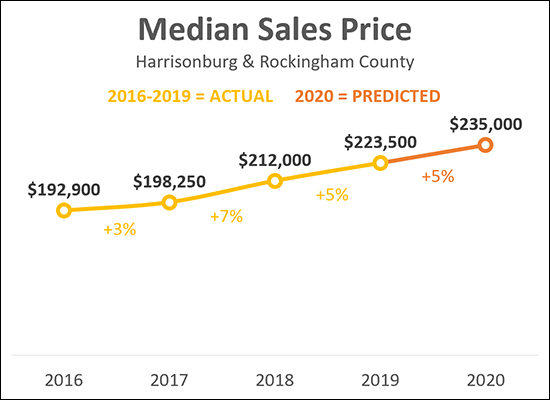 As shown above, we saw a 7% increase in the median sales price in 2018, followed by a 5% increase in 2019! I am -- perhaps too boldly (?) -- predicting we'll see another 5% increase in the median sales price this year. If I'm wrong on either prediction, perhaps it will be this one -- perhaps we'll start to see prices rising, but not quite as fast as they have over the past two years. The chances seem relatively low that we'd see an actual decline in the median sales price in 2020. OK - enough about my predictions --what about for you? Email me (scott@HarrisonburgHousingToday.com) and let me know where you think our local market will go in 2020. And keep up with all the market data between now and next January by signing up to receive my monthly housing market report by email if you are not already receiving it. | |
Inventory Levels Seem Unable To Drop Below 250 |
|
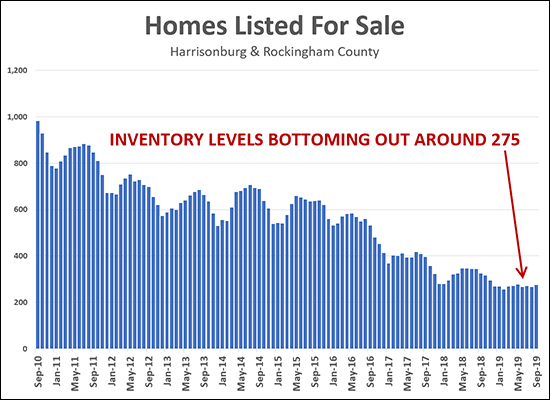 It's been the story for quite a few years now (at least 10 years, it seems) that inventory levels are dropping -- buyers have fewer and fewer homes from which to choose when they are looking to buy in Harrisonburg and Rockingham County. Here are how many homes have been on the market in October for the past 10 years...
So, it's certainly a more challenging time to be a buyer than anytime in the past 10 years -- but inventory levels seem to now be bottoming out around 275. Here's what the past six months have looked like...
So, over the next year, I wouldn't be surprised if we never dipped lower than 250 and we never rose above 300. Given these limited inventory levels, it is more important than ever that buyers in today's market are ready to be patient and then to ACT QUICKLY! :-) Buyers can make it a bit easier on themselves by knowing the market, knowing the process, knowing your buying power, and closely monitoring new listings! | |
Harrisonburg Area Home Sales Over $500K Small But Strong Segment of Local Market |
|
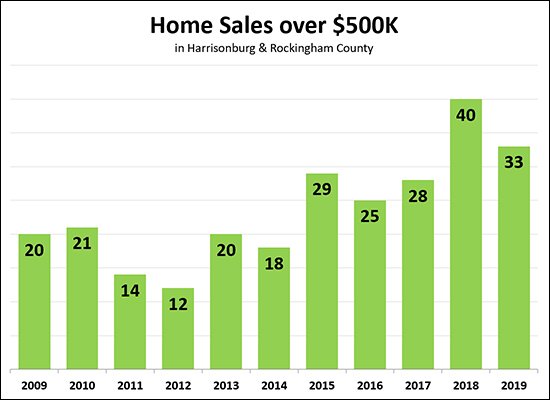 Only 3% of local home buyers spend $500K or more on their home purchase (per sales data over the past year) but this segment of the local housing market has been strong over the past few years. As shown above, there were 40 home sales over $500K last year - more than any time in the past decade. This year we seem to be on track to possibly match that, with 33 home sales over $500K in the first eight-ish months of the year. Reigning in our enthusiasm a bit, though, this is a relatively small number of buyers. If you are selling a home over $500K, you need to keep in mind that only about 40 buyers per year (just over 3 per month) spend that much money on a home in ALL of Harrisonburg and Rockingham County! Let's look a bit further into even smaller segments of the high end local market... 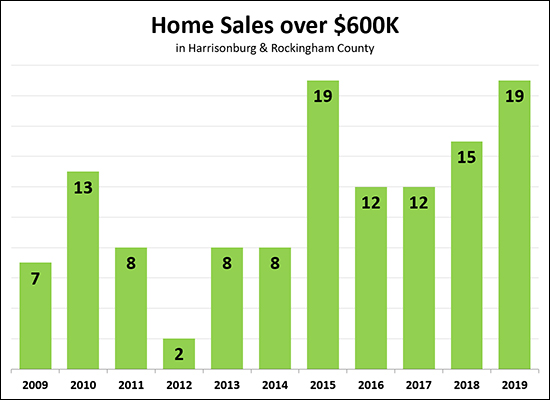 While last year (15 home sales) wasn't quite the strongest year for $600K+ home sales -- this year looks like it will be. We have already -- in eight months -- matched the highest number of $600K+ home sales seen in a year when looking back for 10 years. And one more look at an even higher price point... 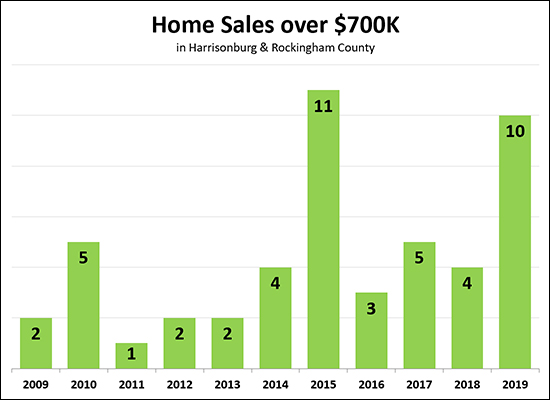 Above, you'll see that most years there are only 5 or fewer home sales over $700K. But back in 2015 there were 11 (which was more than double the norm) and this year there have already been 10 such home sales! So -- overall, the high end home sales market is doing well -- comparatively, but that is not to say that selling a home over $500K is an easy task - it's not. Home sellers over $500K are aiming for a tiny pool of potential buyers -- even if that pool of buyers might be slightly stronger this year than last. | |
Should You List Your Home in August or September or October? |
|
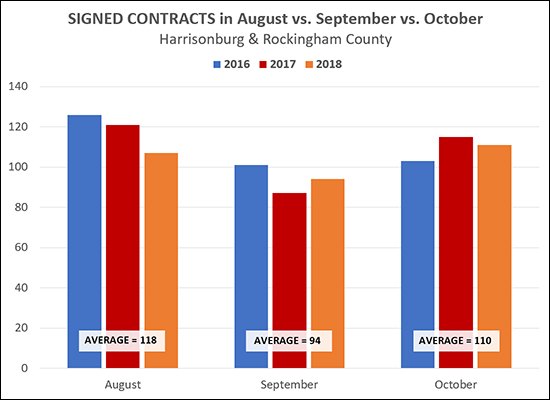 Generally speaking, you should list your home sooner rather than later. As shown above, we are likely to see a declining number of buyers signing contracts between August and September - though then a slight increase again in October. If you want to sell your home in the next few months, let's meet SOON (!!) to start discussing market value and any preparations you need to make in your home before putting it on the market. | |
I Know You Know This, But These are RECORD Low Inventory Levels |
|
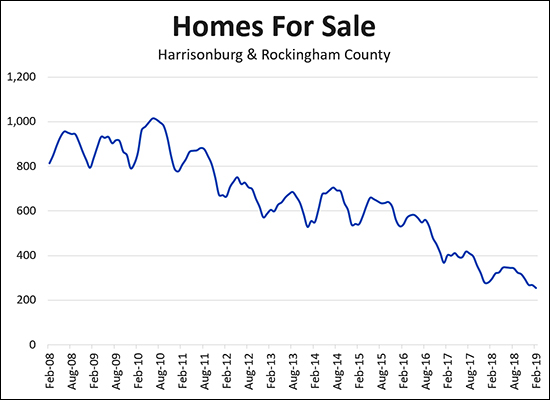 I looked back further, and further, and further, and could not find ANY time in the past 10 years when there have been fewer houses listed for sale than there are RIGHT NOW! And yet, despite the fact that we keep starting off each year with FEWER homes for sale... 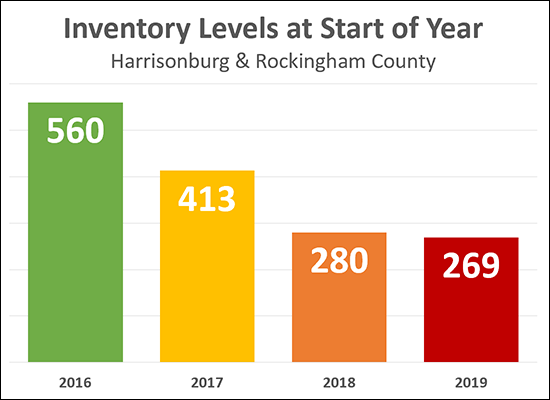 ...somehow buyers are able to buy pretty much the same number of homes for each of the past three years:
What does this mean? How can it be? Stop making my/your head hurt!? Well, basically, the inventory level DOES and DOESN'T matter. If 1,000 homes are listed for sale each month in 2019 and 1,000 go under contract and 1,000 sell -- we would have an absolutely outlandish year of sales (12,000 home sales) but inventory would have started and finished at 269 homes for sale. So -- buyers certainly have fewer choices at any given moment, but as more and more listings come on the market this Spring, they are likely to have more and more choices, though they will be competing against lots of other buyers and the properties are likely to go under contract quickly. | |
How Much Did City Single Family Homes Increase in Value in 2018? |
|
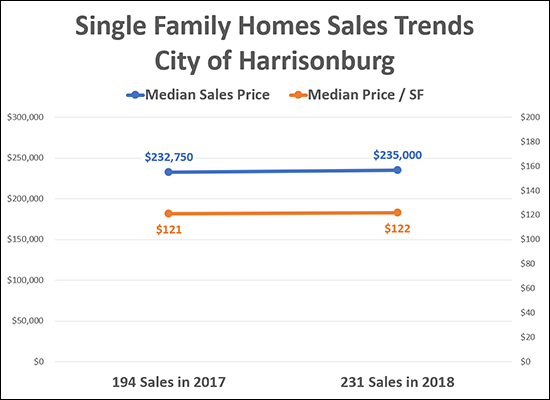 If you own a single family home in the City of Harrisonburg, you might be wondering how much your home's value increased (or decreased) over the past year. 194 single family detached homes sold in the City of Harrisonburg in 2017 with a median sales price of $232,750 and a median price/SF of $121. 231 single family detached homes sold in the City of Harrisonburg in 2018 with a median sales price of $235,000 and a median price/SF of $122. The increase in median sales price from $232,750 to $235,000 is a 0.97% increase. The increase in median price per square foot from $121 to $122 is a 0.83% increase. So, if we round up (just by a bit) then based on changes in both the median sales price and the median price per SF, it seems that single family homes in the City of Harrisonburg increased in value by 1% in 2018. | |
Who Is Winning In The Local Real Estate Market? |
|
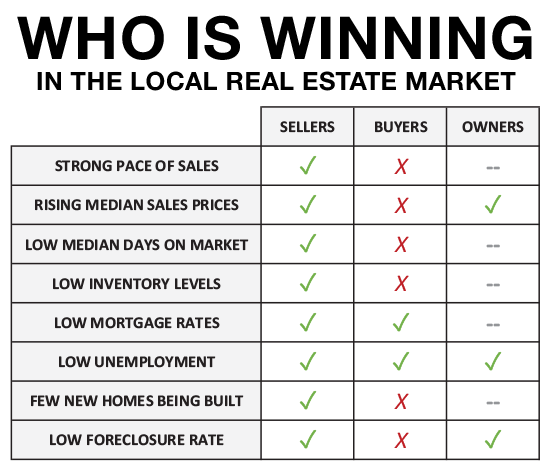 Sellers are winning - rather universally. Every market metric works in their favor. Hooray if you get to be a seller in the current market! Buyers are losing - in all but a few categories. Certainly, buyers are happy to have low mortgage interest rates (cheap money) and low unemployment (you need a job to buy a house) but otherwise, all market metrics are working against buyers. Homeowners are winning - but are indifferent to most of what is going on in the market. Homeowners are certainly happy that home prices are increasing, that folks have jobs, and that not many people are losing their homes to foreclosure. As to all of the other market shenanigans - they are rather indifferent. So, again, a great time to be a seller. And if you have to be a seller AND a buyer -- perhaps it will be a wash. You'll benefit as a seller and struggle as a buyer. Welcome to the Seller's Market of 2019! | |
The Value of Your Home Based On When You Bought It |
|
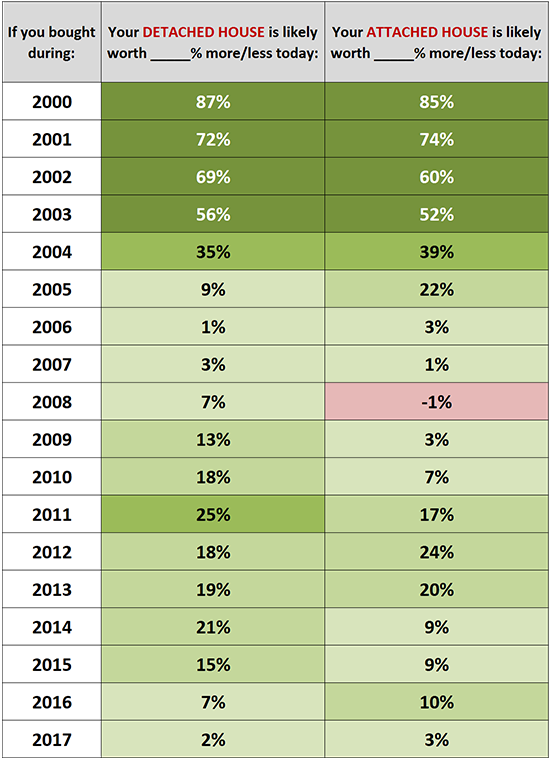 Can historical median sales prices give you some sense of your home's current market value? Perhaps so! The values in the chart above are calculated by comparing the 2018 median sales price to the median sales price in each of the past 17 years. Do remember, of course, that while this might provide a general guide to market changes over the past 18 years, every home and neighborhood is unique. Let's chat about your specific house if you want to know what it is worth in today's market. | |
Will housing inventory levels improve next year? |
|
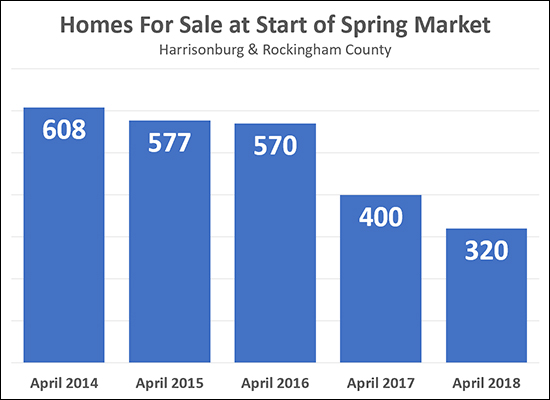 If you have been looking for a new home to buy all Spring and Summer and Fall of this year -- and didn't find one, which you blame on having very few homes from which to choose -- are you likely to have better luck next year? I'm guessing not. The graph above shows that inventory levels have dropped significantly over the past two years based on how many homes are on the market at the start of the main buying season, which I'm defining as April in the graph above. So -- after seeing a 20% decline in inventory levels between April 2017 and April 2018 -- are we likely to see inventory levels start increasing again in 2019? Again, I don't think so, and here's why.... To reverse this trends of declining inventory we would need one or more of the following to happen in our local market....
Again -- none of the changes above seem likely to happen at a scale that would allow inventory levels to see much, if any, of an increase next year. As such, I am expecting we'll see relatively similar inventory levels next Spring and Summer. | |
How Many Home Sellers Pay Closing Costs For Buyers? |
|
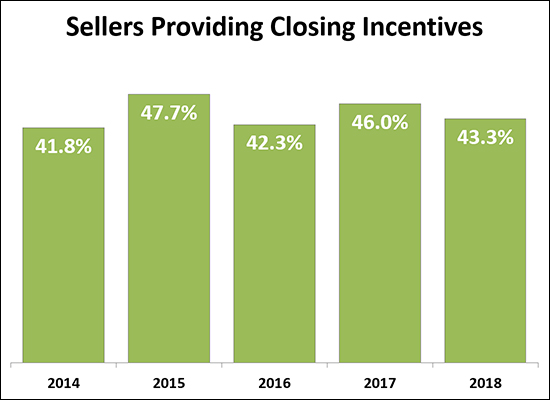 Almost half of sellers (43.3%) pay some portion of a buyer's closing costs in the form of a credit at closing. Over the past five years, the number of sellers providing a "concession" of this sort to buyers have stayed between 40% and 50%. 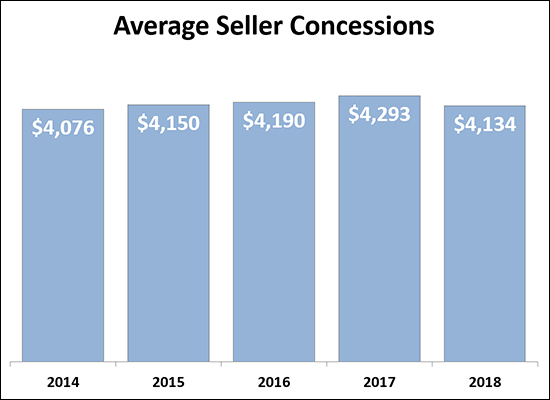 Of interest -- sellers have paid more and more of a buyer's closing costs over the past five years, but that has edged back down during 2018. Why would sellers be paying more of a buyer's closing costs? It's hard to say exactly -- buyers might be asking for more money, sellers might be agreeing to provide a larger credit, or perhaps the total amount of closing costs that a buyer has to pay is increasing as well? 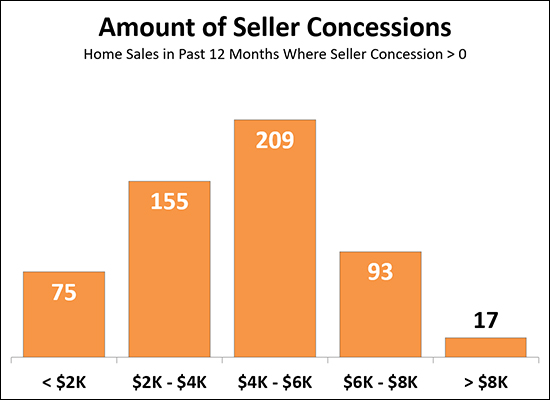 If, as a seller, you are paying part of a buyer's closing costs, you are most likely to be paying between $4K and $6K --- or between $2K and $4K. And again, as a seller, if you pay part of the buyer's closing costs -- you are not alone -- 43% or so of sellers do so! | |
| Older Posts |
Scott Rogers
Funkhouser Real
Estate Group
540-578-0102
scott@funkhousergroup.com
Licensed in the
Commonwealth of Virginia
Home Search
Housing Market Report
Harrisonburg Townhouses
Walk Through This Home
Investment Properties
Harrisonburg Foreclosures
Property Transfers
New Listings

