| Newer Posts | Older Posts |
Sales of new construction homes speeding up in 2015! |
|
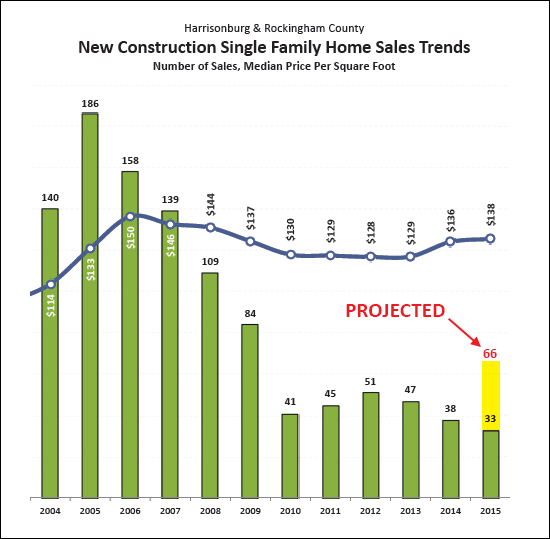 General market recovery (in both pace and price of sales) may finally be resulting in a return of new construction single family home sales. As shown above, we may see a big jump in the number of new construction home sales in 2015 -- perhaps beating out the past five years! | |
Fewer affordable homes available for purchase |
|
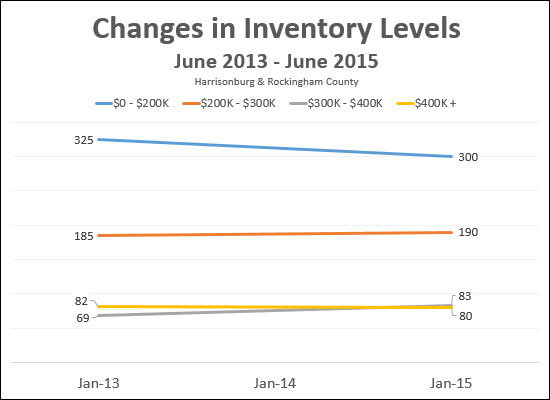 There are 7% fewer homes for sale under $200K as compared to two years ago. In contrast, there are 2% more $200K - $300K homes for sale.... ...and 20% more $300K - $400K homes for sale.... ...and 2% fewer $400K+ homes for sale. This change (fewer lower priced homes for sale) is another indicator that home prices are starting to increase again. | |
Single Family Home Sales Prices Up Nearly 8% in 2015 |
|
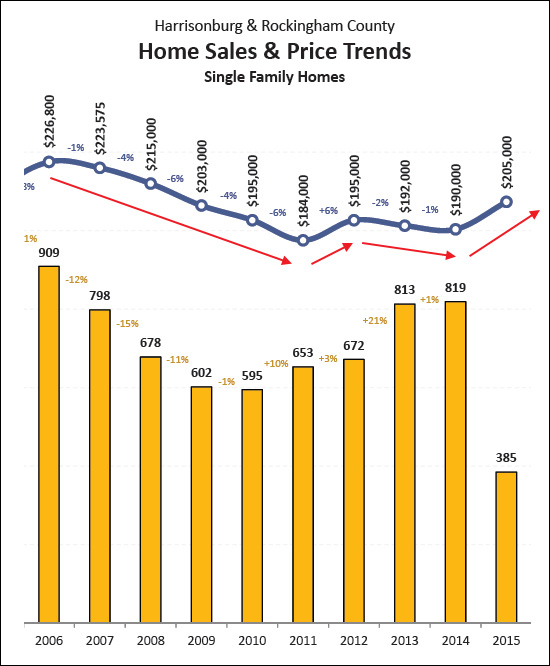 The analysis above looks only at single family home sales -- which excludes duplexes, townhouses and condos. This metric is a helpful indicator for the overall residential market because there are not usually a lot of investors participating in this segment of the market, thus it is typically a good representation of owner occupant demand for houses. As is shown above, the last few years have seen (small) declines in median sales prices with a 2% decline in 2013 and a 1% decline in 2014. It is, thus, exciting news (for home sellers, though perhaps not as much for home buyers) that these median sales prices have increased by nearly 8% thus far in 2015 as compared to 2014 median sales prices. Read more about current market trends in my monthly market report found online at HarrisonburgHousingMarket.com. | |
July 2015 Harrisonburg Housing Market Report: Home Sales Hit Seven Year High |
|
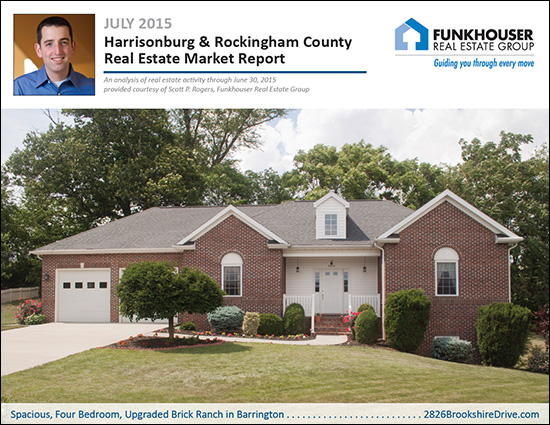 Learn more about this month's Featured Property: 2826 Brookshire Drive I just published my monthly report on the Harrisonburg and Rockingham County real estate market. Jump to the full online market report, or download the PDF, or read on for highlights.... 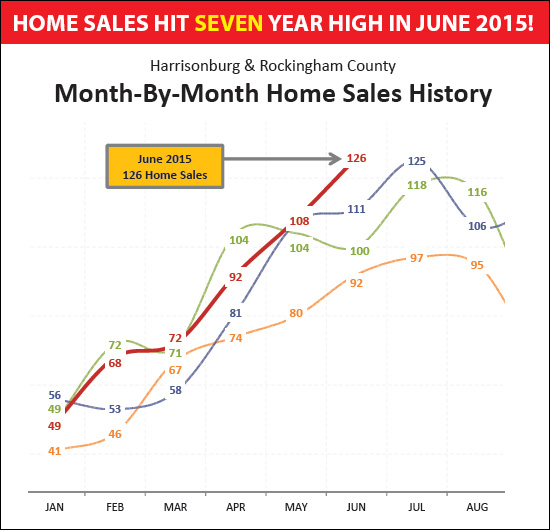 First, the fun news. As noted above, June 2015 home sales (all 126 of them) broke a long-standing record for the number of homes selling in a single month in Harrisonburg and Rockingham County. The last time we saw this many closings in a single month was waaaay back in August 2007! 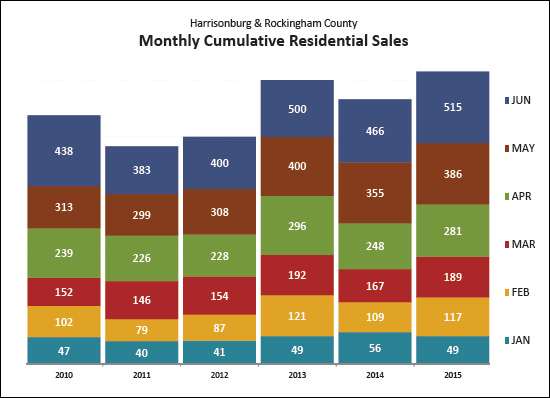 Moving beyond a single month of lots of home sales, it is clear (as shown above) that the first half of the year is off to a smashing start as well. There were 515 home sales in the first half of 2015 -- more than in the first six months of any of the preceding five years. 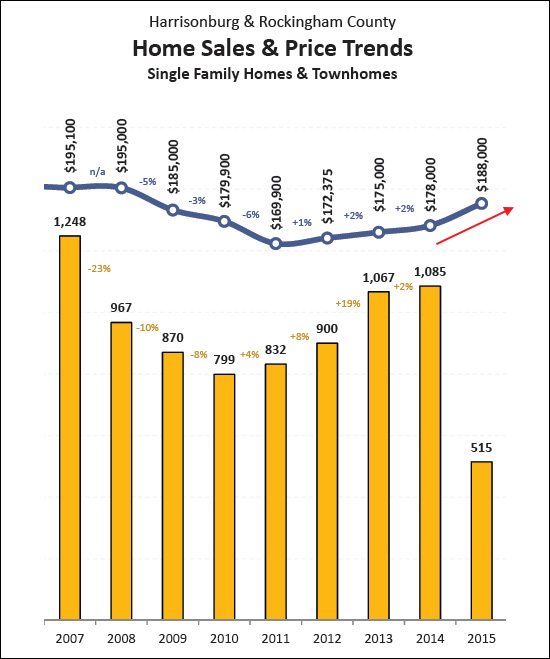 Perhaps these increasing home sales are what is also helping median prices to start to rise. As shown above, after several years of slow increases (+1%, +2%, +2%) in the median sales price, we are now poised to see a 5% - 6% increase in median sales prices in 2015. Stay tuned to see how the rest of the year shakes out -- but hopefully we'll at least clear 3% or 4%. 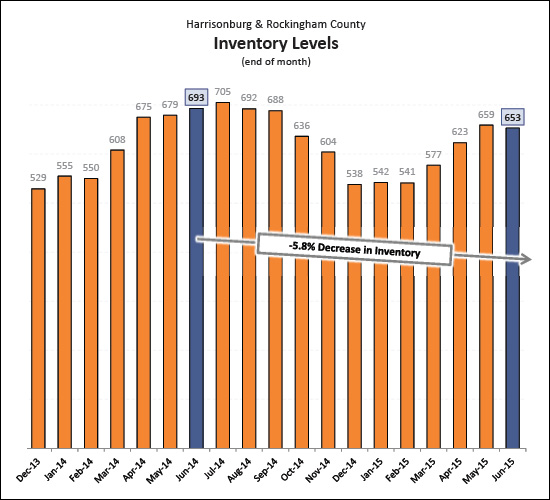 If you're thinking about putting your house on the market, this might be a swell time to do it -- as shown above, inventory levels are down 6% year-over-year AND inventory levels dropped over the past month. Buyers have fewer options right now, and there are still plenty of buyers looking to buy.... 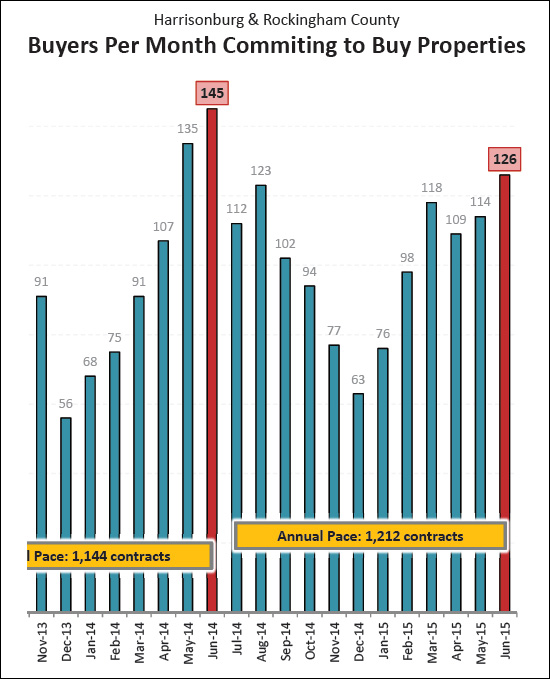 As shown above, there were more buyers (126) in June 2015 than we saw in May 2015 (114) and we should still see quite a few more months of 100+ buyers making decisions to buy homes in Harrisonburg and Rockingham County. OK, that's it for now. I'll hit some high points here on HarrisonburgHousingToday.com in coming days. In the meantime, you can read the full July 2015 Harrisonburg Housing Market Report online or by downloading the PDF. And as is always my encouragement -- if you will be buying or selling a home in the near future, become a student of the housing market! Learn what has been happening recently, what is happening now, and what is likely to happen next. Being informed will allow you to make better real estate decisions.If you are ready to buy or sell a property in Harrisonburg or Rockingham County, contact me at 540-578-0102 or scott@HarrisonburgHousingToday.com to get the process started. | |
Mortgage interest rates have been better (3.3%) and worse (4.6%) in the past three years |
|
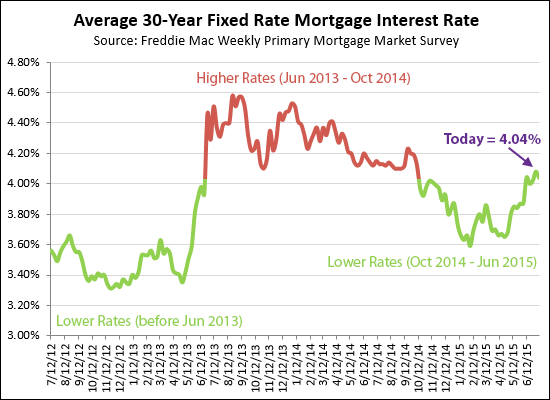 Mortgage interest rates (for a 30 year fixed rate mortgage) have varied from as low as 3.3% to as high as 4.6% over the past three years. Current rates are hovering right around 4% -- which is higher than they have been recently, but is still absurdly low within a longer-term context, providing buyers with a great opportunity to lock in their housing costs for the long-term. | |
Go ahead, set off those fireworks, June 2015 home sales were hot, hot, hot |
|
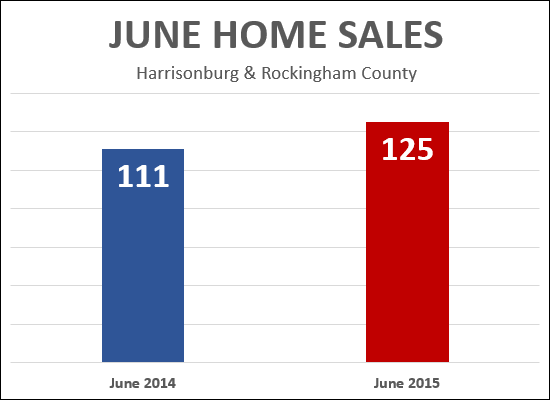 Despite having fewer showings in May/June and fewer contracts in June, it looks like June 2015 was a great month for (closed) home sales. With a few more sales likely to trickle in over the next few days, June 2015 home sales are already showing a 13% improvement over last June. Stay tuned for more analysis in the days to come.....and Happy Independence Day! | |
Showings slower (than last year) in May, June 2015 |
|
 I don't always bring good news. Showing activity in May and June of this year was slower (-28%, -18%) than in the same two months last year. Stay tuned for further market analysis next week to see how we're doing on contracts and sales in the first half of the year. | |
Reimagining Days on Market |
|
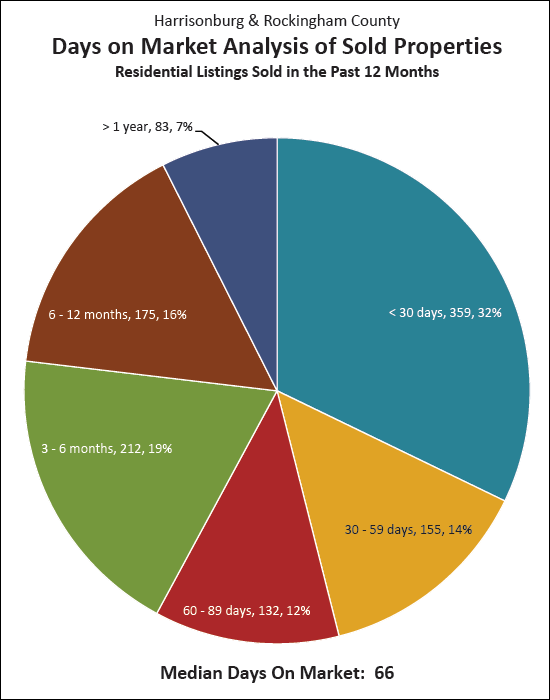 Two months ago, our "Median Days on Market" in this area was 119 days. Now, as shown above, it's only 66 days. What's happening? A drastic acceleration of our local real estate market? Actually, no. "Days on Market" is now being calculated differently by our new MLS. In the past, the "Days on Market" was counting the number of days between the list date and closing date. Now, it is a calculation of the number of days between the list date and when a property goes under contract. In many ways, this is a more helpful calculation -- it takes the variable of "how long it takes a buyer to get to closing once they are under contract" out of the equation. Now, "Days on Market" shows how long it takes for a house to go under contract. | |
Maybe the price of building lots has not plummeted? |
|
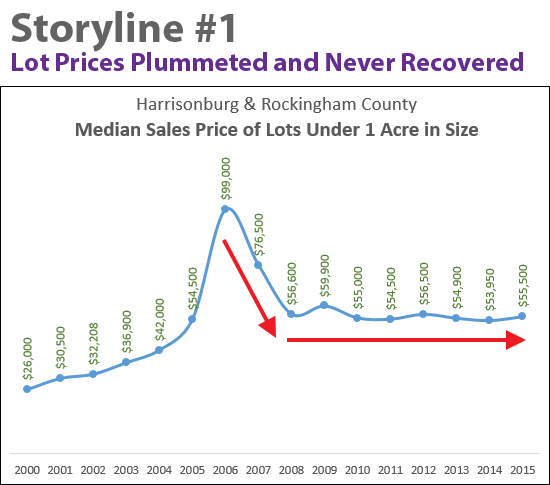 The story illustrated above (lot prices plummeted 50% and have never recovered) is the one I've been running with over the past few years. It takes the $100K lot value as the "new norm" and then looks at all values after that point ($55K-ish for years and years) as depressingly low. Perhaps that's not the correct storyline. What if this is really the story.... 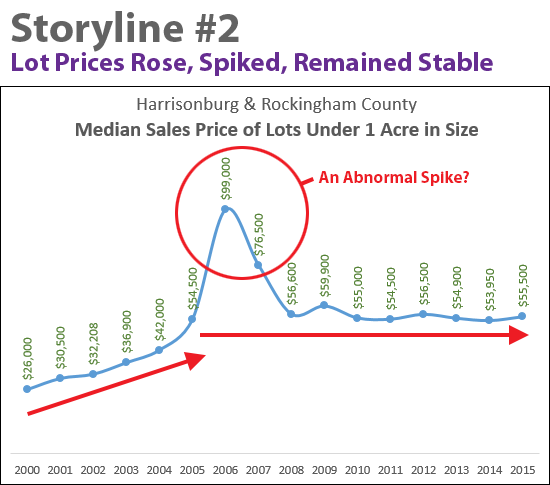 Perhaps the story to be told is that lot values steadily increased between 2000 and 2005 (from $26K to $55K), then had an abnormal, unnatural, unsustainable spike (to $99K) before settling back down to the then continued norm of $55K-ish. If this, is, the more important story to be embracing, then we need not be quite as depressed. Other than a brief two year wild party (for sellers of building lots) the median sales price of these lots has been around $55K for the past decade.... | |
Mortgage Interest Rates Edge Up Past 4% |
|
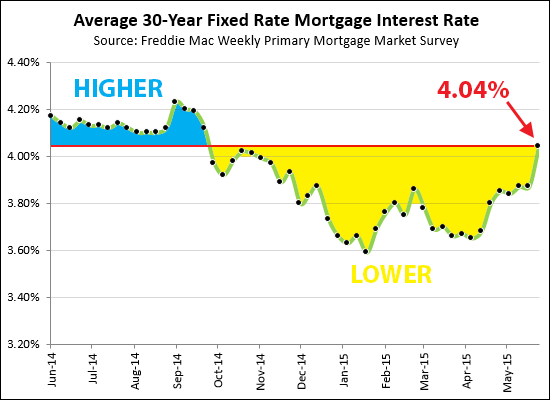 Average interest rates on a 30-year fixed rate mortgage have edged up past 4%. Above you will note that interest rates have been lower than current levels (yellow area) during most of the past year, though we were seeing rates higher than 4% once we look back about seven months. | |
Home prices edging up a bit more quickly? |
|
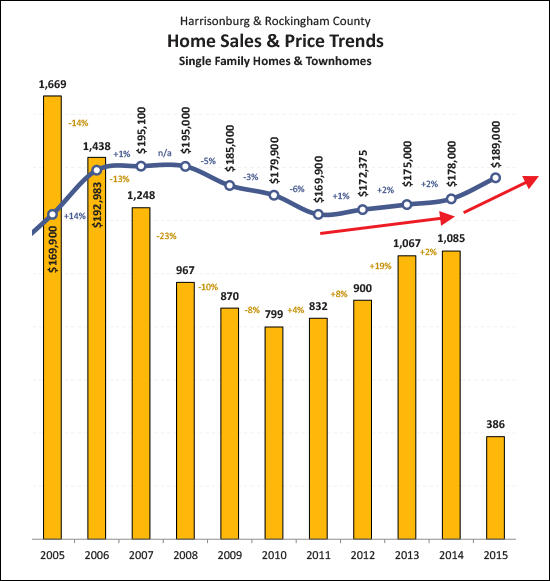 After several years of 1% - 2% increases in median price per year, could we finally be seeing a larger (faster) increase in the median sales price in the Harrisonburg and Rockingham County market? The data thus far in 2015 shows a 6% improvement in median sales price as compared to 2014. Let's see if we can stick with that 6% improvement as the year goes on! Learn more about local market trends via my most recent housing market report....  | |
Mortgage Interest Rates Edge Up Slightly |
|
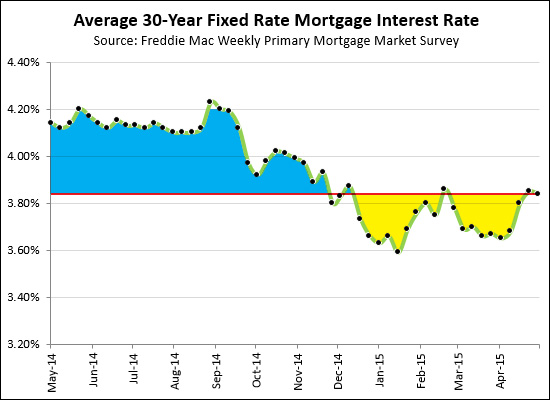 30-Year Fixed Mortgage Interest Rates have edged up slightly over the past few weeks, to a national average of 3.84%. That means that there have certainly been lower rates in the past five months (shown above in yellow) but the current rates are better today than they were for the last seven months of 2014 (shown above in blue). If you're buying soon, talk to a lender ASAP so that you are ready to lock in a rate once you have a contract on a home to purchase. | |
Lots of Showings! (and contracts, too, of course) |
|
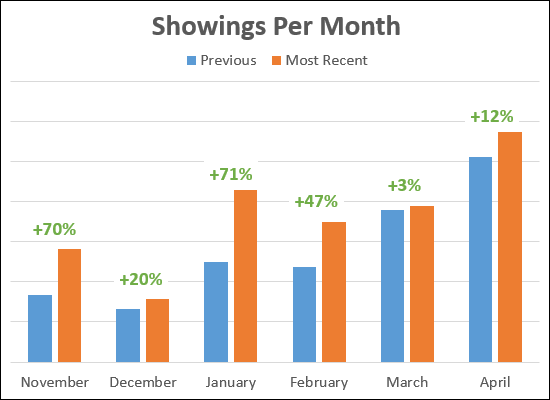 In each of the past six months there have been more showings than in the same month during the previous year. This increase in showings has amounted to a 30% year-over-year increase in showings when looking at November - April. It should be no surprise, then, that contracts and closings are also increasing. | |
What are home values likely to do over the next few years? |
|
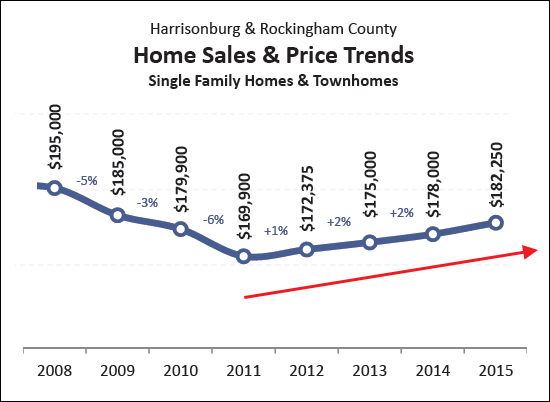 Based on recent trends, I believe we will see 2% - 4% increases per year in the median sales price over the next few years. If we take this year's YTD median sales price ($182,250) and use a 3% per year metric, here's what the next few years would look like....
That would mean that a median priced home ($182K) may increase in value by about $17,000 over the next three years. | |
The balance between buyers and sellers in our local housing market |
|
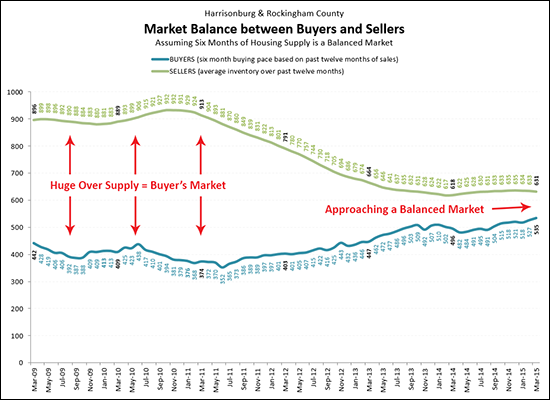 (this one deserves a larger image, click here to view it) Q: Have we reached a balance between buyers and sellers in our local housing market? A: We're not quite there, but we are a lot closer than we have been anytime in the past six years! Here's the methodology behind the chart above....
Read more about the local housing market in my most recent monthly housing market report....  Jump to the full online market report, or download the PDF. | |
March 2015 continues trend of increasing home sales |
|
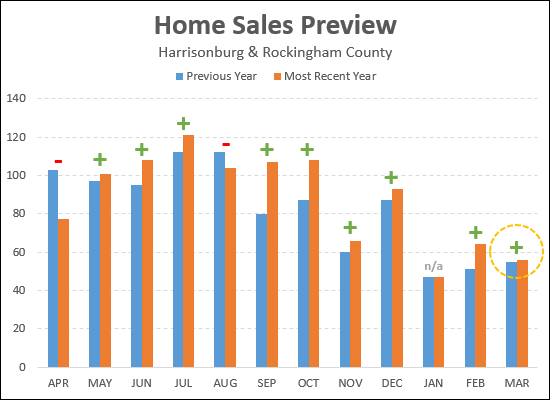 We still have another few days when March 2015 home sales will be reported, but we have already seen more sales this year (56) than during the month of March last year (55). This continues the trend of improving monthly home sales. Now, 10 out of the past 12 months have shown the same number of more home sales than in the same month during the previous year. | |
The most quickly recovering price range is.... |
|
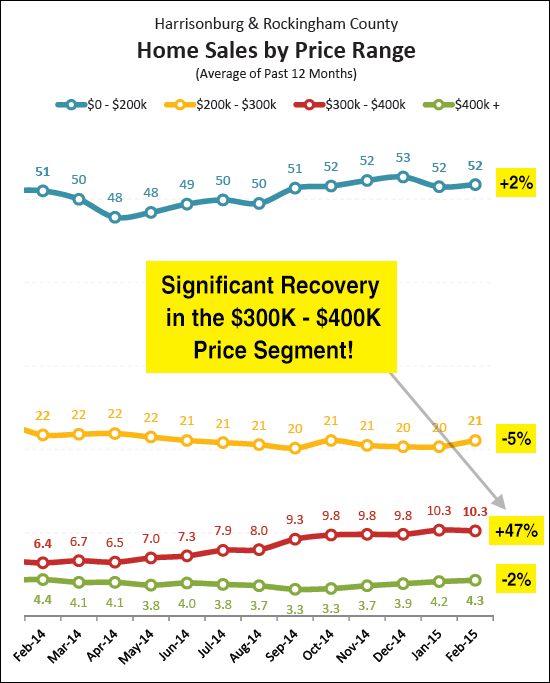 This might surprise you, but the price range that has seen the most significant year-over-year increase in the pace of home sales is homes priced between $300K and $400K. Anyone want to volunteer some theories on why we're seeing this recovery in this price range at this time in the market? Read more about our local housing market in my monthly market report. Jump to the full online market report, or download the PDF.... 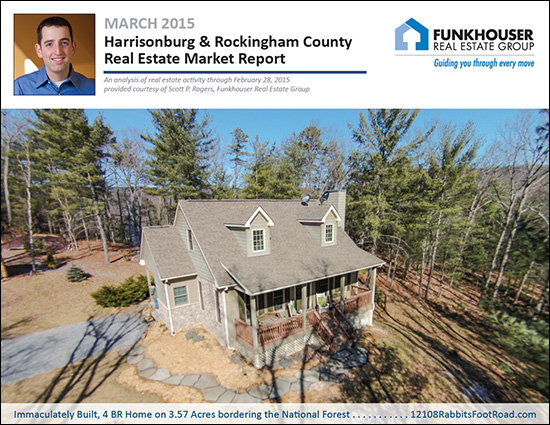 | |
March 2015 Monthly Housing Market Report |
|
 Learn more about this month's Featured Property: 12108 Rabbits Foot Road I just published my monthly report on the Harrisonburg and Rockingham County real estate market. Jump to the full online market report, or download the PDF, or read on for highlights.... 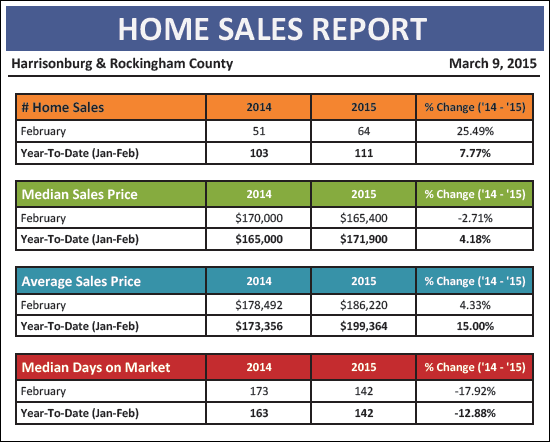 First, the big picture trends thus far this year show signs of a healthy, growing market....
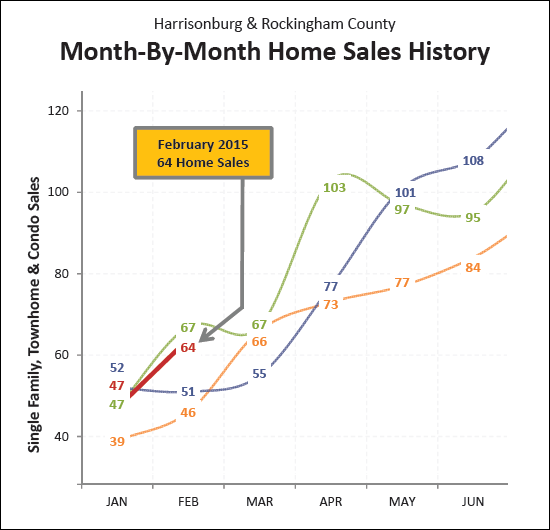 Both January and February of this year appear as "middle of the pack" months when put in the context of 2012, 2013 and 2014. The sales trajectory we see in March and April will be a good indicator of how the rest of this year will turn out. Last year, we experienced somewhat slower than expected home sales all the way until May when the monthly sales pace started popping up above previous years. I am hopeful we will see an earlier start to the 2015 market. 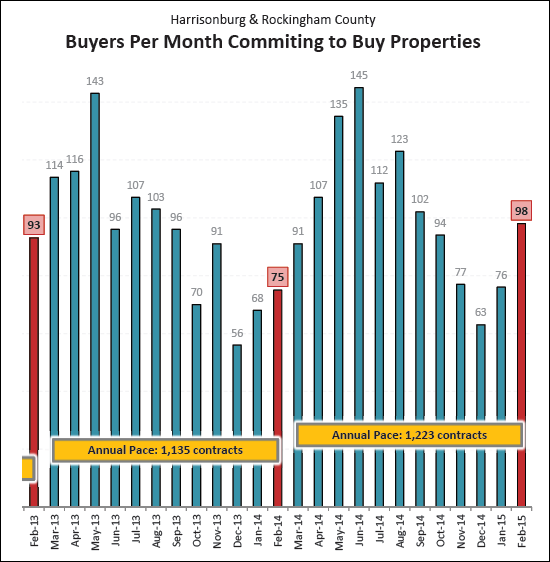 Hooray for lots of buyers in February 2015 -- signing contracts, that is. A whopping 98 contracts were signed in February 2015, compared to only 75 last February. This is an excellent indicator that we should see strong (closed) sales activity in March and April of this year. 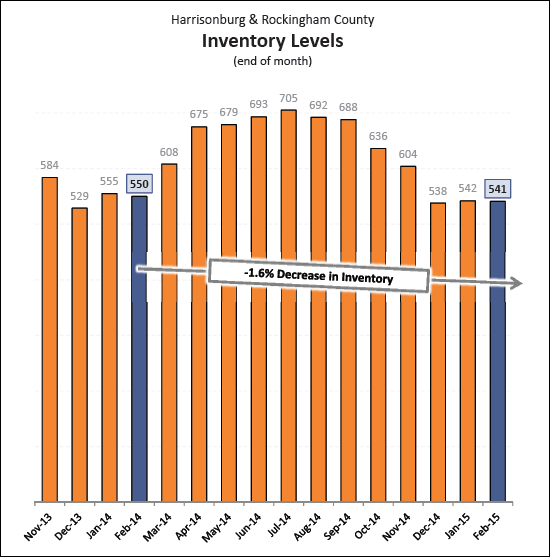 As shown above, inventory levels continued to decline (slightly) over the past month -- and are now down 1.6% as compared to a year ago at this time. We are likely to see these inventory levels start to rise over the next few months. OK, now for some action items.... SELLERS: All of the snow in your yard should be melted within 24 to 48 hours. If you are going to be listing your home for sales this Spring, consider trying to get the advantage of getting your house on the market early, when you'll have less competition from other sellers. Let's meet (soon!) to discuss timing, pricing, marketing and what else you should consider doing to prepare your home for the market. BUYERS: We will see lots of exciting listings coming on the market in the next 30 - 60 days. Are you ready? Have you talked to a lender to become prequalified? Have we met to discuss your hopes, goals and dreams and your next home? Let's start looking at some houses now so that when your dream house comes on the market you have a good context for whether it is a good deal or a great deal. Above all, if you will be buying or selling soon, I encourage you to become a student of the housing market. Learn what has been happening recently, what is happening now, and what is likely to happen next. Being informed will allow you to make better real estate decisions. You can continue your studies by reading the entire March 2015 market report online, or by downloading the PDF. Also, if you're interested in working with me to buy or sell a home in Harrisonburg or Rockingham County, you can always reach me at scott@HarrisonburgHousingToday.com or 540-578-0102. | |
Townhouse (duplex, condo) buyers from 2008 may have to wait until 2018 to see their home value return to the original purchase price |
|
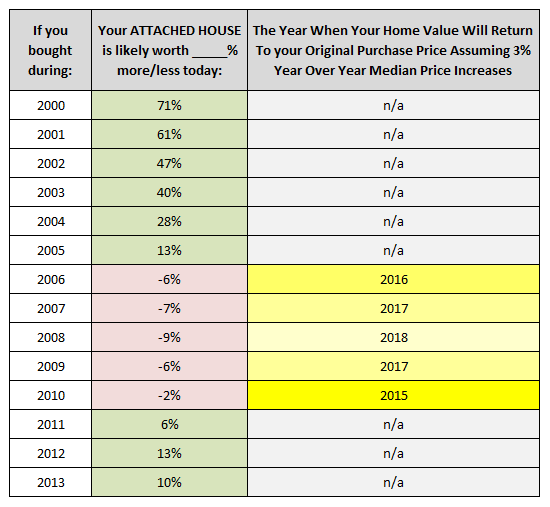 Yesterday I ran an analysis on single family home values -- which suggested that home buyers from 2006 may have to wait until 2020 to see their home value return to the original purchase price. Today, we're answering a similar question for townhouses.... So, let's say one bought a townhouse in 2008or any of the other "red" years above. What's the thought on a reasonable expectation for a townhouse to at least recover the value to the purchase price (and then, of course, hopefully, higher)?OK, so, first of all -- the values in the middle (red and green) column above are showing the potential current value of your townhouse depending on when in the past 15 years you purchased the home. Basically, those folks who purchased before (2000-2005) the real estate boom have higher home values now than when they purchased their townhouse -- and people who bought between 2006 and 2010 have a lower home value today. Townhouse buyers in recent years (2011-2013) are doing just fine. So, back to the question at hand -- how long it will take townhouses to return to the value that they had when they were purchased. As shown above in the right (grey and yellow) column, we can sort of guess as what that time frame will look like if we assume that home values will increase 3% per year over the next five (etc.) years. This analysis shows that....
And, for the data lovers out there, feel free to peruse lots of market indicators and graphs at HarrisonburgHousingMarket.com. | |
Home buyers from 2006 may have to wait until 2020 to see their home value return to the original purchase price |
|
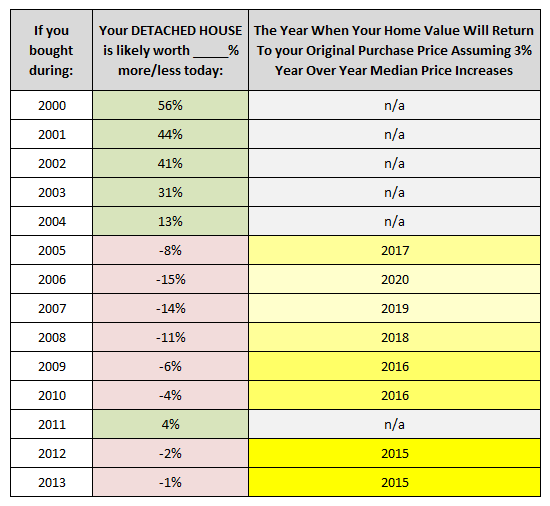 OK, my apologies in advance for the slightly depressing nature of this blog post. This is the third in a series of three -- and I'm only going here because someone (Brad!?!) asked the question, so I thought I'd run the analysis to shed some light on his inquiry. Brad's question.... So, let's say one bought a house in 2009 (hypothetically, of course, right?!)... Or any of the other "red" years above. What's the thought on a reasonable expectation for a house to at least recover the value to the purchase price (and then, of course, hopefully, higher)? Not that you have a crystal ball, but in general?OK, so, first of all -- the values in the middle (red and green) column above are showing the potential current value of your home depending on when in the past 15 years you purchased the home. Basically, those folks who purchased before (2000-2004) the real estate boom have higher home values now than when they purchased their home -- and most people who bought since then do not have a higher home value today. That is because after single family home values peaked in 2006, they have been slowly (slowly!!) drifting downward since that time. (details here) So, back to Brad, he is wondering how long it will take homes to return to the value that they had when they were purchased. As shown above in the right (grey and yellow) column, we can sort of guess as what that time frame will look like if we assume that home values will increase 3% per year over the next five (etc.) years. Working our ways sort of backwards, this analysis shows that....
OK, enough for now. Hopefully this is a helpful look at the implications of shifting market values over time. If you have a question about the value of your home, please let me know. I'd be happy to meet with you to give you some specific feedback pertinent to your home -- as compared to the generalities referenced above. And, for the data lovers out there, feel free to peruse lots of market indicators and graphs at HarrisonburgHousingMarket.com. P.S. Don't like the harsh realities presented herein? Complain to Brad. :) | |
| Newer Posts | Older Posts |
Scott Rogers
Funkhouser Real
Estate Group
540-578-0102
scott@funkhousergroup.com
Licensed in the
Commonwealth of Virginia
Home Search
Housing Market Report
Harrisonburg Townhouses
Walk Through This Home
Investment Properties
Harrisonburg Foreclosures
Property Transfers
New Listings

