Trends
| Newer Posts | Older Posts |
Recent townhouse buyers should be smiling! |
|
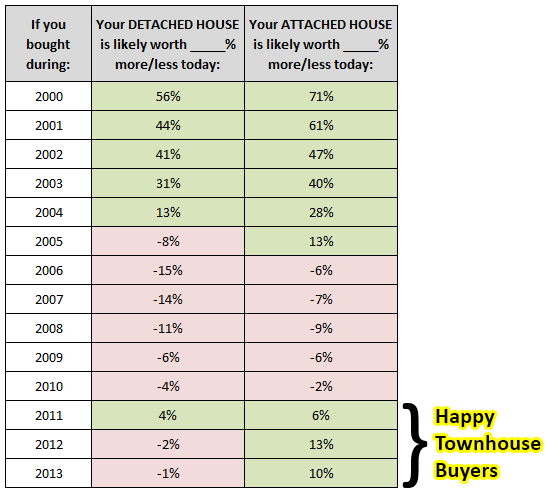 As a continuation of yesterday's analysis, it is worth pointing out that townhouse buyers over the past three years (2011-2013) should be quite pleased with their purchase. Their townhouse is likely to be worth 6% - 13% more than when they bought it -- based on overall increases we have seen in the median sales price of attached dwellings over the past several years. As noted yesterday, the chart above is calculated based on comparing the median sales price in 2014 to the median sales price in each of the prior 14 years. Of course, your townhouse may have performed (from a value perspective) differently than this chart would suggest. These calculations are based on median sales prices during the given time periods. | |
If you bought in X then your house is likely now worth Y |
|
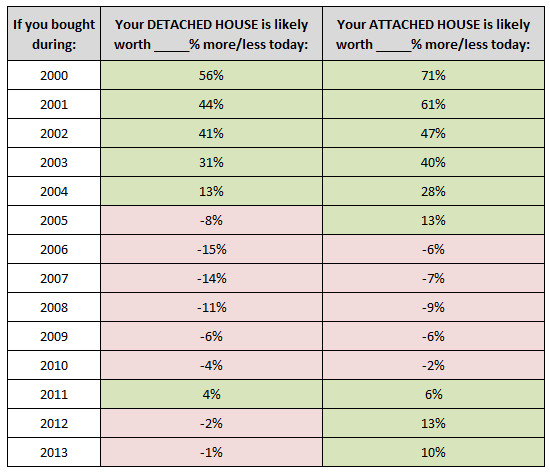 The chart above is calculated based on comparing the median sales price in 2014 to the median sales price in each of the prior 14 years. Several key points to take away from this chart....
| |
Signing Contracts in the Snow |
|
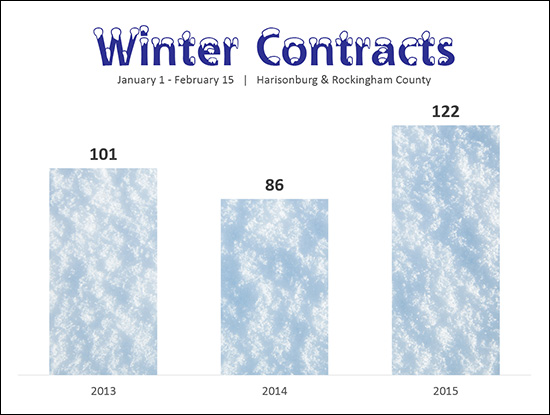 This snowfall has nothing on last year's bitter, winter cold temperatures -- at least as far as home sales go. As noted above, there were significantly fewer contracts signed between the first 45 days of the year in 2014 (86 contracts) as compared to the previous year (101 contracts) and as compared to this year (122 contracts). | |
Median Sales Prices Finally (finally!?!!) hit $180K |
|
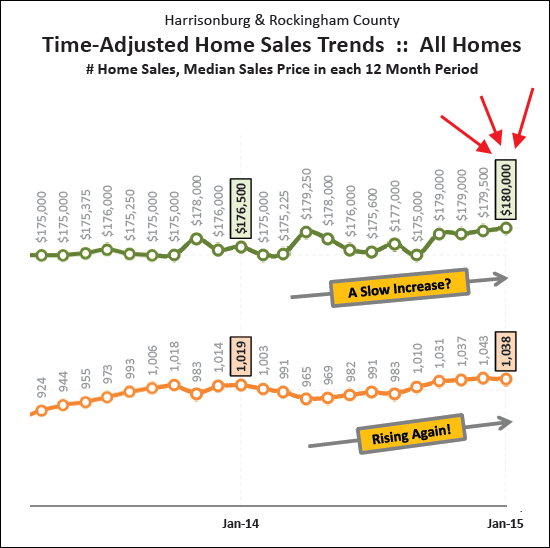 For most of the last three years, the 12-month median sales price has been floating between $173K and $176K. Over the past six months it has started to slowly rise..... Finally -- it has hit $180,000. Read quite a bit more about our local market in my entire February 2015 real estate market report online, or by downloading the PDF. | |
Home Sales Preview: January 2015 |
|
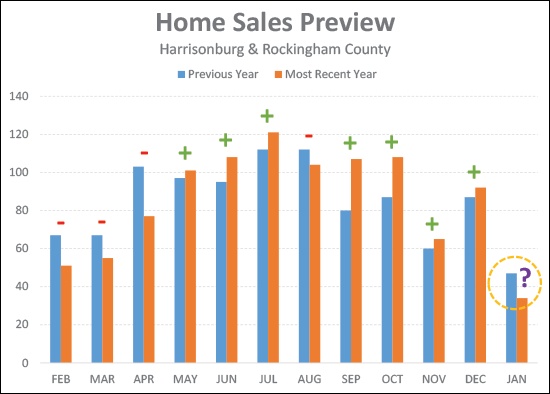 Looking back at sales in recent months we find that....
The current month, however, has thus far not been as exciting. We'll need to see quite a few more sales recorded in the MLS over the next few days (that closed in January) in order to come up on par with last January. Stay tuned for my monthly market report, or feel free to catch up by reviewing last month's report. | |
Local Unemployment Rate Edges Down Below 5% |
|
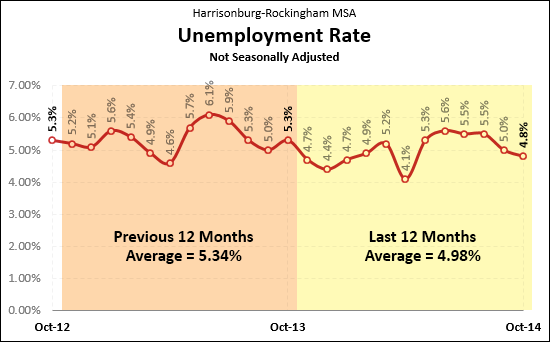 The local unemployment rate (Harrisonburg / Rockingham MSA) edged down to 4.8% in October 2014. That shows a slight decline from the several months prior -- as well as an overall improvement from a big picture perspective....
Low unemployment rates keep our local housing market healthy by keeping our foreclosure rate low along with not creating too many desperate sellers who sell at any price and affect pricing trends. For even more analysis of our local housing market, check out my full December 2014 market report online, or by downloading the PDF. Learn more about this month's Featured Property: 3339 Deavers Lane | |
Positive Long Term Trends Over The Past Six+ Months |
|
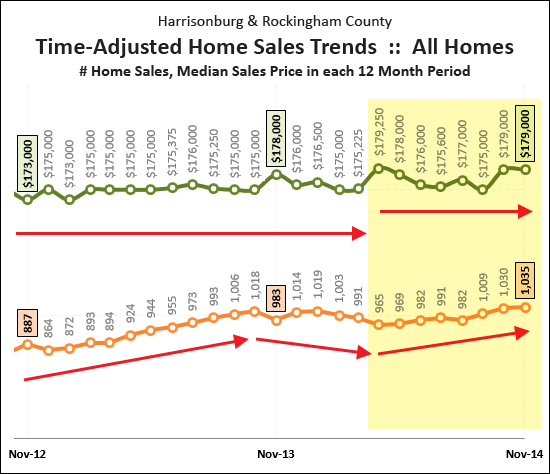 There is a lot going on in the graph above.... This graph shows a rolling 12 months of the number of home sales in the Harrisonburg and Rockingham County area, as well as the median price of the homes that sold during these time frames. Each data point shows one year's worth of home sales, which eliminates the volatility of evaluating sales figures on a monthly basis. Of note, over the past six to eight months, we've seen two things happen.... 1. Median Prices jumped up from their usual $175K spot (where they've been for a few years) to levels closer to $178K or $179K. This is shown with the green line in the yellow shaded box. 2. The pace of home sales started increasing again, surpassing the 1,000 sales per year mark again, after having seen a decline in early 2014. This is shown with the orange line in the yellow shaded box. Both of these are long term trends that show sustained health and growth in our local real estate market. For even more analysis of our local housing market, check out my full December 2014 market report online, or by downloading the PDF.  | |
Showings Strong in November after slower October |
|
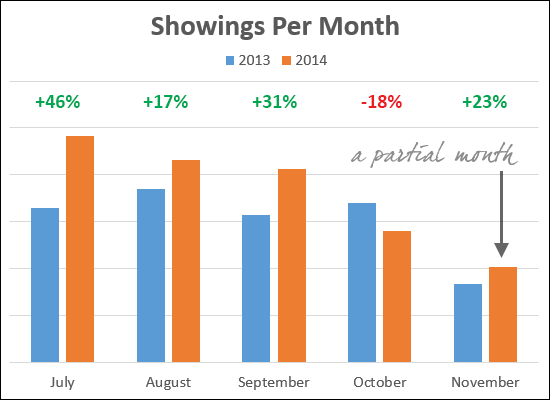 One measure of future performance of our local real estate market is how many homes are being viewed by buyers. The data above is an analysis of showings of Funkhouser Real Estate Group listings over the past several months. A few things to note....
| |
When will we see more NEW single family homes being built? |
|
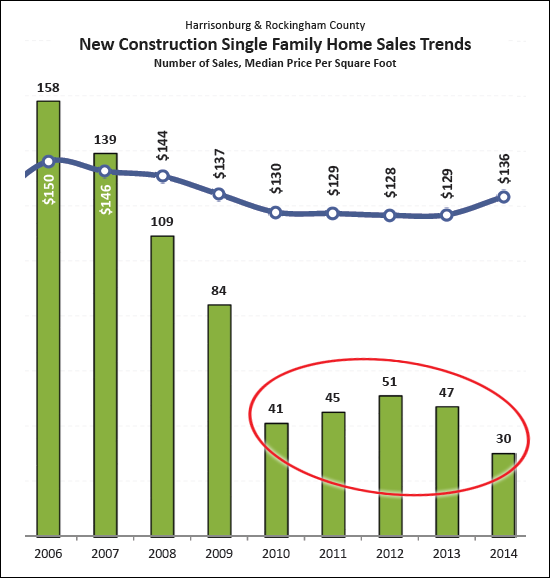 As shown above, there have not been very many new single family home sales in the MLS over the past few years. That said, there have certainly been new single family homes built that are not reflected in these numbers -- for example, custom homes built by builders on customers' building lots. Why aren't more new single family spec homes being built? And when will we see them being built again? The Why -- as I was commenting to a builder yesterday, the continued availability of reasonably priced re-sale homes is making it tough for buyers to decide to build a custom home. The When -- we need to see appreciation of home values, bringing up the prices of these re-sale homes, in order for new homes to be able to be priced competitively enough to more frequently be the chosen option for buyers. | |
September Sales Surge (+33%) Shows Continued Strength of Local Housing Market |
|
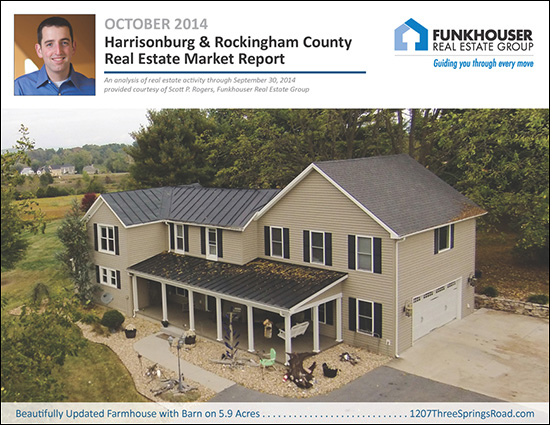 Featured Property: 1207 Three Springs Road, McGaheysville, VA I just published my monthly report on the Harrisonburg and Rockingham County real estate market. Jump to the full online market report, or download the PDF, or read on for highlights.... 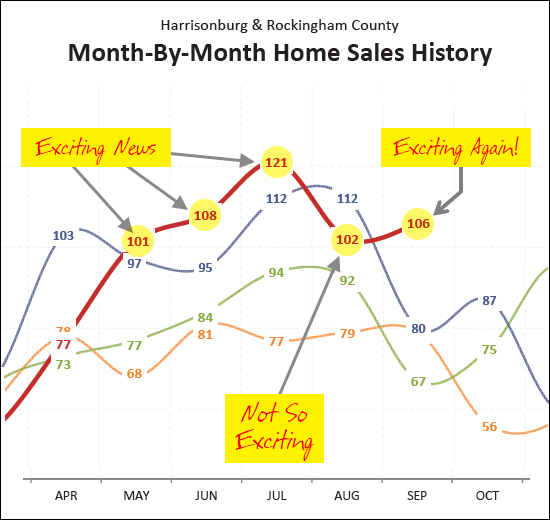 As shown above, August home sales were a bit deceiving. It appeared that after record high sales in May, June and July, that August was an indication that the strong home sales market would not continue through 2014. September sales, however, certainly provides new hope that in fact our year to date sales will end up about the same place as they were in 2013. 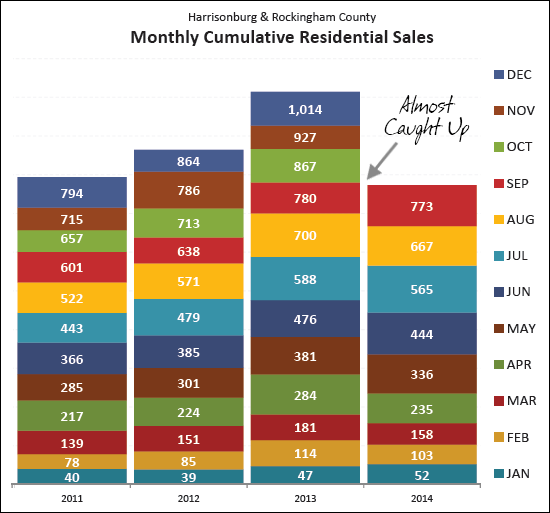 As shown above, given the strength of September sales, this year's year-to-date sales (773) have almost caught back up to where we were at this time last year (780). 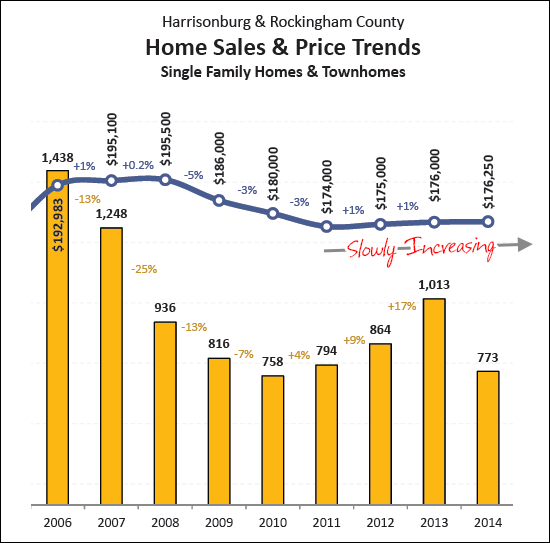 The next question on most people's minds is how home prices are doing. As shown above, we have seen slow (slow!) gains in median home sales prices over the past several years. The stability (not a decline) is good, but I think most homeowners wish property values would start to increase a bit more quickly. 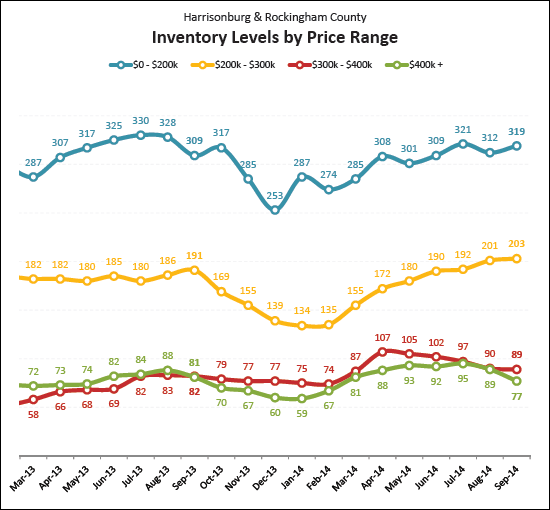 If you are planning to put your house on the market this Fall, it is important to look at trends in your particular price range. As shown above, inventory levels are increase for homes under $300K, but are decreasing for homes over $300K. If you are buying or selling now, or will be soon, I encourage you to become a student of the housing market. Learn what has been happening recently, what is happening now, and what is likely to happen next. Being informed will allow you to make better real estate decisions. You can continue your studies by reading the entire October 2014 market report online, or by downloading the PDF. Also, as always, if you're interested in talking to me about buying a home in Harrisonburg or Rockingham County.....or if you are interested in selling your current home.....just drop me a line by email (scott@HarrisonburgHousingToday.com) or call me at 540-578-0102. | |
The Seasonality of Home Sales . . . Selling in the Fall |
|
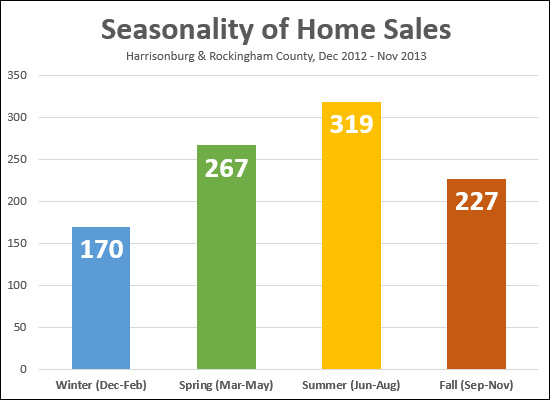 Even if you missed the hot Spring and Summer real estate markets, you will still have a good chance of selling this Fall. As shown above, there were still quite a few home sales in the Fall. And given the number of contracts that have been coming together over the past 60 days, it seems likely that this trend will continue in 2014. If you are planning to sell your home this Fall, let's try to go ahead and take some photos now to show green grass and full trees.... | |
Mortgage rates hold relatively steady just above 4 percent |
|
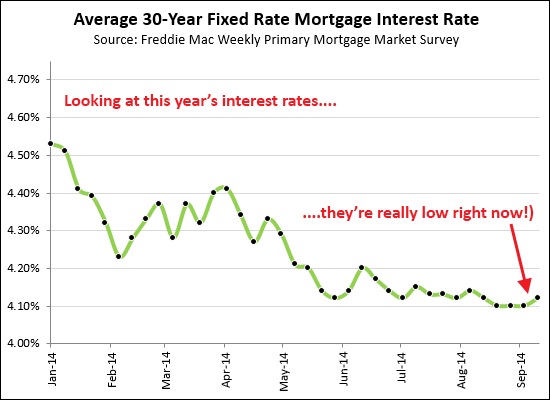 Average mortgage interest rates (for a 30 year fixed rate mortgage) are hovering around 4.1% -- the lowest we have seen this year. 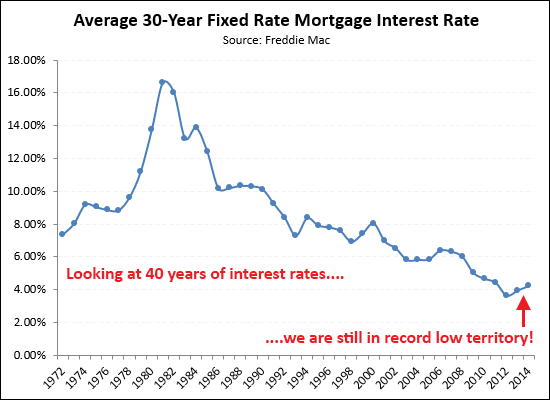 And looking back even further, we can be even more grateful for this low cost of mortgage money. | |
Showings remain strong as we roll into Fall |
|
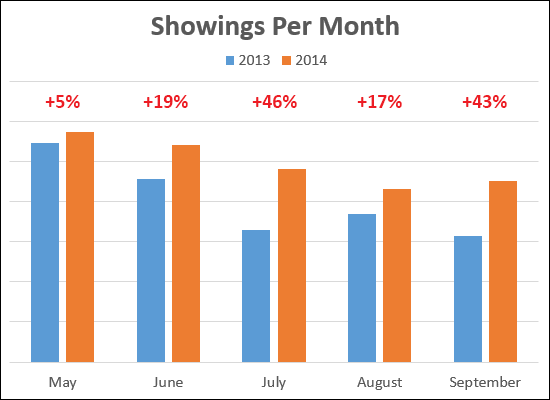 Showing activity remains strong in through August and September -- a promising leading indicator for market activity we may see later on this Fall. * September 2014 data is extrapolated from 9/1/2014 - 9/16/2014 data. | |
Fewer Affordable Homes Available For Sale |
|
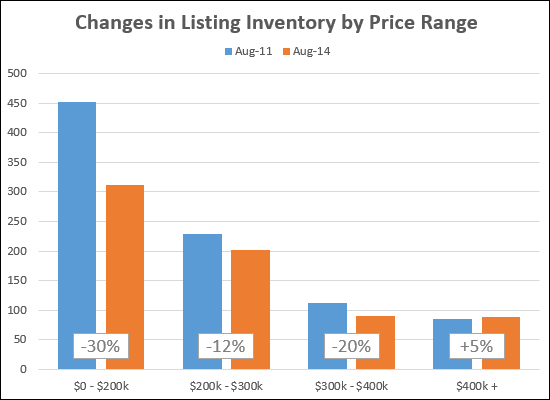 The biggest shift in homes available for sale has been in the lowest price range in our market, under $200K homes. There are now 30% fewer homes for sale in this price range as compared to three years ago. This shift in the lowest price range is the most significant shift as compared to the other three price ranges shown above. The only price range in which we are seeing increased inventory levels is in the $400K + price range. | |
Despite the overall decline in sales, the market is not totally lackluster |
|
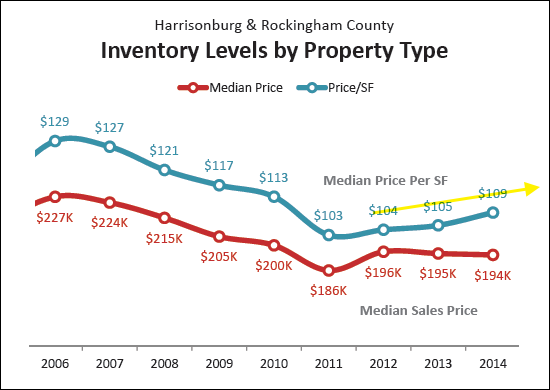 As shown above, despite a decline in the number of home sales in this area, and a tiny decline in median sales price, we may actually be seeing an increase in home values as explored through changes in price per square foot. Read the entire Daily News Record article about our local housing market for further commentary and perspective. Hot July Housing Market Cooled In August Daily News Record, September 9, 2014 | |
Fluctuating Inventory Levels by Property Type |
|
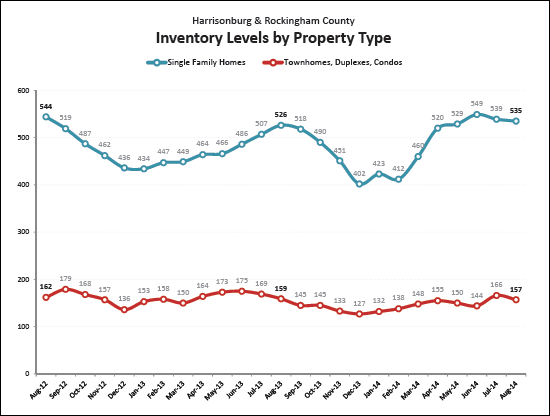 click here for a larger version of this graph As shown above, the number of homes for sale fluctuates greatly through the year --- but the degree of fluctuations differs between single family homes and attached dwellings (duplexes, townhouses, condos). Single Family Homes 36% increase in homes for sales between Dec 2013 and Jun 2014. Duplexes / Townhouses / Condos 13% increase in homes for sales between Dec 2013 and Jun 2014. Thus, we are likely to see inventory declines over the next few months --- but the majority of those declines will be in single family homes. | |
Median Sales Prices Stable Despite 5% YTD Decline in Home Sales |
|
 Featured Property: 3273 Barrington Drive, Harrisonburg, VA I just published my monthly report on the Harrisonburg and Rockingham County real estate market. Jump to the full online market report, or download the PDF, or read on for highlights.... 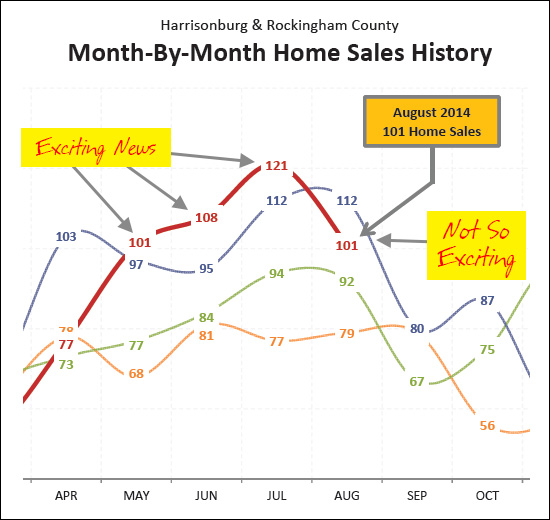 If you can sort through all of the lines and arrows above, you'll note that August 2014 home sales (101) fell short as compared to August 2013 (112). After three great months in a row (May, Jun, Jul) it seemed that August was going to push us over the top and catch us up in 2014 to last year's pace of home sales. Not so. Maybe in September?? 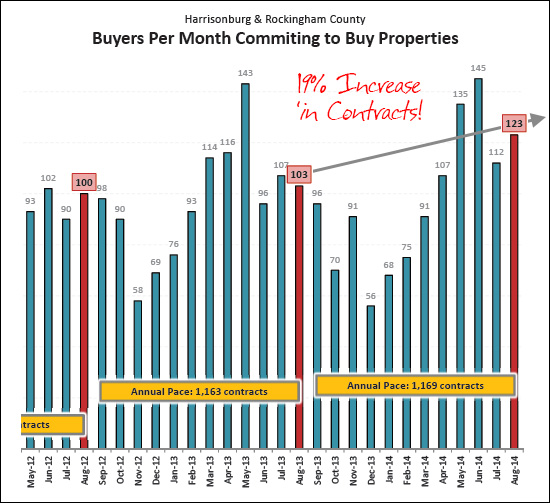 There is, in fact, some cause for optimism. As shown above, there was a 19% increase in contracts between August 2013 and August 2014 --- and the annual pace of contract signing (1,169) is ever so slightly above where it was a year ago. 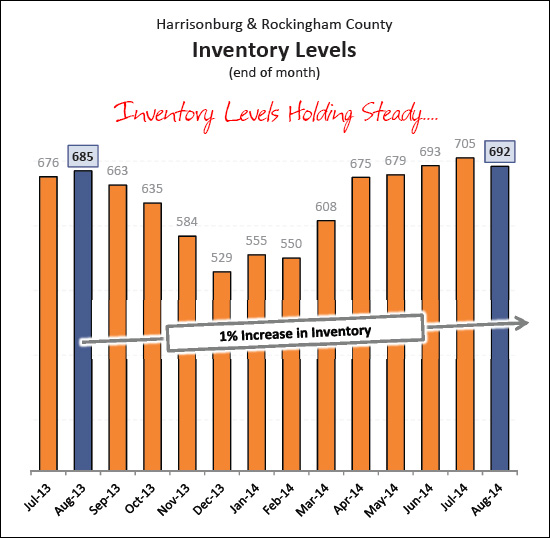 Amidst slightly slower home sales, and slightly higher contract numbers, inventory levels (as shown above) are holding steady. We will likely start to see these inventory levels starting to decline as we continue through the Fall. 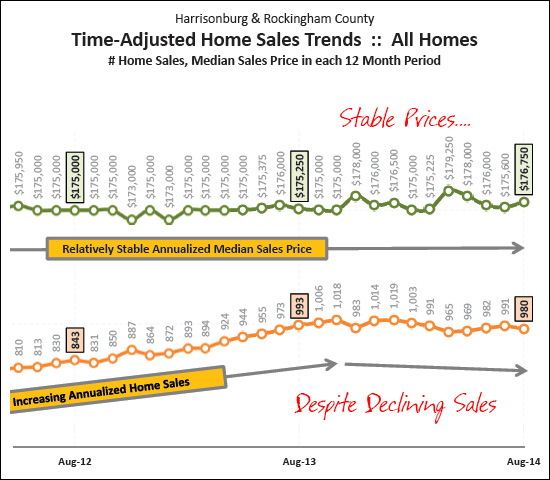 Despite sales declining (5% YTD) sales prices are staying relatively steady, as shown above. This graph is measuring a "rolling 12 month" value for both the number of and median price of home sales in our area. Care to read about all of the exciting details of this month's market report? You can read it online or download the PDF. Also, as always, if you're interested in talking to me about buying a home in Harrisonburg or Rockingham County.....or if you are interested in selling your current home.....just drop me a line by email (scott@HarrisonburgHousingToday.com) or call me at 540-578-0102. | |
High end home sales lagging slightly behind in 2014 |
|
Looking at high end home sales ($500K or higher) it would appear that the pace of sales in 2014 won't necessarily match that of 2013.... 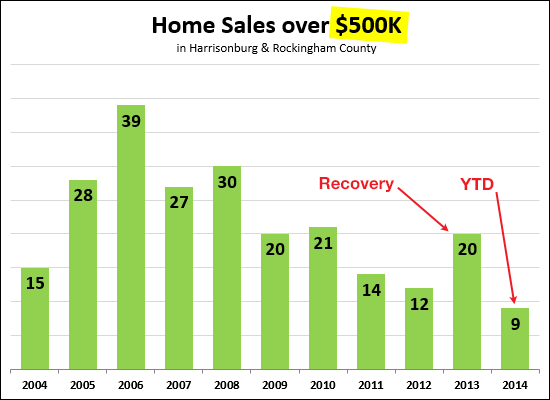 As shown above, home sales over $500K bounced back considerably in 2013. Perhaps some of that was pent up demand from previous years? It seems unlikely that we'll end up with 20 sales over $500K in 2014. 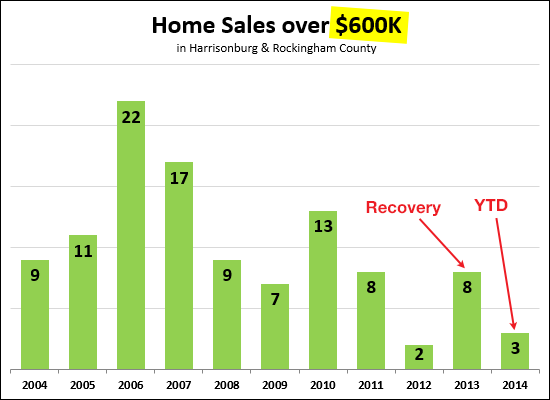 As shown above, home sales over $600K also are not faring as well this year as compared to last year. 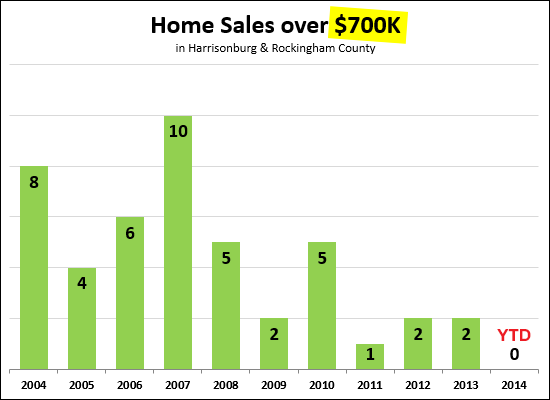 The graph above would certainly lead us to believe that home sales over $700K will definitely take a hit in 2014. However, it's not all bad news, as there are currently four homes priced over $700K that are under contract.... 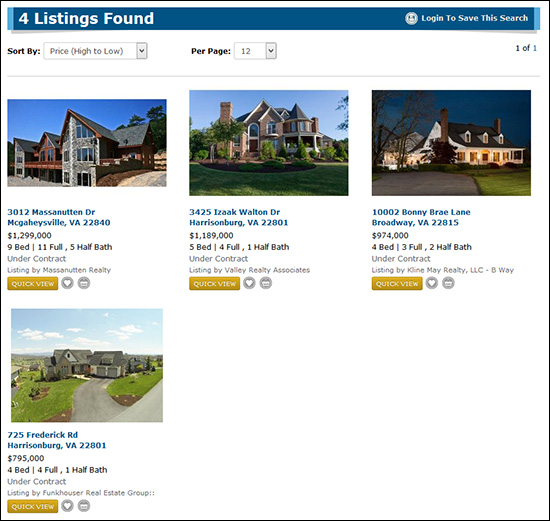 | |
Nearly half of all sellers provide buyers with closing cost assistance |
|
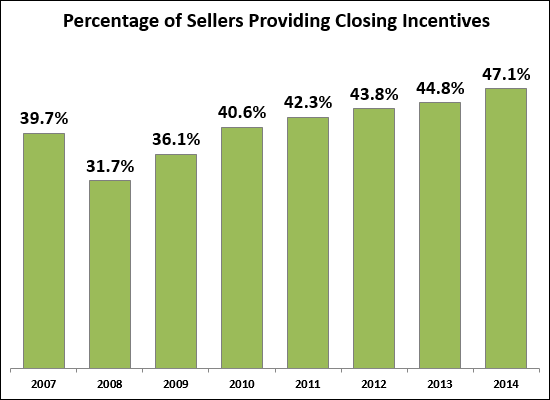 As you can see above, an increasing percentage of real estate transactions have some sort of "seller concession" -- which is usually a credit from the seller to the buyer to help pay for closing costs. Sometimes it could also be related to repairs that have not been completed. I suppose that while it is true that an increasing number of sellers are providing closing cost assistance to buyers -- it is also likely true (perhaps even truer) that an increasing number of buyers need closing cost assistance. How much money is changing hands here? Let's take a look.... 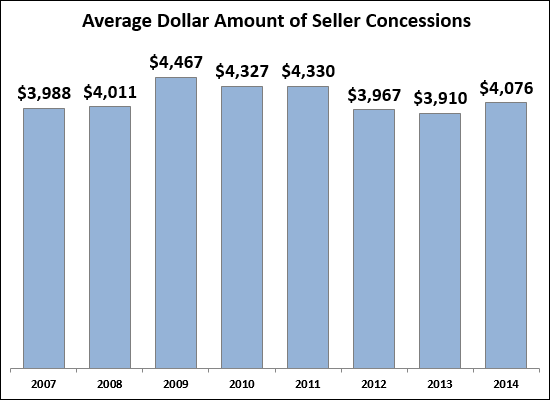 | |
62% of our home sales market is under $200K |
|
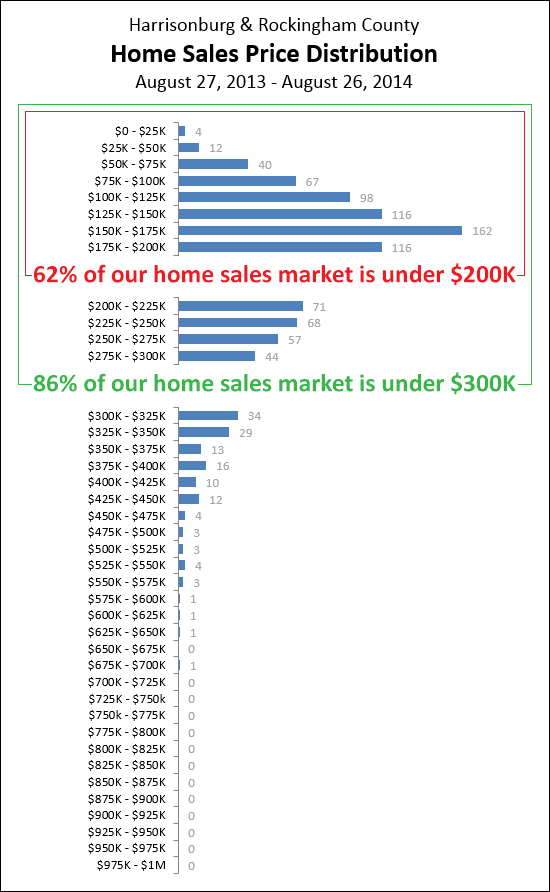 A few fast facts for you....
| |
| Newer Posts | Older Posts |
Scott Rogers
Funkhouser Real
Estate Group
540-578-0102
scott@funkhousergroup.com
Licensed in the
Commonwealth of Virginia
Home Search
Housing Market Report
Harrisonburg Townhouses
Walk Through This Home
Investment Properties
Harrisonburg Foreclosures
Property Transfers
New Listings

