Trends
| Newer Posts | Older Posts |
Massanutten Resort Real Estate Market Update |
|
 Let's take a look at how home sales have been trending at Massanutten Resort in recent years.... 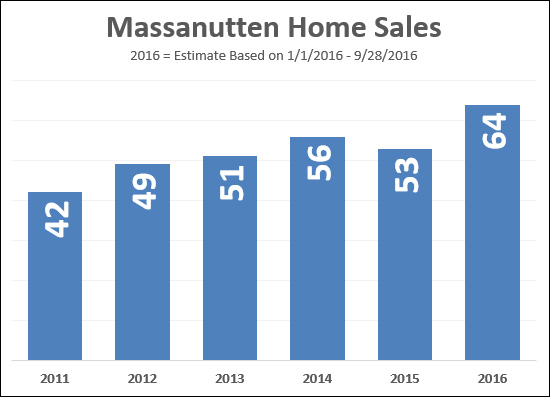 As shown above, home sales have been increasing at Massanutten Resort over the past five years, with the exception of a small decline in 2015. Of note -- there have already (as of 9/28/2016) been 52 home sales in 2016 -- so we are likely to see more home sales this year in Massanutten Resort than in any of the previous five years. The 64 home sales shown above for 2016 are an estimate based on year-to-date home sales (52) and the timing of sales in 2015. 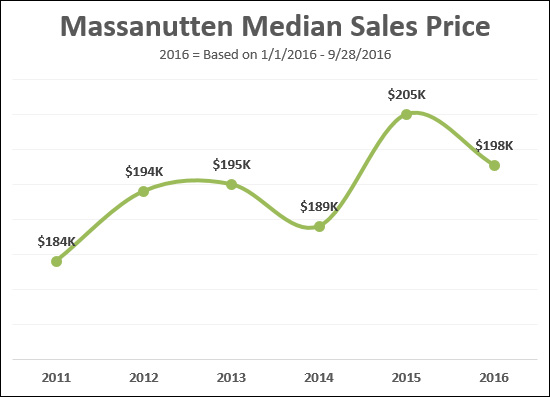 Value trends over time at Massanutten Resort don't paint quite as clear of a picture, but it can certainly be said that home values have been, generally speaking, increasing over the past 5 - 6 years. Values dipped down a bit more than expected in 2014, jumped up a bit more than expected in 2015, and are where we might have otherwise expected them to be in 2016 if we hadn't had that odd low and odd high. This is a relatively small data set (40 - 60 home sales) which can cause some irregularities in value trends. You can find homes currently for sale in Massanutten Resort here. Let me know if you have any questions about the Massanutten Resort real estate market! | |
Showings Up, Down, Up, Down, Up, Down |
|
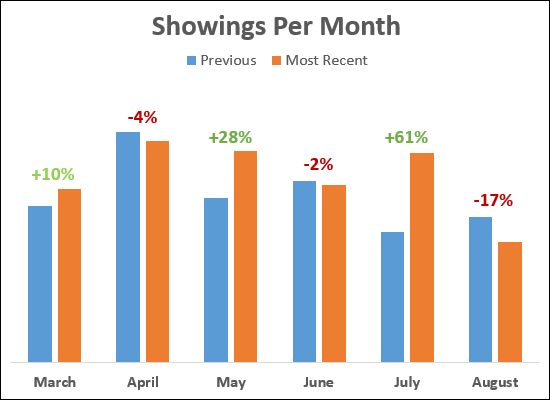 It has been hard to see the overall trajectory of showings this Spring/Summer as compared to last Spring/Summer since we have had both better and worse months of showings. Let's summarize a bit.... Mar/Apr/May 2016 as compared to Mar/Apr/May 2015 = 10% increase Jun/Jul/Aug 2016 as compared to Jun/Jul/Aug 2015 = 11% increase So, while each individual month might be better or worse than the next, it seems that showings are, overall, increasing this year as compared to last year. | |
Are home sales trends catching up with population growth? |
|
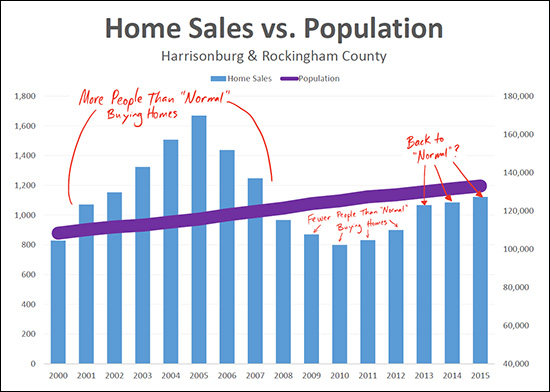 click here for a larger image The Weldon Cooper Center 2015 Population Estimates show that Harrisonburg and Rockingham County are growing, as usual. 2015 Population Estimates: Harrisonburg: 53,875 Rockingham County: 79,134 Combined City/County: 133,009 (up 1% from 131,565 last year) If we take 2000 home sales as a baseline portion of the population to be buying in any given year, and then we project forward based on actual population growth, we can conclude that.... More people than usual bought between 2001 and 2007. (housing boom) Fewer people than usual bought between 2009 and 2012. (housing bust, and then recovery) In 2013/2014 we may have finally returned to a "normal" portion of the local population to be buying in a given year. Based on the data presented above, I believe the new "normal" number of people to be buying per year may be around 1,100. | |
Fall is not the worst time to sell your home |
|
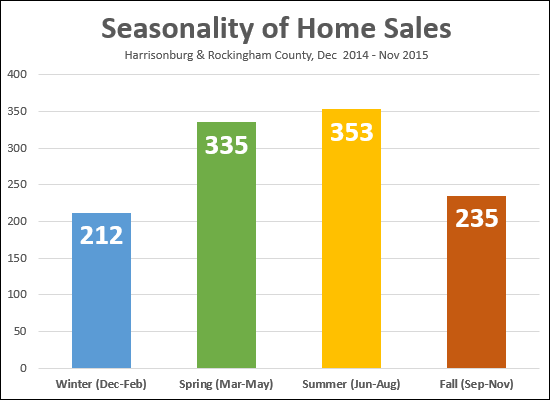 It is, however, the second-worst time of the year to sell your home. The data above reflects the timeframe during which properties went UNDER CONTRACT -- not when they closed. Plenty of the Summer contracts turned into Fall closings -- but the 235 figure is a reflection of how many buyers made buying decisions (signed contracts) between September and November of last year. So....if you want to sell your home (and close on it) in 2016, you should be thinking about getting it on the market sooner rather than later. | |
Housing costs stay relatively level despite increasing home values |
|
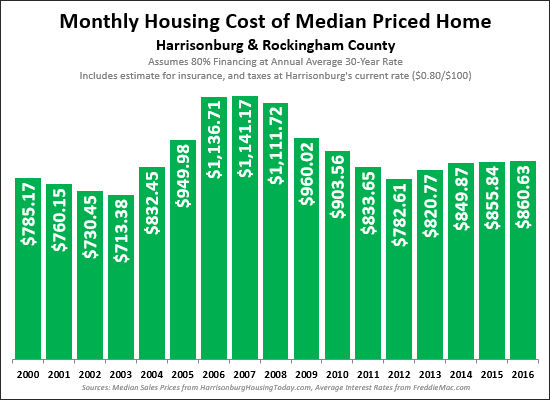 How much does it cost on a monthly basis to buy the median price home in our area, assuming 80% financing? Today, that adds up to an $681 monthly payment -- which is right in the same ballpark as what we've seen for the past two years ($850, $856). How can housing costs be staying relatively level if home values are increasing? Well, it's the declining mortgage interest rates, of course! The graph above shows how much you would pay in a monthly payment for each of the past 16 years if you financed 80% of the purchase price at the average interest rate for that year. These payments include an estimate for your insurance costs, and property taxes based on Harrisonburg's current rate of $0.80 per $100 of assessed value. Another pretty wild perspective -- over the past 16 years, housing costs (understood as outlined above) have only increased by 9.6%. | |
Buyers have fewer and fewer choices of homes to purchase these days |
|
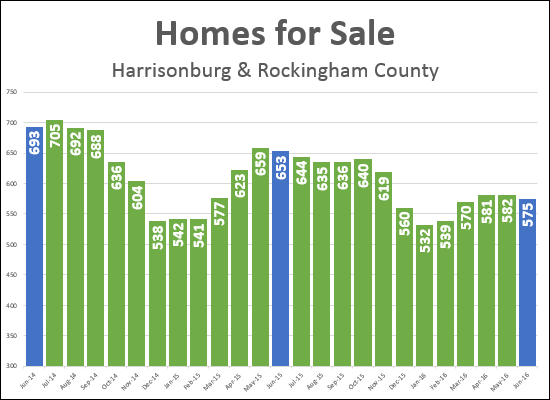 click here for a larger image Buyers have fewer and fewer homes to choose from these days. The blue bars above show that there were 693 homes for sale at this time two years ago -- 653 homes for sale at this time one year ago -- and only 575 homes for sale today! This decline in inventory has helped create a more balanced market -- but can also lead to a frustrating home search for many buyers, depending on their desired price range and location. | |
If you bought in X then your house is likely now worth Y |
|
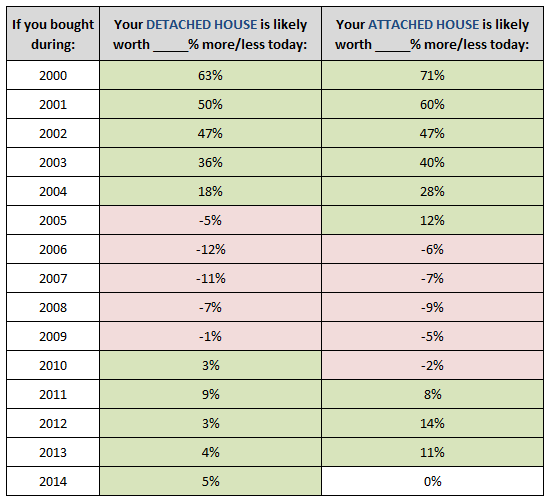 The chart above is calculated based on comparing the 2015 median sales price to the median sales price in each of the prior 15 years. Several key points to take away from this chart....
| |
Buyers Slow to Respond in August, September |
|
 Fewer buyers signed contracts to buy homes in August and September of 2015 as compared to the same month last year. Let's hope for an increased pace of signed contracts in October and November! | |
Foreclosures Continue to Decline in 2015 |
|
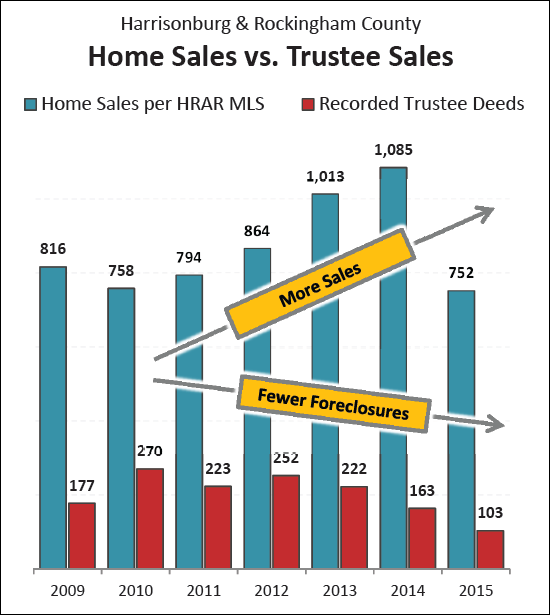 After peaking in 2010 at 270 completed foreclosure sales in Harrisonburg and Rockingham County, we have seen declines in nearly every year since then -- down to a total of only 163 foreclosure sales last year -- and a projected 154 this year. This decline in the number of foreclosed homes (and thus decline in the number of sales of banked owned homes, potentially at lower-than-market-value) is helping to continue to stabilize our local real estate market -- and it means fewer people are losing their homes due to their inability to make their mortgage payments. Good news on both fronts! | |
Record Setting Year for High End Home Sales |
|
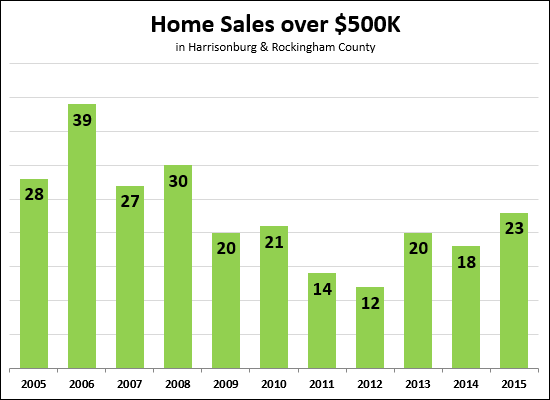 Only 75% of the way through the year, we have already seen more (23) home sales over $500K during 2015 than we saw in the entirety of any of the past six years. This is a promising sign for owners of homes valued over a half million dollars. 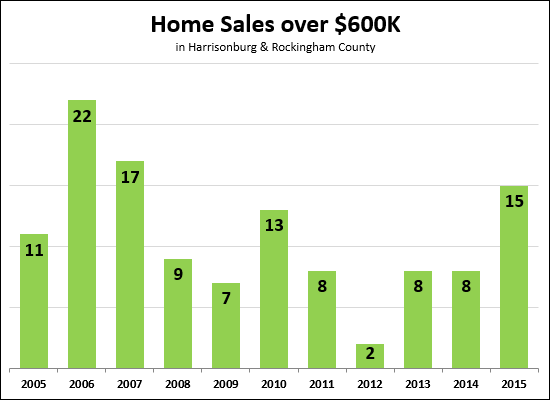 Looking a bit deeper we see that a tremendous number of those home sales were over $600K. We have seen 15 home sales over $600K in the first nine months of this year -- well more than any seen in the past seven years. 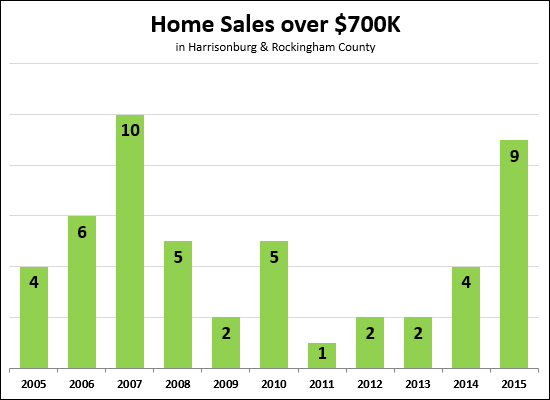 And finally, we see that quite a few of these home sales were actually over $700K! There have been more $700K+ home sales in the first nine months of 2015 than we have seen in the past four years COMBINED! | |
Fear not, folks, mortgage interest rates are still below four percent |
|
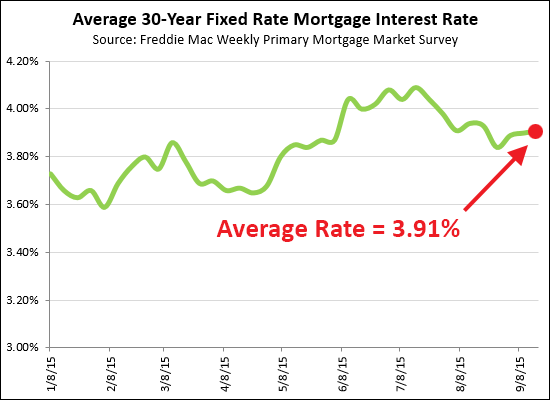 For the past few years everyone has been thinking, saying, predicting that interest rates would rise. We're going to get back to 6% -- maybe higher. Or, maybe not. Taking a look at average mortgage interest rates, as I do around the middle of each month, we find that we're still below four percent. Thus, great opportunities still exist to lock in your housing costs at historically low levels relative to the interest rate on your fixed rate mortgage. Let me know if you'd like a recommendation of a lender to speak with if you are considering a purchase or a refinance. Here's to more low, low, super low interest rates!!! | |
Showings Slow Despite Strong Sales |
|
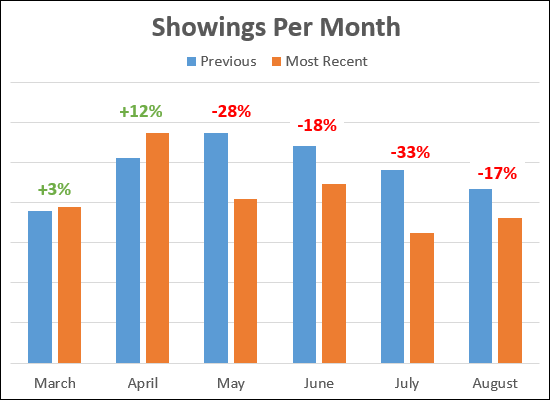 Sales are up 8% this year -- but showings have been down (year-over-year) for the past four months. Any number of theories could (partially) explain this....
Other theories? | |
The under $200K market is the healthiest |
|
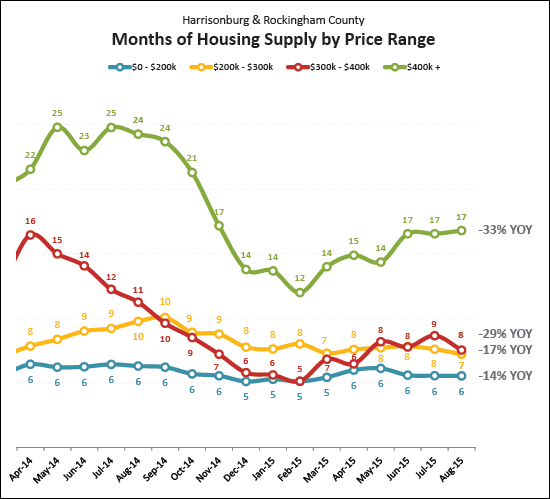 "Months of Housing Supply" is determined by dividing the number of buyers buying (on average over the past 12 months) into the number of sellers selling (number of current listings). This graph (above) does so for each of four different price ranges in our local market. Here's what we find.... Under $200K
| |
Inventory levels are at the lowest levels we have seen in at least seven years |
|
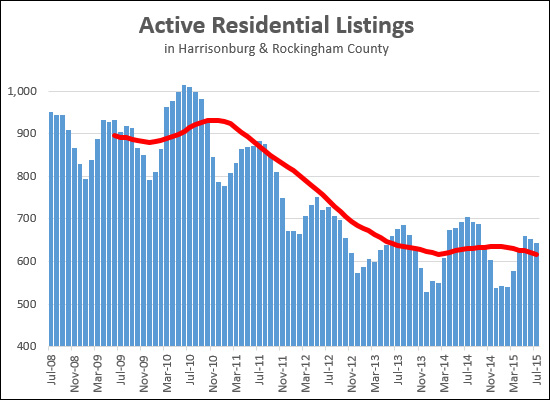 If you think there aren't many homes for sale, it's because there aren't many homes for sale. The graph above shows how inventory levels in our area have shifted downward over the past seven years. Looking at inventory levels at the start of each August, here's what we find....
Past years indicate that we will likely see inventory levels continue to decline over the next five to six months. | |
30 Year Mortgage Interest Rates Dip Below 4%, Again |
|
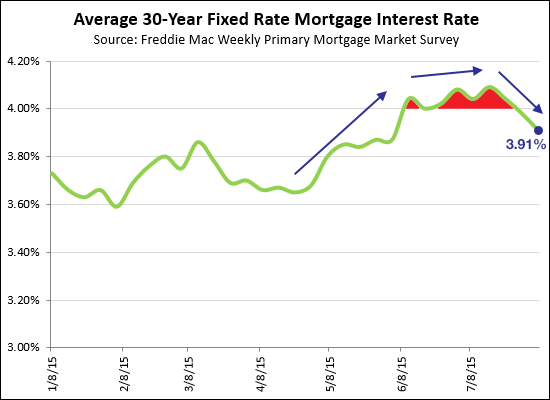 Home buyers enjoyed mortgage interest rates below 4% for the first five months of this year -- and they even dropped as low as 3.6% in February. But after rates started rising in mid-April, they did not stop at 4% -- they kept on rising, and stayed largely above 4% for much of June and July. But no longer! Just when you thought mortgage interest rates were going to keep on climbing, to 4.5%, 5%, 5.5%, 6% and beyond -- they dropped again! The average mortgage interest rate for a 30 year fixed rate mortgage has again been below 4% for the past two weeks. Despite numerous false alarms of interest rates getting ready to go up, up, up over the past few years -- it still has not happened. I'm sure the rates will eventually go up, and yes, that will affect your monthly payment relative to your home's purchase price -- but for now, we can continue to enjoy these super (super) low interest rates below 4% -- yet again. | |
Market segments under $300K are the healthiest |
|
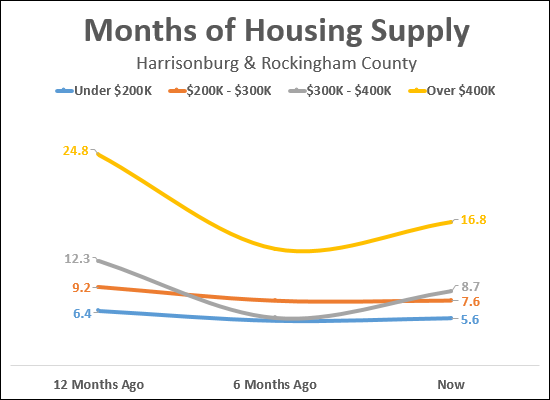 The "months of supply" illustrated in the graph above shows how many months it would take to sell all homes currently listed for sale in each price range given the current pace of buying activity in that price range. As you can tell, each price range is performing differently. Let's take a closer look....  The good news, as shown above, is that over the past 12 months, all price ranges have seen a decline in the months of housing supply available on the market for sale. The decline in the months of supply available ranged from 13% to 32%. But when we look changes over the past six months, we find a bit of a different phenomenon....  As shown above, almost all price ranges are seeing more months of supply available now as compared to six months ago. The largest increase in housing supply has been in the $300K - $400K price range with a 56% increase in months of supply over the past six months. The only price range that did not experience an increase in available housing supply has been the $200K - $300K price range. A few concluding thoughts....
| |
August 2015 Harrisonburg Housing Market Report: Home Sales Up 6%, Prices Up 7% |
|
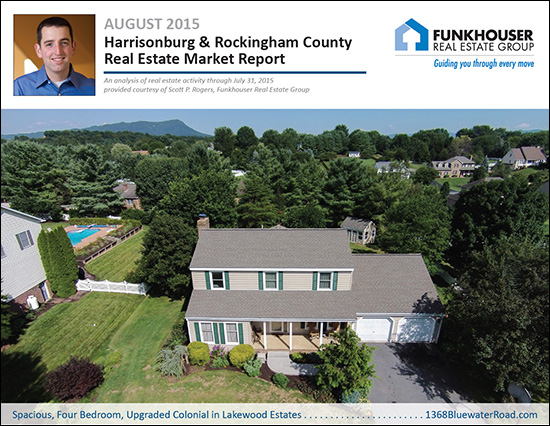 Learn more about this month's Featured Property: 1368 Bluewater Road I just published my monthly report on the Harrisonburg and Rockingham County real estate market. Jump to the full online market report, or download the PDF, or read on for highlights.... 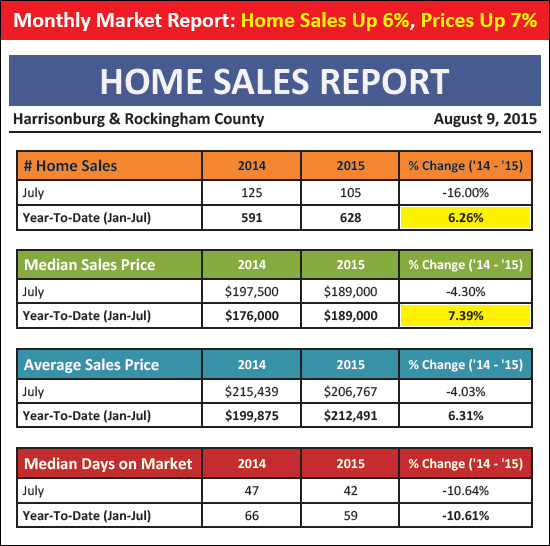 First, the fun news. As noted above, when looking at 2015 YTD home sales, you'll find that the market has shown a 6% improvement over last year in the pace of sales -- and that the median sales price has risen by 7%. Both of these are signs of a strong, growing local real estate market. A third indicator to note is that the median time it takes for a house to go under contract (days on market) has fallen 11% over the past year. 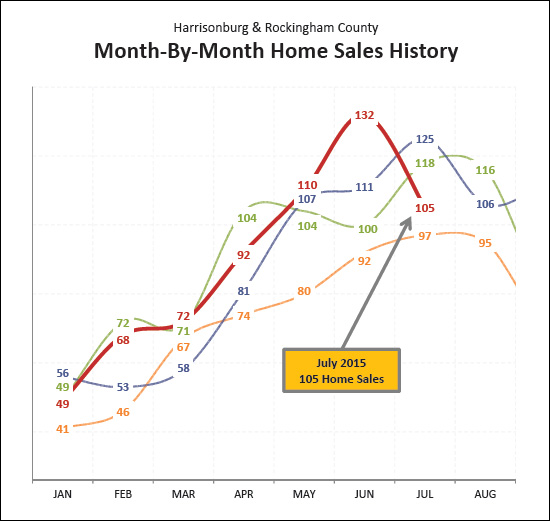 You may have noted that July 2015 home sales (105) were a good bit below July 2014 home sales (125). It turns out the seven year high of 132 home sales seen in June 2015 may simply been a timing phenomenon. When combining June and July home sales, there were 237 home sales in June/July 2015 as compared to 236 home sales during June/July 2014 --as such, the two month track record for June and July is on pace with last year despite the decline in monthly sales in July 2015. 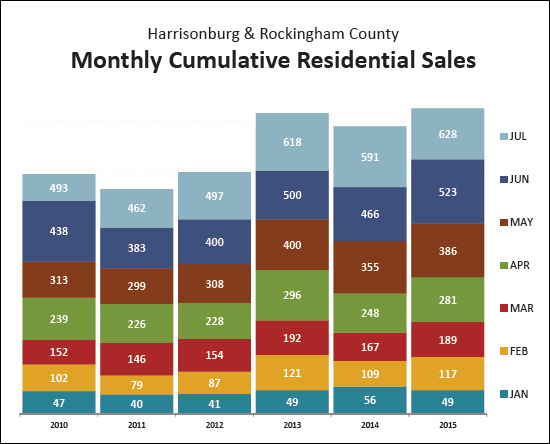 Looking, graphically, at the first seven months of home sales during 2015 (above) you can see that we're a good bit ahead of 2014 (YTD) and that this is the strongest January - July sales pace we have seen in at least the previous five years. Looking back further into the historical data, it seems that the last time we saw 628 (or more) January - July home sales was waaaay back in 2007. 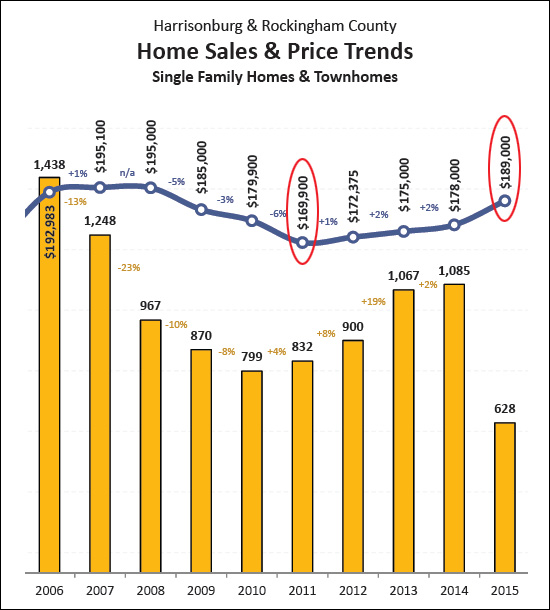 While every market segment (price range, property type, neighborhood, specific house) has performed differently over the past four years -- it is certainly a welcome sign to see a nearly $20,000 increase in the median sales price over the past four years -- after having seen a $25,000 decline from the peak in 2007/2008. 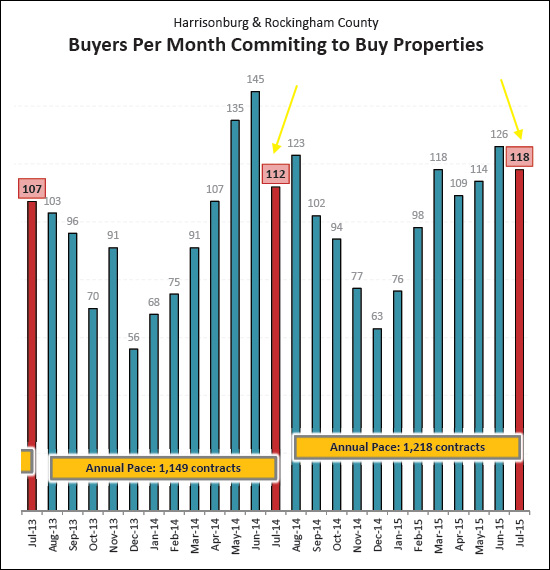 After several months of year-over-year declines in the monthly pace of contracts being signed, we did see (above) a year-over-year increase during July 2015 with 118 contracts being signed by buyers (and sellers). We are likely to see 100+ contracts during August, and quite possibly into September and October as well. OK, that's it for now. I'll hit some high points here on HarrisonburgHousingToday.com in coming days. In the meantime, you can read the full August 2015 Harrisonburg Housing Market Report online or by downloading the PDF. And as is always my encouragement -- if you will be buying or selling a home in the near future, become a student of the housing market! Learn what has been happening recently, what is happening now, and what is likely to happen next. Being informed will allow you to make better real estate decisions.If you are ready to buy or sell a property in Harrisonburg or Rockingham County, contact me at 540-578-0102 or scott@HarrisonburgHousingToday.com to get the process started. | |
July (2015) Home Sales Seeming Cooler Than Past Years |
|
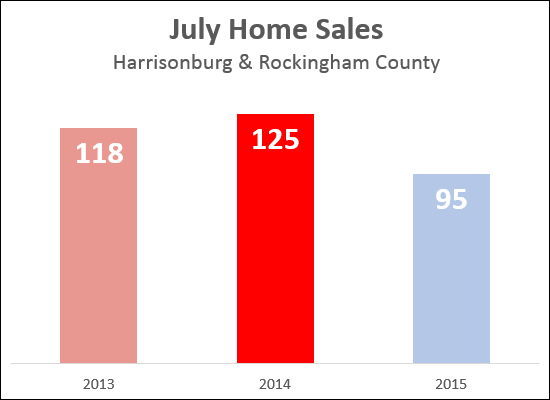 I will hold out a bit longer to see any other home sales that might end up being reported in the MLS in the next few days, but thus far, home sales in July 2015 are coming in a bit lower than the same month in the past two years. Stay tuned for more analysis as the week goes on. | |
Local Market Likely to Hit $225M in Real Estate Sales in 2015 |
|
 Slow increases in the number of sales plus slow increases in the median sales price result in increase in the overall volume of real estate sold in this area. The graph above is based on Jan 1, 2013 - Jun 30, 2015 sales data, so the 2015 figure is a projected figure. It looks like we are on track to get close to, or to surpass 225 million dollars in real estate sales in our local market in 2015. | |
Is August too late to list my home for sale? |
|
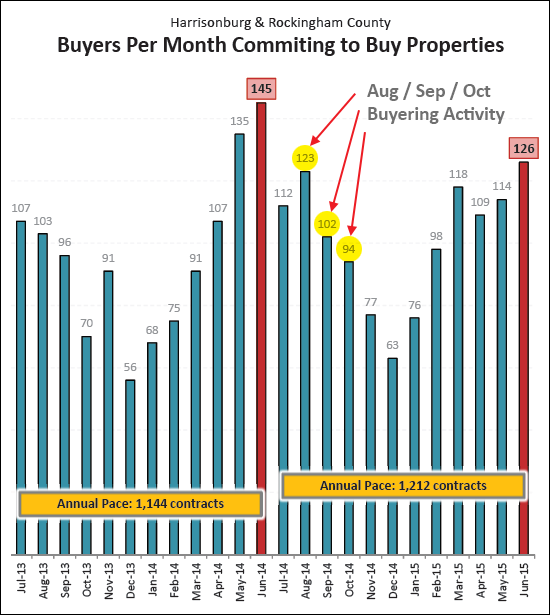 Nope -- it's not too late to list your home in August. While we will have missed the strong Spring and early Summer rush of buyers, there will still be plenty of buyers in August, September and October. As shown above, last year there were more buyers in August than in July! One other silver lining for late Summer (early Fall) sellers -- there will be fewer sellers to compete with as the next month or two passes and inventory levels continue to decline. If you're thinking about putting your house on the market in August, let's chat ASAP about any improvements you will be making to the house as well as reviewing market data to develop a pricing strategy. | |
| Newer Posts | Older Posts |
Scott Rogers
Funkhouser Real
Estate Group
540-578-0102
scott@funkhousergroup.com
Licensed in the
Commonwealth of Virginia
Home Search
Housing Market Report
Harrisonburg Townhouses
Walk Through This Home
Investment Properties
Harrisonburg Foreclosures
Property Transfers
New Listings

