| Newer Posts | Older Posts |
Are all (price) segments of the local housing market recovering equally? Maybe not. |
|
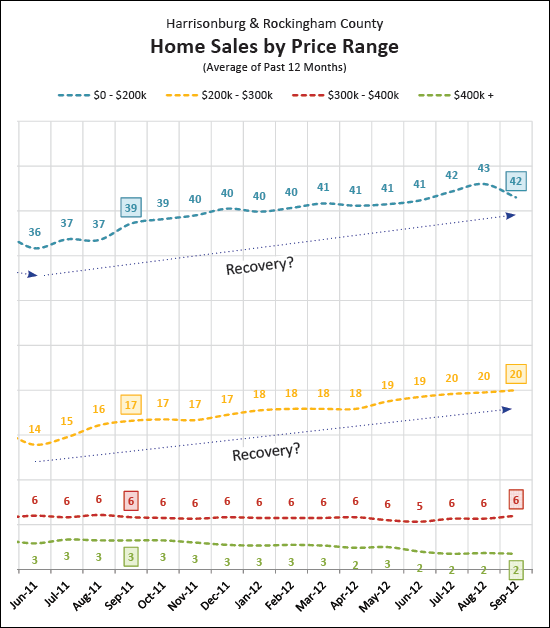 The under $200K segment of our local housing market has recovered nicely over the past 15 months --- improving from an average of 36 buyers per month up to 42 per month --- a 17% improvement in sales pace. The next most affordable price range ($200K-$300K) is also doing OK, having improved by 43% (14 buyers/month up to 20 buyers/month) during the same time frame. But our local housing market's higher price ranges are not faring as well --- with virtually no change in pace in the $300K-$400K segment of the market, and a declining pace of sales in the $400K+ price range. So.....overall, the local housing market is definitely recovering (read more here) but it is not affecting all property types and price ranges equally. Interested in details on how your property value has been affected? Feel free to call me at 540-578-0102. | |
Harrisonburg townhouse market may finally be stabilizing! |
|
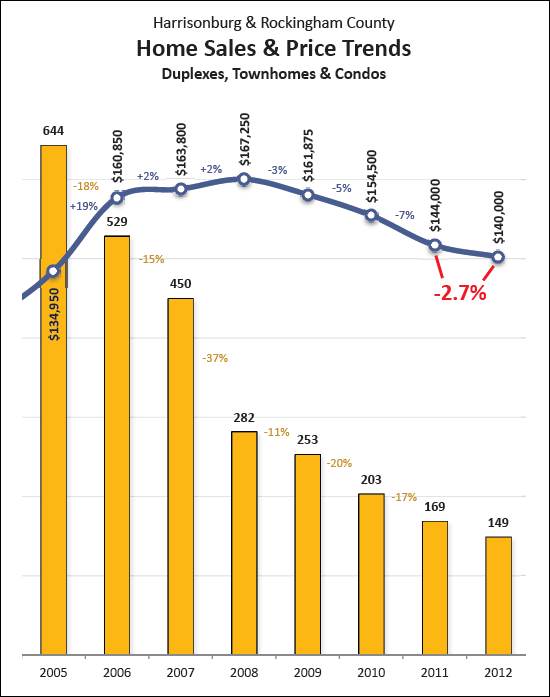 The townhouse market has been hit especially hard in recent years:
But it seems (see the graph above) that the market may finally be starting to stabilize.
You'll find lots more market analysis and commentary in my monthly real estate market report (PDF). Explore Harrisonburg townhouse communities online at HarrisonburgTownhouses.com. | |
Despite mixed signals in September, local housing market continues to show signs of strength and stability |
|
I just published my monthly Harrisonburg & Rockingham County Real Estate Market Report. Download the full PDF here, or read on for some highlights. Despite some confusing and conflicting indicators in September, our local housing market is still stabilizing, and is poised for further growth. 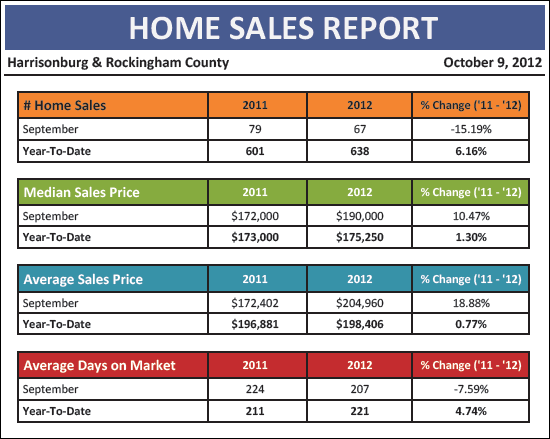 This month particularly, we need to keep the one-month indicators (September) firmly rooted within the context of longer-term trends (YTD)....
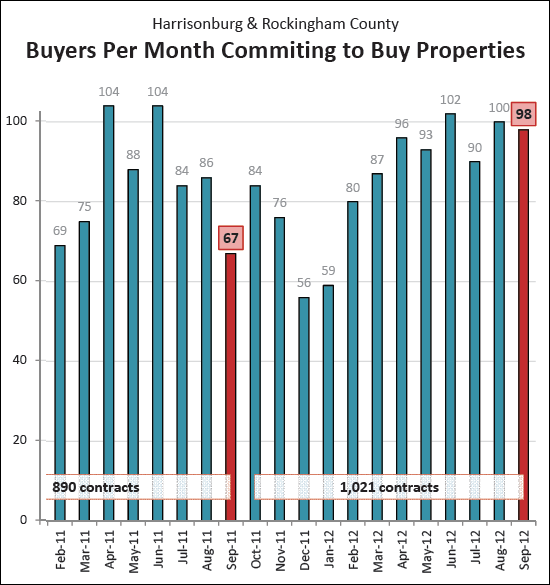 Contracts are up 46% in September 2012 (compared to Sept 2011) but bear in mind that 22 of those contracts were a single buyer purchasing 22 investment properties. 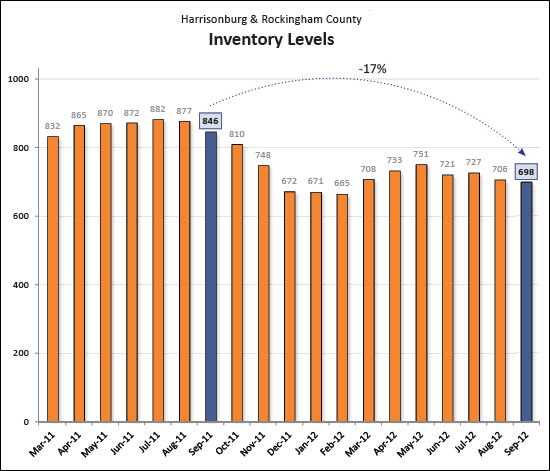 Inventory levels continue to drop in our market, slowly creating a more even balance between buyers and sellers. 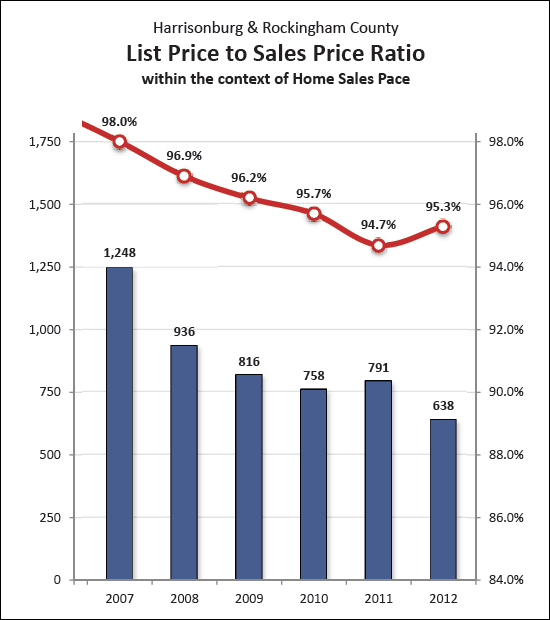 Buyers aren't able to negotiate quite as much these days, as shown above. This is another sign of market stabilization. 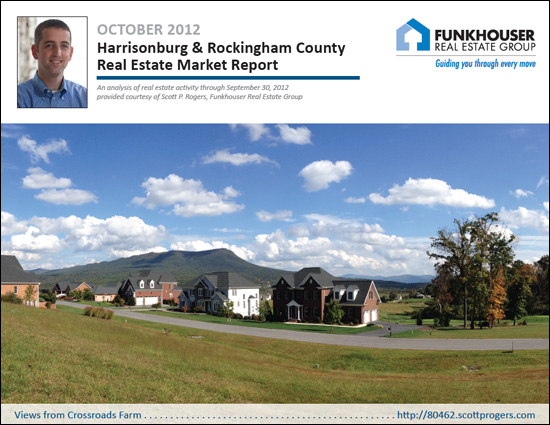 Looking for more analysis of our local housing market? Download the full PDF of my market report here. And, if you have questions about the local housing market, or if I can be of assistance to you with real estate that you own, or that you'd like to own, please be in touch. You can reach me most easily at 540-578-0102 or scott@HarrisonburgHousingToday.com. Oh, one last thing....here are a few articles I have written over the past month that might be of interest:
| |
Sellers, don't despair yet, take a look at buyer activity last October and November! |
|
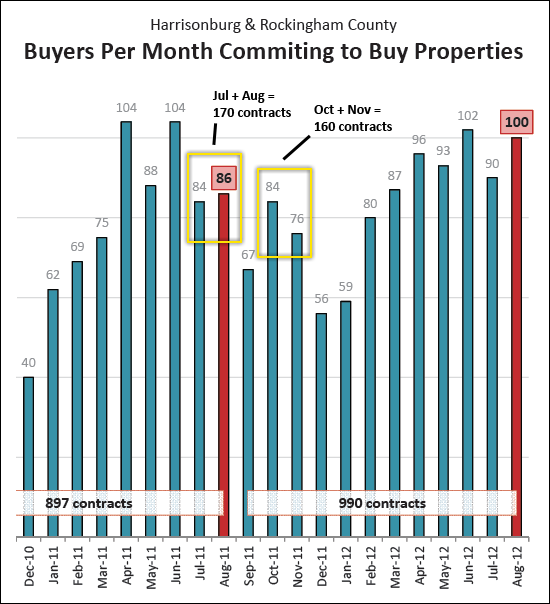 Some sellers are feeling depressed, not having received a contract on their house during the exciting Spring and Summer months of April through August. And since September has now passed, they assume they might as well now wait until Spring to try selling again. But wait --- if we look at last year's contract trajectory, we need not be discouraged....
We should still have two more active months of buyers writing contracts before the market does slow down for its two slowest months of the year --- December and January. | |
Did you miss the HOT spring and summer market? Selling in the fall isn't so bad after all. |
|
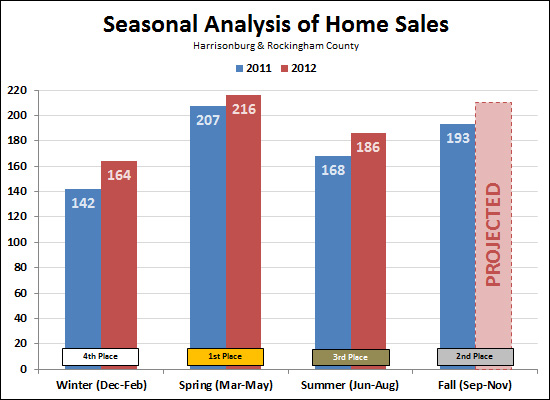 As shown above, the Fall market last year (blue, 193 sales) was actually much active in Harrisonburg and Rockingham County than the Summer market. If that trend continues, we are likely to see a very strong Fall market this year -- perhaps with as many as 212 home sales. As it turns out, the seasons stacked in order of activity seem to be Spring, Fall, Summer, Winter! Projected Fall sales are based on average 2012 seasonal sales increase of 10% during Winter, Spring and Summer. | |
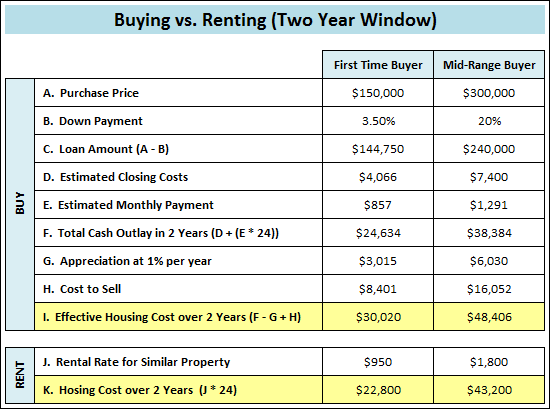
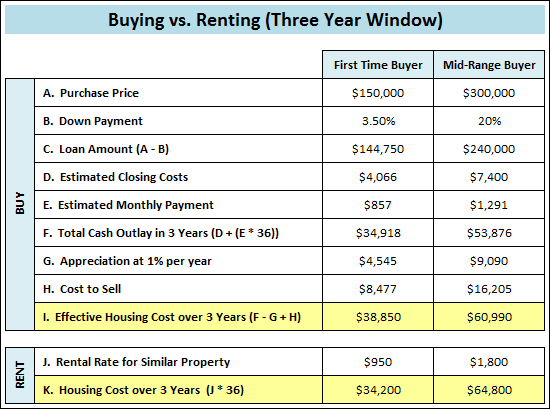
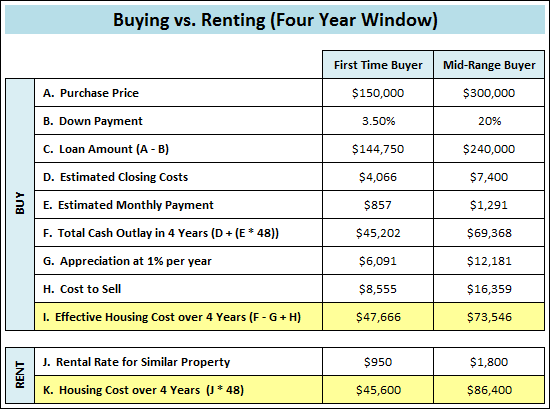
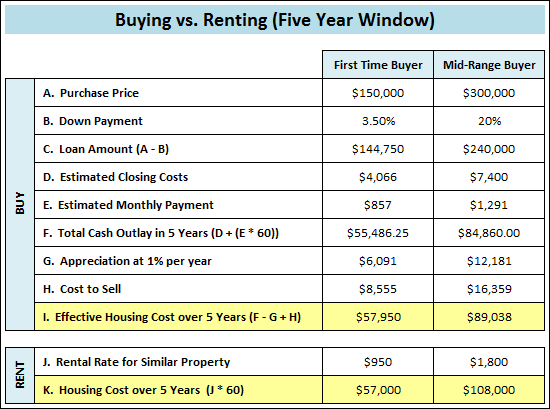
Should I buy a home if I am only going to be there for two years? |
|
It depends on the price range, how much of a down payment you are making, whether you are willing to keep the property as a rental property after you move out, and many other factors. However, below is a 2-year, 3-year, 4-year and 5-year analysis of buying versus renting a property valued at $150K compared to $300K, which shows that....
There are, of course, plenty of extenuating circumstances. Many people might buy a $150K house (or townhouse) even if they are planning to be there for only 3 years --- because they want their own home (not their landlord's), or to get in a certain neighborhood, or because of the tax benefits (not shown below). Every buyer's situation is different, and I'd be happy to help you run an analysis similar to those shown below if you're interested in analyzing your best housing move.
| |
Don't rely on Zillow Zestimates for an estimate of your home's value in Harrisonburg, Rockingham County |
|
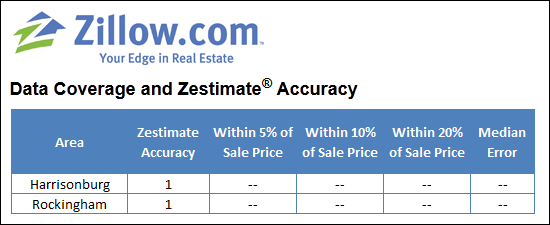 If you do some digging on Zillow.com, you will see they rate their confidence in their estimate by each geographic area. A rating of five means they are most confident in the value. A rating of one means they are either using the tax assessed value or "unable to compute Zestimate accuracy". 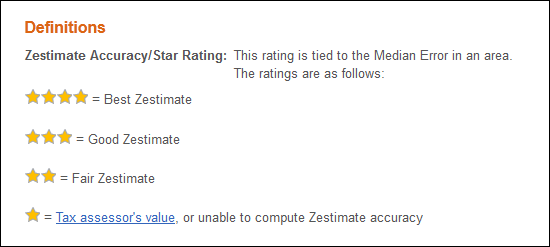 As you'll note above, Harrisonburg scores a ONE by their own admission. This means that their value estimates are information is totally unreliable. You can read more about this on Zillow's website. So before you put too much stock in what Zillow might tell you about your home's value --- remember that they themselves would tell you that their value estimates in Harrisonburg and Rockingham County are not at all accurate. | |
Harrisonburg home sales surge ahead 16% in August 2012 |
|
Exciting things are happening in the Harrisonburg and Rockingham County housing market. Click here to download my monthly market report (28 page PDF), or read on for some highlights. 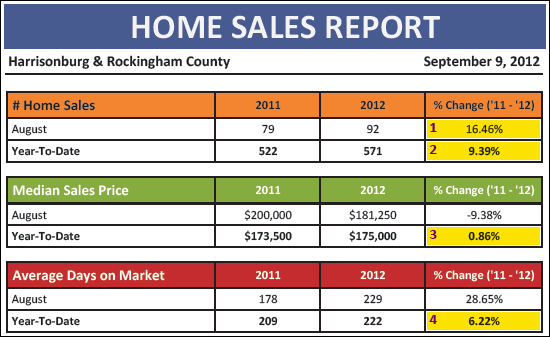 As shown above, indicators were mostly positive in August....
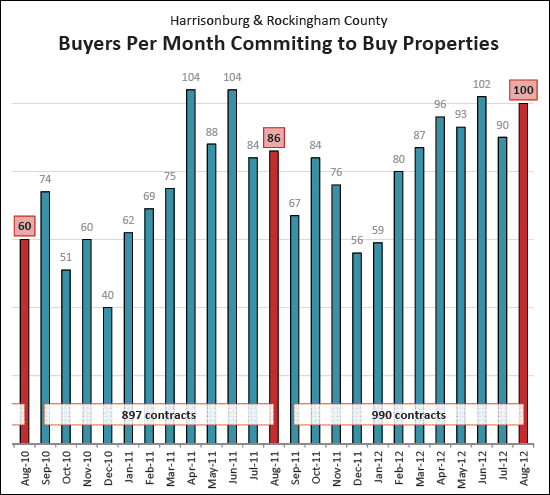 Contract activity also surged in August 2012 --- showing a 16% increase over August 2011 --- and a 67% increase over August 2010! This is certainly a good sign for the coming months of closed sales data. 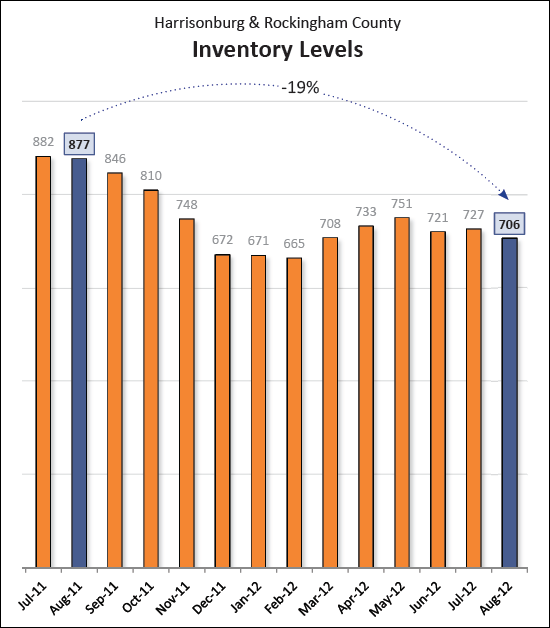 Declining inventory is certainly helping our local housing market head back towards more of a balance between buyers and sellers. The number of homes for sale has decreased by 19% over the past year. 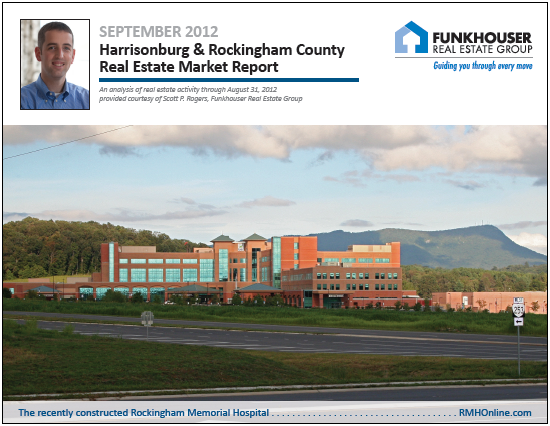 Click on the image above to download my full market report (28 page PDF). Also, here are a few articles I have written over the past month that might be of interest:
| |
August was good to us; positive trends continue.... |
|
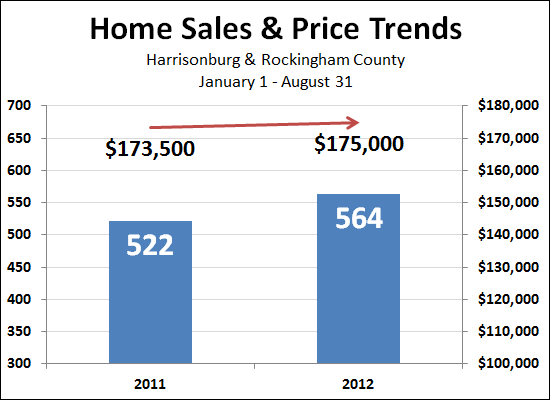 Home sales have increased (2012-YTD as compared to 2011-YTD) and so have median prices. These prolonged trends are slowly leading us back towards a more balanced local housing market. Jan 1, 2011 through Aug 31, 2011 = 522 (median price = $173,500) Jan 1, 2012 through Aug 31, 2012 = 564 (median price = $175,000) | |
Has the local housing market started stabilizing and/or recovering in all price ranges equally? |
|
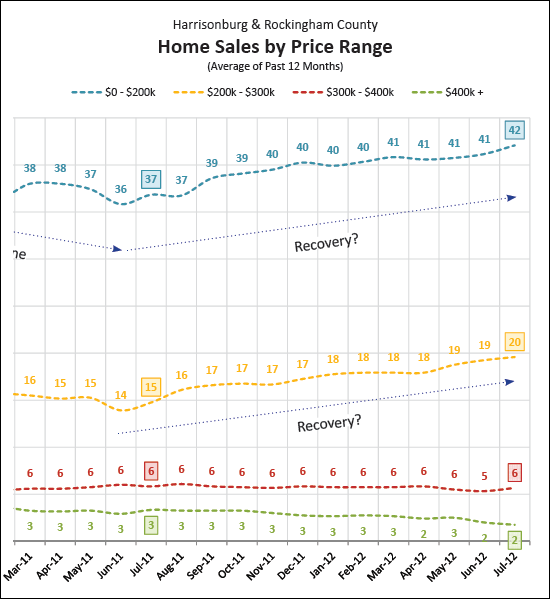 Yesterday, I was chatting with two different people about the housing market and both were wondering how the potential local recovery (or at least stabilization) impacted different price ranges. The increased pace of home sales over the past year has not affected all price ranges equally, as shown in the graph above:
The winner, it seems, is the $200K - $300K price range, though the lowest price range (under $200K) is also doing quite well. | |
Is the window of maximum negotiating ability closing? |
|
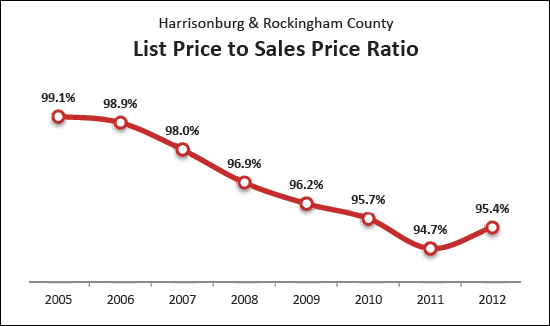 Hidden in yesterday's monthly market report was this new graph that explores the amount that sellers negotiate off of their asking prices. As you can see, at the peak of the market (2005) sellers only negotiated 0.9% (on average) off of their asking price. That metric has since fallen all the way down to 94.7% in 2011 --- well below the assumed normal of 97.4% in 2000, before the real estate market started taking off like a rocket. The important thing to note, though, is that this metric is edging back upwards thus far in 2012 --- to an average of 95.4%. That means that sellers are finding themselves negotiating less on their asking price because of gradual overall market improvements. Sellers -- be encouraged that you won't be beat up as much on price as we move forward. Buyers -- if you want to negotiate heavily on price, consider buying now, not next year. | |
Home Sales Up 8%, Prices Up 3% in Harrisonburg, Rockingham County |
|
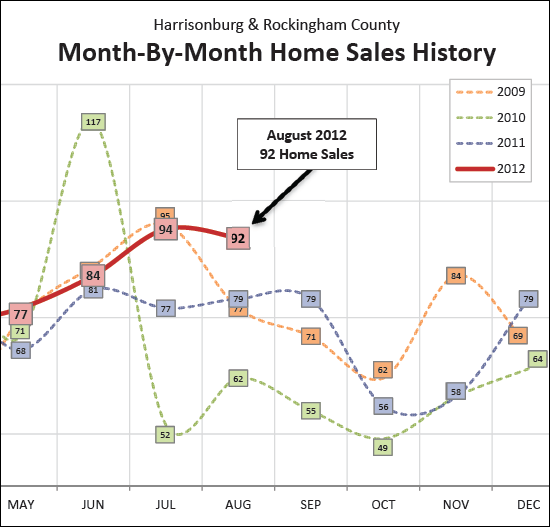
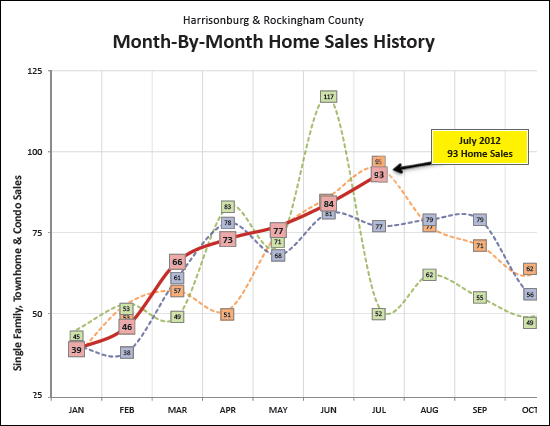
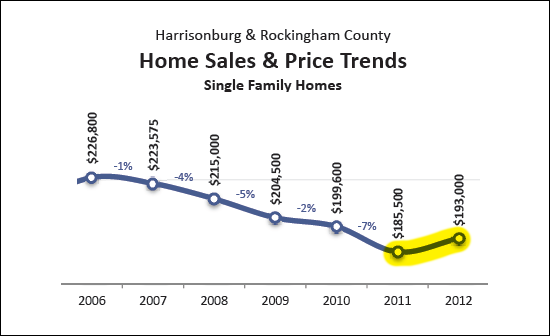
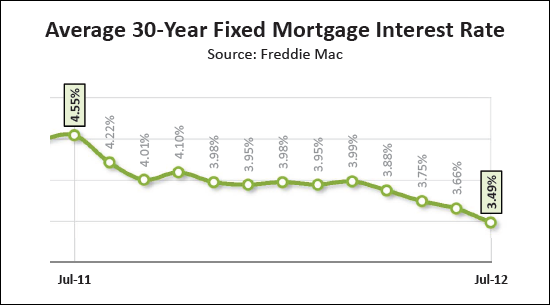
Seven months into 2012, the Harrisonburg and Rockingham County housing market is showing signs of steady improvement in the pace and price of home sales. Click here to download the PDF of my full market report, or read on for highlights. 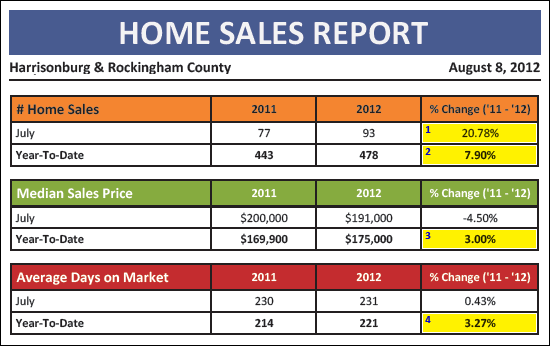 Most indicators above show signs of a stabilizing local housing market:
July 2012 was quite a month for home sales --- and this year has shown a strong upward May-June-July sales trajectory, not unlike the 2009 sales trajectory.
While the graph above only shows price trends for single family homes (not the overall market) it is encouraging (for sellers, at least) to see a halt to the multi-year decline in home prices in the area.
Among other market trends to improve, the list price to sales price ratio has also started to improve in Harrisonburg and Rockingham County. This means that sellers are (on average) negotiating less off of their asking prices when selling their homes. This is more welcome news for sellers --- and buyers should take note that their window of maximum negotiating ability might be starting to close.
Record low mortgage interest rates have certainly helped to spur on the local housing market as buyers continue to take advantage of their opportunity to lock in their housing costs for now and the future. For much more insight and analysis, click on the image above to download my full market report specifically focused on Harrisonburg and Rockingham County. | |
Local Housing Market Shows Signs of Strength in First Half 2012 |
|
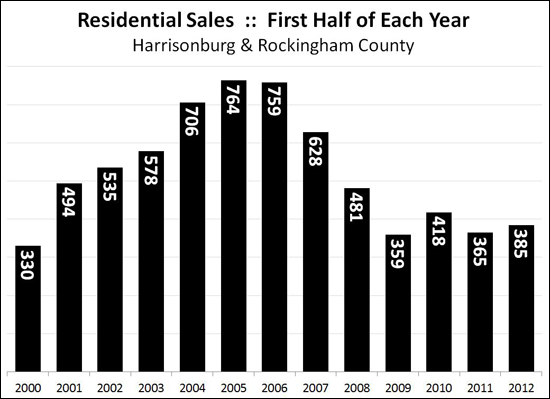 Halfway through 2012, the Harrisonburg and Rockingham County housing market is showing signs of returning stability and strength. As shown in the accompanying graph, the pace of local home sales (in the first half of the year) has been slowly increasing ever since 2009 – aside from temporary spike in 2010 related to the federal home buyer tax credit. In even better news, however, the local market is finally experiencing stability in prices. The median price of homes fell 10.5% between 2008 and 2011, but is finally starting to increase again. The median sales price during the first half of 2012 was $172,000 – which marks a 4% improvement over the first half of last year when the median sales price was $165,000. If you're looking to buy a home sometime in the next year, you will be well served do so sooner rather than later. A changing tide in the local housing market and the historically low interest rates make it a great time to buy. Despite falling inventory levels, you will still have plenty of choices and a good amount of negotiating ability. If you're looking to sell your home in the next year, things will hopefully be brighter and brighter from here. The pace of sales has increased and prices are stabilizing, so hopefully you won't see further declines in your home's value. If you absolutely have to sell now or soon, it shouldn't be as tough to do so as it has been recently --- but if you can wait, you would be well served to do so for another year or two to allow home values to recover further. After two wild five year cycles (up between 2000-2005, and down between 2005 and 2010) we are finally starting to see stability and growth in the Harrisonburg and Rockingham County housing market. The pace of home sales increased in 2011, and is set to do so again in 2012 – and it now appears that we may also see an increase in median sales prices during 2012. | |
Which seller do YOU want to be? |
|
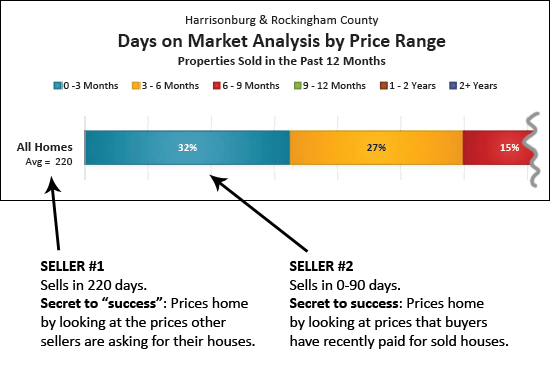 Believe me -- there are an abundance of both types of sellers in the current market. Keep in mind, of course, that all sellers who don't sell in the first 90 days are not necessarily sellers who priced their home based on other list prices instead of sold prices. Sometimes (many times) there are other factors that also affect the speed of the sale. It is important, though (very important!) to be basing your pricing decisions on what buyers are actually paying for houses --- not what long-standing would-be sellers are hoping that buyers will pay for their houses. It is, of course, easier to figure out what would-be sellers are asking for their houses (view any public real estate web site) and harder to easily ascertain what buyers are actually paying for houses. That is where I can help -- if you're getting ready to sell, let's start by reviewing recent sales similar to your house -- not just active listings similar to your house! | |
Preliminary Report: July was a great month for home sales |
|
 Stay tuned for my monthly market report 7-10 days from now. Until then, get excited, as preliminary data indicates that July 2012 was a GREAT month for home sales. July 2011 Home Sales = 77 July 2012 Home Sales = 85 Bear in mind that the July 2012 data does not yet include many of the closings that have happened in the past day or two. | |
Virginia home sales continue to rise, 11% YOY |
|
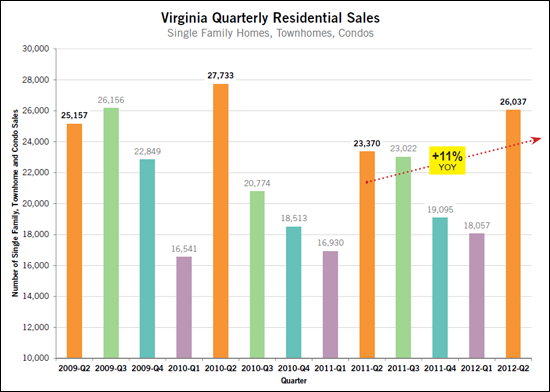 And.....Virginia's median sales price has increased 7.5% year-over-year. Read more in the recently released 2012-Q2 Virginia Home Sales Report. | |
Summer, Fall best time to get low mortgage interest rate |
|
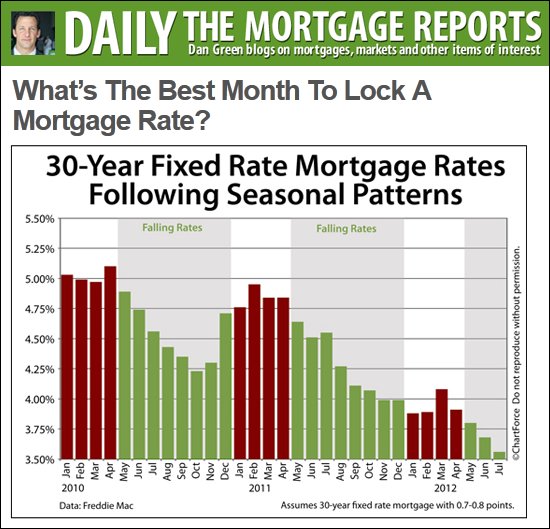 Check out this interesting analysis from Dan Green, showing that interest rates are typically lowest in the summer and fall. Talk to a lender now if you're thinking of buying this summer or fall! | |
How did the first half of 2012 compare to previous years? |
|
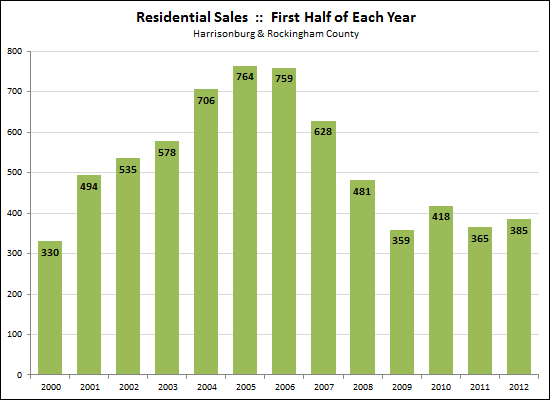 Things to note....
What this means for you....
| |
To rent, or to buy a Harrisonburg townhouse |
|
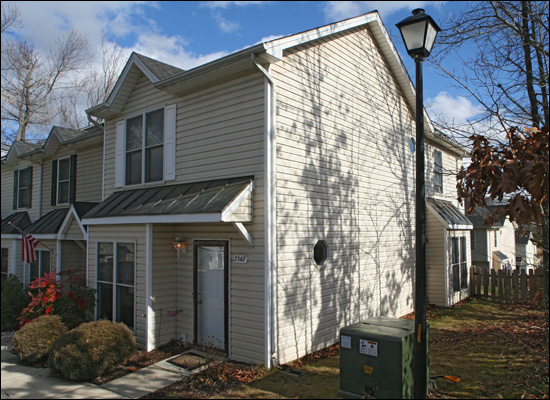 In meeting with a potential buyer of a City townhouse yesterday, we found ourselves comparing the opportunities in buying versus renting. RENT = $900/m. There are regularly options for renting a two-story townhouse in Harrisonburg for $875-$950 in Avalon Woods, Beacon Hill, Stonewall Heights, Liberty Square, etc. BUY = $817/m. With an FHA loan, buying such a townhouse apparently may cost as little as $777 per month assuming a $130K purchase price, 3.25% interest rate, 3.5% down payment.  This shows an $83/month cost savings of buying instead of renting. If we then look at the difference between renting and buying over a five year time period, the advantages start to pile up.  You'll also want to keep closing costs in mind (for buying) but as you can see, there are some compelling reasons to consider buying a townhouse if you are in the market to rent one but know that you'll be in the area for the next five years. The mortgage details were generated using Wells Fargo's online mortgage estimate tool and this is the scenario I was considering. | |
When Do Homes Close in Harrisonburg? |
|
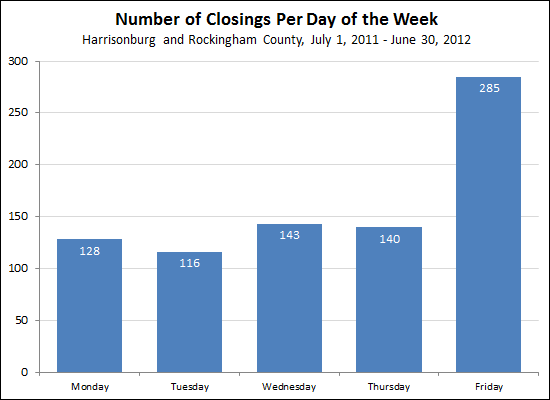
Inspired by Jim's analysis of the timing of closings in Charlottesville, I thought I'd take a look to see how many closings typically happen on each day of the month. 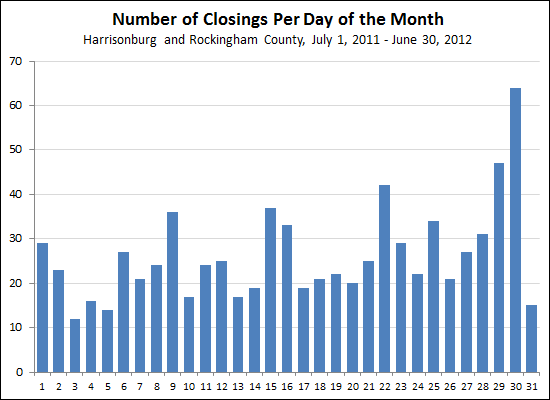 The data above shows how many homes closed in Harrisonburg and Rockingham County on each day of the month for the past year. There are certainly plenty of closings pushed towards the end of the month --- though not as many as I suspected. Buyers often tend to close towards the end of the month to bring less money to closing --- though you the end up owing your first mortgage payment more quickly. August 15 closing
August 30 closing
 | |
| Newer Posts | Older Posts |
Scott Rogers
Funkhouser Real
Estate Group
540-578-0102
scott@funkhousergroup.com
Licensed in the
Commonwealth of Virginia
Home Search
Housing Market Report
Harrisonburg Townhouses
Walk Through This Home
Investment Properties
Harrisonburg Foreclosures
Property Transfers
New Listings

