
Analysis
| Newer Posts | Older Posts |
How long does it take homes to sell in Harrisonburg and Rockingham County? |
|
A recent comment from my blog raises a great question: "Statistical analyses always report "average days on market." As a buyer, I am wondering what a histogram of days on market for houses sold in the last 6 months looks like. In other words, how many houses sold within 1 week? 1 month? 6 months? How many took an entire year to sell?" As this reader points out, I typically only report the average days on market, which isn't very helpful. So, let's take a look at what we'll find when viewing the last six months of home sales in Harrisonburg and Rockingham County...  Click on the chart above (or here) for a printable PDF. As you can see, there are still quite a few homes selling within the first few months of being on the market (94 homes) --- but there are a LOT that are taking a VERY long time to sell. There were 59 homes in Harrisonburg and Rockingham County that took more than a year to sell, with 30 of those taking more than two years! Hopefully this sheds a bit more light on the time it takes to sell a home in Harrisonburg or Rockingham County. A more detailed analysis of the days on market of your property type, location, price range, etc. is bound to be even more helpful for you. Let me know if I can assist. | |
Home Value Projections for Harrisonburg and Rockingham County |
|
As can be seen below, home values across the U.S. have declined sharply over the past three years, after a sharp increase over the preceding years. (Source: OFHEO)  In Harrisonburg and Rockingham County, however, we saw an increase in home values between 2003 and 2006, but we have not seen a comparable decrease between 2006 and 2009. (Source: HRAR MLS)  One of my blog readers (who has a Ph.D. in Assessment and Measurement) wonders whether we will see a decline in home values in Harrisonburg and Rockingham County because of a principle called "Regression to the Mean". This principle suggests that over time things (scores, prices, etc) revert back to the mean. Let's use this concept to examine what might happen to home values in our area. Using OFHEO data, we see that home values across the entire United States have increased (on average) four percent per year since 1991.  A few notes on the graph above, where the blue line shows actual home prices and the purple line shows a 4% per year increase in prices.
The graph below shows local median home price changes (since 2000) in green, with a the 4% per year increase shown with a purple line.  From the graph above we can see that since we haven't seen a sharp decline in prices in Harrisonburg and Rockingham County, that the actual median home price is still significantly above what it "should" be based on a 4% per year increase beginning in 2000.  If we go along with the theory that home prices locally will regress to the mean, there are several ways that it might happen. The graph above shows what it might look like to return to the mean (of a 4% per year increase) --- if it happens by 2010 (sharp decline) vs. 2011 (moderate decline) vs. 2012 (no decline, or gain). Again, please note that the idea that we must return to this mean is not carved in stone. It is a mathematical principal that some people believe has applies to the housing market. Below is one final graph to leave you feeling a bit more hopeful...  The red line above shows how we could see a steady (slow!) increase in home values every year from 2009 forward and still adhere to the principle of regressing to the mean. The yellow line above flies in the face of regressing to the mean, and shows a return to the 4% per year increase starting from today's home prices independent from any (real or imaginary) need to regress to the historical mean. Some of my references as I researched and wrote this post were: | |
March 2009 Real Estate Market Report for Harrisonburg and Rockingham County |
|
Click here to view a PDF of this entire report. Enjoy!  The pace of home sales in Harrisonburg and Rockingham County continues to decline --- with a 25% drop in sales pace when comparing Jan-Mar 2009 to the same time frame last year. Home values, however, seem to be holding relatively steady despite this drop in sales activity. Median home prices have dropped 5% since last year and average home prices have increased 1%. The next three months will be indicative of the overall health of our market, as we should see an increase in home sales as a result of seasonal trends, historically low interest rates, and the $8,000 first time buyer tax credit. Given this information, sellers should price their homes carefully, market them aggressively, and be flexible within reason when it comes to negotiating a contract. Buyers in our current market should look for good opportunities to buy at a reasonable price, but likely won't find too many opportunities to buy at a significant discount. If we start to see a more significant decrease in average or median home sales prices, buyers will be able to negotiate more effectively.  Home sales in March 2009 (57) were decidedly slower than last March (92) -- a bit of a surprise after an exceptionally strong month of sales in February 2009. We will likely still see an increase in sales over the next four months (as we see each year at this time) but we will have to wait to see whether we can match last year's overall sales pace --- I am optimistic that we will be able to, given the $8,000 first time buyer tax credit.  This graph shows a normalized trend of home sales by charting the ongoing sum of the preceding 12 months' sales. The drop we see this month is a result of March 2009 sales being markedly lower than March 2008 sales.  Active inventory continues to rapidly increase, likely as a result of homeowners' anticipation of more buyers in the spring/summer market. This continued increase, however, will not help bring our market back into a balance between buyers and sellers.  Unfortunately, the increased inventory of homes on the market over the past several months has not been matched by a corresponding increase in sales. Thus, the number of months of supply has started to increase again in all price ranges.  This graph captures all residential real estate activity as reflected in the Harrisonburg/Rockingham Multiple Listing Services. The 2009 year-to-date sales figures now include three months of sales data, and show only a slight decline in median sales prices. This is good, however, the pace of sales continues to decline.  When examining only single family home sales in Harrisonburg and Rockingham County we see a slight increase in median sales price, though this median sales price has not had a significant net increase or decrease since 2006. During the same time, the sales pace has decreased drastically -- 28% between 2006 and 2008.  Sales of townhomes in Harrisonburg and Rockingham County continue to slow, though median sales prices continue to stay relatively steady. We have seen an amazing 56% decline in townhome sales between 2005 and 2008 --- with even more of a decline likely to be evident by the end of 2009.  Examining the median price per square foot of sold single family homes in Harrisonburg and Rockingham County reveals a gradual (small) decline in home values (as defined by this metric) between 2006-Q3 and 2008-Q4. Over the past three months, however we have started to see an increase again. Click here to for a printable PDF of this entire report. | |
Has the Harrisonburg real estate market hit bottom? |
|
I was asked that two times yesterday.....and the hypothesis of the two people asking was that the Harrisonburg real estate market has indeed hit bottom. But what do we mean "hit bottom"? When people use this language in most other real estate markets, they are referring to the end of a period of declining home values. But in Harrisonburg (and Rockingham County), we saw a 1% increase in home values between 2006, 2007 and less than 1% change between 2007, 2008. So, without an overall decline in home values, we probably wouldn't be referring to home values when we say "hitting bottom" --- if we were, we should be asking if home values are starting to increase again (after 2 years of treading water). Perhaps when people ask if the Harrisonburg housing market has "hit bottom" they are referring to the dramatic decline in sales activity. The number of home sales in our local market peaked in 2005 (1,669) and have declined ever since (-14% in '06, -13% in '07, -25% in '08). I do hope that we see that we have "hit bottom" in terms of this steady decline in market activity. More specifically, I hope that we see at least the same amount of home sales in 2009 as we saw in 2008. A broader view... In a sense, we may see market activity pick up in Harrisonburg and home values increase again when other real estate markets across the country are deemed to have hit bottom. Some analysts are predicting that we are seeing the beginning of that in March. Factors that may be contributing to an increase in sales activity and home values (in Harrisonburg and otherwise):
| |
Exploring huge variances in Price Per Square Foot |
|
From a loyal blog reader... "I used your lovely search tool to look at all of the Belmont Estate listings. One thing that surprised me is the vast difference in the price per sq ft. Some were as low as $88 and others were as high as $139+. I'm curious to know why there's such a difference." An excellent question! Here's what she was noticing....  One reason for these differences is based on whether the homes have basements. You'll note (below) that the three homes without basements have a much higher price per square foot than all other homes in the neighborhood. What is really going on here is that when you start to add basement finished square footage into the "total livable square footage" (which is then used to calculate price per square foot) you are able to achieve a much lower price per square foot in a home with a basement. So....while the homes without basements seem to be really expensive on a price per square foot basis, it's really that the homes WITH basements are able to look less expensive using that metric. ") Another item to notice is that the largest homes (on a total livable square foot basis) are able to achieve the lowest price per square foot (see below). Three of the largest homes in this group have the lowest price per square foot. ") Given all of this, remember that it is best to compare relatively similar homes using the price per square foot metric. If some of the homes you are comparing have basements, and others do not, or if they are vastly different in total livable square feet, then you are likely to find significant a variation in the cost per square foot. | |
Benefits of $8,000 tax credit, record-low interest rates |
|
 Let's assume for a moment that a first-time buyer decides to buy a $150,000 townhouse in Harrisonburg. With the appropriate income and credit scores, they may be able to obtain a rate as low as 4.625% on a 30 year fixed rate mortgage, with no downpayment. In the first year, this first-time buyer would likely have the following income and expenses:
Contrast this to a buyer who closes on December 1 of this year. At that point, the tax benefit will have ceased, and I predict that rates will be at least as high as 5.75% on a 30 year mortgage.
The combination of the tax credit, and the extremely low interest rates we are currently experiencing are likely to save you almost $9,000 in the first year of homeownership. As you can see, much of the above $9,000 of savings is in the $8,000 tax credit for first time buyers --- but the additional savings because of a low interest rate becomes quite dramatic over the course of the loan. Buying now at very low rates (4.625%) may save you as much as $37,000 over the next 30 years as compared to buying at 5.75%.
| |
Home sales increase in February, is our local market poised for a recovery? |
|
Click here to view/print a PDF of my real estate market report. Enjoy!  This month's home sales report (above) has several surprises, the first ofwhich is the increase in sales in February 2009 compared to February2008. Though only a modest increase, we have only seen this type ofincrease in sales (compared to the same month the prior year) 3 timesin the past 14 months. Median sales prices have fallen considerably when comparing Jan/Feb2009 with Jan/Feb 2008. This is, however, solely based on two monthsof data (a small sample size), and thus these figures may be affectedby the sales price distribution of the properties that have closed inthese two months. Somewhat contradictory to the median sales pricetrends, we see that average sales prices have increased when comparingJan/Feb 2008 to Jan/Feb 2009. Average Days on Market has increased somewhere between 14% and 20%during the past year, which is likely no surprise to sellers, many ofwhom have experienced a longer than typical length of time on themarket.  Home sales in February 2009 (53) were stronger than in February 2008 (52), perhaps suggesting that we may see 2009 turn into just as strong of a year as 2008. After several years of consecutive declines in real estate activity, February's sales figures should be an encouragement for homeowners --- perhaps the pace is finally increasing again in our local residential real estate market.  This graph shows a normalized trend of home sales by charting the ongoing sum of the preceding 12 months' sales. This normalized trend line is now showing a leveling off of home sales, perhaps indicative that the market is becoming more stable. 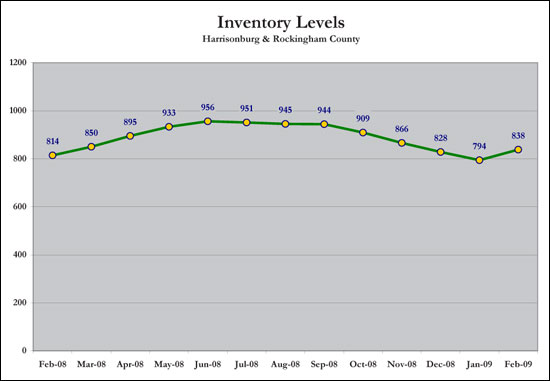 Likely as a result of the coming spring real estate market, inventory levels are now headed back up. If we continue to see an increase in the number of homes on the market, buyers will have even more negotiating power as we move forward.  Supply levels in the $400,000+ price range dropped significantly (from 25 months to 22 months) --- due in large part to a significant increase in sales in this price range. We continue to see the healthiest supply levels in the lowest price ranges.  This graph captures all residential real estate activity as reflected in the Harrisonburg/Rockingham Multiple Listing Services. The pace of home has decreased significantly over the past four years, but home values have continued to stay level or increase slightly.  When we examine solely the single family home market we find a somewhat more significant decrease in median sales price (4% between 2007 and 2008), but we don't see as much of a drop off in the number of sales taking place. Of note, the record growth in median sales prices was 2004 when we saw a 24% increase.  Sales in the townhouse market have drastically decreased, with a 37% decrease just between 2007 and 2008. Sales of townhouses are now down below even 2003 levels. The good news, however, is that the median sales price of townhouses continues to increase, with a 2% increase between 2007 and 2008.  Examining the median price per square foot of sold single family homes in Harrisonburg and Rockingham County reveals an overall decline in home values (as defined by this metric). We are now at 2005 First Quarter prices per square foot, which is a decline of 14% since the peak in 2006. | |
Analyzing Investment Properties |
|
When considering the purchase of an investment property, you ought to account for the following investment benefits:
Click on the image for more detail.  | |
JMU Student Housing Supply & Demand Analysis |
|
 As we approach the 2009/2010 academic year at JMU, I believe we will be facing a significant surplus in student housing for JMU students. However, do bear in mind that there are many factors that make it difficult to track the actual supply and demand for student housing, including:
On the demand side of the student housing equation, enrollment for Fall 2009 is projected to be 18,928 students. This is an increase of 1,500 students as compared to our Fall 2007 baseline. On the supply side, I estimate that 3,240 additional beds will be available for Fall 2009 as compared to Fall 2007. These new beds are located in the following communities:
| |
The Most Popular Neighborhoods in Harrisonburg |
|

| |
Why are fewer homes selling in Harrisonburg? |
|
As referenced in yesterday's "My hope for the 2009 local housing market" post, the quantity of home sales has fallen 44% over the past 4 years (between 2005 and 2008). At the same time, values haven't significantly fallen, and thus I tried to answer the question of why we haven't seen a big shift in home values. But one question remains --- why have we seen such a larger decline in the number of home sales!? Here are my thoughts, though I welcome your insights as well...
| |
My hope for the 2009 local housing market |
|
 I am thankful that we have not seen much of a shift in home values in Harrisonburg and Rockingham County! However, the extremely slow rate of market activity that we are currently experiencing makes it very difficult for a homeowner to sell their home, and thus I hope that we will soon see market activity pick up in this area. Of note, we have seen a steady decline in overall residential sales for each of the past four years (shown above), with a 44% overall decline between 2005 and 2008. The graph and chart represent all residential sales recorded in our local MLS in Harrisonburg and Rockingham County. Each year the number of home sales has slipped further and further down, with 2008 finishing out with only 931 home sales. Thus, my hope for 2009 is that we can at least keep pace with 2008 --- with 931 home sales. I'm not hoping for a miraculous turnaround with 1,200 sales --- I'd just like to see market activity stop sliding downhill. How are we doing with this goal so far, you might ask? So far this year there have been 57 residential sales. Last year by this time, there had been 72 residential sales. We still have some catching up to do to hit the 931 mark by the end of the year, but it is indeed still early in the year --- and the stimulus package was signed into law less than 24 hours ago! | |
What is sustaining home values in our local market? |
|
 Over the past few weeks I have examined shifts in home values from several perspectives:
Why!???? This is the question that many people are asking --- why aren't we seeing a downward shift in values in this area? Over coffee today, I was presented with one hypothesis (thanks Ian!) for why this may be occuring. Ian's conjecture --- we're not seeing a big shift in values because there aren't too many people in our area that absolutely MUST sell, and thus they aren't making huge price drops in order to sell. I can go along with this theory. In talking to homeowners with their homes on the market, it seems that while there are many sellers who definitely, positively want to sell, the sooner the better, there aren't a very large number who are absolutely desperate and willing to take desperate measures in order to sell. What are your thoughts? Anyone want to refute or defend this theory? | |
A quickening pace in the local real estate market? |
|
 Our company runs over 60 web sites with real estate listings --- the company site, and a web site for each agent. Over the past year there have been hundreds of thousands of property views on this set of web sites --- with each property view being a web user clicking to view the details of a given property. The graph above shows a trendline for the number of properties viewed during each of the past 12 months on all of these web sites combined. The trendline is likely not too surprising, as we see a tremendous amount of activity in March/April/May, gearing up for summer purchases, and we see a rather significant drop through the remainder of the year (August-December). January, however, showed a sharp incline --- which leads me to question --- is this simply a seasonal trend coming around again, or will we see a significantly stronger real estate market this spring? | |
Rent vs Own in Harrisonburg |
|
 A common question I am asked is how costs compare in buying versus renting a "starter townhouse" in Harrisonburg. This changes over time, but here's how the costs compare now, assuming that you stay in the property for three years.... Buying a townhome at $156K (example) With a 3% down payment, you'll be financing $151,320, and at current interest rates (5.00%), this will equate to a $922 monthly mortgage payment. This $922 will include the principal, interest, taxes and insurance. You will likely pay $4,000 of closing costs to buy the townhome. During your three years of ownership you will have saved approximately $5,000 on your taxes because of the mortgage interest you have paid. After three years you will have paid off approximately $7,000 of principal on your mortgage. Thus, you have a net (unrealized) gain of $8,000 ($5k tax savings + $7k principal reduction - $4k closing costs). Renting a comparable townhome To rent a comparable townhome, you will likely be paying $900 per month. You will have no up front costs, no tax savings during your time of ownership, and no financial return at the end of the three year time frame. Three Year Conclusion If you are only going to live in your townhome for three years, you will still need to carefully consider whether you should buy vs rent. Even though you will have $8,000 of savings, you will burn through much of that in the transaction cost of selling your townhome. Five Year Conclusion If you're in the townhome for five years, it becomes a much better opportunity to have purchased. In the five year analysis, you will have a net (unrealized) gain of $17,000 ($9k tax savings + $12k principal reduction - $4k closing costs). Deciding whether to buy or rent is a big decision, but it can be made wisely with some basic financial analysis. Feel free to call (540-578-0102) or e-mail me (scott@cbfunkhouser.com) if you'd like some guidance for your personal situation. | |
Looking even closer at home values over time |
|
 The Daily News Record ran an interesting article yesterday which reinforces what I have been stating in my monthly home sales reports for quite some time now --- sales volume is down, median and average sales prices are stable. Ex. December 2008 Report. However, the comments in the DNR article were of quite a different persuasion -- the commentators were quite sure the assertion of stable home values was bogus. Here's where I stand on the issue:
Today I'm going to take a closer look at one very narrow property type to examine value trends over time.... New-ish (2000+) two-story townhomes in the City of Harrisonburg with 1200-1500 s.f., without basements or garages. This includes developments such as Avalon Woods, Beacon Hill, Liberty Square, Harmony Heights, Meadow Point and Wellington Park.  Prior to this analysis, my assumption was that tracking median price trends across our entire market (which show stability) does not reveal true value trends. I suspected that we would see the median price trend analysis break down if we limited it solely to one very specific property type. However, as seen above, median prices of very similar townhouses in Harrisonburg have stayed stable over the last year. I was wrong! But perhaps the most interesting part of this segment of the market is not found by looking at sold properties, but by examining those currently offered for sale. A few observations:
Still think this data or analysis is bogus, or missing some critical perspective? Tell me about it! Use the comment field below, or e-mail me at scott@cbfunkhouser.com. | |
Understanding long term home sales trends |
|
Below is one of the graphs I generate each month in my monthly market report. This graph shows an overall trend for residential sales in Harrisonburg and Rockingham County by computing the rolling sum of the previous twelve months of market activity. To explain a bit more clearly, here are a few examples:
 To go a bit futher, I broke down the data between different sizes of homes (0-1499 SF, 1500-2499 SF, 2500+ SF). This can show us trends in how each size of home is selling, and it will be interesting to see when each of the individual trendlines turns positive, and when the collective trendline turns positive.  The graph above shows all residential sales, and then shows each of the other size ranges of homes (0-1499 SF in green, 1500-2499 SF in yellow, 2500+ in blue).  This graph shows the trendline for homes (single family and townhomes) with less than 1500 square feet. With a somewhat smaller data set we see more volatility in this trendline, even with rolling twelve month sums, but it can still give us a good idea of long term trends in this type of housing.  The graph above shows the changes in sales activity for mid-range homes (1500-2499 SF). This trendline doesn't have as much volatility, and mimicks more closely the overall trendline.  This graph shows the trendline for larger homes, with at least 2500 square feet. There was a good bit of volatility in this trendline during 2003 and 2004, but it has now returned to a trendline much more similar to the overall market trend. | |
Home value trends in Harrisonburg, Rockingham County |
|
Question everything! Below is an excerpt from an e-mail that I received from one of my clients about a month ago. She asks a fantastic question, and one that I believe is on many people's minds these days... On your website (as well as many other local realty sites) people keep saying home prices are stable. How is that determination made? I understand (& am happy) that we have not experienced the free fall some places have in home values - but as someone who has been watching the local market I am starting to wonder if saying that about the local market is accurate. So, how do we figure out what is happening with home values in Harrisonburg and Rockingham County? Below are a variety of ways that you could come to some conclusion --- some are better indicators than others. 1. Median & Average Sales Price I use this measure quite regularly in my monthly market report, and this metric indicates that home values are holding (relatively) steady in Harrisonburg and Rockingham County. When comparing the 2008 median sales price ($195,000) to the 2007 median sales price ($195,100) we see only a 0.05% decrease. When comparing the 2008 average sales price ($223,668) to the 2007 median sales price ($224,394) we see only a 0.32% decrease. These metrics are often used for observing value trends because they are easy to calculate, and in theory give an all encompassing view of market conditions. However, in a smaller market, they can be greatly affected by what happens to be selling. As an one example of the imperfection of these metrics -- there has been a 40% decline in single family home sales (H'burg & Rock Co) between 2004 and 2008 --- but there has been a 32% increase in single family home sales with sales prices over $400,000. This shift in what is actually selling, can greatly affect the average and median figures, making them less meaningful. Another example of the imperfection of these metrics is found by examining single family homes at or larger than 2,500 s.f. sold in the City of Harrisonburg. In 2007, there were 36 such homes selling at an average sales price of $351,547 and a median sales price of $327,500. In 2008, there were 31 such homes selling at an average sales price of $336,357 (4.3% decrease) and a median sales price of $305,000 (6.9% decrease). In a market of our size, average and median home sales prices are useful for observing value trends, but can be quite off the mark for actual market trends. 2. List to Sell Ratio Most people would assume that sellers probably aren't getting anywhere near what they used to for their homes expressed as a percentage of their asking price. I have asked several people to guess, and the general consensus was that sellers were probably getting 99% of their asking price in the "hot market" of 2004 and 2005, and are probably getting only 90% now. In 2004, a total of 1,507 homes sold in Harrisonburg and Rockingham County at an average of 99.13% of the asking price. In 2008, a total of 932 homes sold in Harrisonburg and Rockingham County at an average of 96.86% of the asking price. This shows us that buyers are able to negotiate more off of the sales price, but the difference is not as dramatic as you might suspect. This metric is most helpful in judging whether the market is a buyer's market or a seller's market. 3. Changes in Asking Price on Specific Properties This is an interesting one, and one that my client was quite instrumental in helping me to observe. She has been observing the market for the past year and a half (roughly) and has seen a dramatic shift in the asking prices of specific homes. Changes in the asking price of specific homes can't necessarily reveal any particular market trend, because sellers don't necessarily price their homes at the price the market would suggest. If an appraiser conducted a full appraisal of every home in our area before it went on the market, and the home was listed at the appraised value, then if we saw a shift in asking prices, it would be very meaningful. As it stands, a home seller may price their home well above the market to start, and then continue to lower the price over time after not being able to sell at an above-market price. Then, because the home sat on the market for so long, buyers are skeptical, and the seller has to lower the price "below-market" in order to sell it. Some (many?) observed changes in asking prices on specific homes are an indication of pricing mistakes, rather than market trends. However, while asking price trends on specific houses won't give as a true indicator of value trends, if we expand this metric to specific neighborhoods or property types we can begin to observe real market trends. 4. Changes in Asking Prices in Neighborhoods or Property Types If owners of homes in Belmont (for example) used to be asking $350,000 - $400,000 for their homes, and are now asking $300,000 to $350,000 that may be a good indicator of a change in value. If owners of two-story townhomes in the City of Harrisonburg built since 2000 used to be asking $160,000 for their townhomes, and are now asking $140,000, that may be a good indicator of a change in value. This metric is getting close to being a good indicator of market trends, but can be improved if we look at sales prices in specific neighborhoods or property types instead of asking prices. 5. Changes in Sales Prices in Neighborhoods of Property Types Again, if we can narrow down the market to a specific neighborhood, property type, age range, square footage range, etc., and then observe average sales prices over time, we will have a very good idea of what is happening with home values in our market. One challenge here is that we probably want to eventually get back to the "big picture" of what is happening in our entire market --- and it would be quite arduous to create 20-30 (or more) profiles of market segments, calculate changes in average sales prices, and then try to come to some broader conclusions about the entire market. But remember --- we came to this as a metric for understanding changes in home values, because we realized (or at least I asserted) that the average (or median) sales price for our entire market isn't necessarily an indicator of what is happening with home values. 6. What could I have sold my home for, and what can I sell it for now? This is a very inexact concept, and one that often confounds, frustrates and depresses homeowners. Part of the problem with understanding changes in home values within this context is that the first data point (what I could have sold my house for) is often a very rough personal assessment. For example, "I am sure I could have sold my house for $250,000 a year ago" --- regardless of whether comparable sales data would actually support that. However, if we take emotional, and imperfect "self assessments" out of the equation, this is a very valuable metric. If you live in a neighborhood where the homes are all very similar, you can probably have a very good idea of what you could have sold your house for a year ago, and what you could sell it for now. CONCLUSION I believe my client's question, and many homeowners' concerns are based on the conflict between several of the metrics above. Homeowners sense that there has been a decrease in home values in general, and their home value specifically, but average/median sales price suggest that they have not. Based on my analysis above, I believe that average and median home sales price are not very helpful in understanding changes in home values in our market. However, because of the complexity of a true analysis of home values (using criteria #5 and #6 above), we may never have a better sense of what is happening with home values in our market in general, beyond using the quite inexact metrics of average and median home sales prices. Homeowners (or prospective homeowners), should take the time to understand how their home value has changed over time. It is not an easy or exact analysis, but it will give you a much better sense of where you have been, where you are now, and where you may be headed in the near future. I welcome any and all dissenting views, alternative perspectives, suggestions for other value analysis criteria, etc! Feel free to e-mail me (scott@cbfunkhouser.com), call me (540-578-0102) or leave a comment below. | |
Calculating the return on your home improvement investment |
|
 Remodeling Magazine has released their 2008-2009 report comparing the cost of a variety of home improvement projects as compared to the added value of each renovation. The projects that they analyze include: basement remodel, bathroom addition, deck addition, master suite addition, window replacement, and many more. Drum roll please... The highest return on investment (as a national average) is a deck addition (80% return on investment), and the lowest return is on a home office remodel. Learn more... You can download a full report of the data on a city-level (the closest city to us is Richmond, VA) here. © 2008 Hanley Wood, LLC. Reproduced by permission. Complete city data from the Remodeling 200809 Cost vs. Value Report can be downloaded free at www.costvsvalue.com. | |
| Newer Posts | Older Posts |
Scott Rogers
Funkhouser Real
Estate Group
540-578-0102
scott@funkhousergroup.com
Licensed in the
Commonwealth of Virginia

Home Search
Housing Market Report
Harrisonburg Townhouses
Walk Through This Home
Investment Properties
Harrisonburg Foreclosures
Property Transfers
New Listings