| Newer Posts | Older Posts |
Home Sales History in Rockingham County Towns |
|
After yesterday's analysis of year-to-year residential sales in Harrisonburg and Rockingham County, I thought it might be interesting to compare similar sales trends in sub-markets in Rockingham County. Here's what I found . . . 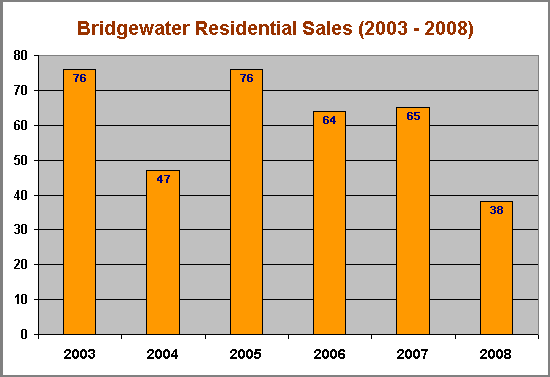 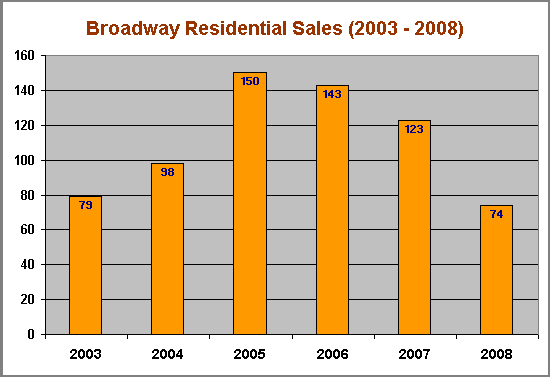 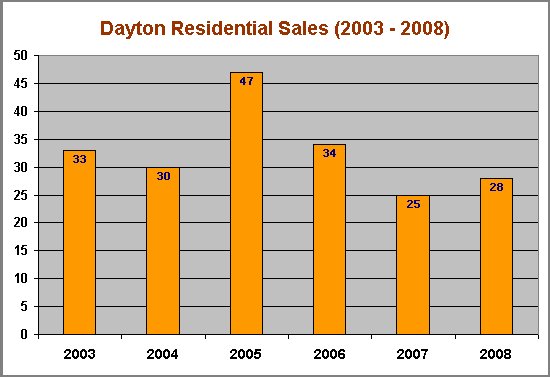 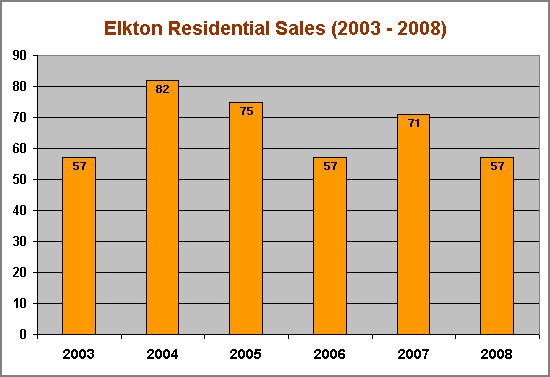 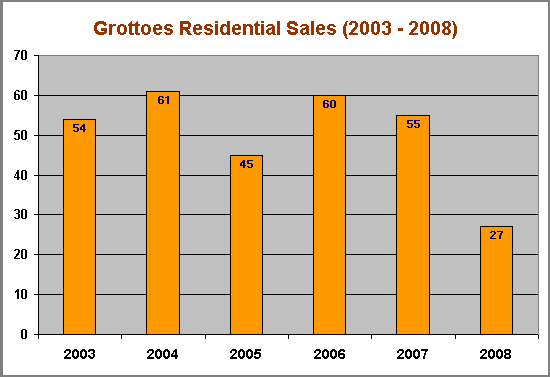 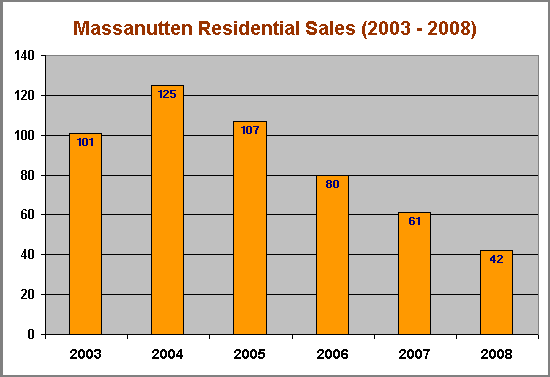 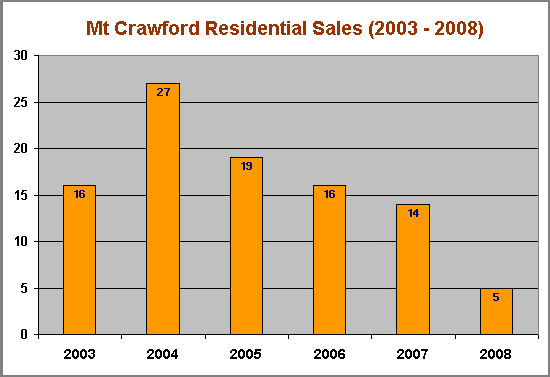 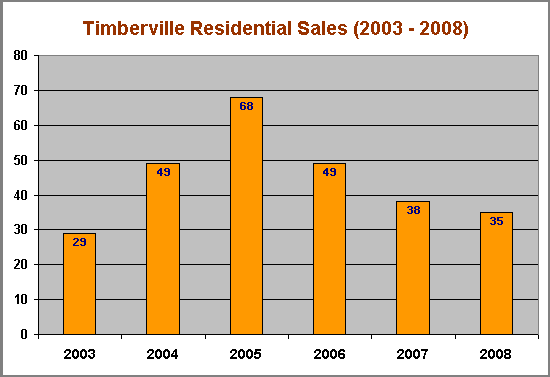 | |
The big picture - year to year real estate sales trends |
|
Each month I conduct a thorough analysis of home sales, but most of my analysis takes a look at a monthly snapshot. Thus, at the request of one of my blog readers, I have compiled the monthly data to show a bit more clearly how the Harrisonburg and Rockingham County market has changed from year to year over the past six years. 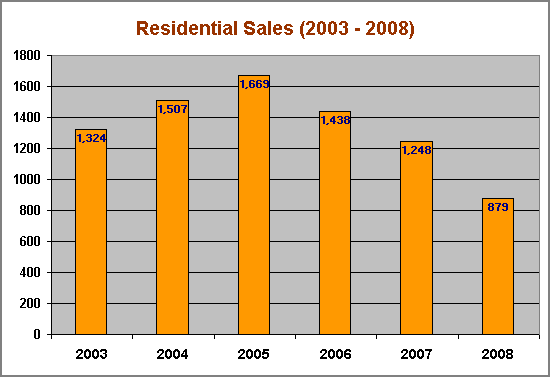 Bear in mind that all of these charts show 2008 data through December 9, 2008 --- so there will still be a more sales before the 2008 data set is closed out. We have seen decreases from 2005 through 2008 --- who wants to guess, will 2009 be an increase over 2008, or will we have to wait for 2010 for an increase? 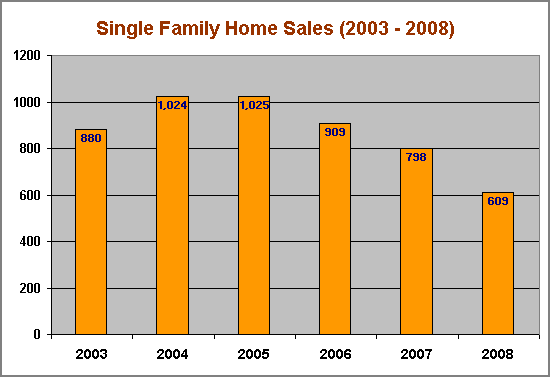 Single family home sales, as we might have imagined, follow a similar trend line to the first graph that showed all residential sales. 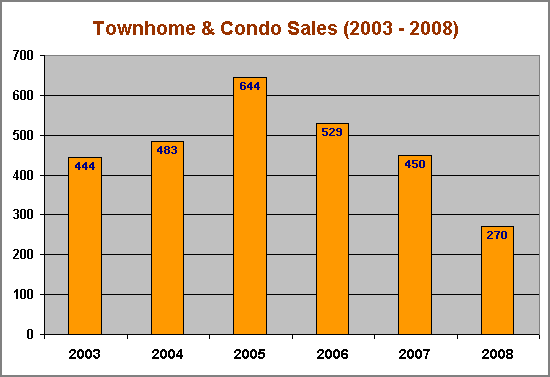 One peculiarity seen here is that there was a sharp increase between 2004 and 2005 in the number of townhouse sales. I suppose 2005 was the year of the townhouse! | |
What sold in November 2008? |
|
 As my November 2008 monthly market report shows, November 2008 was a rather slow month for real estate sales --- only 40 properties sold (closed) in Harrisonburg and Rockingham County, which is the lowest sales level we've seen in (at least) six years. With so few houses selling, let's see if we can come to any conclusions about what did actually sell, but first, two side notes:
| |
October 2008 Harrisonburg & Rockingham County Real Estate Market Update |
|
The October 2008 Harrisonburg & Rockingham County Real Estate Market Report is now available. Click here for a printable PDF of this report.  Sales continue to be slow compared to last year, but overall prices continue to slowly and steadily increase. Both the median and average sales price increased when comparing January through October of last year versus this year.  After a strong September (compared to last September), October's sales figures are lower than expected. October's sales (62) were 40% lower than last October's sales (103). Perhaps last year's fall months (October & November) were an anomaly with their strong increase.  This graph shows a normalized trend of home sales by charting the ongoing sum of the preceding 12 months' sales. Despite an increase in sales pace last month (October 2008), this month we again see a continued decrease in this long-term sales trend.  Inventory continues to decline in Harrisonburg and Rockingham County --- this month down to 866 active single family, townhome and condo listings. This is a 9% decrease compared to June 2008's inventory level of 956 active properties.  As inventory continues to decline, likewise the number of months of housing that is on the market has also declined. The top two price ranges ($300k-$400k, $400k+) both are headed back down towards (somewhat) healthier supply levels. | |
September 2008 Harrisonburg & Rockingham County Real Estate Market Update |
|
The September 2008 Harrisonburg & Rockingham County Real Estate Market Report is now available. Click here for a printable PDF of this report. 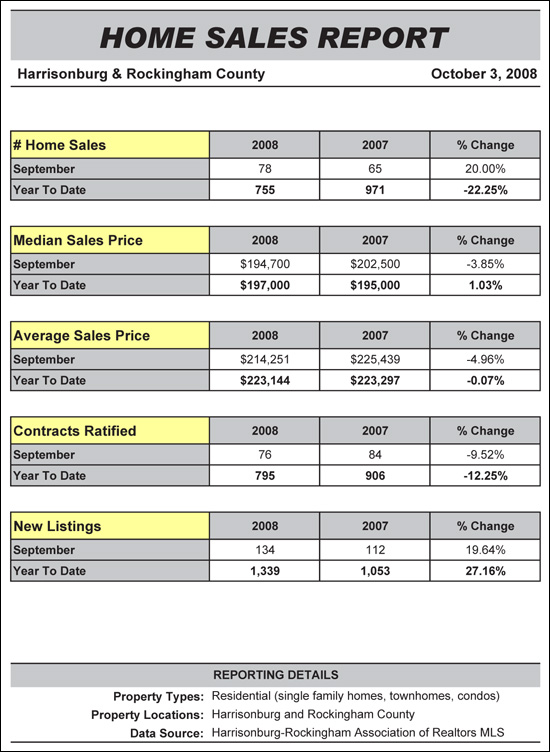 When comparing September 2008 to September 2007, both median and average sales prices show declines, of 3.85%, and 4.96% respectively. However, when comparing Jan-Sept 2008 to Jan-Sept 2008, the median sales price still shows an increase of 1.03%. 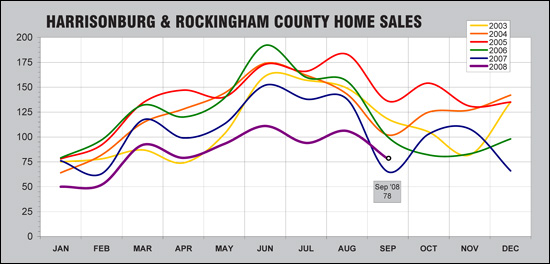 Each year for the past six years, September sales have been slower than in August, and 2008 was no different. However, September 2008 sales were stronger than September 2007, which, combined with the typical increase in October sales, make this a good trend to watch. 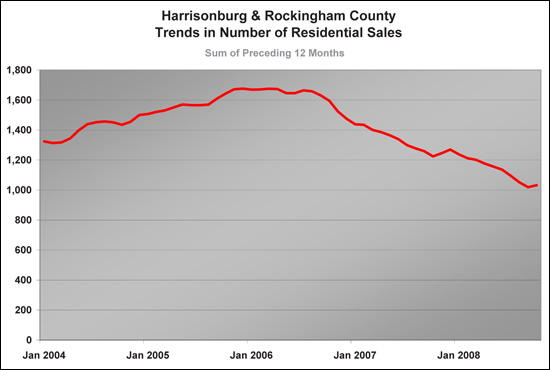 This graph shows a normalized trend of home sales by charting the ongoing sum of the preceding 12 months' sales. Pay close attention this trend next month, as the September 2008 sales trend figure (Oct 1 ‘07 - Sept 30 ‘08) shows an increase in sales. 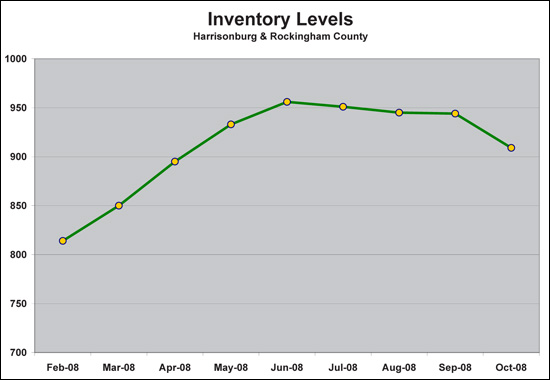 For quite some time, we have seen an elevated level of inventory -- thus, it is healthy to see a decrease in inventory levels. Yet, we may also be observing a seasonal trend in inventory that we will see continue through the winter. 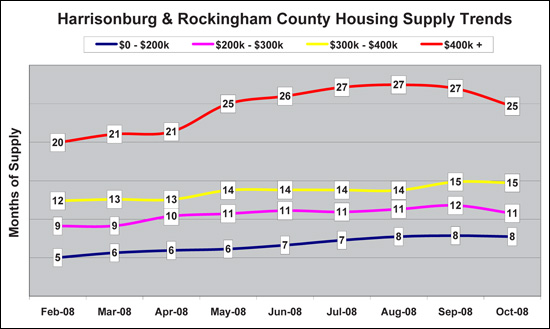 Inventory has declined since August, and likewise, the number of months of housing that is on the market has also declined. The sub-$200k supply has remained stable for several months, but the price range with the most extreme over-supply ($400k+) has declined. | |
August 2008 Real Estate Market Report for Harrisonburg & Rockingham County |
|
Click on any of the charts or graphs below for a printable PDF of the August 2008 Real Estate Market Report for Harrisonburg & Rockingham County. Perhaps of most interest is that buyers are committing to buy properties at an almost equivalent rate as they were last year. Last August, 77 properties went under contract, and this August 76 properties went under contract. This seems to indicate that either we will see closed transactions pick up as the year continues, or that fewer buyers are able to get from contract to closing on a property. 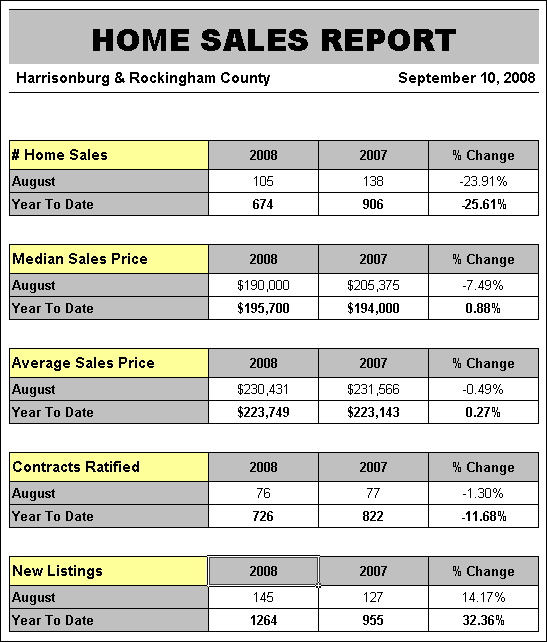 We are in a buyers market. In many markets around the country, which are also in buyers markets, prices have declined significantly over the past 18-24 months. However, we continue to see average and median sales prices staying relatively level. Both average and median sales prices increased (by less than 1%) when comparing Jan-Aug 2007 to Jan-Aug 2008. 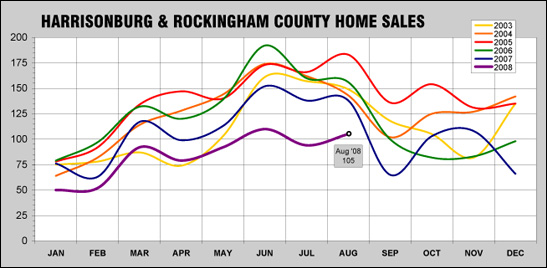 Home sales continue to be largely seasonably predictable. Sales increased in August (as compared to July) as they have in most previous years. September, October and November will be interesting months to observe, as last year October and November showed a modest increase in sales activity. 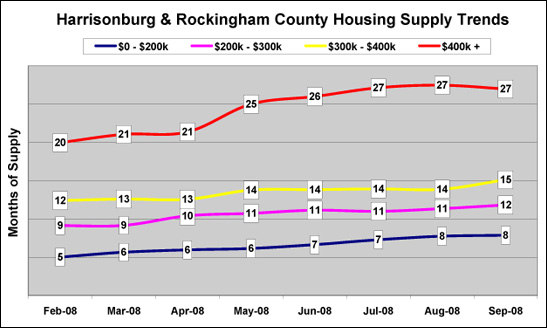 Housing supply is holding steady, or increasing slightly in all price ranges. The lowest price range ($0-$200k) continues to have the healthiest relationship between buyers and sellers, with the most expensive price range being the most out of balance. If you are interested in a more specific analysis of a particular segment of the Harrisonburg or Rockingham County real estate market, please call (540-578-0102) or e-mail me. | |
"It would be great if more properties on the market..." |
|
"It would be great if more properties on the market..." Isn't that an interesting thought?  I couldn't agree more! Several of my current buyer clients are pre-approved and ready to buy, but they can't find a house that suits their needs. They would love to see more houses for sale to give them more options from which to find their new home. I couldn't agree less! For months, most price ranges have been significantly over-supplied. Adding more houses to the already healthy supply levels would just further exacerbate the situation. Hmmmm........ | |
July 2008 - Home Sales Down, Prices Up! |
|
A few weeks ago I posted my Harrisonburg & Rockingham County July 2008 Real Estate Report. Below is a similar report issued by my company (Coldwell Banker Funkhouser Realtors). Slightly different analysis -- and definitely interesting to review. (click the image for a PDF) Generally speaking, home sales are down, but prices are up! | |
The time-value of an interest free $7500 loan to first-time home buyers |
|
Over the past few weeks I have been explaining to many first time home buyers that if they buy a home before July 1, 2009 they can take advantage of a $7,500 tax credit. Some, though, have been less than enthused because the full $7,500 tax credit has to be repaid over 15 years. Yes, that's right --- even though you will pay $7,500 less in taxes for the tax year in which you make your first home purchase, you do have to repay these tax savings in years three through seventeen. I thought I'd take a look at the value of what is essentially an interest free $7,500 loan. For this analysis, I am examining the aggregate savings from not paying interest on the $7,500, using a current interest rate of 6%. 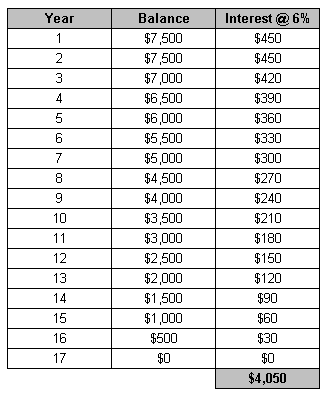 As you can see --- over the course of the 17 years, you save a total of $4,050. Thus --- even though you are paying back the $7,500 tax credit, it is still at a significant ($4,050) savings. | |
At the close of the first half of 2008, here's another look at the Harrisonburg housing market. |
|
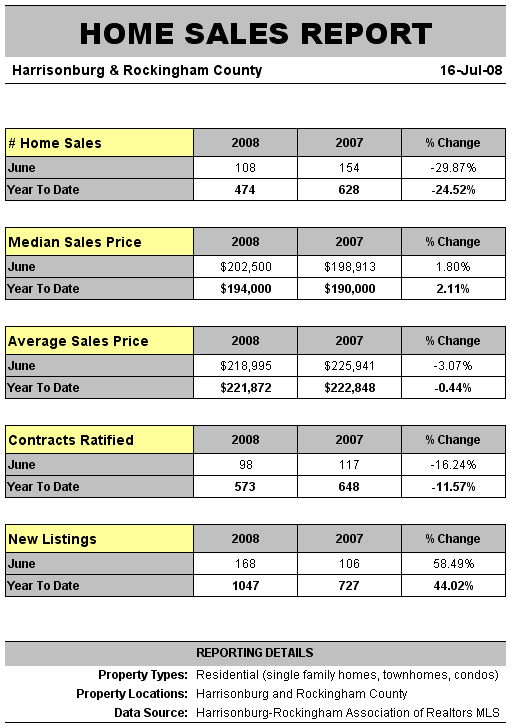
Here is a quick overview of the current state of the Harrisonburg and Rockingham County housing market:
Click on the chart for a printable PDF, or click here for some additional analysis of the Harrisonburg housing market in the first half of 2008. | |
Housing supply remains steady in Harrisonburg and Rockingham County (except those high-priced homes!) |
|
This past week, I overheard someone at the grocery story telling their friend "Can you believe how many homes are coming on the market? I don't know when they'll all sell!?!" Many seem to share this sentiment. You might find it interesting, then, that housing supply is actually remaining rather steady (compared to demand) in all but the highest price range. Click on the graph below for a printable PDF, and read below the graph for more information on how I calculate these values. 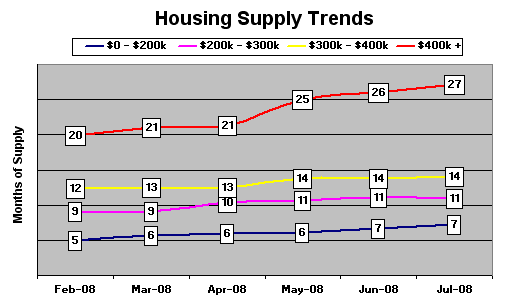 The number of houses on the market at any given time is only relevant within the context of how many people are buying. If 100 houses are for sale and 100 houses are being bought each month, we have a very different market condition than if only 10 houses are being bought each month. Thus, to compare housing supply and demand in Harrisonburg and Rockingham County, I use the following process: 1. Calculate the average number of sales per month over the past 12 months. 2. Calculate the number of houses currently for sale. 3. Divide the number of houses for sale by the average sales rate per month to find out how many months it would take to sell the current inventory. The numbers you see in the graph show the results of these calculations. Let me know if you have any questions, or suggestions for additional analysis. | |
What are the SIZES of new construction single family homes being sold in Harrisonburg and Rockingham County? |
|
Over the past 18 months (January 1, 2007 through June 30, 2008) 138 single family homes have been built and sold in Harrisonburg and Rockingham County, as reflected in the HRAR MLS. The sizes of new construction homes that are selling might be of interest to home buyers, home sellers, builders and developers... 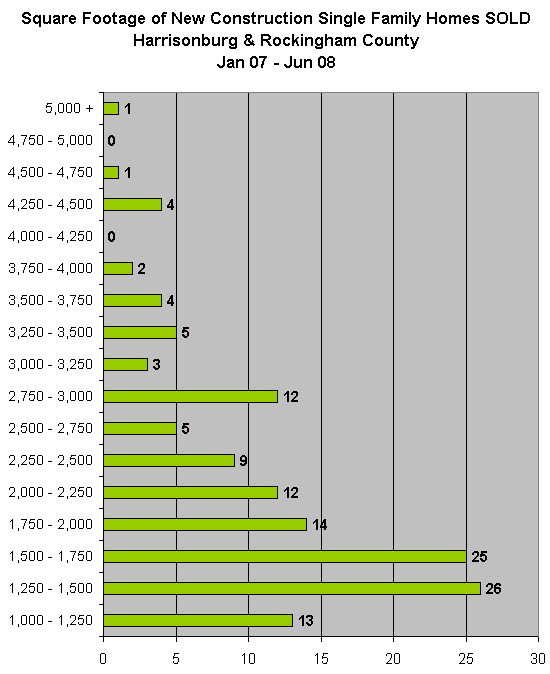 Click on the graph above for a printable PDF. | |
What are the PRICES of new construction single family homes being sold in Harrisonburg and Rockingham County? |
|
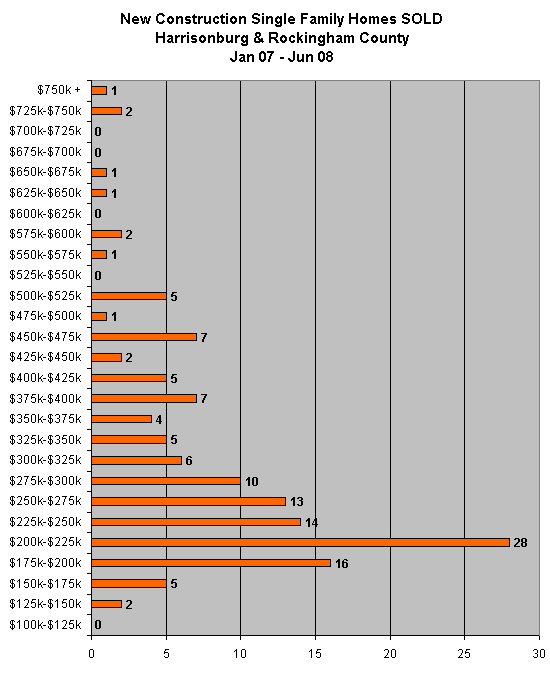
Over the past 18 months (January 1, 2007 through June 30, 2008) 138 single family homes have been built and sold in Harrisonburg and Rockingham County, as reflected in the HRAR MLS. | |
Please tell me --- are home values in Harrisonburg and Rockingham County DECLINING? |
|
Here's the methodology, for those who are interested: 1. Gain or Loss = Sale Price 2 - Sale Price 1 2. Time Increment (Years) = Sale Date 2 - Sale Date 1 / 365 3. Appreciation Per Year = Gain or Loss / Time Increment 4. Percentage Appreciation Per Year = Appreciation Per Year / Sale Price 1 As you may be able to tell, this isn't an automated report (at all!) -- so I probably won't be reconstructing this analysis too often. I had to sort through all 4,209 home sales and manually match up double sales, etc., etc. Does anyone know an undergraduate statistics student who would like an (unpaid) internship? :) | |
Understand current market value before making an offer! |
|
| |
Trends in median price per square foot |
|
One problem with tracking median home sales prices in a relatively small market is that median home sales prices can easily be swayed if a large number of small (or large) homes sell in a particular month or quarter. To try to account for the size of the home, I decided to take a look at how the median price per square foot has changed over the past six years. 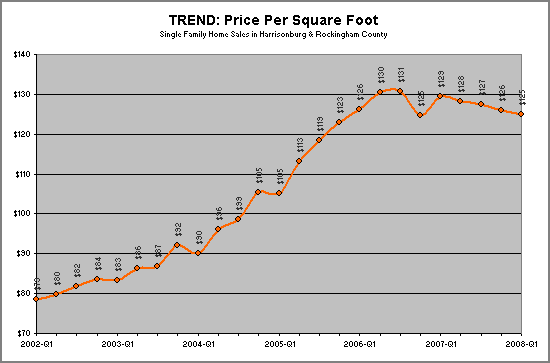 This graph has a few irregularities, but overall seems like it might be a reasonably trustworthy indication of how home values are adjusting over time. Do bear in mind that while I have removed the size factor, I have not accounted for some other factors such as age. The first quarter of 2004 showed a sizable decrease in median home sales price --- this could be explained by a large number of older homes selling, or by some other factor that would affect the price per square foot of homes that sold. | |
Another look at median home sales price trends |
|
I recently posted a six year trend graph of median home prices, measured each quarter, and concluded that median home sales price analysis is not wildly significant. However, several people mentioned to me that they would be interested to see how the trend lines changed if I broke out single family homes, as compared to townhomes/duplexes/condos. Here's what we get... 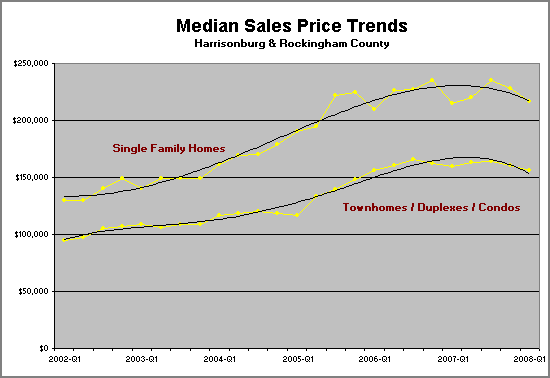 As you can see, the trend lines aren't wildly different than the trend line that included both data sets together. Also, both trend lines seem to indicate an increase in median sales price. This could either mean that:
| |
Where have all the buyers gone? |
|
Each month I post a graphical representation of Harrisonburg and Rockingham County home sales within the context of the prior five years. (2003-2008) My monthly home sales report includes the data behind this graph, which (in the most recent month) showed a 23% decline in home sales this year as compared to the prior year (Jan-May 2008 versus Jan-May 2007). But, as a friend of mine pointed out, this doesn't show how far the rate of home sales has fallen compared to when our market was at its fastest pace. 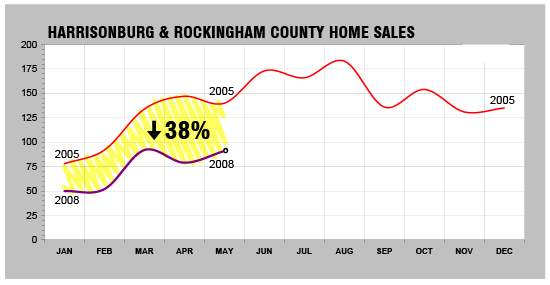 The graph above illustrates the 38% decline that we have seen in Harrisonburg and Rockingham County between the peak of buyer activity (2005) and the current year (2008). Please do remember, this is a decline in market activity (properties being sold/purchased), not a decline in home values. So where did all of those home buyers go? Why did 364 buyers close on properties during January - May 2008 as opposed to 591 buyers during January - May 2005? I have some ideas...
| |
Median Home Sales Price Analysis Is Not Wildly Significant |
|
In my June 2008 home sales report, I noted that the median sales price of single family homes and townhomes in Harrisonburg and Rockingham County had declined by 3.13% between May 2007 and May 2008. I was a bit surprised to see this, as home values still seem to be increasing in this area. So....I thought I'd take a closer look at median sales price trends....and here's what I found.... 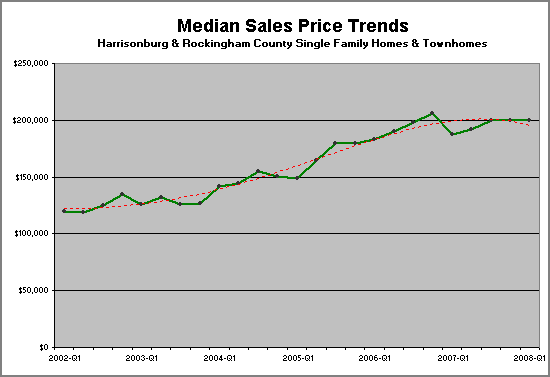 This graph charts the median home sales price on a quarter by quarter basis for the past 25 quarters (6.25 years). The data points of the median home sales price are in gray, connected by the green line. You'll see that the median home sales price goes down (quarter to quarter) almost as often as it goes up. We could, thus, conclude that either:
The red trend line may give us a better indication of the changes in home values over time --- though suggesting that significant trend data could rise out of insignificant source data is probably a stretch. Click on the graph to take a closer look. | |
What on earth is this "cap rate" you keep talking about? |
|
 No --- that's not a cap rate!! Simply put, a "cap rate" is a measure of how quickly your investment is being returned to you. By your "investment" I mean the value of property that you have purchased. by "returned to you" I mean the amount of money that a property generates in a year. The cap rate formula is . . . Net Operating Income / Purchase Price So if you buy a property for $160k, rent it for $975 per month, and have $1,500 of annual expenses, you have a cap rate of 6.375%. ( ( 975 * 12 ) - 1500 ) / 160,000 = 6.375% Care to know more? Read these . . . What Is A "Cap Rate"? Harrisonburg Single-Property Cap Rates Harrisonburg Multi-Family Cap Rates Would you like help calculating the cap rate on a property you own, or are considering purchasing? Call me (540-578-0102) or e-mail me (scott@cbfunkhouser.com). | |
| Newer Posts | Older Posts |
Scott Rogers
Funkhouser Real
Estate Group
540-578-0102
scott@funkhousergroup.com
Licensed in the
Commonwealth of Virginia
Home Search
Housing Market Report
Harrisonburg Townhouses
Walk Through This Home
Investment Properties
Harrisonburg Foreclosures
Property Transfers
New Listings

 In some parts of the country, they definitely are! But since all real estate is local, I'm really more interested in what is happening with home sales prices in Harrisonburg and Rockingham County.
  It would seem that many buyers in the market today are hesitating before making an offer because they are unsure of the current and future value of the home they think they want to purchase.