Analysis
| Newer Posts | Older Posts |
Harrisonburg Area Home Sales Spike Again In August 2021 |
|
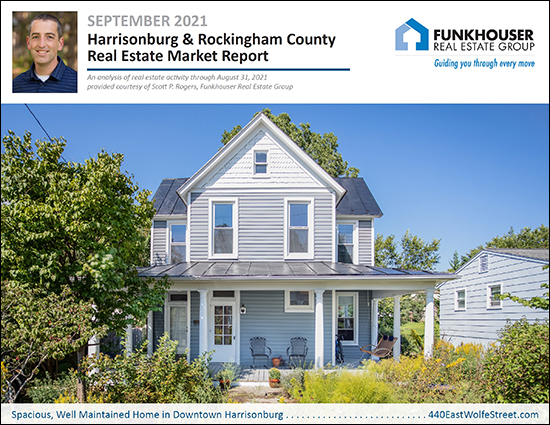 Happy Tuesday Morning, Friends! I hope you had a fun and relaxing weekend. My Sunday included an adventure with my daughter, about 24 of her classmates, and several other dads... hiking to Saint Mary's Falls... with many of them then jumping off a 15 foot high ledge down into a pool of water below!?! A bit nerve-wracking at first, but we didn't have any injuries, so we'll call it success. :-) You should definitely check out Saint Mary's Falls if you haven't been -- it's a 4.3 mile out and back hike only about 45 minutes from Harrisonburg!  But back to the business at hand - the very active Harrisonburg and Rockingham County real estate market! August 2021 was a busy month, and there is plenty to unpack in the latest data. Download a PDF of all of the charts and graphs here, check out this beautiful home on East Wolfe Street on the cover of this month's report, or keep reading for some insights into the latest news from our local housing market... 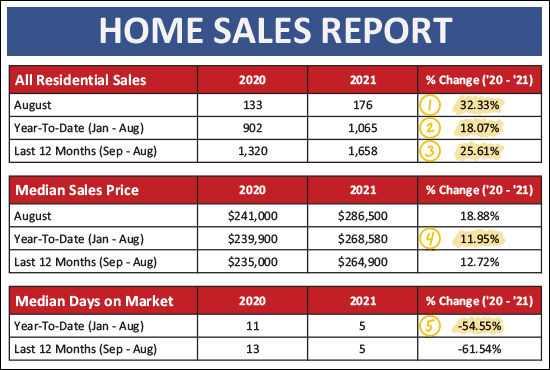 OK - so much to jump into (I guess I'm still thinking about the waterfall!?) right from the start... Referencing the data table above... [1] There were 176 home sales in August. 176! That's 32% more than last August. Admittedly, things slowed a bit in July -- but then sales spiked again in August! [2] We've now seen 1,065 home sales in 2021 which is 18% more than we saw last year during the same timeframe. It has been an active year! [3] Over the past 12 months we've seen 1,658 home sales recorded in Harrisonburg and Rockingham County via the MLS and that is 26% more than the prior 12 months! [4] The median sales price thus far in 2021 -- $268,580 -- is 12% higher than it was a year ago. That is a much larger than normal increase in the median sales price. [5] Homes are selling quite a bit faster this year (median of 5 days on the market) than last year (median of 11 days on the market). 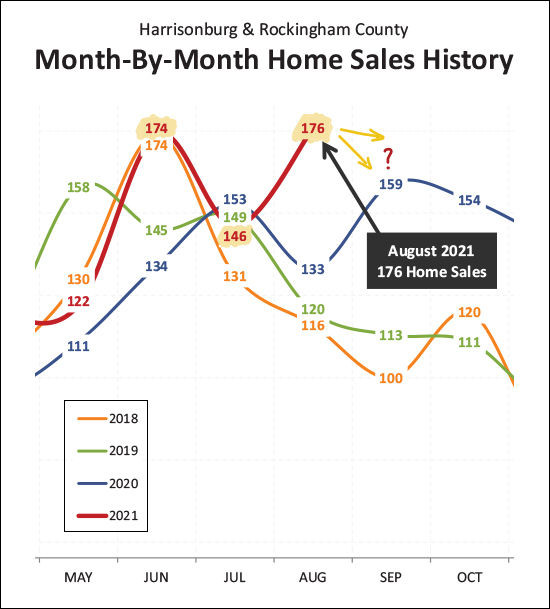 Above you can take a closer look at the month by month trajectory of home sales this year. We saw 174 home sales in June -- which was well above 2020 (134) and tied with June 2018... but then home sales in July 2021 slowed to 146 sales, a small decline from the 153 sales seen in July 2020. But then, August!?! After only seeing 133 home sales last August, there were 176 this August! Where do we go from here? It's anyone's guess. September and October were extremely active for home sales last year -- could we match that pace this year? All these active months of home sales in 2021 have been piling up... 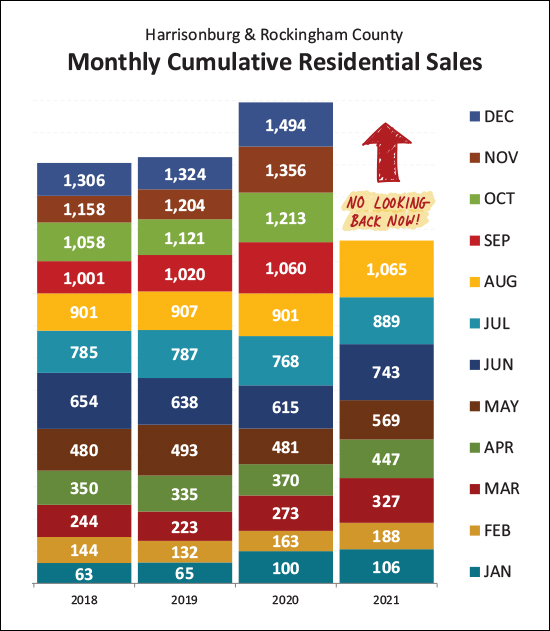 We're now more than a full month ahead of the pace of home sales last year. We've had more home sales (1,065) in the first eight months of 2021 than the number of sales (1,060) seen in the first nine months of 2020! Given the current trajectory, we are very likely to see more than 1,500 home sales in 2021 -- and it seems possible that we could get all the way up to 1,600 home sales! Here's the best "why" I can come up with at this point... 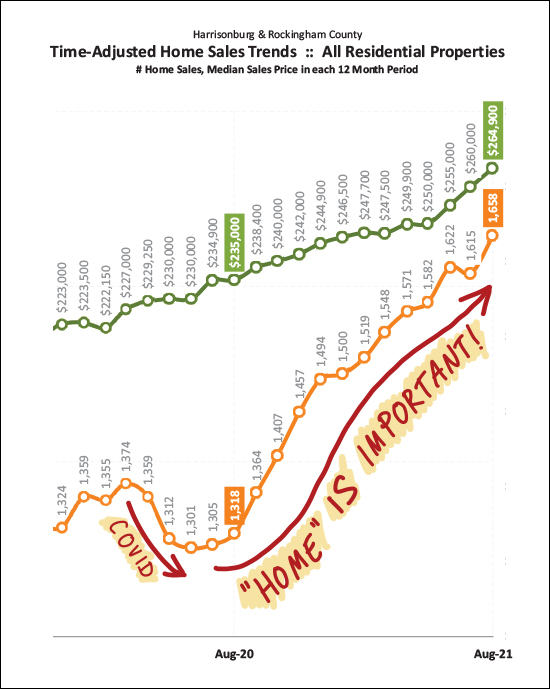 We saw a temporary decline in the pace of home sales when Covid started showing up in our lives -- in March/April of 2020. Then -- many of us started to work from home, learn from home, stay at home -- basically spending more and more time in our homes. This seems to have caused many folks to realize it was more important to have a home that worked well for them -- related to amount of space, types of spaces, etc. Home sales took off starting in late August 2020 and have been on a tear ever since. But it's not just the pace of home sales that has been increasing... 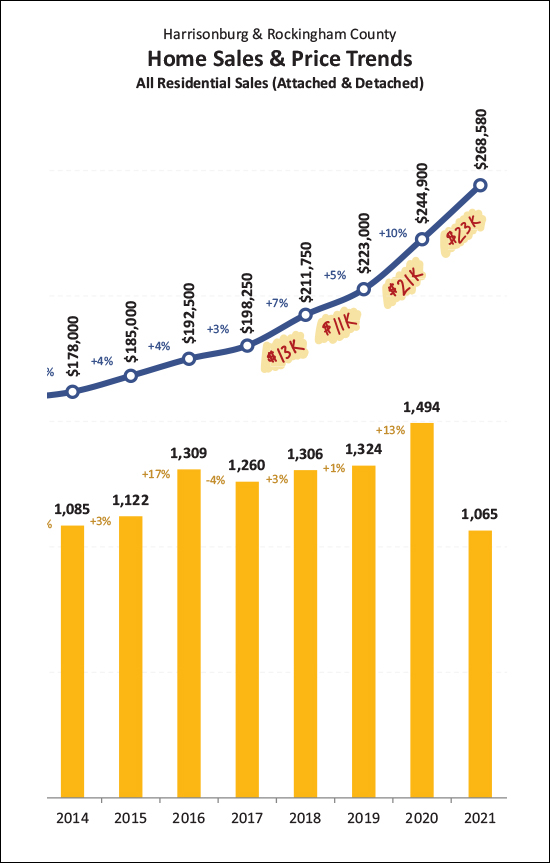 Home prices have been rising very steadily over the past few years, but we have seen a 10% or higher increase in the median sales price in both 2020 and thus far in 2021. Of note, here are the annual increases in the median sales price per year for the past four years, including 2021...
So, if you have owned a median priced home for the past four years you may have very well seen a $70,000 increase in your home's value in the past four years! What comes next? 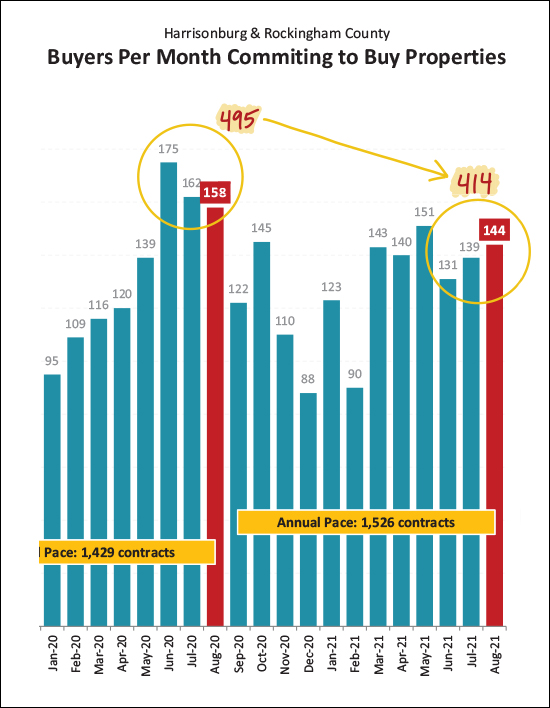 Well, technically, things might eventually start slowing down? Last summer (June / July / August) there were 495 contracts signed for homes in Harrisonburg and Rockingham County -- compared to only 414 this summer. So, maybe we start to see a decline in closed sales in September and October? It's hard to say at this point. Clearly, the robust month of home sales in August is not an indication that things are slowing down or cooling off. :-) We are also seeing a marginal increase in available inventory... 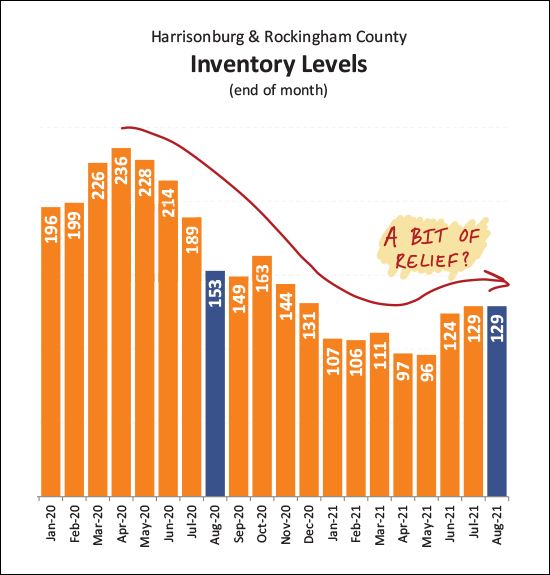 The number of homes for sale at any given time has been declining for years -- but over the past few months the number of homes on the market at any given moment in time has increased slightly from "barely any" to "still very, very few" in Harrisonburg and Rockingham County. Keep in mind -- when 1,658 homes are selling in a year, an increase from 96 homes on the market to 129 homes on the market is not overly encouraging for new buyers. That means there is still less than a month of inventory on the market right now! Given than there aren't many homes on the market for sale -- some buyers are considering the purchase of a building lot to build a home... 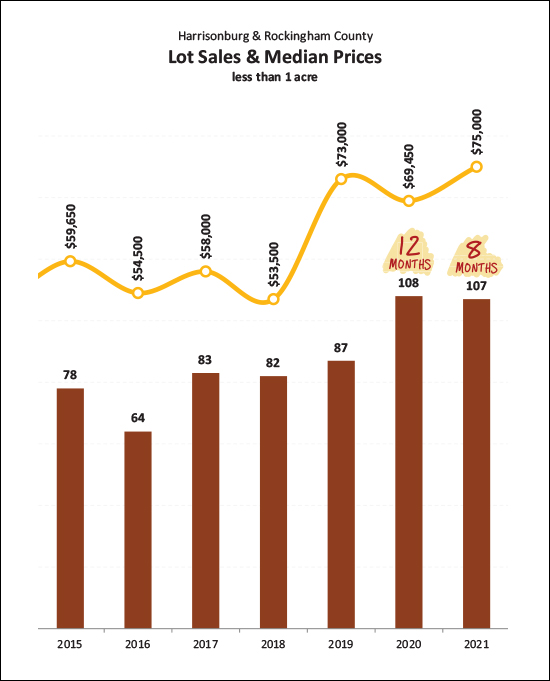 Indeed, even at a time when the price of building materials is still quite high, we are seeing a lot of building lots selling. There were 108 lot sales (of less than an acre) all of last year -- and we've seen 107 such sales in the first eight months of 2021. It's not clear whether all of those buyers will really build -- or be able to build -- but low housing inventory has certainly contributed to more buyers considering building lots. And here's a big part of what has kept all of this home buying activity chugging along... cheap money... 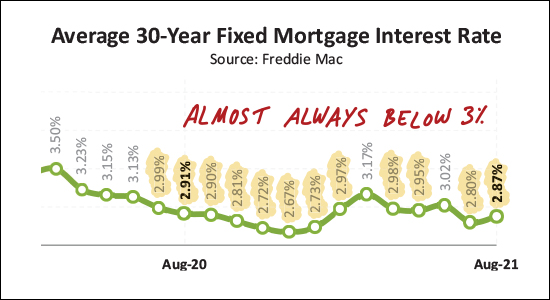 The 30-year fixed mortgage interest rate has been below 3% for almost all of the past year. This has kept housing payments for buyers very low -- even amidst rising home prices. I've been saying for years that mortgage interest rates will certainly start rising soon. I think I have given up on that mantra now, after having been wrong year after year. Certainly, if or when rates do start to rise, that will affect monthly housing costs and housing affordability -- but higher interest rates don't necessarily seem to be on the horizon anytime soon. And now... we're already half way through September!?! We might be seeing high temperatures again this week, but hopefully it will start feeling like fall by the time we get to the first official day of fall, next week, on September 22nd. Meanwhile... If you are thinking of selling your house this fall, let's talk sooner rather than later about timing, pricing, preparations and more. If you're thinking of buying this fall, start looking now, because there aren't many houses on the market, so we'll likely need to patiently wait for the right opportunity to come along and then jump on it, quickly! If you have a question about the market, or your home, or your overall real estate plans -- don't hesitate to ask. Email me or call/text me at 540-578-0102. If you made it to the end, thanks for reading along. I hope you learned something -- and I hope you'll plan something exciting for this coming weekend -- as exciting as jumping off a 15 foot ledge into a pool of water! | |
A Slightly Longer Look At August Contract Activity |
|
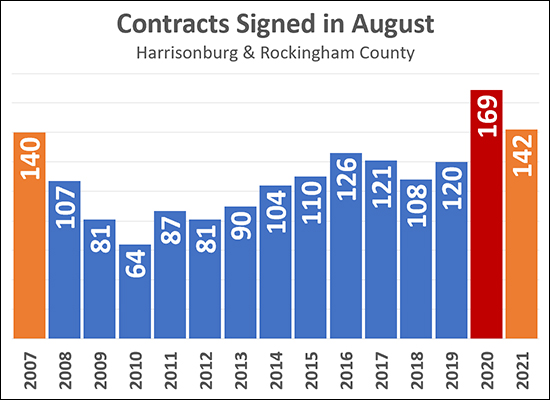 Per a question and suggestion from a reader -- I have taken a slightly longer look at August contract activity. As shown above, there was a decline in contract activity when comparing August 2020 contracts to August 2021 contracts... ...but... The number of contracts signed in August 2021 (all 142 of them) was the strongest month of August contract activity we have ever seen in any other years as far back (2007) as I can pull contract activity from the MLS. So, moving forward I will likely think of August 2020 as a Covid anomaly - and will consider August 2021 as the new high water mark against which future months of August will be compared. If you have a question about this data -- or other data I publish -- let me know. I'm always happy to dig a bit deeper to gather a slightly broader context. | |
An Early Look At Home Buying Activity In August 2021 |
|
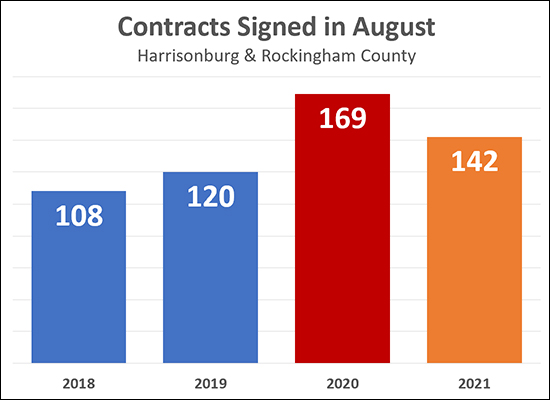 The most up-to-date way to think about the pace of market activity is how many buyers (and thus, sellers) are signing contracts in any given month. I'll release my full market report within the next week or so, but the graph above provides an early look at the amount of contract activity that took place (contracts signed) during August 2021 within the context of the past few years. Two main thoughts...
I expect that summer/fall of 2021 will be a bit slower this year as compared to last year -- but mostly because of the odd timing of market activity in 2020. Stay tuned for my full market report later this month. | |
Harrisonburg and Rockingham County Home Prices Have Risen 10% In The Past Year |
|
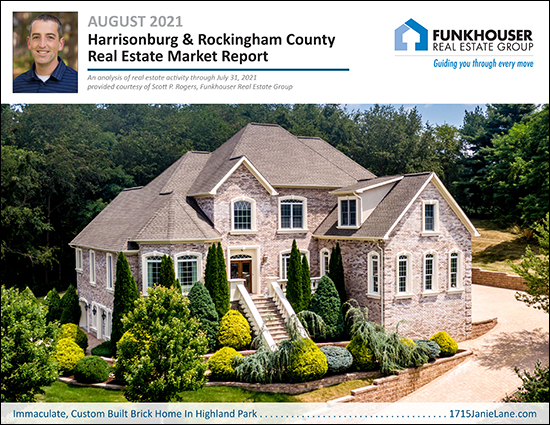
Happy Wet Wednesday morning to you! It looks like this will be the fourth (?) day in a row of rain in the valley, which is a welcome trend for many given the previous few weeks of very, very dry weather in the Harrisonburg area. I hope at least some portions (or most!?) of your summer have been enjoyable and relaxing amidst all that is going on in the world right now. I escaped dry Harrisonburg to visit even drier Utah with my family in early August -- and was impressed by both the lack of humidity :-) and the beautiful landscapes of Arches National Park. I'm back now, though, and Luke (11th grade) and Emily (8th grade) are transitioning into a new school year. If you have little (or big) ones starting school now or soon, I hope that transition goes well for you and them. Now, then, let's chat for a bit about our local housing market. Or, rather, I'll chat -- while you read -- and if you want to chat back, shoot me an email me with what's on your mind or let me know if you'd like to grab a coffee and we can chat in person. But one last note -- you'll find a PDF of all of the charts and graphs in my market report here and you can learn more about the amazing Highland Park home pictured above here. Now, to the data... 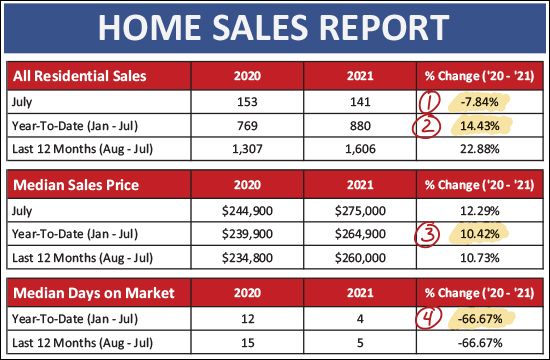 This first data table (above) gives you a quick overview of the basic market dynamics we're seeing right now in the Harrisonburg and Rockingham County area -- and most of it is probably what you would have guessed that you would see... [1] This first one might be a bit of a surprise. There were 8% fewer home sales this July compared to last July. But... you need to keep last July (and last June) in context remembering that they were extraordinary busy months for home sales after the usually strong spring real estate market was delayed by a few months by Covid, resulting in slower spring 2020 home sales and much stronger summer 2020 home sales. Thus, while there were fewer home sales this July compared to last -- that's mostly a story about how crazy things were last July. [2] Here you'll note that the year-to-date pace of home sales (880 sales) is 14% higher than it was last year (768 sales) when evaluating only the first seven months of the year. So, yes, despite extraordinary low inventory levels -- at any given time -- 14% more homes are selling this year than last! [3] Those home prices keep on rising. You might have noted the headline of this update was related to the increase in sales prices. After receiving one of my market reports that lauded a strong pace of home sales, one of my past clients once commented that he could care less how many homes sold -- he just wanted to know what prices were doing -- going up or down. So, in that spirit, I lead this month's update with the fact that the median sales price has increased 10% between last year ($239,900) and this year ($264,900) when looking only at the first seven months of the year. [4] Finally, sales are still happening very (very) quickly in our local market. The median "days on market" for homes that sold in the first seven months of this year was... four days. That is to say that half of the homes that sold went under contract in four days or less! Wow! Now, then, a slightly (just slightly) deeper dive into the basic sales data... 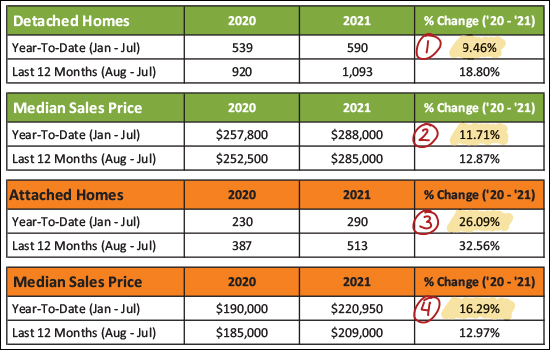 The data table above provides a slightly more nuanced analysis of detached homes in green as compared to attached homes in orange. An attached home is a duplex, townhouse or condo. Splitting out the data in this way calls attention to the fact that while we've seen 9% more detached home sales thus far in 2021, we have seen a much larger, 26%, increase in the number of attached homes that have sold in 2021. Lots of duplexes, townhouses and condos are selling -- though mostly townhouses, and many of them are new townhouses. Looking at sales prices between these two data sets we find that the median sales price of detached homes has increased 12% to $288,000 -- while the median sales price of attached homes has increased 16% to $220,950. So -- at least some portion of the overall increase in home sales in this area is a big increase in the number of attached homes that are selling. Now, to the monthly sales trends... 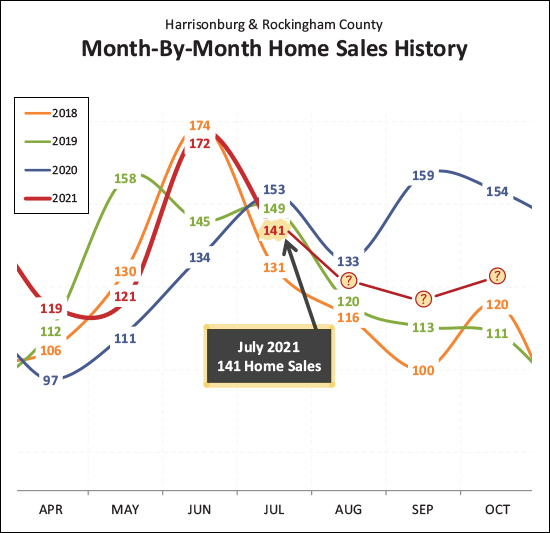 There is a lot going on in this graph, above, but focus on the bright red line for the current year and the dark blue line for last year. By doing so, you'll note that April, May and June home sales were extremely strong in 2021 compared to 2020 -- though that was mostly because home sales were sloooooowwww during those months last year as a result of Covid pushing last year's home sales later in the year. When we then look at June and July home sales in 2021 they look slow compared to 2020 -- but again, this is largely a result of Covid pushing last year's home sales later in the year. So, what then should we expect for August and thereafter in 2021? As illustrated above, I think we are likely to see more home sales than in the same month of 2018 and 2019, but likely fewer home sales than seen in the same month in 2020. The second half of last year was absolutely bonkers as far as the number of homes that sold per month and as strong of a year as 2021 has been, I just don't think it can keep pace with last year. But... in the end, I do think we'll see more home sales this year than last... 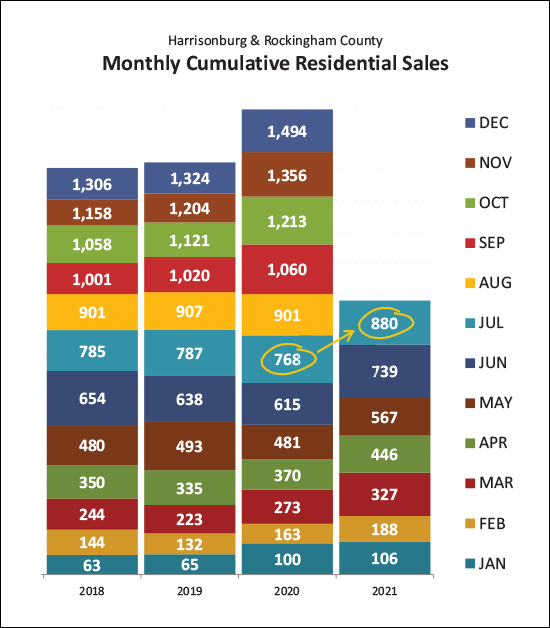 This graph (above) piles each month of home sales on top of the previous months that year, and you'll see that 2021 has established a serious lead over 2020. We are now 112 home sales ahead of the pace of last year's local housing market. So -- even if home sales are a bit slower in the last five months of 2021 than they were in 2020, I still think we'll see more home sales in all of 2021 than we did in all of 2020. Looking back, then, at home sales prices -- some folks have asked if home prices are going up too much or too quickly... 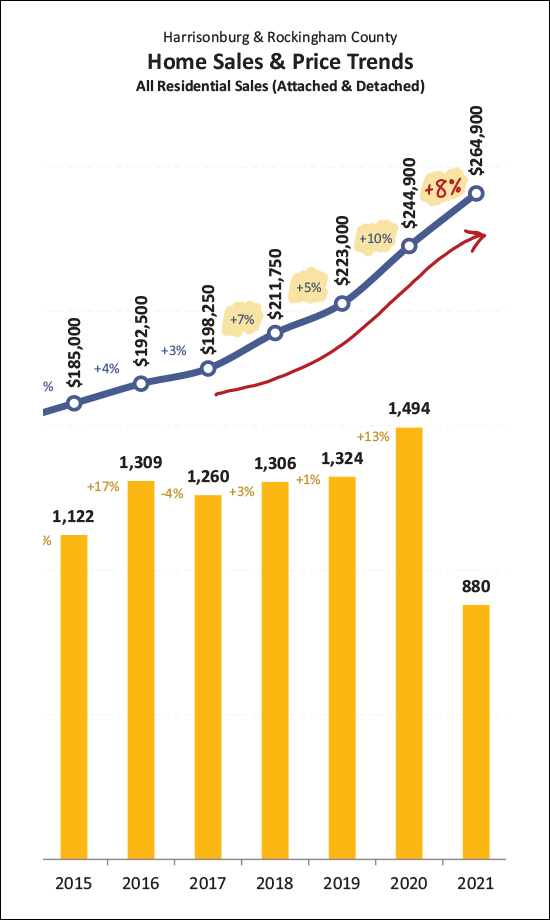 As shown above, there was a 10% increase in the median sales price in 2020, and depending on how you crunch the numbers an 8% of 10% increase in 2021. So, will home prices keep going up? Will they come down? As I mentioned on my blog earlier this week, I don't think home prices are going to decline in the next year, because... [1] I believe housing (for purchase) has been under built for many years in this area. I believe there are more homeowners or would-be homeowners in the market than there are homes to be owned. [2] Even if lots and lots of homes are being built or being planned, it takes a long time (relatively speaking) for those homes to be planned and built. [3] There are a flurry of showings and often multiple offers on most new listings. So, home prices are rising (10-ish percent in the past year) and I don't see that changing significantly in the near future. Now, technically closed home sales are old news -- it's the contract activity that gives us the freshest data, so let's take a look... 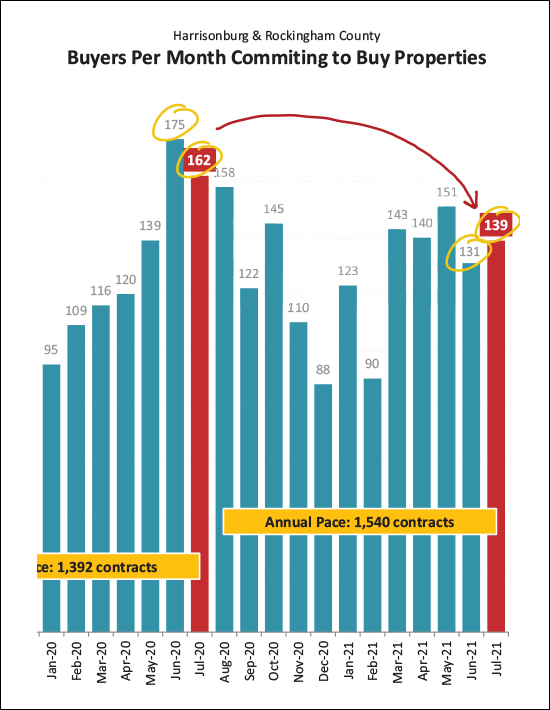 As shown above, contract activity in June and July has been dreadfully slow compared to last June and July. ;-) While technically true, this doesn't tell the whole story, in my opinion. During early 2020, Covid caused a major slow down in the number of homes coming on the market and thus the number of buyers contracting to purchase homes. The spring months are usually some of the busiest months for contract activity and that didn't happen in 2020. As a result, contract activity spiked to record or near record highs in June, July and August. Last year's incredibly and unusually strong months of contract activity during those summer months does make this summer's contract activity look a bit pitiful, but again, it's only because of the crazy highs last summer. Now, how about those inventory levels? Are we getting any relief? 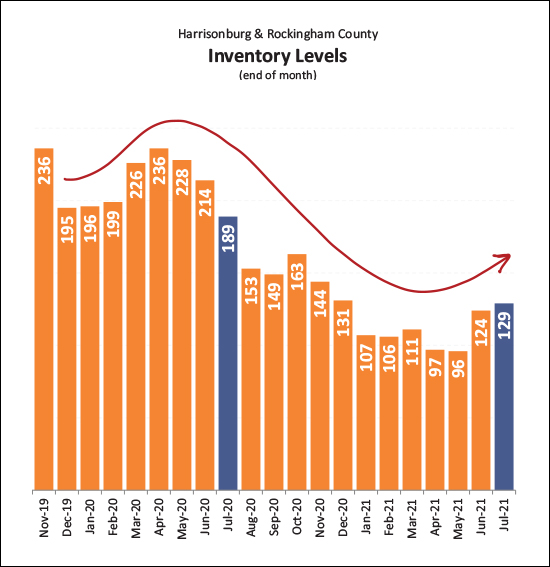 Maybe? Possibly? A little? Inventory levels crept up a bit in June and July of 2021 from terribly, dreadfully low all the way up to... yeah, still terribly and dreadfully low. Inventory levels in early August over the past few years have been 345 homes for sale in August 2018, 270 homes for sale in August 2019 and 189 homes for sale in August 2020. So, before you get too excited about inventory levels increasing from 96 homes *all the way* up to 129 homes, keep in mind that this is still far fewer homes on the market at any given time than we have seen... ever. And finally, a happy recap of recent trends in mortgage interest rates... 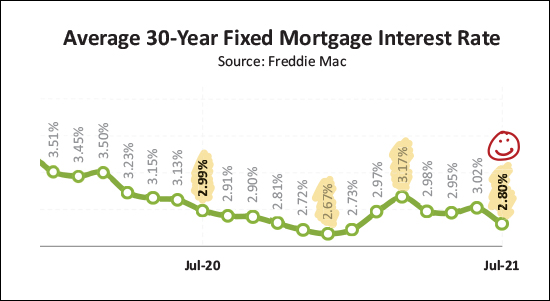 Interest rates were around 3.5% a year and a half ago, fell to 3%, then all the way down to 2.67% back in December before rising again until they were above 3% again. But, no longer. The average mortgage interest rate (on a 30 year fixed rate mortgage) has declined for a few months now and is right around 2.8% -- a welcome sign for home buyers. OK -- I'll wrap it up there for now. All in all... [1] Lots of homes are selling in 2021 -- well more than in 2020. [2] Home prices are much higher this year than last. [3] Buyers need to be prepared to see new listings as soon as they hit the market and to make a quick decision about making an offer. [4] Sellers are likely to continue to see favorable market conditions for at least the next six to twelve months. You'll still need to price your home appropriately, prepare it to show well and market it thoroughly -- but you'll likely enjoy the price for which you sell your home. If you made it this far, thanks for reading. Drop me a line to let me know if you have any questions about our local housing market -- or even more interestingly, to tell me about about your favorite adventure of summer 2021! I'd love to hear from you!
| |
Contract Activity In 2020 Is Somewhat Useless For Understanding 2021 Market Activity |
|
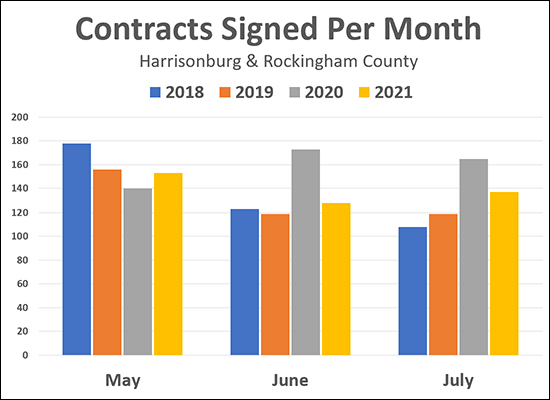 If we just compared this year's contract activity (yellow bars) to last year's contract activity (gray bars) for the past three months we might conclude the following about this year...
The conclusion above are likely pretty far off base as a result of what was actually going on (Covid related) last May, June and July -- and thus last year's contract activity is mostly useless in helping us understand this year's contract activity. MAY: Contract activity was higher this May than last, but that was actually lower than in 2018 and 2019. May was essentially the last month of Covid suppressed contract activity last year. The entire market slowed down in March, April and most of May as everyone tried to figure out whether Covid would affect the real estate market. As such, while this May's contract activity was stronger than last May, it was actually a bit slower than we'd normally expect in May since last May was not normal. JUNE: Once June (and July) rolled around last year, contract activity started to spike to abnormally higher levels -- likely as a backlog of buyers who would have bought in the spring found themselves scrambling to find something to buy in the summer. Thus, while this June's contract numbers are significantly lower than last June -- they are on par with, and slightly above, the pace of signed contracts in June 2018 and 2019. JULY: While there were quite a few less contracts signed this July than last -- this July's numbers were quite a bit higher than July of 2018 and 2019. Again, this seems to be a weird month of July last year that makes this July look off (slow) when in fact it is the opposite. In the end, we all know that the local housing market has been booming for the past year (plus) and more particularly this year and even more particularly, this spring and summer. Thus, if a quick glance at a data set at first leads you to a conclusion (contract activity is falling) that seems contrary to a general understanding of current market dynamics, it is often helpful to zoom out a bit and try to see a clearer picture on a larger data set. | |
Special Saturday Edition: Home Sales, Prices Flying High In Harrisonburg Area |
|
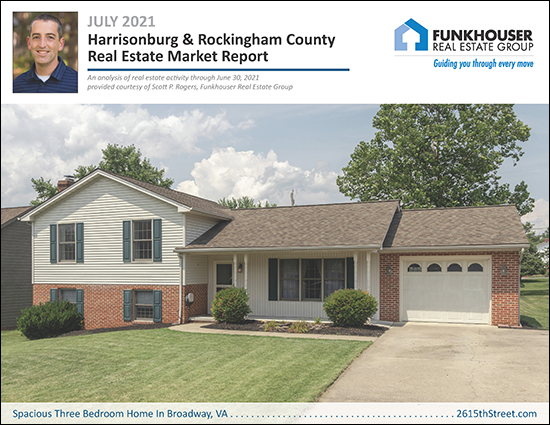 Happy Saturday morning to you! I hope you had a wonderful week. I am still unwinding a bit from a great time at the Red Wing Roots music festival last weekend. I enjoyed seeing many of you there, and if you missed it this year, you should consider attending next year! Back to the here and now, though -- I'm not sure what your weekend looks like -- but thus far mine has involved sipping coffee while my daughter and I have been drawing on our iPads. Admittedly, Emily is creating art, and I'm doodling on graphs and charts as included below - but fun times nonetheless. :-) Regardless of whether your weekend will include relaxing at home, traveling out of state to see family, heading to the beach for a week, or working in the yard -- I hope it is a weekend that includes at least some moments of fun and relaxation. When you get to a few free moments in your weekend, take a look through the remainder of this market update to learn more about what is happening in our quickly moving local real estate market. First, the full PDF of my market report can be found here, second, the featured home shown above is located at 261 5th Street in Broadway and you find details of it here, and now, let's dive in... 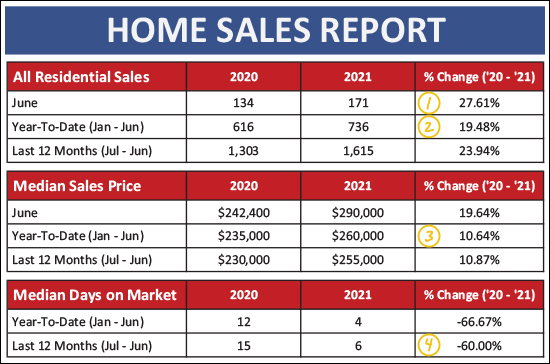 Quickly glancing through the numbers above, you might find your eyes opening wider than normal and your eyebrows rising higher than normal. There are some rather surprising things going on in our local housing market. Anyone who is selling their home, or trying to buy their home, knows about these dynamics -- but it's good to put some numbers to it... [1] There were 171 home sales in June 2021, which was 28% more than last June! [2] Thus far this year (we're halfway through it) there have been 736 home sales, which is 19% more than the first half of last year! [3] The median sales price in the first half of this year was $260,000 (!!) which is 11% higher the median sales price during the first half of last year which was only $235,000. [4] Over the past 12 months it has taken a median of six days for houses (that sold) to go under contract -- compared to a median of 15 days during the 12 months before that. So, yeah, lots of homes are selling, at much higher prices than a year ago, and much more quickly! Breaking it down between detached homes and attached (duplexes, townhouses, condos) homes reveals a few other details... 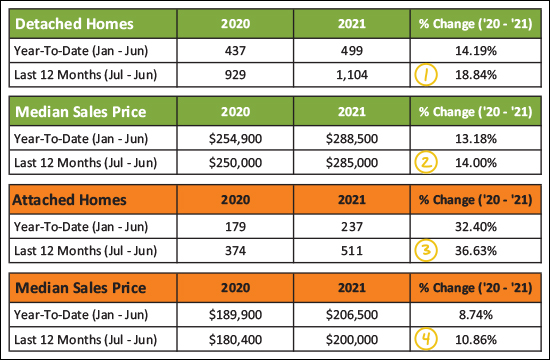 Above you might notice that... [1&3] There have been a 19% increase in the number of detached homes that have sold in Harrisonburg and Rockingham County over the past year -- but a much higher 37% increase in the number of attached homes that have sold! [2&4] The median sales price of detached homes ($285,000) has risen a bit more (14%) over the past year than the median sales price of attached homes ($200,000) which has only (haha) risen 11% over the past year. Those (above) are the long term trends. When we dial in a bit and look at things on a monthly we find that this strong increase in the number of home sales thus far in 2021 has been a month after month after month occurrence... 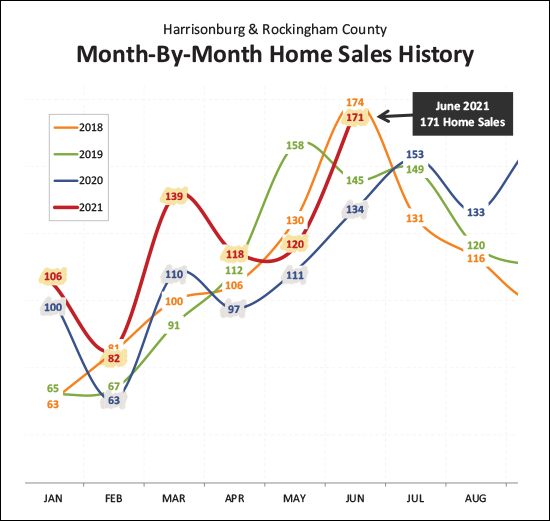 I have highlighted each of the first six months of 2021 in yellow above, and the corresponding month last year in gray. Now, it certainly bears noting that home sales during some of the months in the first half of last year were likely a bit lower than they would have been otherwise because of Covid, but regardless -- each month of home sales in 2021 has been head and shoulders above the corresponding month of 2020. And now, let's see how this first half of the year stacks up against the first half of the past few years... look for the dark blue bars... 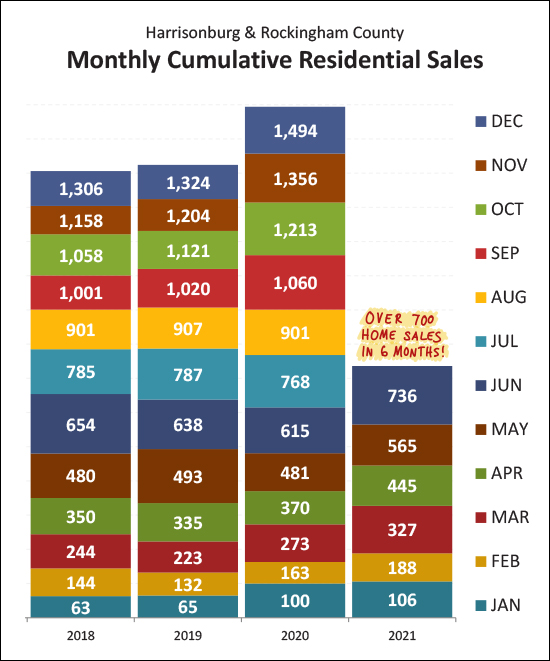 As you can see, with over 700 home sales (736) in the first half of 2021 this year is well ahead of the pace of home sales in the first half of each of the past three years. Looking ahead, it currently seems quite reasonable to think that we would see 1500+ home sales in 2021, with one significant exception. Home sales were tilted towards the second half of the year last year due to Covid, so while we are seeing stronger sales in the first half of 2021 (compared to 2020) things might level out a bit when we get to comparing the second half of 2021 to an abnormally strong second half of 2020. The next visualization is still shocking to me each time I update it with another month of data... 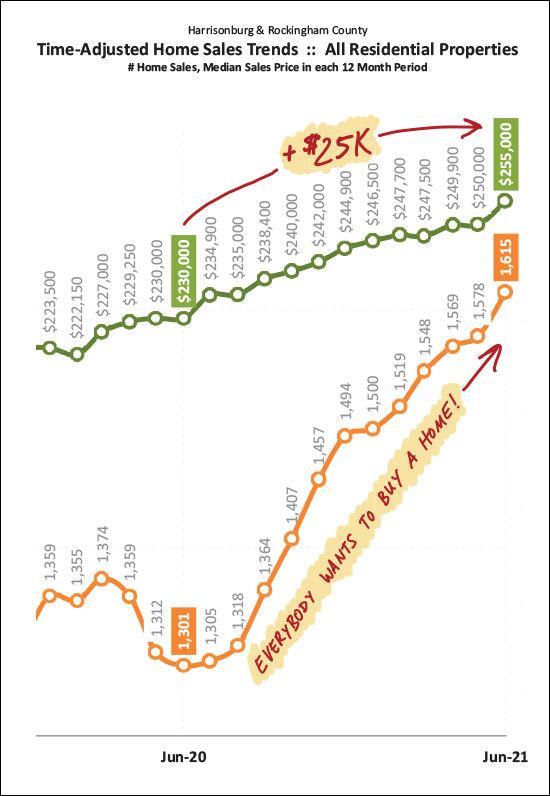 A year ago, 1300-ish buyers were buying homes a year -- now that has risen to 1600+ buyers per year!?! Indeed, it feels like EVERYBODY wants to buy a home... because, keep in mind, this 1600+ per year figure does not include all of the would-be buyers who made offers on houses in the past year but were not successful in securing a contract to buy a house!?! Imagine if there had been enough houses on the market for all of those buyers to have bought as well... The price change (orange line above) over the past year is also somewhat of an eyebrow raiser. The median price has risen $25,000 in the past year. Thus, if you own a home, the value of that property may have very well increased $25,000 over the past year! Admittedly, this varies based on property type, location, price range, etc., -- but suffice it to say -- home values have increased quite a bit in the past year!! Now, just to keep you levelheaded this morning, the next two graphs might make you (and me) say "hmmm..." and "well, let's see what comes next"... 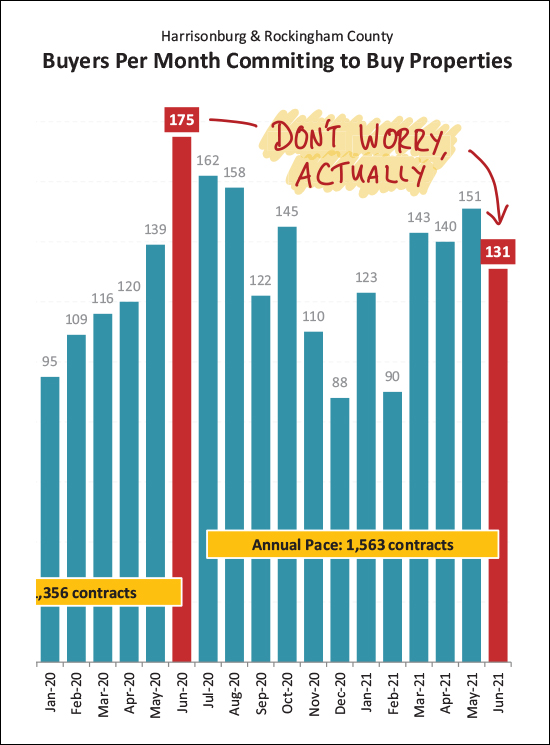 Above, it would appear that the pace of buyers signing contracts has dropped off considerably in June 2021!?!?! ;-) But don't worry too much -- I don't think!? The pace of contract signing in any typical March / April / May is usually quite (!!) active. Last year, buyer activity was significantly suppressed during those normally active months because of Covid -- we didn't know what was happening, what was going to happen, whether the housing market was going to slow down, etc. Then, buyer activity exploded in June of last year and remained quite strong throughout most of the remainder of the year. So, as you look at the decline in June 2021 as compared to June 2020, keep in mind that it was a very unusual June 2020. So, wait and see -- but I don't think June contract numbers mean that our local housing market is slowing down. And now, the second graph to make you say hmmm..... 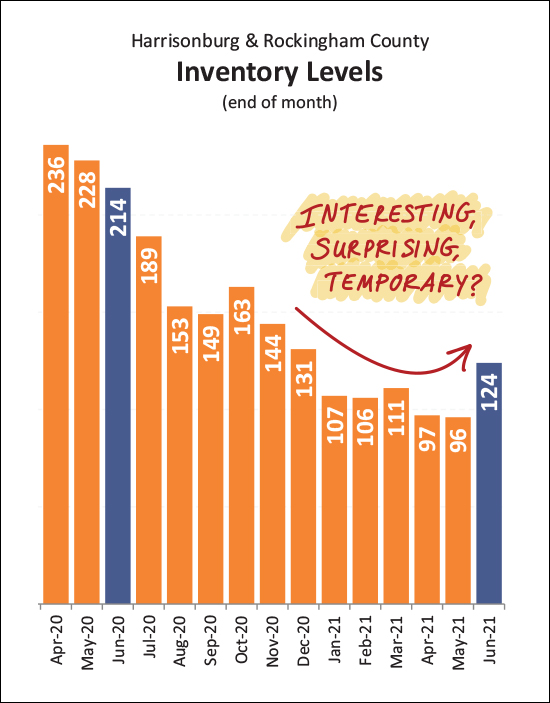 Inventory levels have risen over the past month -- to the highest level in almost six months! This is somewhat interesting and surprising -- but I do also wonder whether it is temporary. I should also point out that this increase in inventory levels only takes us from super-super-super-super low inventory levels up to super-super-super low inventory levels. In the end, most buyers in most price ranges will still find very few choices of homes on the market at any given time. So, I think this is a wait and see -- as to whether we'll start seeing inventory levels rising again, or if this is a one month blip. Lastly, just to remind everyone of at least one of the reasons why so many buyers would LOVE to buy a house right now -- mortgage interest rates are phenomenally low right now... 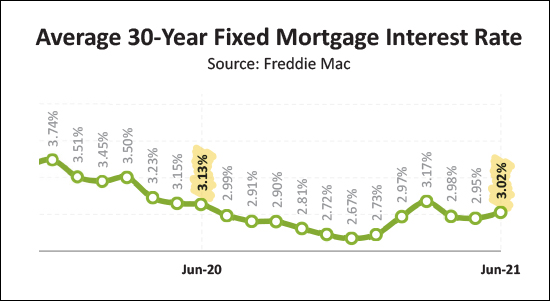 Interest rates have been up and down over the past year, falling as low as 2.67% and rising as high as 3.17%. Clearly, though, anything under 4% still has to be described as absurdly low from any sort of a long term perspective. The cost of financing your home purchase will be very, very low if you are fortunate enough to secure a contract to buy a home in 2021. OK, that's all of the charts and graphs I have for you this morning. A few short takeaways from a big picture perspective... BUYERS: Get prequalified now, see new listings quickly, and carefully consider each contract term of your offer to make it as strong as possible. SELLERS: Prepare your home well, price it reasonably, enjoy a short period of time when you have to put up with showings, and enjoy likely being able to select from multiple offers with favorable terms. HOMEOWNERS: Enjoy knowing that your home value is increasing. :-) If you have questions about buying, or selling, or just want to tell me about the exciting plans you have for the weekend ahead -- drop me a line via email or call/text me at 540-578-0102. Otherwise, enjoy the weekend! | |
June Is Shaping Up To Be A Crazy Month For Local Real Estate |
|
 Yes, I know it's the last day of June -- but it takes a few days after the last day of the month for all of that month's home sales to show up in the MLS. So, until then, you'll have to live with this snapshot of the first 28 days of June. As shown above, there were 115 home sales in the first 28 days of last June -- and 136 home sales in the first 28 days of this June! Again, this is just the first 28 days -- give it another week or so and we'll be able to get a clearer look at the entire month -- but so far it seems June will have been an exceptionally strong month of home sales in Harrisonburg and Rockingham County. The change from 2020 to 2021 shown above marks an 18% increase in the pace of home sales in (the first 28 days of) June. Stay tuned in early July for a full analysis of the first half of the year in our local real estate market. | |
Harrisonburg Area Home Sales and Prices Rising Quickly In 2021 |
|
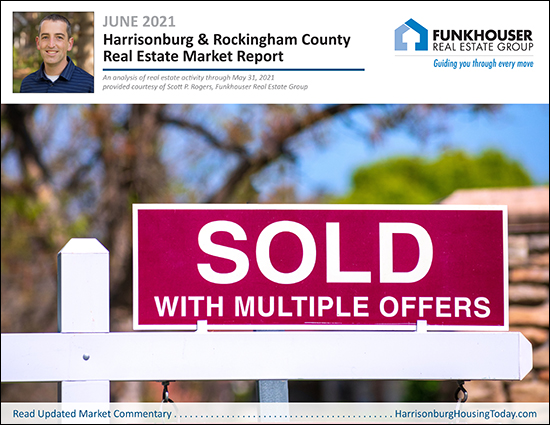 Happy Friday morning to you, friends in the Harrisonburg real estate world and beyond! It is a wild and crazy time right now in the local real estate market with many (many!) homes selling in a matter of a day or two -- often with multiple offers. It is not uncommon to have 5+ (or 10+) offers on a house within the first 48 hours of the house being listed for sale. Which means, as you might imagine, that... [1] It is a delightful time to sell! [2] It is a difficult time to buy! [3] If you need to do both, perhaps it's a wash!? Read on for some numbers and charts and graphs that can help us gain a deeper understanding of some of the current dynamics of our local real estate market -- or download my entire market report as a PDF here. First, the basic overview of how things are looking so far this year... 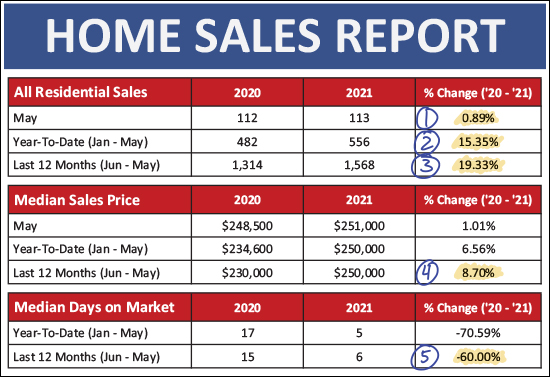 Several things to unpack here, actually... [1] We saw about 1% more home sales this May (the month that just ended) as compared to last May. This is actually a bit surprising. Home sales were rather sluggish last May due to Covid. As a result, I expected we'd see more home sales than we did this May. That said, the limitation on the number of home sales happening these days seems to be more in the area of how many sellers are willing to sell -- as opposed to how many buyers want to buy. So, sometimes when we see fewer homes selling -- it may simply be a result of fewer sellers being ready and willing to sell. [2] Despite only seeing a 1% increase in home sales during May, there have been 15% more home sales in the first five months of this year as compared to the first five months of last year. Thus, don't knock 2021 just yet -- we're well ahead of the pace of home sales that we saw last year. Later on I'll show you an even broader picture to see how 2021 compares to earlier years. [3] When we look at a full year of home sales there has been an impressive 19% increase in the pace of sales. There have been 1,568 home sales in the past 12 months -- compared to only 1,314 home sales in the 12 months before that! [4] Prices keep on rising! The median sales price of all homes sold in Harrisonburg and Rockingham County was $250,000 over the past 12 months -- which is a 9% increase over the median of $230,000 during the prior 12 months. [5] Homes are selling fast -- FAST! The median days on market has dropped 60% over the past year, from a median of 15 days to a median of 6 days. The median days on market is a measure of how many days it takes for a house to go under contract once it is listed for sale. OK, phew, now -- onto one slight nuance that bears noting... 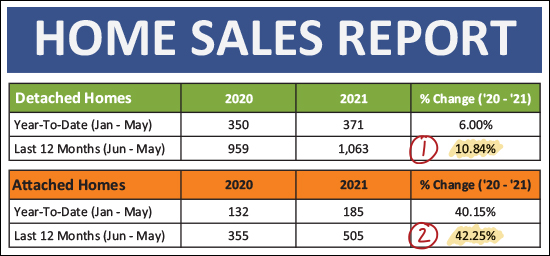 The chart above is comparing detached home sales (green section) to attached home sales (orange section) over the past year. While we have seen a respectable 11% increase in the number of detached homes selling -- we have seen an astonishing 42% increase in the number of attached homes selling! These attached homes are duplexes, townhomes and condos -- and a good number of those are likely new homes. Most new dwellings currently under construction are attached homes -- which contributes to the larger increase in the sale of attached homes. Here's another visual look at what was actually a somewhat surprisingly low month of home sales in May 2021... 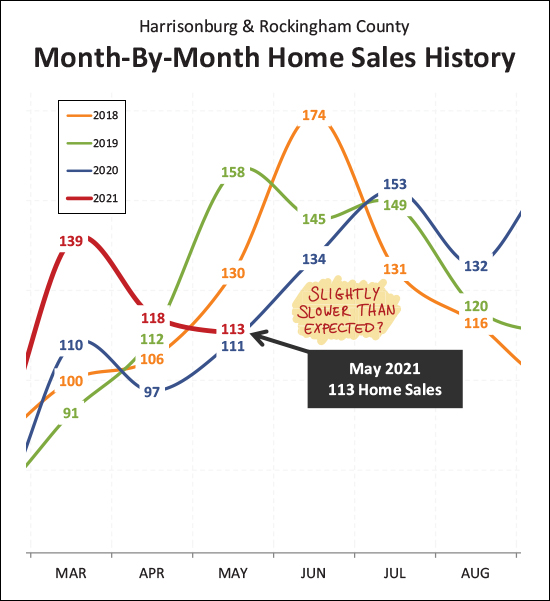 As stated previously -- home sales in May 2021 were lower than I thought they'd be given past months of May. During May of 2018 and 2019 we saw 130 and 158 home sales -- but that dropped down to only 111 home sales in May 2020, largely due to Covid. So, yes, I was surprised to only see 113 home sales in May 2021. I expect we'll see home sales pop back up in June -- but as also stated previously, this will largely depend on enough sellers having been willing to sell! Now, let's look at the first five months of this year compared to the same timeframe for the past three years... 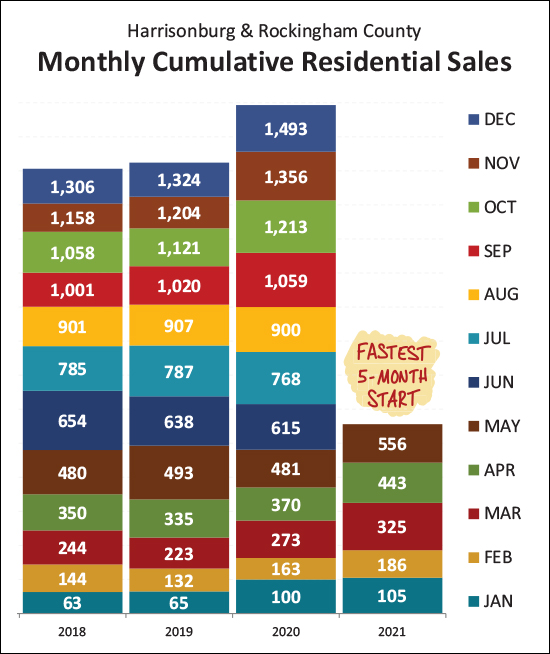 As shown above, we've seen 556 home sales thus far in 2021 -- which is well ahead of the pace we saw for each of the past three years. Thus, even though 2020 ended up being a wildly active year for home sales (1,493) it would seem that 2021 might be on track to surpass that pace! Buckle your seat belts -- if we're going to get there, to perhaps 1500+ home sales -- it's going to be a wild ride for the next seven months of the year. Here's a visualization of how the annual pace of home sales has been speeding up... 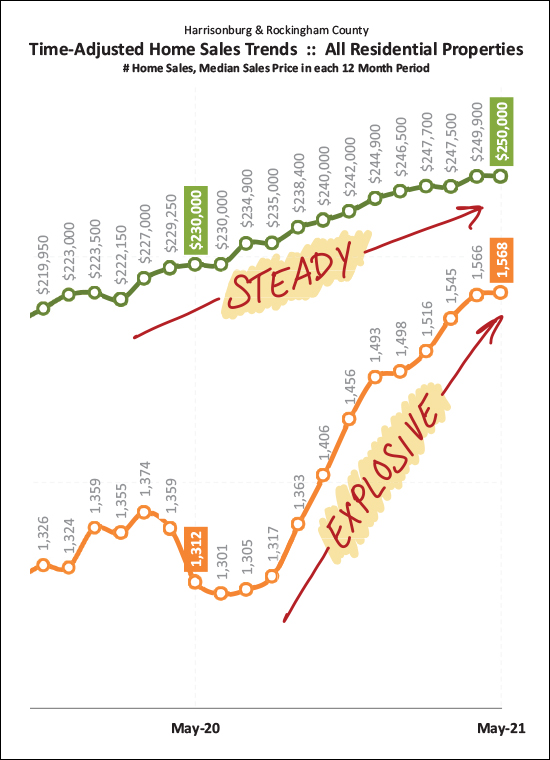 As I have described it above -- [1] We have seen STEADY growth in the median sales price over the past year, plus. The current median sales price of $250,000 is 9% higher than it was a year ago. [2] We have seen EXPLOSIVE growth in the pace of home sales over the past year. The current pace of 1,568 home sales a year is 20% higher than it was a year ago! Will home prices keep rising forever? Maybe so. Will the pace at which they increase start slowing? Maybe so. Here's a brief look at that dynamic just five months into the year... 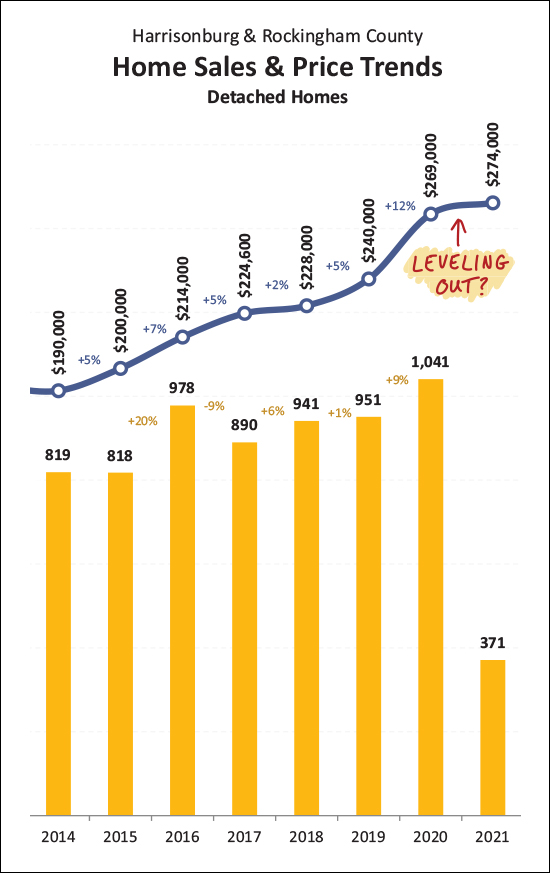 When looking just at single family homes, above, we find that... In the five years before 2020 we saw between a 2% and 7% increase per year in the median sales price. On average, the median sales price increased 4.8% per year between 2014 and 2019. But then, 2020. :-) We saw a 12% increase in the median sales price of single family homes between 2019 and 2020. So, what will happen in 2021? Well, we're only five months into 2021 thus far -- AND, if you ask most active Realtors in this area, they'd likely tell you that, anecdotally, home prices seem to be accelerating even more this year than last year -- BUT, thus far we have only seen a 2% increase in the median sales price in 2021. So, stay tuned. I'll keep monitoring this as the year continues. I don't think the median sales price is going to actually flatten out or decline -- but I also don't think we'll necessarily see another 12% increase this year. OK, this next one requires a bit of thought and explanation, but bear with me... 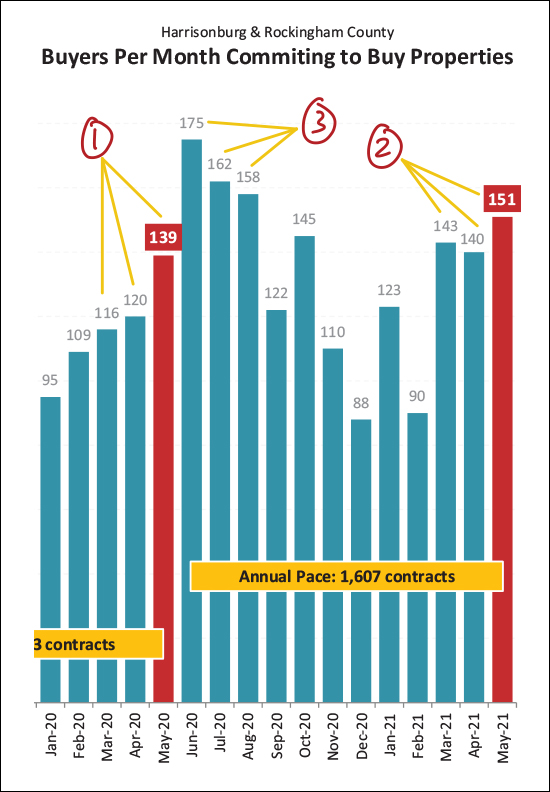 When it comes to contracts signed per month, as shown above, here's what I'm trying to point out... [1] Last spring (March, April, May) only 375 buyers (and sellers) signed contracts. This was likely a bit slower than normal because of Covid. [2] This spring (March, April, May) things were much more active, comparatively, with 434 contracts signed. [3] Last summer (June, July, August) was extremely active -- with 495 contracts signed. This was likely somewhat the result of the market bouncing back after a slower spring. So, what's in store for summer 2021? It's hard to say if we'll have as strong of a summer as we saw last year -- and as mentioned several times thus far, a huge impact on the pace of sales, and contracts being signed, is how many sellers are ready and willing to sell. The buyers are certainly there waiting to pounce! Now, perhaps one of the most confusing and most depressing graphs... 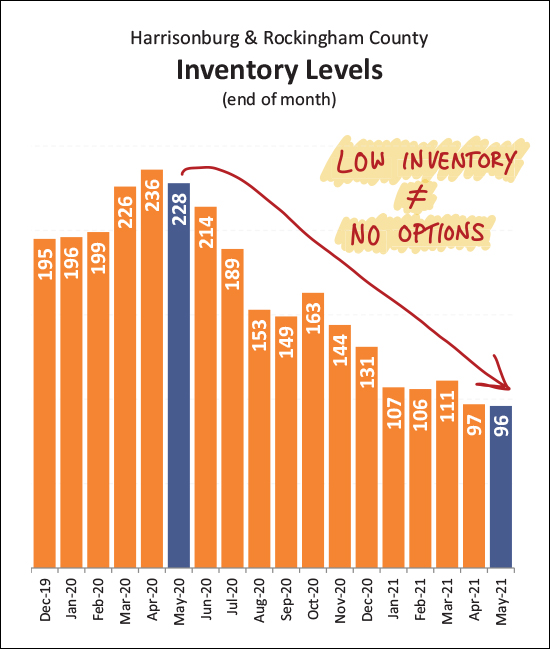 Lots going on here in this relatively simple graph... [1] A year ago a buyer would have found 228 homes on the market for sale in Harrisonburg and Rockingham County. That end-ish of May inventory figure has tumbled 58% over the past year to where current buyers are only finding 96 homes for sale right now!? [2] Bear in mind that low inventory does not mean no options. While buyers at this exact moment have 58% fewer choices than they did a year ago -- technically, they have had about 19% more options of what to buy over the course of the past year as compared to the prior year. After all -- the 19% increase in the number of sales in the past 12 months (compared to the prior 12 months) is a result of 19% (or more) new listings having coming on the market in the past year as compared to the prior year. [3] How can this be? How can a buyer have had 19% more options over the past year but 58% fewer options today? It's a result of the how quickly homes are going under contract. Lots of new listings have come on the market over the past year but they have been going under contract faster and faster and faster, resulting in fewer and fewer and fewer homes left on the market for buyers at any given point in time. What's one of the reasons why so many buyers are buying right now? 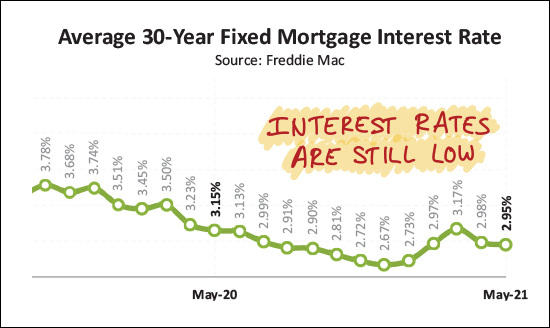 Low mortgage interest rates are making it a very compelling time for buyers to buy right now. Even if prices are going up, interest rates are super low -- and buying with such a low interest rate allows you to lock in the largest part of your monthly housing cost (principal and interest) at a super low payment given these super low rates. Alrighty then! If you made it through all of the charts and graphs and commentary above, hopefully you are feeling like you have a relatively good understanding of some of the market dynamics affecting our local real estate markets. Now, the "so what" of all of these market dynamics... HOME BUYERS - It's definitely possible to buy a home right now, but you're going to have more competition than ever before. You need to have a lender letter in hand, see a house within the first day (or two) of it being listed for sale, be ready to make an offer very quickly, and be willing to consider paying over the asking price and limiting your contract contingencies. It's a tough market, but well prepared, decisive, strategic buyers are winning contracts on houses. HOME SELLERS - You will likely sell your home more quickly, at a more favorable price, and with more favorable terms than you would have a year ago. That said, if you do receive multiple offers within the first week of being on the market, we'll need to make sure we're picking the offer with the most favorable terms overall, that stands the best chance of making it successfully to closing. HOME OWNERS - If you love your home, or even if you just like it pretty well, great! Settle in and enjoy owning a home during a time when home values are increasing quickly and when homes are hard for buyers to buy. Just like toilet paper, swimming pools, lumber, gasoline, and cars -- houses are in short supply and are getting more expensive. Enjoy the fact that you already own one! If you're looking to connect with me to talk about buying or selling a house, perhaps this summer, feel free to reply to this email or call/text me at 540-578-0102. Until next month, I hope you are able to find some time this June to relax and enjoy this first month of summer 2021! | |
Does The Current Rise In Home Prices Mirror The Last Real Estate Boom? |
|
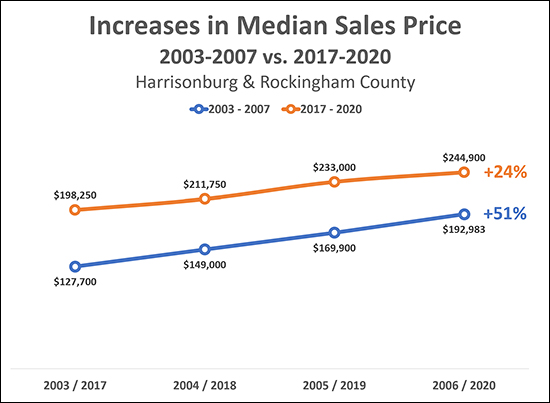 At first glance, yes, the current increase in median sales prices DEFINITELY mirrors the last run up in prices.
But, let's look a bit closer... Last Time...
As an important side note -- the median sales price then flattened out (2006-2008) and next declined 13% between 2008 and 2011. This Time...
So... Yes - median sales prices are currently increasing much faster than normal from any historical perspective and it seems unlikely that they could keep going up like this forever. But - the current increases in median sales price (+24% over three years) are only about half the size of the last time we saw a real estate boom (+51% over three years) so it's not quite as severe of an increase as last time. Certainly, though, many wonder if median sales prices will flatten out (seems possible) or decline (seems less likely) in the coming years. | |
Home Sales Up 19% In Harrisonburg, Rockingham County In 2021 |
|
 Happy bright, sunny, soon-to-be-hot, Wednesday morning to you! Curious about how things are going in our local real estate market? Here's a snapshot of what now just seems like a typical day in the local real estate market... Driving To Work In The Morning: "Oh, look, that house was just listed for sale!" Driving Home From Work In The Evening: "Wait!? What!? Already under contract!?" Indeed, homes are selling FAST right now - often with multiple offers - often selling over their asking price. Feel free to download a PDF of my full market report or keep reading as I dive into the data to take a closer look at the latest trends... 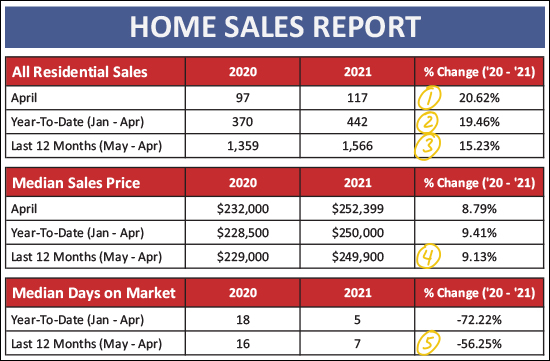 As shown above...
So, if April 2021 home sales were way above April 2020, how did they compare to other recent months of April? 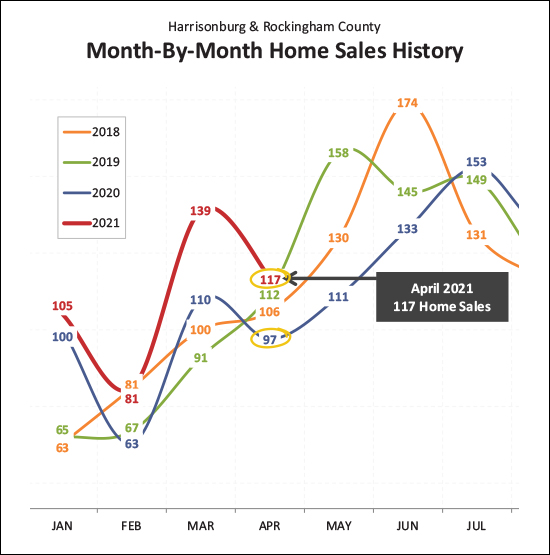 As shown above, this month of April -- with 117 home sales -- was the strongest recent month of April. The next strongest month of April was in 2019 when we saw 112 home sales. Looking ahead, it seems likely that we'll see somewhere between 130 and 160 home sales in May, if 2018 and 2019 are a good guide. It seems unlikely that we'll sink as low as the 111 home sales we saw in 2020 during the start of Covid. Slicing and dicing things a bit differently, this year has stacked up quite nicely compared to past years... 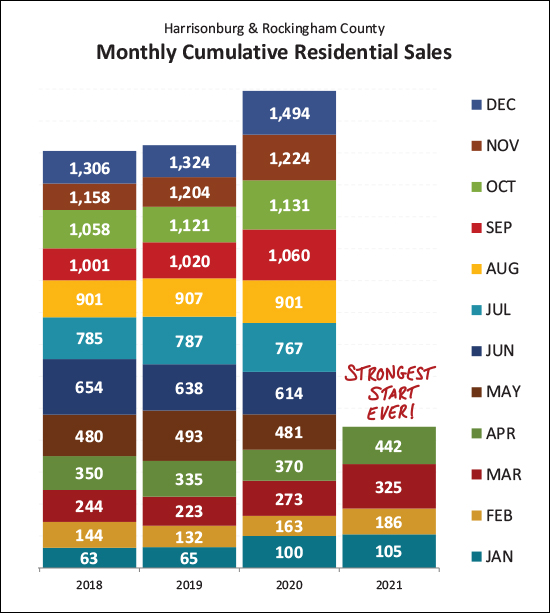 With 442 home sales in the first four months of this year, this is a very strong start compared to the past few years, and even most/all of the years prior that are not shown! Here's another visualization of the surge of home sales activity we have been experiencing over the past year... 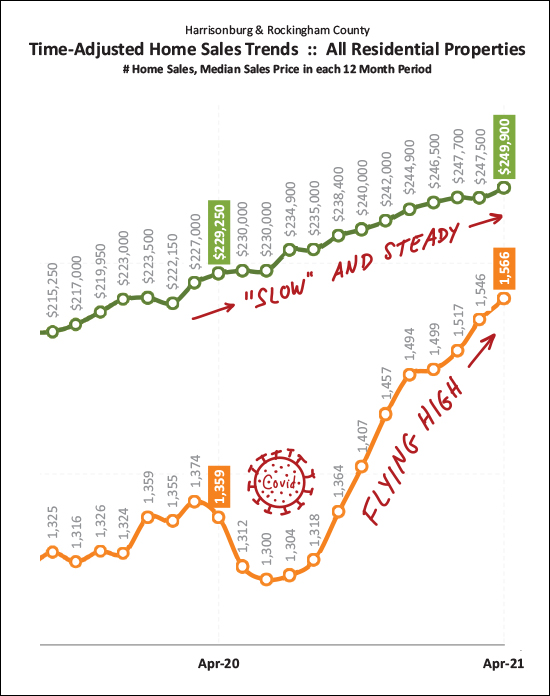 The orange line above is the one that looks a bit odd right now - largely due to Covid. After seeing the annualized pace of home sales steadily increase for several years, things dropped off quickly between April and July of 2020 due to the onset of Covid. But then, things started heating up -- quickly! Home sales have been flying high, increasing ever further and faster, for the past nine months and aren't showing any signs of slowing down. Sales prices, on the other hand, didn't take a nose dive last spring -- they have been "slowly" and steadily plodding along and upward. I say "slowly" because the increase has not been at the same breakneck speed of home sales -- but we have seen a much higher than normal (9%) increase in sales prices over the past year. What should we expect over the next few months, you might ask? 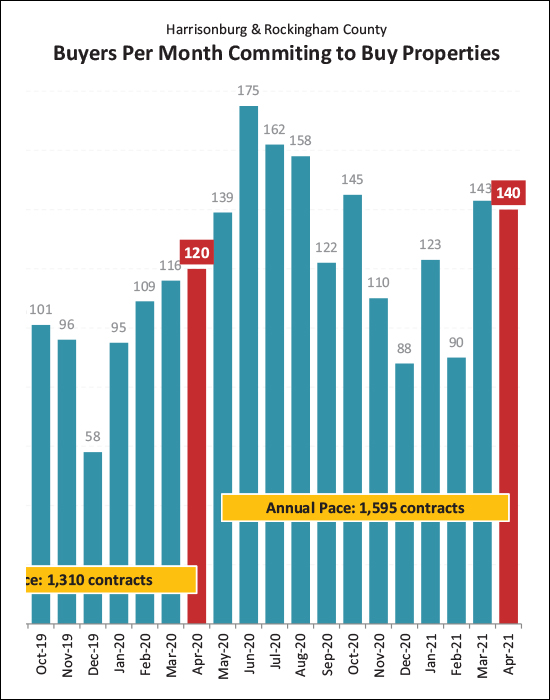 We have seen many more contracts over the past two months (143, 140) than we saw during those same months last year (116, 120) though - to be fair - last March and April were an uncertain time due to Covid. The number of contracts signed over the past two months does, though, indicate that we'll see strong months of closed sales over the next two months -- and we're still at the front end of the strongest six months of the year as far as the number of homes that sell in Harrisonburg and Rockingham County. So, don't expect things to slow down or calm down anytime soon! Several folks have asked me over the past month -- how can so many homes be selling when inventory levels are so low!? 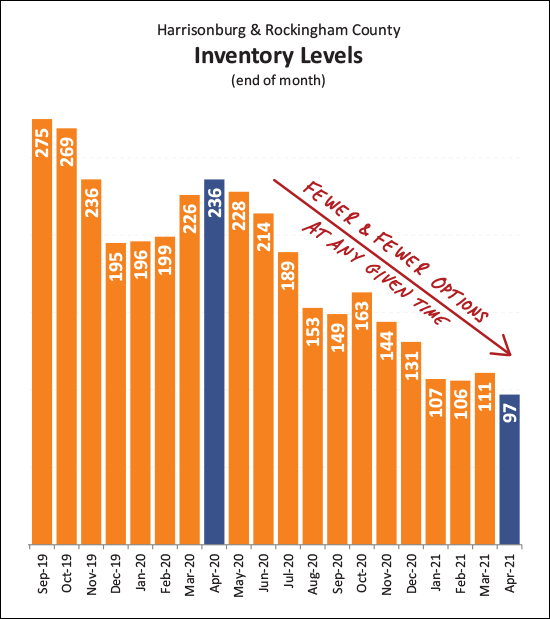 Indeed, a confusing phenomenon, at first. There are fewer houses on the market right now than at any time in the past several years. Buyers today have less than 100 homes to choose from in all of Harrisonburg and Rockingham County. But -- that doesn't tell the whole story. Quite a few new listings come on the market each month -- giving buyers quite a few choices over a month long period -- but because so many of those new listings are going under contract so quickly, the influx of new listings never has a net impact on the number of houses remaining actively for sale at the end of each month. So - you won't have many options of homes to buy in a single day, but if you can give it a few weeks or months, you should have plenty of options over time. Did I mention that homes are going under contract quickly? 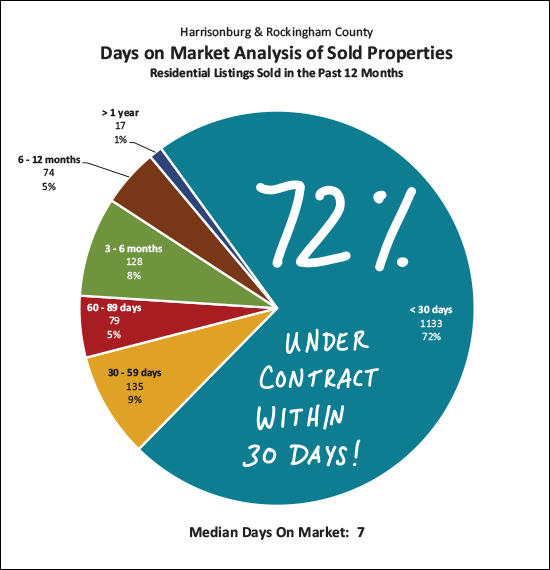 Over the past year, 72% of homes have gone under contract within 30 days -- and half of homes have gone under contract within 7 days!?! This rapid pace of buyers signing contracts on homes is what is keeping inventory levels so low. If you're just entering into the market to buy, you'll likely be astonished / disappointed by how few options you have right now -- but again -- just give it a bit of time and evaluate those new listings as they come on the market -- but do so quickly, before they are under contract! If you're fortunate enough to secure a contract on a house, you are likely excited about the low interest rate you'll have on your new mortgage... 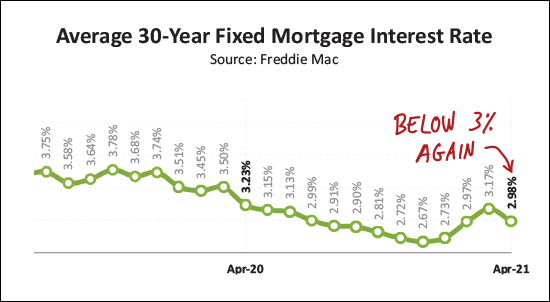 After having started rising -- above 3% -- the average 30 year fixed mortgage interest rate has dropped (barely) below 3% again. This is an outstanding (and historically low) interest rate that gives current home buyers a unique opportunity to lock in a low long term interest rate on your mortgage. So, there we have it. Lots of homes are selling, quickly, at higher prices than ever. What is a seller to do?
What is a buyer to do?
If you're thinking about buying or selling soon and would like to talk a bit more about your particular situation, I'm happy to meet with you or set up a time to chat by phone or zoom. Simply reply to this email or text/call me at 540-578-0102. Best wishes for a pleasant balance of the month of May, and I'll be in touch again in June! | |
Nearly 500 Buyers Secured Contracts On Homes In First Four Months of 2021 |
|
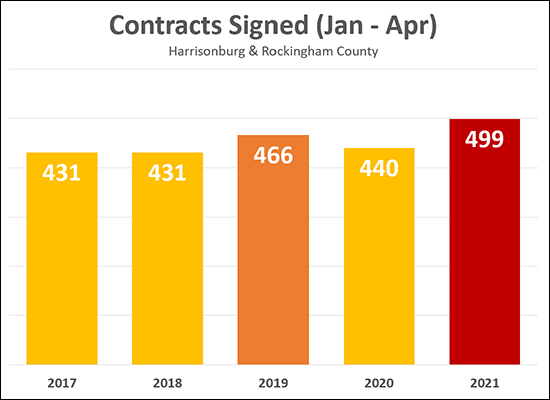 As shown above, for three of the past five years, around 430 - 440 buyers signed contracts to buy homes between January and April. Two years ago, in 2019, there was a bit more contract activity than normal with 466 buyers signing contracts to buy homes. But this year -- in 20201 -- we set new records! Nearly 500 (499) buyers (and sellers) signed contracts to buy (and sell) homes between January and April 2021. You might ask -- how is this possible -- I heard inventory levels are super low!? It actually works the other way around. It is not remarkable or mysterious that this many buyers secured contracts to buy homes despite low inventory levels... The inventory levels are so low because so many buyers secured contracts to buy homes! Buckle up - this seems bound to be a fast paced year in the local real estate market! | |
13% More Contracts Signed This Year than Last |
|
 It has been a busy few months for home buyers in Harrisonburg and Rockingham County. During the first four months of this year, 510 contracts have been signed for residential properties. This is 13% higher than the number of contracts during the first four months of last year. Some might find this increase in contract activity surprising as inventory has been extremely low all year but this statistic shows that even though there are not many homes on the market at any given time, there have enough new listings coming on the market for more buyers to contract on homes this year than last during this timeframe. If I had to guess how many offers were written in the first four months of this year versus last, here are the make-believe statistics I would come up with...
There are a tremendous amount of buyers attempting to buy homes right now which results in many of them finding themselves making offers on multiple houses before they finally are the winning buyer on a particular house. It will be interesting to see how the next few months ago but at this point I suspect we will continue to see strong contract activity through the summer of 2021. | |
Home Sales Soar In First Quarter of 2021 in Harrisonburg, Rockingham County |
|
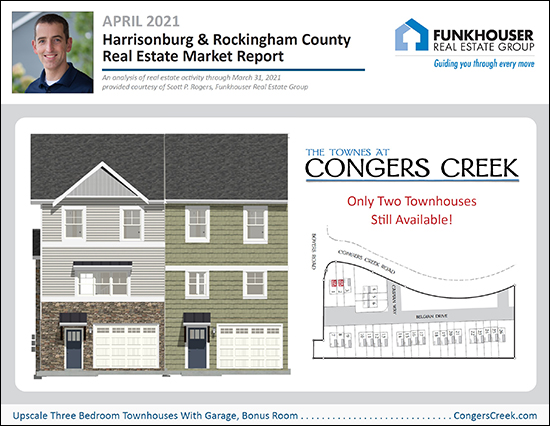 Happy not-really-tax-day, friends! (taxes are due May 17 this year) What a wild first three months of the year it has been thus far in the Harrisonburg and Rockingham County real estate market! Before starting to pick through the data to find some meaningful insights, here are a few general notes for you...
Now, let's dive right into the data and see what we can learn about our local housing market... 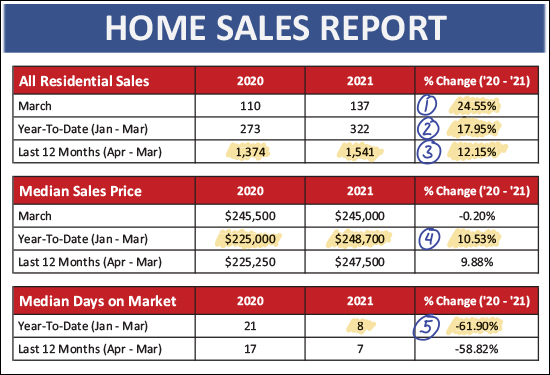 OK, some of these numbers (above) are just bonkers...
Now, then, let's take a look at a break down of detached homes (single family homes) and attached homes (duplexes, townhomes, condos)... 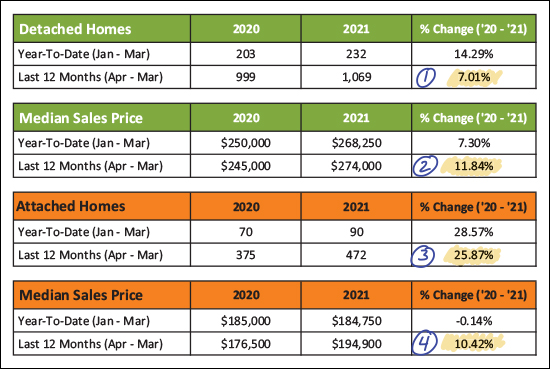 A few things to note when we look at this data sliced a bit differently than in the first data table... [ 1 & 3 ] While sales of detached homes increased 7% over the past year compared to the prior year, sales of attached homes increased 26% during that same timeframe. [ 2 & 4 ] The median sales price of detached homes increased 12% over the past year which is just slightly higher than the 10% increase in the median sales price of attached homes. Chopping the data up one more time by City vs. County we can note some differences as to how these two portions of our local market are performing... 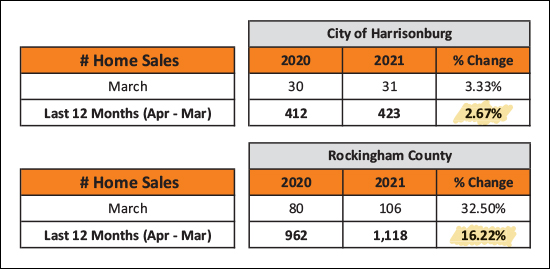 The data above is just looking at where we are seeing home sales increase and by how much. Over the past year there has been a 3% increase in the number of homes selling in the City -- while there has been a 16% increase in the number of homes selling in the County. I believe this is primarily because the majority of new construction is now happening in the County -- thus those sales numbers have more of an ability to grow as compared to the City numbers where most home sales are resales. OK, next, let's visually contextualize that exciting month of March... 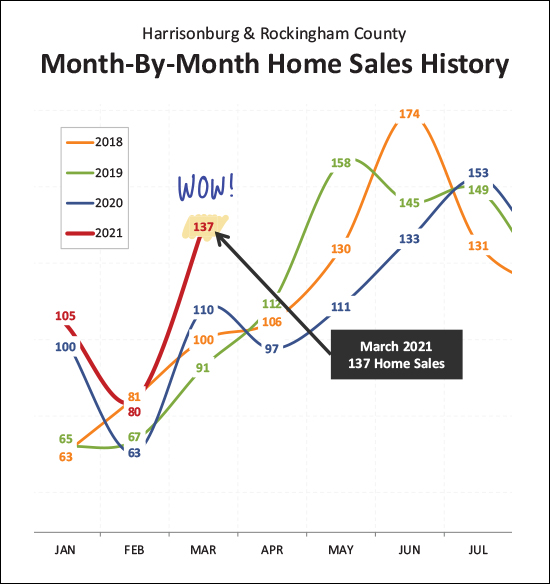 Indeed, March was a BUSY month of home sales in Harrisonburg and Rockingham County. While I am only showing three years of data above, the file I'm working in when I create these reports includes data all the way back to 2003 when I started in real estate. There has never, in that time, been a month of March where we have had 137 or more home sales in Harrisonburg and Rockingham County! Given contract data (we'll look at that a bit later) it seems likely that we will see another strong month of sales in April and May, which means the year is likely shaping up to be a year of a LOT of home sales. Which leads me to... 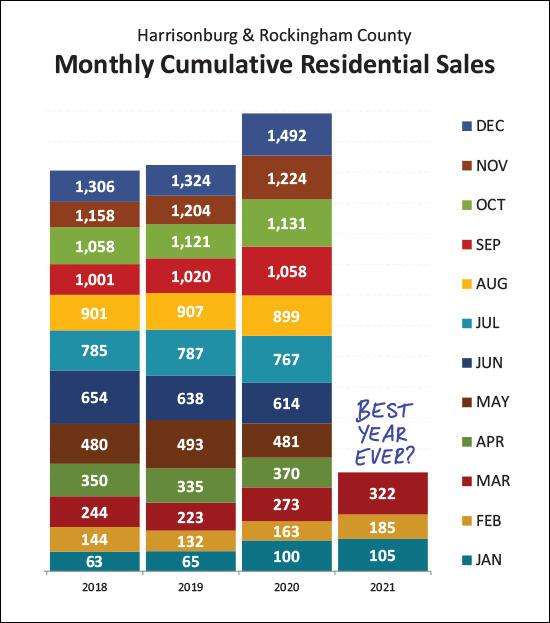 I put this graph together by stacking each month of home sales on top of the prior to see how each new year stacks up in comparison to past years. As you can see, above, this year (2021) is currently poised to be the best year ever as far as the number of properties selling in Harrisonburg and Rockingham County. So, lots of homes selling, how did we get here? 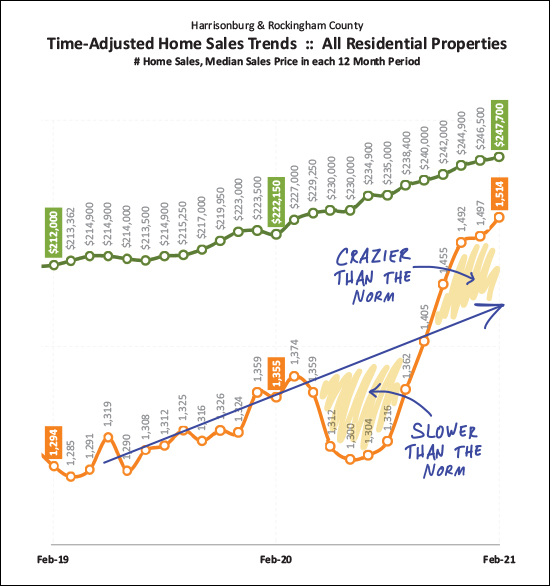 We didn't get here (1500+ home sales) without some turbulence. A year ago we had seen a slow and steady increase from 1300 sales/year up to 1350 sales/year. Then the COVID dip and then the COVID spike! Looking back, we had a five month period with far fewer home sales than we would have expected given our overall trajectory. And now, we are in the fourth month of what a much (much!) more active market than we would have expected given our overall trajectory. Now, you might find yourself saying that things have been crazy for MUCH longer than four months. Yes, you are right. The graph above is looking at a rolling 12 months of home sales, which evens out some of the peaks and valleys of home sale seasonality, but also can mean it takes longer for overall trends to appear. And yes, I know you probably didn't need a graph to tell you that a lot of homes are selling these days... but this graph made me realize that these two conflicting realities are being experienced daily in our local market...
But I digress. Lots of homes have been selling. What is to come over the next few months? 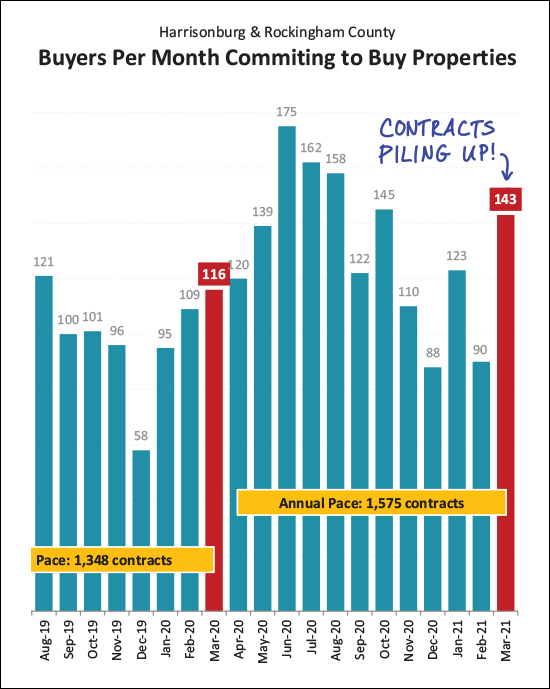 Well, based on a STRONG month of contract activity in March (143 contracts) it would seem that we'll continue to have strong months of home sales in the coming month or two. Furthermore, we're entering into what is typically one of the busiest seasons for buyers to be buying homes, so I expect contracts and closed sales to continue to stay at higher levels for the next five or six months, at least! And now, I think I mentioned (or you may have heard) that there aren't many homes for sale right now... 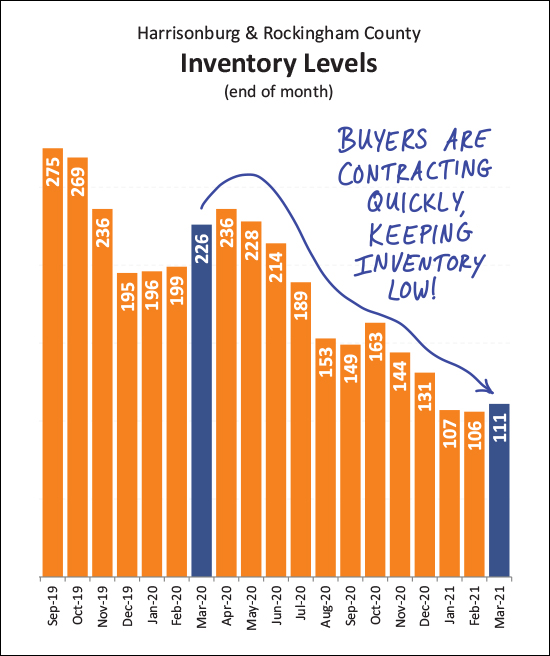 Yes, it is true. Even though we are seeing an ever increasing number of homes selling, we are also seeing an ever declining number of available listings. As I recently commented to a client, if we start the month with low inventory and 5,000 homes are listed for sale and 5,000 homes go under contract, we will still end the month with low inventory. As such, understand low inventory fully by remembering that...
Finally, just one more graph for your perusal... 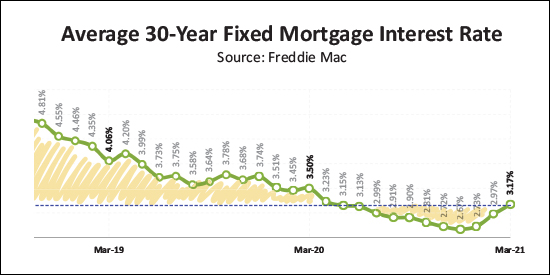 This graph shows trends in the average 30 year fixed rate mortgage interest rate and there are a few things to note here as well...
Alright, that's all I have for you at this point. You are now up to speed on the latest news and developments in our local housing market. But if you are thinking about buying or selling sometime soon, these general market trends are only part of what you want (and need to know) as you also should dig into the market in which you are hoping to buy or sell -- whether that is best defined by price range, location, property type, etc. If I can be of help to you as you make plans to list your home for sale, or to seek a home to purchase, just let me know. I'd be happy to meet with you in person, via Zoom, or to chat by phone to help you think and talk through the possibilities. You can reach me at scott@hhtdy.com or via phone/text at 540-578-0102. Until we chat, or until I write again, here a few final tips... Sellers - Even though the market is hot, you still need to prepare your home well, price it appropriately based on historical sales data and market it thoroughly and professionally. Buyers - Get prequalified for a mortgage, start stalking new listings, go see them on the first day they hit the market, and get ready to compete in a multiple offer situation. Seller / Buyers - If you need to (or want to) sell in order to buy, this will require a bit more strategery than normal. It can be done, but we need a solid plan in place from the start. | |
Is My Home Value The Same As The Tax Assessment Or Zestimate? |
|
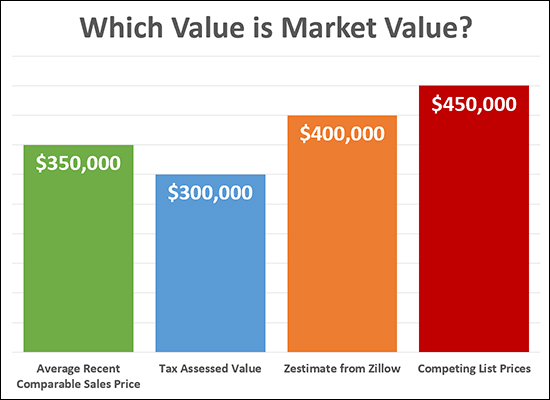 Which one of the values above is the "market value" of the imaginary home in question? The answer is -- the GREEN bar -- a home's value is most often determined by how much other buyers have recently paid for similar properties. A would-be buyer might WANT the home's value to be the "tax assessed value" -- but that might be quite a bit lower than the recent sales prices -- so a home's tax assessed value is not necessarily the home's market value. A would-be seller might WANT the home's value to be the "Zestimate" from Zillow -- but that might (often, usually) vary quite a bit from a home's market value -- so a home's Zestimate is not necessarily the home's market value. A would-be seller might REALLY WANT the home's value to be the same as the list price on competing properties currently for sale -- but those listings might sit on the market forever with unreasonably high list prices -- so the list price of competing listings is not necessarily the home's market value. Now, this scenario would be much easier... 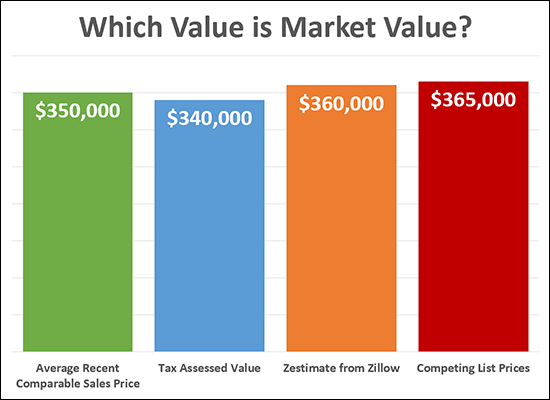 As you can see here, there isn't too much of a difference between the different values -- so it matters a bit less which of the value perspectives we use when estimating a likely sales price and planning for a potential list price. But in the case where there is quite a bit of separation in these different value perspectives -- stay focused on what other buyers have recently paid for similar properties -- this alone is your best guide as to what you can/should expect the next buyer to be willing to pay for your house. | |
The Harrisonburg Area Real Estate Market Is As Strong As Ever Two Months Into 2021! |
|
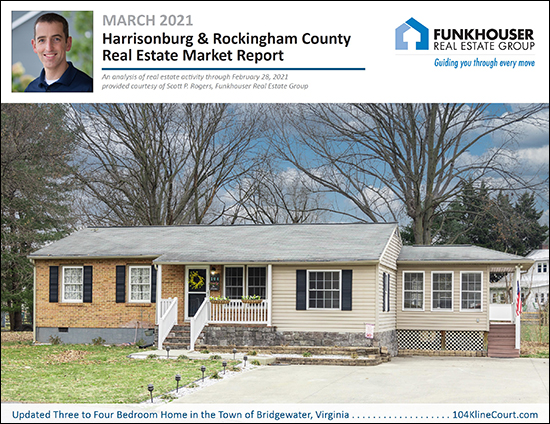 Happy Thursday morning to you! It's been a busy week on my end, what with St. Patrick's Day yesterday, and my daughter's 13th birthday the day before (Happy Birthday Emily!) so forgive me for the slight delay in getting the news to you that... The Harrisonburg Area Real Estate Market Is As Strong As Ever Two Months Into 2021! Before I dive into the data below, a few quick links...
Now, on to the data... 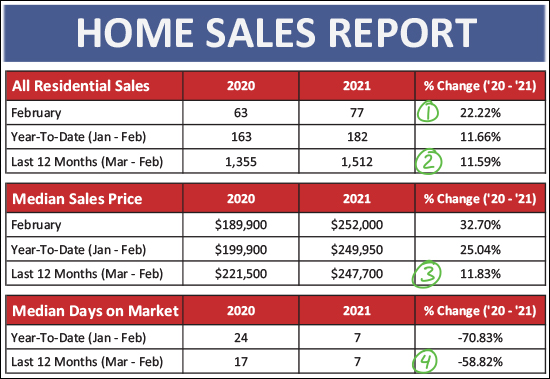 As shown above, with St. Patrick's Day green numbers for ya, you'll note that...
So -- more home sales, at higher prices, selling more quickly! Sounds like a good time to be a seller and a bit less exciting of a time to be a buyer! What might develop as we finish out March? 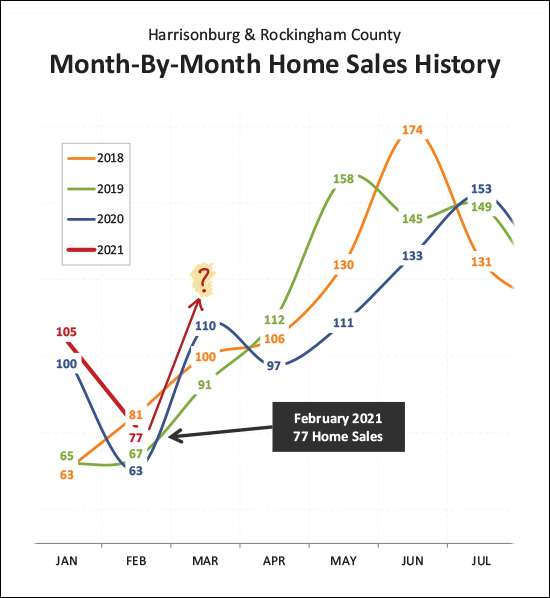 You might notice that the 77 home sales seen in February 2021 was higher than last February (63) but was not the strongest recent month of February home sales. There were 81 home sales back in February 2018. Looking ahead to March, will we see more than 110 home sales close? It seems quite possible! Here's the data stacked up a bit differently... 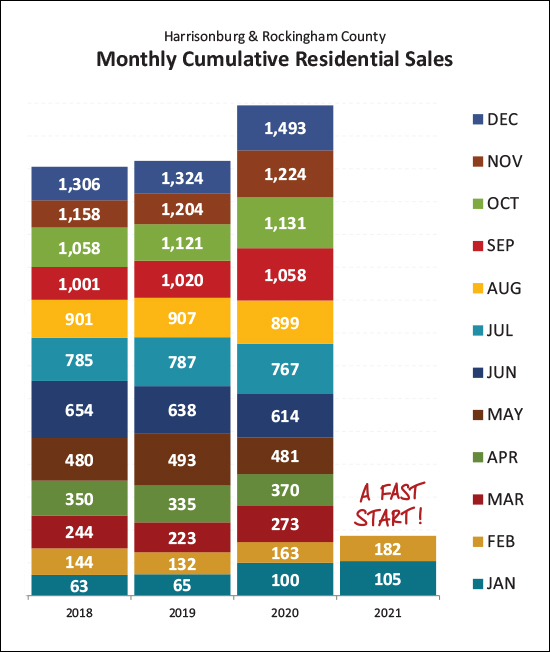 As shown above, the January + February sales pace during 2021 of 182 home sales is the fastest start we've seen in the past several years. This is a good indication (though not a guarantee) that a relatively strong year of home sales lies ahead of us. You've seen a version of this graph below, but it surprises me again every time I see it... 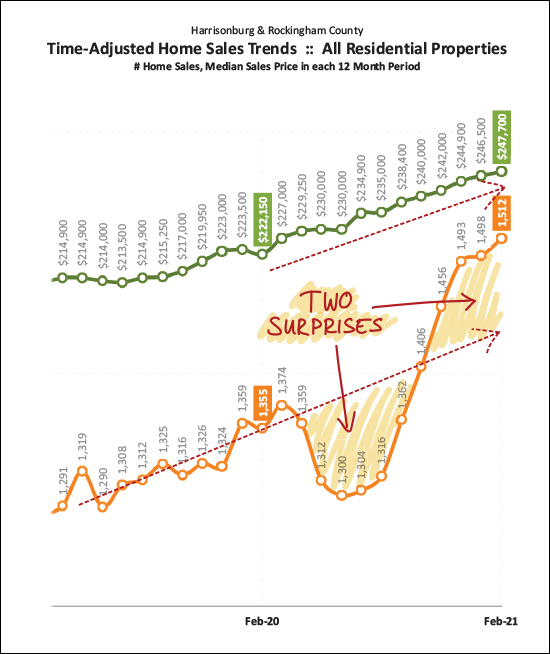 The orange line (above) is tracking the number of home sales per year -- measured each month. Throughout 2019 and into the beginning of 2020 this was steadily increasing, from just below 1300 to nearly 1400. Then, Covid hit -- and within a few months the annual pace of home sales had dropped back down to 1300 sales per year. That's the downward dip shown above. Then, as we made it into the summer and fall (and winter) of 2020, the pace of home sales picked up incredible momentum, and accelerated beyond where we might have expected it to have been otherwise -- as shown with the dashed red line. All the while, the median sales price just kept on climbing, up to its current level of $247,700 as compared to $222,150 a year ago. So, Covid dealt us two surprises -- a rapid slow down and then a fast and furious rebound! 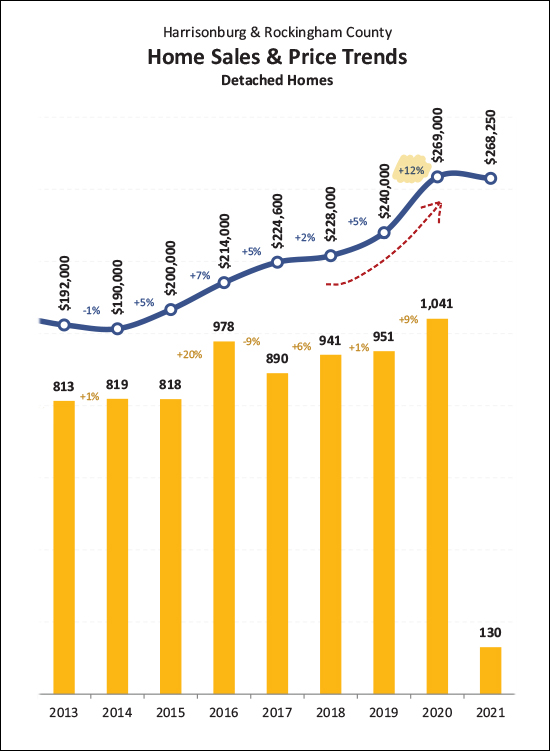 As noted previously, sales prices are on the rise. The median sales price of all detached homes (not duplexes, townhouses or condos) sold in Harrisonburg and Rockingham County (via the HRAR MLS) rose 12% in 2020 -- from $240,000 up to $269,000. If you bought a home in the past year, you likely paid 5% to 15% more than you would have a year prior. Not as fun for you as a buyer -- though the seller on the other end of your purchase transaction likely thoroughly enjoyed that increase! Looking ahead, again... 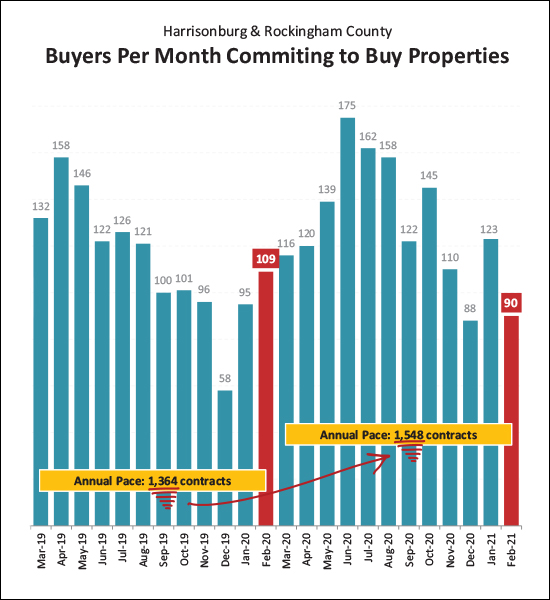 While we have seen a significant increase in the annual pace of contracts being signed (1364/year up to 1548/year) the number of contracts signed in February did actually drop off a bit from last year. Admittedly, the January 2021 contracts helped keep the Jan/Feb numbers higher this year than last, but this February did have a bit slower pace of contract signing than I expected. Maybe this smaller number of contracts has something to do with inventory levels?? 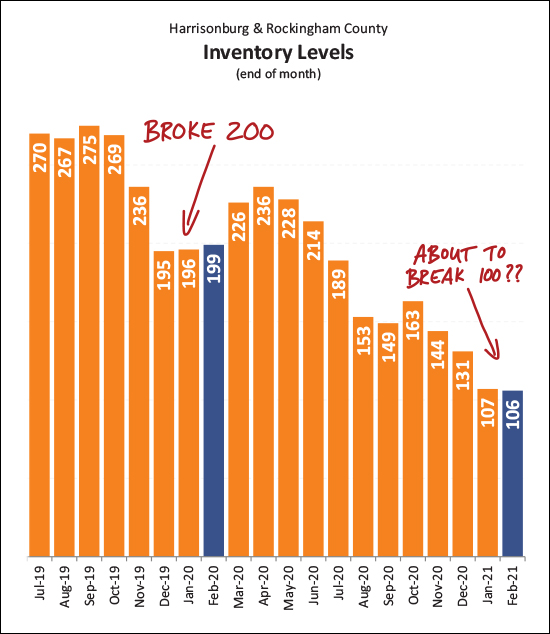 A year-ish ago I thought it was quite something that we had broken through the 200 mark -- and all of a sudden we were in the 190's as far as the number of homes for sale in all of Harrisonburg and Rockingham County. But now -- we might break through the 100 mark?? A month ago there were 107 homes for sale -- now 106. Please, let's keep it to triple digits -- let's not get down to only 95 or 97 homes for sale!? One of the reasons buyers haven't minded (too terribly) that they were paying higher prices for homes over the past year was because mortgage interest rates were soooooo low... 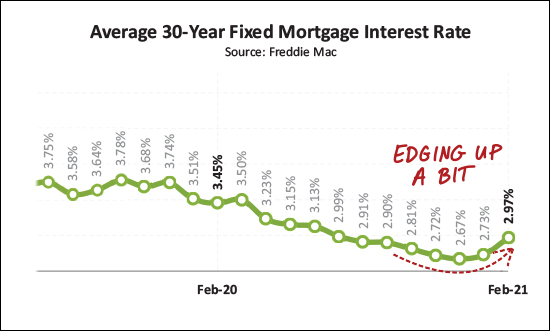 But now, yes, mortgage interest rates are starting to rise a bit. It doesn't seem likely that they will rise dramatically through 2021, but the lows of being below 2.75% might be (??) behind us for good. OK -- I'll wrap it up there for now. A bit less than a month from now I'll send you another update on where we are a full quarter of the way through the year. My how time flies! Until then... Sellers - Even though the market is hot, you still need to prepare your home well, price it appropriately based on historical sales data and market it thoroughly and professionally. Buyers - Get prequalified for a mortgage, start stalking new listings, go see them on the first day they hit the market, and get ready to compete in a multiple offer situation. Seller / Buyers - If you need to (or want to) sell in order to buy, this will require a bit more strategery :-) than normal. It can be done, but we need a solid plan in place from the start. | |
Are Home Prices Only Going Up Because Mortgage Interest Rates Are Going Down? |
|
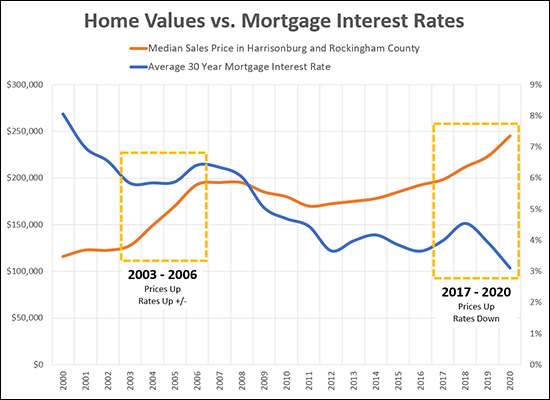 Disclaimer: I am not an economist. I don't play an economist on TV. Or on this blog. Feedback from actual economists, or accountants, or financial analysts, or wise guys is welcome: scott@hhtdy.com So, are home prices going up because mortgage interest rates are going down? Maybe yes AND no? Yes...
No...
So What...
Why...
| |
Why Did So Many Homes Sell In Our Area In 2020? |
|
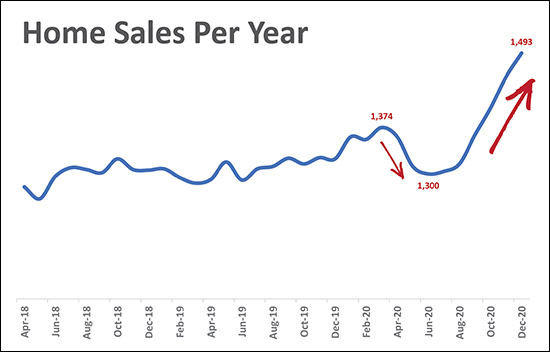 As shown above, the annual pace of home sales took a nose dive in April 2020 related to COVID, but has taken off since August 2020 and quickly accelerated the market to a pace of almost 1,500 home sales per year. Why is this happening? Here are some of my best guesses... Pre-COVID, most of us likely spent the minority of our waking hours in our homes. We would be at work much of the time. During COVID, many folks find themselves spending 90% or more of their waking hours in their homes. For many people, this made them quickly realize that their home was no longer working for their needs or those of their family. If you're working from home and your kids are learning from home, you suddenly have higher expectations for the space and spaces that your home offers. I suspect this "being at home much more than normal" dynamic caused more people to decide to sell their home and buy a new home during 2020. Mortgage interest rates have been dropping throughout most of 2020, making it an excellent time to buy a home from a monthly mortgage payment perspective. These lower rates likely made it pretty easy for the "my home doesn't work during COVID" buyers to consider upgrading to a new home. There is an extraordinary amount of pent up buyer demand in our area. Perhaps more sellers than usual listed their homes in the second half of the year, most of which were scarfed right up by eager buyers, thus leading to higher than normal home sales. This also seems to have lead to higher sales prices! What do they say? The whole is greater than the sum of its parts? It seems that... more buyers wanting to upgrade to a new home + super low interest rates + pent up buyer demand + quickly rising home prices = a red hot real estate market in 2020! As one other aside, it is also possible that we may have seen more second home purchases in 2020 than in other comparable years. More and more people found they could work from home, or from out of town, and this likely drove at least some number of new buyers of second homes into our market. | |
Home Sales Up, Prices Up, Inventory Down in January 2021 |
|
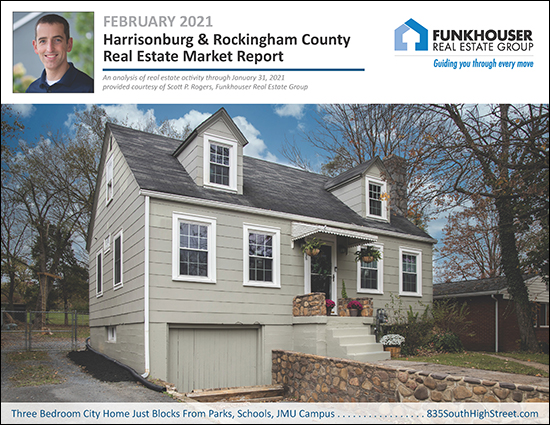 Happy Wintry Monday Morning, friends! It looks like it might be a touch above freezing temperatures today, so perhaps some of the lingering snow and ice and will start to melt today. This has been one of the coldest and snowiest and iciest months of January / February that I can remember anytime recently in the Harrisonburg area! As a preview of where we're headed in this overview of the local real estate market:
So, no huge surprises. It seems the 2021 housing market is trying to keep the momentum going from 2020. Read on for a recap of what is happening in our local housing market or:
Now, onto the data and some pretty charts and graphs... 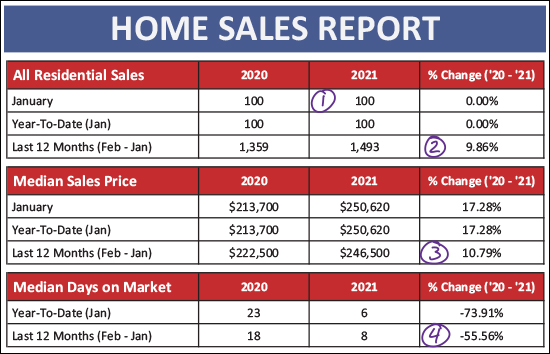 A few observations from the overview data presented above...
Now, I was telling you that January was a bit unusual, even though it was a repeat of last January, right? Let's take a look... 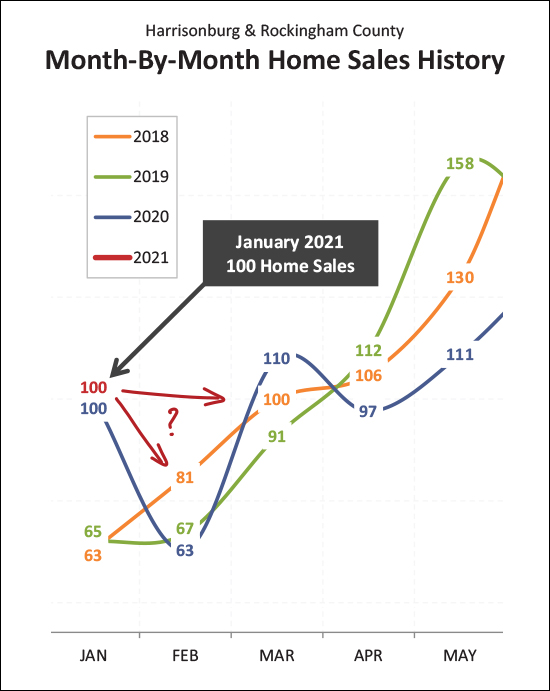 Indeed, the 100 home sales we saw in January 2021 was merely a repeat of January 2020 -- boring! ;-) -- but that is many more home sales than we typically see in January. We usually see 60 to 70 home sales in the month of January. Last year's super strong month of 100 home sales was followed by a super slow month of only 63 home sales in February. Stay tuned to find out whether home sales will again quickly slide downward in February, or will remain strong. Keep reading to see how many people signed contracts in January, which might be at least some indication of what we'll see as far as February sales. Looking for a big picture graph that summarizes what has been happening in our local housing market over the past year? It's this funny looking one... 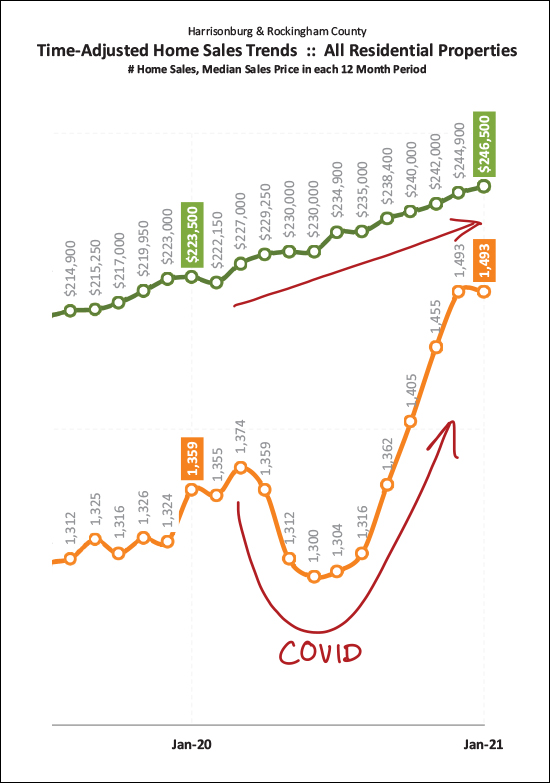 Starting with the bottom, orange, line -- this is showing the number of home sales per year for each of the past 12+ months. You'll note that the annual pace of home sales took a nose dive last year between April and August, which are usually the strongest months of the year for home sales. But then, home sales took off quickly in the fall and continued to accelerate into winter, leading to huge rebound in the pace of home sales in our area. This seems to mostly be able to be attributed to COVID. There was a lot of uncertainty in the market in March, April, May, etc. which slowed down home sales, but then as people realized that the housing market wasn't falling apart AND they realized that their homes weren't working as well for them when they were in them 95% of the time (thanks, COVID) AND they realized that super low interest rates made it a compelling time to upgrade their home, we saw home sales take off quickly! The top, green line, then is the median sales price. We have been seeing steadily increasing sales prices in our local area for the past few years and those prices kept marching upward quickly in 2020. The annualized median sales price at the end of January 2021 was $246,500 -- a significant increase above a year ago when it was $223,500. So, remember that I mentioned that January contracts might give us an idea of what to expect for February sales? Let's take a look... 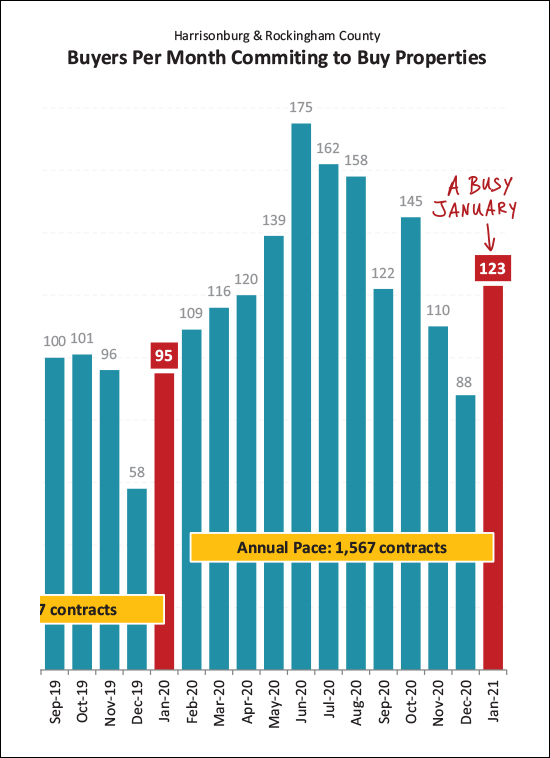 It seems January wasn't just a busy month of closings - it was also a busy month for buyers (and sellers) signing contracts to buy (and sell) homes. There were 95 contracts signed in January 2020, and 123 in January 2021! As such, it seems likely that February (and March) will be busy months for closed home sales. What's it like buying a home these days? It can be a bit challenging, and stressful, mostly because of the very (very, very) low inventory levels at any given point... 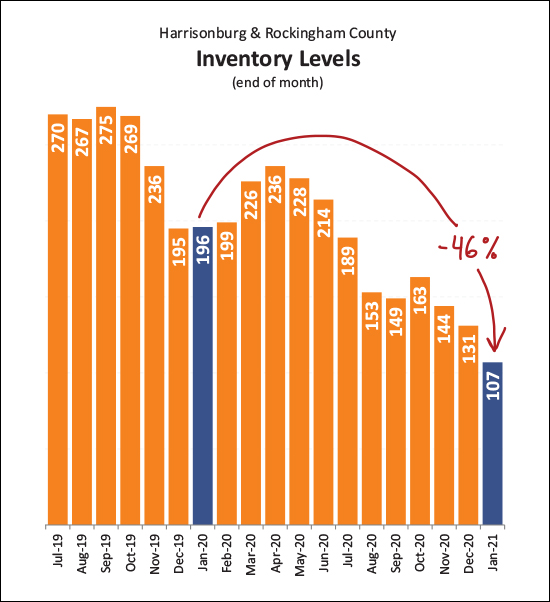 A year ago, a buyer would have been choosing from 196 homes on the market in Harrisonburg and Rockingham County. Today, there are only 107 homes on the market for sale!?! This huge (46%) decline in inventory levels means that a buyer doesn't have a whole lot of options at any given moment in time. Now, that's not to say that they don't have options at all -- they do. If we see 1400 home sales over the next 12 months it will be because around 1400 homes will be listed for sale. So, there will be plenty of options of what a buyer might buy -- but if recent market dynamics continue through 2021, most of those new listings will go under contract quickly (median of eight days on the market) which will keep the inventory levels quite low! Finally, those interest rates. Yes, they are still low... 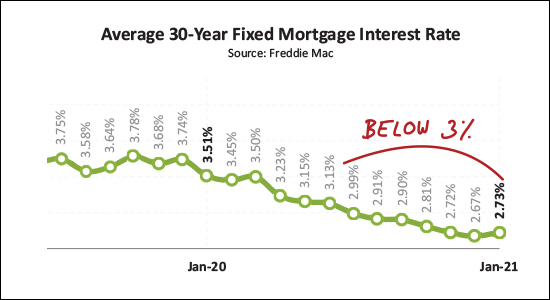 Some part of what fueled the wild real estate market in 2020 was super low mortgage interest rates. As shown above, the average 30 year fixed mortgage interest rate has been below 3% for over six months now. This has kept monthly housing prices affordable for buyers amidst rising prices and has also allowed plenty of folks to refinance and see cost savings on a monthly basis. So there we have it. We're a month (ok, really a month and a half) into 2021 and thus far we're seeing a continuation of the strong local housing market that we saw in 2020. Generally speaking that means it will be pretty fun to be a seller, pretty challenging to be a buyer, and you'll get to experience the full range of emotions of you are selling AND buying! If you are making plans for selling or buying in spring 2021... Sellers - Even though the market is hot, you still need to prepare your home well, price it appropriately based on historical sales data and market it thoroughly and professionally. Buyers - Get prequalified for a mortgage, start stalking new listings, go see them on the first day they hit the market, and get ready to compete in a multiple offer situation. Seller / Buyers - If you need to (or want to) sell in order to buy, this will require a bit more strategery :-) than normal. It can be done, but we need a solid plan in place from the start. If I can be of help to you as you start to think about the possibility of making a move, selling your home, buying a new one, etc. -- just let me know. I'd be happy to meet with you in person, via Zoom, or to chat by phone to help you think and talk through the possibilities. You can reach me at scott@hhtdy.com or via phone/text at 540-578-0102. Enjoy the second half of February, and we'll check in again in early March! | |
Did City Home Prices Really Drop For The First Time Since Spring 2019? |
|
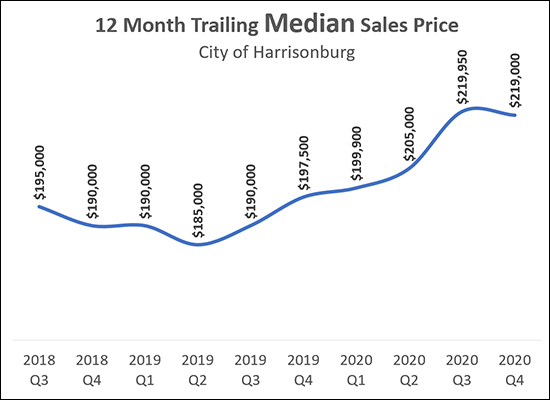 Today's edition of the Daily News Record leads with a story about home prices dropping in the City of Harrisonburg. The headline and much of the article might cause you to misunderstand the bigger picture of what is going on with City home prices. After all, most people would read that and say "oh, City home prices have fallen" when I think most people would come to a different conclusion when examining the actual data and/or if trying to buy a home in the City right now. :-) Let's dig in... The article states that the "median sales price dropped from $214,400 in the fourth quarter of 2019 to $205,200 in the fourth quarter of 2020, a difference of 4%" which is from data provided by the Harrisonburg Rockingham Association of Realtors. Here's the problem... The City is sufficiently small such that there aren't many home sales per quarter (only 116 in 2020-Q4) and thus the data can lead you to the wrong conclusions if you are looking at too small of a data set. When looking at just one quarter of data...
Oh my, home prices are falling, right? But let's look to see what happens when you expand the data set to include a longer time period to avoid improper conclusions drawn from smaller data sets...
Are home prices falling? It seems they have actually risen 11% over the past year. The graph above attempts to offer a slightly clearer picture of home prices. It shows the median sales price over a 12 month period for each of the past (10) quarters. You'll note that the median sales price has been steadily increasing over the past several years. Did it tick downward slightly in 2020 Q4? Yes. By $950. Could it decline further as we get through 2021 Q1 and 2021 Q2? Yes, certainly. Anything is possible. Is it accurate to say that City home prices dropped in 2020 Q4? I guess? Technically? But that seems to be focusing in pretty narrowly and missing the larger picture. But you tell me -- what does the data say to you? | |
January Housing Inventory Levels Sink To New Lows |
|
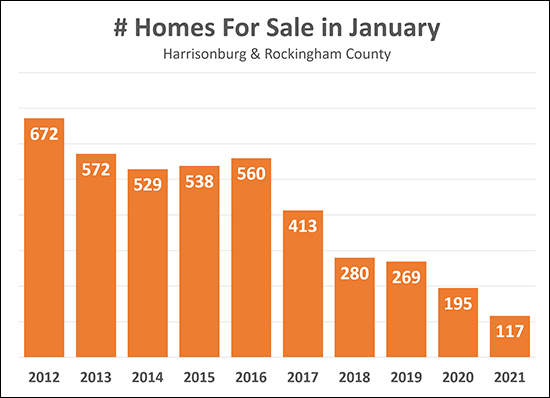 We like somethings to be low - like mortgage interest rates. But inventory levels - it really isn't ideal for them to be this low - except for sellers, I suppose. For each of the past five years, home buyers in our local market have found themselves worse off as far as having options for houses to buy in Harrisonburg and Rockingham County. Today, buyers are choosing from 117 homes for sale in the entire City and County. Ouch! Just a year ago, that was 195 homes, two years ago 269 homes, oh -- and can you imagine having 500+ homes to choose from such as back in 2016!? Here's hoping for a flurry of homes coming on the market in February and March to help meet the apparently never ending surge of buyer demand! | |
| Newer Posts | Older Posts |
Scott Rogers
Funkhouser Real
Estate Group
540-578-0102
scott@funkhousergroup.com
Licensed in the
Commonwealth of Virginia
Home Search
Housing Market Report
Harrisonburg Townhouses
Walk Through This Home
Investment Properties
Harrisonburg Foreclosures
Property Transfers
New Listings

