Market
| Older Posts |
Year End Recap Shows 12% Increase In Home Sales, 5% Higher Sales Prices In Harrisonburg, Rockingham County |
|
 Happy New Year, friends! The high temperature actually made it up to 40 degrees today, a slight reprieve from the frigid temperatures over the past week. I think we've had more snow this January (eight inches or so) than we've had for the past few winters... and the super low temperatures are causing it to stick around much longer than it usually does in the Shenandoah Valley. I hope by now you are mostly shoveled out and that you are enjoying the snowy winter scenes that seem likely to stick around for another week or so! I have good news to report... I closed out 2024 much more safely than I started the year. :-) December 31, 2023 - Ran in the VA Momentum NYE Glow Run 5K, slipped, fell, sprained my ankle and hobbled my way through most of January. December 31, 2024 - Ran in the VA Momentum NYE Glow Run 5K, stayed on my feet and sustained no injuries, despite a very rainy finish.  Two takeaways here... [1] If your 2024 had a rough start, I hope you also had a strong and happy close to your year. [2] VA Momentum puts on some super fun running events -- energizing communities for good -- I hope to see you at one in 2025! Now, then, if you're looking for a fun dinner spot for later this month, consider checking out Rocktown Kitchen, a farm-to-table restaurant on Liberty Street in Harrisonburg, just across from the Farmer's Market. I'm giving away a $50 gift card to Rocktown Kitchen this month to one of you readers of my monthly market report - so click here to enter to win the gift card. And now, on to the real estate data... with a note to you, the reader, before we start... We just closed out 2024, so I'm looking back at a full year of data, and thus there will be a few more charts, and a few more graphs in this report than usual. Read through it all in detail, or scroll and skim, or ignore it all and just email or text me (540-578-0102) to set up a time for me to explain it all to you in person over coffee or breakfast. ;-) First up, the overall residential sales market in 2024... 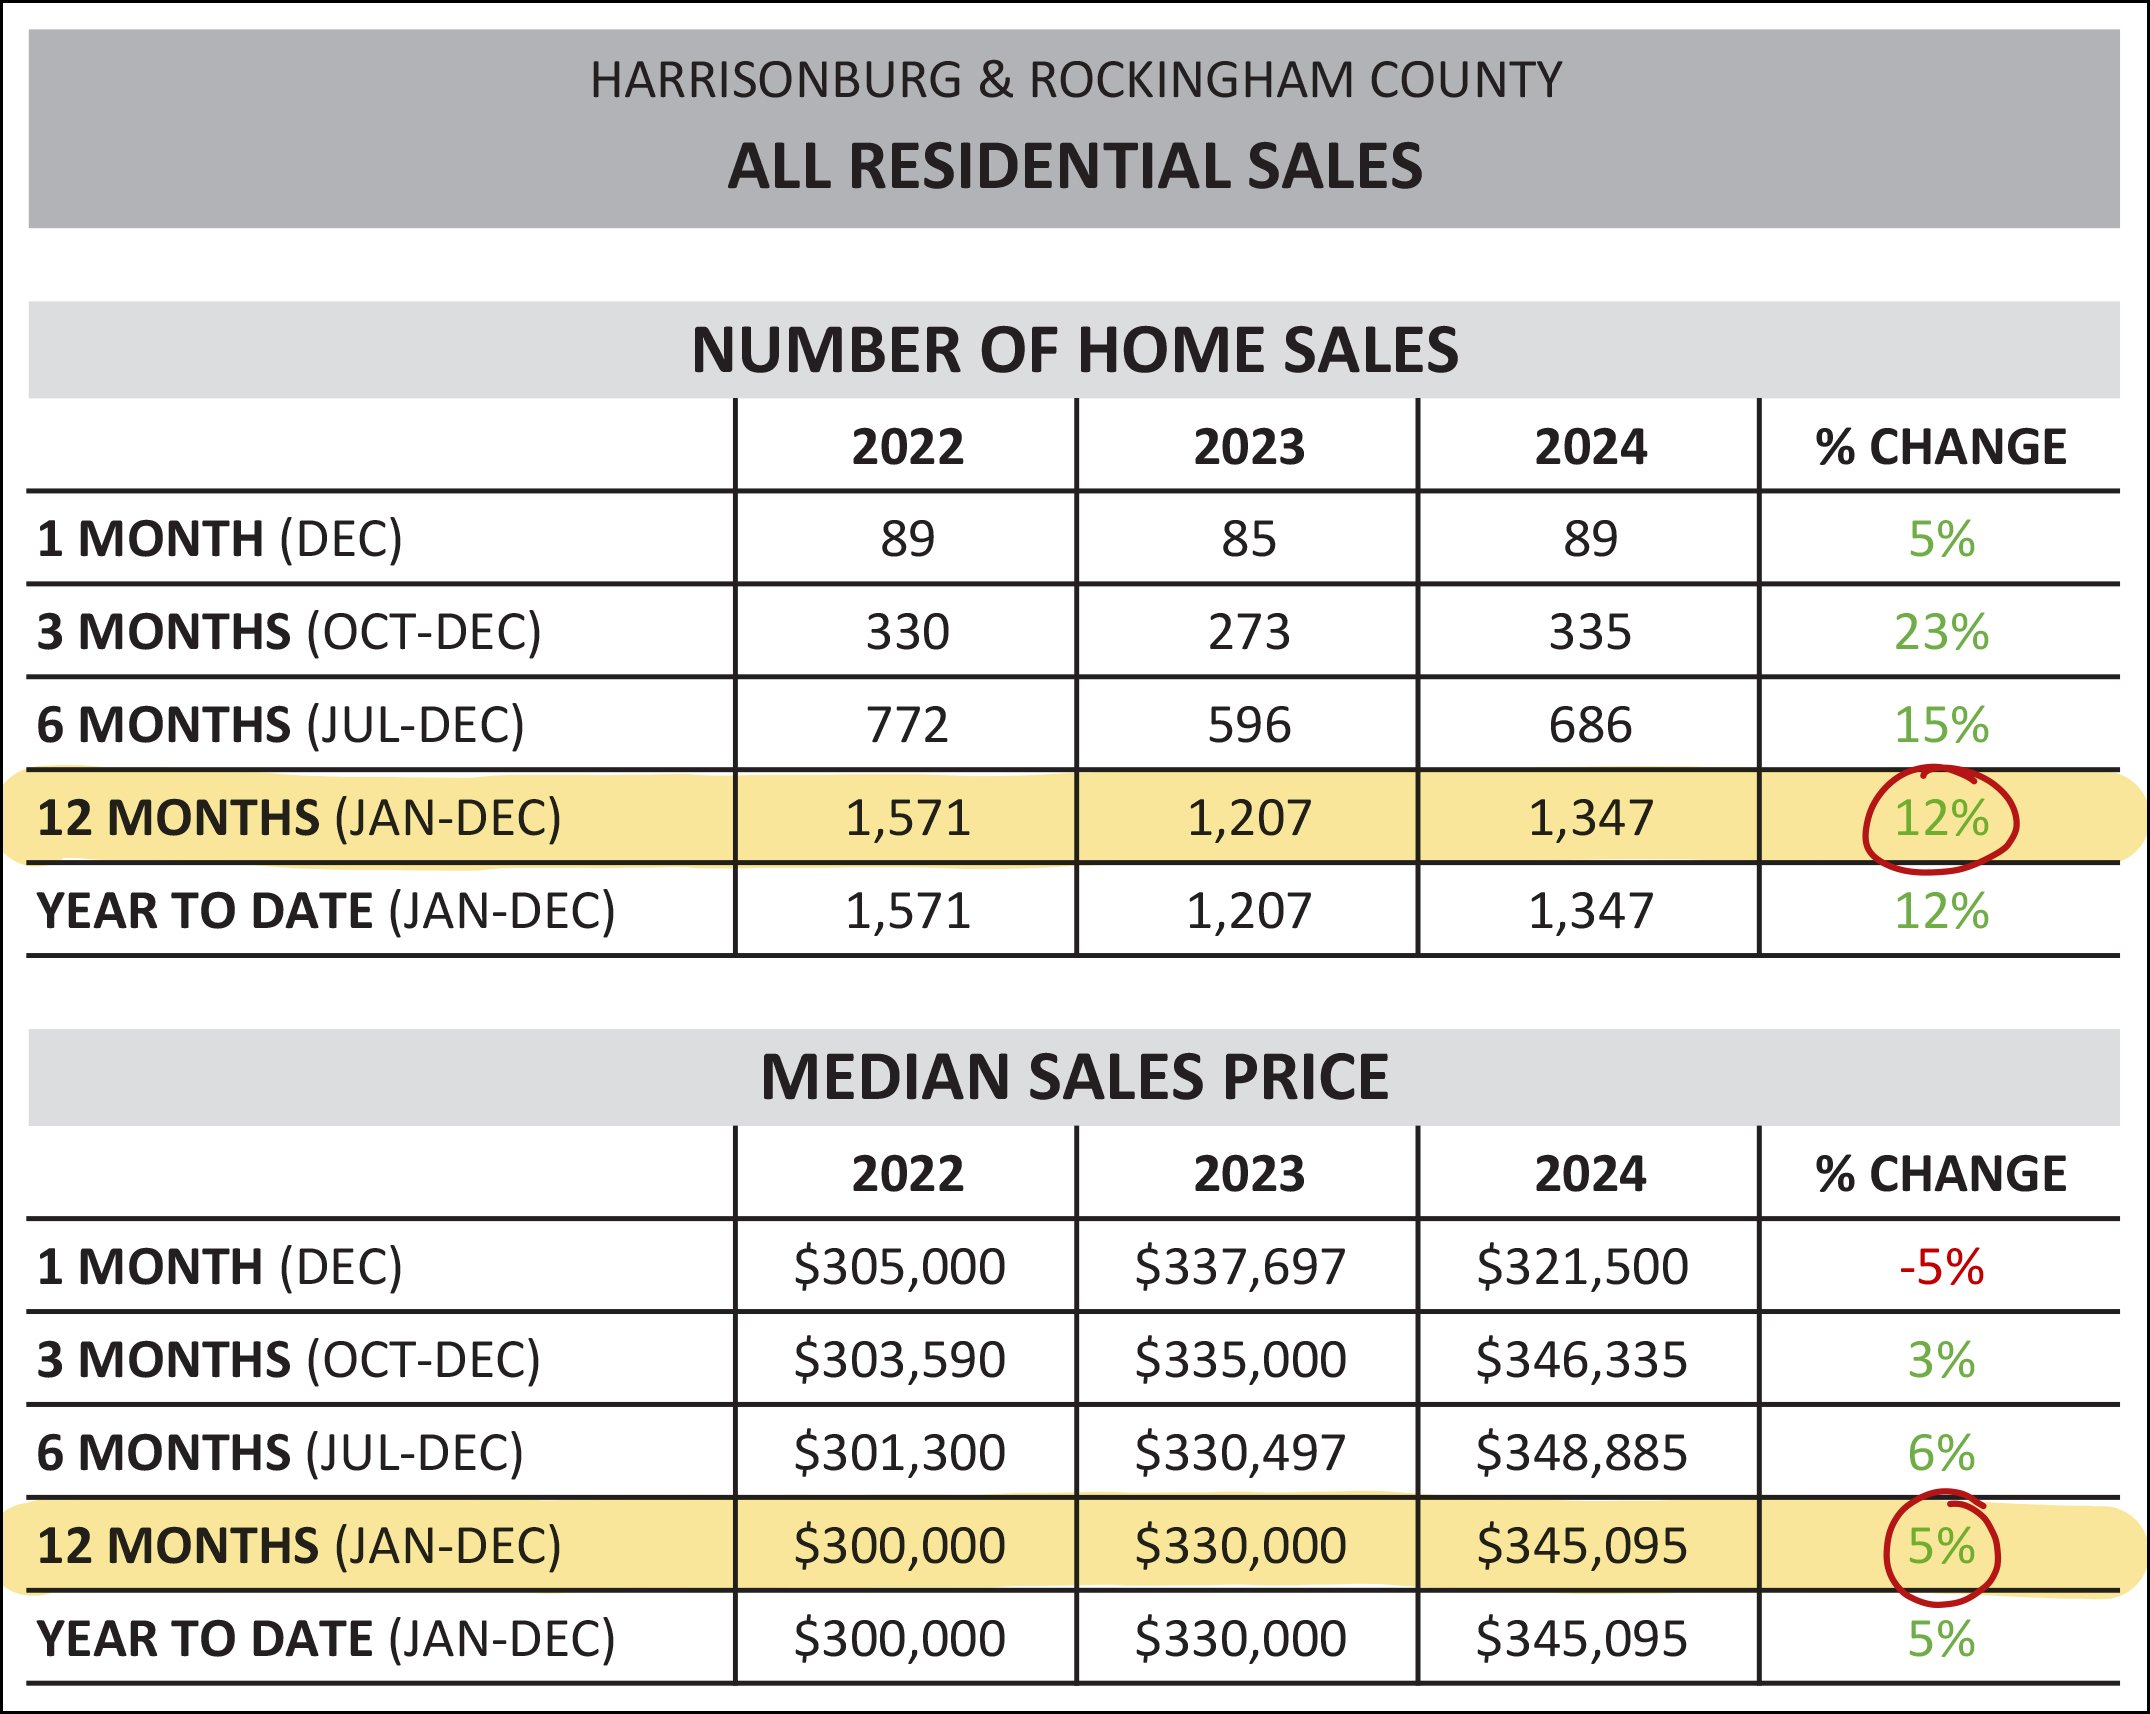 The chart above outlines sales trends over multiple different timeframes, but the one I'm focusing on today is highlighted and shows the entirety of 2024. There were 12% more home sales in Harrisonburg and Rockingham County in 2024 than in 2023. The median sales price of all homes selling in Harrisonburg and Rockingham County increased by 5% in 2024... to $345,095. Of all of the home sales in 2024:
Here's what's happening in the detached home segment of our local market... 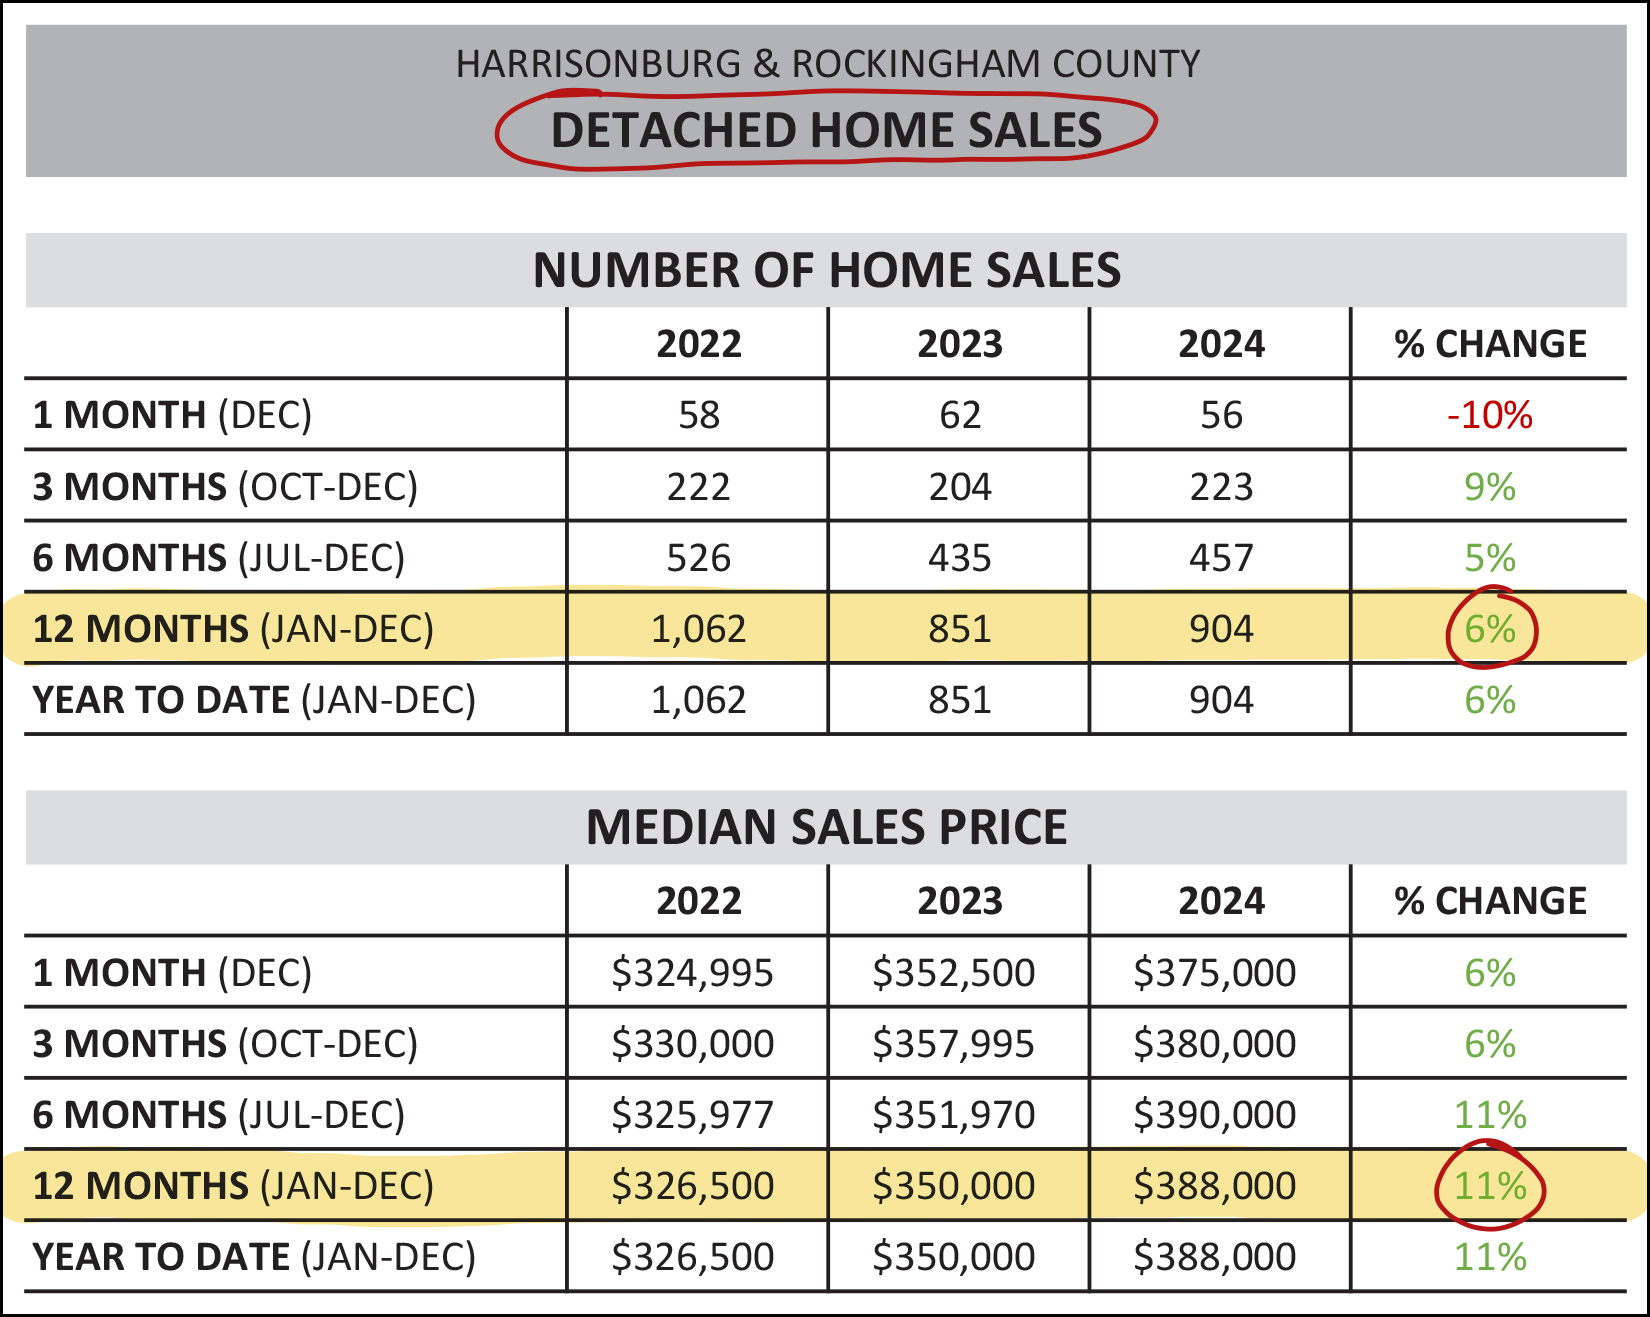 Interestingly... [1] Compared to the 12% increase in all home sales, we have only seen a 6% increase in detached home sales. This means that more of the recovery (12% increase) in the quantity of homes selling was in attached homes. [2] While the market-wide median sales price only increased 5% in 2024... the median sales price of detached homes increased by... 11%. The median sales price of detached homes selling in 2024 was $388,000. So, about those attached home sales... 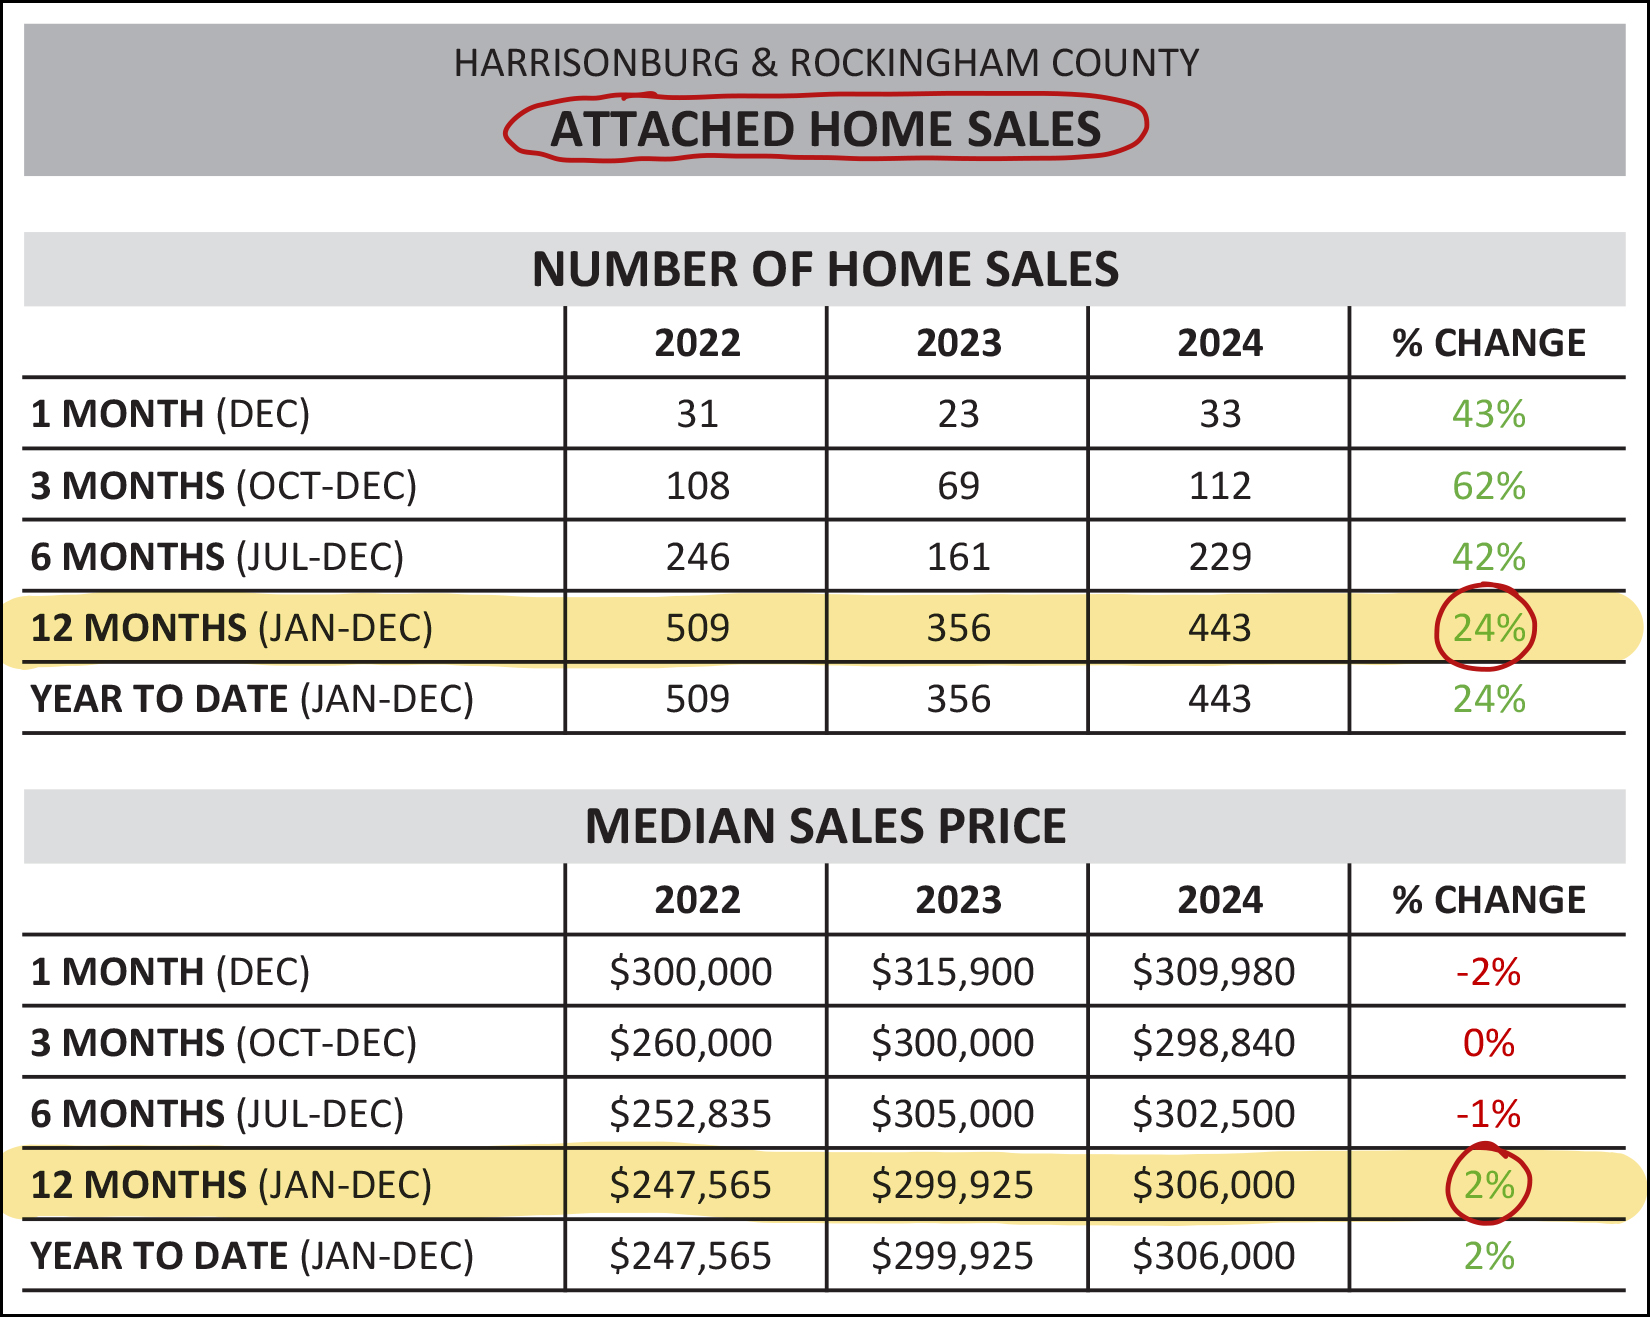 While we only saw a 6% increase in the number of detached homes that sold in 2024... we saw a 24% increase in attached home sales! That's a lot more townhouse, duplex and condo sales in 2024! But... despite that increase in the number of attached homes that are selling, the median sales price of those attached homes only increased by 2% over the past year... to $306,000. Having sliced and diced sales by property type, let's do so by location as well, starting with the City of Harrisonburg... 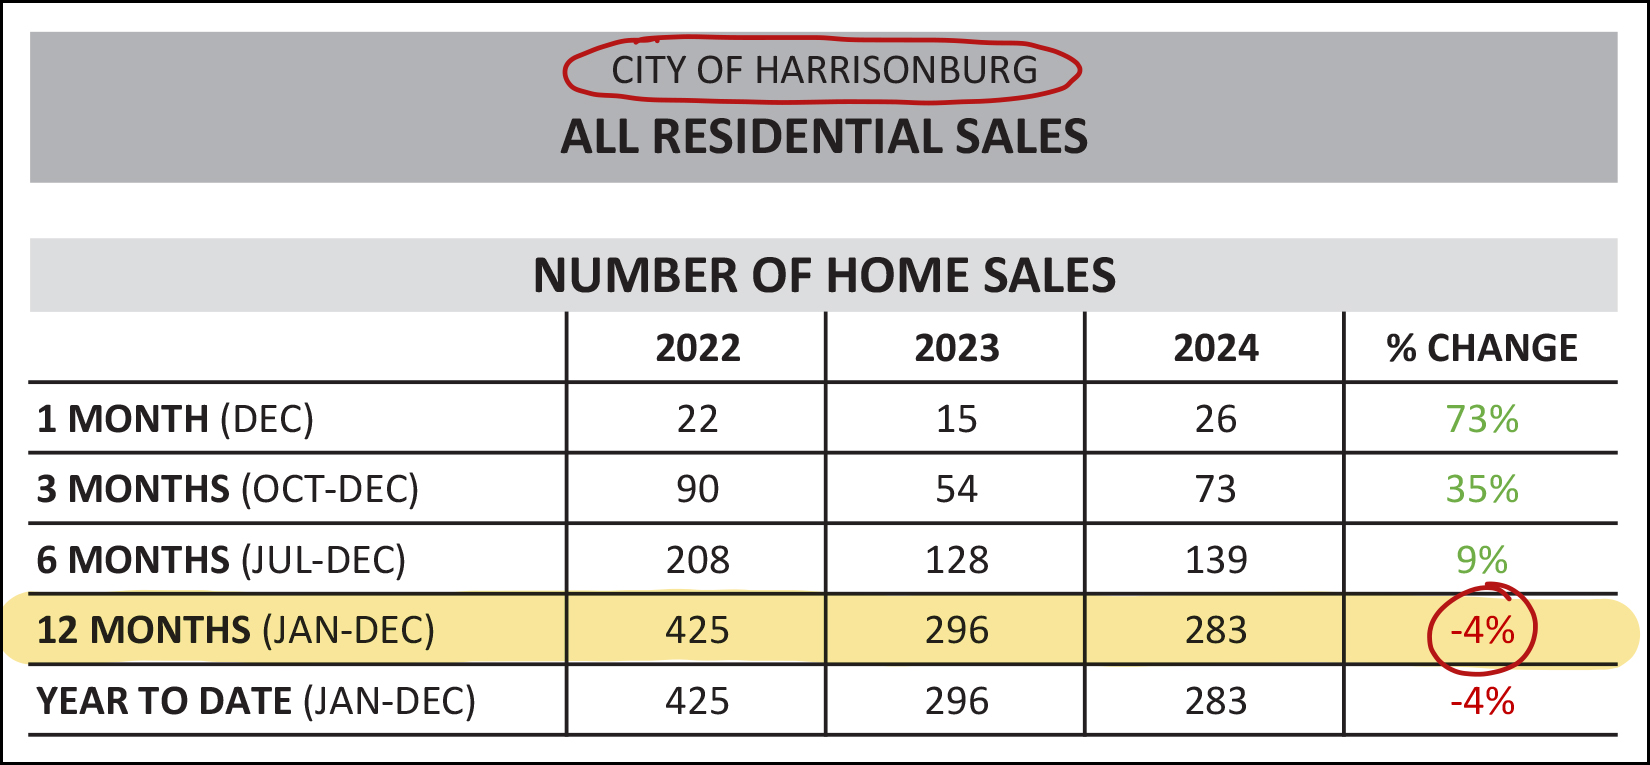 As shown above, fewer homes sold in 2024 than 2023 in the City of Harrisonburg. Over the past three years we have seen the number of City home sales decline from 425 to 296 to 283. A significant part of the decline in City home sales is because there is very few new homes are being built to be purchased in the City of Harrisonburg. The number of opportunities to buy a home in the City is almost entirely depend on resale home sales. Meanwhile, in Rockingham County, we are seeing a steady supply of new homes being built, and thus the following chart probably won't surprise you...  Rockingham County has seen 17% more home sales this year than last year. With new construction continuing in multiple neighborhoods in the county, we are likely to continue to see strong home sales in the county over the next few years. Speaking of new home sales... here's a variety of news on that front... 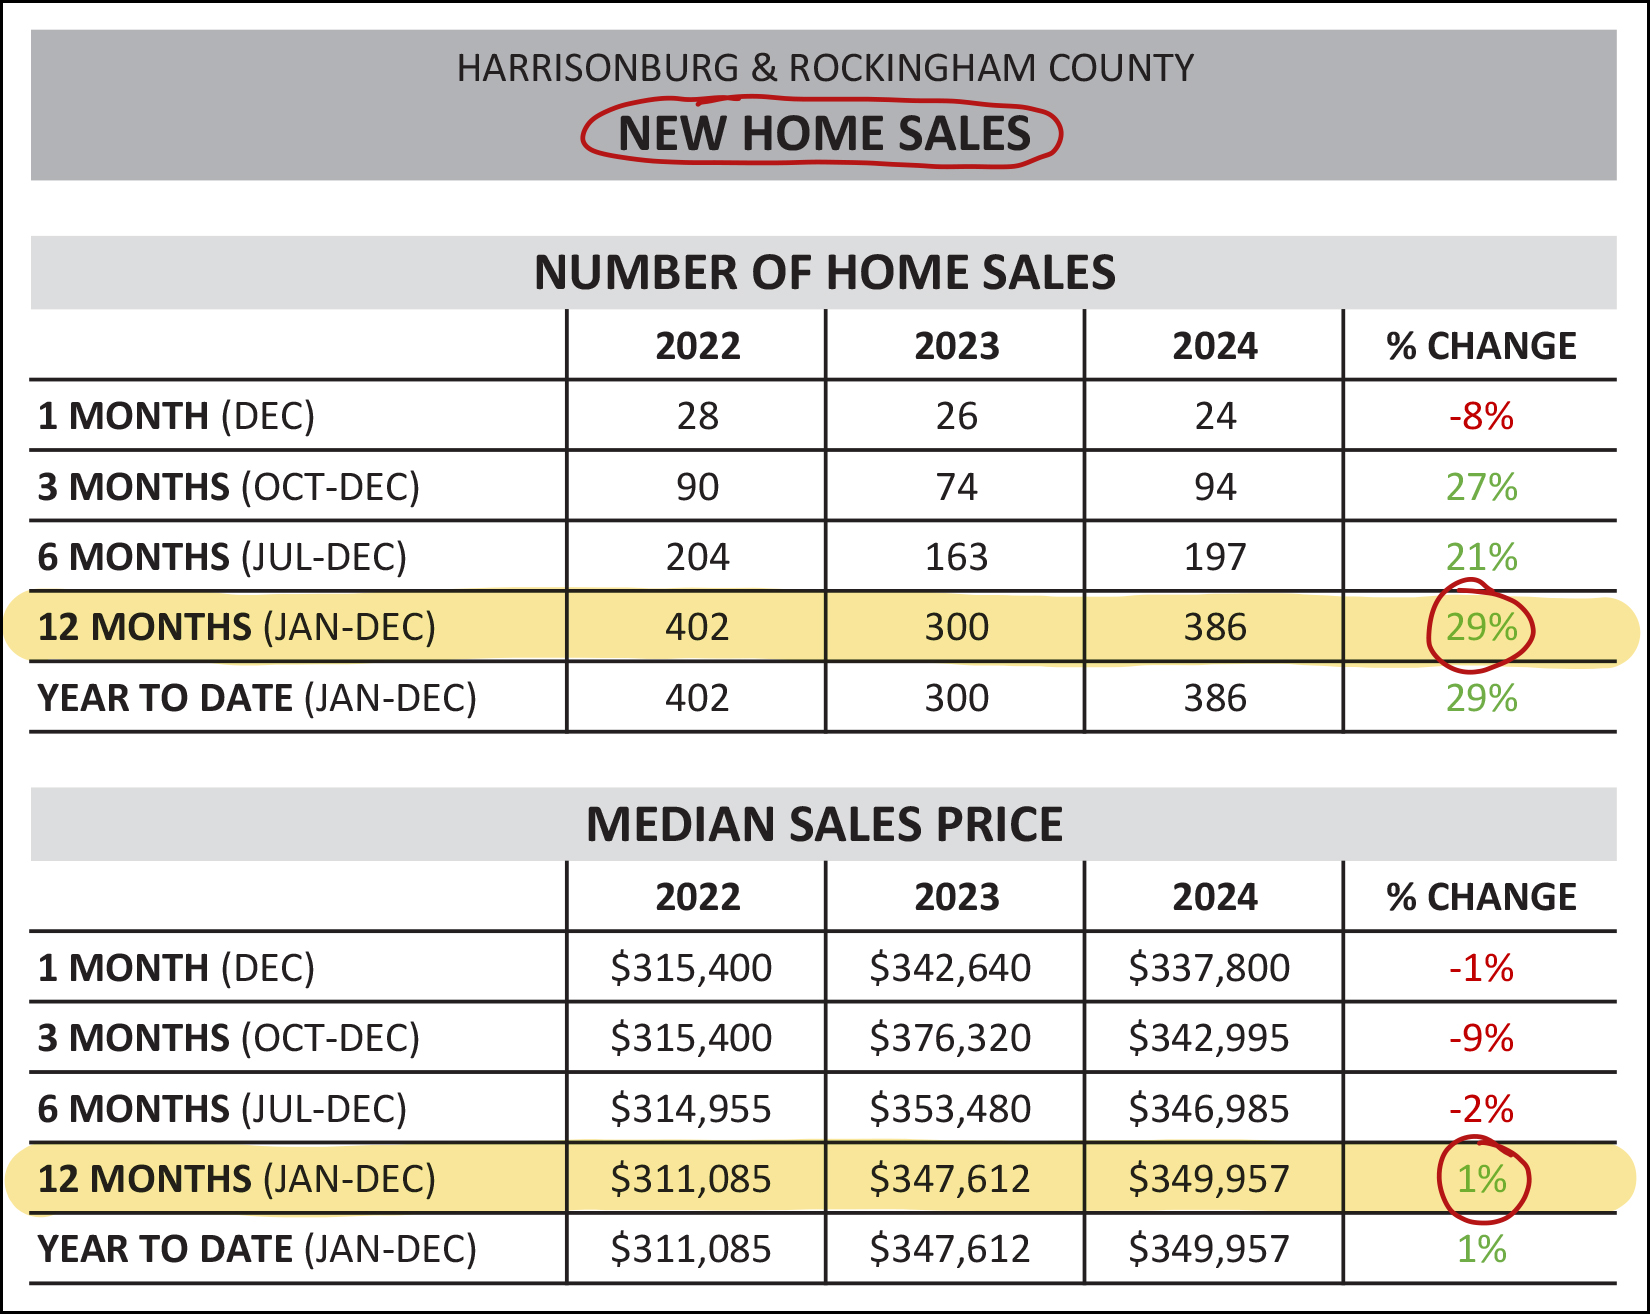 New home sales in Harrisonburg and Rockingham County (mostly Rockingham County) increased 29% in 2024. That said, the number of new home sales in 2024 was actually slightly lower than in 2022. The median sales price of new homes in 2024 was only 1% higher than in 2023... though both years showed a median sales price about 12% higher than in 2022. Given that more and more people want to make Harrisonburg and Rockingham County their home, and given that current mortgage interest rates are keeping lots of existing homeowners from selling their homes, the construction of new homes is an important part of allowing our community to continue to grow. Here are some more details on why we need those new homes if we want buyers to have homes to buy... 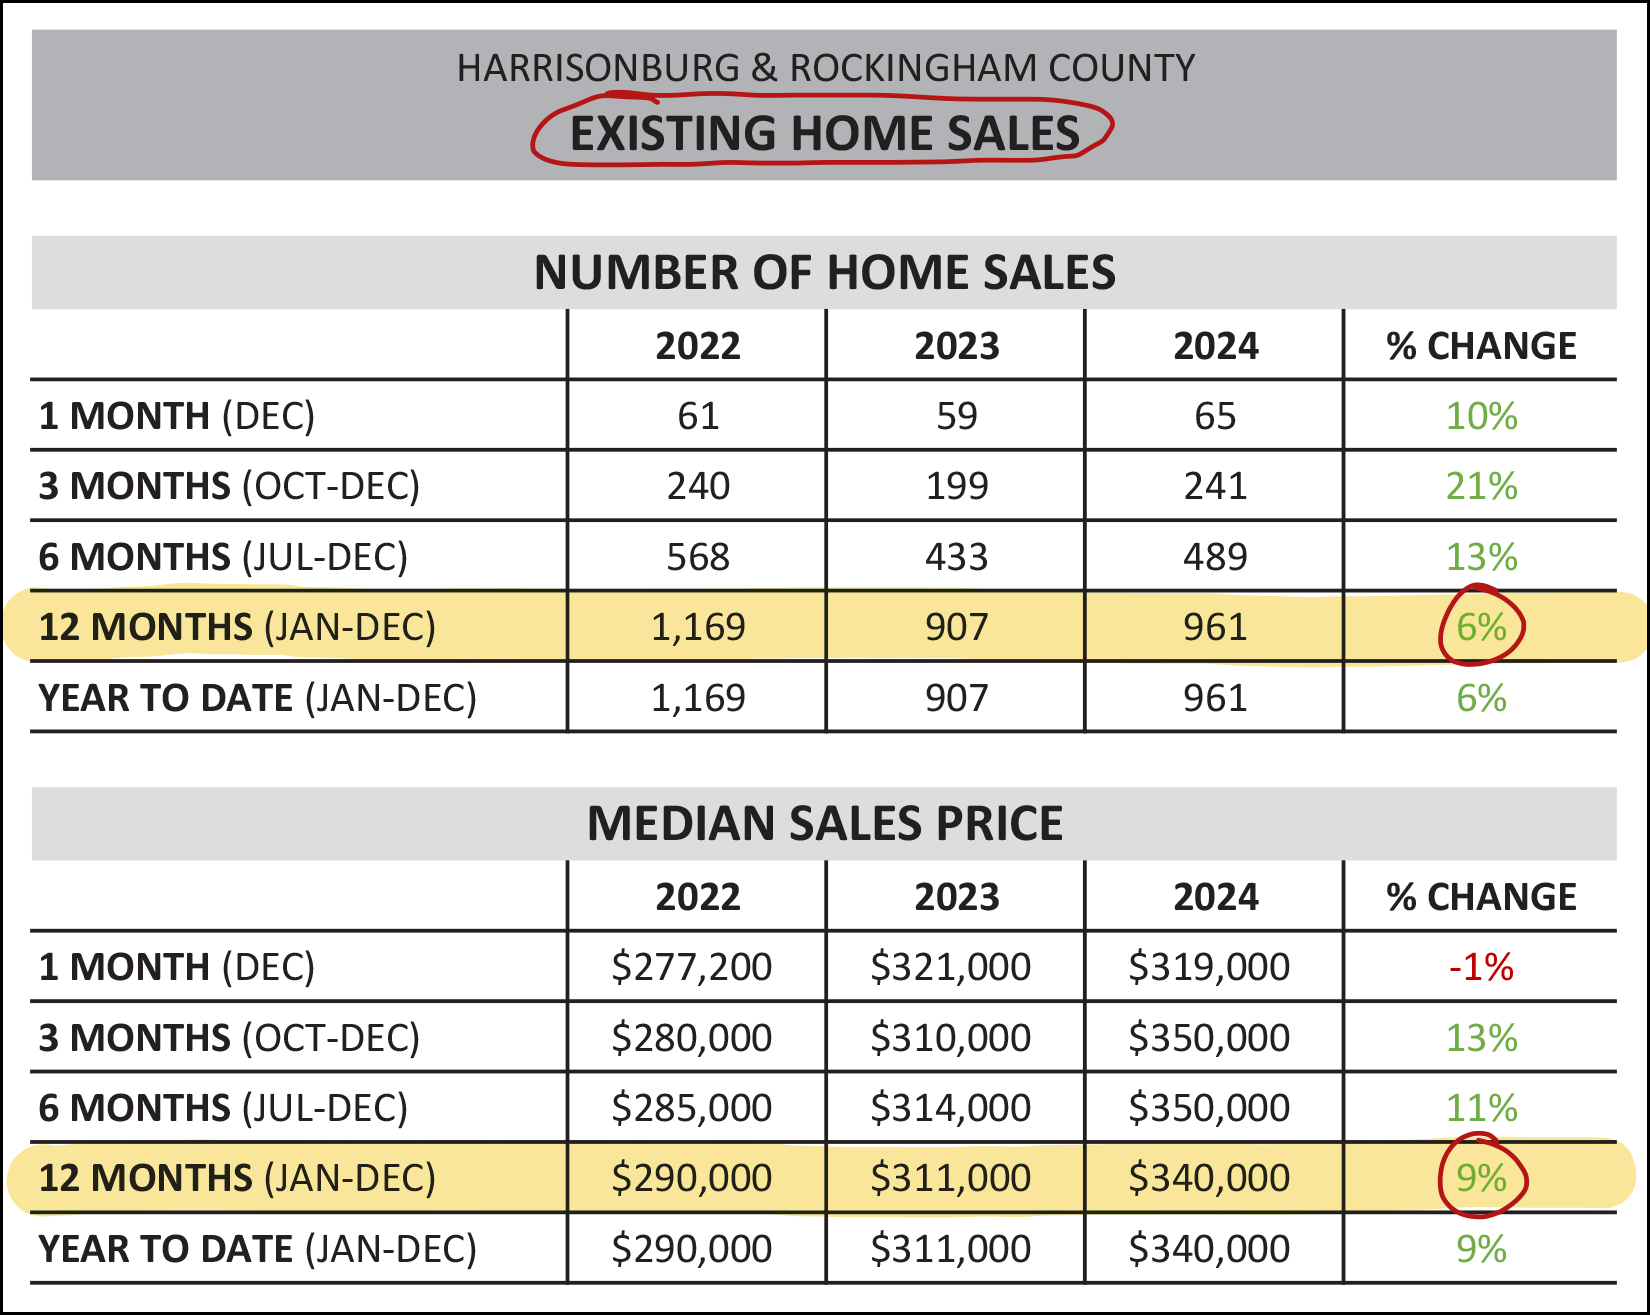 Existing home sales increased 6% in 2024... but the 961 existing home sales in 2024 is still 18% lower than in 2022. We saw somewhat of an increase in existing homeowners being willing to sell, but not enough to keep up with buyer demand. Now, on to some graphs to help better understand a few more trends... 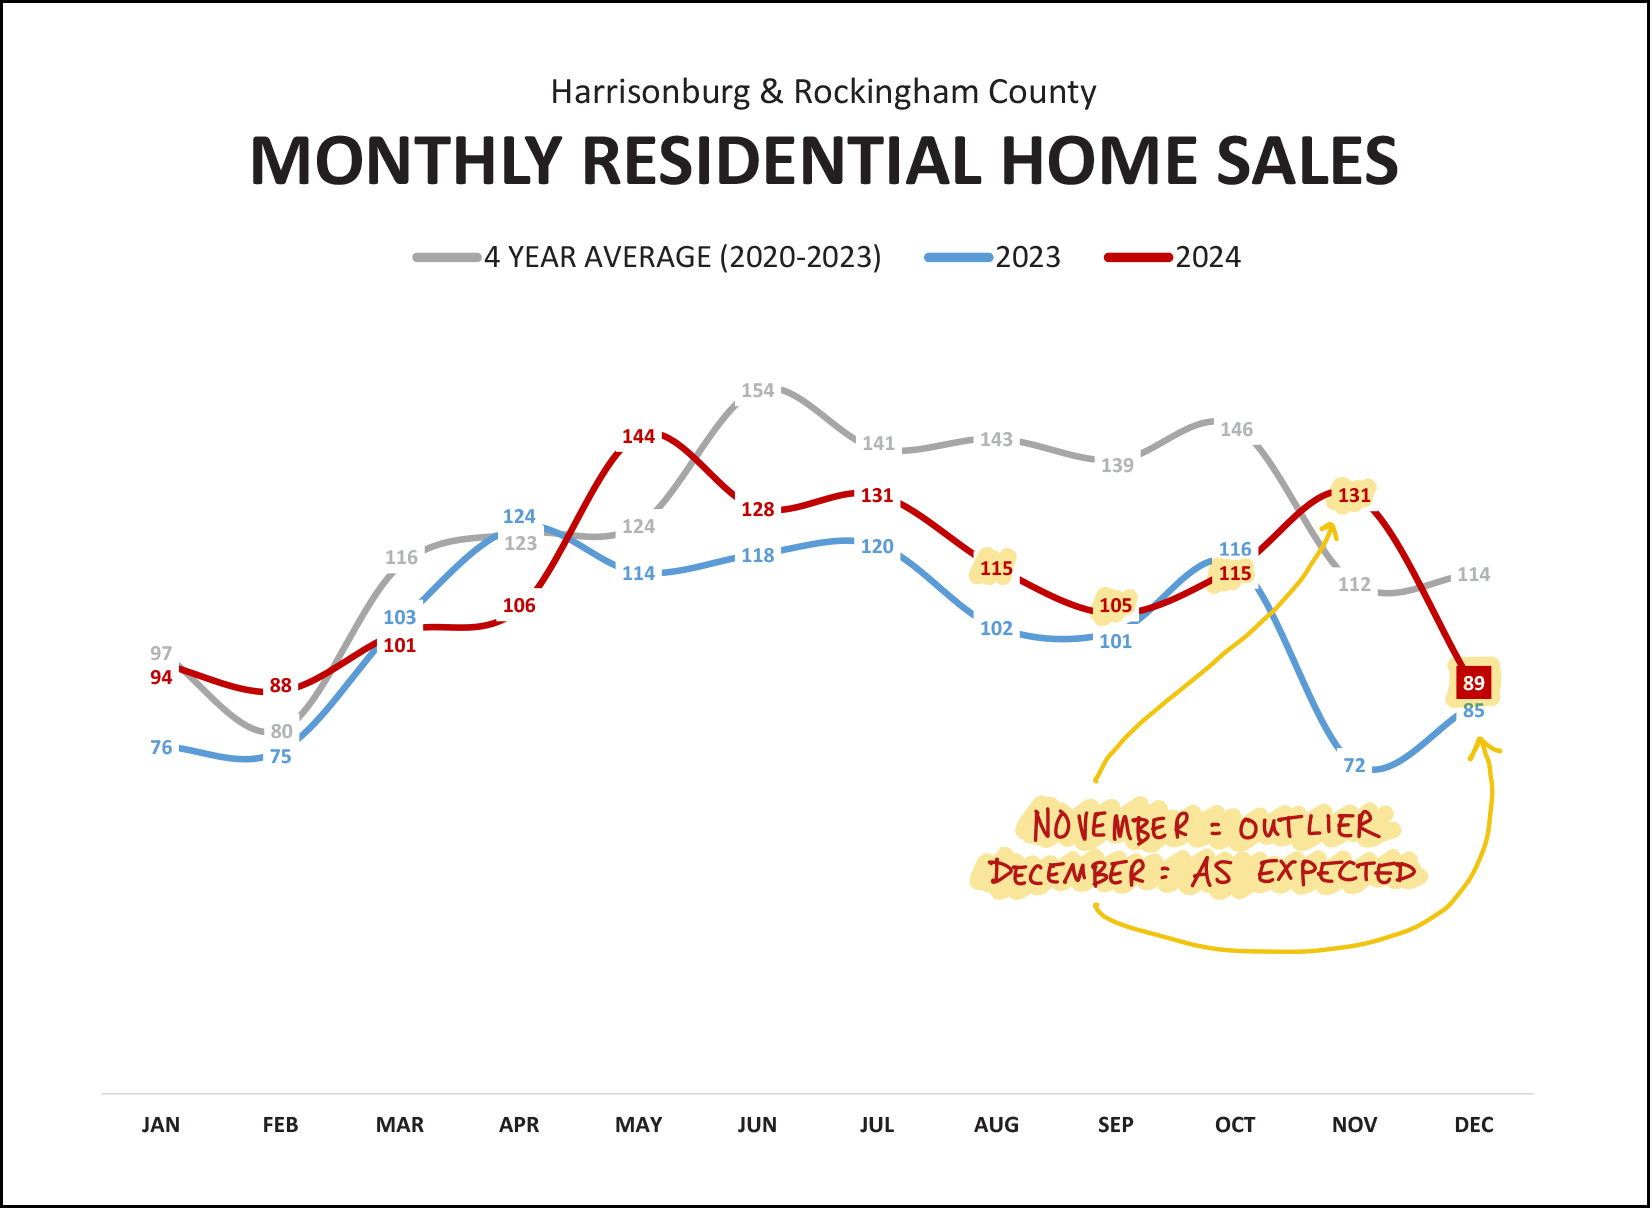 A few notes on the lines on the graph above... red = sales per month in 2024 blue = sales per month in 2023 grey = sales per month, on average, between 2020 and 2023 Since May 2024, most 2024 monthly sales counts were above the same month in 2023 with two exceptions... October 2024 sales were slightly below (-1) October 2023. November 2024 sales were drastically higher (+59) than November 2023. December, then, ended about where we'd expect it -- with 89 home sales, compared to 85 last year. Looking ahead, we are likely to see between 75 and 100 home sales per month for the next two months before we get into the busier sales season starting in March. Switching back to viewing the year as a whole, 2024 beat 2023, but lost to the three years before that... 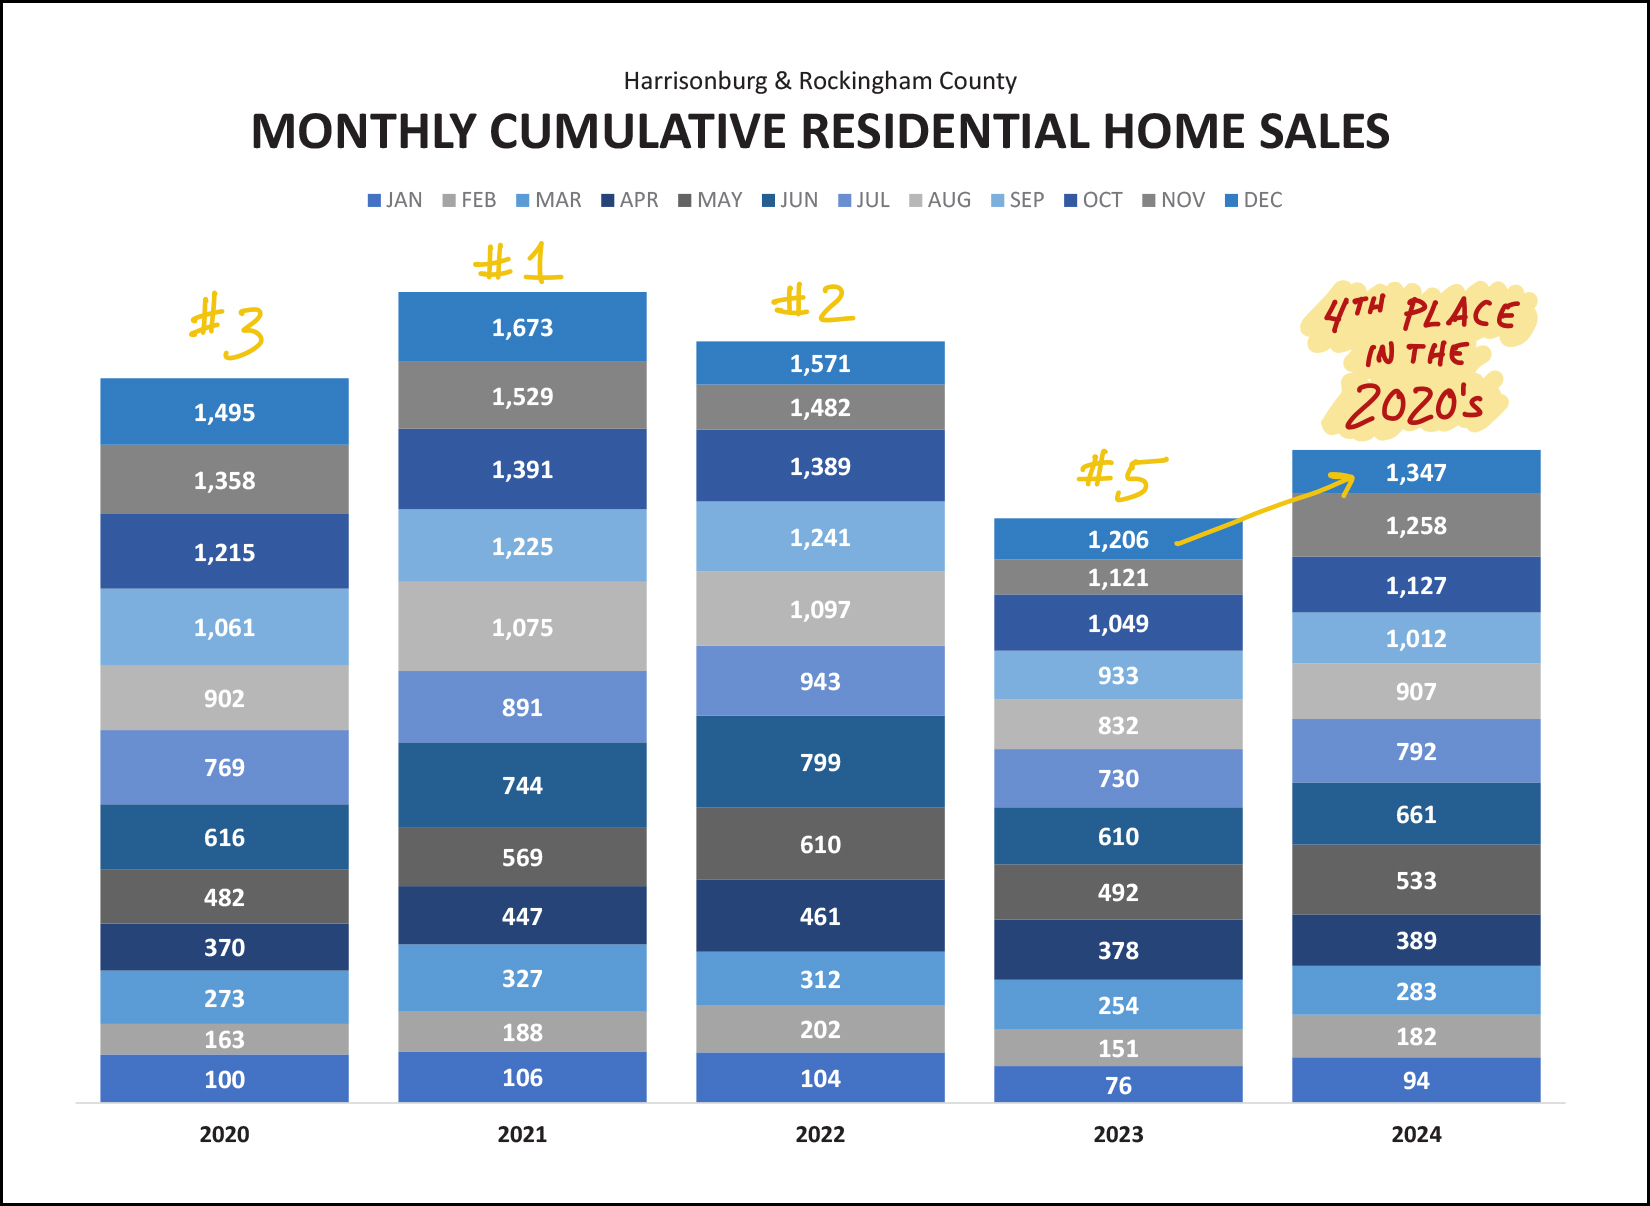 In total, 2024 came in 4th out of 5 spots when looking at the total number of home sales per year for each of the past five years. So, home sales are on the rise again, but just compared to a particularly slow 2023. Speaking of particularly slow... a year(ish) ago is when things slowed most significantly... 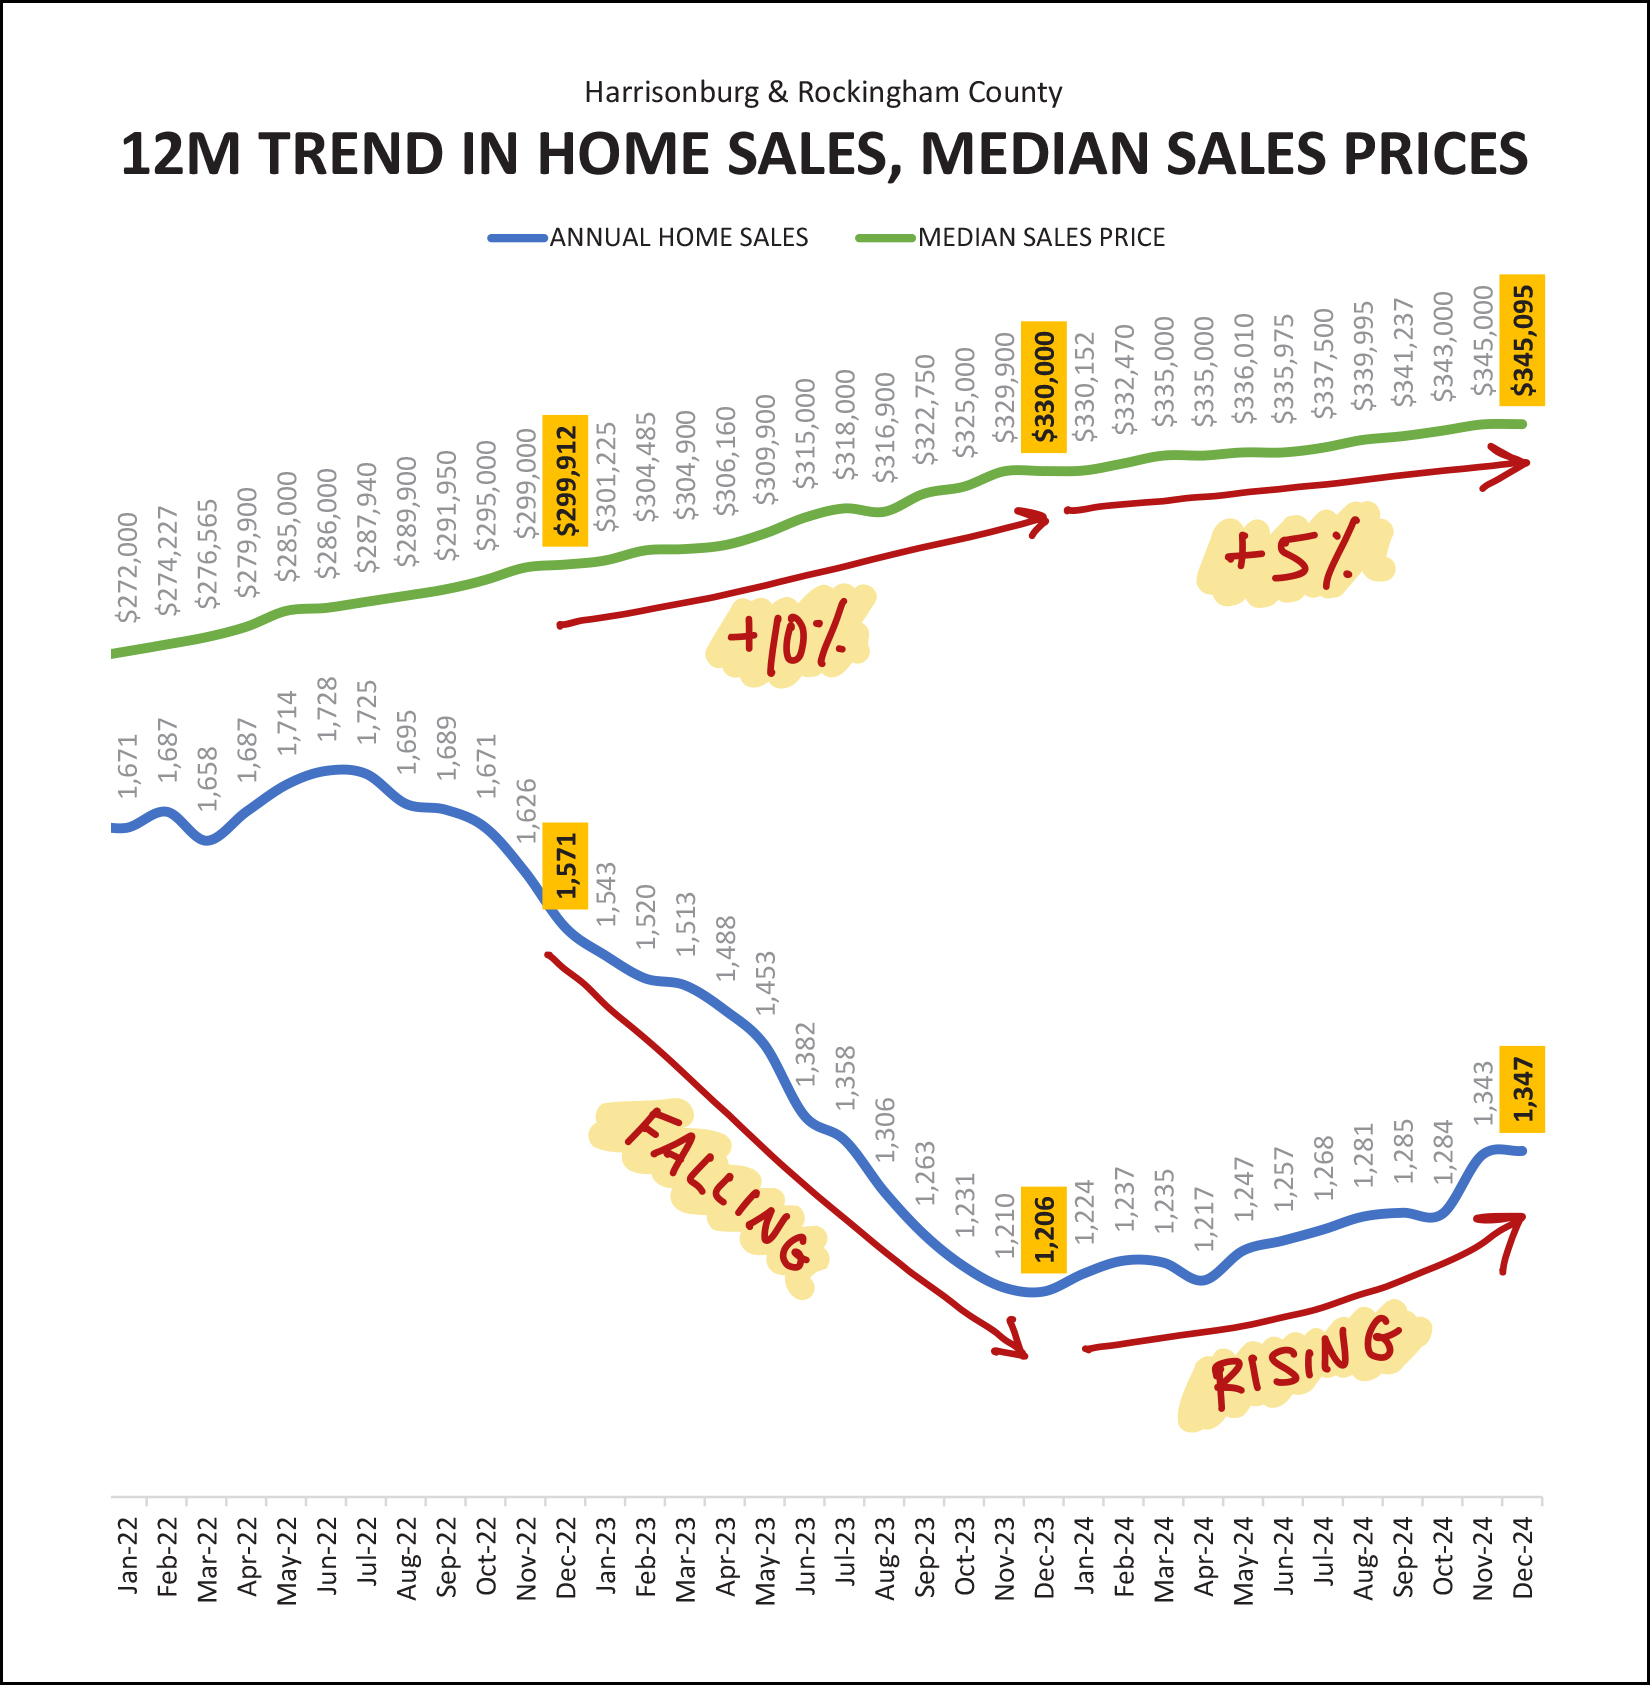 Annual home sales steadily declined from 1,728 sales in mid-2022 down to 1,206 sales in December 2023. That was the lowest annual sales we have seen in the past five plus years... and the pace of annual sales has been rising again ever since. But... while we have seen an increase in the number of homes that are selling over the past year... we are seeing a slowing in rate at which the median sales price of those homes is increasing. That was a lot of words to say that after several years of median sales prices increasing by 10% per year, in 2024 the median sales price only increased by 5%. OK. Still a lot of words. Stretching a bit further back in time, we can create a bit more context... 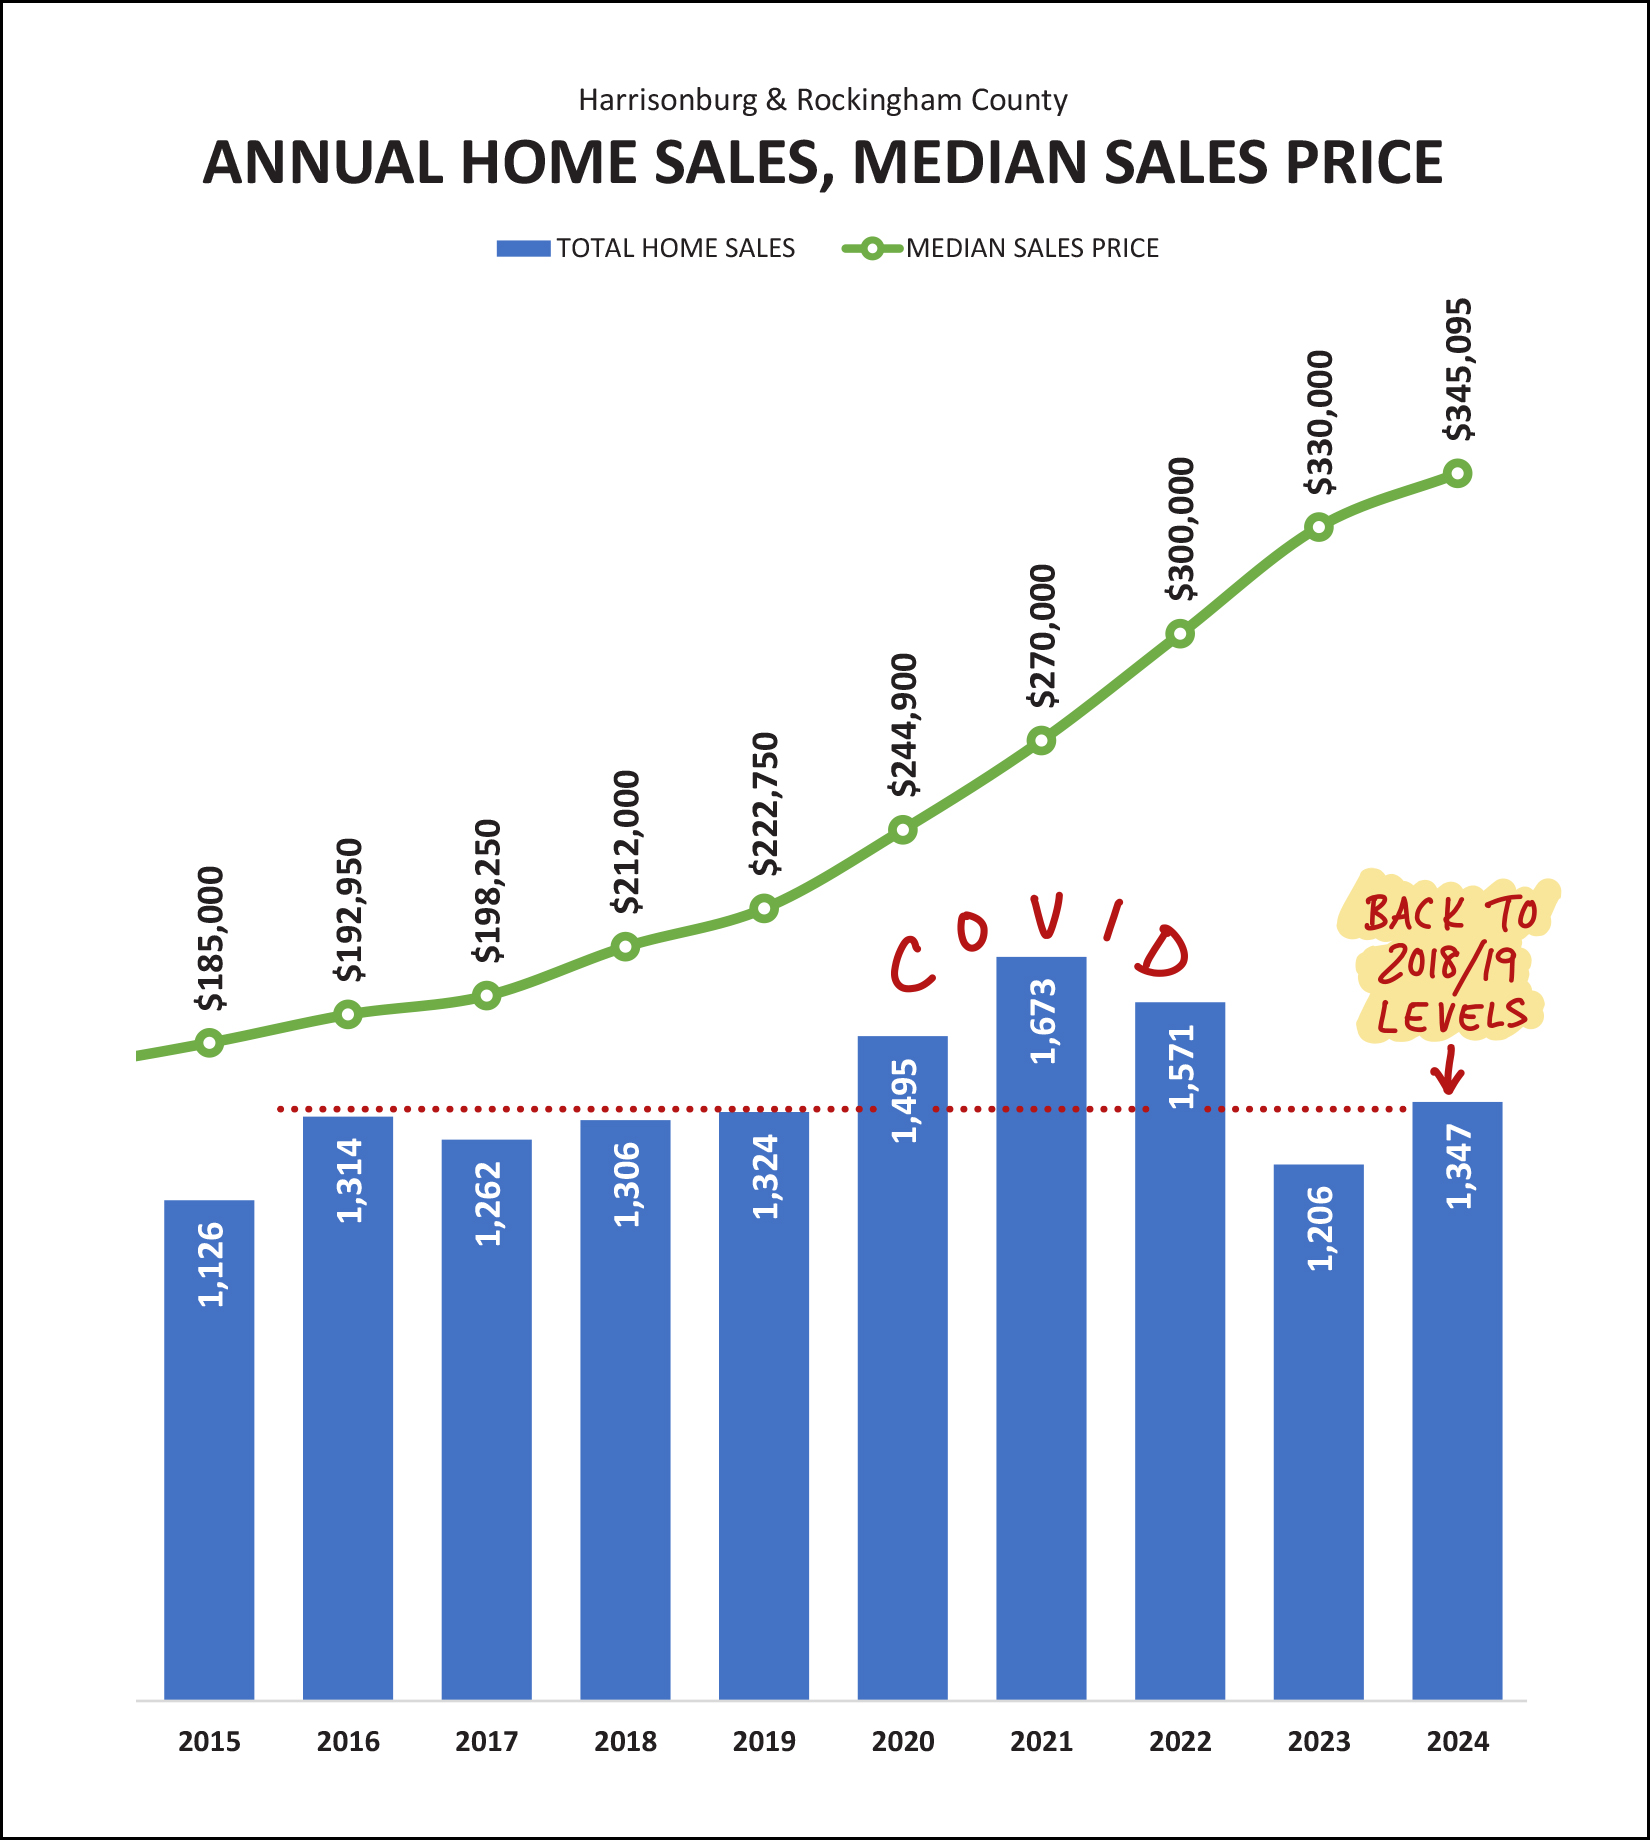 A few things to note related to the 1,347 home sales seen in 2024 in Harrisonburg and Rockingham County... [1] The three years in the past decade when we have seen more sales in a year were ones where home sales activity was fueled on by a COVID-induced home buying spree (more people working from home) and historically low mortgage interest rates. [2] We are now (in 2024) back to the number of home sales we were seeing in a year pre-Covid. I expect we will see the number of home sales continue to increase in our area in 2025. Also shown above, the median sales price increased by 10% - 11% for four years in a row: 2020, 2021, 2022 and 2023. We have now seen a smaller increase (+5%) in the median sales price in 2024 and I expect a similar (5% or less) increase in 2025. Shifting gears a bit, to contract activity, the last two months of 2024 were as slow as you might have expected they would be... 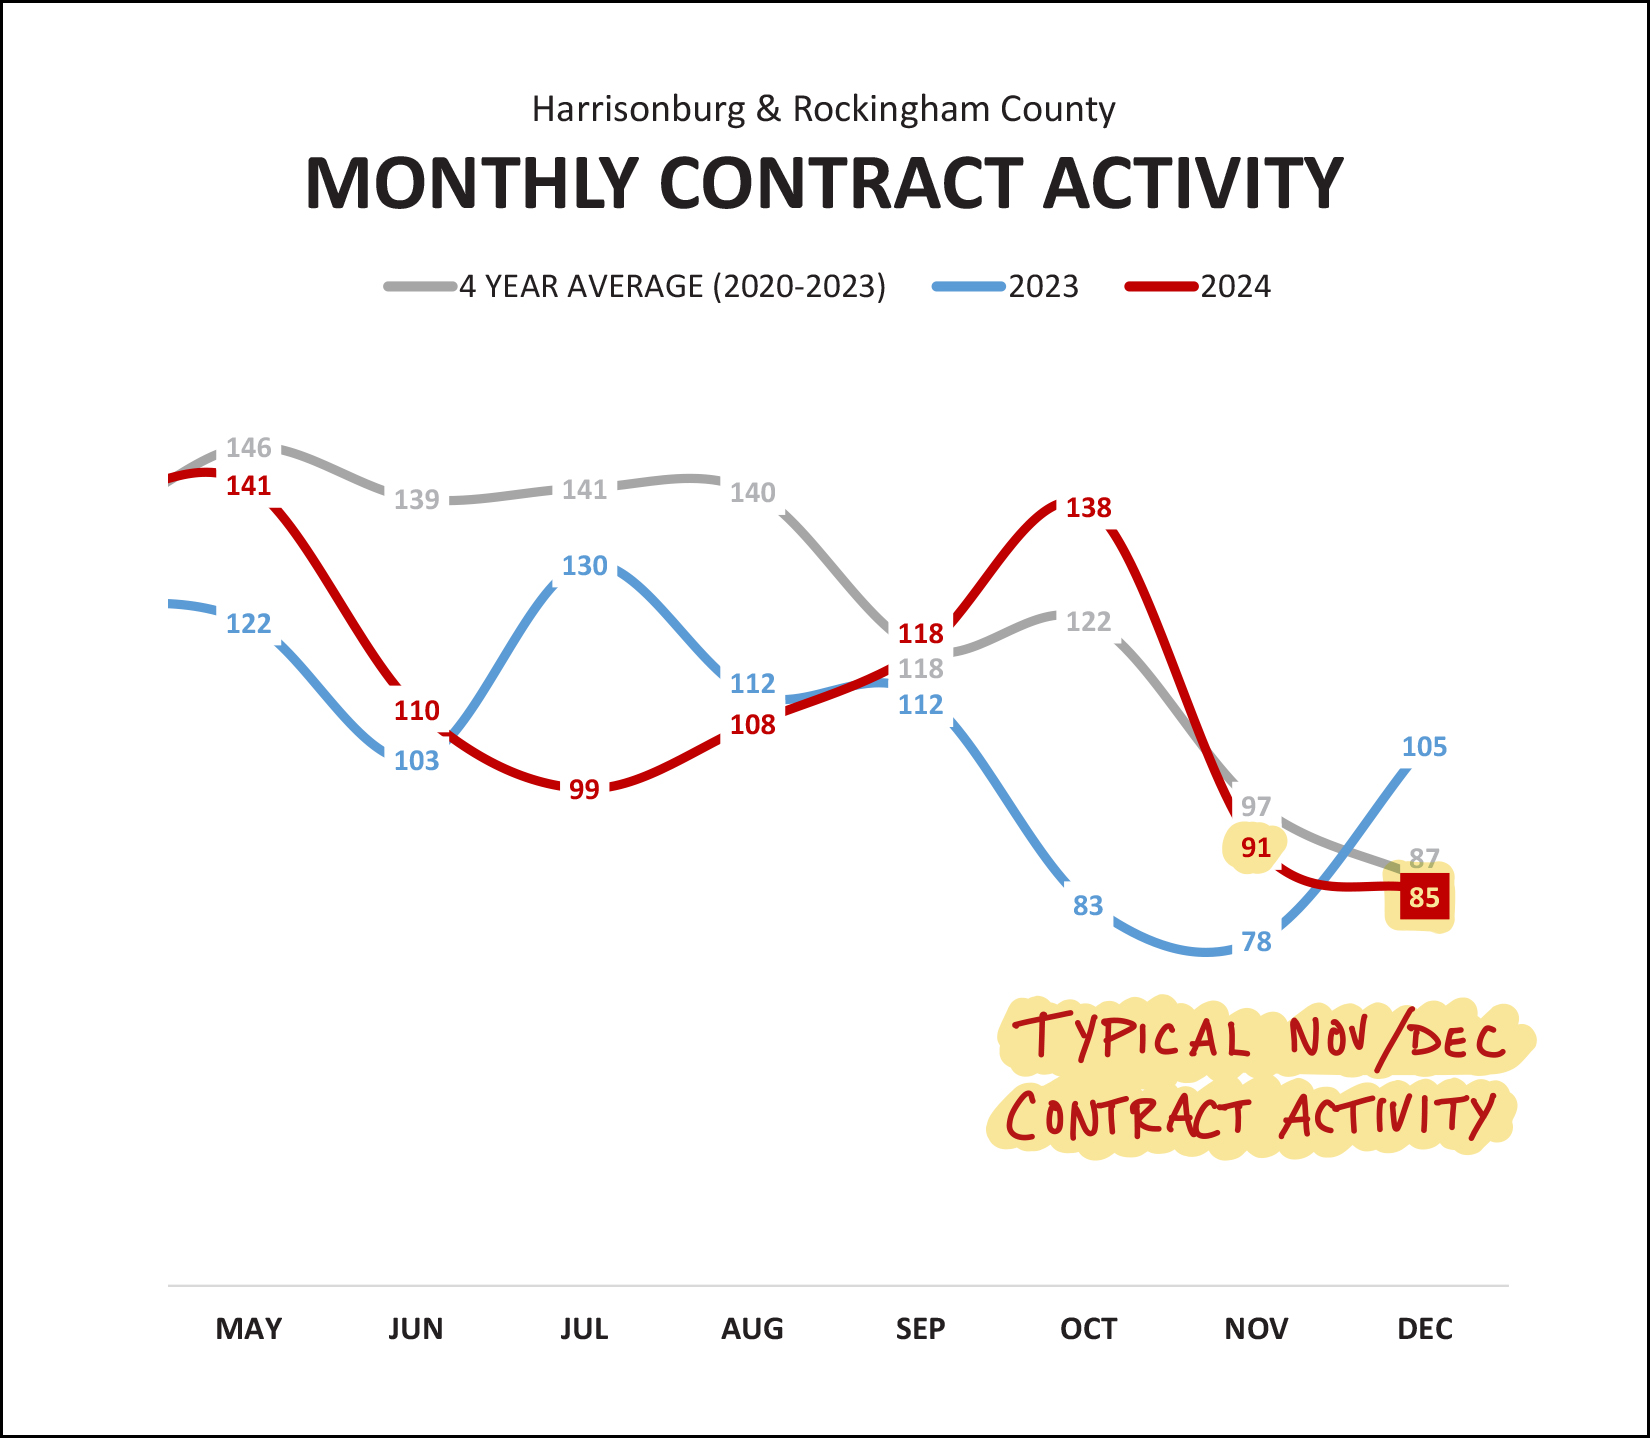 The 91 contracts signed in November 2024 and the 85 signed in December 2024 were about what I expected we would see in the final two months of the year. These tend to be slower months of the year for contract activity -- compared to 120 to 140 contracts being signed in some spring and summer months. Inventory levels are also quite low, as you might expect at this time of year... 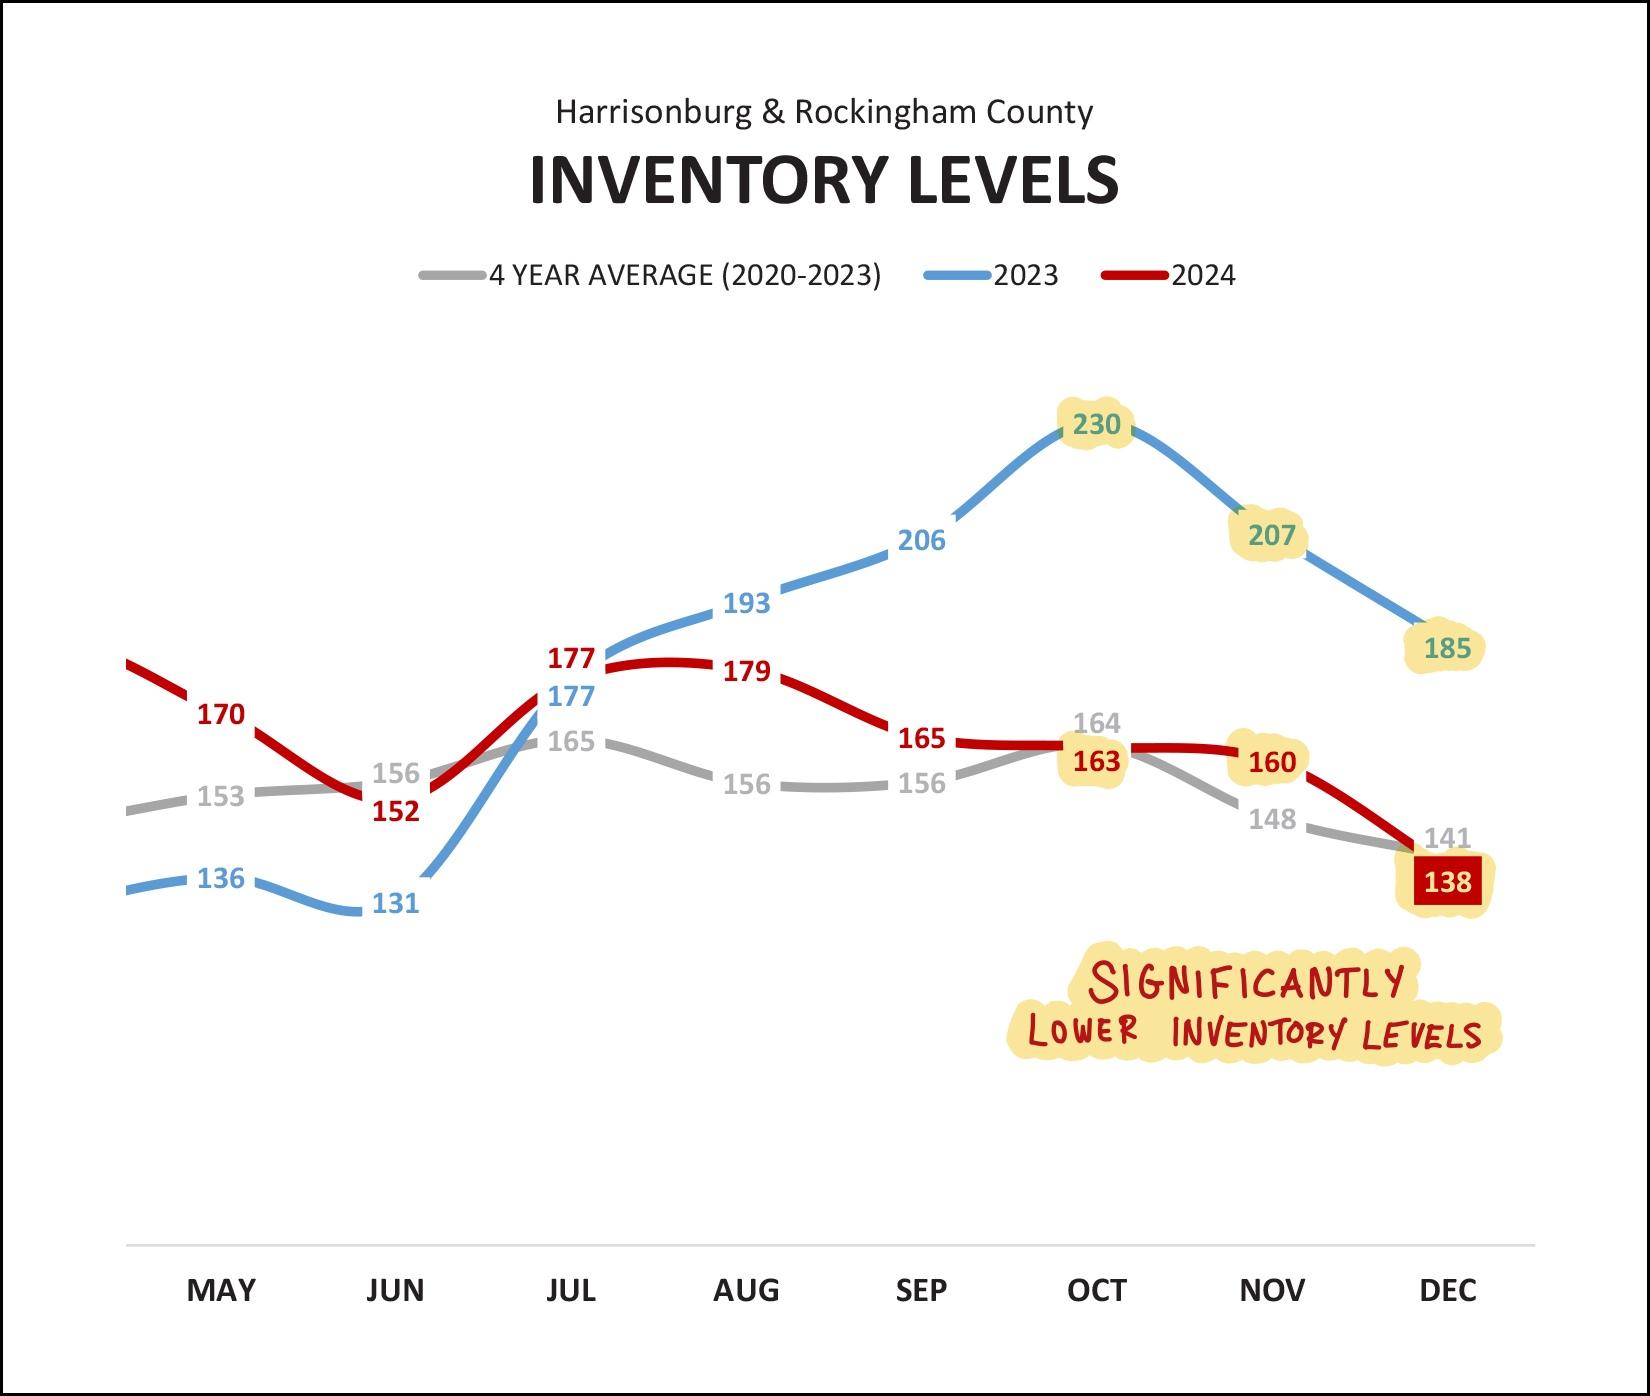 Since July 2024, inventory levels have been falling in Harrisonburg and Rockingham County, particularly compared to a year ago. That is to say that there are fewer homes available to a buyer at any given time now compared to a year ago. There are 138 homes currently on the market in Harrisonburg and Rockingham County... compared to 185 a year ago at this time. Finally, let's look at mortgage interest rates... 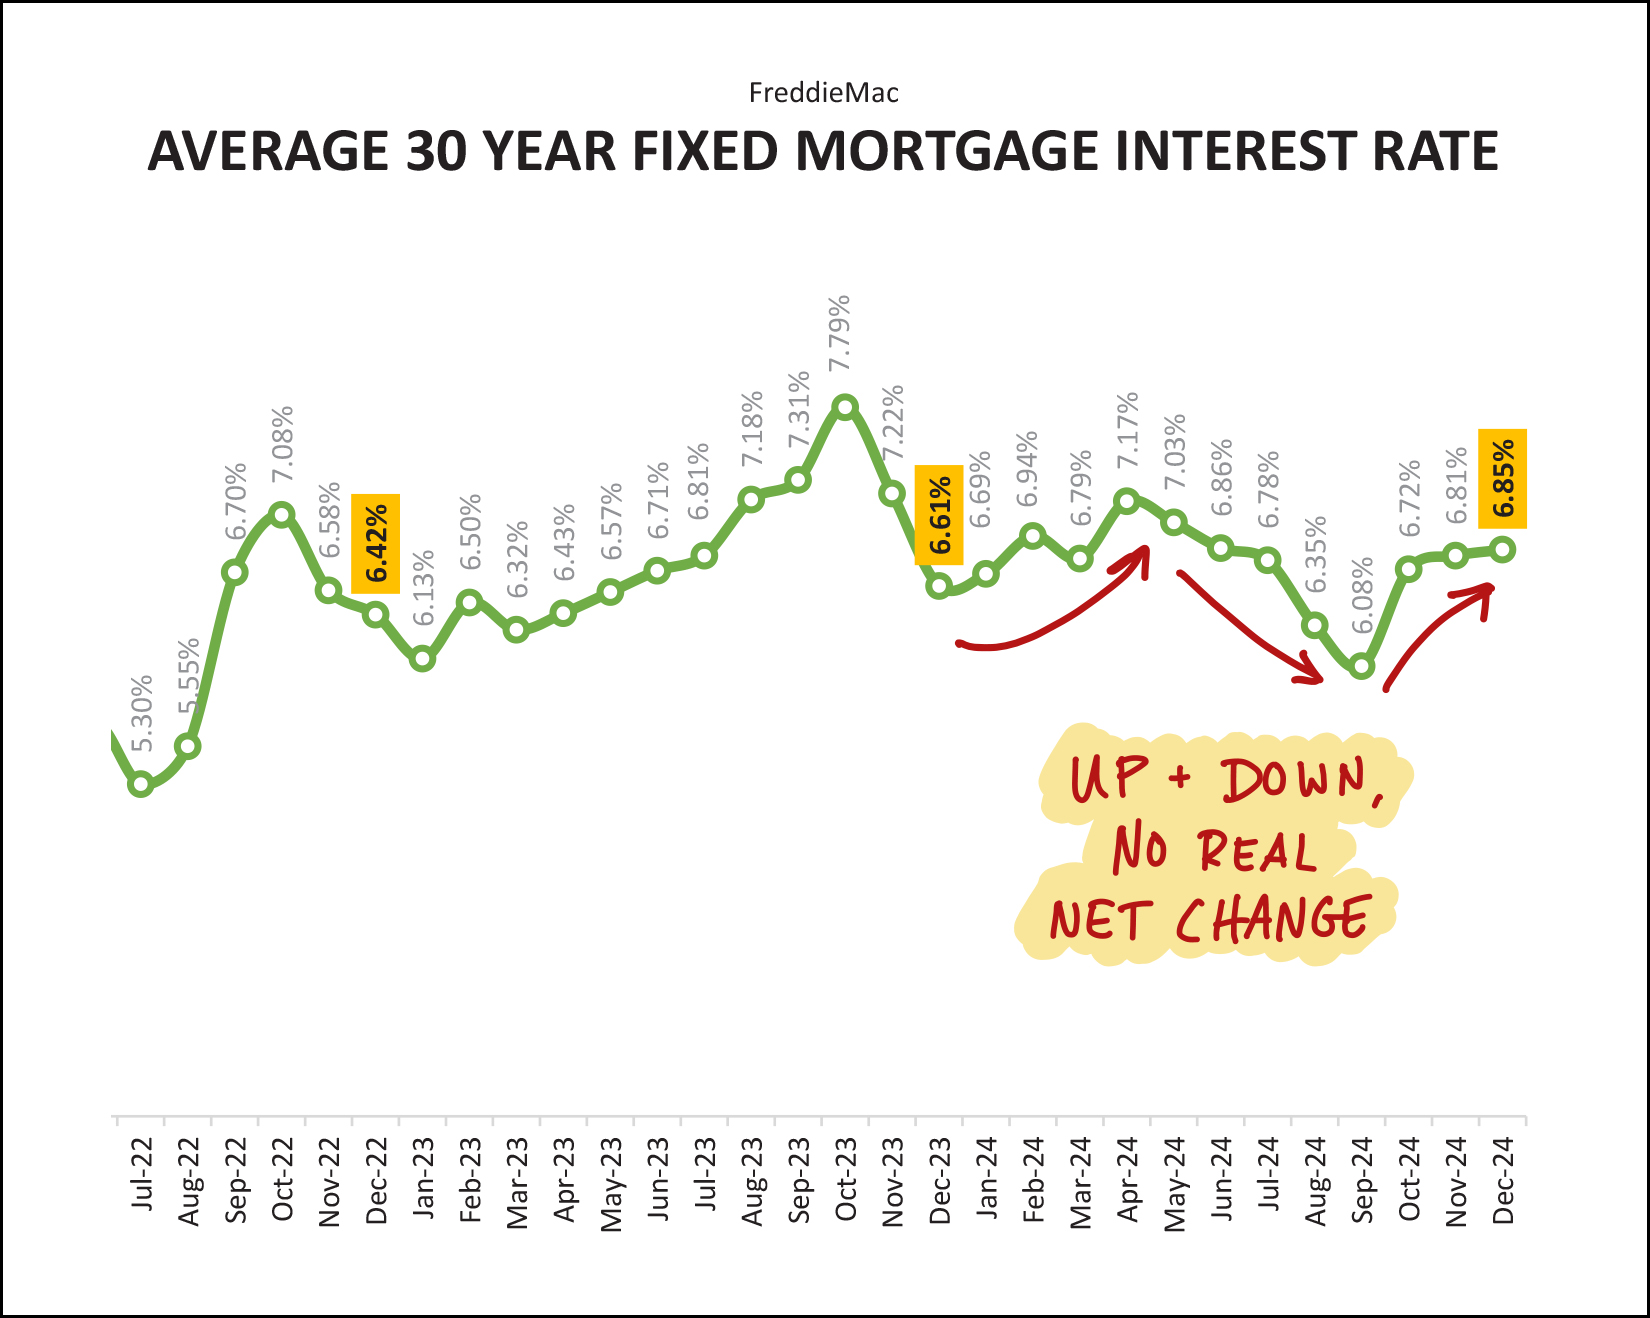 Everything is new. Everything is still the same. Mortgage interest rose in 2024. They fell. They rose again. The average (30 year fixed) mortgage interest rate closed out 2024 at 6.85%... a smidge above the 6.61% level where it was a year prior... which was another smidge above the 6.42% from a year before that. While it would be wonderful to think we would see mortgage interest rates close to 6%, or a bit below that, in 2025 - I think it is more likely that mortgage interest rates will stay between 6.5% and 7% in the coming year. Phew! You made it to the end. :-) One of the reasons I compile all of this data each month is because I educate myself through the process of researching, analyzing and writing this report. This, then, provides me with a good sense of overall market trends to help me advise home buyers and sellers as they buy and sell houses in Harrisonburg and Rockingham County. If you want to move beyond the basics of these broad trends, I'm happy to chat with you directly. These are the most frequent reasons why I'm hearing from someone like you after I send out this report... 1. I plan to sell my house in the next few months and want to better understand the market in my neighborhood and price range. 2. I hope to buy a home in the next few months and want to better understand the process and the market for what I'm looking to buy. 3. I would like to buy a new (to me) home - but would need to sell my house in order to do so. What does this look like and can this even work in the current market? You might have these questions, or any number of other questions, related to thinking about buying a house, selling your house, or real estate in general. Feel free to reach out if I can be of help to you as you explore these topics in 2025. You can contact me most easily by phone/text at 540-578-0102 or by email here. I'll send you another update on the local housing market in February. I assume by then the current snow on the ground will have melted... maybe? Stay warm! | |
More And More Homes That Are Selling Are New Homes |
|
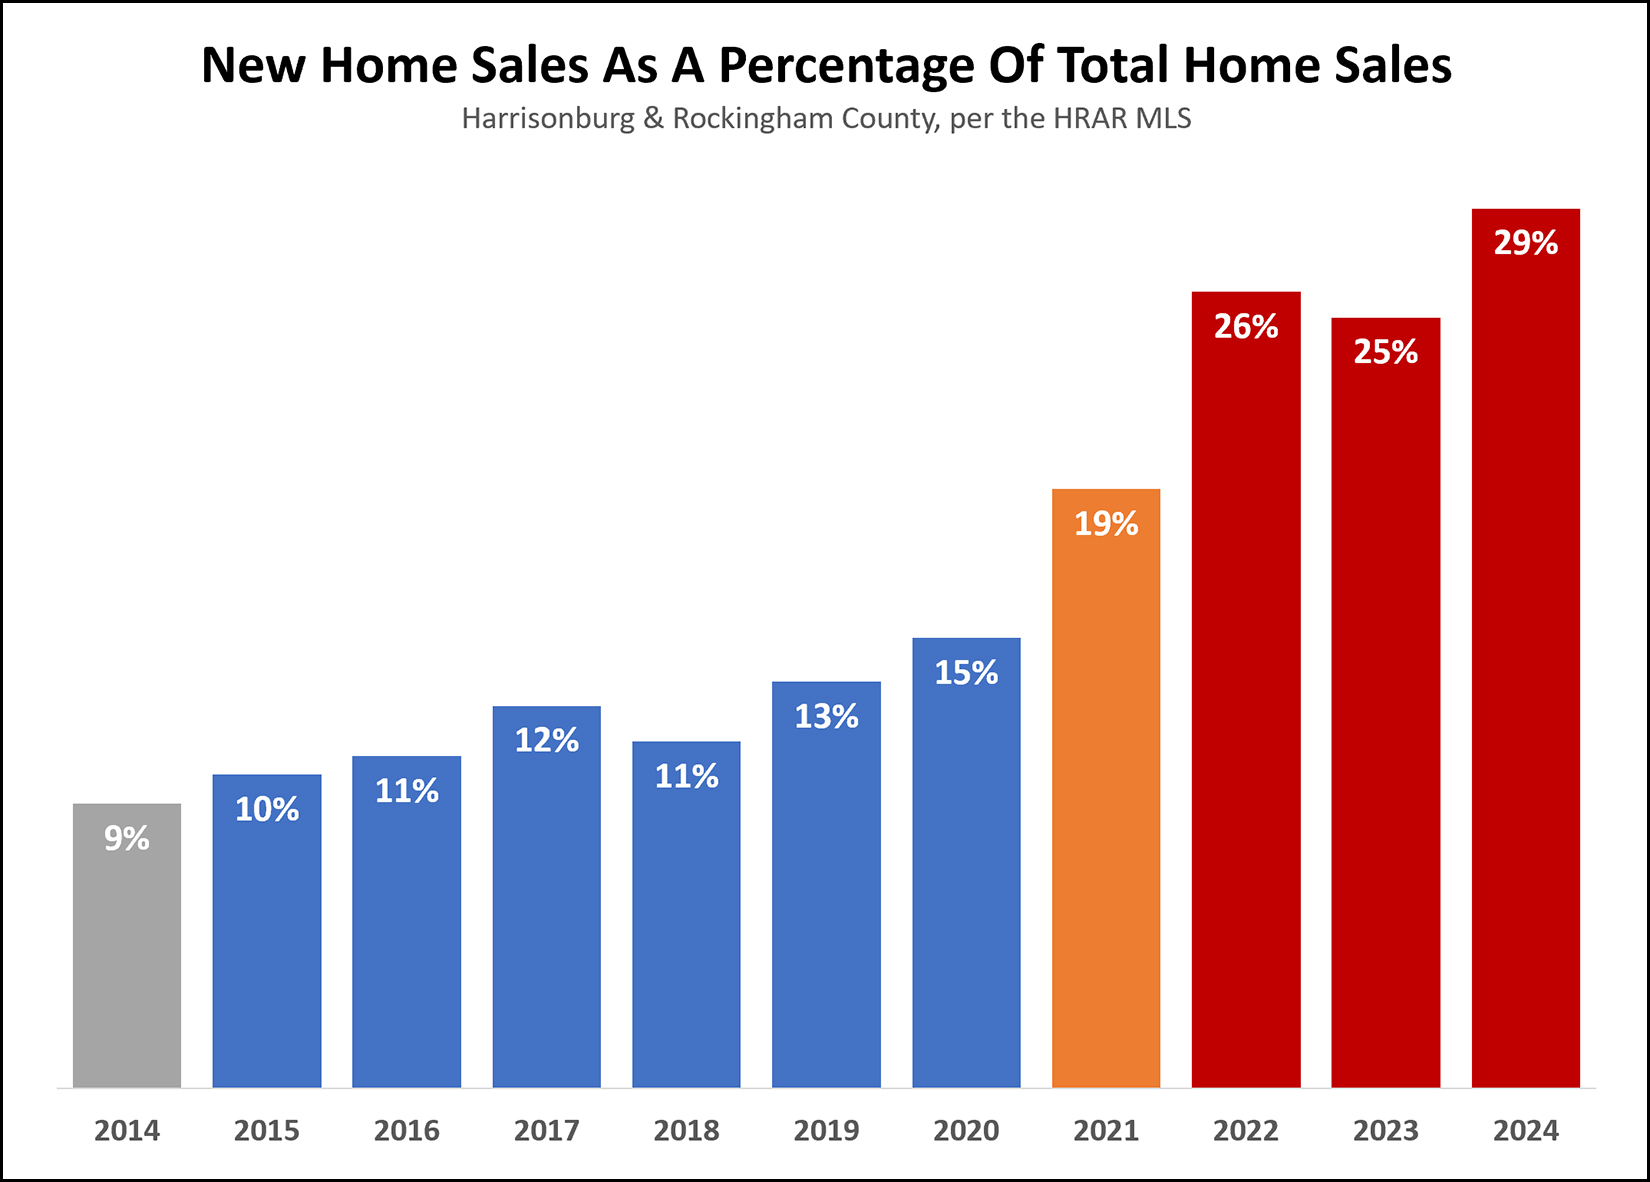 Between 2015 and 2020 we were seeing new home sales making up between 10% and 15% of all home sales. Since then, the portion of all home sales that are new home sales has increased significantly. After a small jump to 19% in 2021 we then saw the new home sale share of the market increase to 26% in 2022, 25% in 2023 and then... 29% in 2024. That is to say that almost one in every three homes that sells is a new home. With multiple local, regional and national builders developing communities in Harrisonburg and Rockingham County, I think it is likely that we will continue to see at least 25% of all home sales being new home sales -- and that could increase up to 30% or higher in 2025. | |
Reviewing My Predictions From Last Year For The 2024 Real Estate Market |
|
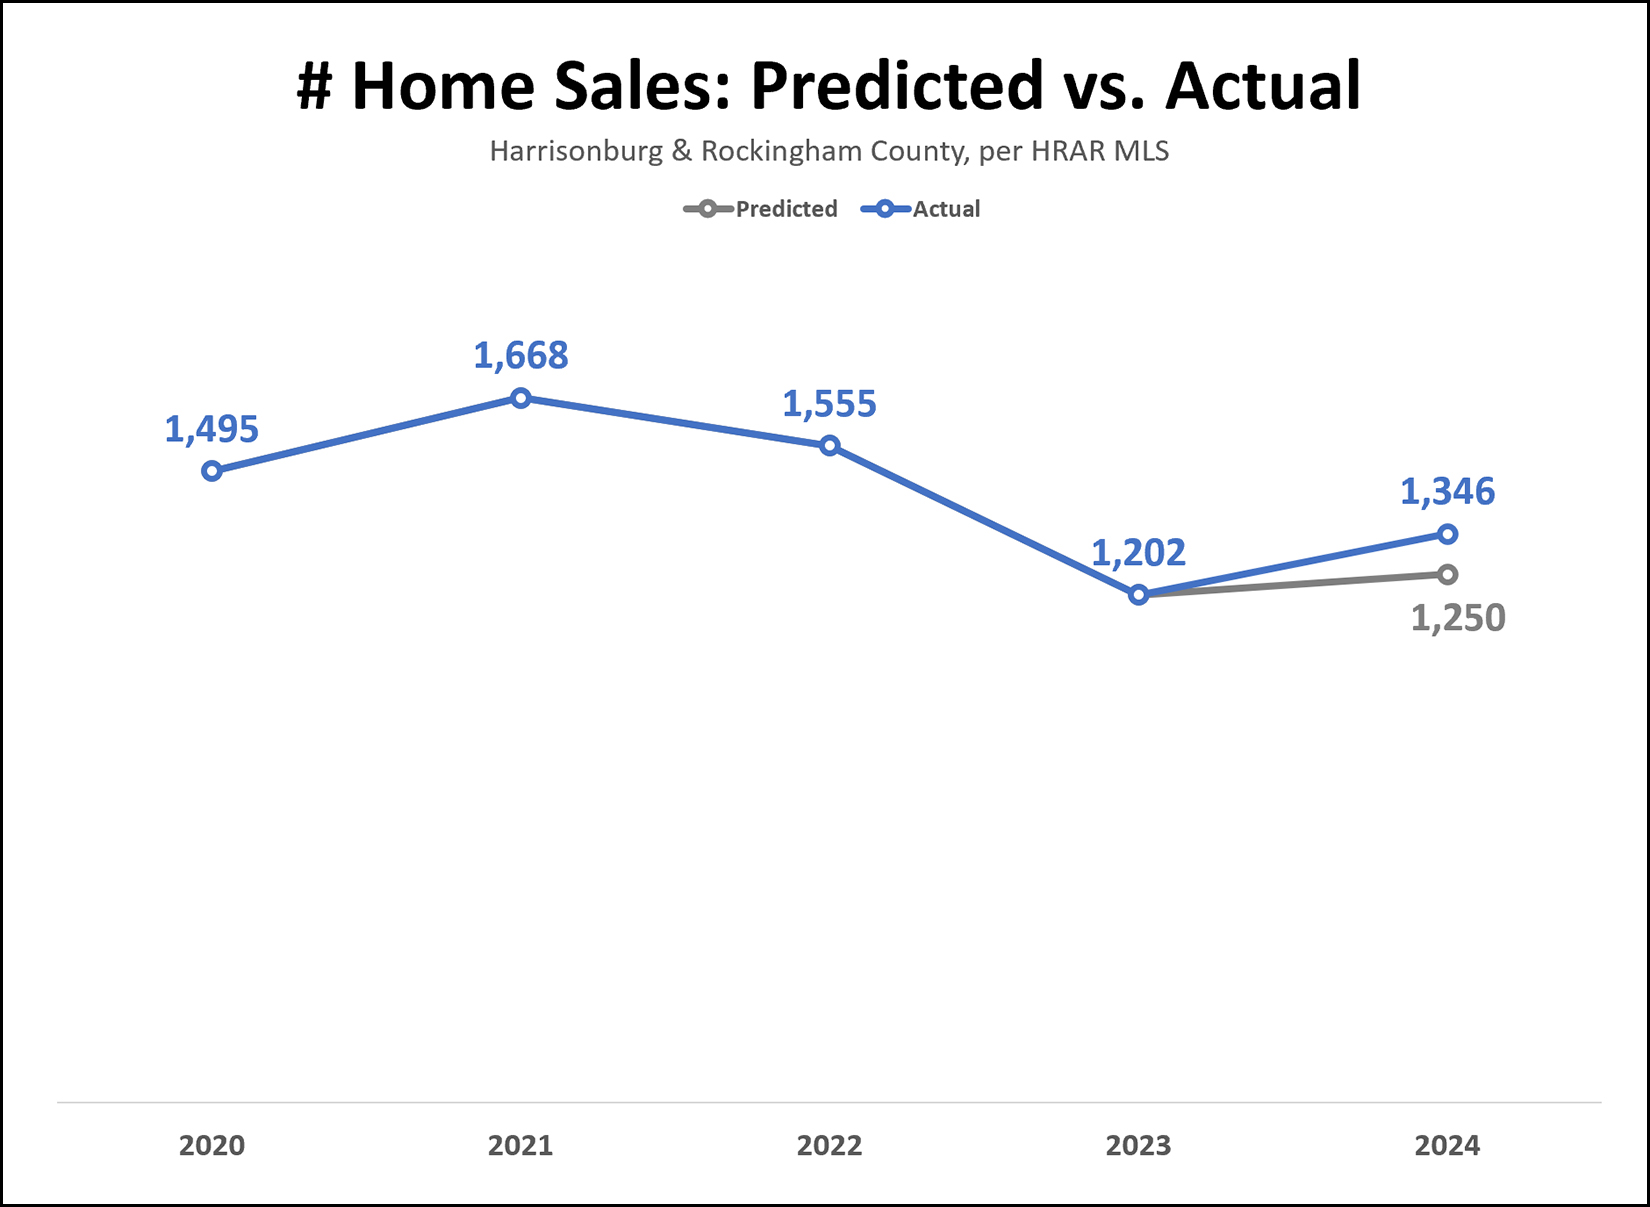 The 2024 real estate surprised me -- at least as far as how many homes were purchased and sold. Mortgage interest rates remained quite high (compared to some of the past five years) throughout 2024, and yet, quite a few home buyers bought homes! Above you'll see actual versus predicted number of home sales in Harrisonburg and Rockingham County within the context of the past few years... [1] Home sales were at or (almost) above 1,500 sales per year through 2020, 2021 and 2022 - due in large part to the Covid-19 pandemic and super low mortgage interest rates. [2] Home sales dropped quite significantly (-23%) in 2023. [3] I predicted that we would see about a 4% increase in home sales in 2024. [4] We actually saw... a 12% increase in home sales in 2024!?! Home sales bounced back much quicker than I thought they would in 2024. And how about those sales prices... 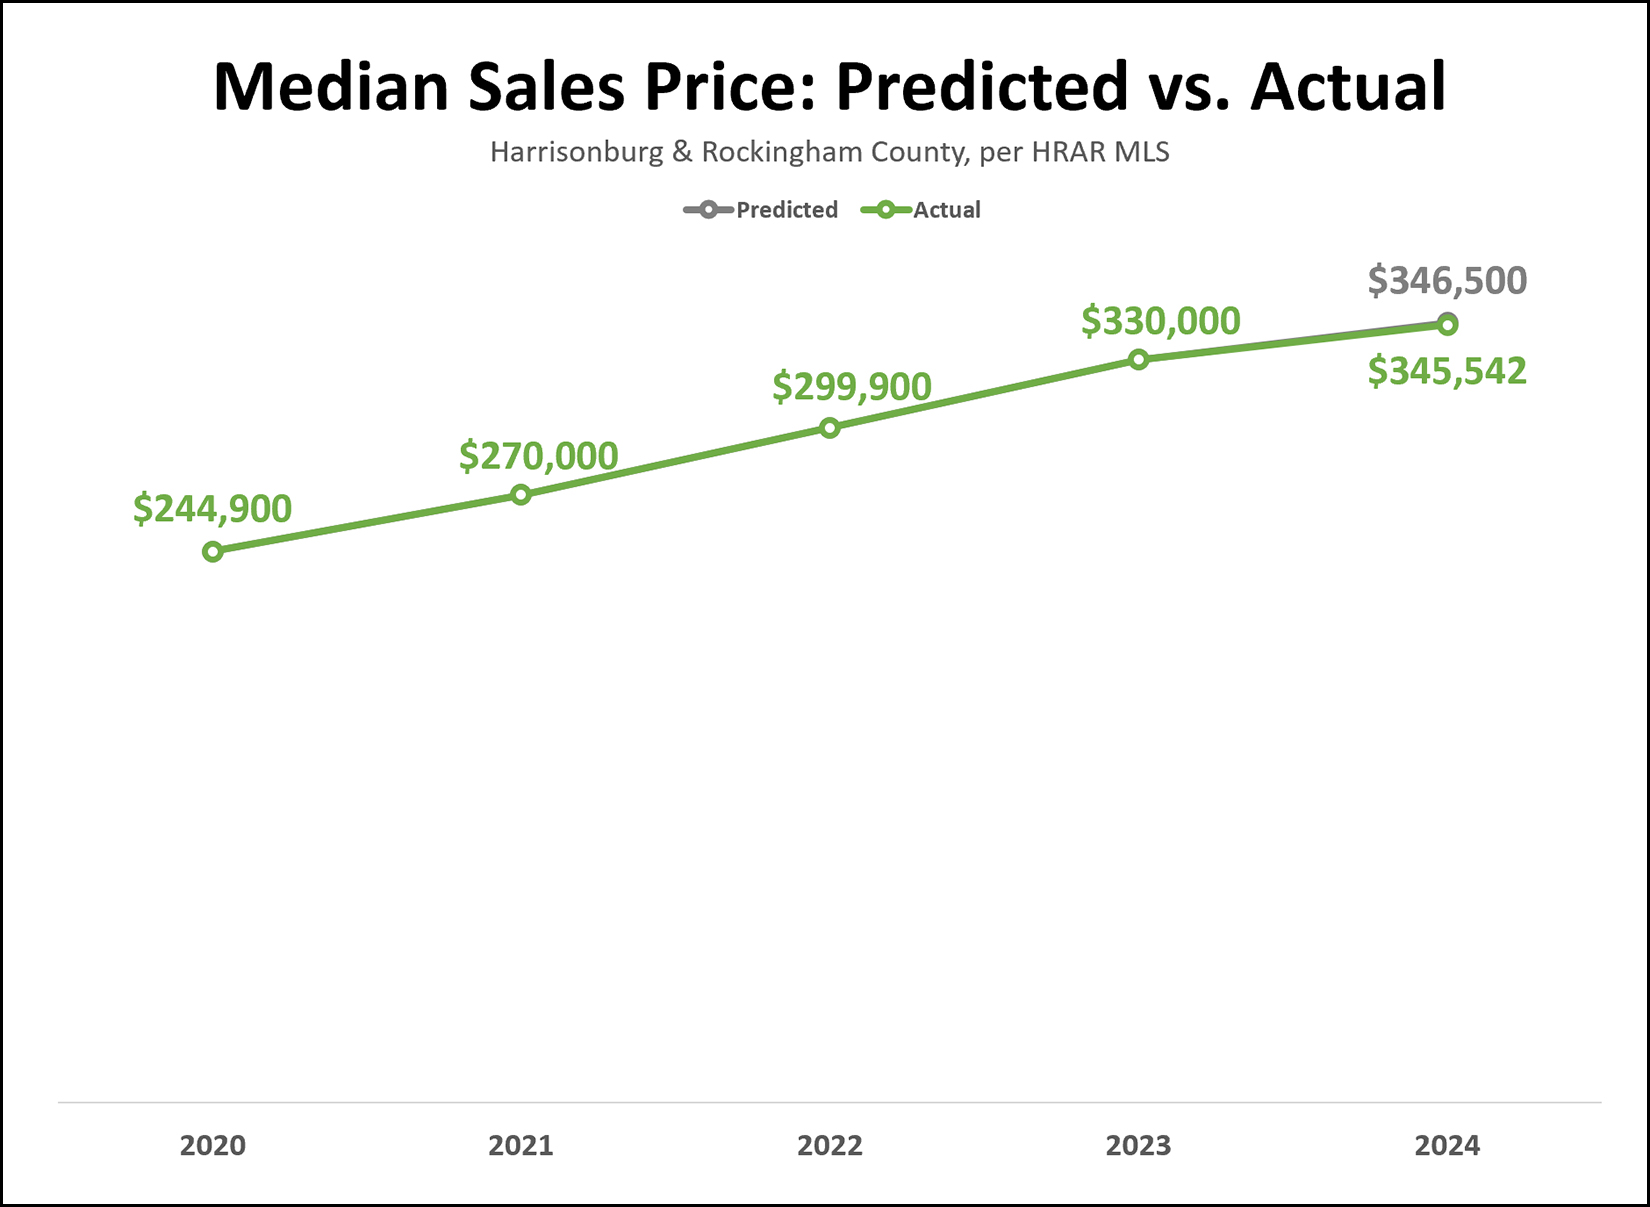 A few things to note above... [1] The median sales price jumped 10% (to 11%) per year in 2021, 2022 and 2023. Wow! [2] I predicted a 5% increase in the median sales price - from $330,000 to $346,500. [3] The actual increase in the median sales price was 4.7% -- from $330,000 to $345,542. So, we'll call that prediction a win once rounded. The median sales price did rise again in 2024, but not by nearly as much as in the three previous years. Stay tuned for my predictions for the 2025 real estate market in Harrisonburg and Rockingham County! | |
Home Sales On The Rise Again In 2024 |
|
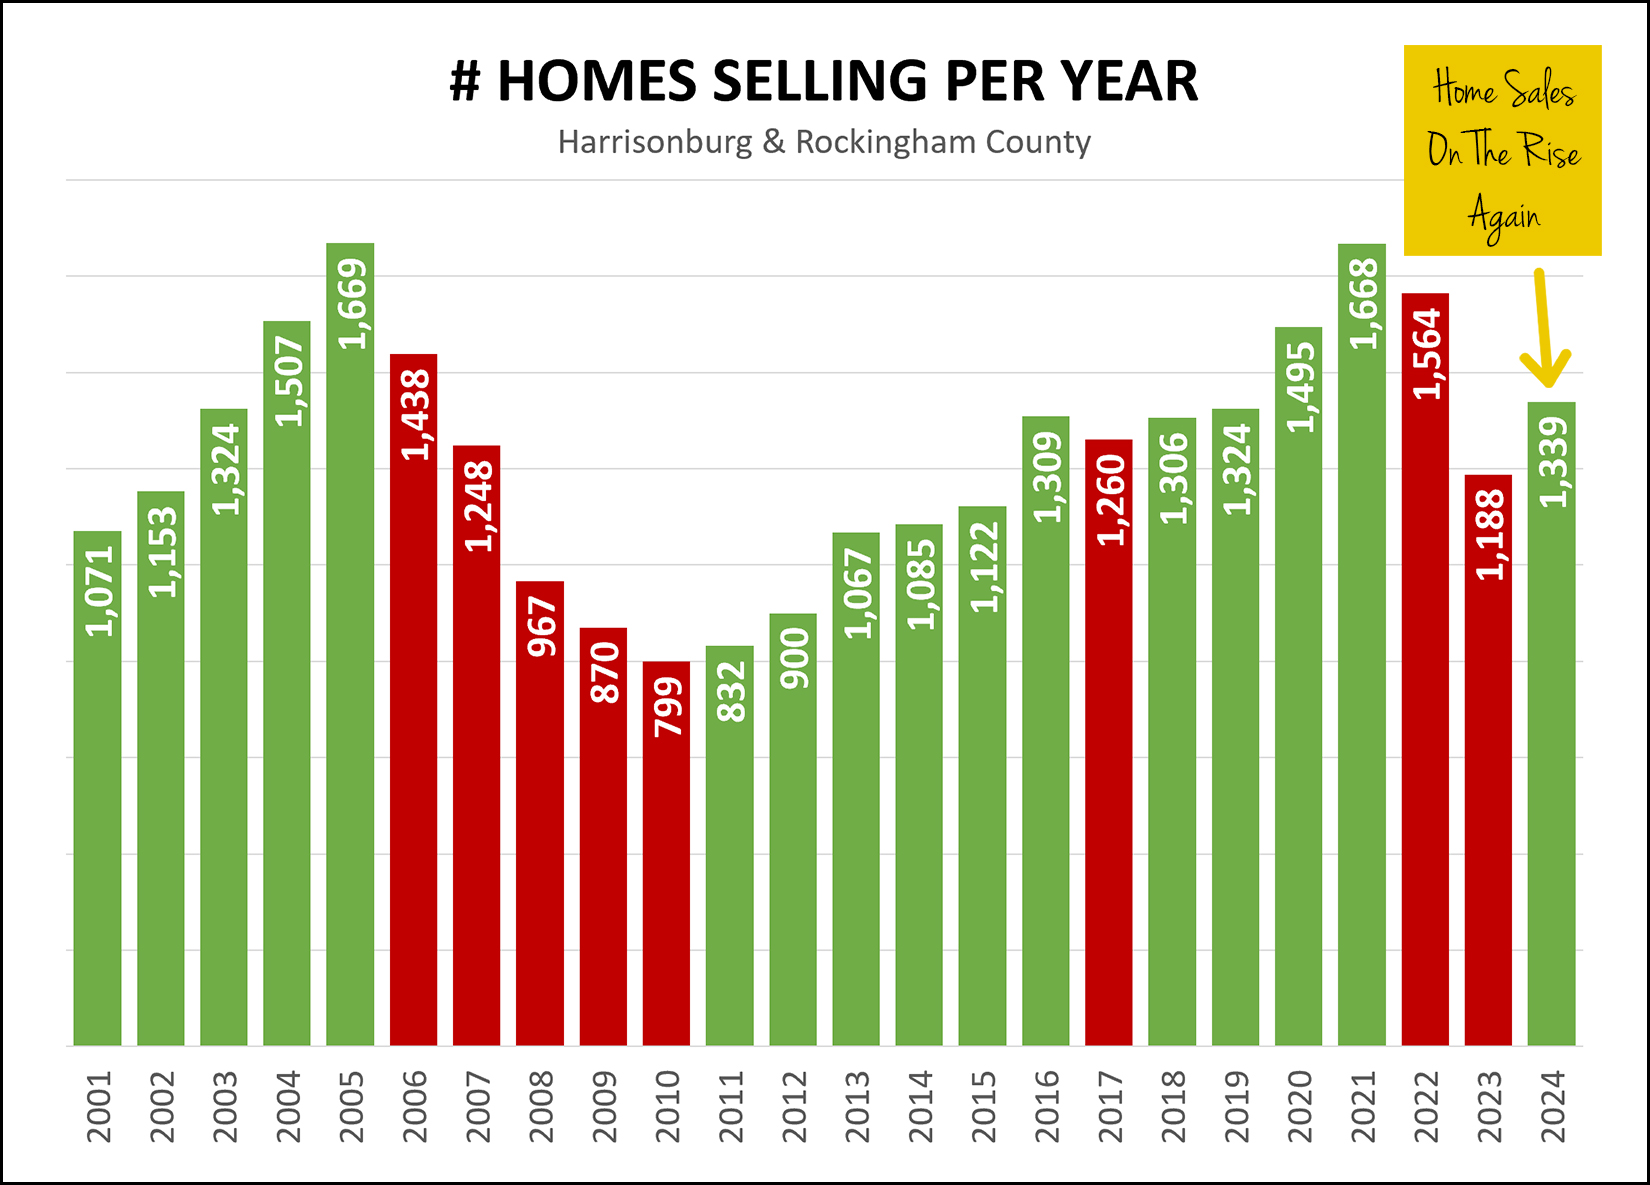 Happy New Year! A few more 2024 home sales might be reported in the HRAR MLS over the next week -- but the total shown above will be relatively close to the total number of home sales for Harrisonburg and Rockingham County last year. A few observations about the graph above... [1] After two years of declining home sales (2022, 2023) we are now see home sales on the rise again in 2024. The final count (at this point) shows a 13% increase in home sales between 2023 and 2024. [2] The large number of home sales in 2020, 2021 and 2022 were at least in part impacted by the Covid-19 pandemic, historically low mortgage interest rates, and a frenzy of buying activity as a result of more and more people working from home during that pandemic. If we ignored those three years of home sales for a moment, we'd find that the 1,339 home sales in 2024 was the highest number of home sales in a year in over 15 years. [3] Home sales declined significantly in 2023 due in part to significant increases in mortgage interest rates. These mortgage interest rates came down a bit in 2024, but not significantly, and yet, home sales rose again in 2024. What should we expect for 2025? I'll look ahead at some predictions for 2025 in the coming days. Stay tuned. | |
December Contract Activity Slower This Year Than Last |
|
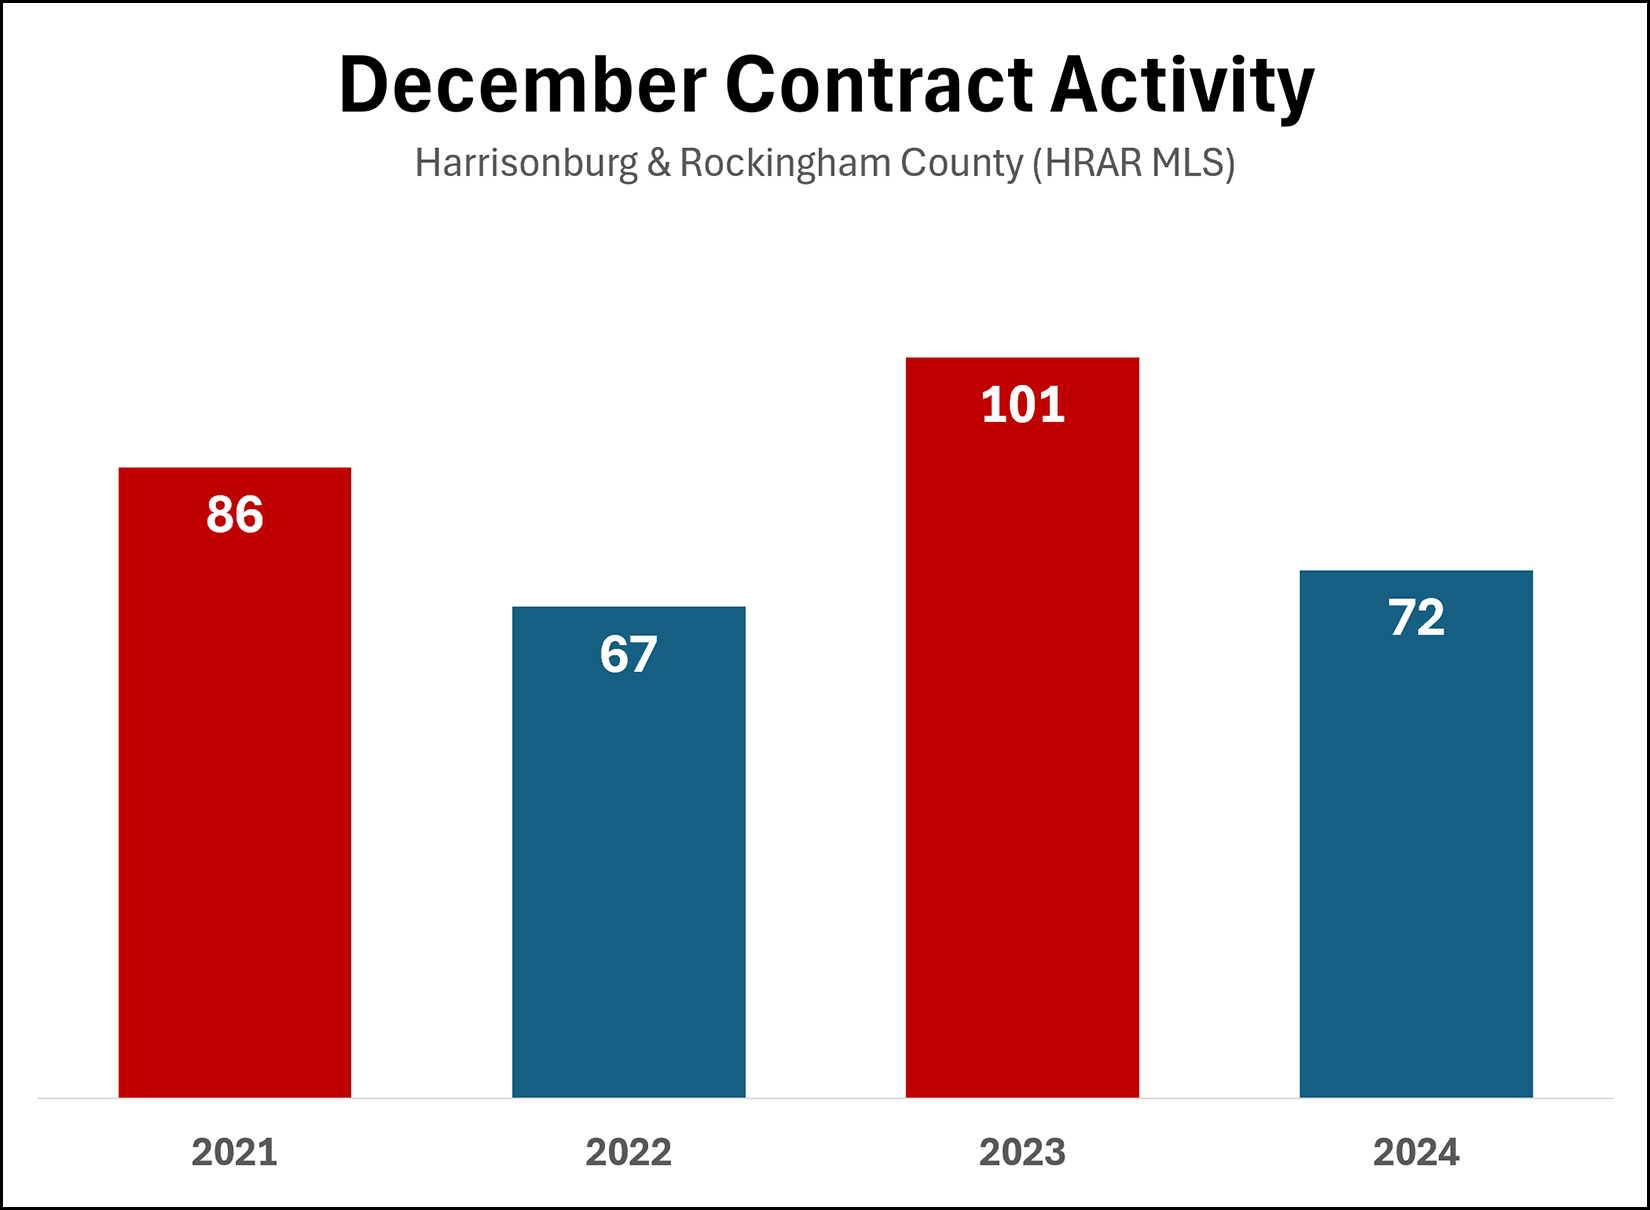 The chart above shows December contract activity for the past four years. The only caveat I'll add is that the last day of 2024 contract activity is not included in the chart, though that seems unlikely at this point to swing the 2024 data point very far. So, what is notable? 1. Far fewer (29% fewer) buyers signed contracts in this December than last - though that may also be related to how many sellers are willing to sell at the home. 2. About the same number of buyers (and sellers) signed contracts this December (2024) compared to two Decembers ago (2022) - though 2024 wins out by a few contracts. Because we have seen so much movement in mortgage interest rates over the past three years and because that can impact buyer behavior, it's probably also worth noting the following related to 30 year fixed mortgage interest rates... December 2023: average rate declined from 7.22% to 6.61% December 2024: average rate modulated between 6.60% and 6.85% Could those 101 December 2023 buyers have been reacting to declines mortgage interest rates? Possibly so. Could it be that there were more sellers willing to sell in December 2023 than in December 2024? This is also quite possible. | |
The End Of Double Digit Growth In Median Sales Prices, At Least For Now |
|
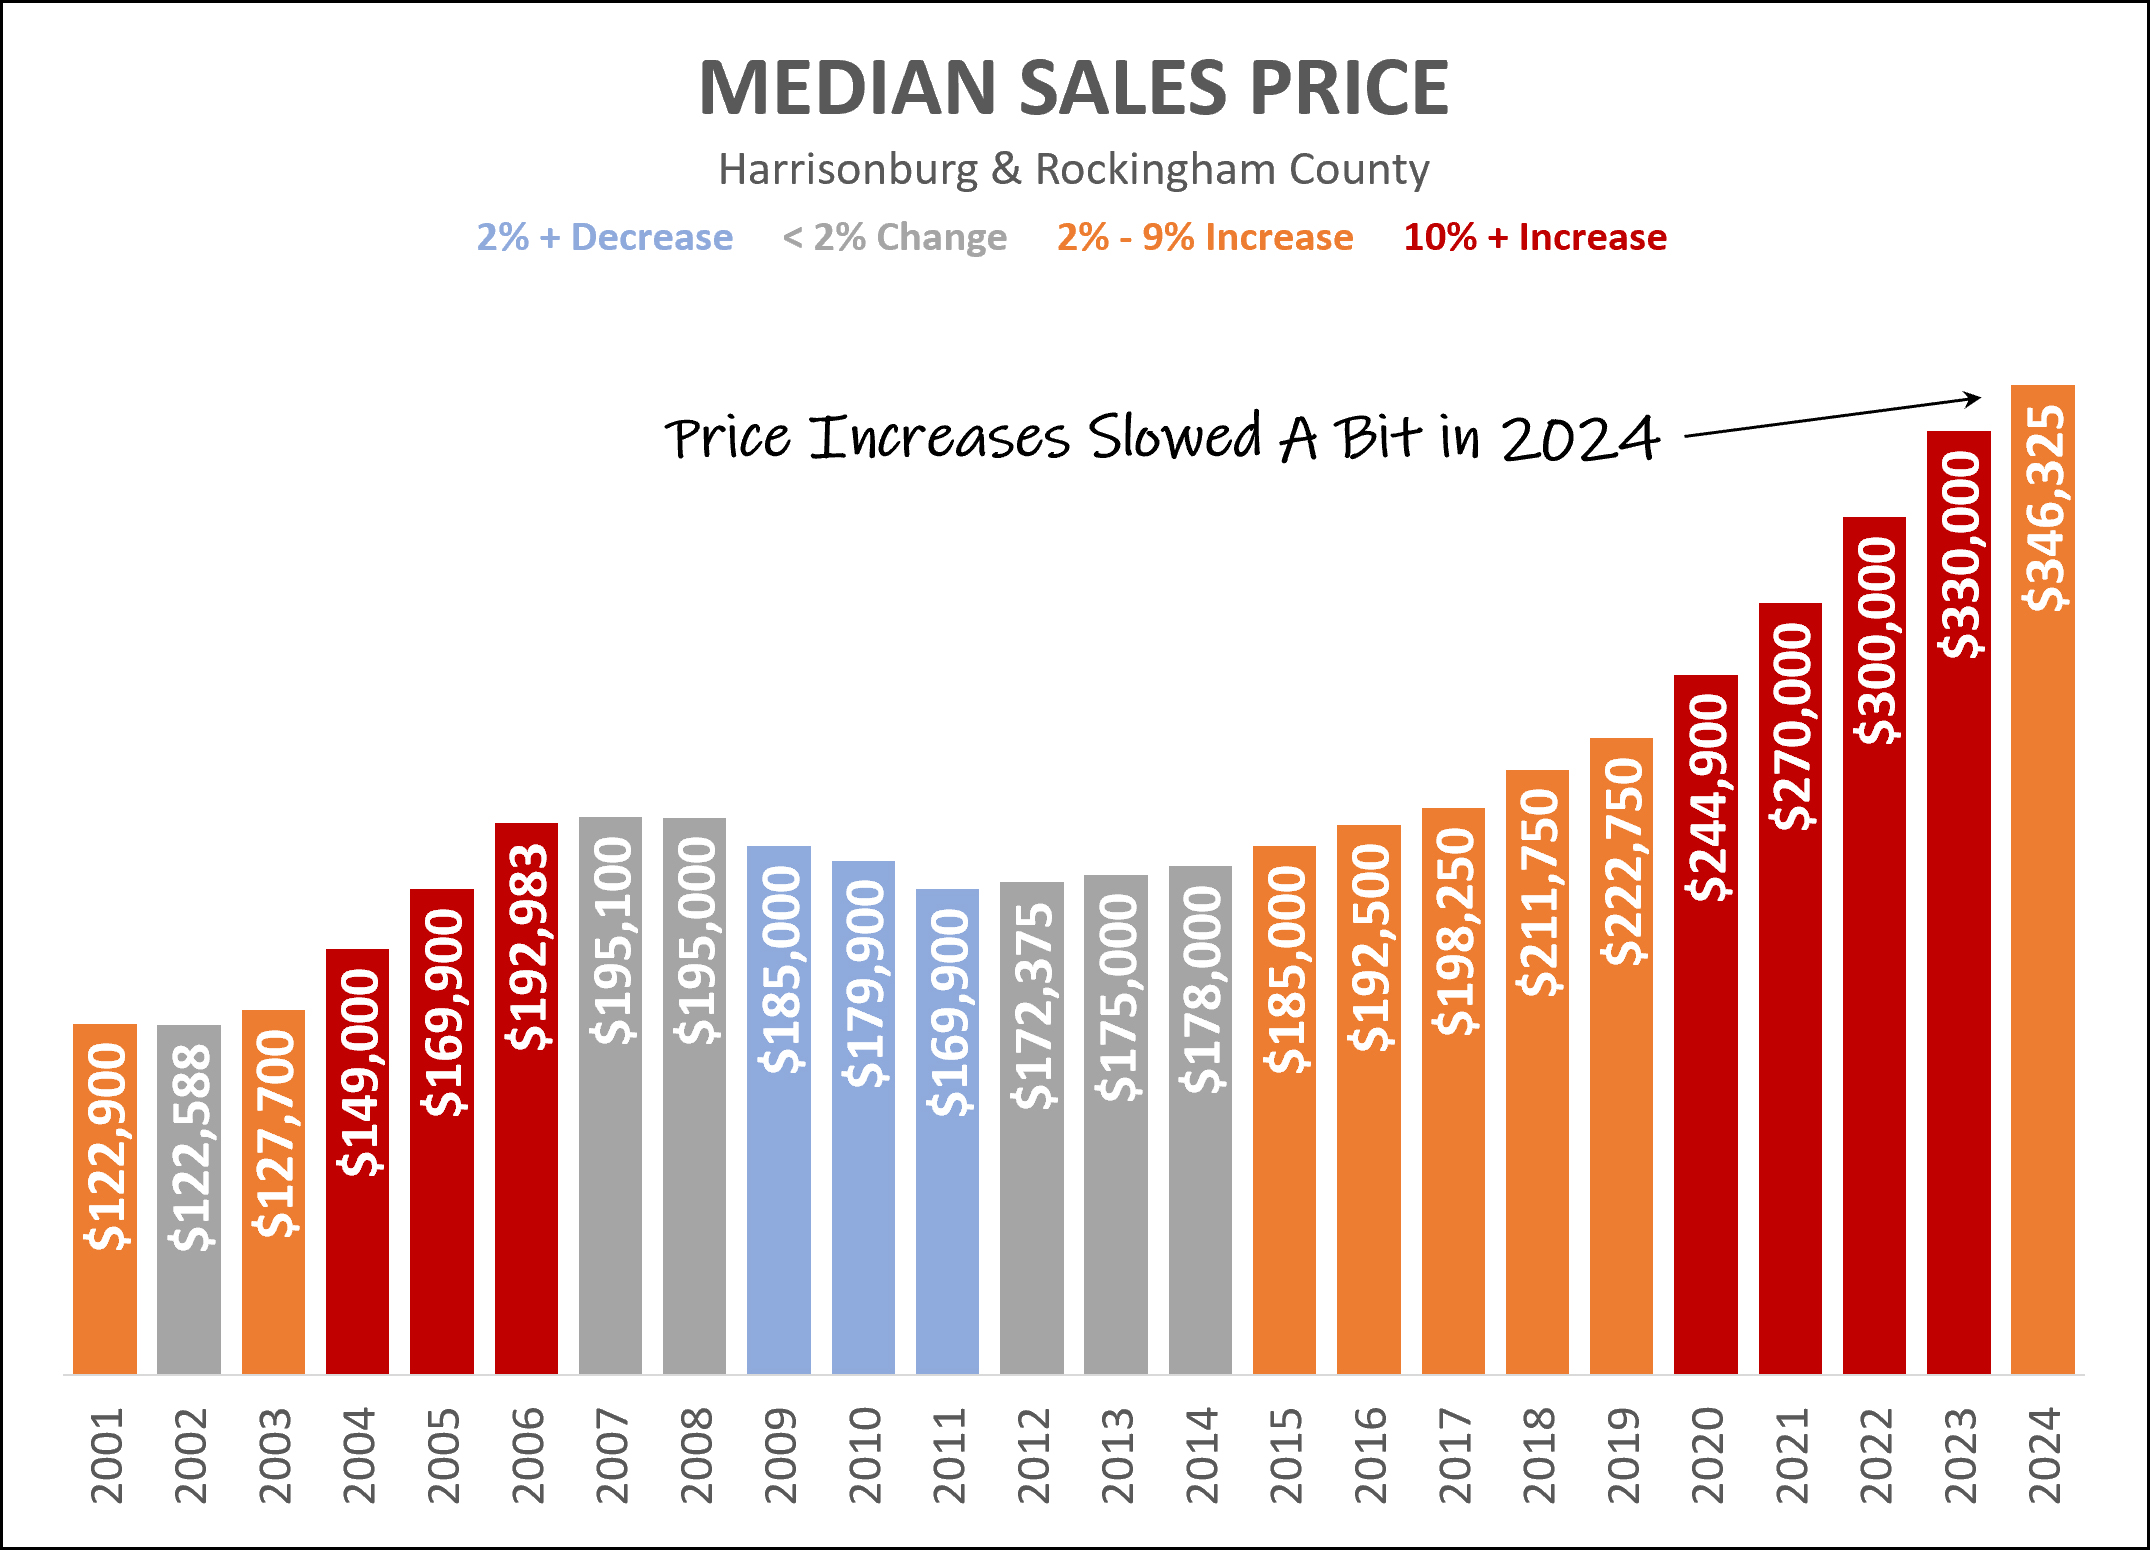 Looking back over the past 24 years, there have been two multi-year periods of rapid increases in the median sales price in Harrisonburg and Rockingham County... 2004 through 2006
This 2004 through 2006 timeframe was followed by eight years of no change or slight decreases in the median sales price. 2020 through 2023
All we know so far is that this 2020 through 2023 timeframe has been followed by one year (2024) of a slower but still significant (+5%) increase in the median sales price. | |
About One In Six Home Purchases Are Cash Purchases In Harrisonburg, Rockingham County |
|
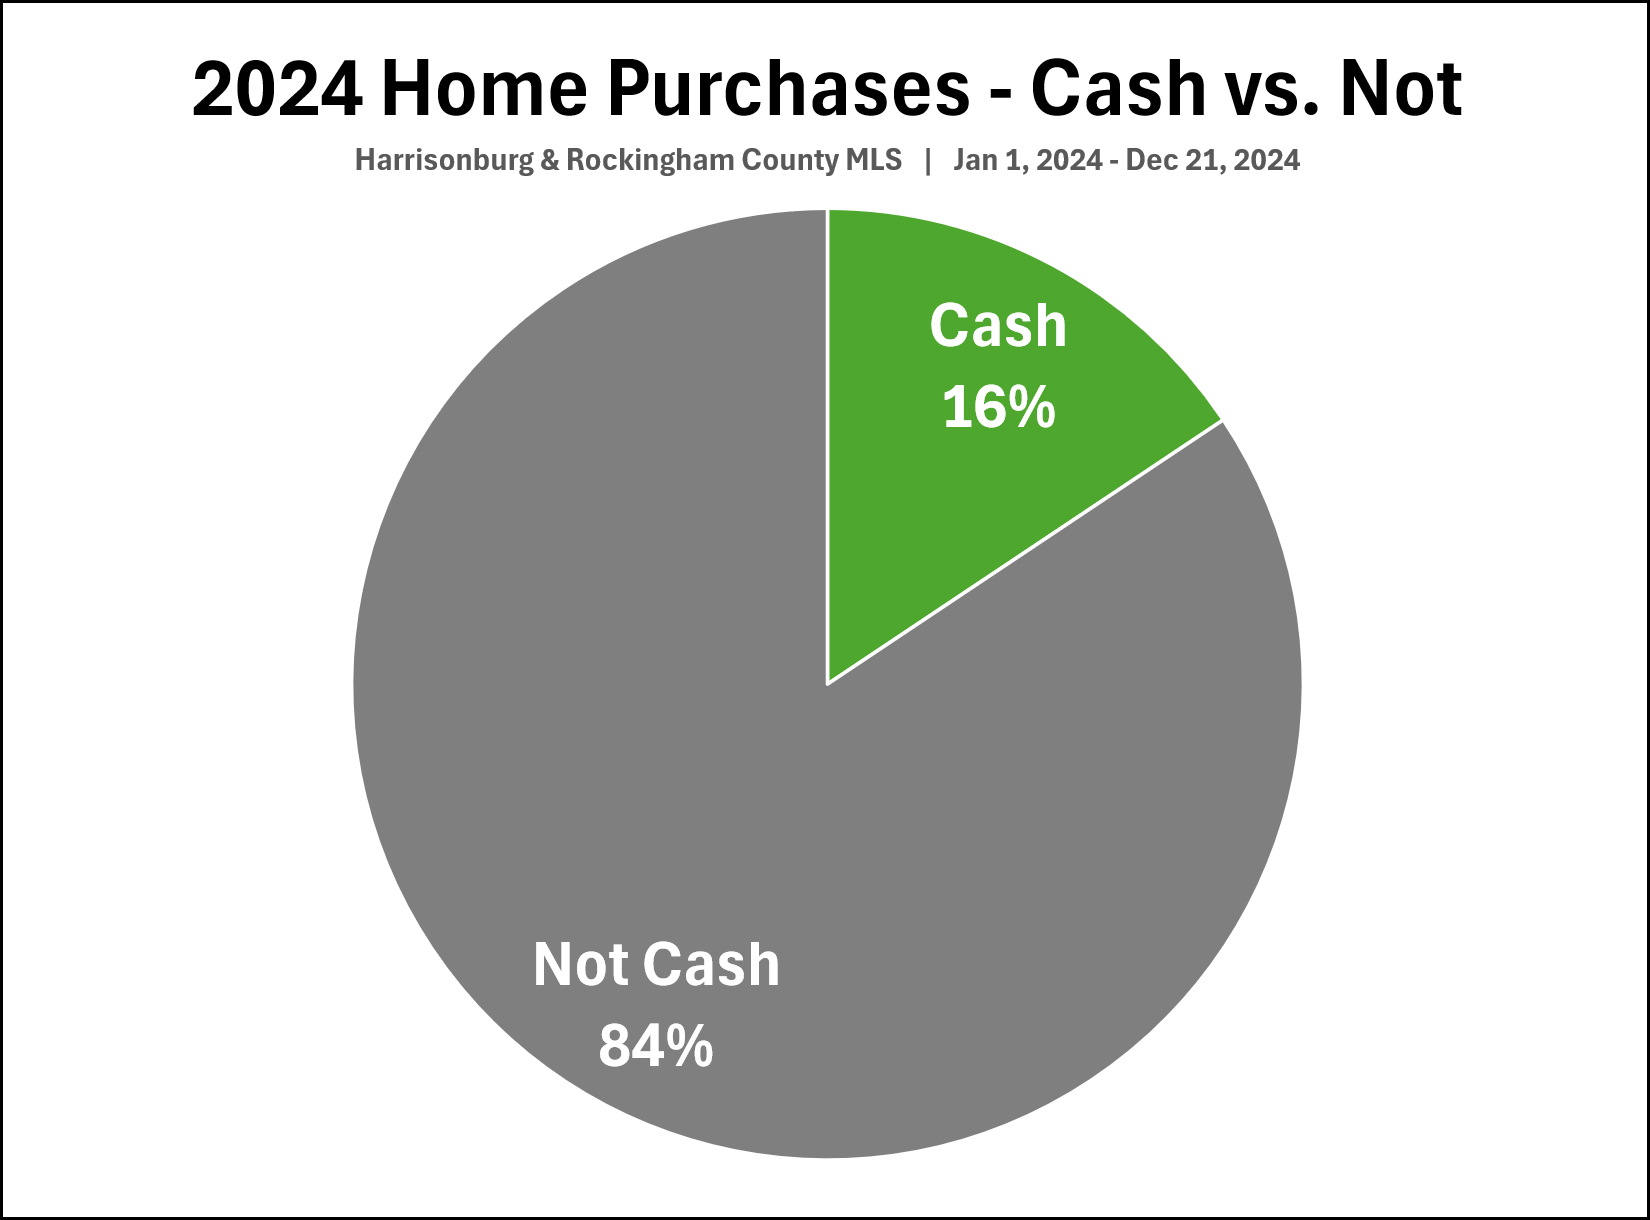 How many buyers do you think paid cash for the homes they purchased in Harrisonburg and Rockingham County over the past year? As shown above, about 1 in 6 buyers paid cash for homes in Harrisonburg and Rockingham County over the past year, per the HRAR MLS. These cash buyer might fit into a variety of customer categories... 1. Buyers who have built up equity in their homes over many years and thus are able to pay for that next house with cash rather than with a mortgage. 2. Buyers who are moving from a more expensive home market, who sold a home with some equity, which provided enough cash to purchase a home in the Harrisonburg market with cash. 3. Investor buyers who are paying cash to purchase a rental property. | |
November Home Sales Surge with 12% Year Over Year Growth and 5% Increase in Median Price |
|
 Happy Friday morning, friends! It's hard to believe there are only 19 days remaining in 2024! This year has flown by, and we'll soon be ringing in the New Year! Speaking of new beginnings, I'm excited to let you know about the latest news in our family - our son, Luke, is now also a Realtor! Luke looks forward to helping individuals and families navigate the real estate market in the Harrisonburg and Rockingham County area and is also continuing his studies at JMU, pursuing a dual degree in Independent Scholars and Communication Studies with minors in Entrepreneurship and Honors Interdisciplinary Studies. In some other fun news, The Steel Wheels are hosting another Winter Roots concert in February at JMU's Wilson Hall. You can find the details of the concert here, buy tickets here... and... enter to win a pair of free tickets here! And now... after all that... let's hit the real estate data... 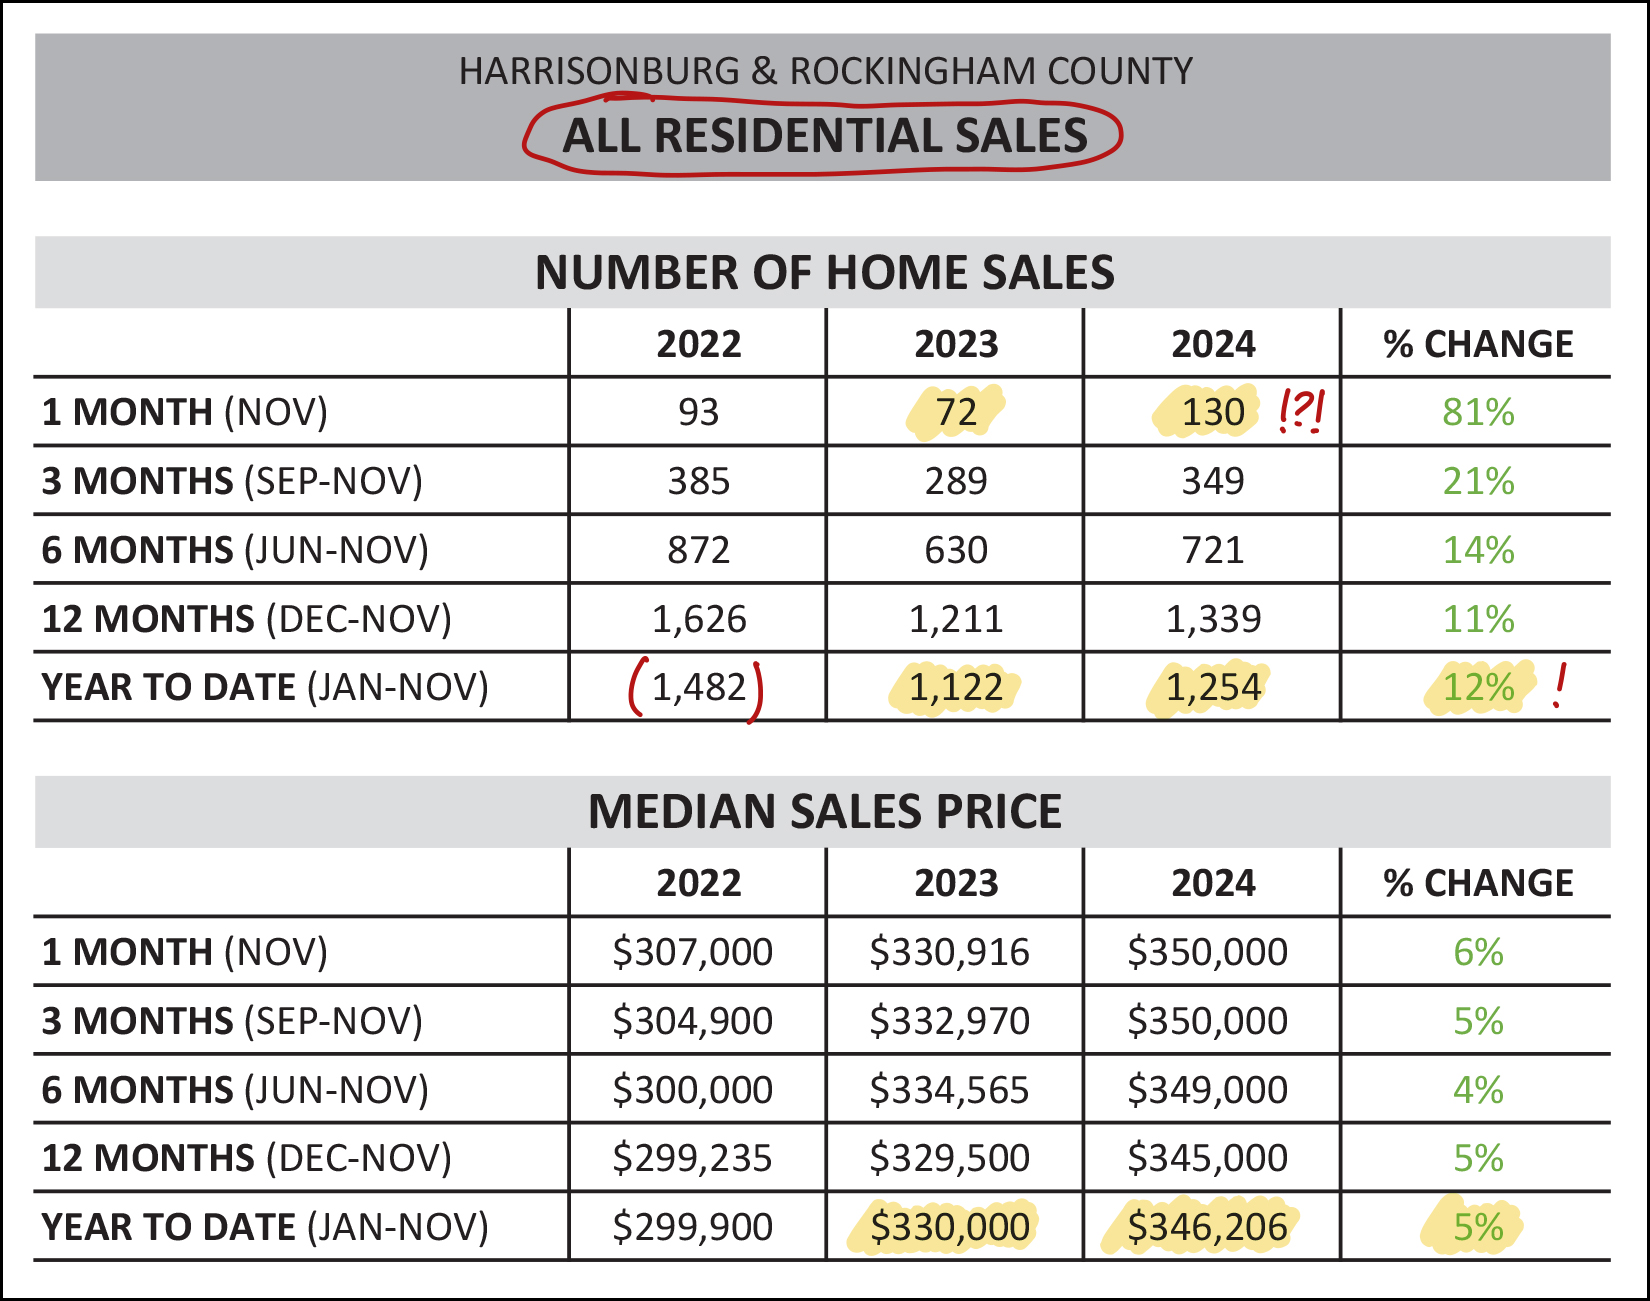 First up... look at those November home sales!?! Last November there were only 72 home sales in Harrisonburg and Rockingham County... this November... 130 home sales!?! This took me by surprise. Even if we considered November 2023 to be a bit slower than normal, when we look back at November 2022 there were only 93 home sales... so this November was certainly a surprising surge of home sales for our market. This surge of home sales in November lead to -- no surprise here -- continued improvement in how this year's home sales compare to last year. We have now seen 12% more home sales this year than last in Harrisonburg and Rockingham County when looking at 11 months of data. Of note... the 1,254 home sales seen thus far in 2024 is still quite a bit lower than the 1,482 home sales seen in the first 11 months of 2022. And how about those prices? The median sales price for all homes sold in 2024 in Harrisonburg and Rockingham County is now approaching $350,000... which is a 5% increase compared to the median of $330,000 seen last year. Moving on to look at few sub-sections of the market, first let's see what's happening in the detached home market - which excludes townhouses, duplexes and condos... 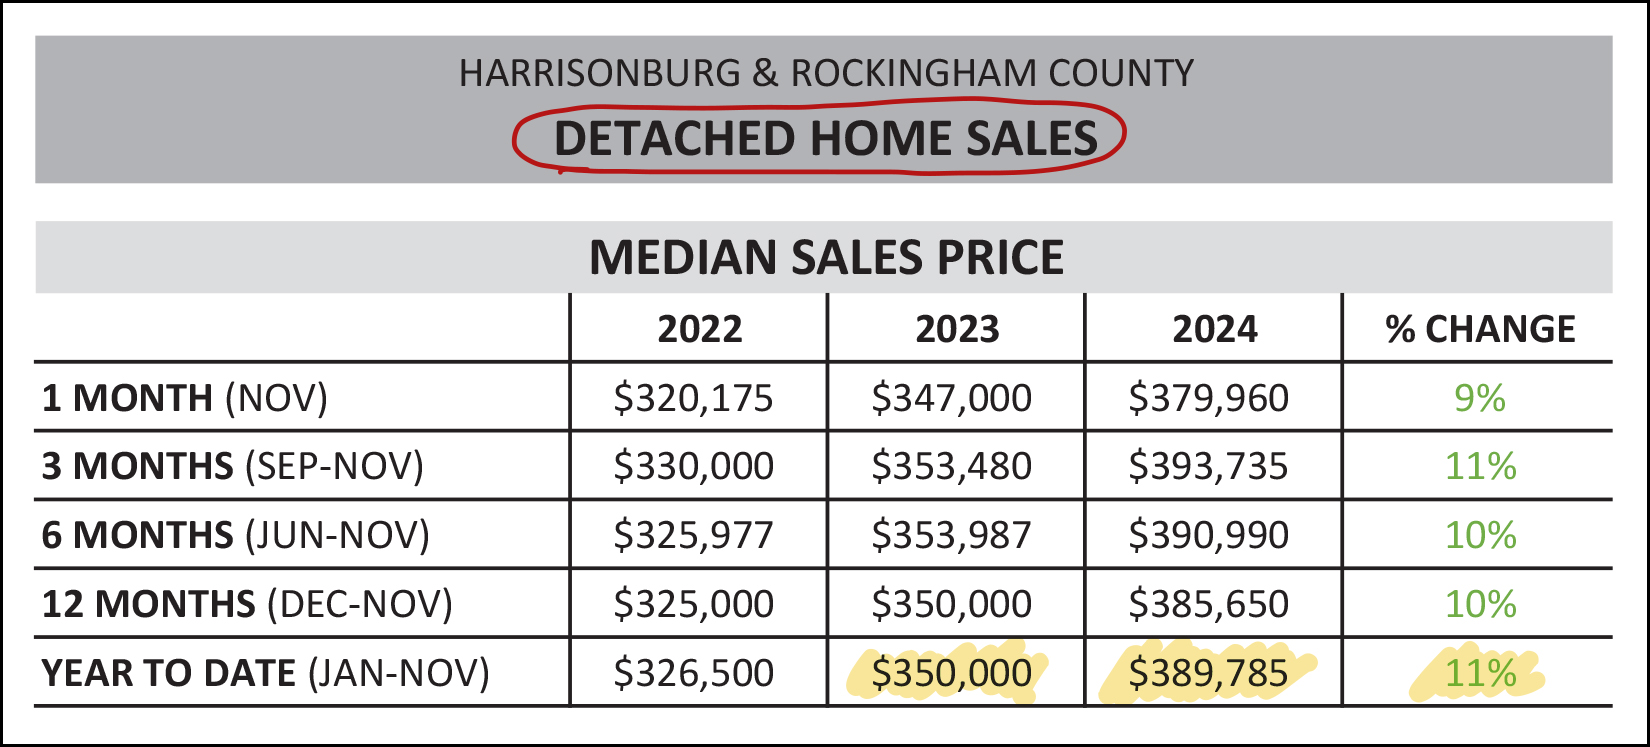 The main metric I have highlighted above is the median sales price in 2024 compared to 2023. A year ago the median sales prices of detached homes was $350,000... and we are now quickly approaching a median sales price of $400,000 in Harrisonburg and Rockingham County! This marks an 11% increase in the median sales price in the course of a year. Meanwhile, in the "attached homes" market -- which mainly includes townhouses but also duplexes and condos... 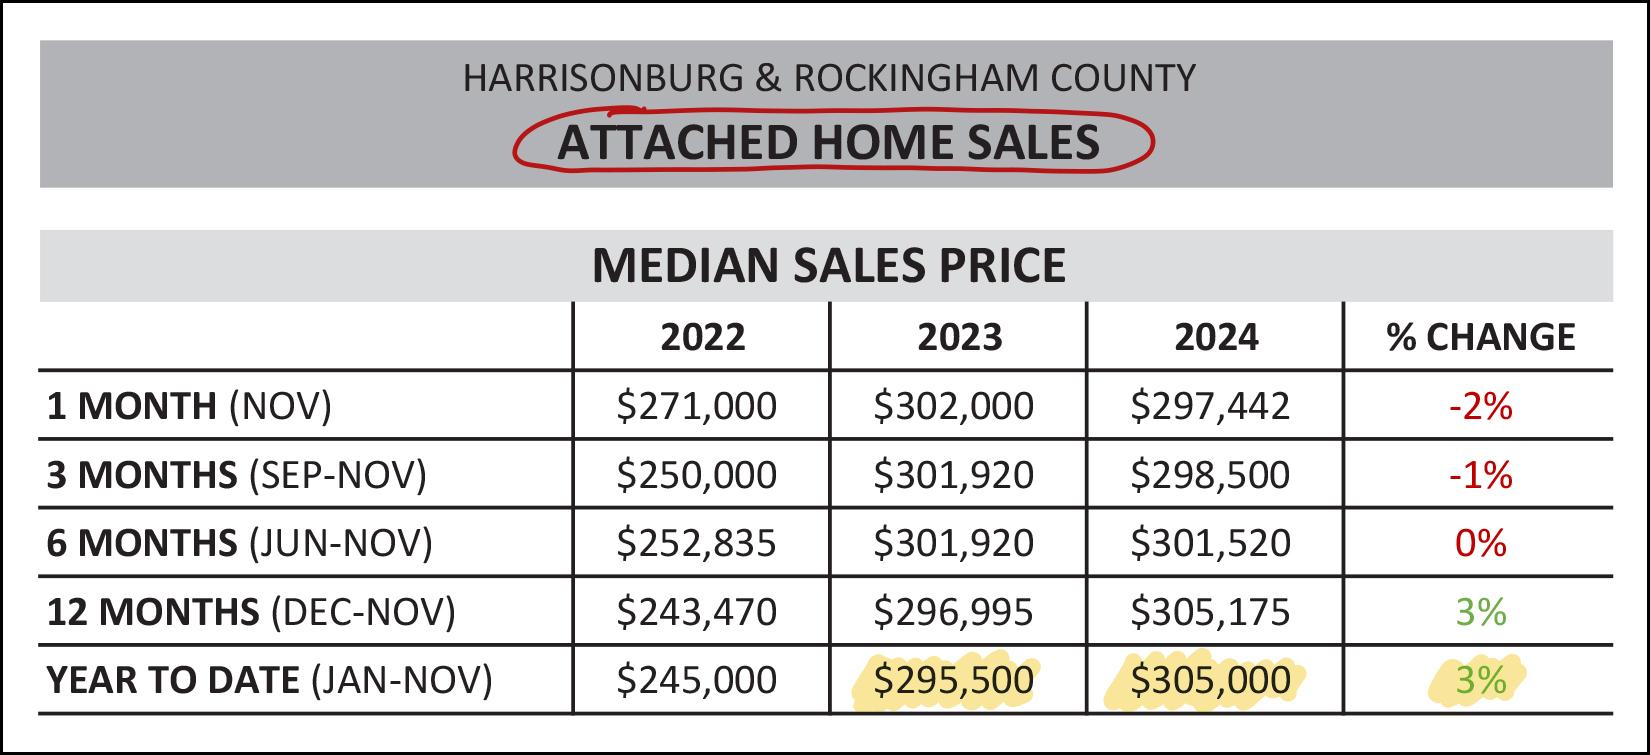 The median sales price is not climbing quite as quickly for townhouses, duplexes and condos... but that median sales price has eclipsed $300,000 for the first time in 2024. We can also learn a bit more about the nuances of the local real estate market but breaking things down between the City of Harrisonburg and Rockingham County. Here are the numbers for the City... 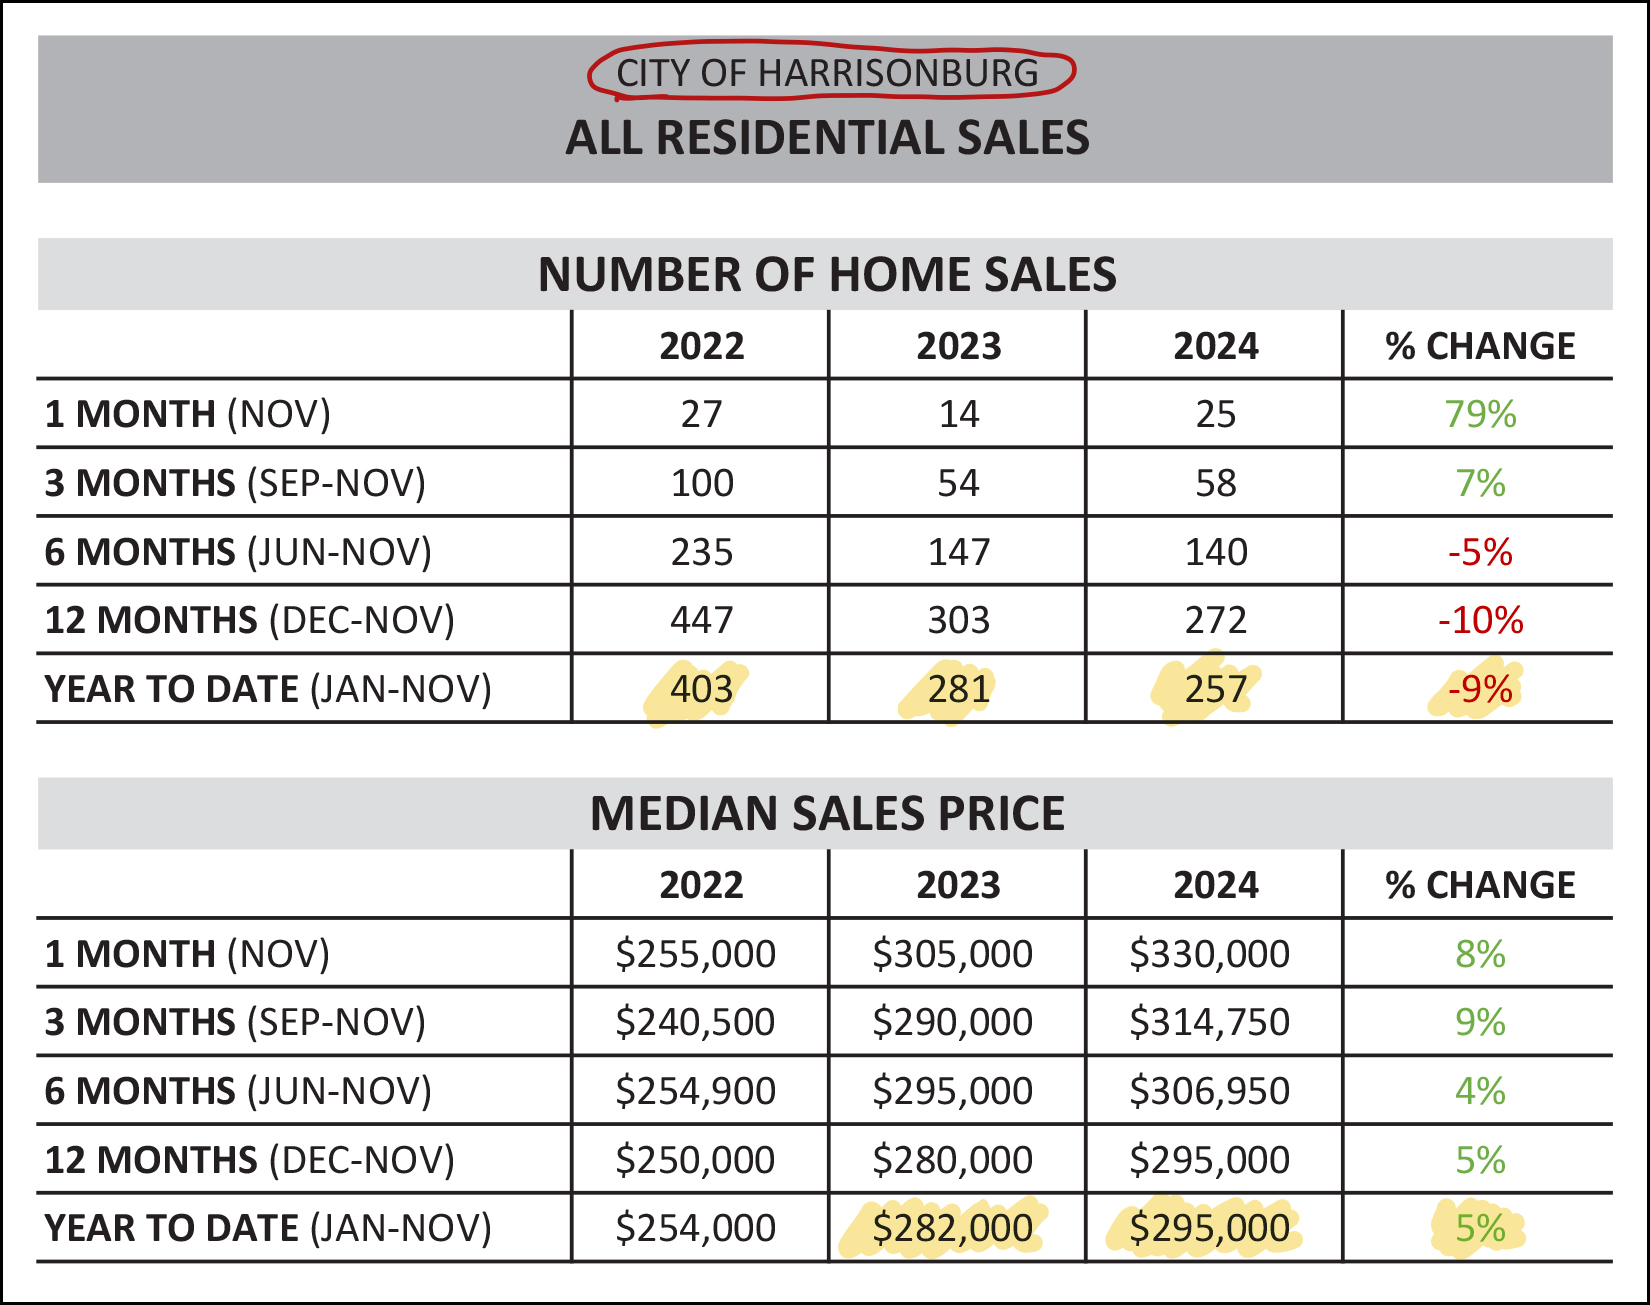 As you will note in the top half of the chart above... we have seen 9% fewer home sales in the City of Harrisonburg this year compared to last year... but as shown in the bottom half of the chart above... the median sales price has risen 5% to $295,000. Let's compare these figures to Rockingham County... you'll find they are quite a bit different... 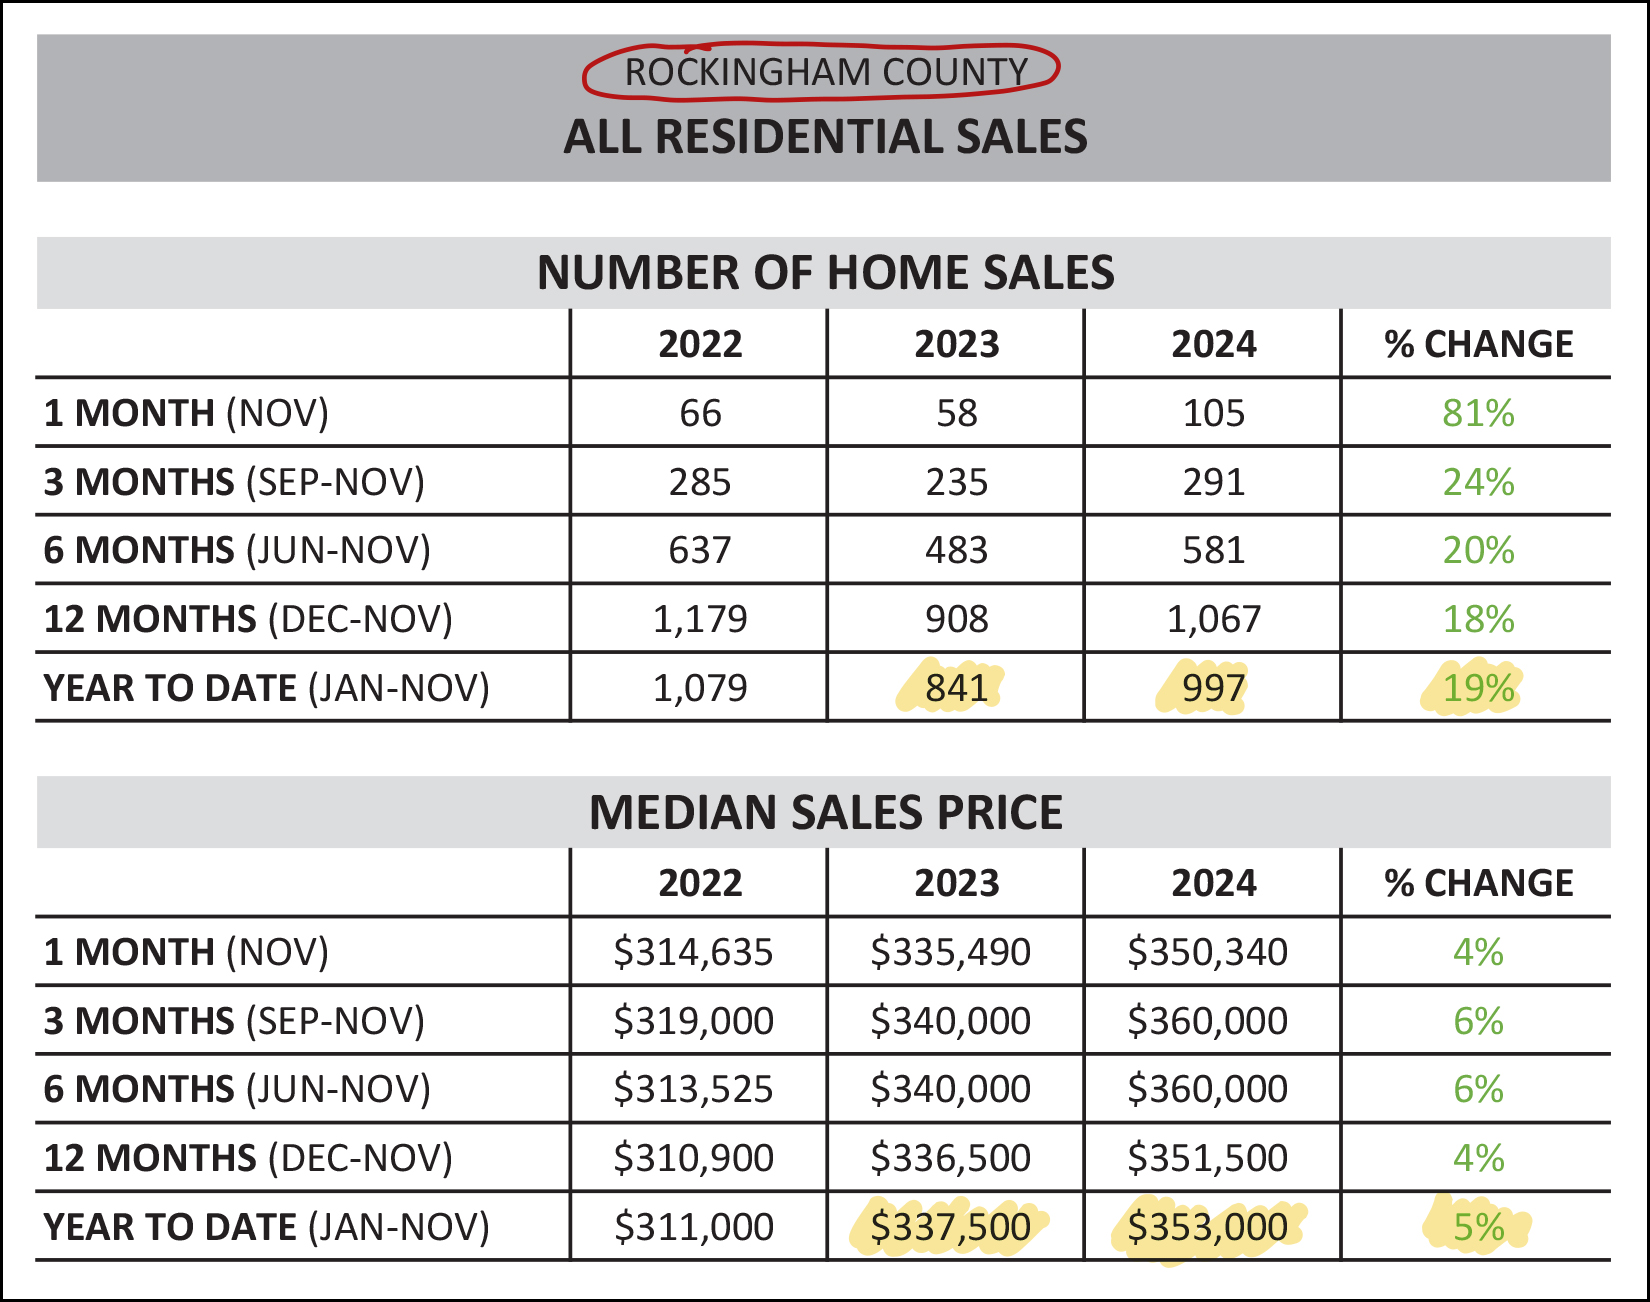 In contrast to the 9% decline in the number of City sales... we're seeing a 19% increase in the number of County sales -- though the median sales price in the County has increased by 5% over the past year, just as the City price has increased by 5%. Slicing and dicing the data one more time, let's look at new home sales compared to existing (resale) home sales. First up, new home sales... 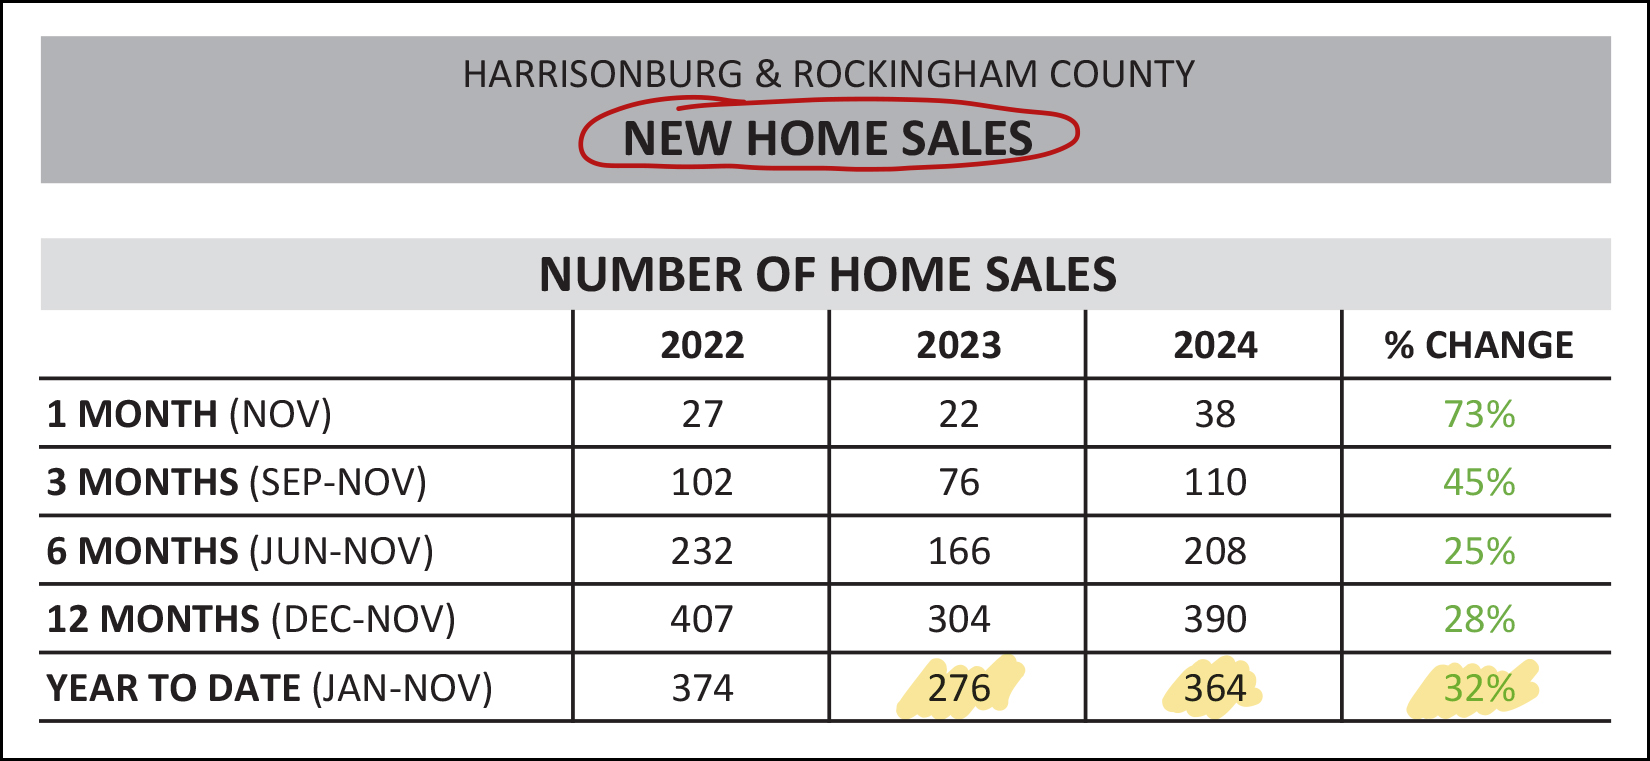 My oh my how the new homes are being built, and are selling. We have seen a 32% increase in the number of new homes that have sold in Harrisonburg and Rockingham Count this year (364) compared to last year (276) though - interestingly - we're right back to about the level (374) where we were two years ago. The existence of newly built homes in our community continues to be a significant factor in our overall housing market. And the existing home sales... did they increase by 32% Nope... 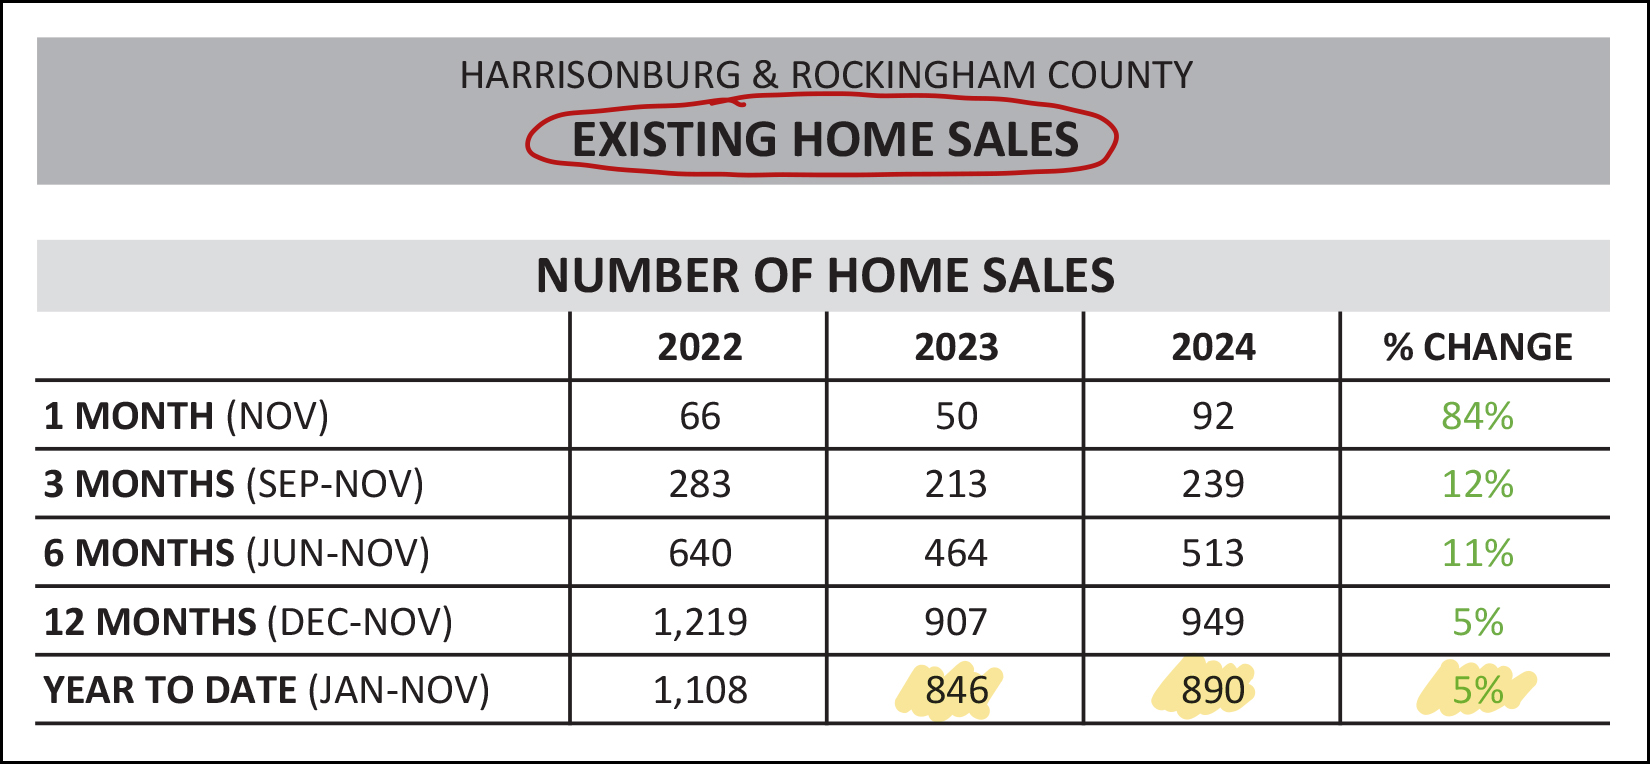 We are seeing an increase in existing home sales (+5%) this year... but nowhere near the 32% increase seen in new homes. This is not too surprising, as many homeowners simply do not want to sell their homes right now given the super low mortgage interest rates that many homeowners still have on their current mortgages. Now, then, you made it past the charts... let's see what we can learn from some graphs showing the latest trends in our local market... 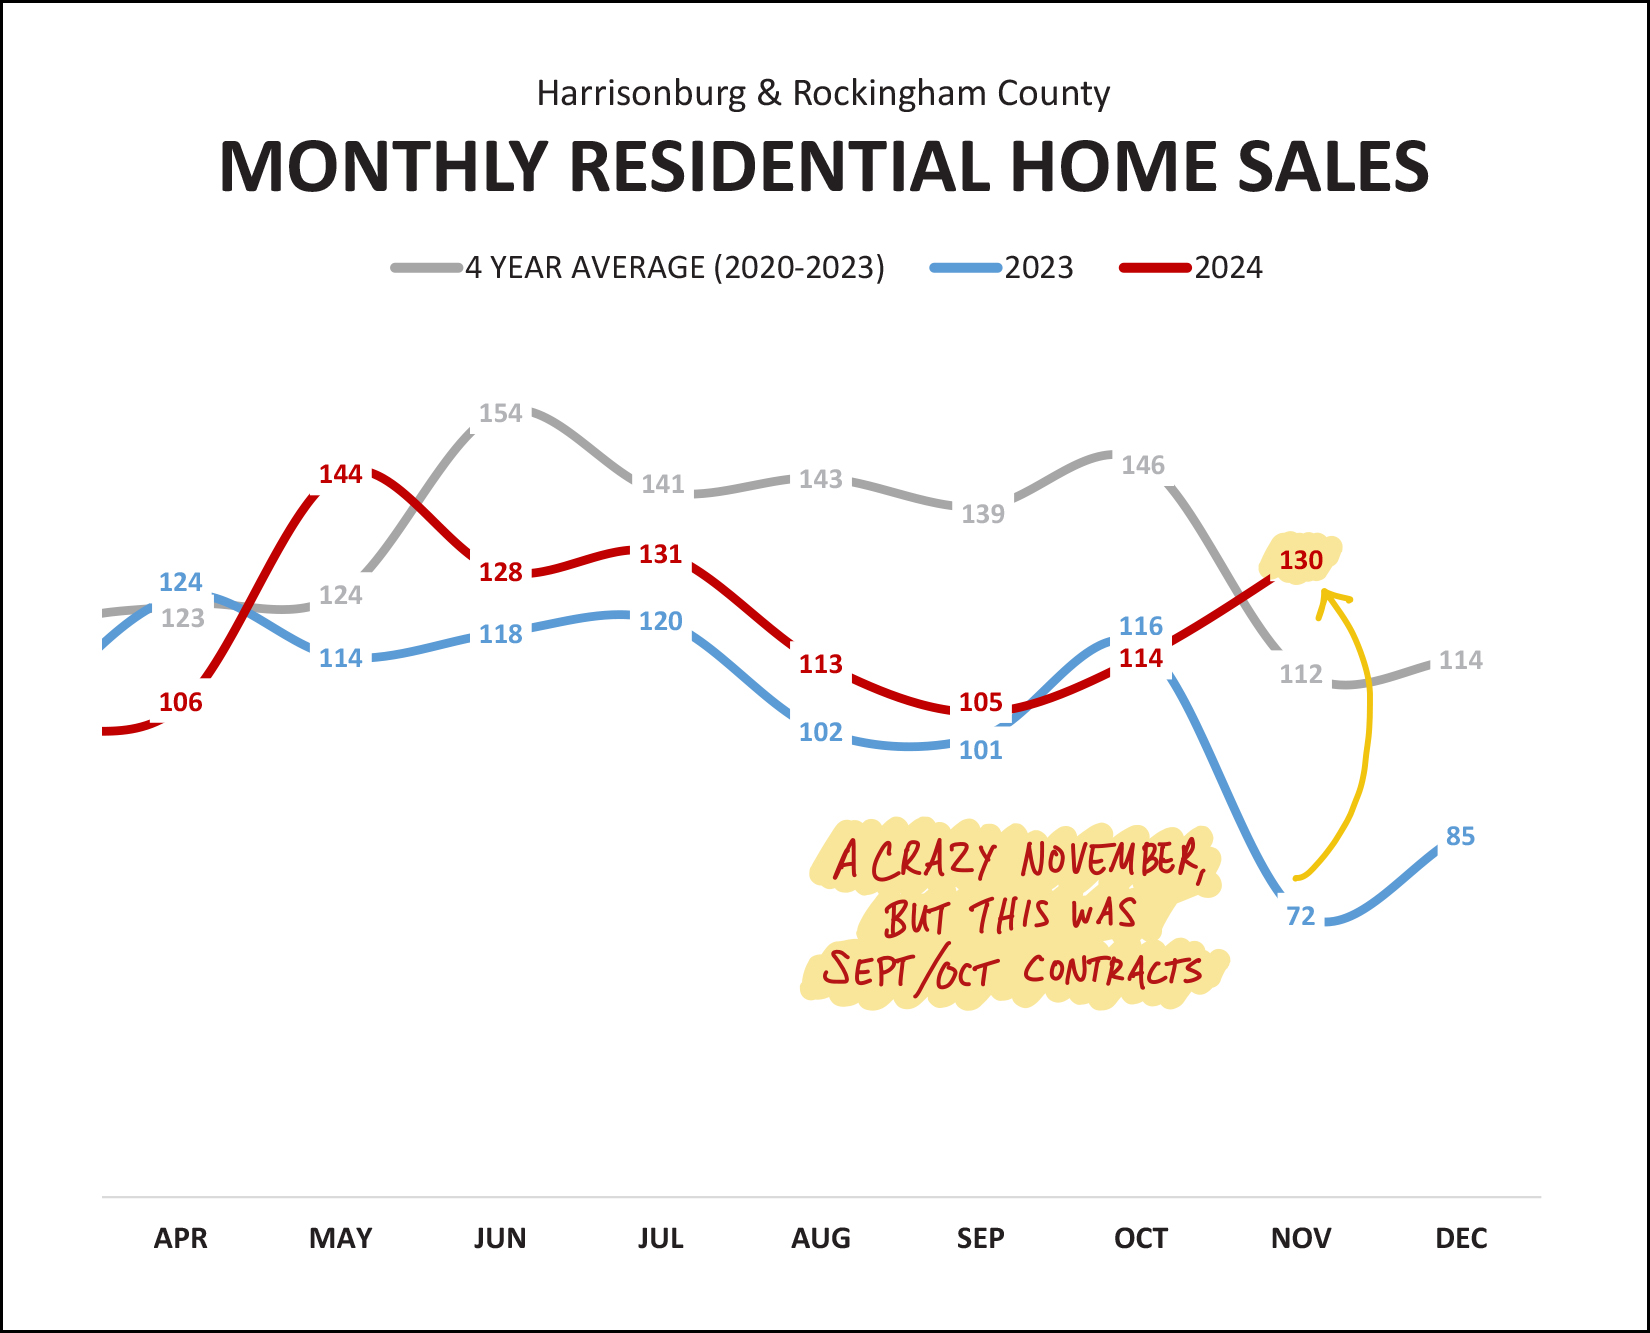 This graph (above) paints the picture more clearly than the chart of data earlier on -- the 130 home sales in November 2024 was unexpectedly high -- way higher than last November (72 sales) and also well above the average (112) of 2020 through 2023. But, remember, this high number of closed sales in November 2024 would have been the result of buyers (and sellers) signing contracts in September or October... since it takes some time to get from contract to closing. Thus, we'll look ahead a bit further on in this report to see what contract activity took place in November 2024 to better predict home sales activity in December 2024. But first, how is 2024 stacking up compared to prior years? 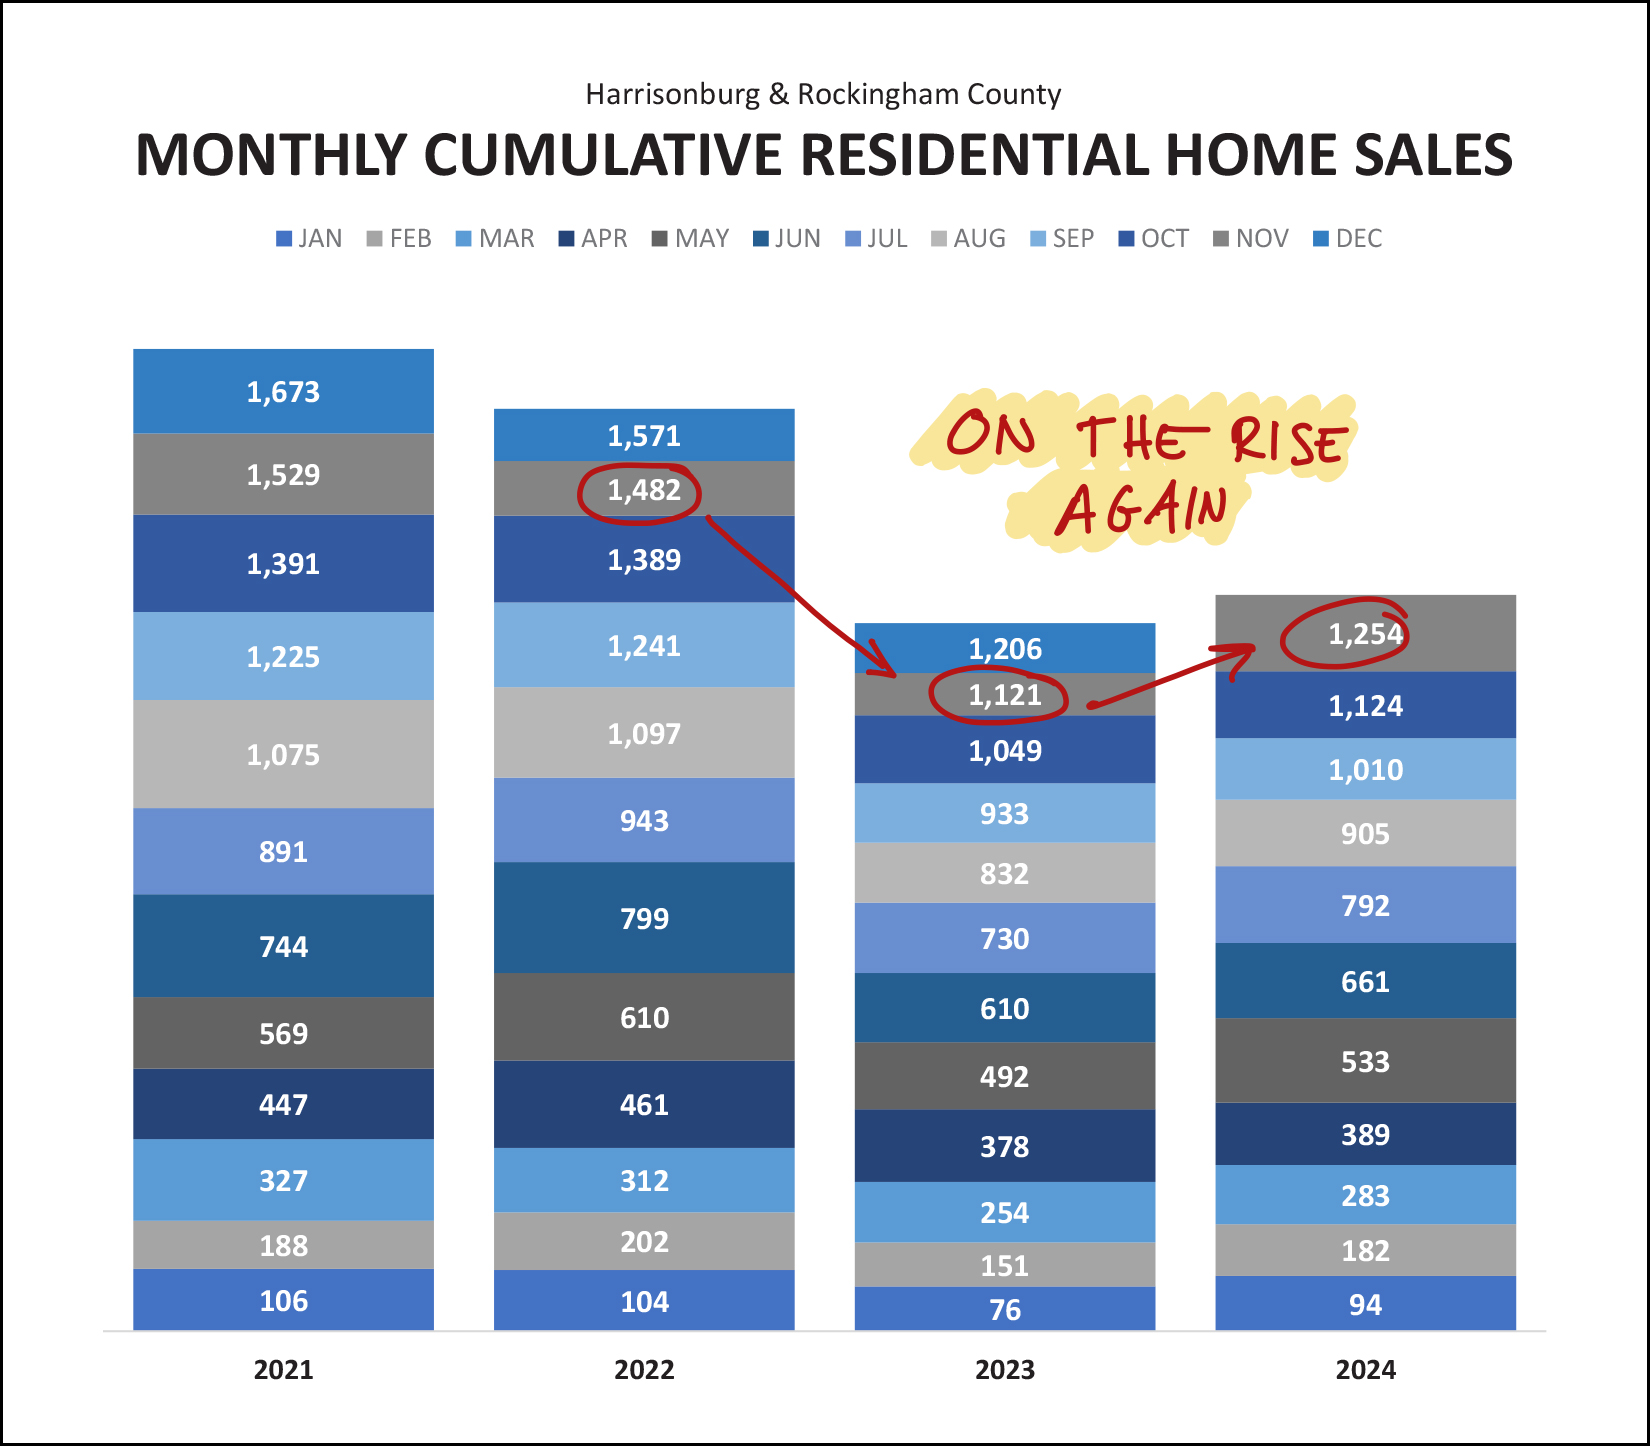 Home sales are on the rise again! After declining in 2022 and 2023, we are now seeing an increase in the number of home sales taking place in Harrisonburg and Rockingham County. The 1,254 home sales seen in the first 11 months of 2024 puts us 12% ahead of last year. Visualized differently, here's how the trajectory of home sales and home prices have changed over the past year... 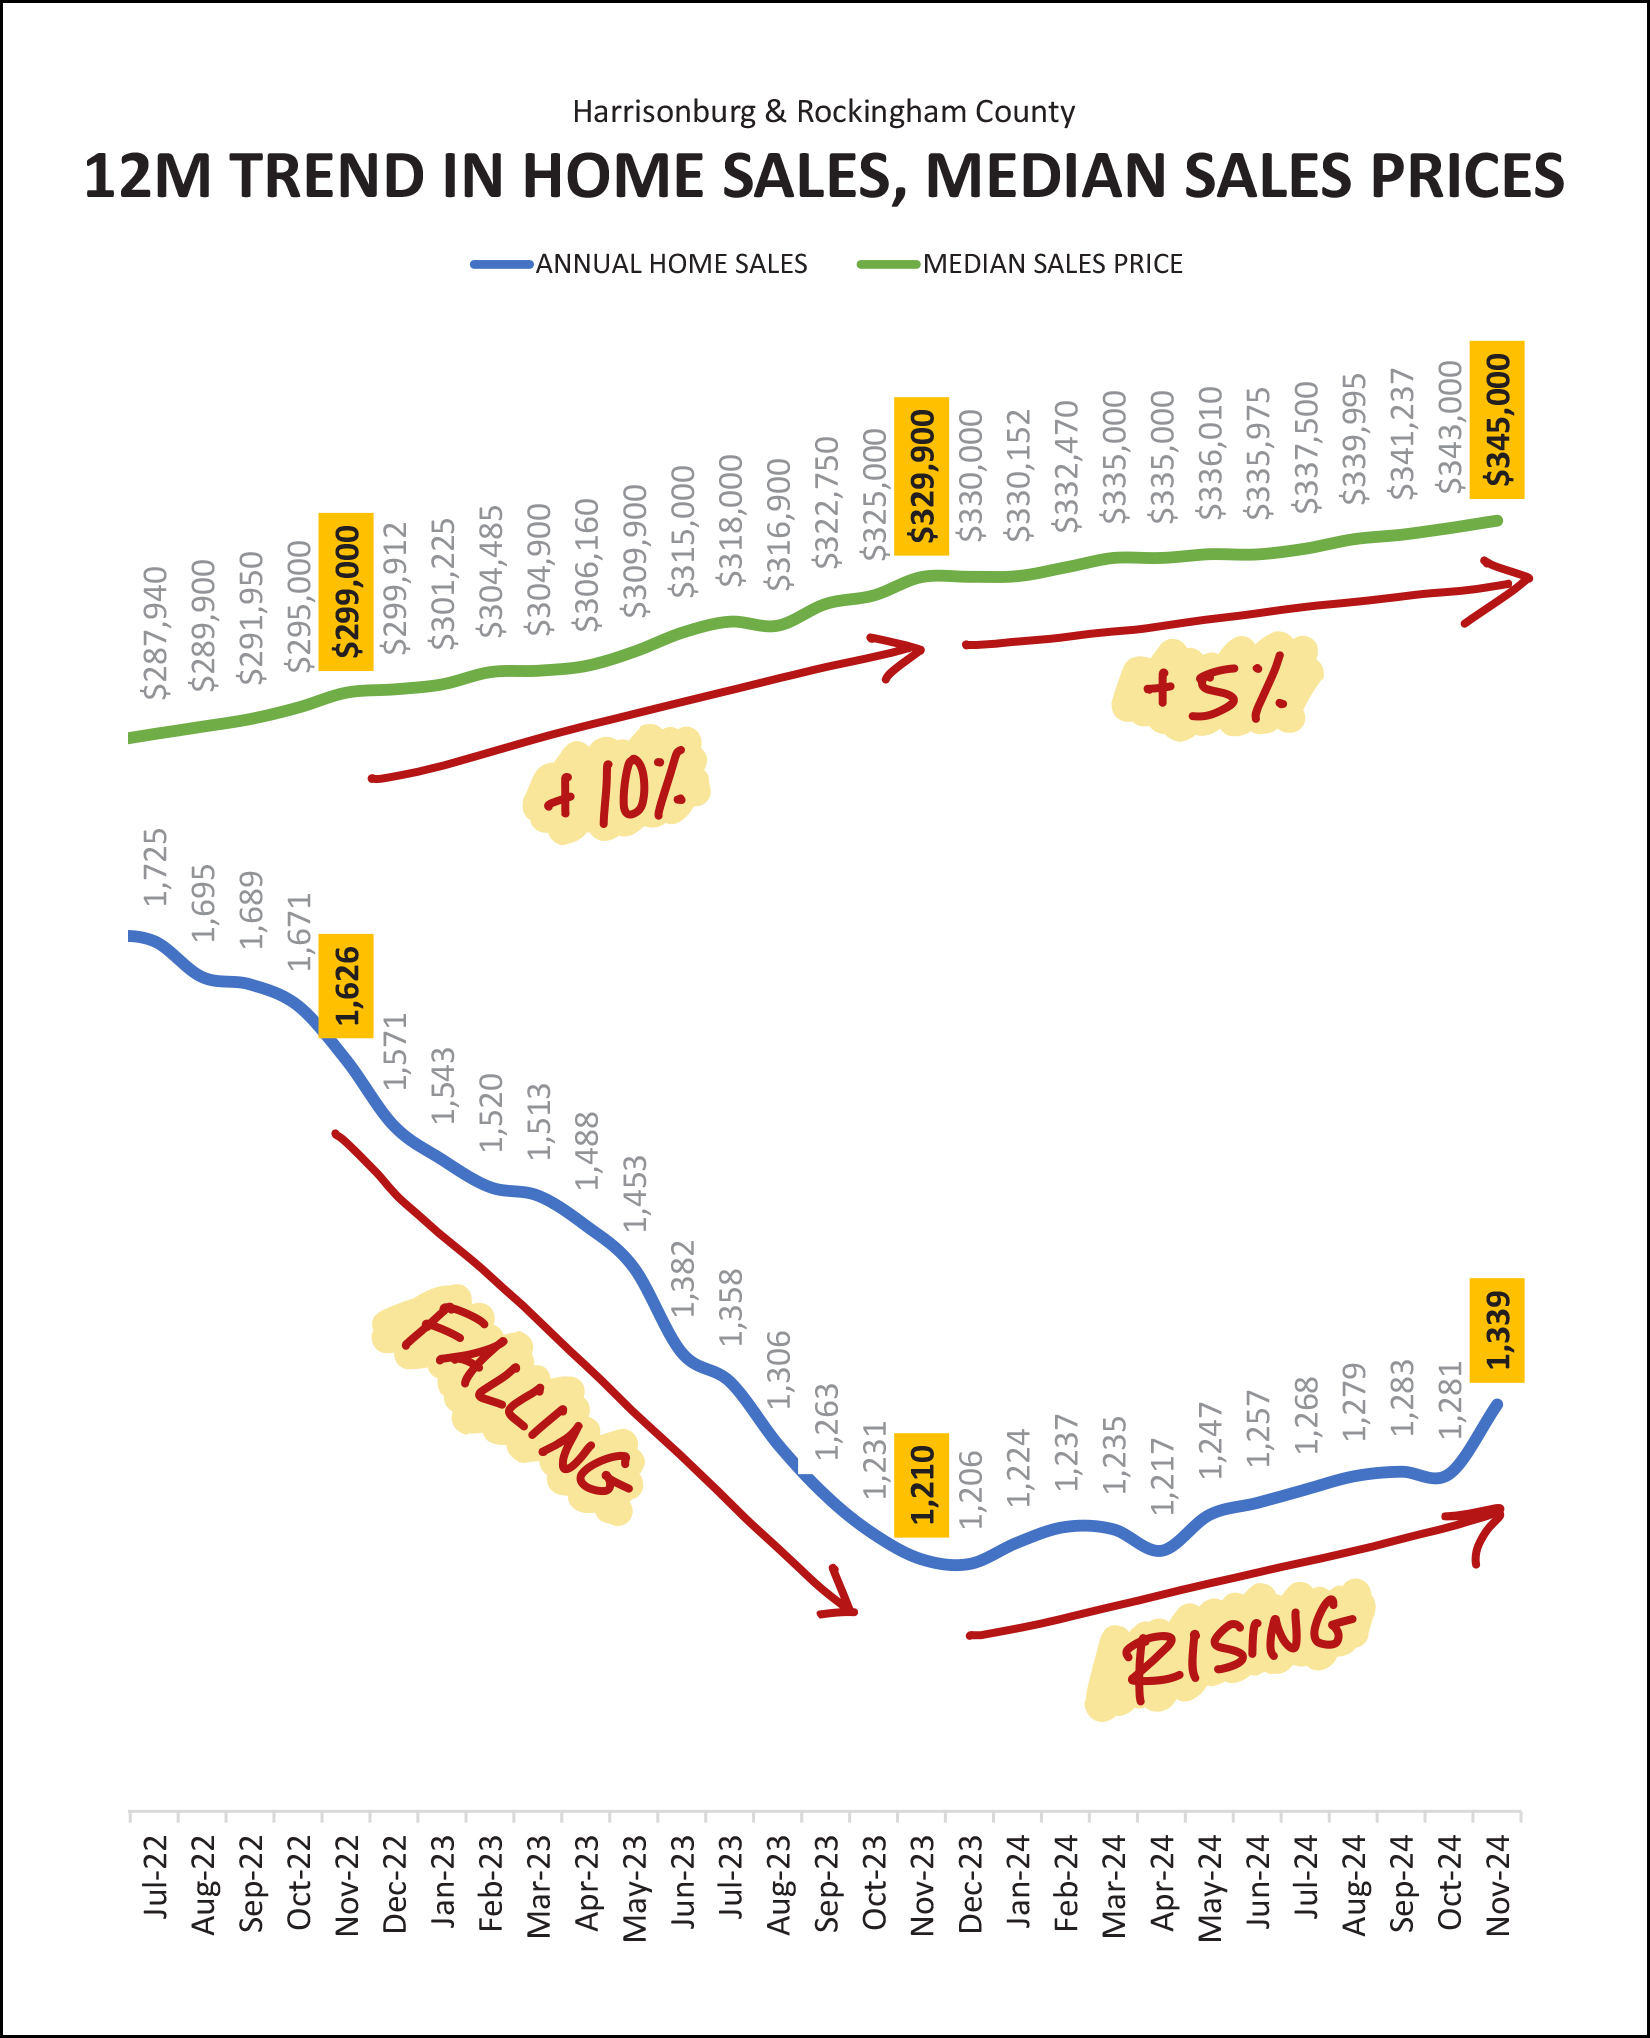 After multiple years of 10% annual increases in the median sales price (only one year of that type of increase is pictured above) we are now seeing a more modest 5% increase in the median sales price over the past year in Harrisonburg and Rockingham County. I think this is more likely to be what we see moving forward as well -- a 5% (ish) increase in prices over the course of a year. Meanwhile, the number of homes selling has certainly rebounded over the past year... bottoming out around 1,206 annual home sales a year ago, and now back up to 1,339 annual home sales. How does the current number of home sales compare to some past years, particularly pre-Covid? Let's take a look... 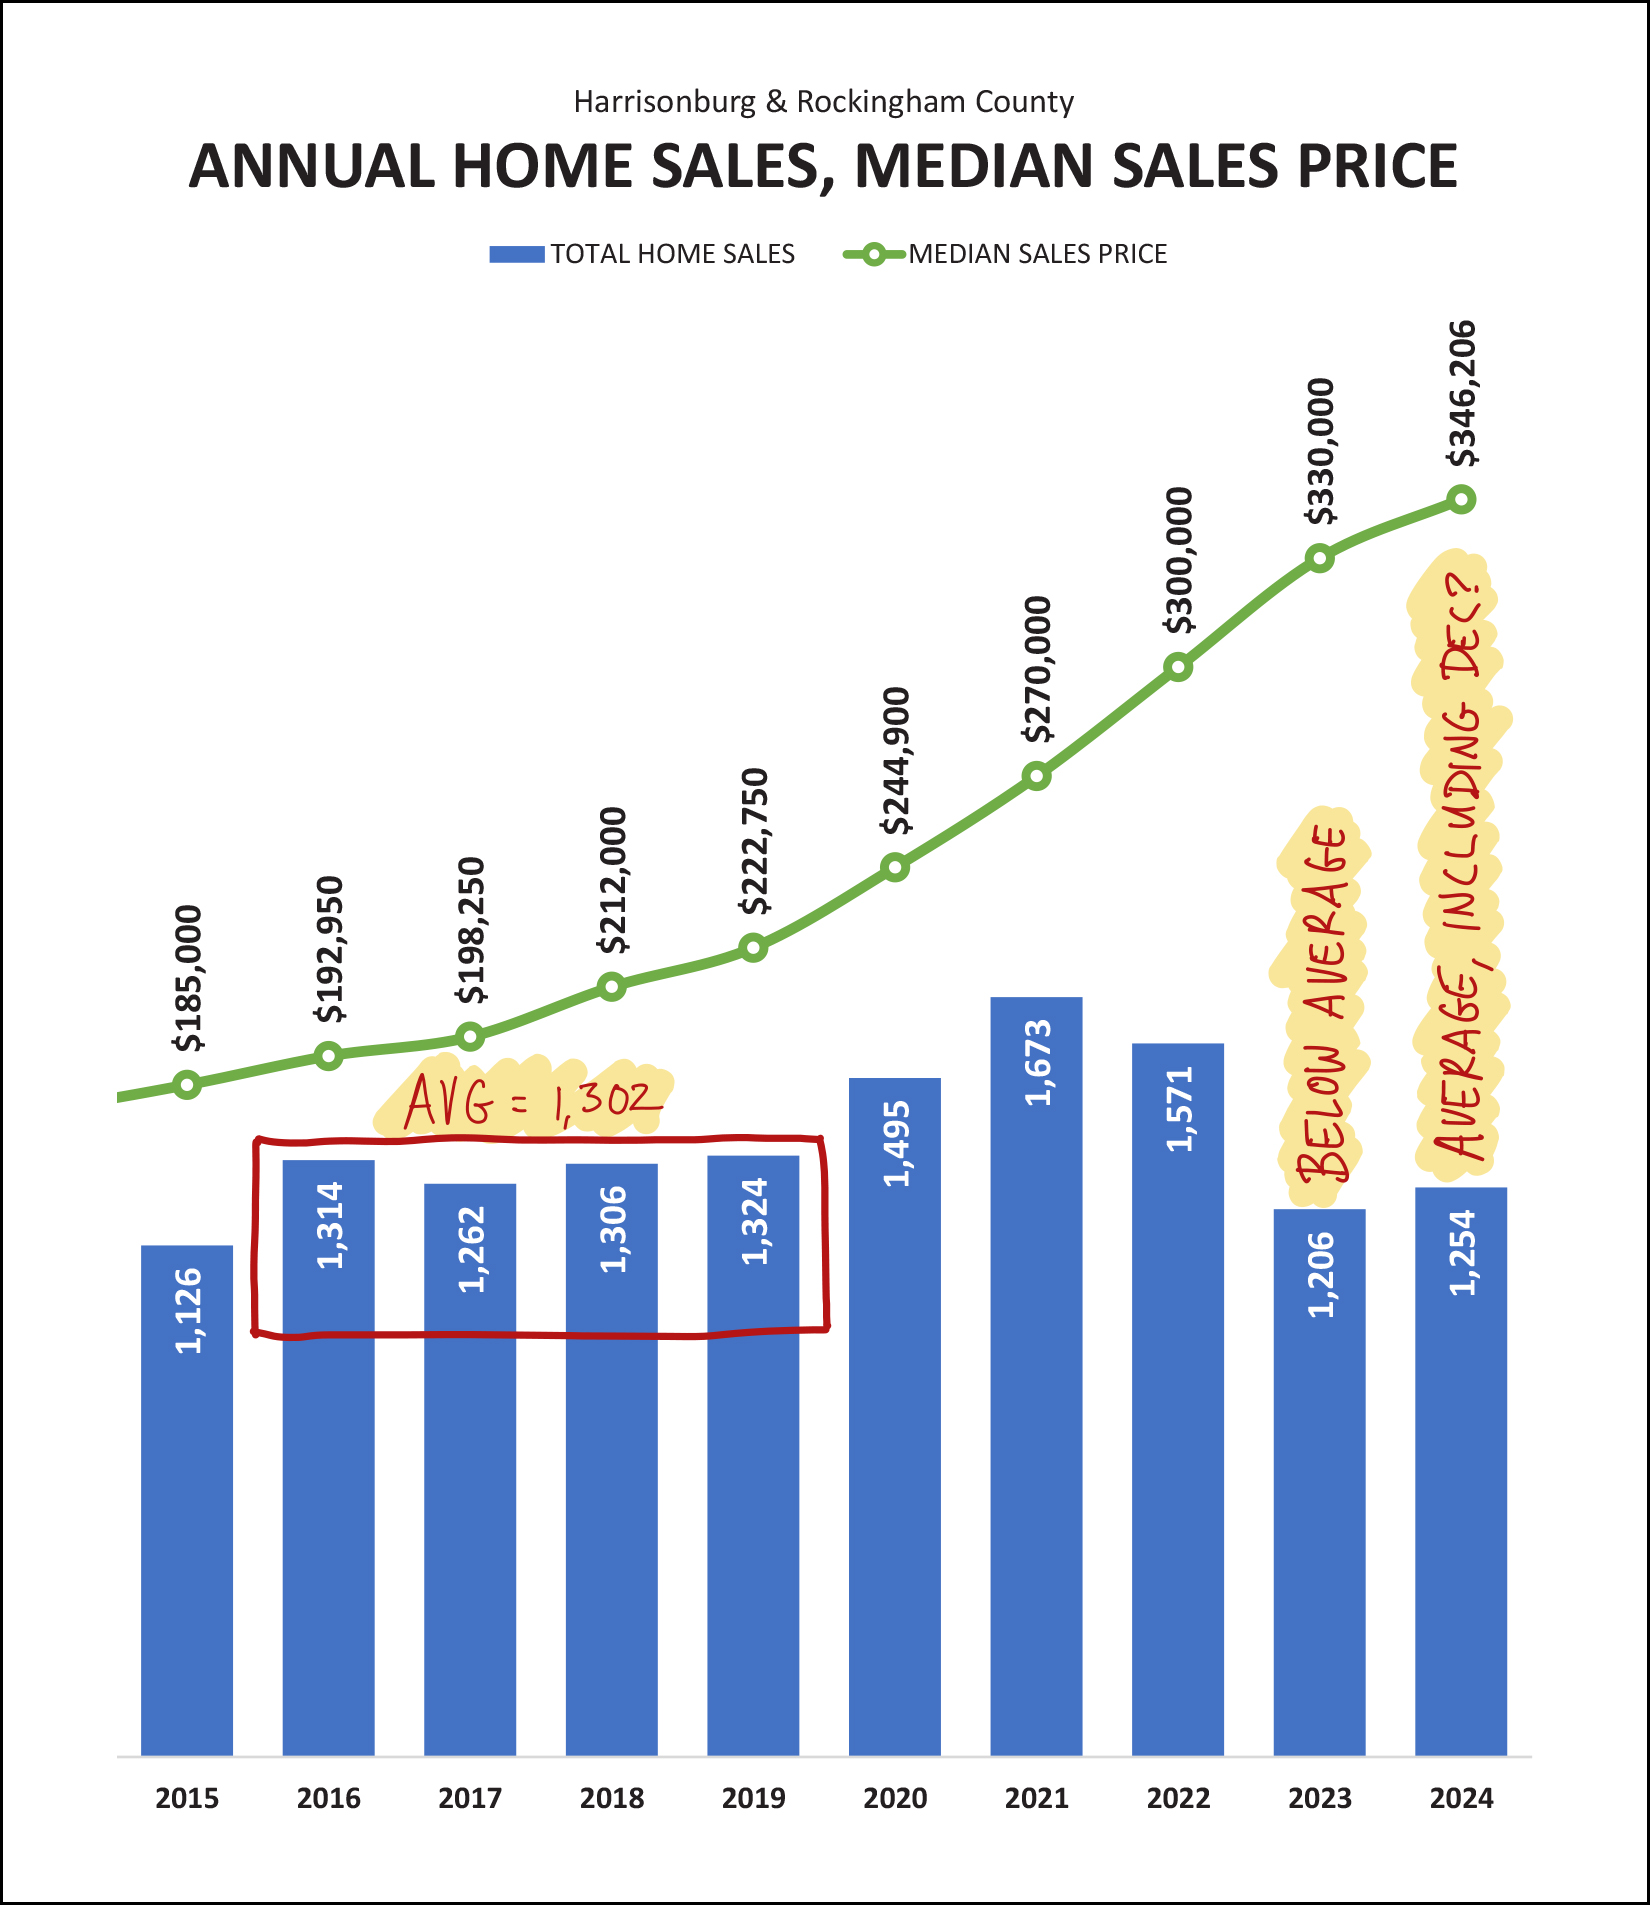 Looking back to the pre-Covid days (2016-2019) we were seeing an average of about 1,300 home sales per year in Harrisonburg and Rockingham County. Then, Covid. During the pandemic and it's aftermath, which included super (super) low mortgage interest rates -- we saw the annual pace of home sales quickly climb above 1,400 then 1,500 then 1,600 to then crest at 1,673 in 2021. But then, as mortgage interest rates rose (and home prices rose) the number of home sales fell rather quickly - back down to 1,206 in 2023. This year, however, with 1,254 home sales in the first 11 months, it seems likely we will get back to that 1,300-ish level by December 31. So, maybe we are now back to the 1,300 home sales a year range, after having been quite far above it, and then a good bit below it. Stay tuned in 2025 to see how this plays out. Now, about that contract activity... 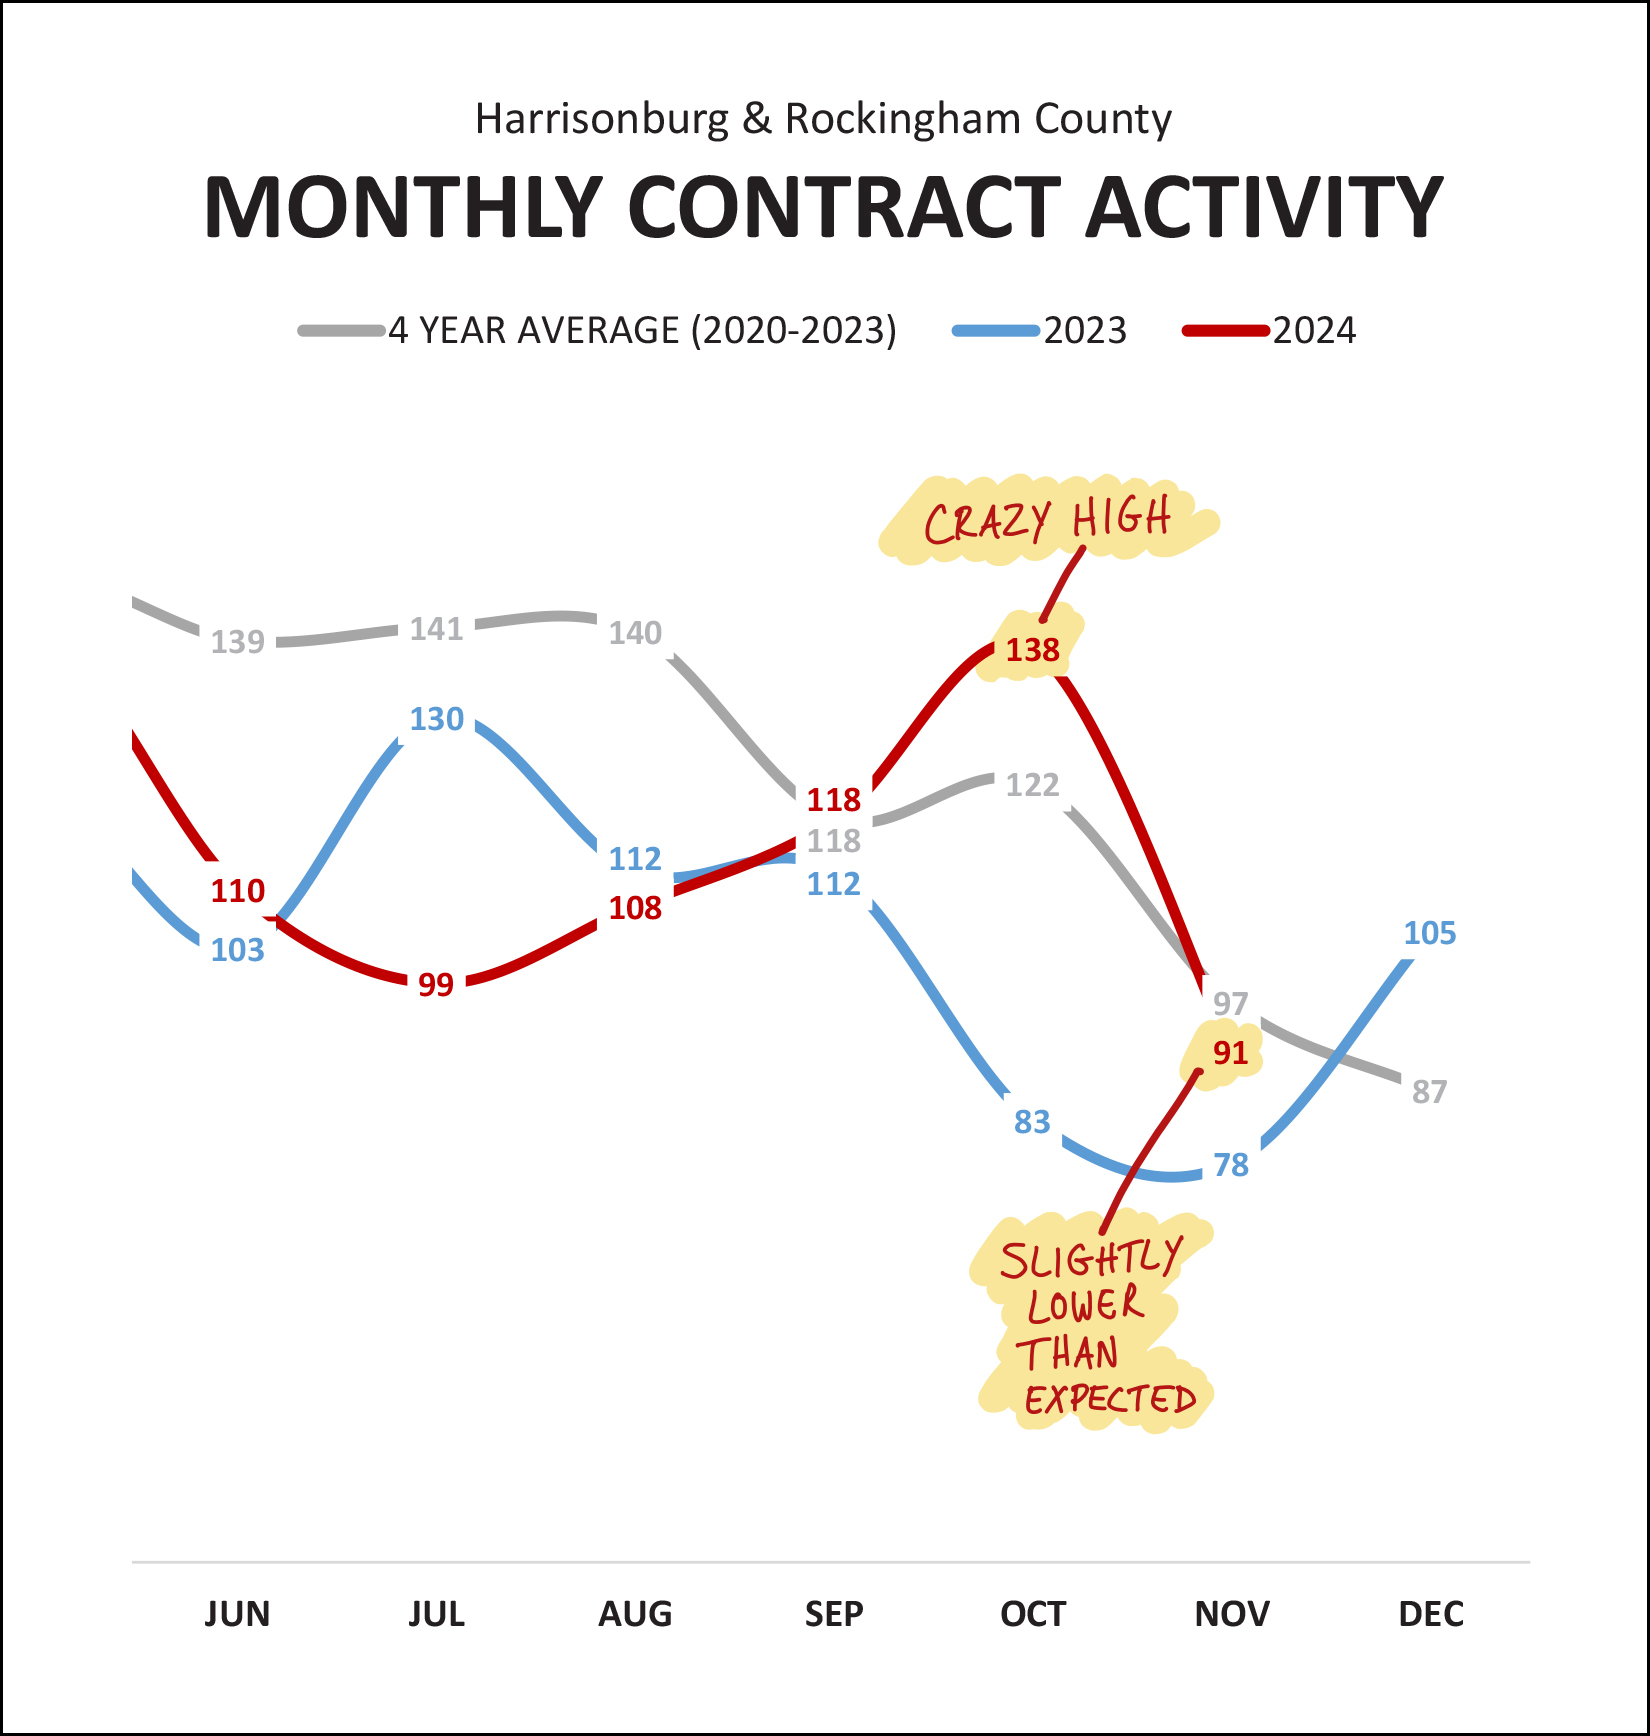 You can see it clearly here (above) that a crazy high number of contracts in October 2024 was what lead to the crazy high number of closed home sales in November 2024. So what shall we expect over the next few months? The 91 contracts signed in November 2024 was a normal-ish number of contracts for a November -- it was higher than the 78 we saw last year, but slightly lower than the 2020-2023 average of 97 contracts. Thus, we should likely see around 80 - 95 home sales close in December 2024. With all of those closings in November, are there still quite a few homes under contract right now? Sort of, kind of... 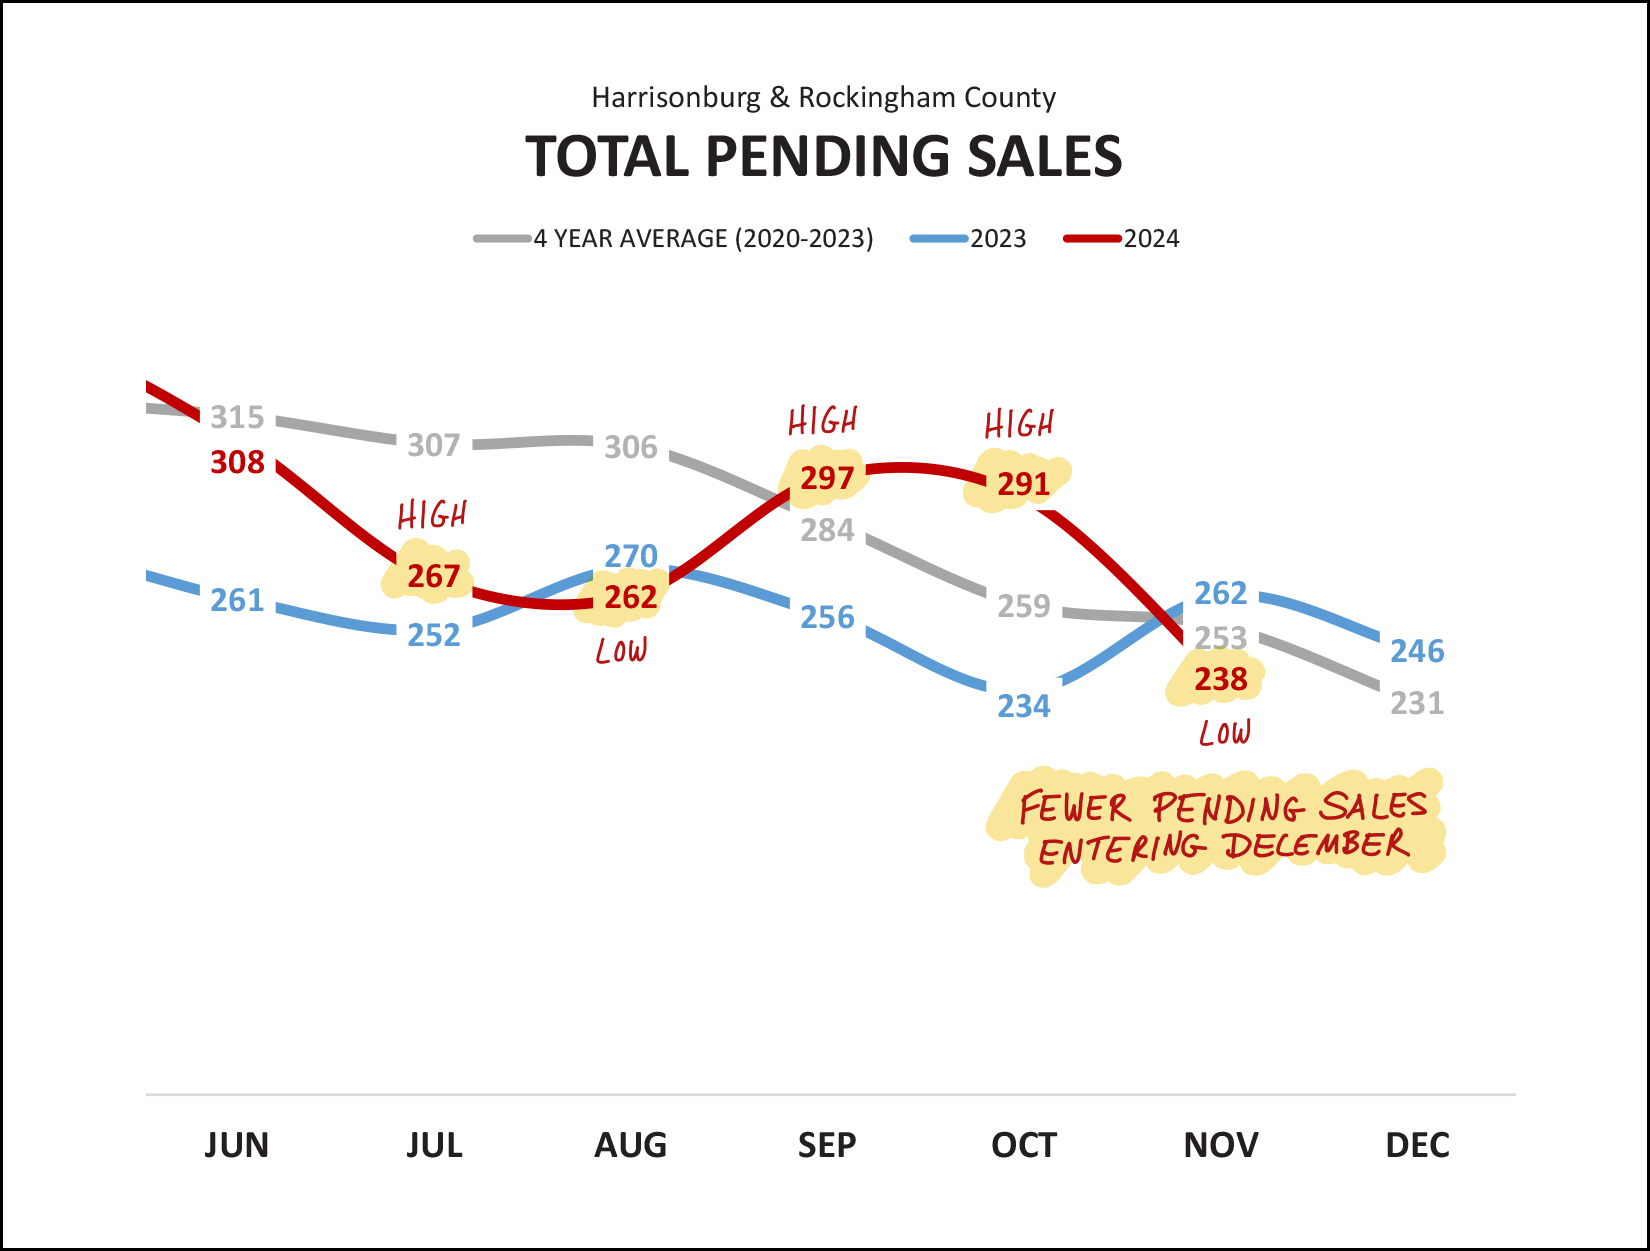 Pending sales were higher than expected at the end of September and end of October... but perhaps unsurprisingly because of all of the closed sales in November... the pending sales count is lower at the end of November than we might have otherwise expected. This is also an indicator that we'll see a bit of a slower month of closed sales in December and likely in January -- though this is somewhat to be expected in these winter months. And inventory levels -- how do they compare to last year? 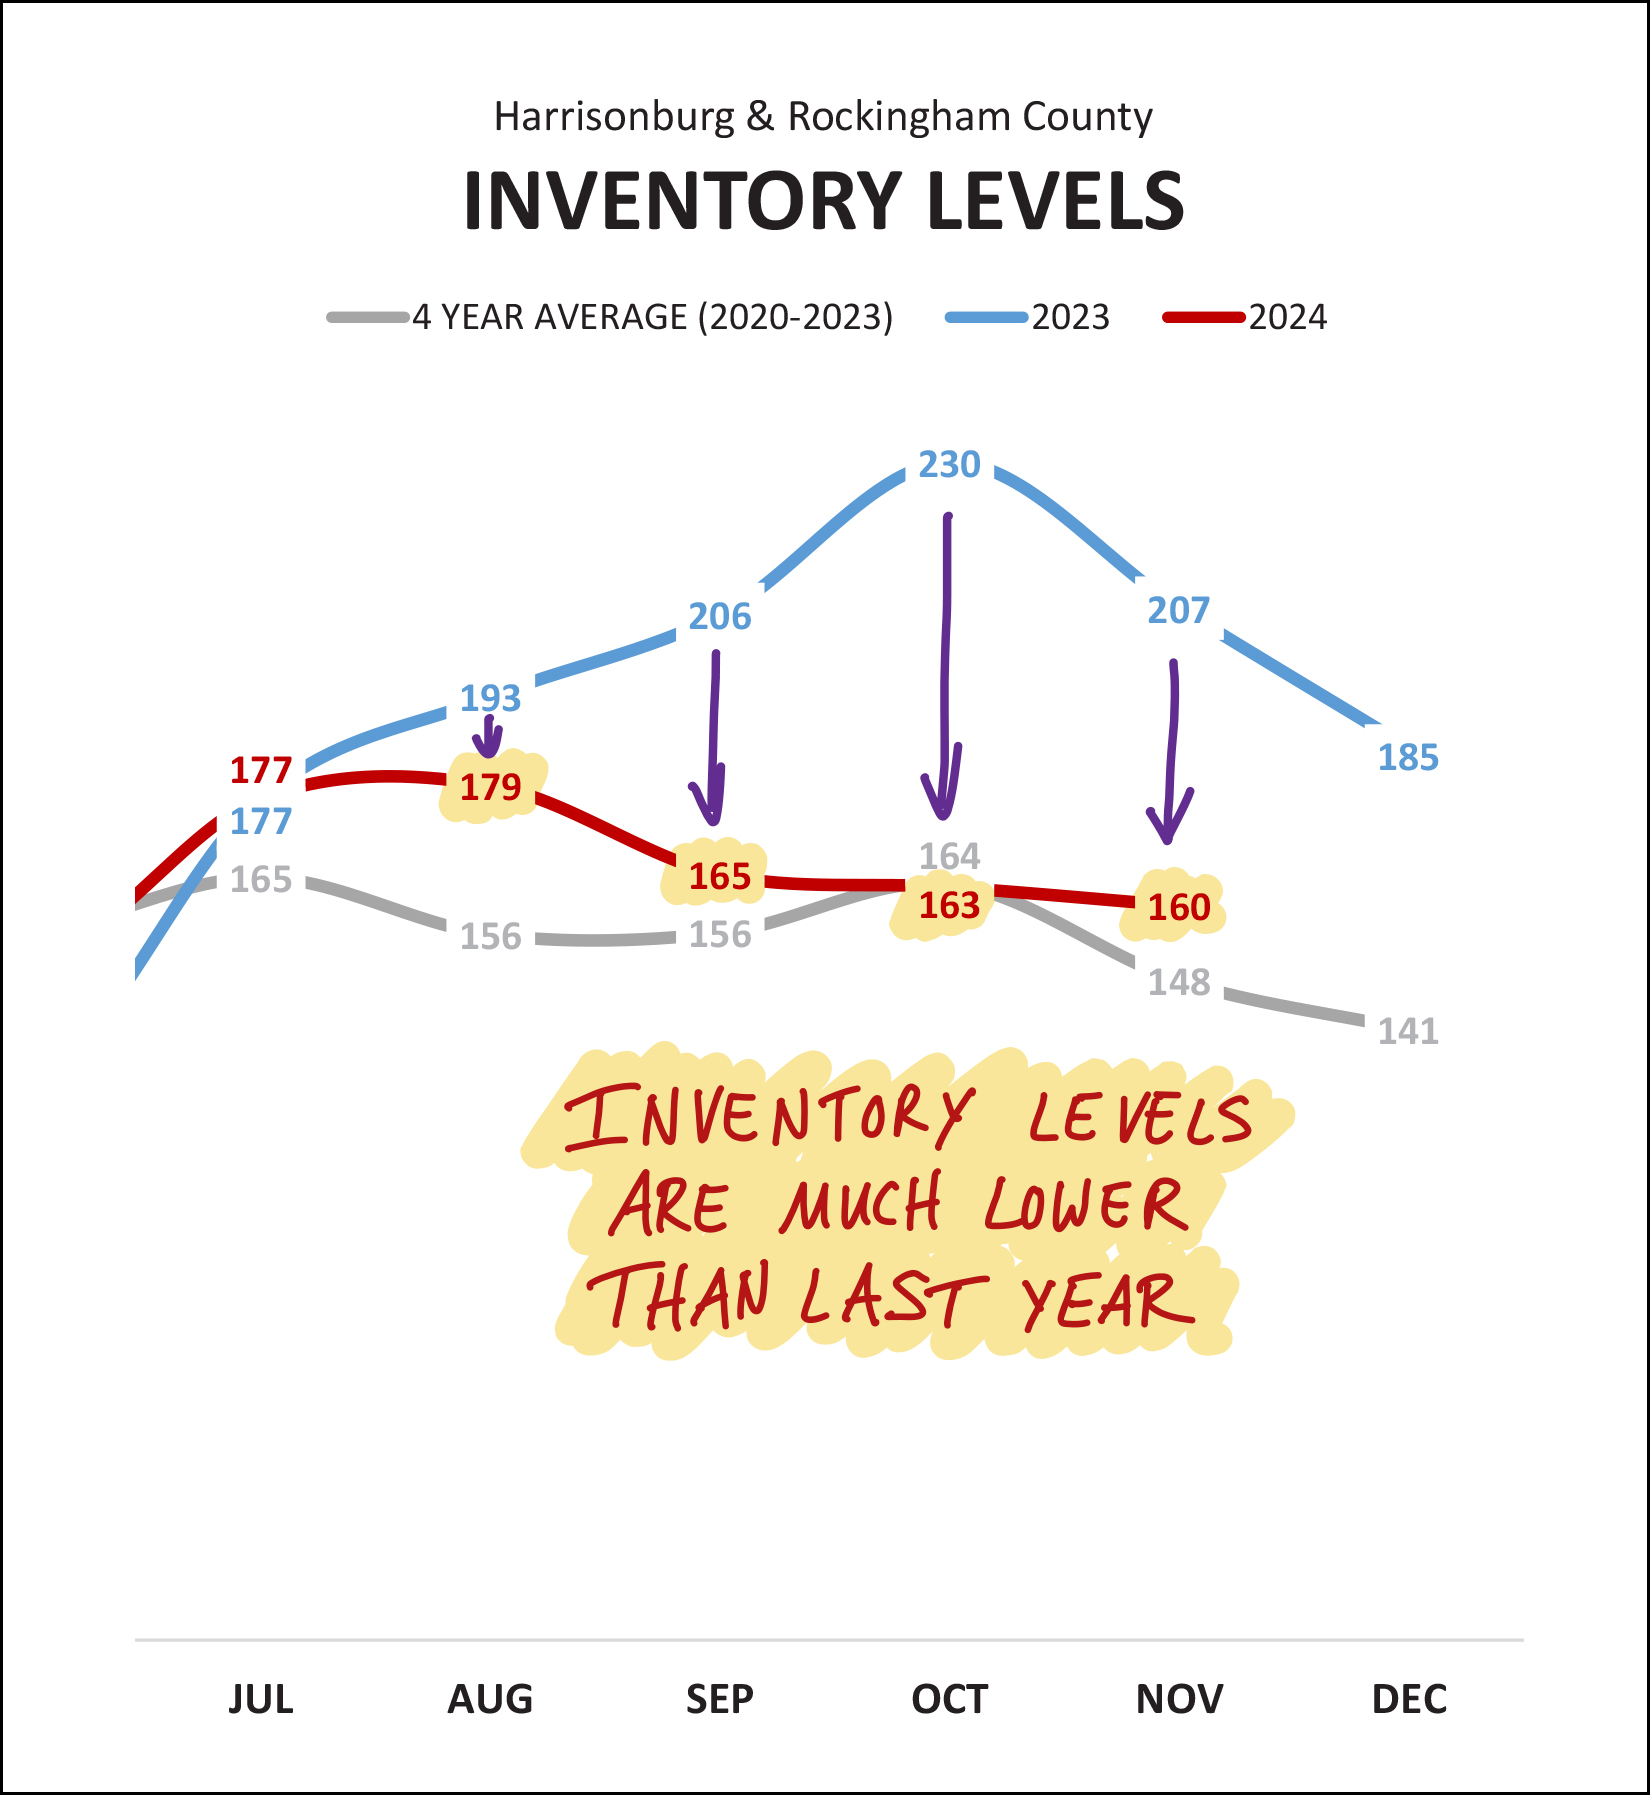 There are significantly fewer homes on the market now as compared to a year ago. Last September through November we saw inventory levels of 206 to 230 homes for sale -- while we are seeing a more consistent 160 to 165 homes for sale during the same timeframe this year. Last year's higher inventory levels were mostly a result of rapidly increasing mortgage interest rates that slowed the market, causing inventory to start building. About those mortgage interest rates... 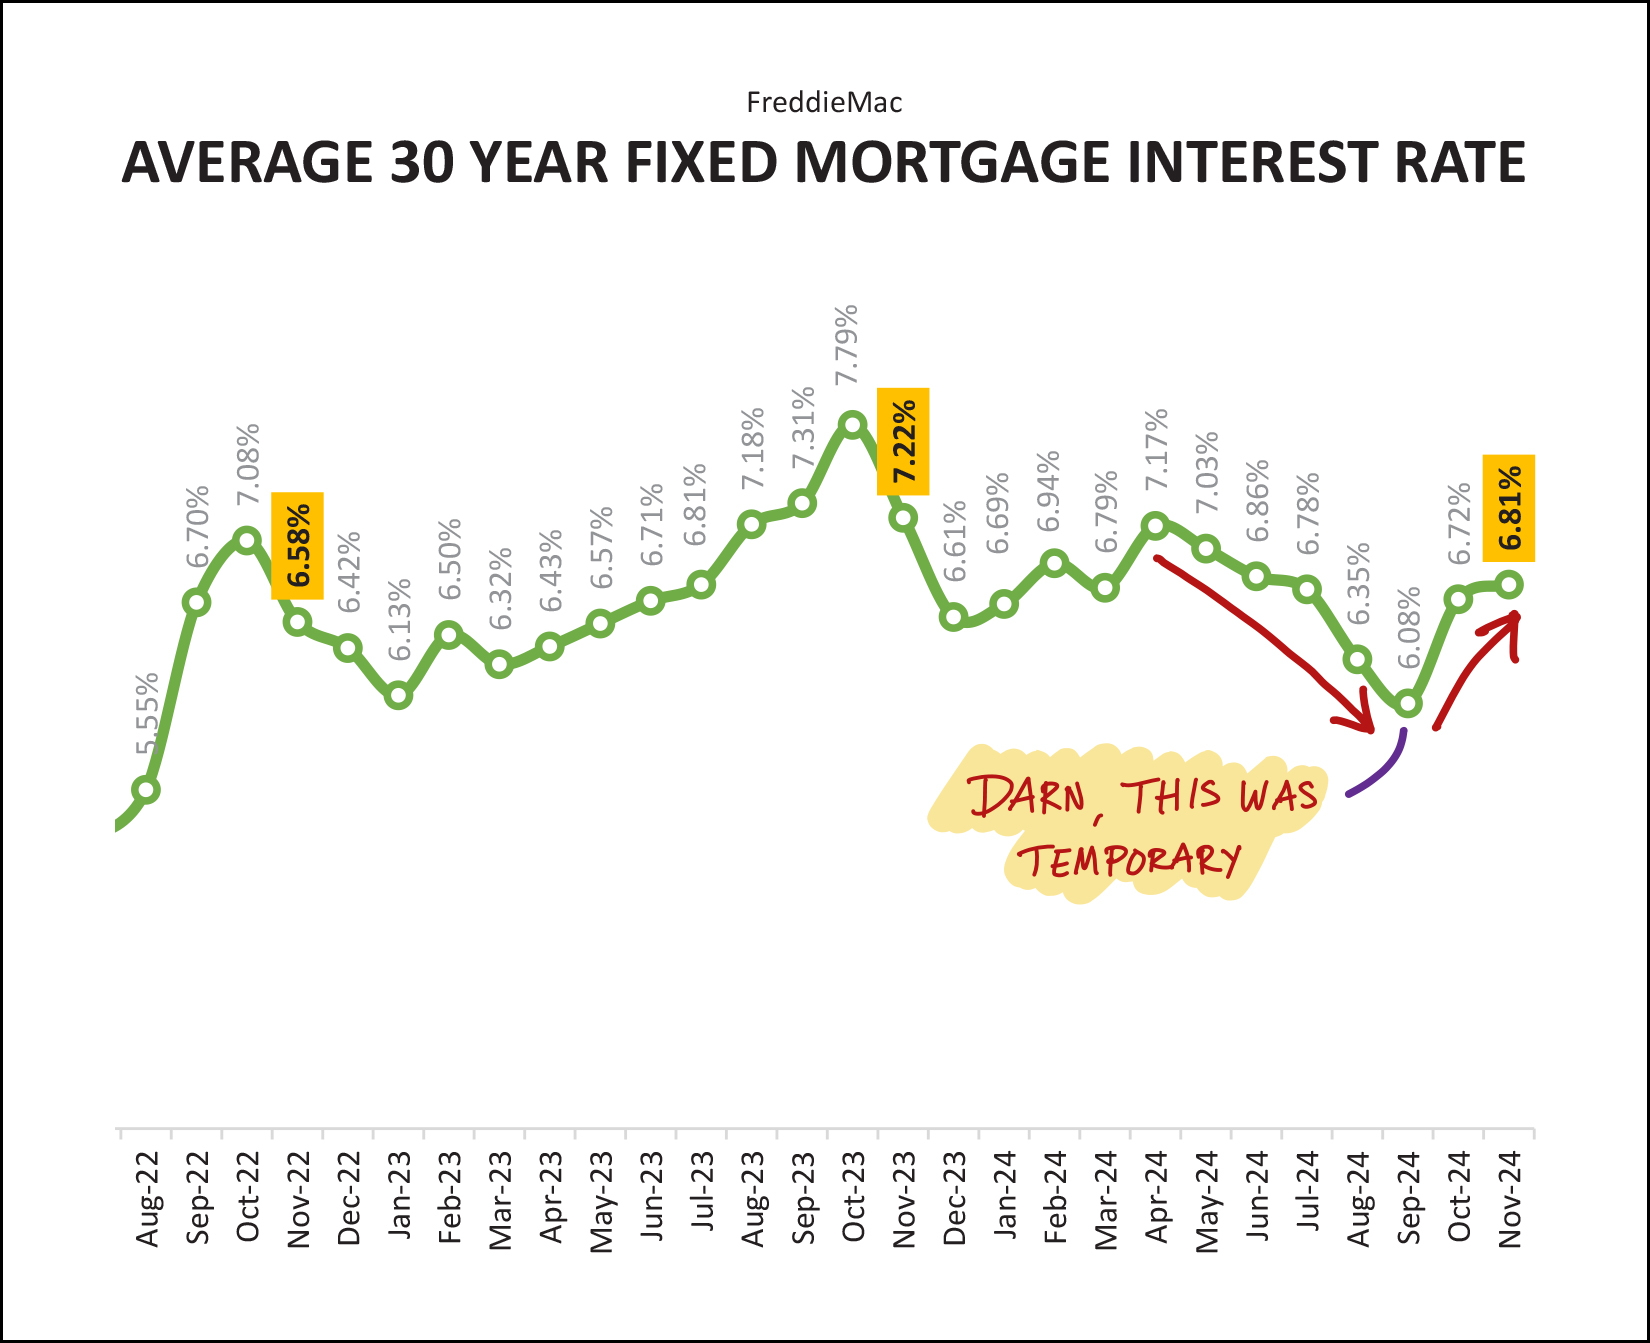 They've been up, they've been down, they've been all around!?! Mortgage interest rates were steadily declining for quite a few months in the middle of 2024 (May - Aug) but they have now increased again, getting closer to 7%. I think we will likely see mortgage interest rates continue to fluctuate between 6% and 7% over the course of the next year. If you're waiting to buy until rates get below 6%, it might be a long wait. Now, for a brief summary of the big picture and the latest trends in the Harrisonburg and Rockingham County real estate market... [1] We are seeing 12% more home sales this year than last. [2] The median sales price has increased by 5% over the past year. [3] Detached homes are increasing in value faster than attached homes. [4] We are seeing a decrease in City home sales and an increase in County home sales. [5] We are seeing a much larger year over year increase in new home sales than existing home sales. [6] Inventory levels remain relatively low. [7] Mortgage interest rates continue to stick between 6% and 7%. So, as we prepare for 2025... Home Buyers should connect with a great lender, get a preapproval letter in hand, and go see houses within the first few days that the hit the market. Home Sellers should be realistic in the pricing of their homes given that prices are not increasing as quickly and mortgage interest rates are remaining quite high. Homeowners who do not plan to sell should enjoy their home, their likely low mortgage interest rate, and enjoy not having to engage in what can be a hectic and/or stressful process of selling and buying a home. As you think about YOUR year ahead, if it might include a housing transition (buying, selling, both) feel free to reach out so that we can chat about the market, the process, your hopes and dreams and so that I can know how to best support you in that potential move. You can contact me most easily by phone/text at 540-578-0102 or by email here. Until next year (!) have a wonderful remainder of 2024 - and I hope that you have the opportunity to spend some quality time over the next few weeks hanging out with, laughing with, having fun with, the people in your life who bring you joy! | |
An Early Look At November Home Sales! |
|
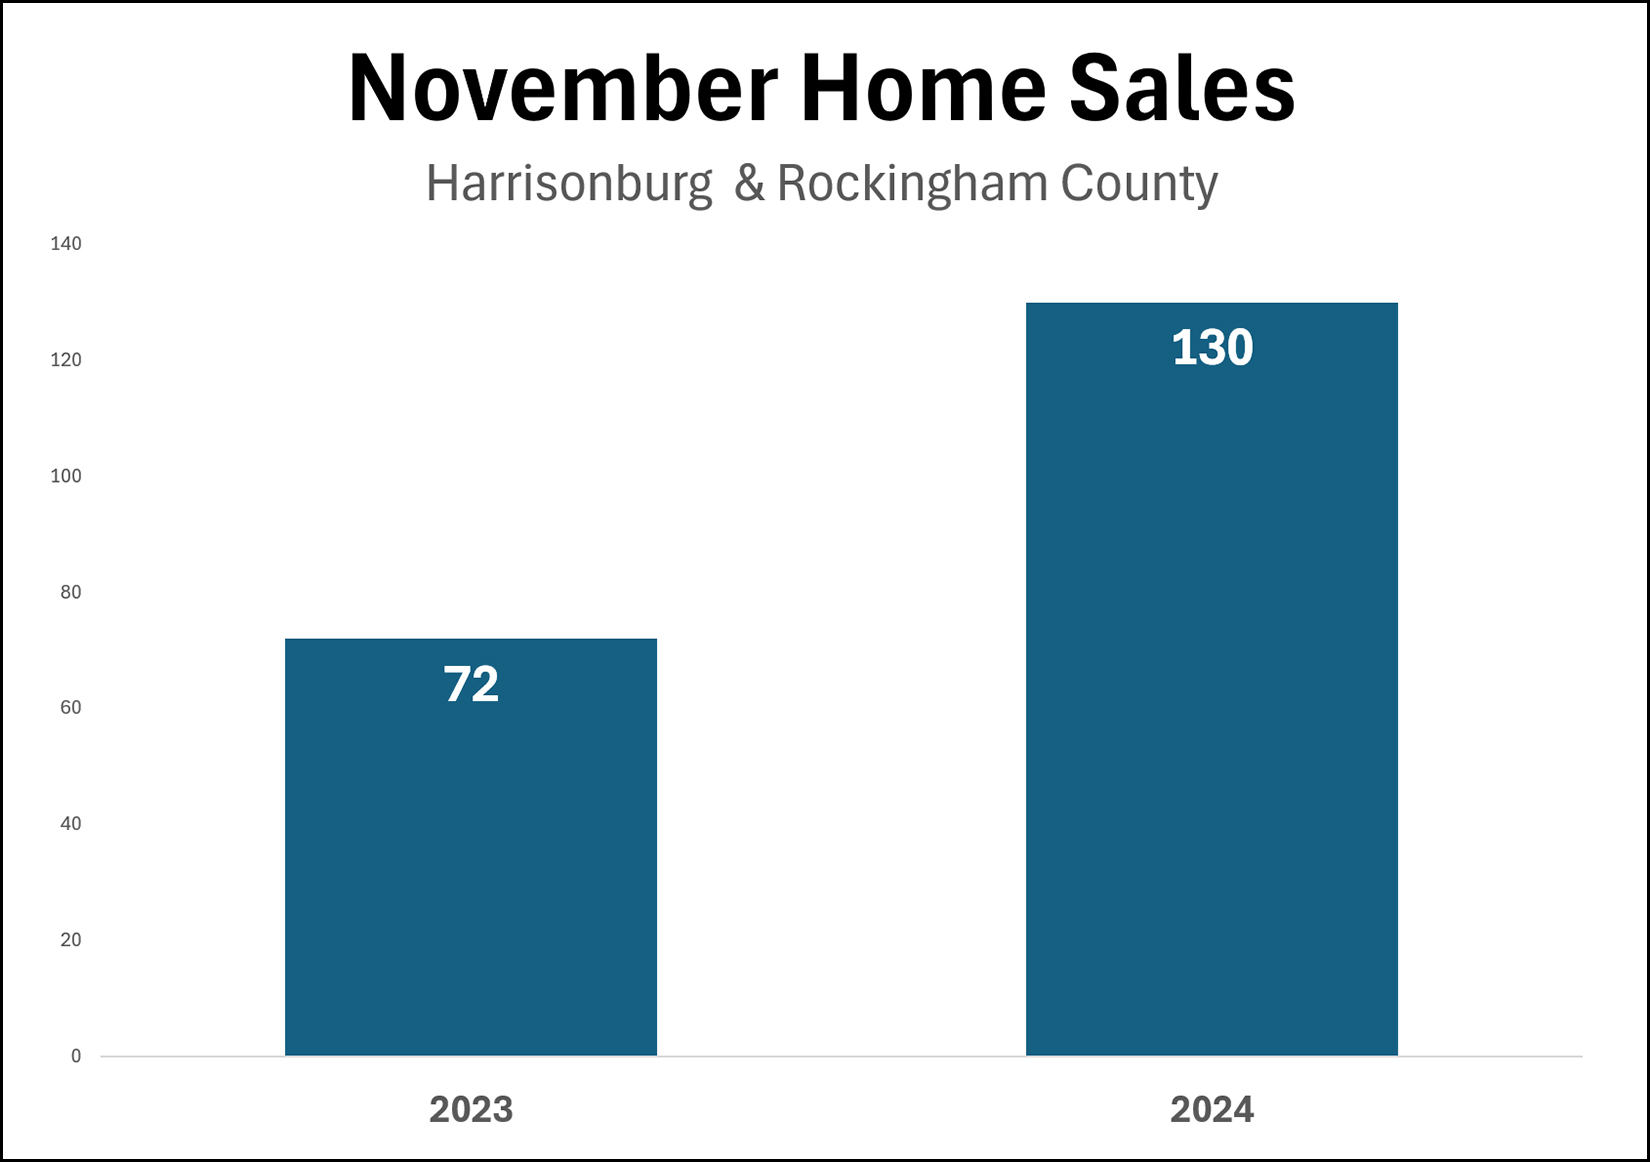 Wow! I wasn't expecting this when I ran a few numbers on November home sales. Last November... only 72 home sales. This November... what!?!!?... 130 home sales. More analysis of November (and year-to-date) home sales coming soon, but for now... this was a much busier November than we experienced last year. By far. | |
Home Sales By Price Range In The City Of Harrisonburg |
|
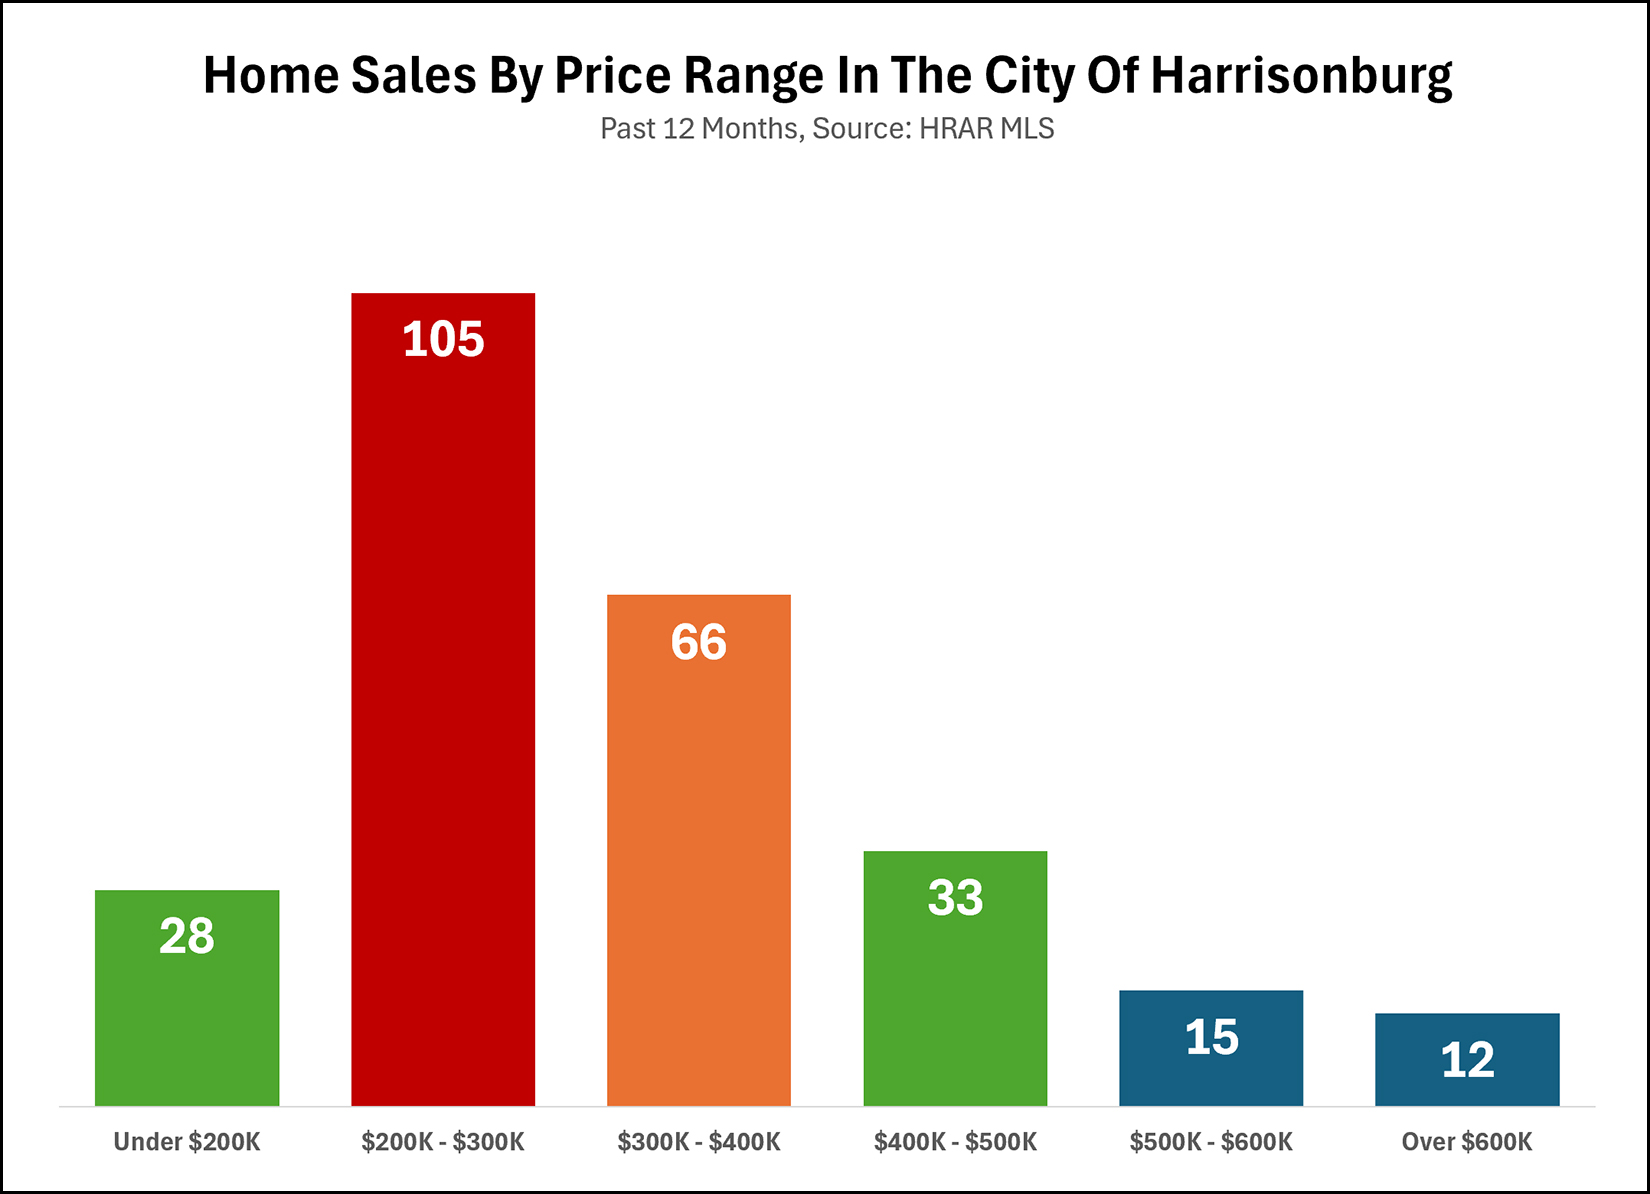 The most active price range for home sales in the City of Harrisonburg is... the $200K to $300K price range. But this might be more than just what buyers are buying... 1. The housing stock (what homes exist in the City) also impacts what is sold, and thus, what buyers can buy. 2. The houses that homeowners in the City are willing to sell also impacts what is old, and thus, what buyers can buy. An interesting unknown is whether home buyers would buy $500K+ or $600K+ or $700K+ homes in the City of Harrisonburg if more such homes existed. Quarry Heights may help to answer that question as they plan to build $500K+ detached homes and $600K+ attached villas. | |
Rockingham County and New Home Sales Drive Surge in Area Housing Market |
|
 Happy Friday morning, all! November is flying right along... with a rather entertaining overlap of the JMU football and basketball seasons (Go Dukes!)... plus one of my favorite holidays, Thanksgiving! Speaking of JMU Basketball... each month I offer a giveaway for readers of my market report. This month I'm giving away four tickets to the JMU Men's Basketball game on Saturday, December 7 at 4:00 PM. Click here to enter for a chance to win the tickets to cheer on the JMU Dukes! Now, on to the latest in our local housing market. First, some of the overall metrics... 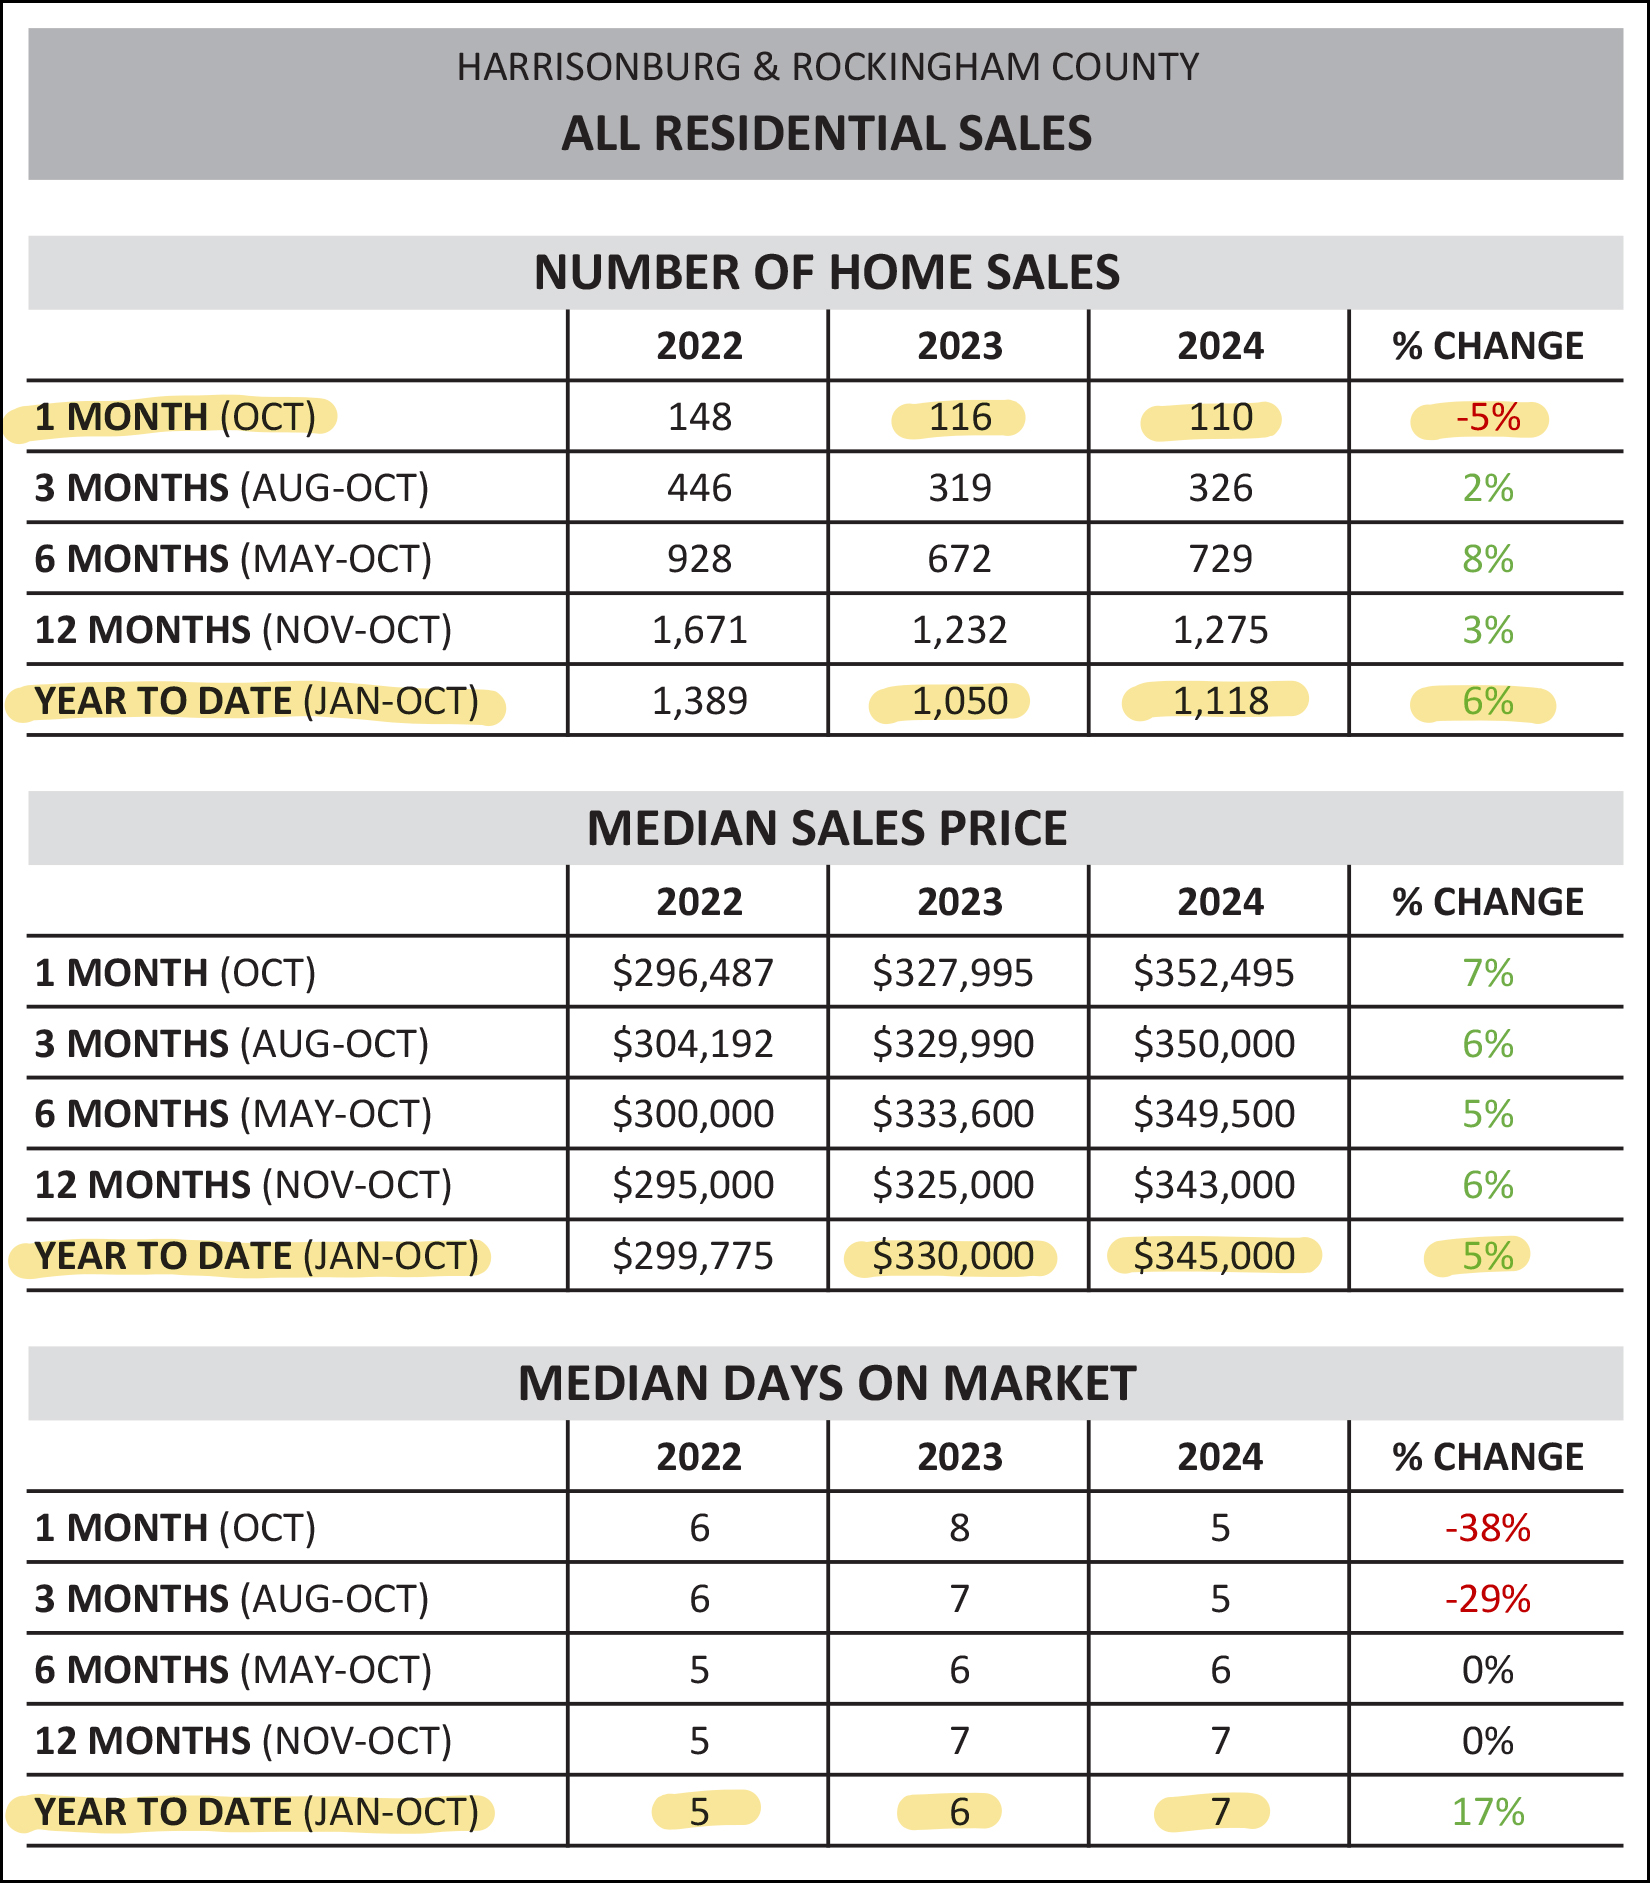 Home sales slowed, a touch, in October 2024 with only 110 home sales as compared to 116 last October... but thus far this year we have seen 1,118 home sales, which is a 6% increase from the 1,050 seen in the same timeframe last year. So... 6% more home sales this year than last... and how about those prices... The median sales price in Harrisonburg and Rockingham County over the first ten months of 2024 has been $345,000 -- which is a 5% increase from the median sales price of $330,000 last year at this time. So... 6% more home sales, and 5% higher prices... how about the speed of those sales... Median days on market continues to (slowly) increase in 2024... which a current median of 7 days, up from 6 days a year ago, and 5 days the prior year. So... small increases in the speed at which home sales go under contract, but 6% more home sales and 5% higher prices. Now, let's take a quick look at only single family detached housing, which excludes townhouses, duplexes and condos... 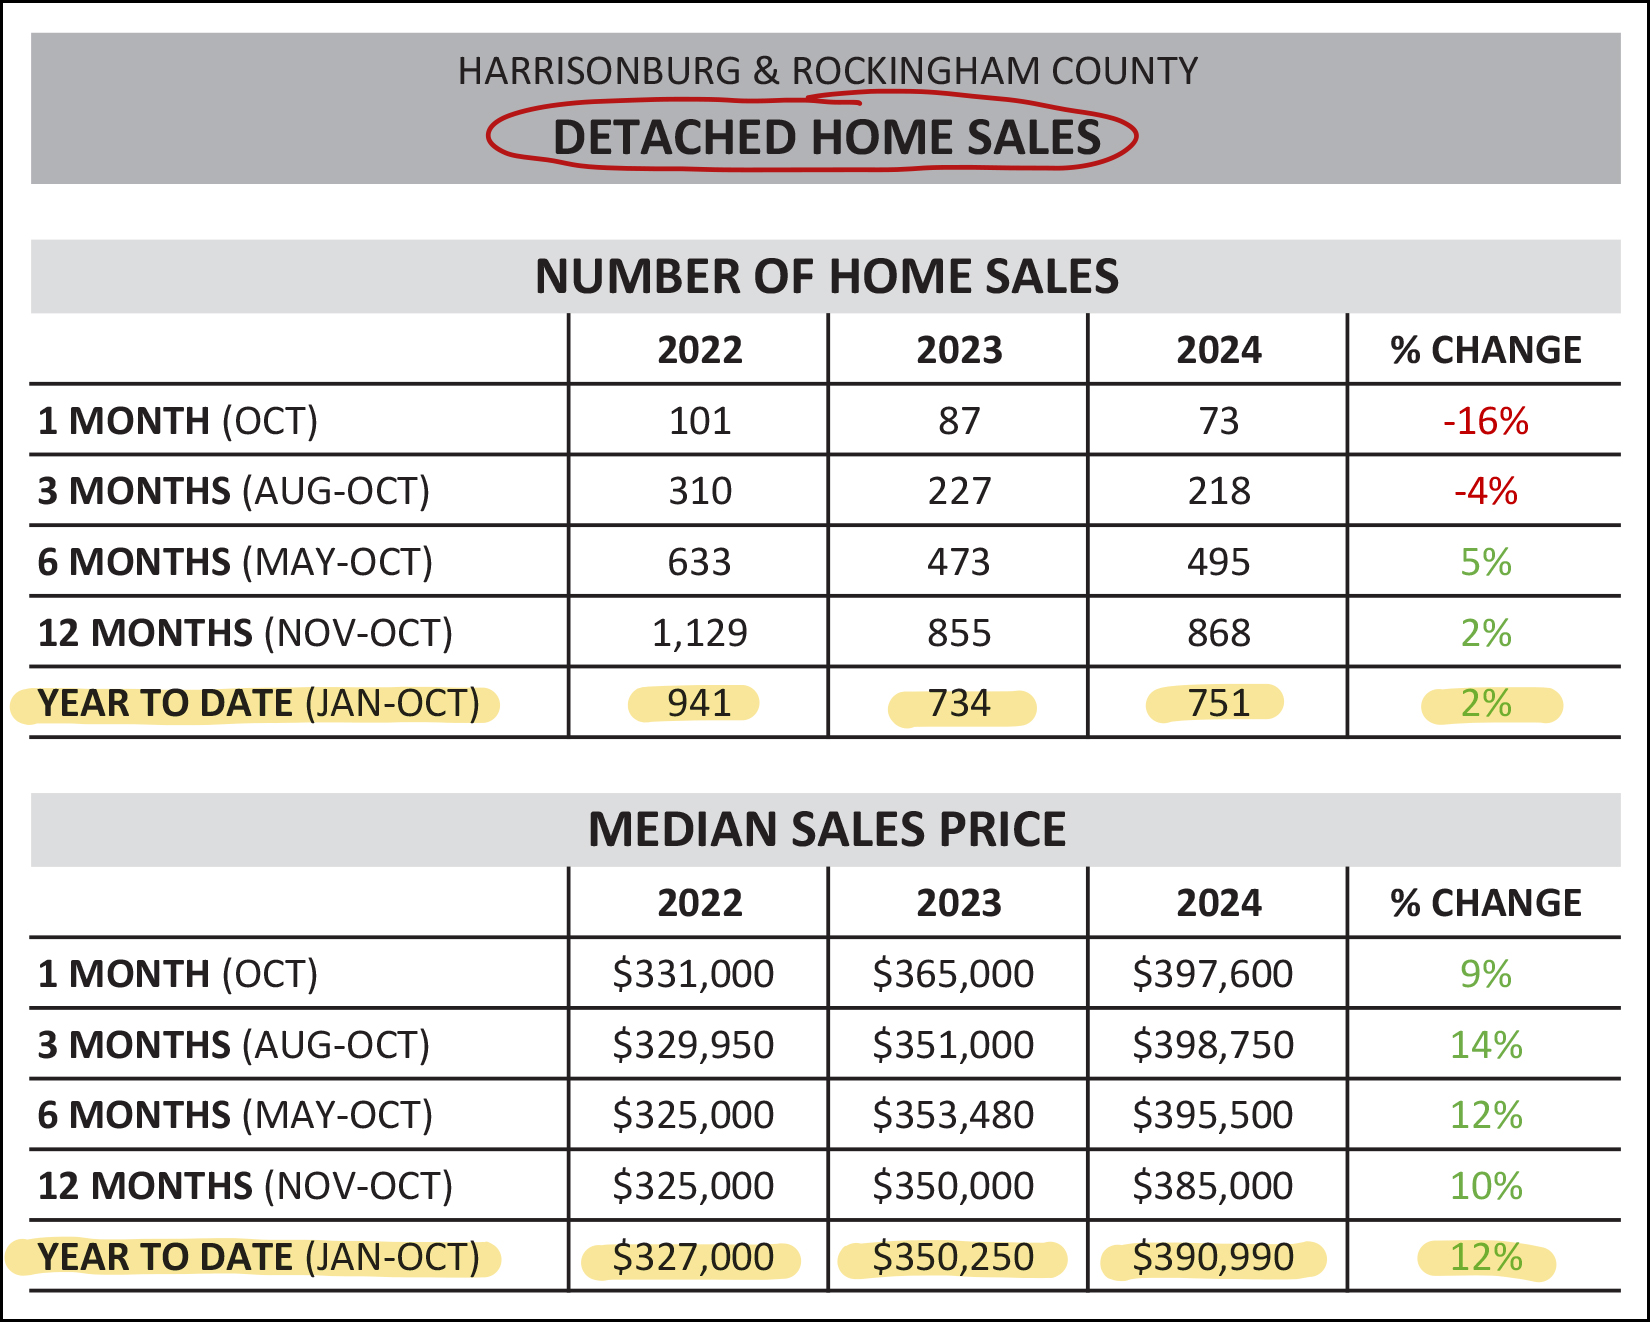 In contrast to the market-wide 6% increase in the number of homes that are selling, we are only seeing a 2% increase in the number of detached homes that are selling. Also of note, two years ago we had seen 941 detached home sales in Harrisonburg and Rockingham County through the end of October, whereas we are only seeing 751 such sales thus far in 2024. When it comes to prices, we are seeing a stronger (12%) increases in the median sales price of detached homes as compared to the overall market-wide 5% increase in the median sales price. Furthermore, the median sales price of a single family detached home has increased from $327,000 to $390,900 over the past two years. Next up, let's take a peek just at the City of Harrisonburg... 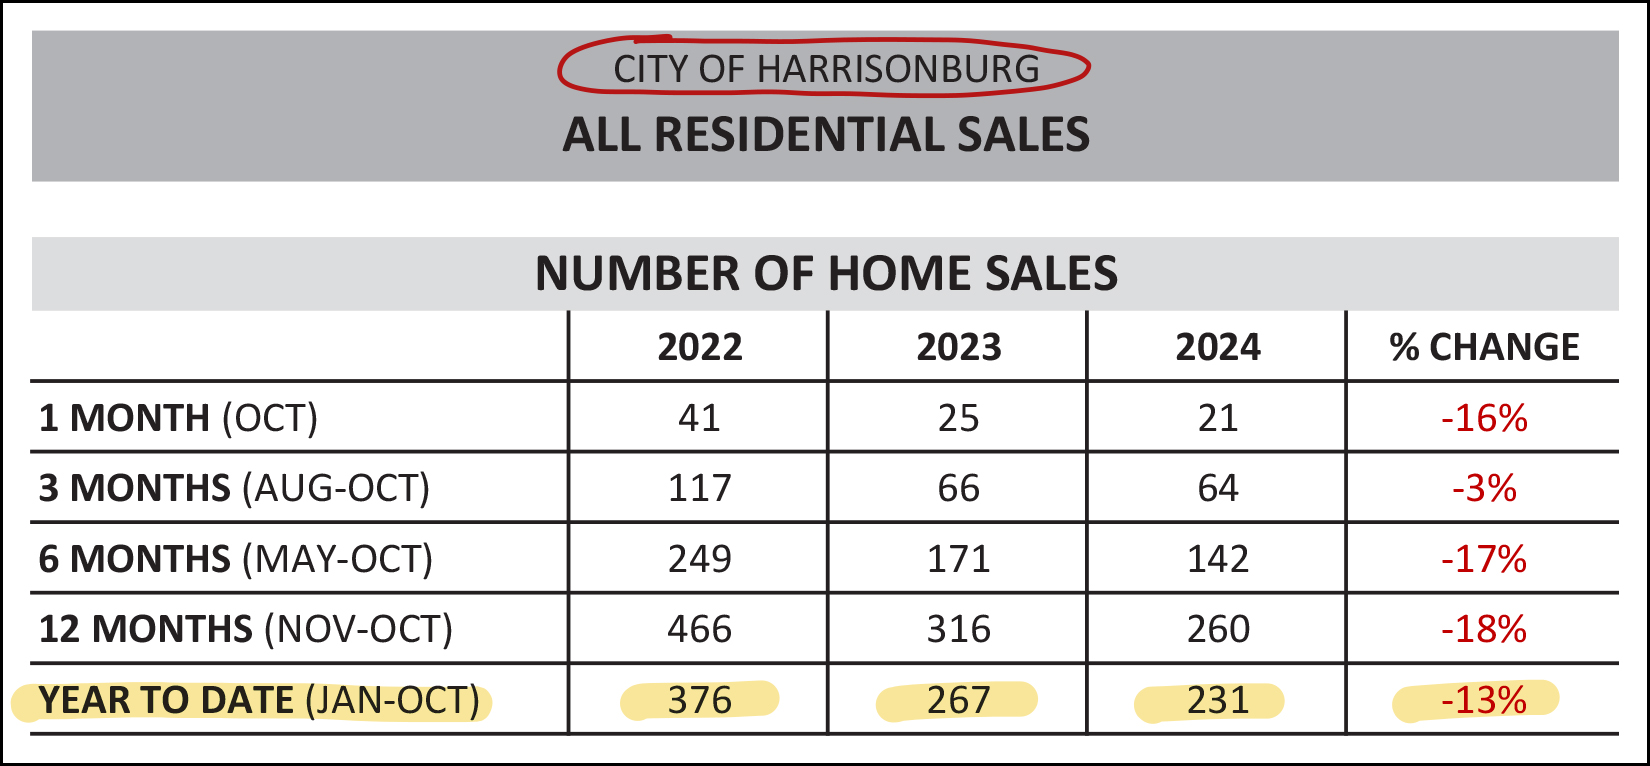 While we are seeing increases in home sales in most portions of the market... and in the overall market... not so much in the City of Harrisonburg. There have only been 231 home sales in the City thus far in 2024 which is a 13% decline from last year, and a 39% decline from the 376 home sales seen in the first ten months of 2022. Meanwhile, in Rockingham County... 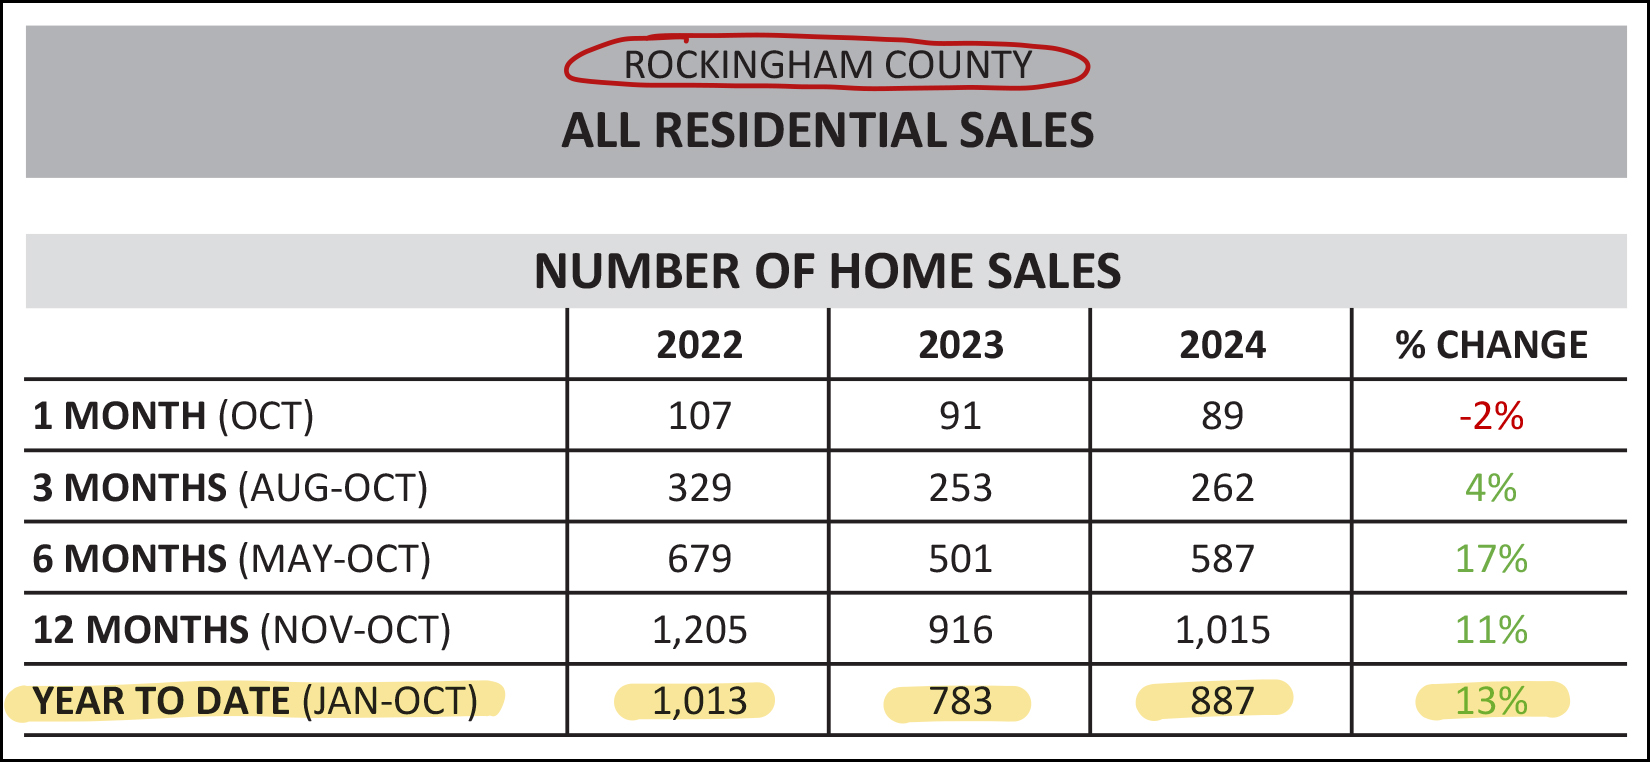 Mirroring the 13% decline in City sales in 2024, we are finding a 13% increase in Rockingham County home sales thus far in 2024. One reason we are seeing more of an increase in home sales in the County than in the City is a result of most new home developments currently being built in the County... and not the City. Here's a look at the number of new construction homes selling in recent years... 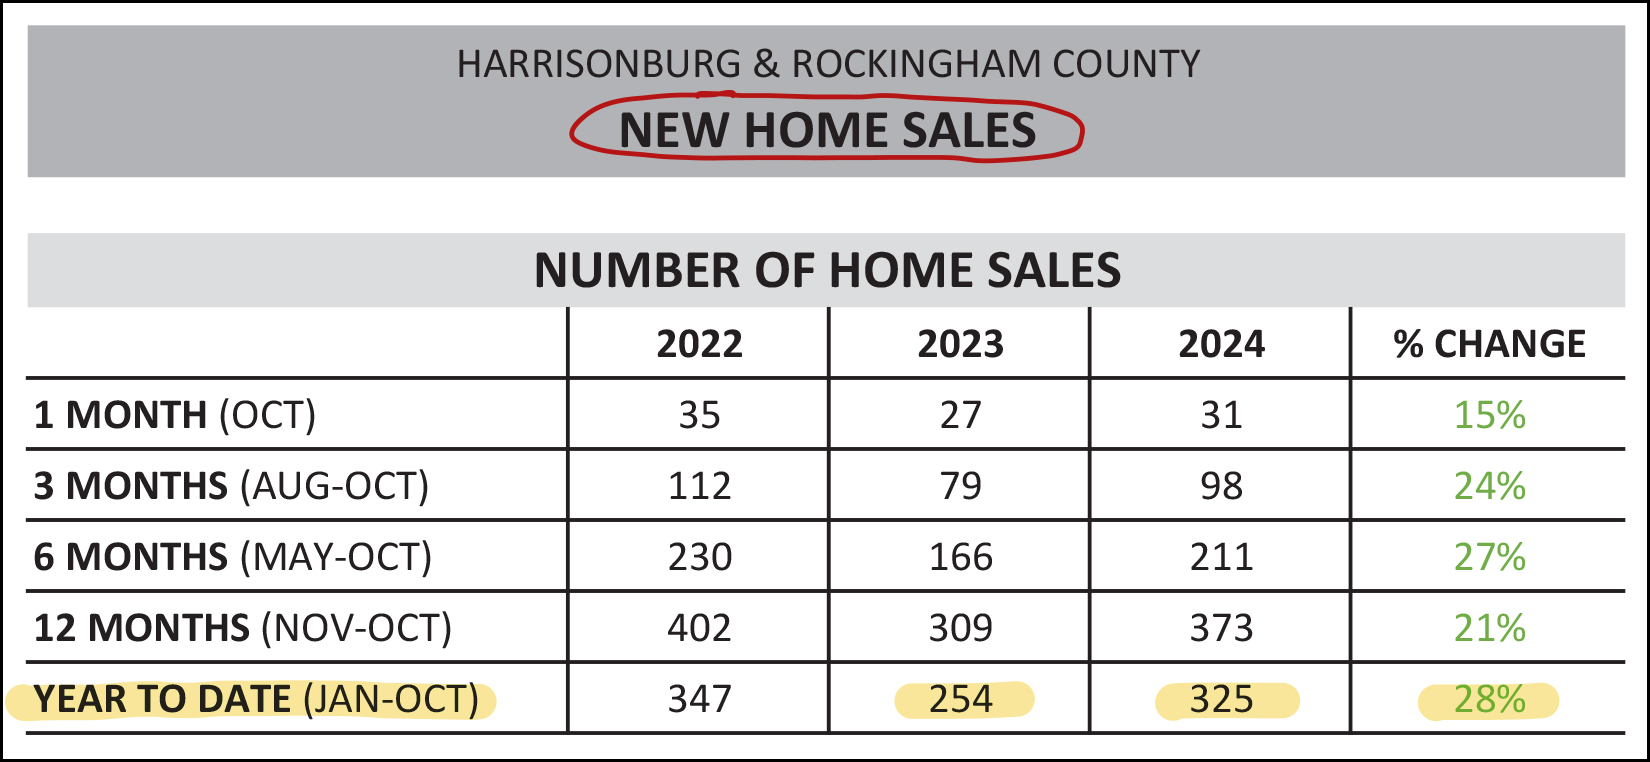 And as you might imagine... if we're seeing a 28% increase in new home sales in the first ten months of 2024, we probably aren't seeing much of an increase in existing home sales... 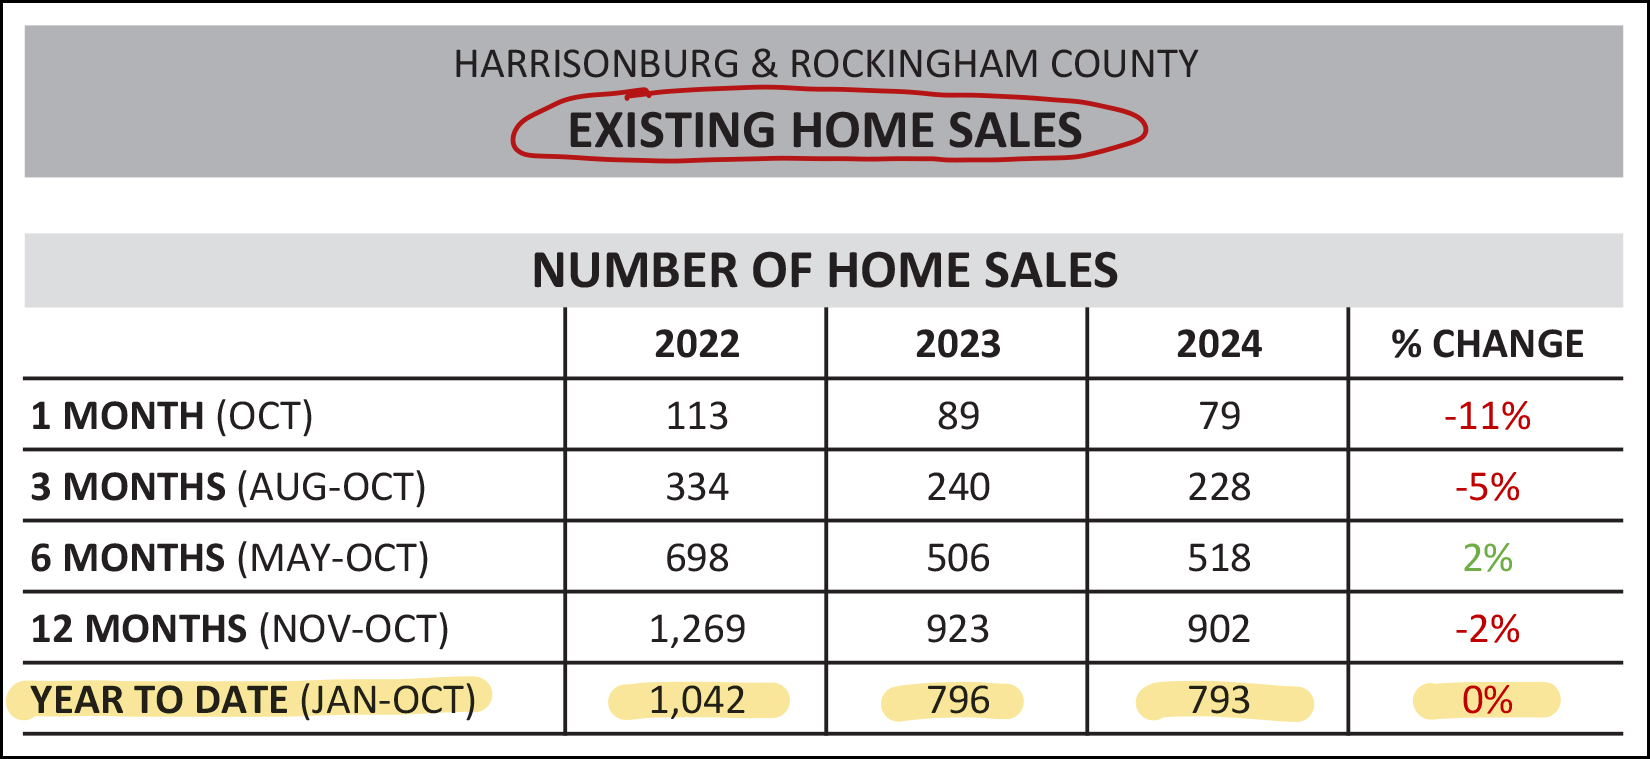 Indeed, we are seeing a tiny decline in existing home sales this year (793) compared to last year (796) though both are considerably below the 1,042 existing homes that sold two years ago in the first 10 months of 2022. Rolling over now into some graphs, let's see what else we can learn about our local housing market through the end of October 2024... 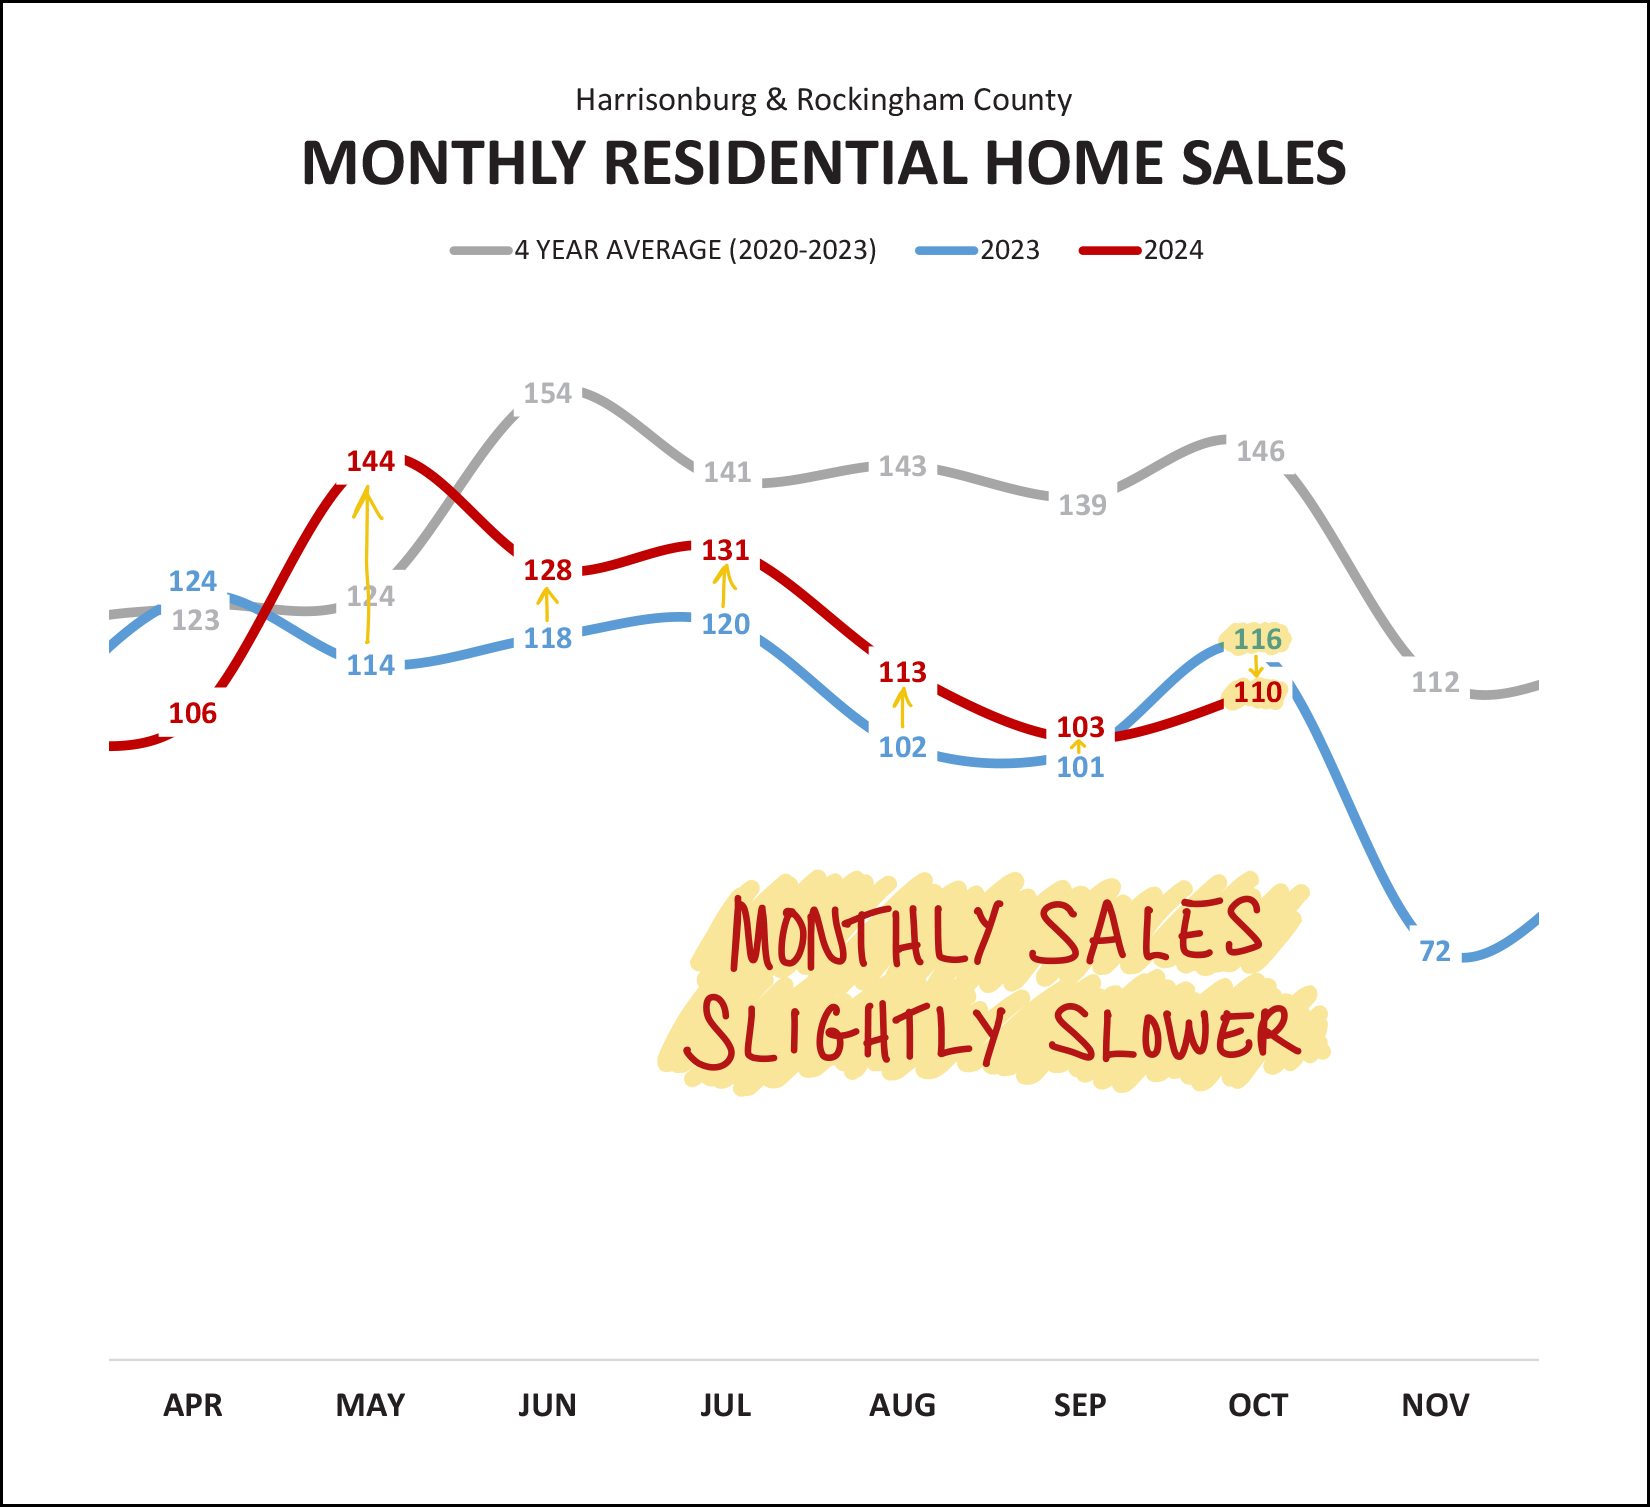 For five of the past six months we have seen more home sales this year than last year... the one exception being October. We could also generalize and say that the larger increases in monthly sales (larger little gold arrows) were on the first half of the past six months... while the smaller increases (smaller little gold arrows) were on the second half of the past six months. Looking ahead a bit on the graph above... it seems almost guaranteed that we will see more November home sales this year than last. Last year we saw monthly home sales drop from 116 in October to 72 in November. I don't think we will see that large of a decline this year. When we pile up each month of the year on top of the prior months, here's what we get over the past few years... 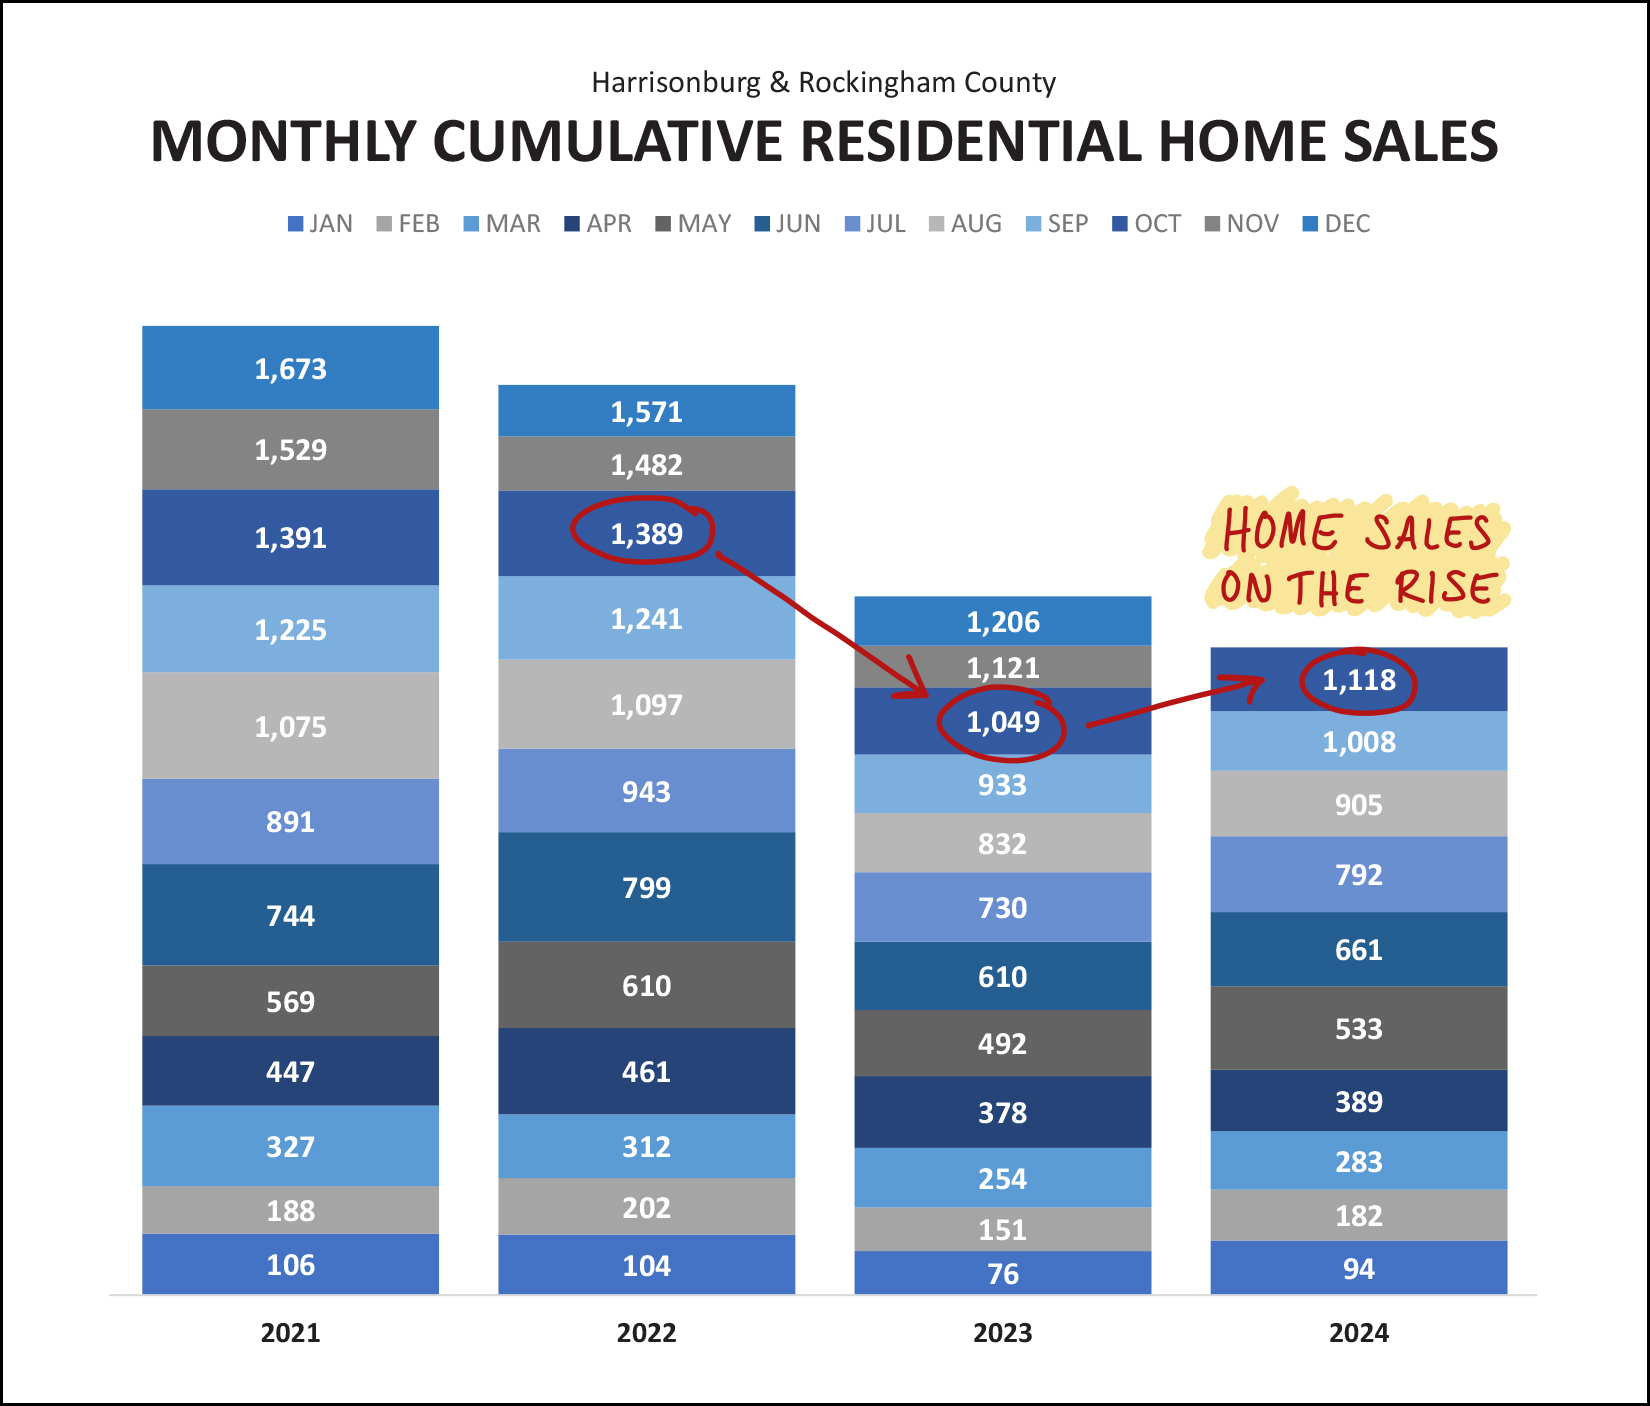 Home sales are on the rise this year... increasing from 1,049 to 1,1118 in the first ten months of the year... BUT... that is still a significant drop from the 1,389 home sales seen in the first 10 months of 2022! The biggest difference, as you likely know, is that we were still experiencing super low mortgage interest rates in 2022... which were no longer around in 2023 and 2024. On this next graph I'm trying to generalize the main two shifts I have seen in 2024... 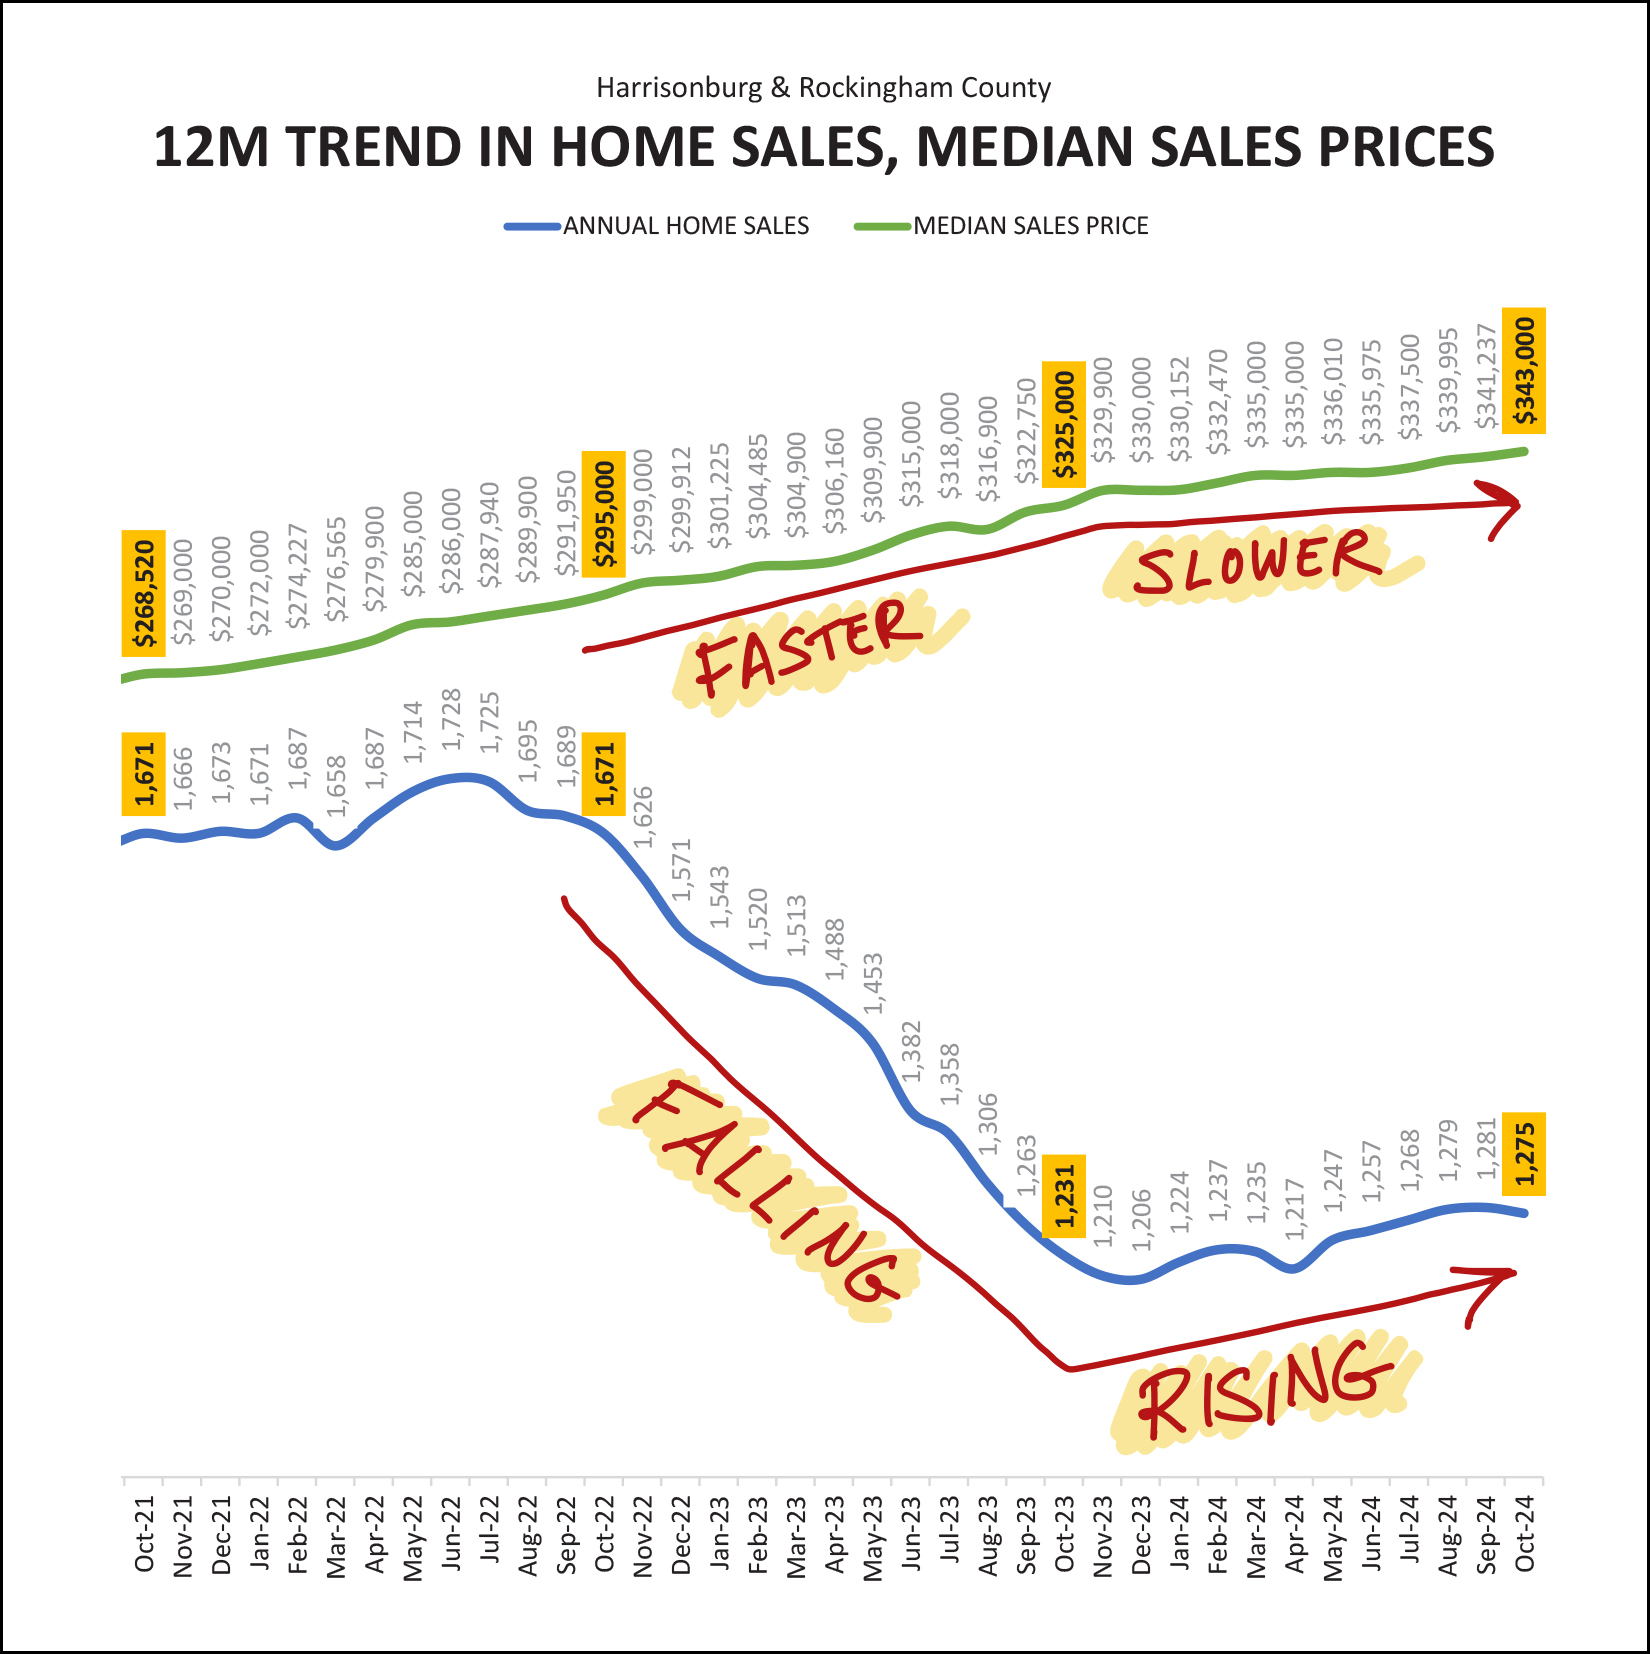 The top line is tracking median sales prices. For several years we saw 10% per year annual increases in the median sales price... up to and including in 2023... but home prices seem to be increasing a bit more slowly in 2024... more in the neighborhood of a 5% increase instead of a 10% increase. The other main change we have seen in 2024 is that home sales are rising again... so as to say that more homes are selling. Through most of 2023 we saw steady declines in the number of homes that were selling, but that trend reversed itself (slowly) in 2024. Zooming out a bit, take a look at the change in home values for detached homes in Harrisonburg and Rockingham County over the past five years... 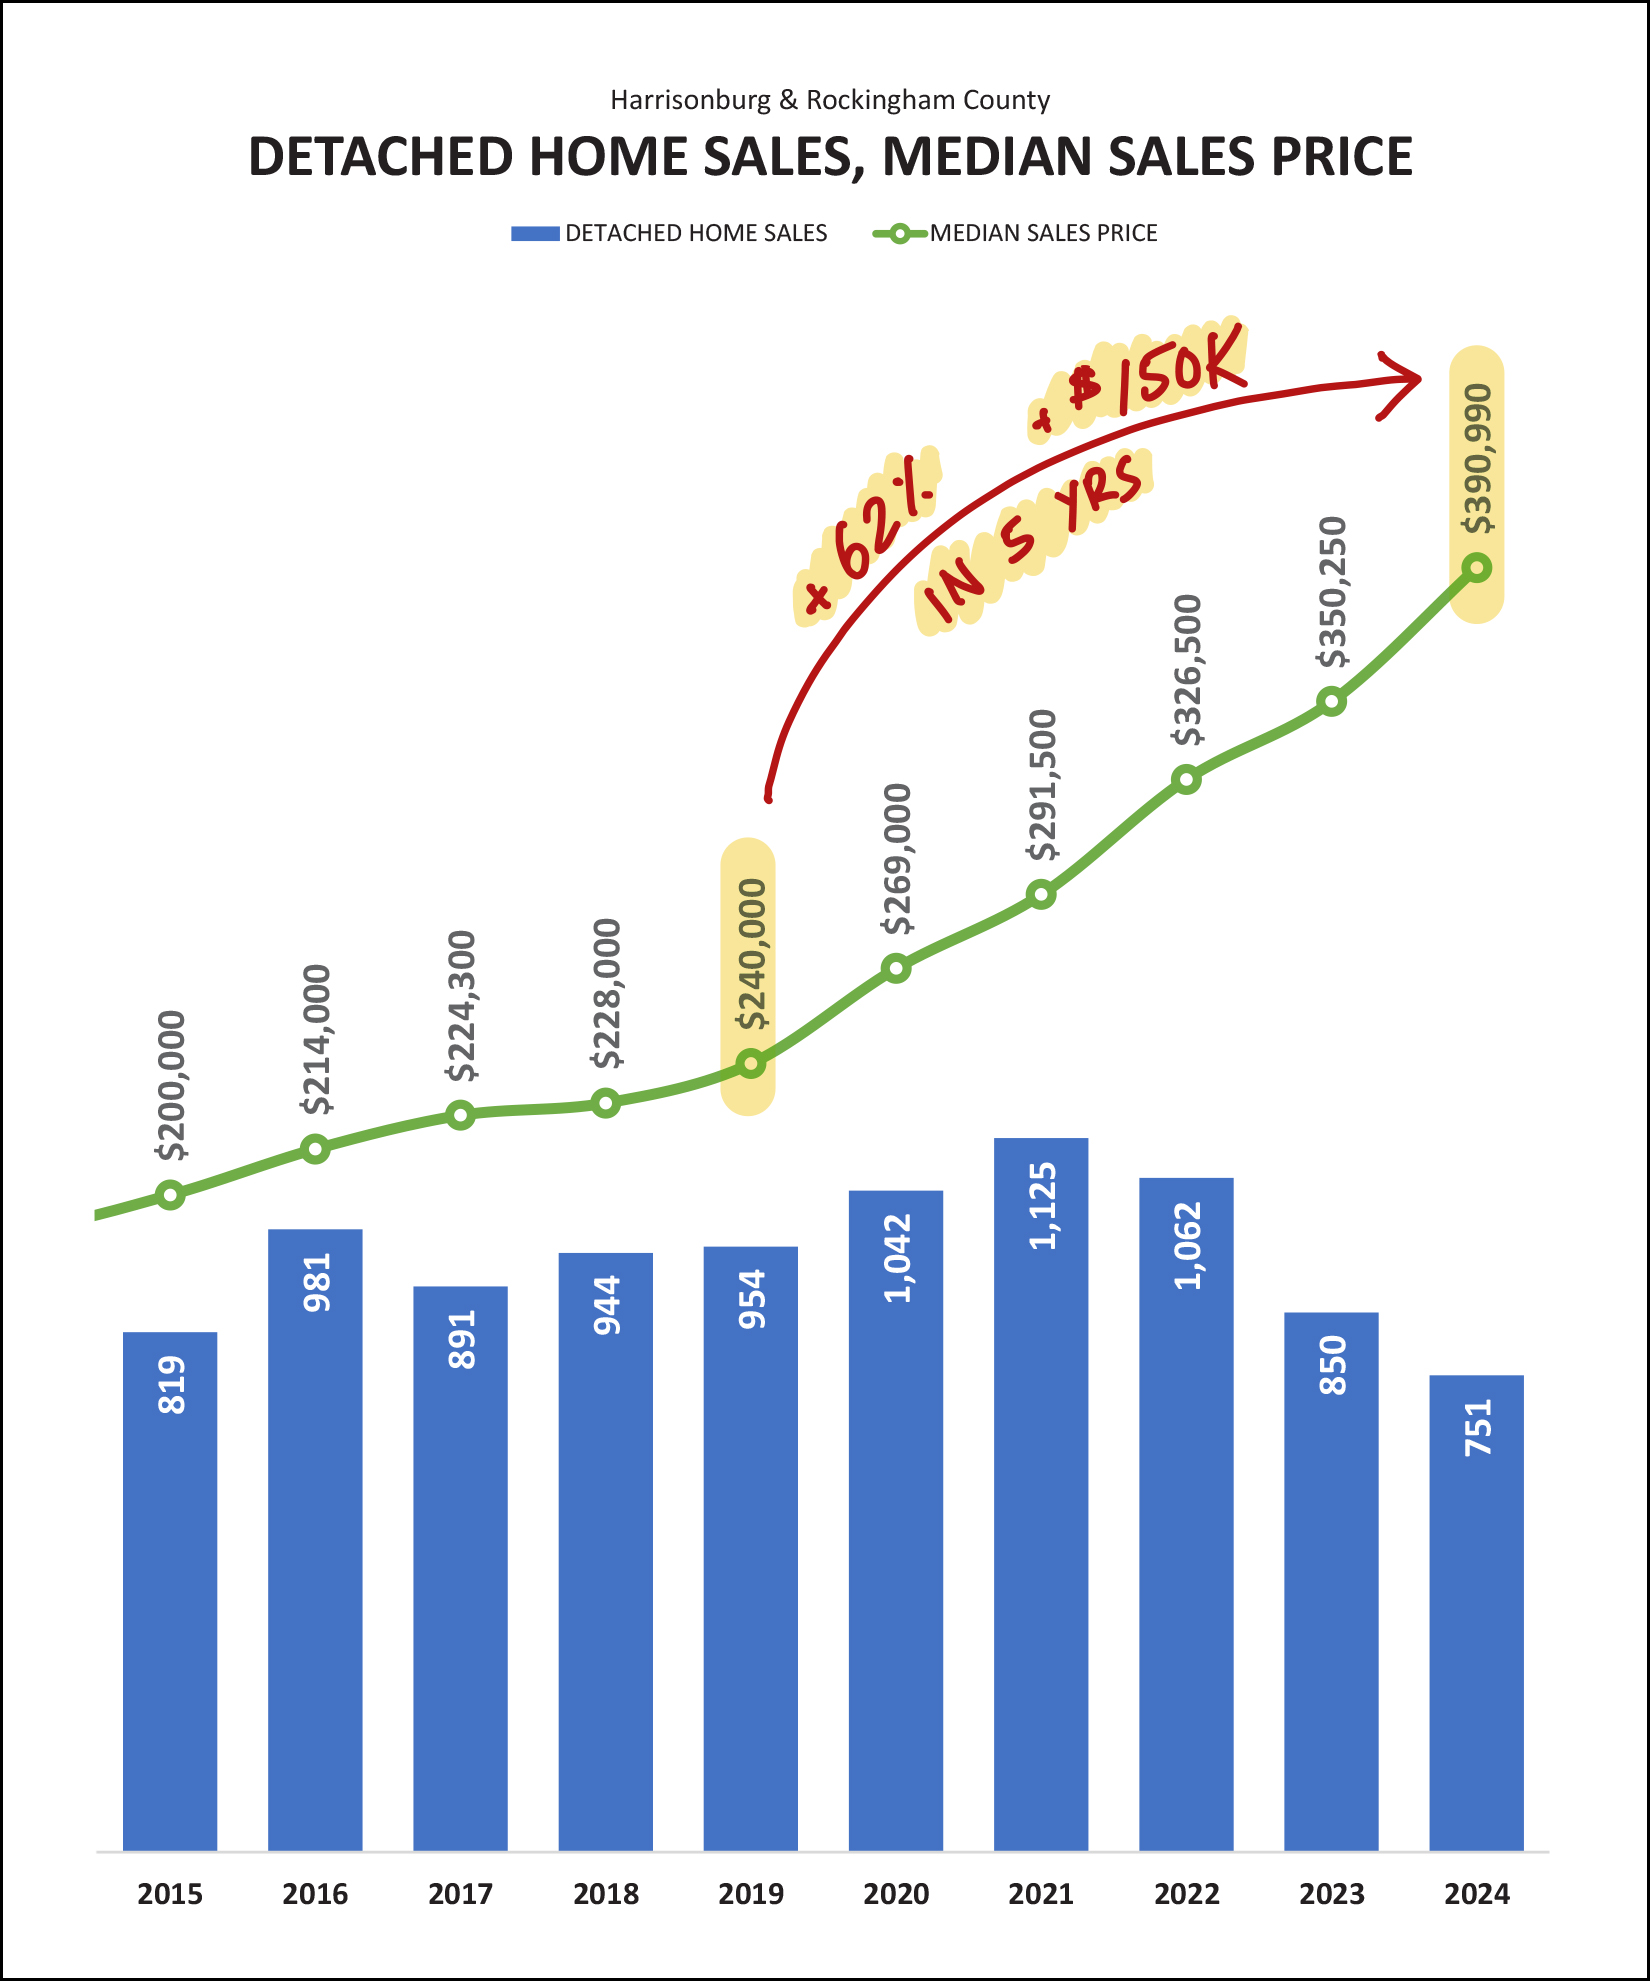 Indeed... you are reading that correctly... the median sales price of a detached home in Harrisonburg and Rockingham County has increased by $150,000 over the past five years... for a cumulative 62% increase! A few thoughts come to mind... 1. Anyone who has owned the same home for the past 5+ years likely has quite a bit of equity in their home. 2. It is a lot harder (financially) to consider buying a detached home now (median price of $391K) than it was five years ago (median price of $240K). 3. Changes in mortgage interest rates over the past five years haven't helped buyers either -- as the average rate on a 30 year mortgage was 3.75% five years ago, and is 6.78% today. Wowsa! Shifting gears a bit, let's zoom back in to the here and now, to see what recent contract activity might tell us about upcoming months of home sales... 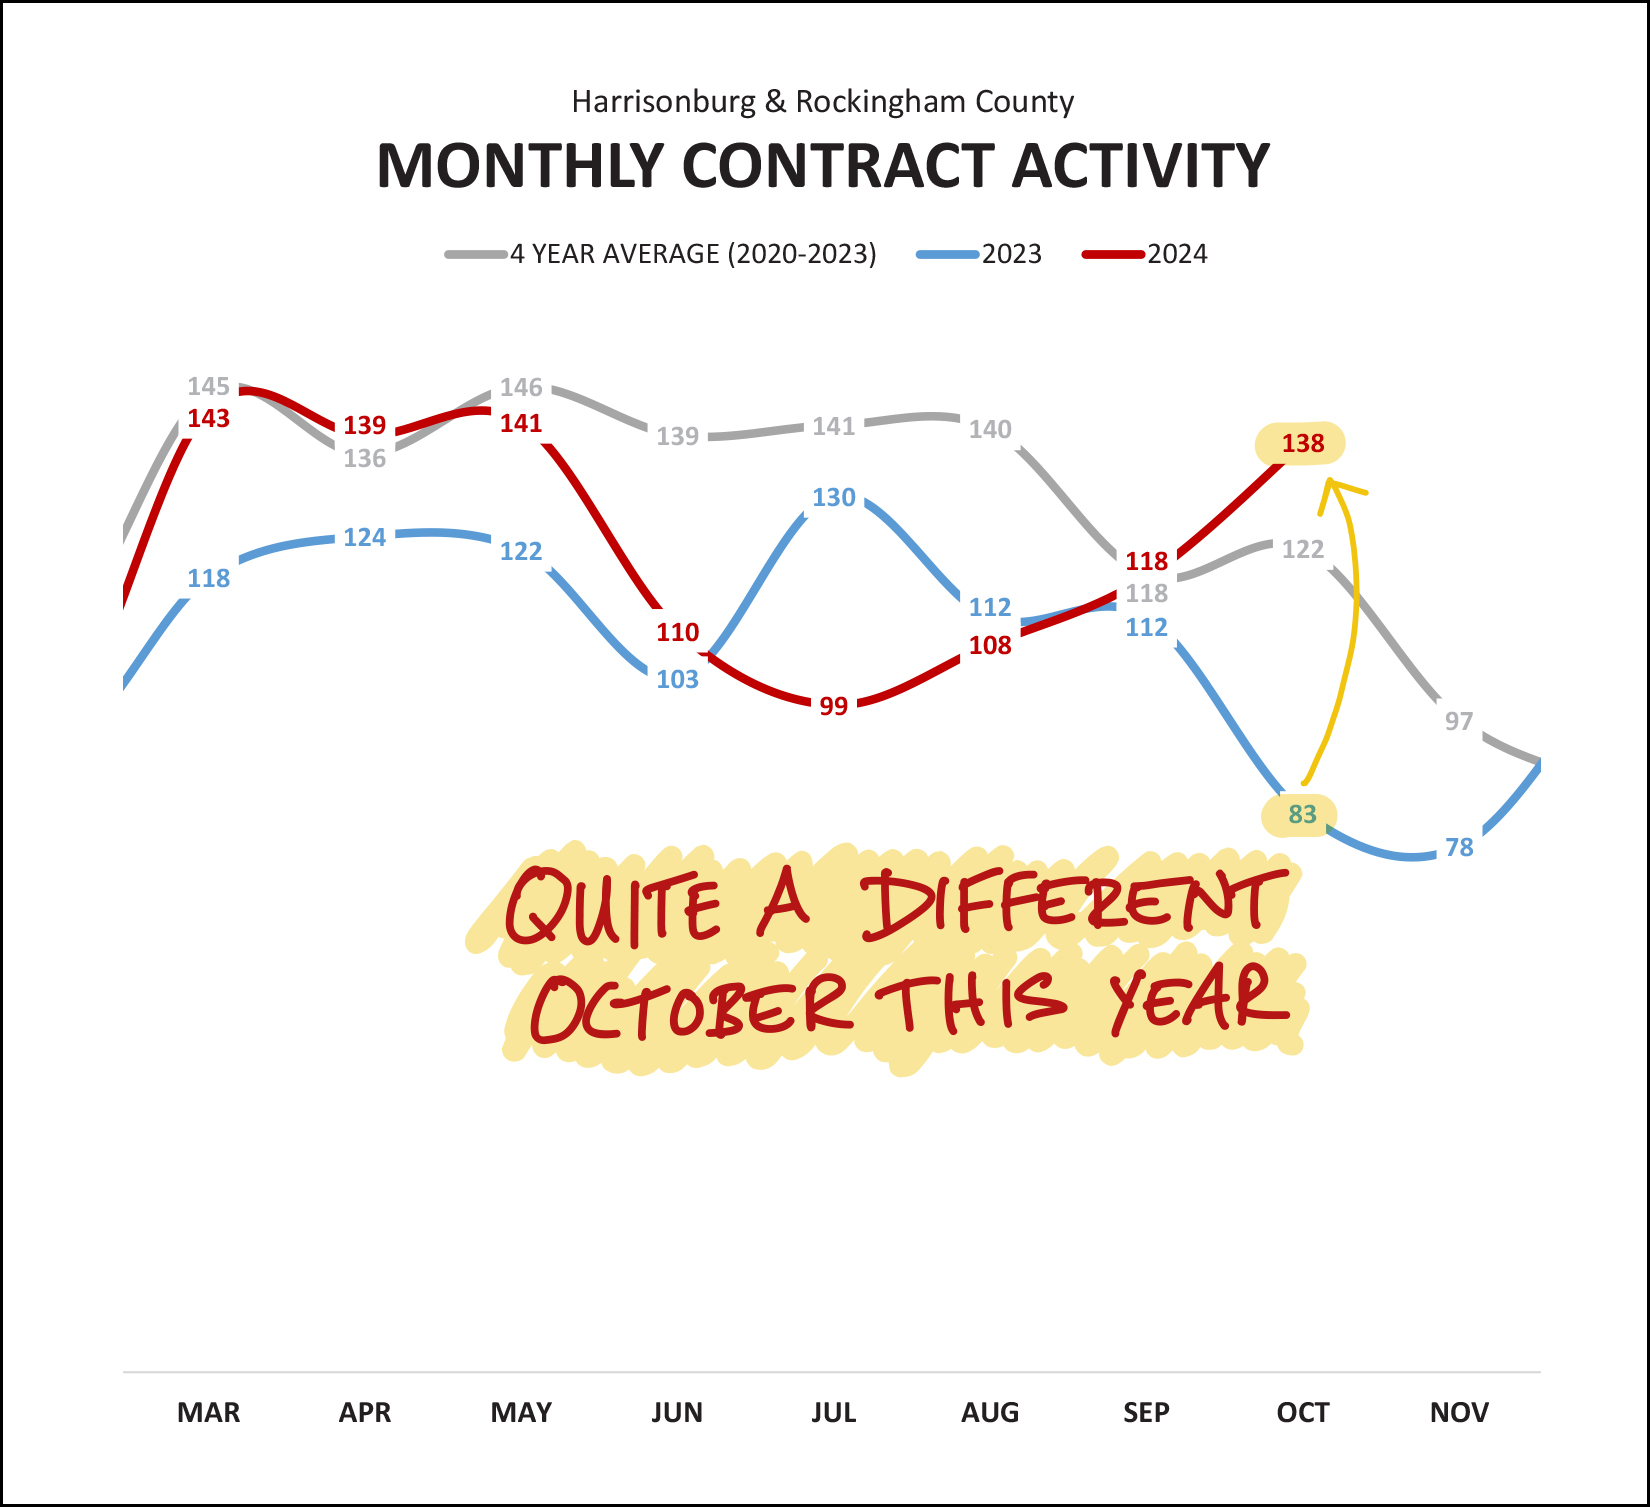 Here (above) is the other reason why I don't think we'll see a decline in November home sales this year like we did last year... there was a drastic difference in October contract activity this year compared to last. The key thing to remember about last October is that it included the final climb to a peak average mortgage interest rate of 7.79%. That steady climb slowed and slowed and slowed down buyer activity last October (and November) as shown by the blue line above. Thus, even though mortgage interest rates are currently in the 6% - 6.75% range, we still saw many more buyers signing contracts to buy homes this October (138) as compared to last October (83). I expect we will continue to see stronger contract activity in November and December of this year compared to the same months last year. Which leads us to "pending sales" -- the number of homes that are under contract at any given time... 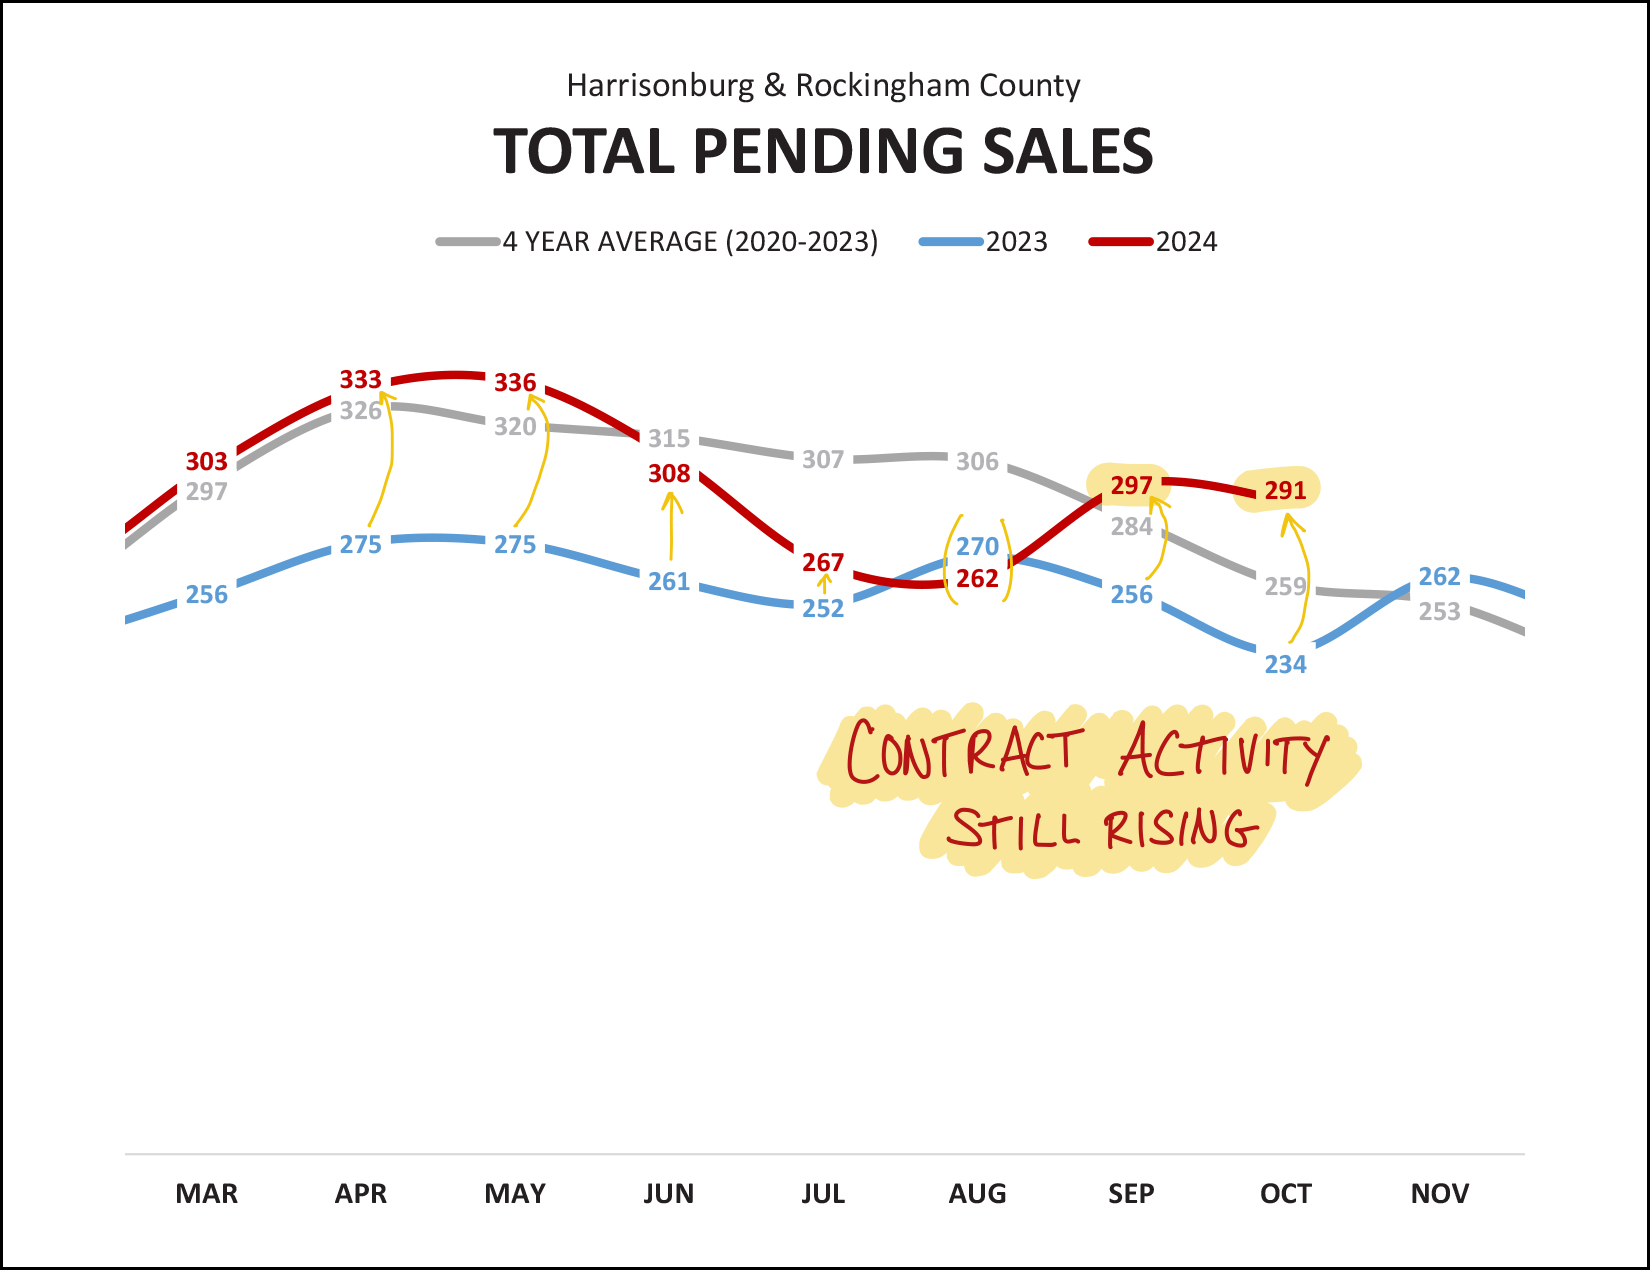 The red line (above) tracks how many homes are pending (under contract) per month in Harrisonburg and Rockingham County. As you can see from all the gold arrows, we had been seeing increases in pending sales for most of the months this year... through August, when 2024 fell below 2023... but things have picked back up again significantly in September and October. There are currently 291 homes under contract (pending) in Harrisonburg and Rockingham County as compared to only 234 a year ago at this time. And how about those inventory levels? 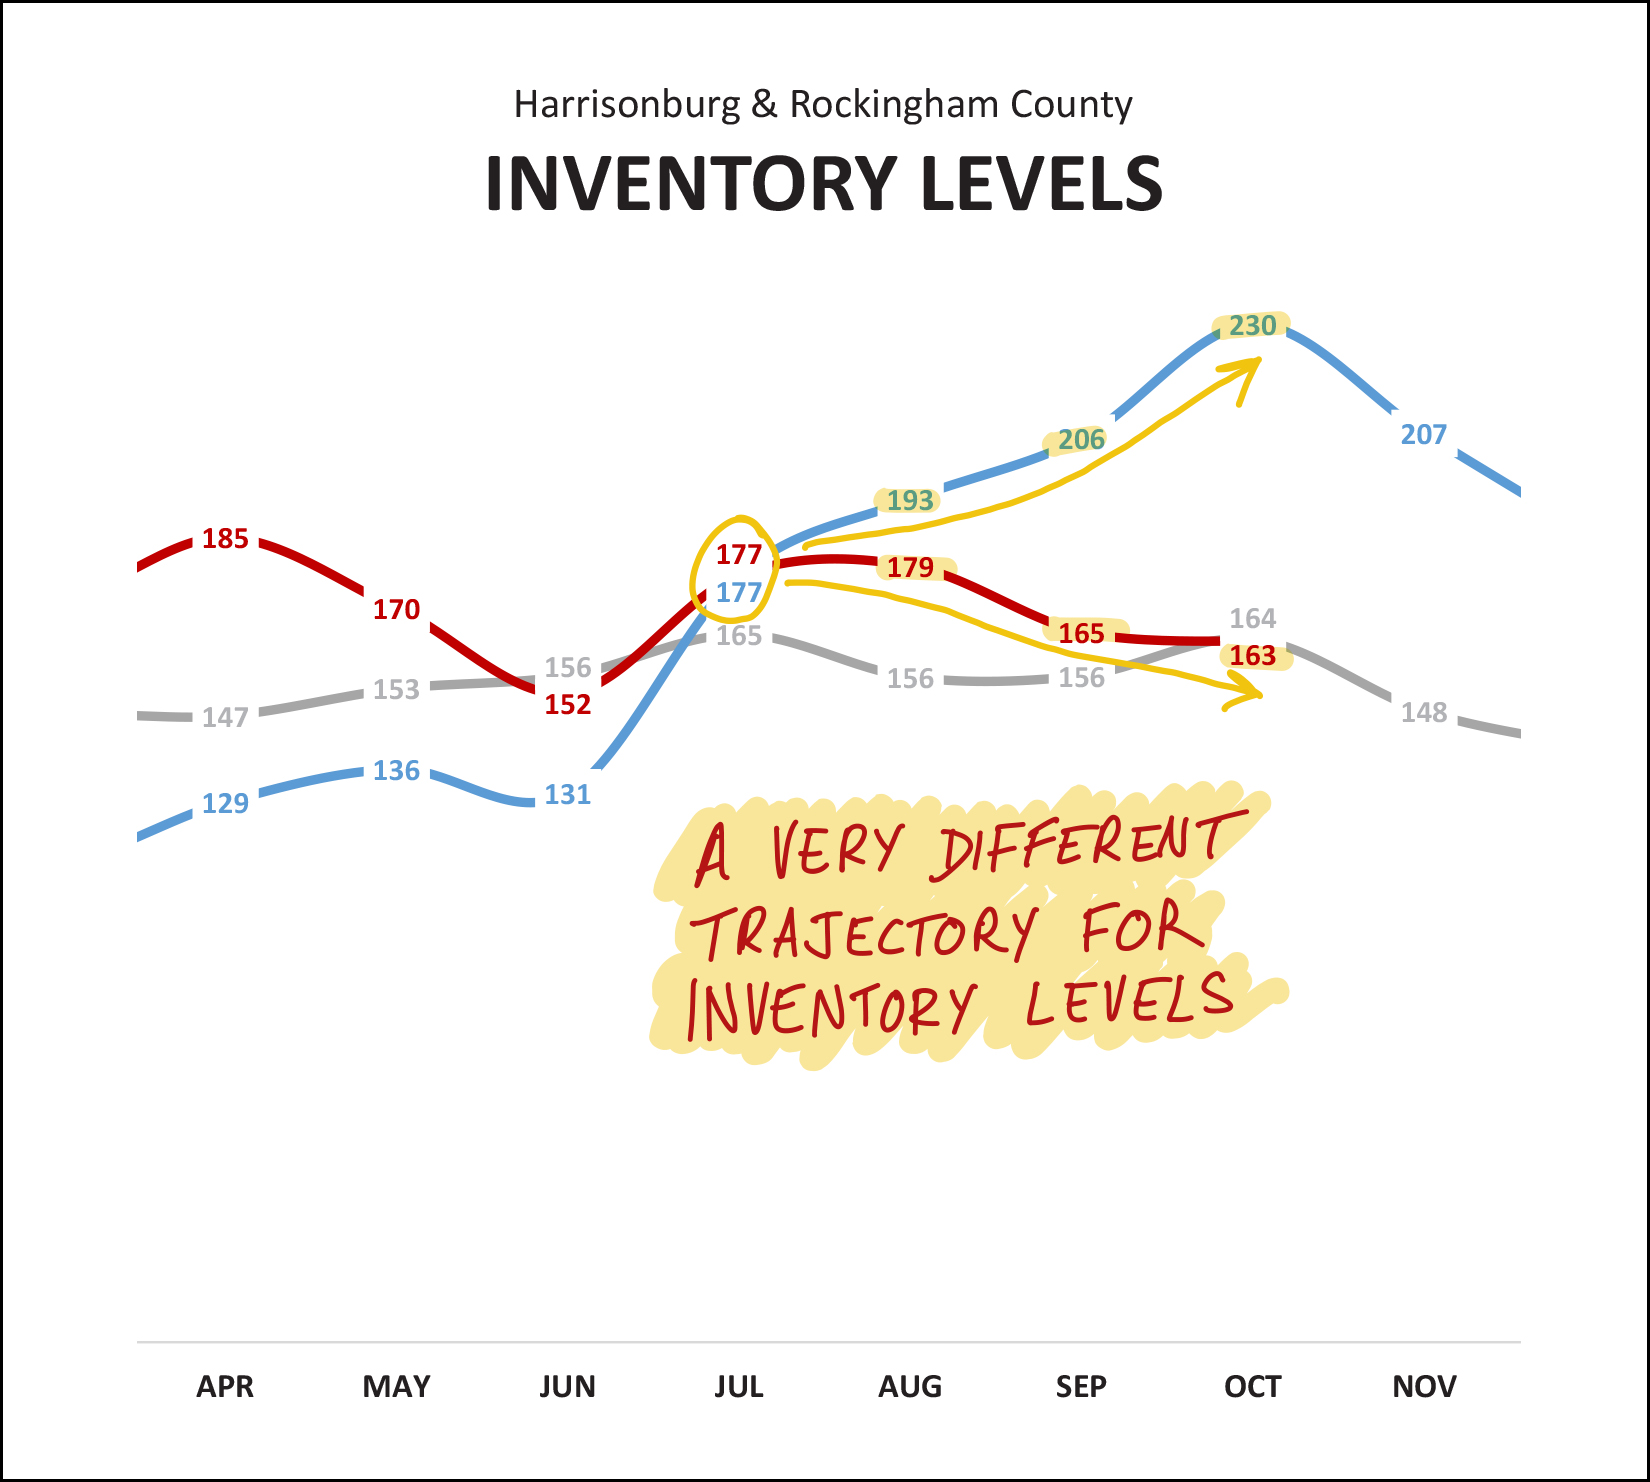 Look at the difference in the trajectory of the blue and red lines above. The blue line shows how inventory levels were steadily rising last year between July and October... in contrast to the red line that shows inventory levels mostly decreasing this year between July and October. Now in November, we see far fewer (163) homes for sale than at the same time last year when 230 homes were listed for sale and not yet under contract. A thread that runs through all of these charts are graphs is change in mortgage interest rates over time which is what we'll examine next... 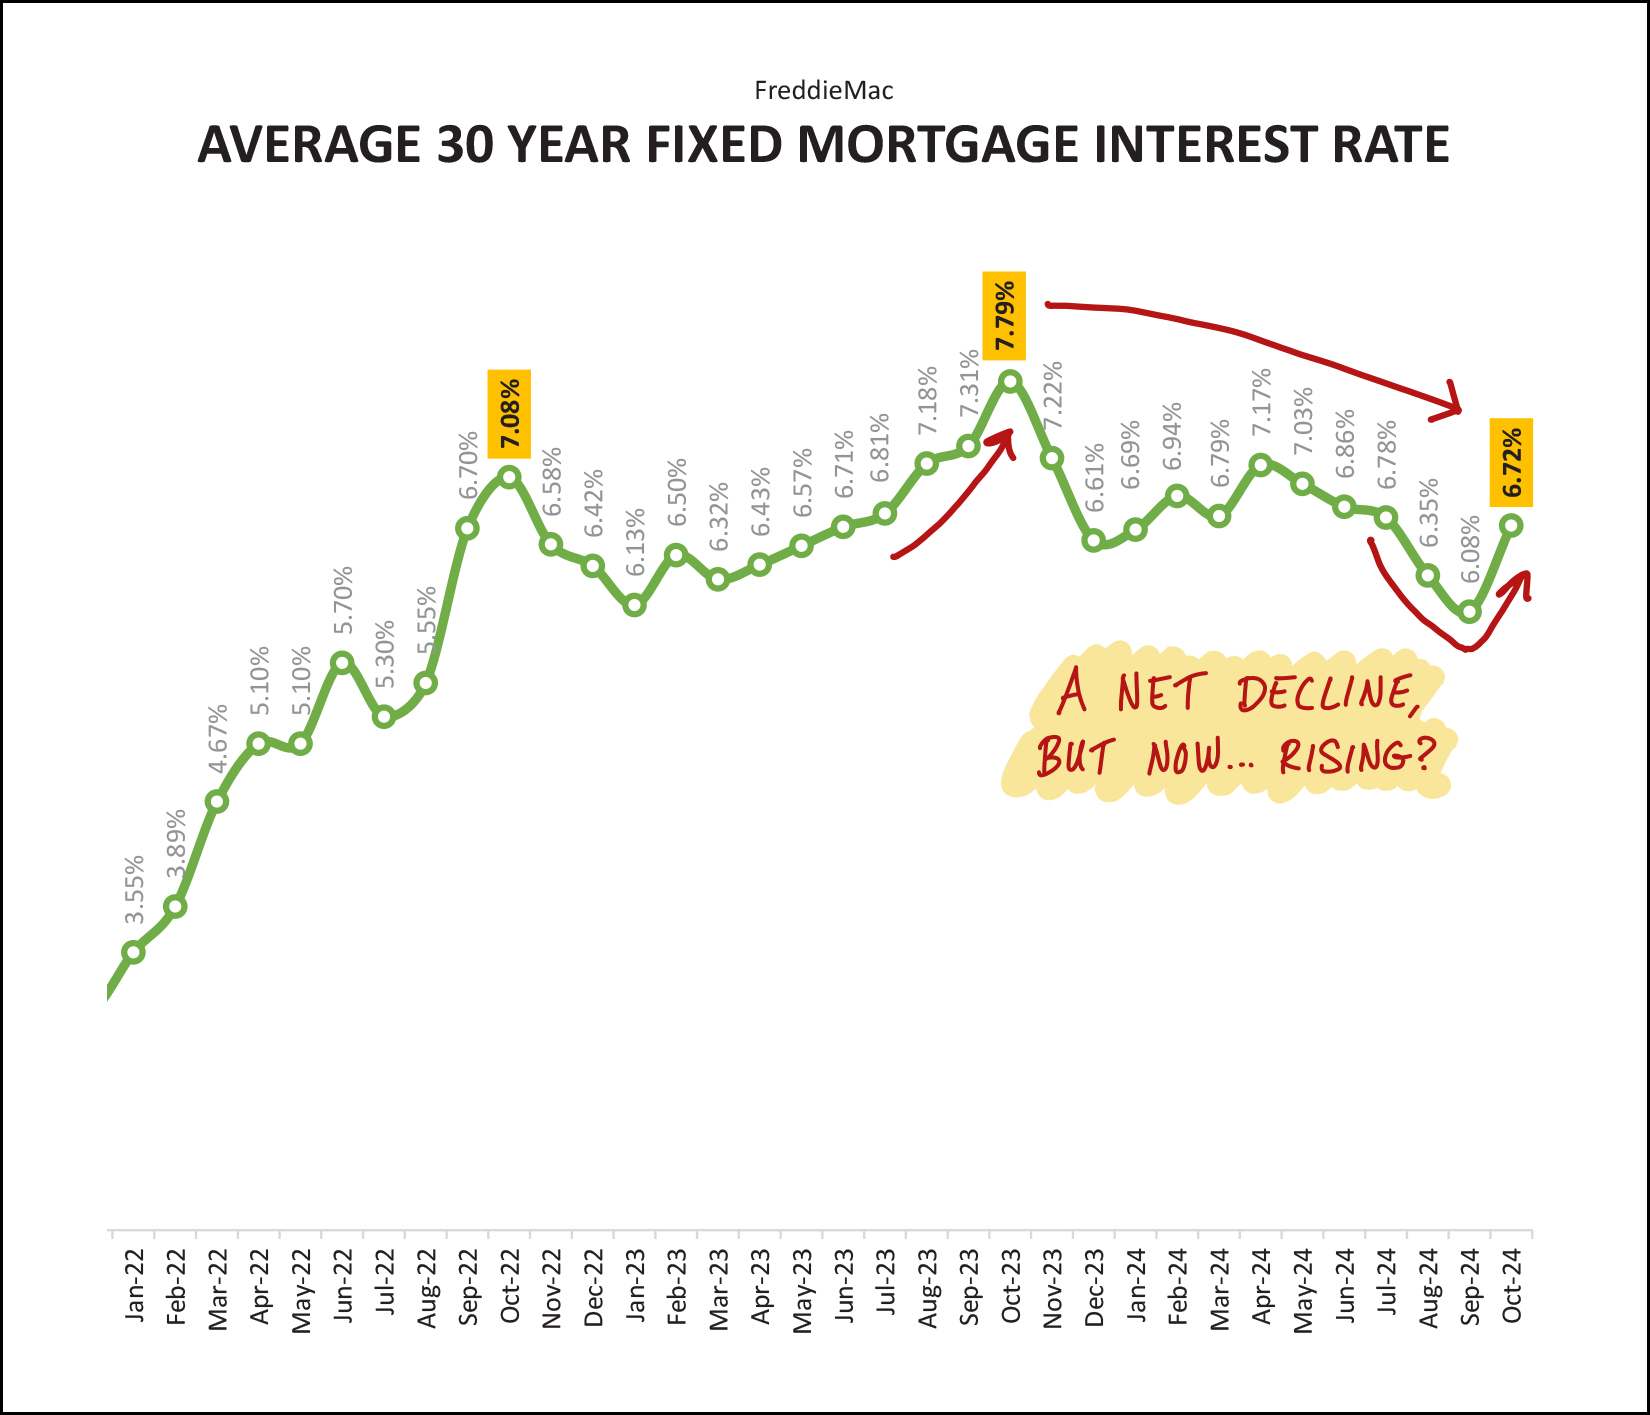 Lots of arrows on this graph -- sorry, not sorry. A year ago we were seeing mortgage interest rates rise as we progressed from August (6.81%) to November (7.79%). We have seen an overall decline in rates over the past year (7.79% to 6.72%) but over the past month we have actually seen them start to increase a bit, rising from 6.08% at the end of September up to 6.72% at the end of October. Mortgage interest rates significantly impact the cost of housing and have played an oversized role in the the housing market (locally and beyond) over the past few years due to how quickly they have increased. So, if you've made it thus far, thanks for reading and for educating yourself on the state of our local housing market. The general, recent, local, trends I am seeing in our local market include:
If you will be buying or selling a home in the next three to six months, we should talk sooner rather than later about your hopes, goals, dreams and the best timing for your big move. Even if you don't know if you really will buy... or if you really will sell... I'm still happy to connect with you just the same to discuss your possible purchase/sale, to discuss the market, or to discuss life in general. Feel free to reach out anytime with questions or to set up a time to meet. You can contact me most easily by phone/text at 540-578-0102 or by email here. Until we chat next, I hope you have a wonderful Thanksgiving celebration and are able to enjoy bountiful, relaxing, refreshing and fulfilling time with your family, friends and other special people in your life. If you're running in the Rocktown Turkey Trot, I'll see you on Thanksgiving morning in downtown Harrisonburg! :-) Gobble, Gobble! | |
More Than Half Of New Home Buyers Are Buying Attached Homes |
|
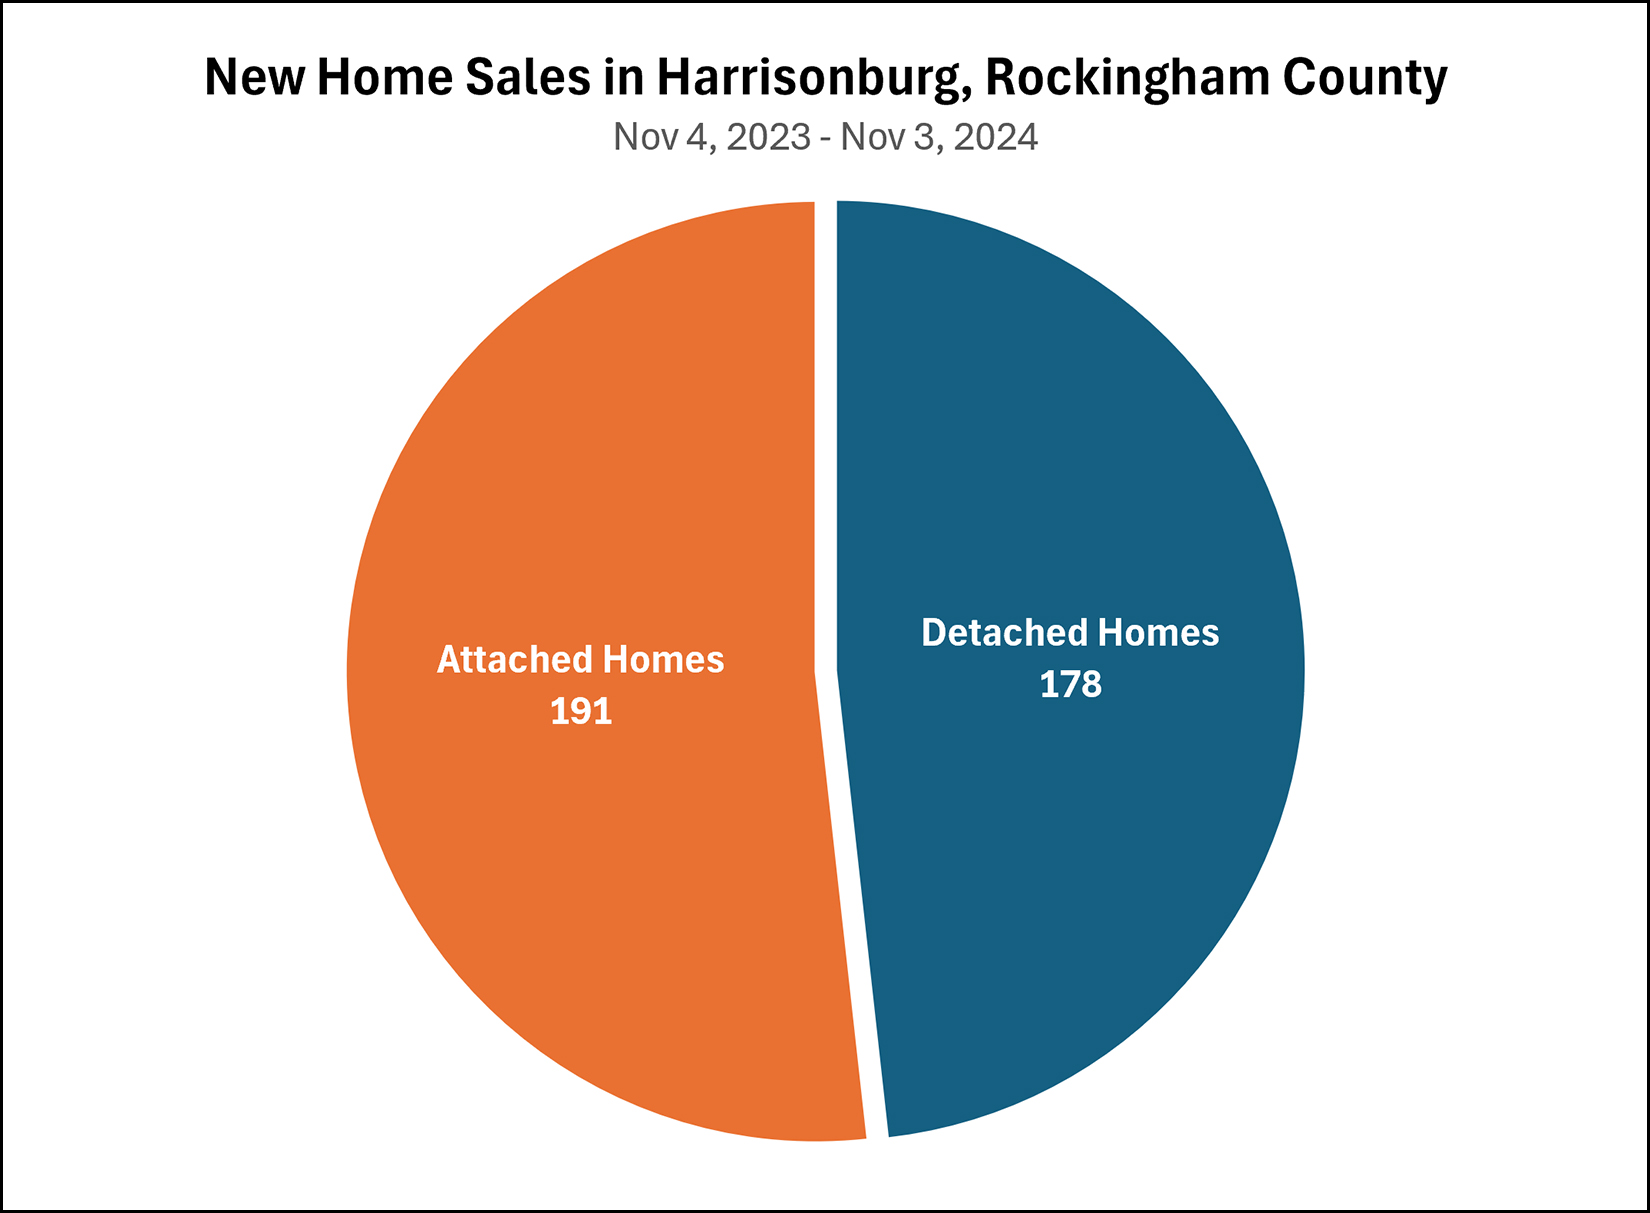 Most buyers of new homes in Harrisonburg and Rockingham County are buying attached homes... though just barely. 52% of new home buyers (191) bought attached homes over the past year 48% of new home buyers (178) bought detached homes over the past year Two reasons come to mind as to why we are seeing just as many (or slightly more) buyers buying new attached homes as detached homes... [1] It's what the builders are building. [2] The price point of attached homes is more affordable. Here's how the median sales price of detached and attached homes compare over the past 12 months... Detached Homes = Median Sales Price of $406,250 ($210/SF) Attached Homes = Median Sales Price of $328,955 ($198/SF) Moving forward, I think both of these dynamics (what is being built, price of each) will cause plenty of future buyers of new homes to be buying townhouses. Who knows... within a few years we might be seeing 60% to 70% of new home buyers buying attached homes instead of detached homes. (Attached Homes = townhouses, duplexes, condos) | |
Fewer And Fewer Resale, Detached, Homes Selling In City Of Harrisonburg |
|
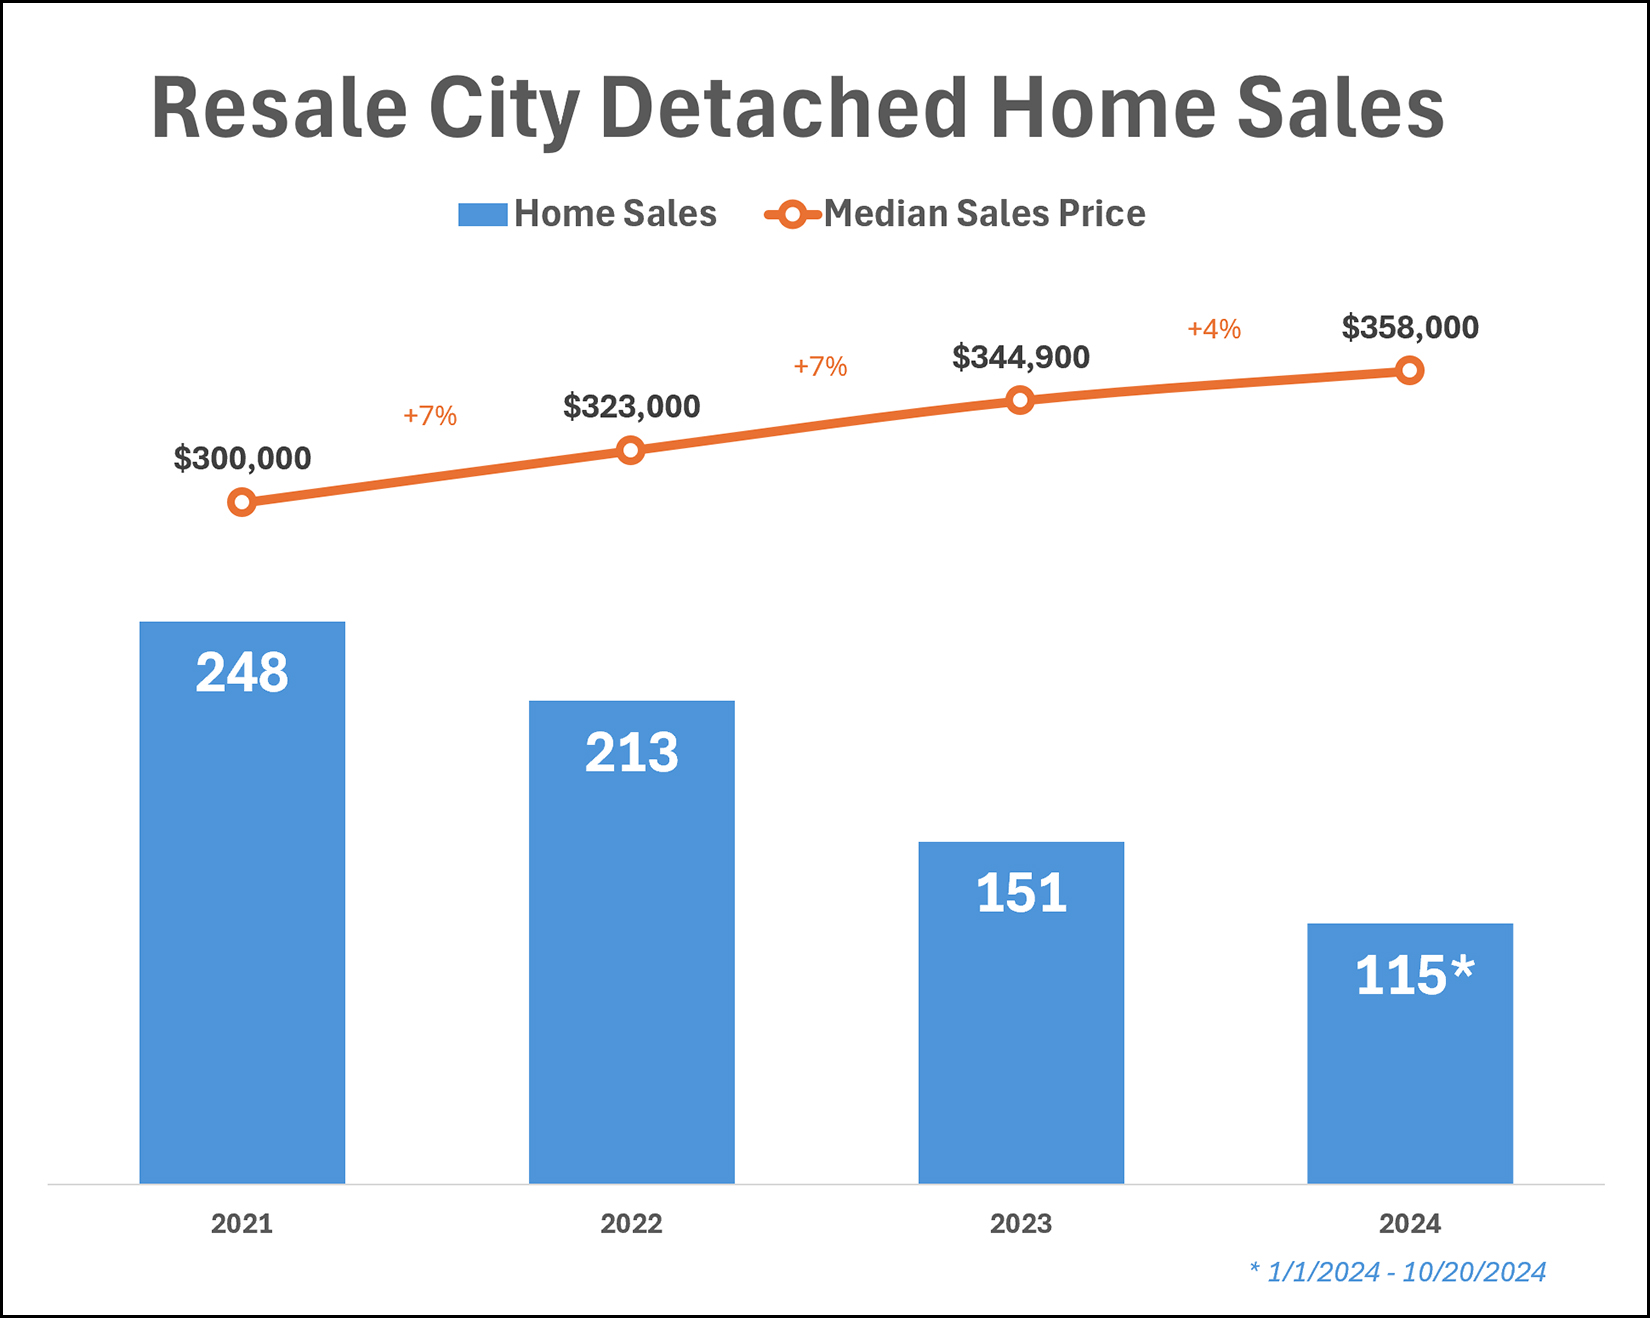 Just slicing and dicing the data one more time here... this is looking at only the City of Harrisonburg, only resale homes, and only detached homes -- no duplexes, townhomes or condos. A few things to note... We are seeing a steady decline in the number of these homes selling per year over the past three years. The 2024 column (115) is only through yesterday -- so we'll see that number rise by the end of the year, but it's not likely we will end up seeing another decline in annual, existing, detached City home sales this year. The median sales price of these homes keeps on rising... after a 7% increase in 2022 and 2023, the median sales price increased slightly less (4%) thus far in 2024. As I have mentioned quite a few times, I believe this reduction in the number of buyers buying existing, detached, City homes is a result of a reduction in the number of sellers willing to sell their existing, detached, City homes. | |
Competition Is Often Fierce For City Homes! |
|
 We have seen fewer, and fewer, and fewer home sales in the City of Harrisonburg over the past few years. But this is almost entirely an issue of not enough sellers being willing to sell -- not an issue of not enough buyers wanting to buy. The result is that in the current market, when a City home is listed for sale... there is often a LOT of interest in said home. This is great for home sellers in the City of Harrisonburg...
This is not quite as great for home buyers in the City of Harrisonburg...
But alas, the City of Harrisonburg remains a popular place to live. Until and unless we start to see some new construction (for sale) housing in the City of Harrisonburg, we will likely still see lots of competition for City homes when they are offered for sale. | |
Contract Activity Continues To Track Slower This Year Than Last In September |
|
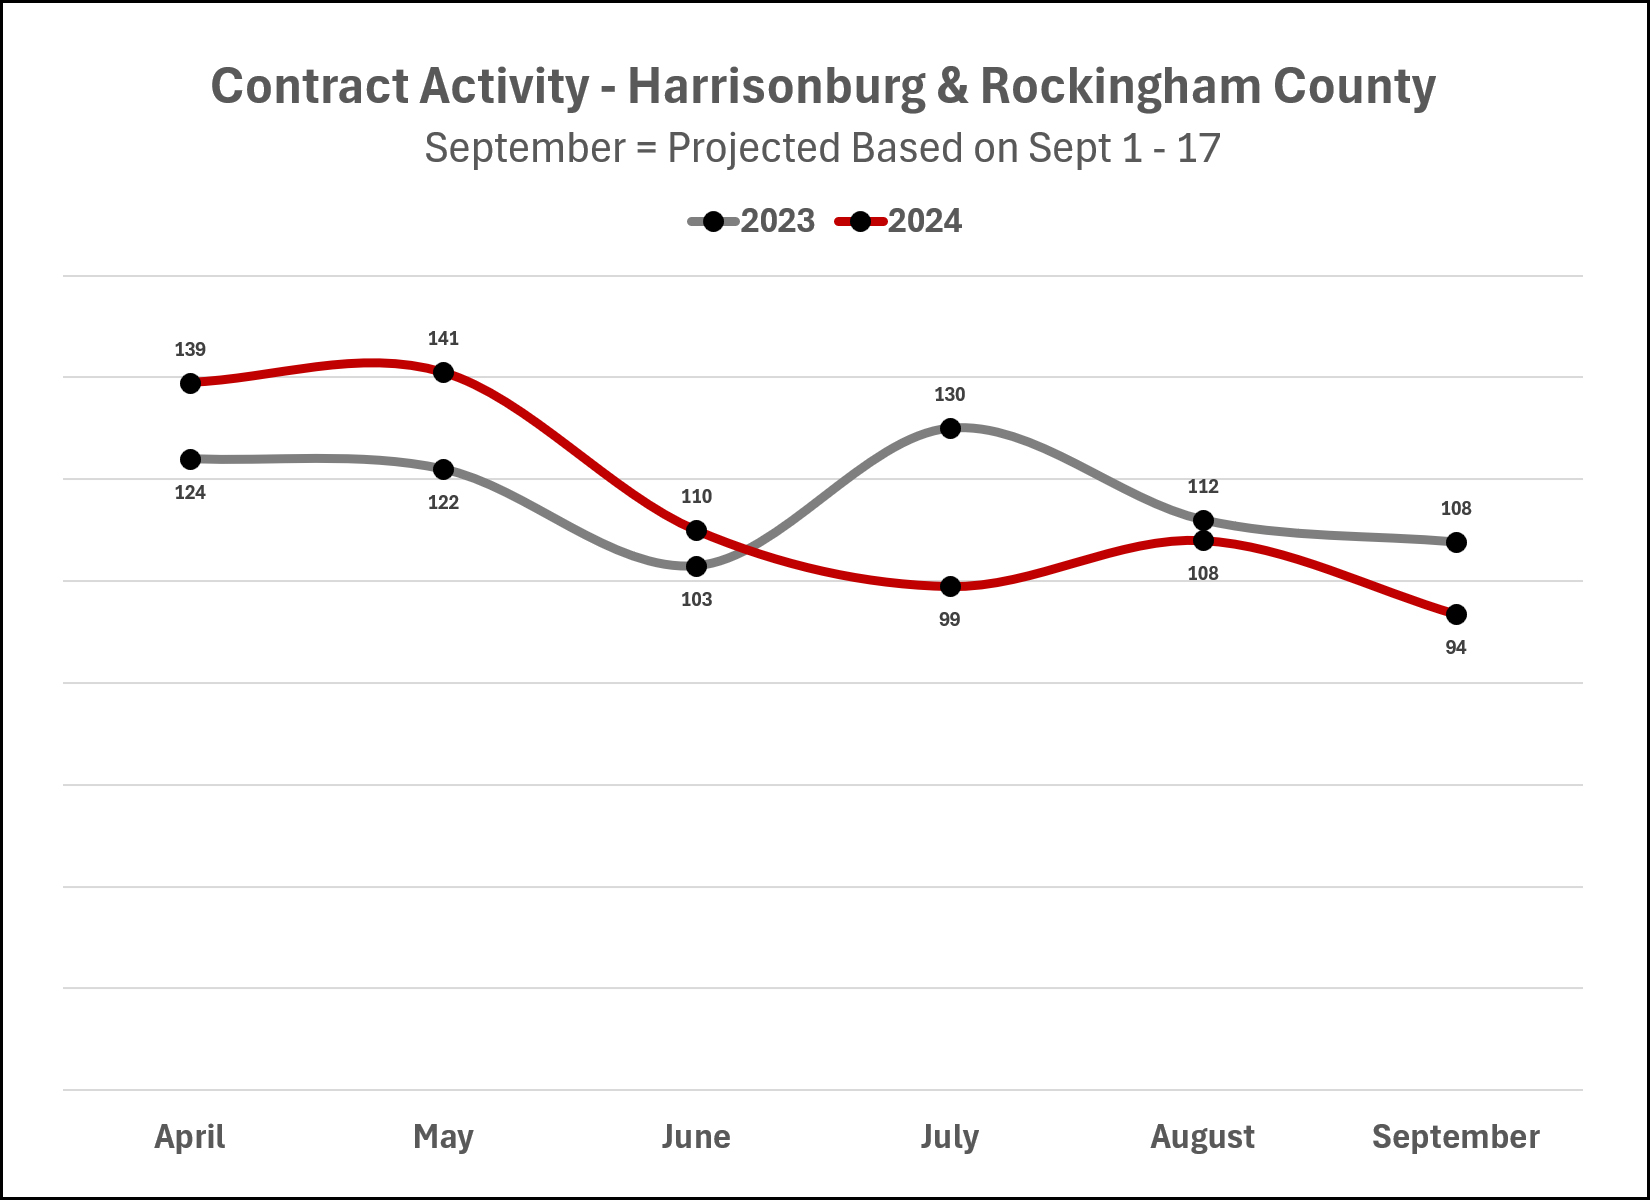 The graph above shows contract activity per month... comparing 2023 (grey line) to 2024 (red line) for each month between April and September. For the first three months (April through June) we were seeing more contracts signed this year than last. For the most recent three months (July through September) we have been seeing fewer contracts signed this year than last. The September data points are projected totals for the month based on contract activity between September 1 and 17 of this year and last year. Will the second half of September surprise us? Will we see an uptick in contract activity? What has been keeping contract activity over the past few months? Will changes in mortgage interest rates over the next few weeks or months impact contract activity? Stay tuned to see how the Fall housing market starts to shape up in Harrisonburg and Rockingham County. | |
Contract Activity Cools Slightly After Strong Summer Surge in Home Sales in Harrisonburg and Rockingham County |
|
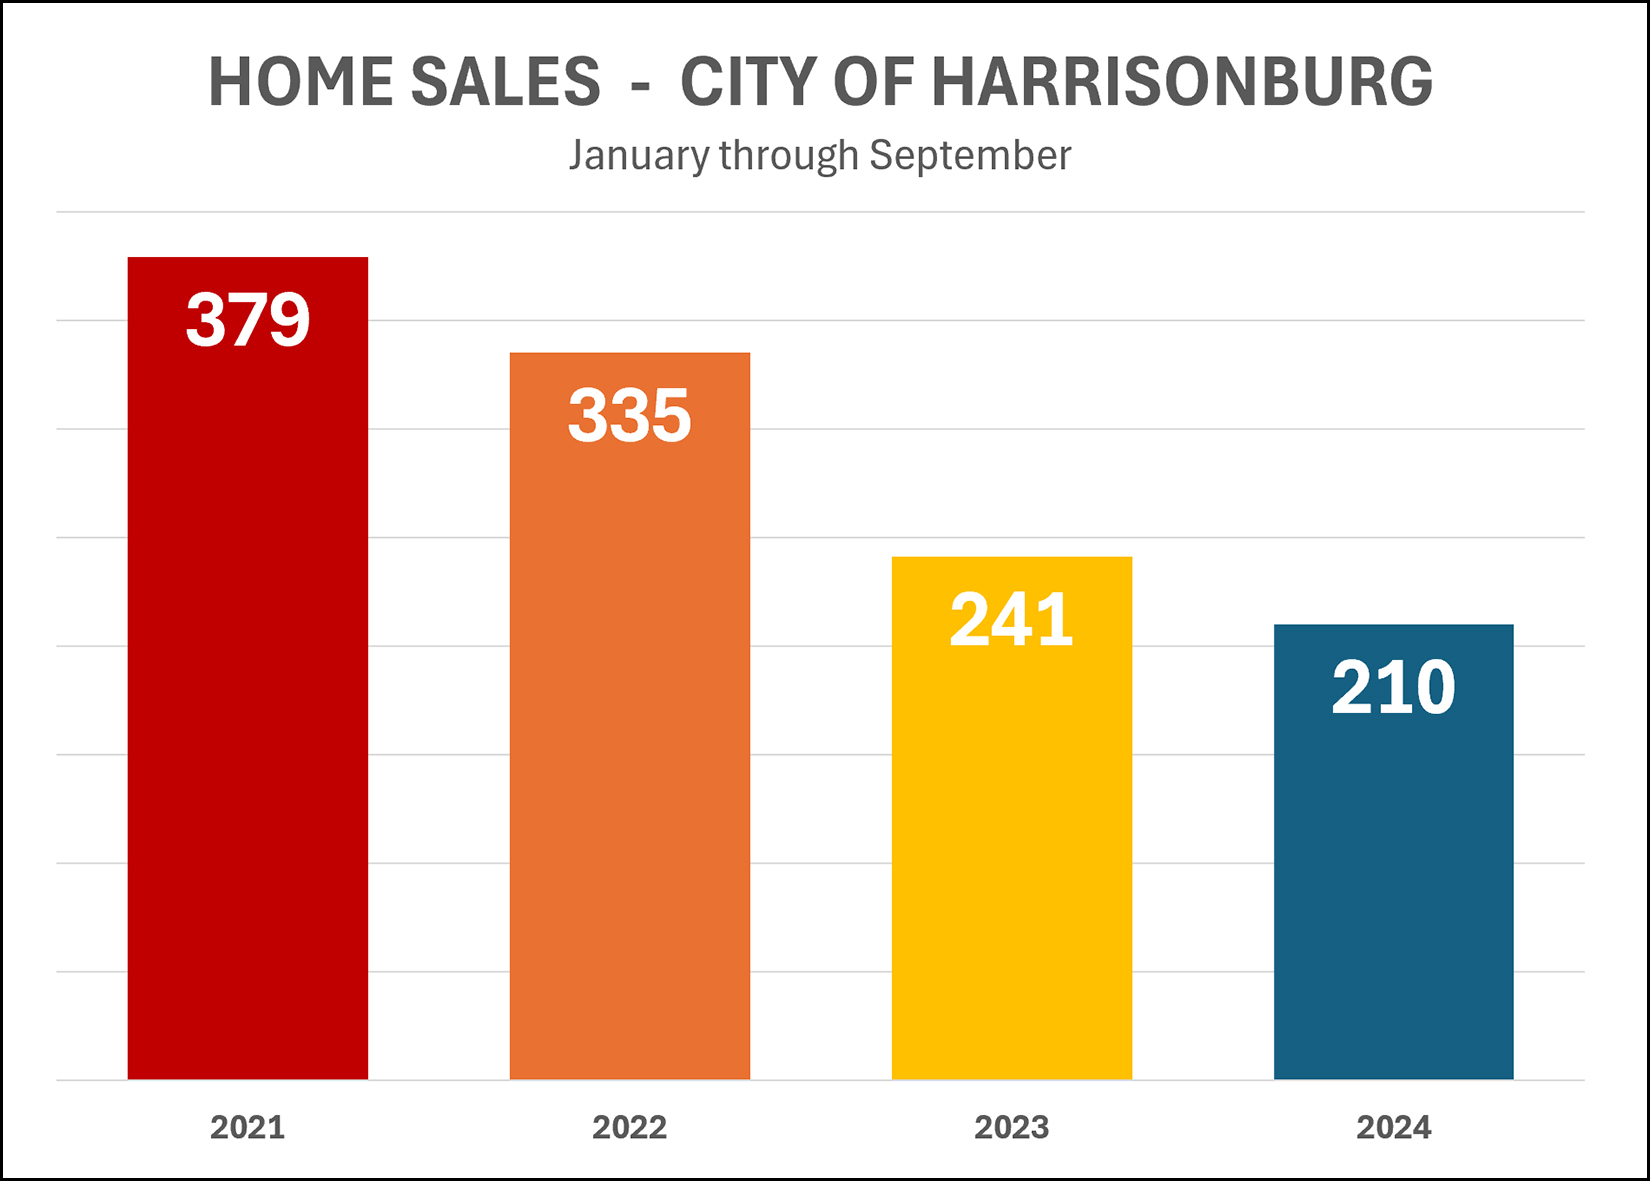
 Happy Monday Morning, Friends! We are just six days from the first day of Fall... and it's starting to feel like it! High temperatures are peaking in the 70's instead of the 80's this week... the leaves are starting to change colors... and we're back to having fun watching JMU football games...  My niece, Sofia, just started college at UNC Charlotte, so Luke and I were excited to go down to visit her and to take in the first JMU football game of the season. Here's looking forward to some further fun as the season continues! Go Dukes!!! Before we dive into the real estate data... as one last reminder of summer... I'm giving away a $50 gift card to Sweet Frog. Yes, I know, we can enjoy Sweet Frog all year round, but it's particularly tasty on a warm summer evening. So, if you're a fan of Sweet Frog frozen yogurt (and all the toppings!) click here to enter the gift card. And now, on to the latest in our local real estate market... 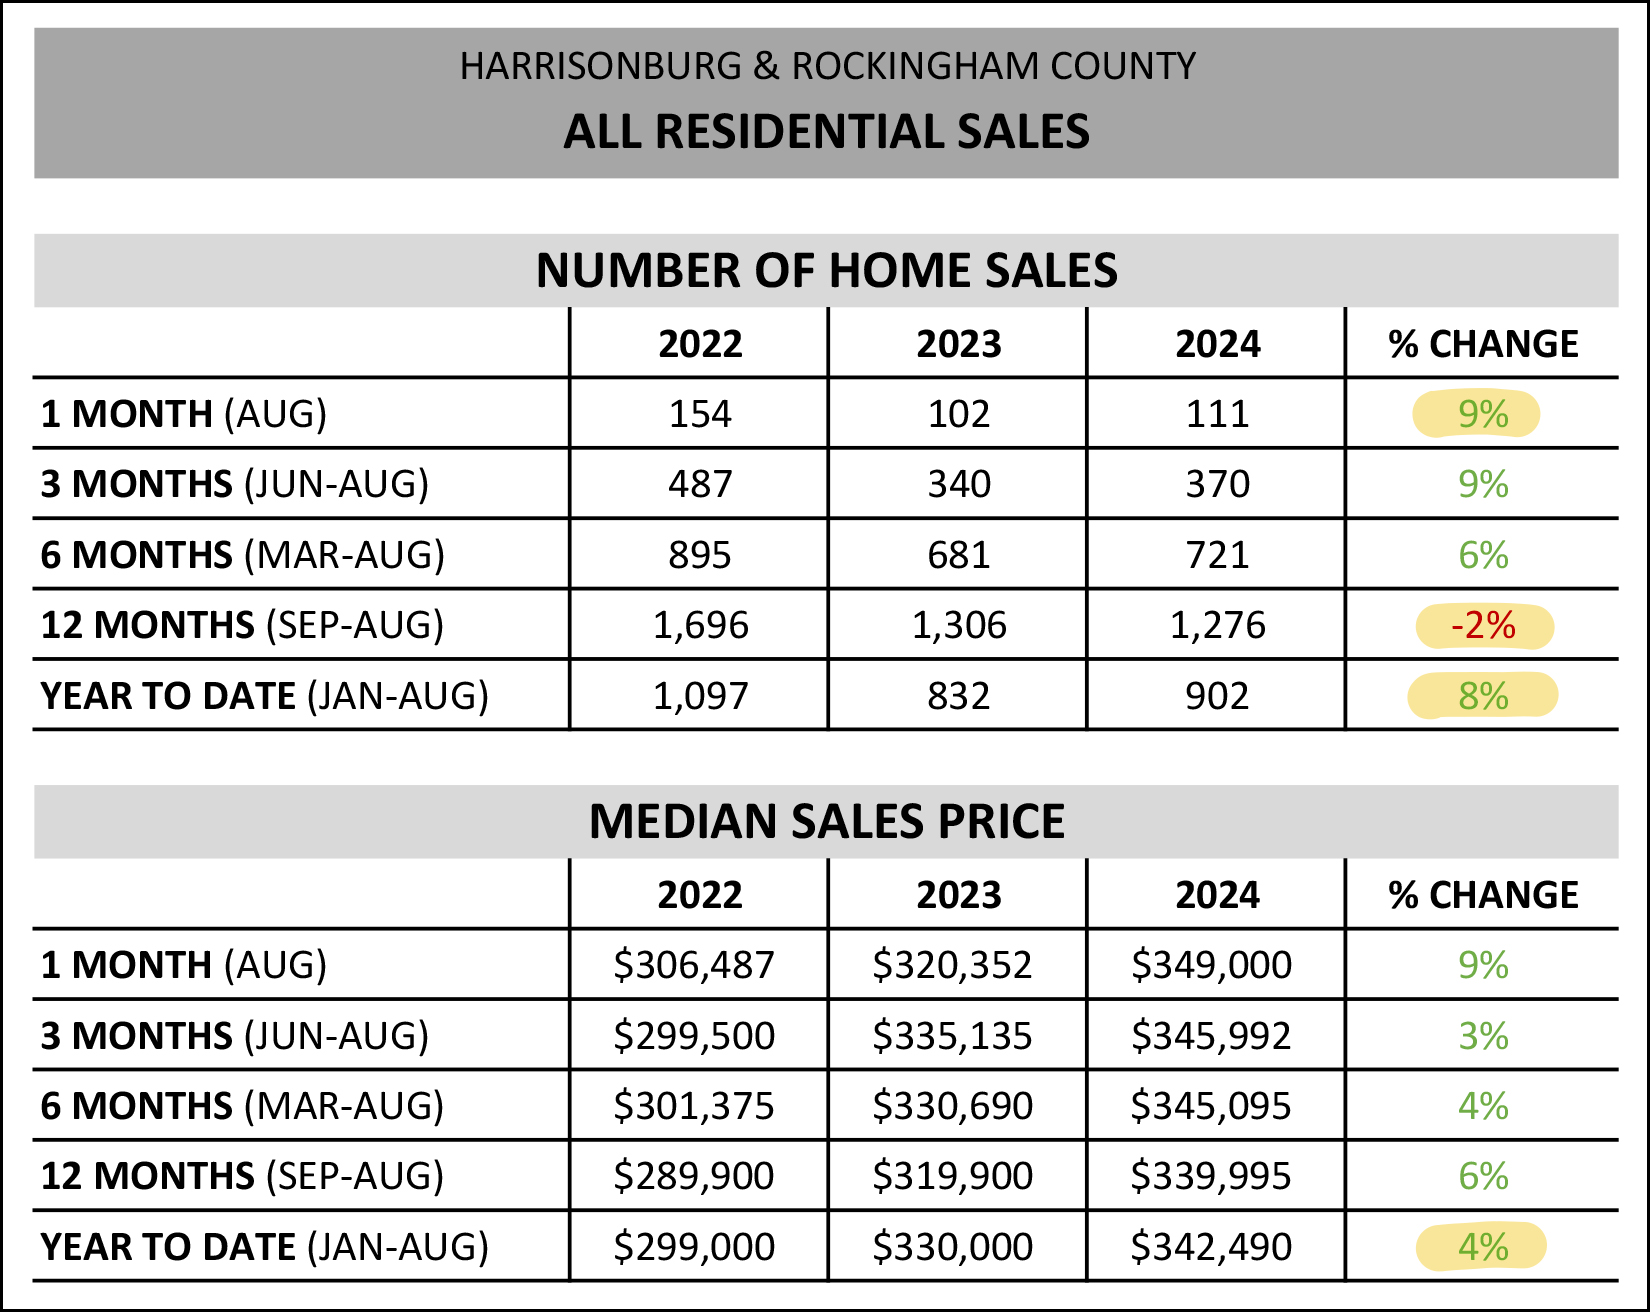 Above you'll see a basic overview of the amount of homes that are selling these days, and the prices at which they are selling. A few things to note... # Sales: We saw more home sales this August than last (+9%) and even though we've seen fewer home sales over the past 12 months compared to the prior 12 months (-2%) we are seeing an increase (+8%) in the first eight months of 2024 as compared to the same timeframe last year. So... more homes are selling this year than sold last year, and... Prices: In every time horizon I explored above (1M, 3M, 6M, 12M, YTD) I found an increase in the median sales price. I'll focus in on the year to date number, however, where we see a 4% increase in the median sales price when looking at homes selling in the first eight months of this year (median of $342,490) compared to the first eight months of last year (median of $330,000). As we continue, we'll want to see how the performance of different market segments compare to this market wide 4% increase in the median sales price. First up, detached home sales... 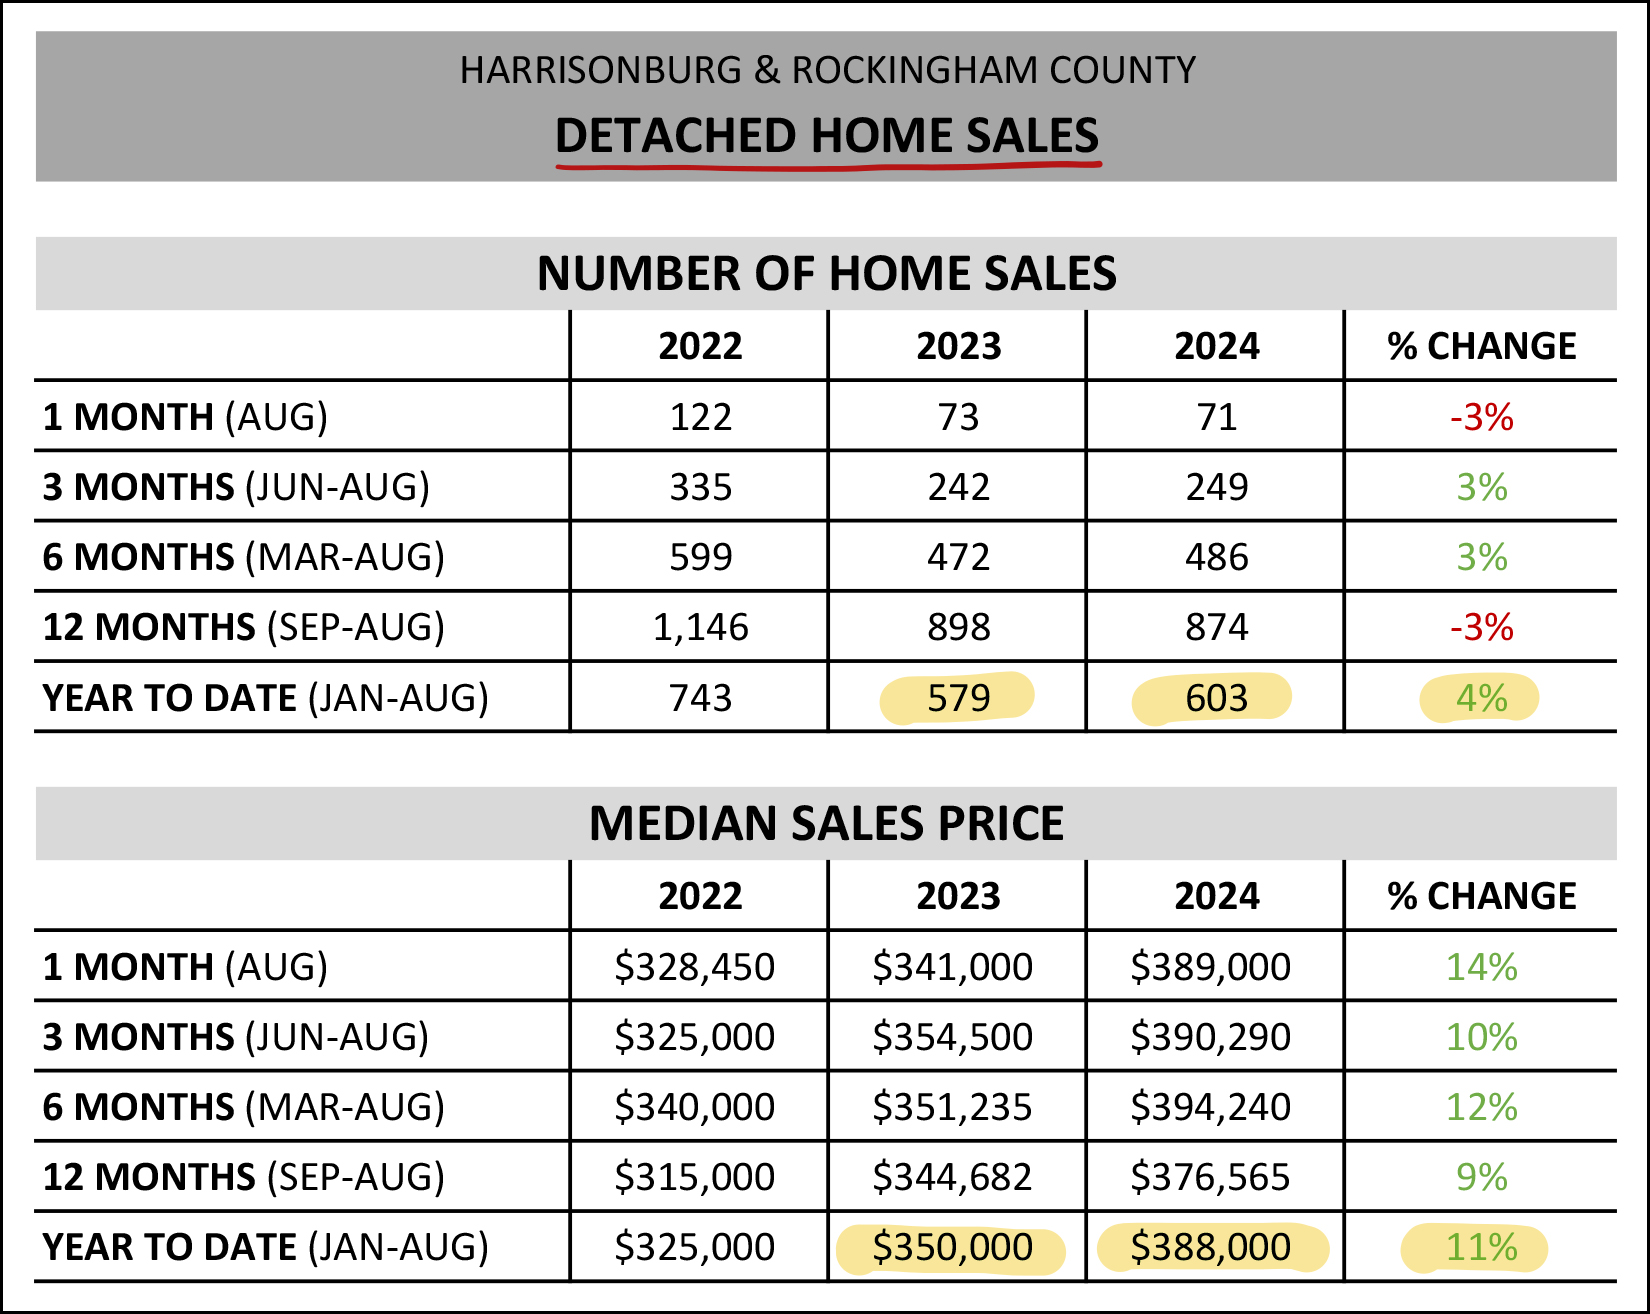 Interestingly... [1] Despite an 8% market-wide increase in home sales thus far in 2024... we're only seeing a 4% increase in the number of detached homes that are selling. [2] Despite only a 4% increase in the median sales price in the overall market (detached + attached) we're actually seeing an 11% increase in the median sales price of detached homes in 2024. As we continue through this report, you'll note a variety of charts and graphs that indicate that price growth is slowing to only 4%... but that is the overall market, whereas detached home median sales prices still seem to be climbing more quickly than the overall market. Dialing in now on one specific geographic area... the City of Harrisonburg... 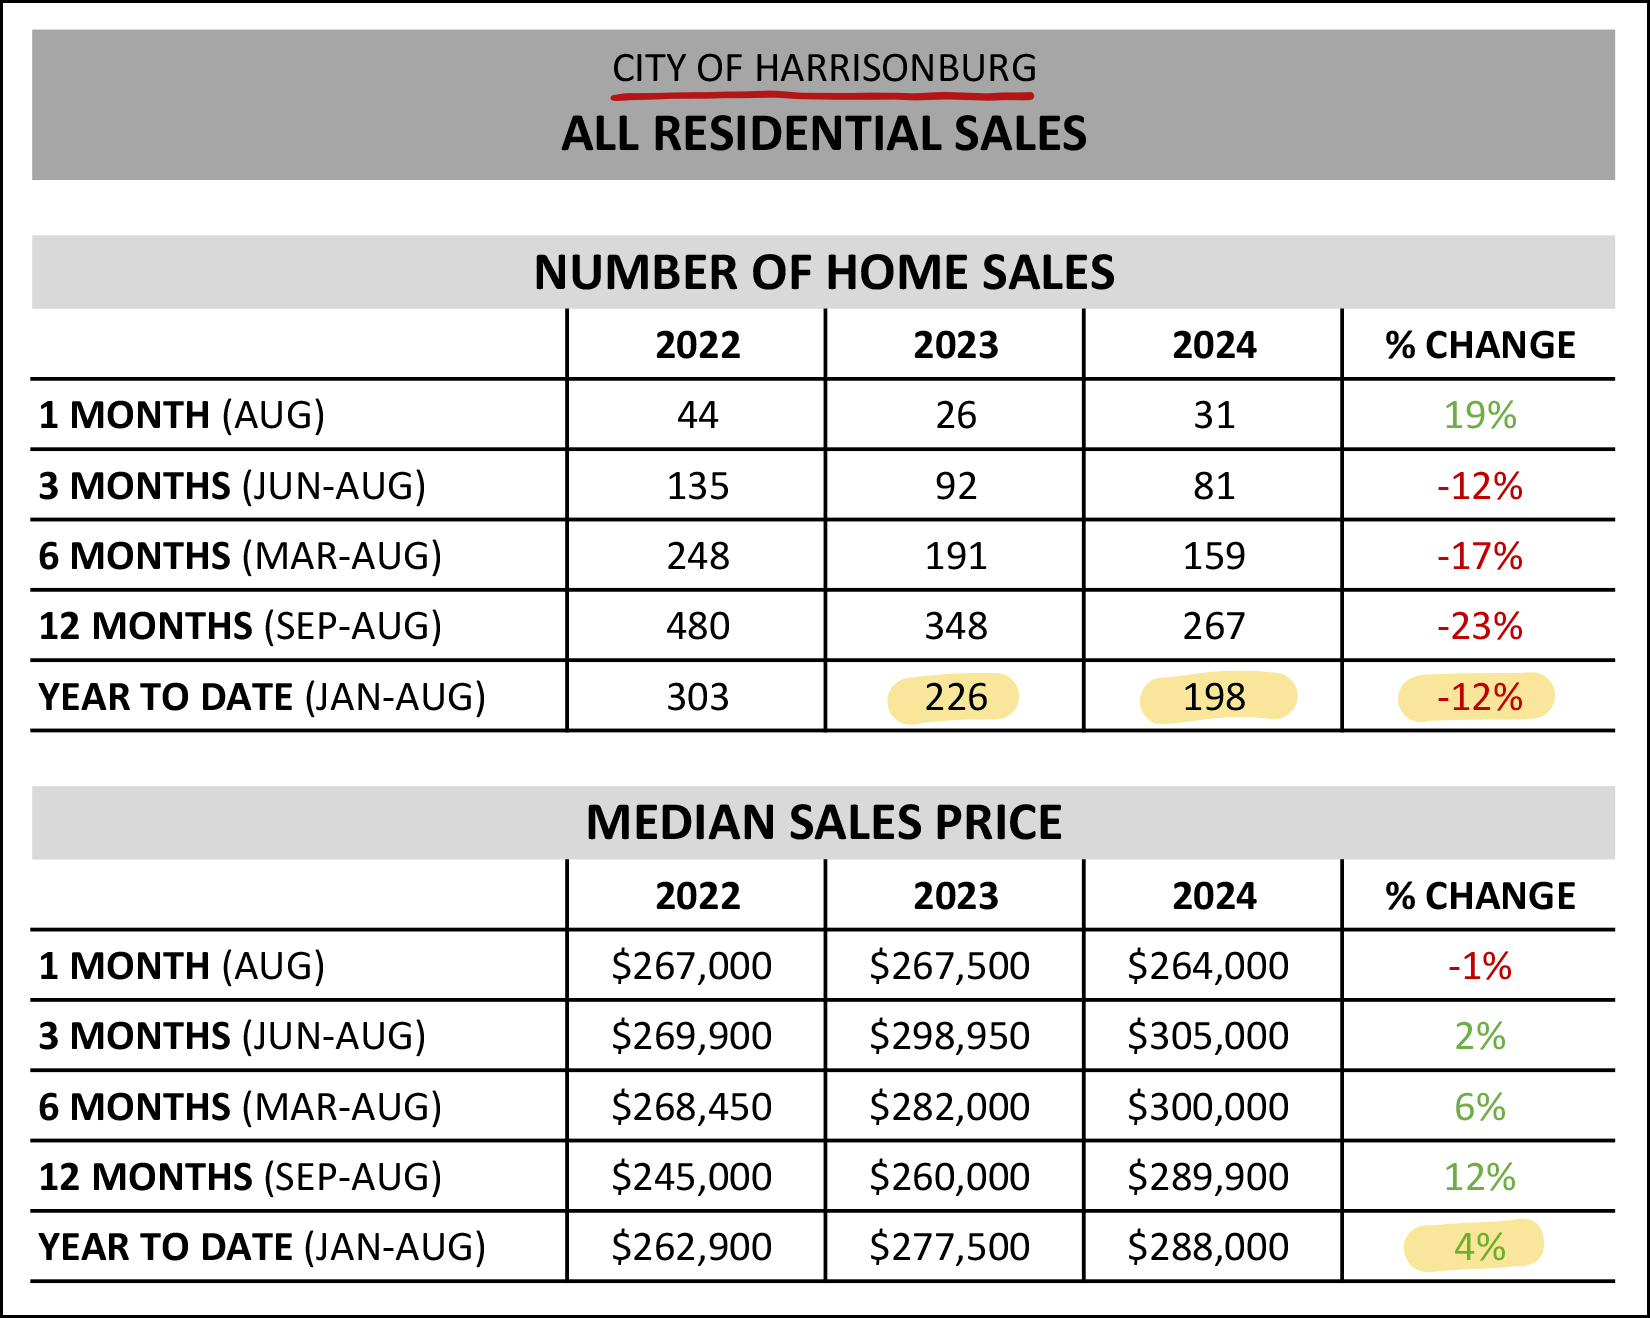 It has been increasingly difficult to find a house to buy in the City of Harrisonburg. As shown above, in the first eight months of 2022 we saw 303 home sales in the City, last year that dropped to 226 sales and this year only 198 sales. To be clear... this is almost entirely a supply side issue - there aren't enough property owners willing to sell their homes, and there isn't much new construction happening in the City these days. Despite that restriction in the market in the City of Harrisonburg, we are still seeing only a 4% increase in the median sales price when comparing the first eight months of this year to the first eight months of last year... and the median sales price in the City of Harrisonburg is still under $300K thus far in 2024. And how about out in Rockingham County? How are things going there? 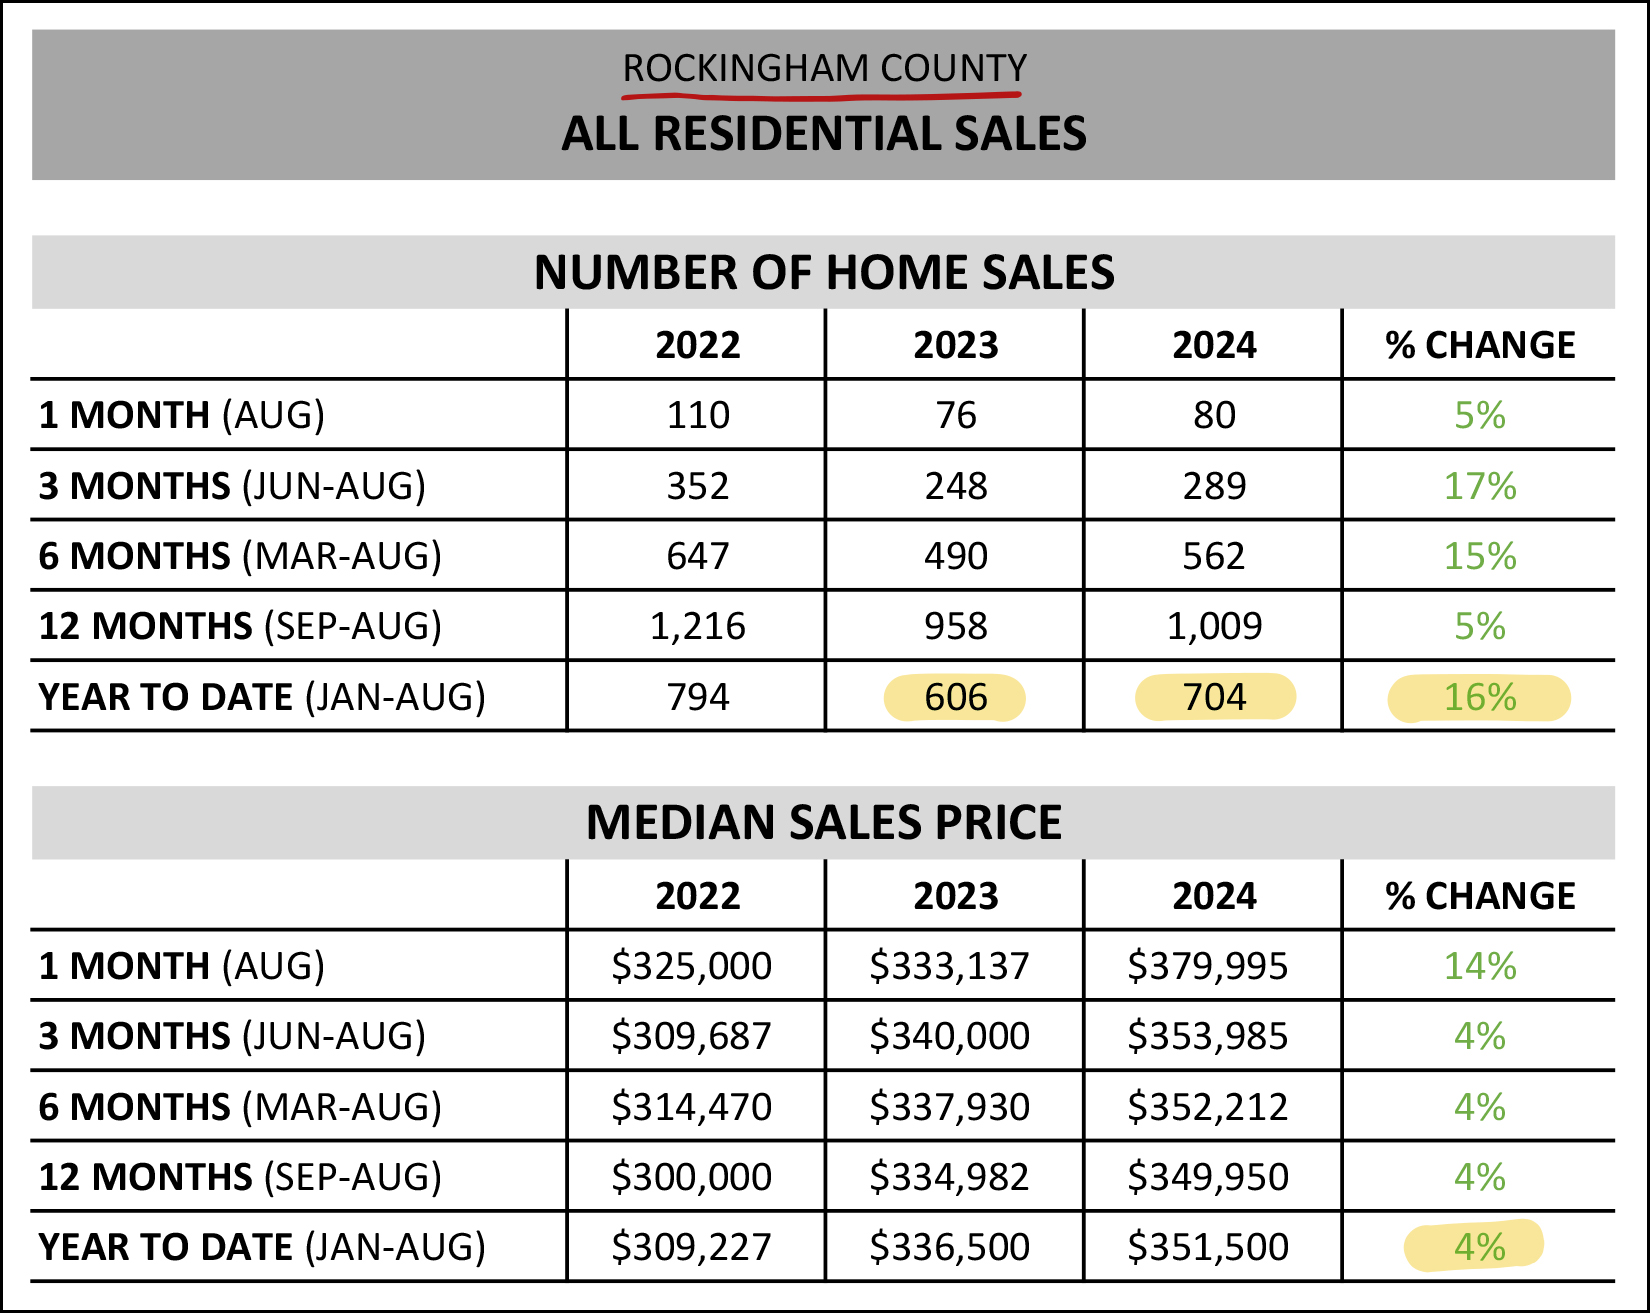 We are seeing a significant increase (+16%) in the number of homes selling in Rockingham County thus far in 2024 compared to in the same timeframe in 2023. You can't see it from the chart above, but a lot of that increase in the number of homes selling is a result of new homes being built in the County. Median prices, however, continue to rise in Rockingham County at that same 4% in the first eight months of 2024 compared to the same timeframe last year. New home construction... it's on the rise? Yes, indeed, it is... 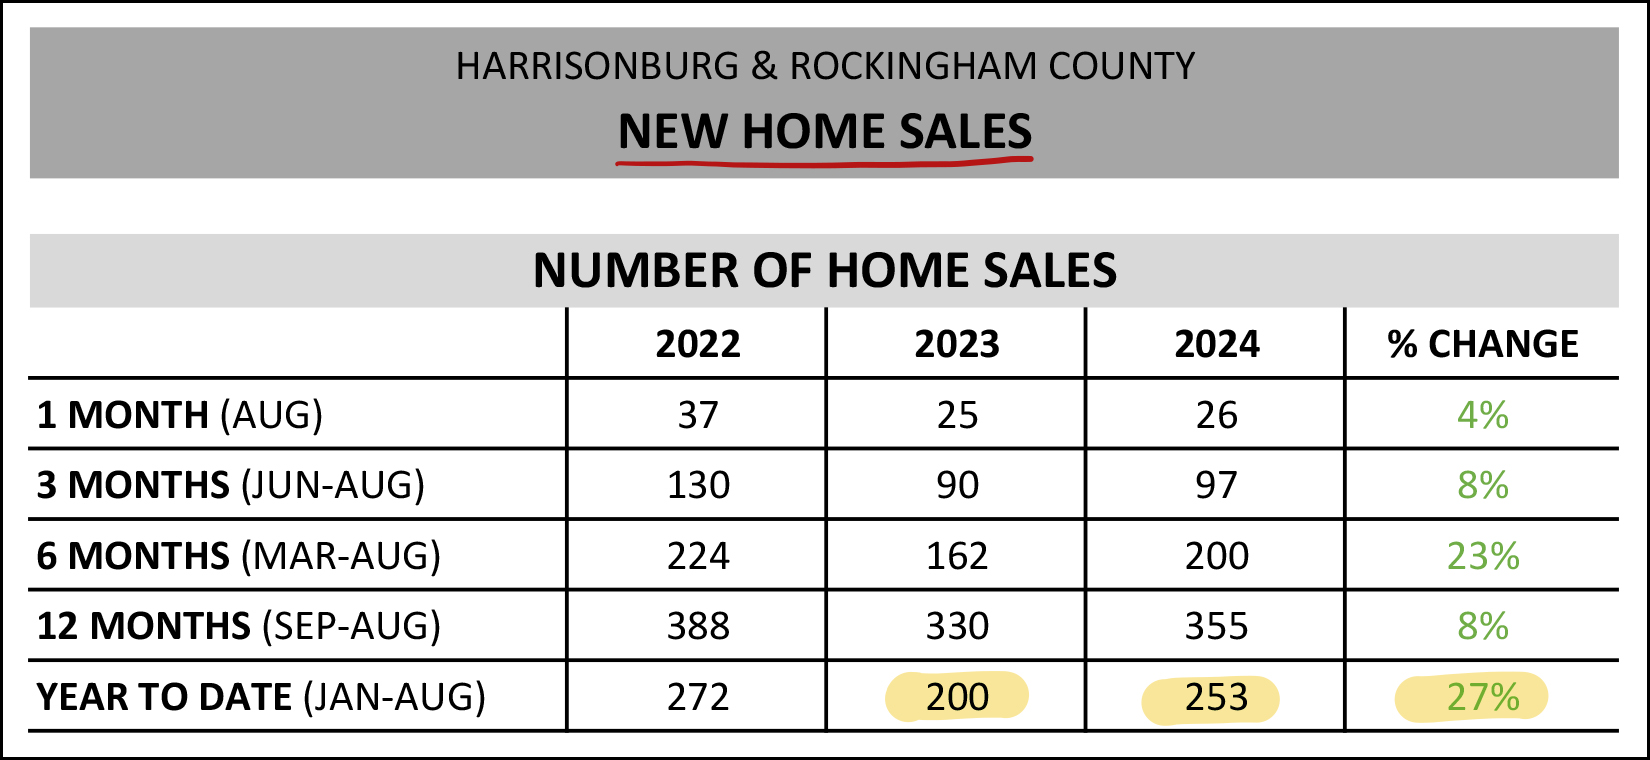 We've seen 253 new home sales thus far in 2024... which is a 27% increase from the first eight months of 2023... though interesting, it's slightly fewer than we saw two years ago, in 2022. I expect we will continue to see quite a bit of new home construction over the next few years... and we need it... as we continue to see high levels of demand from home buyers. So, if we're seeing a 27% increase in new home sales, how about those existing home sales? Are they also increasing at that pace? Ummm... nope... 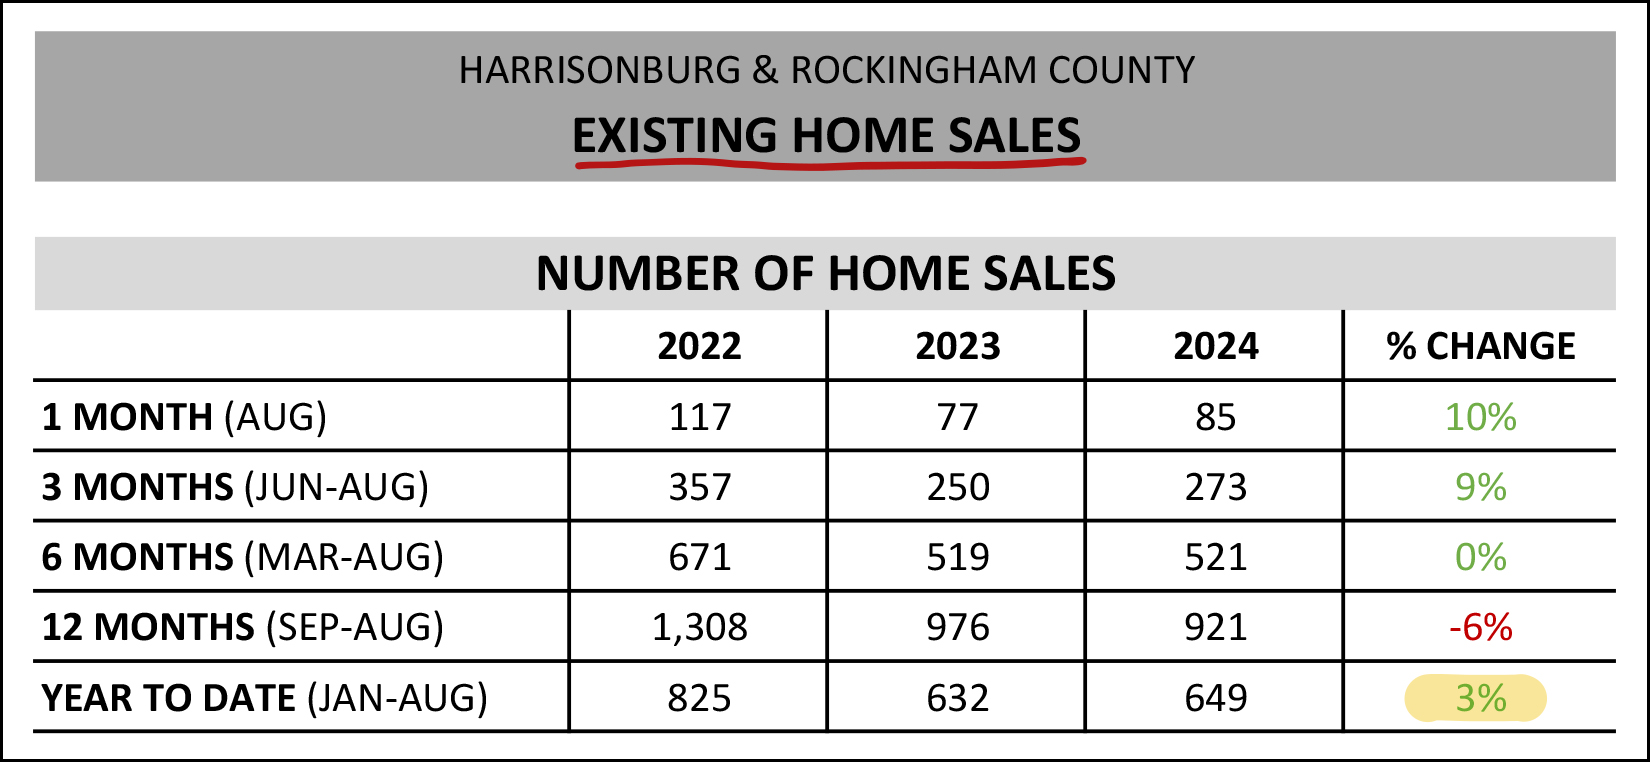 In contrast to the 27% increase in new home sales thus far in 2024... we have only seen a 3% increase in existing home sales. Lots and lots of homeowners are just staying put and not selling their homes. Now, let's get to some of the graphs, to get a clearer picture of some of the trends we have been discussing... 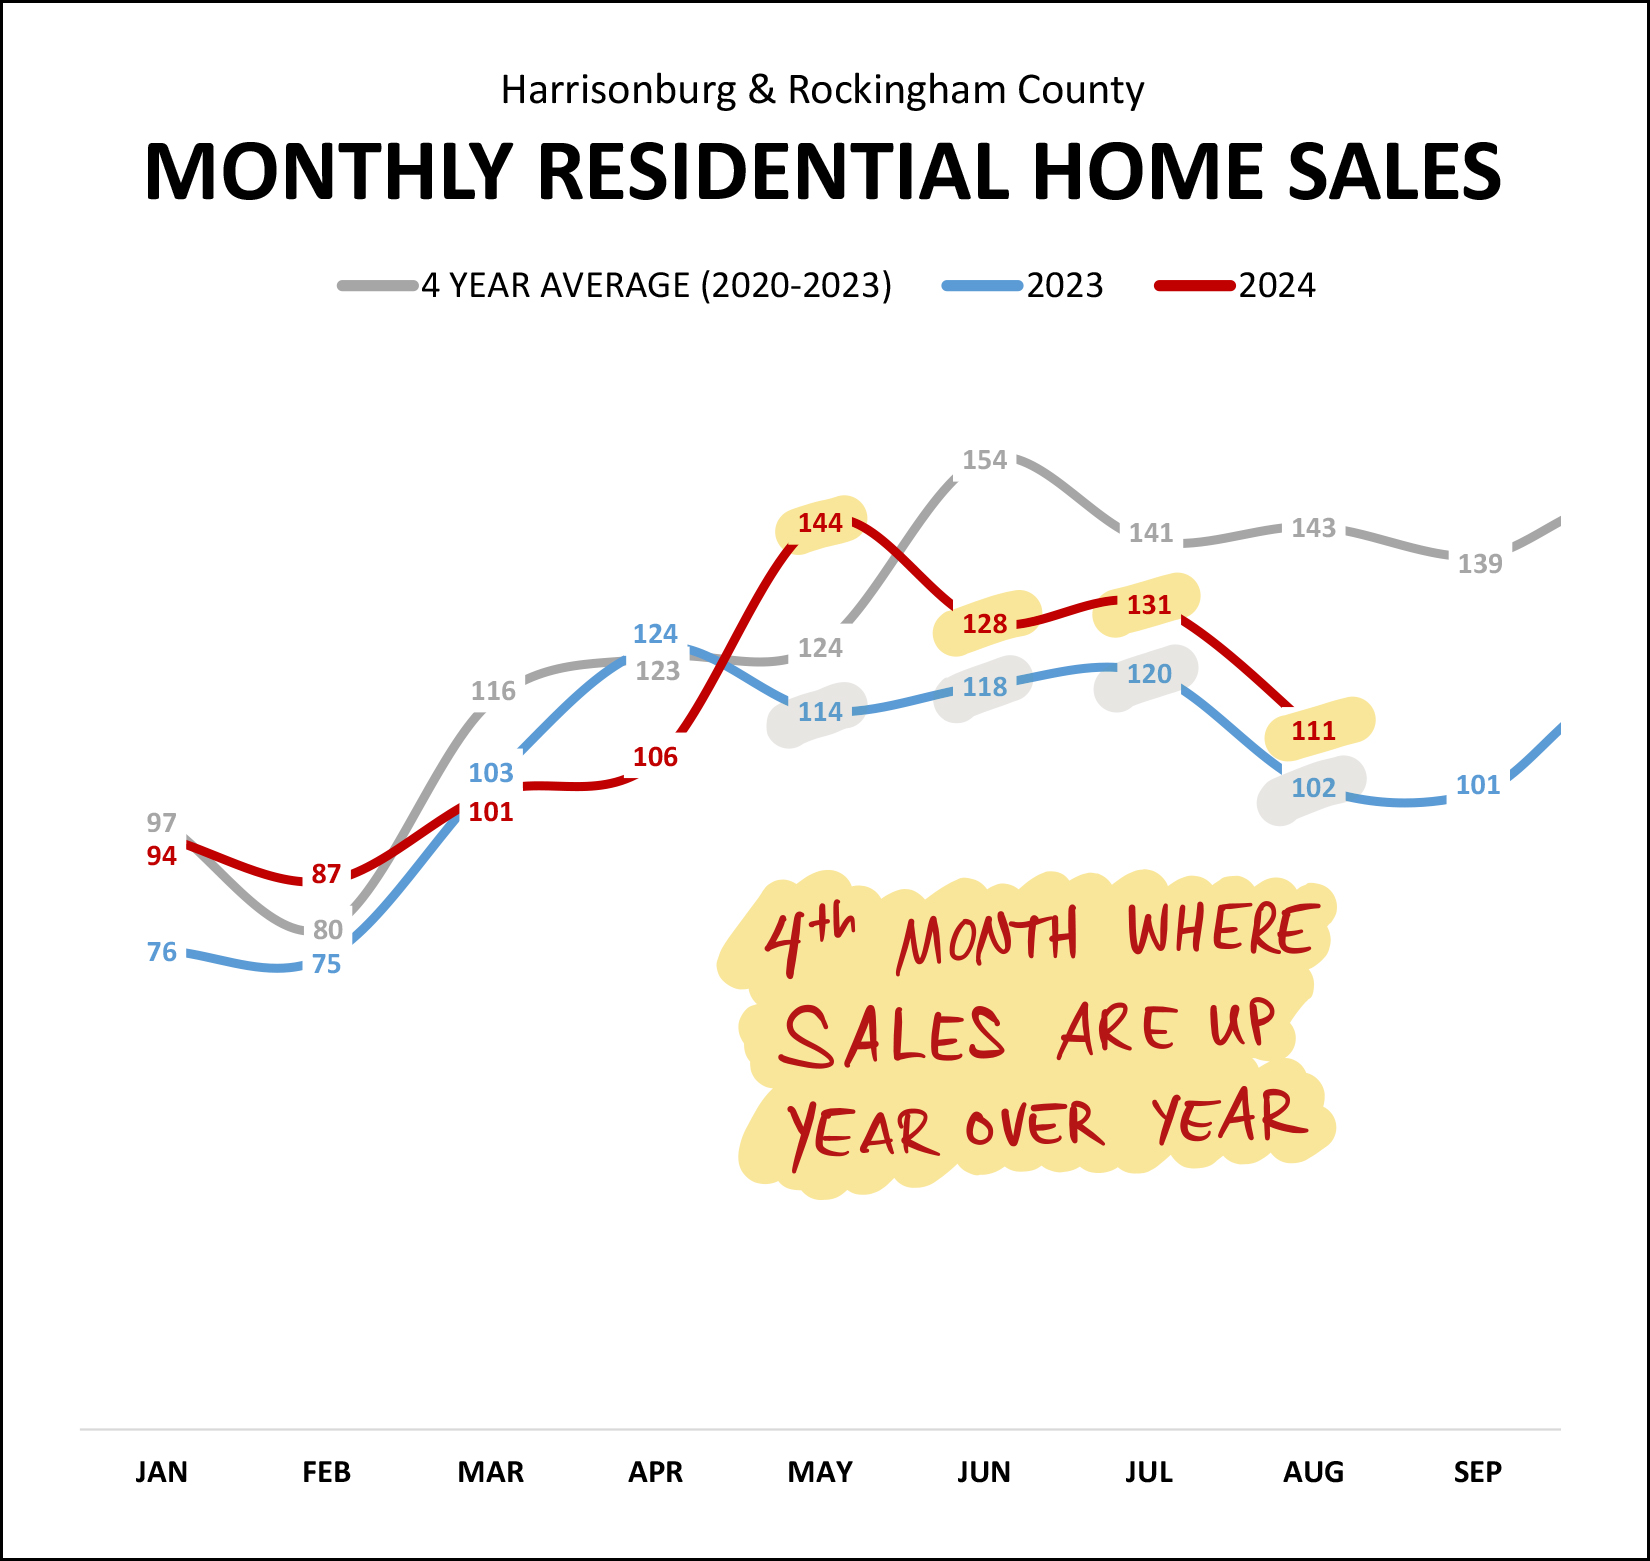 August marks the fourth month in a row with more home sales (closed home sales) than during the same month last year. This has been an active summer of real estate closings... though homes often go under contract a month or two before they make it to closing... so this busy summer of real estate closings was the result of a busy late Spring and early Summer of contracts, which we'll see shortly. To put this year in the context of the past two years... 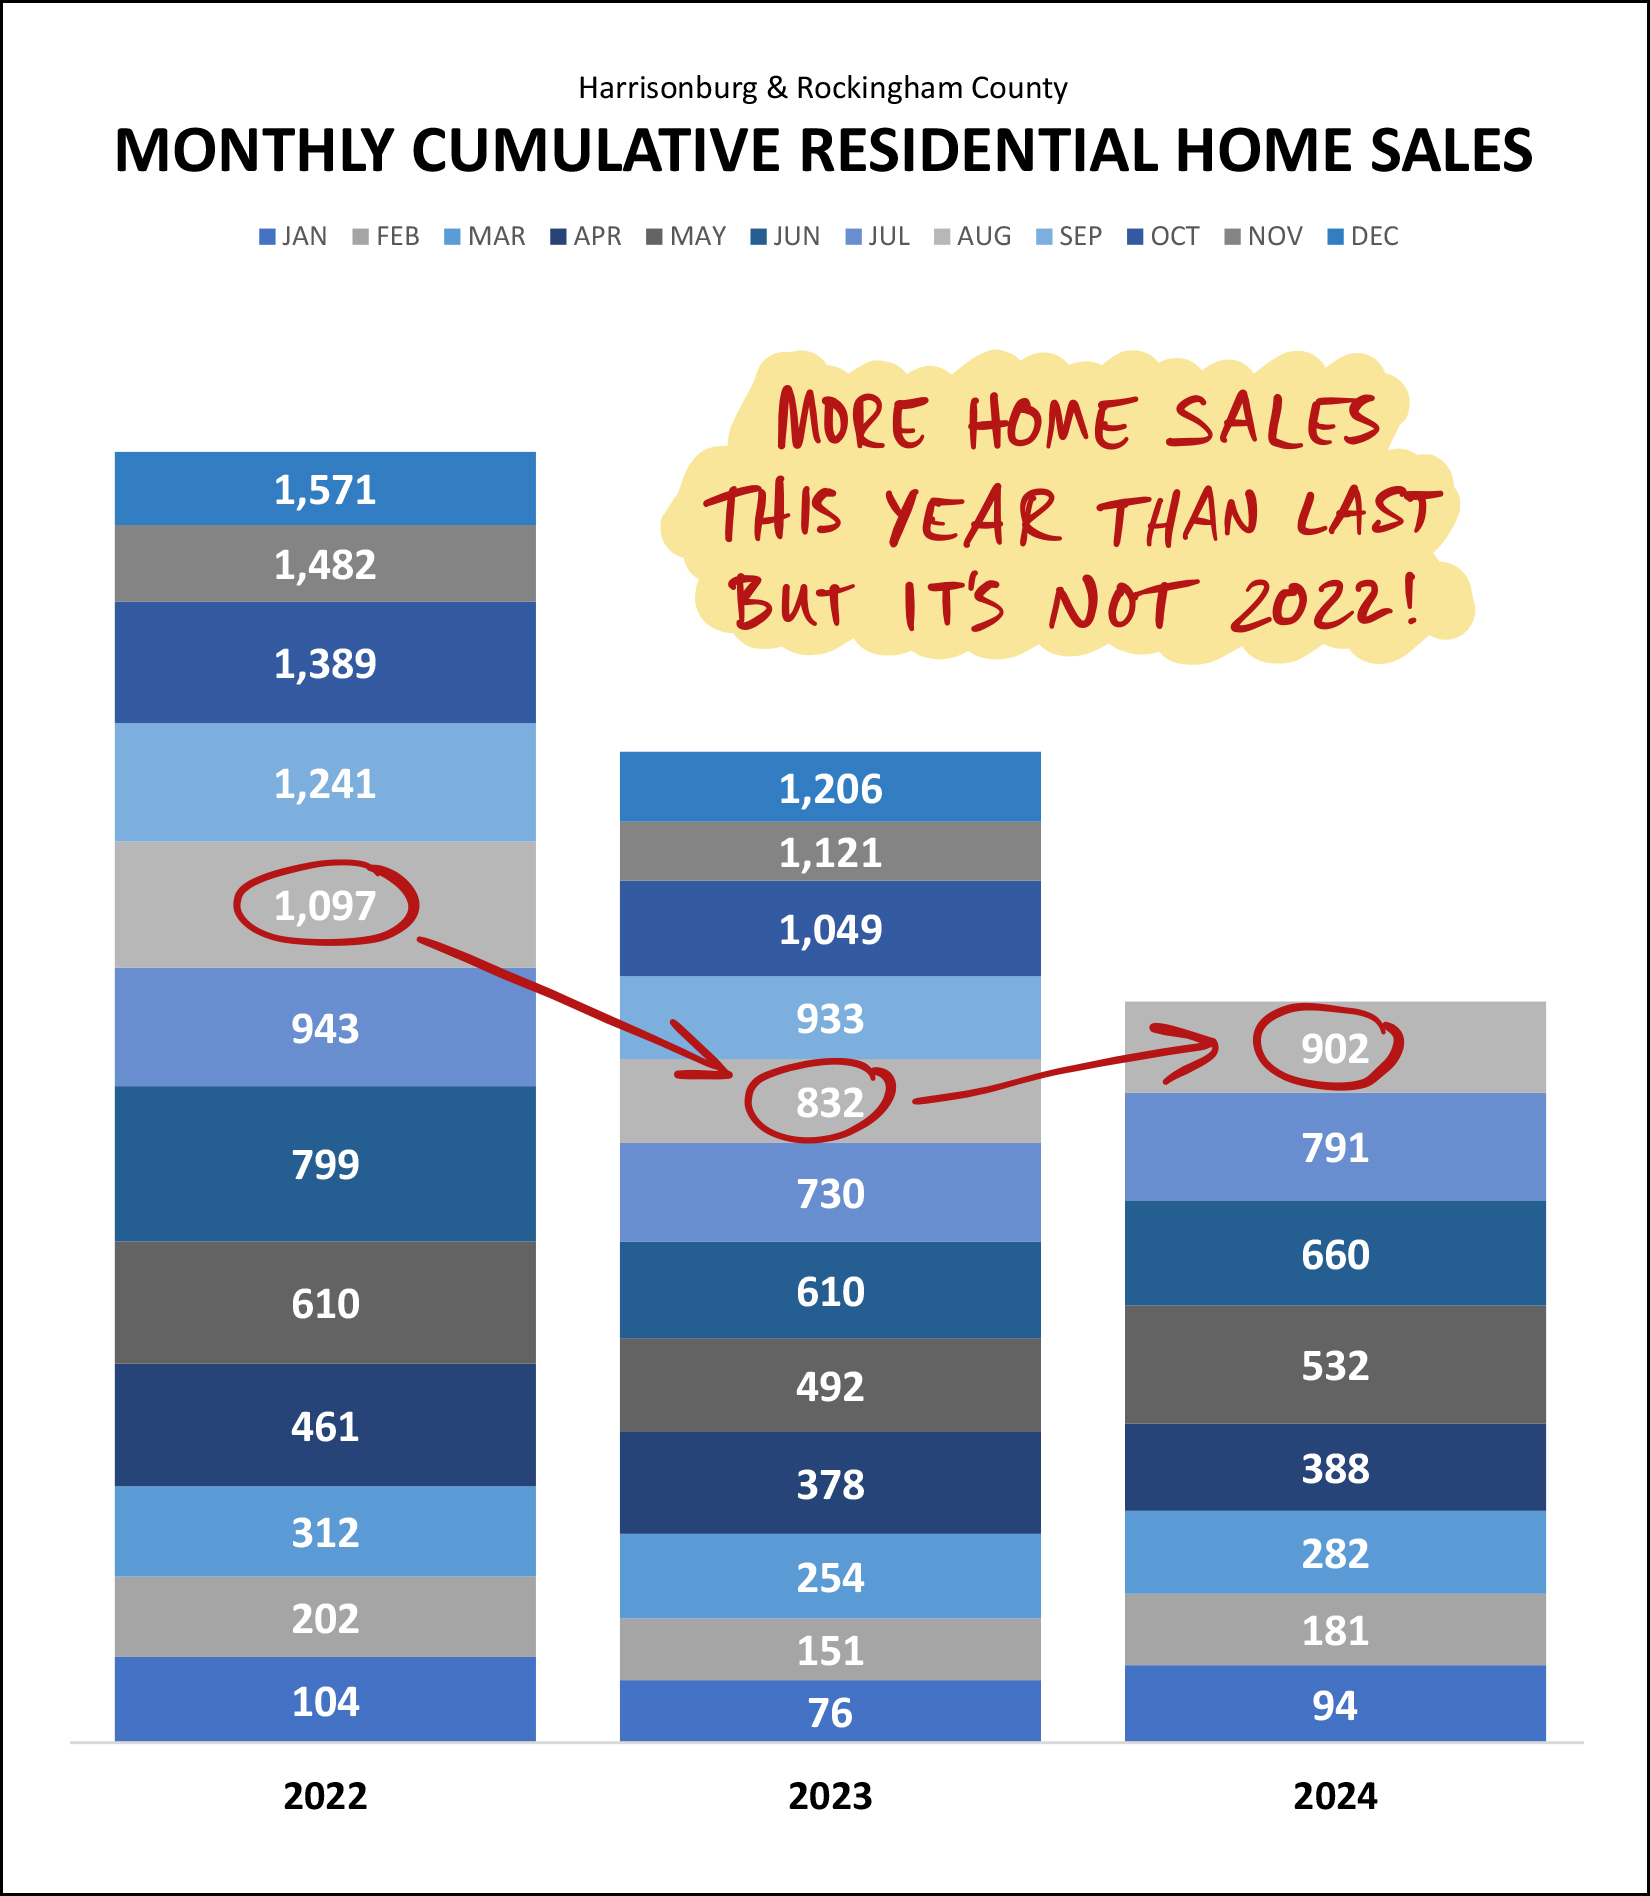 Home sales in 2024 are definitely exceeding 2023 levels... but pale in comparison to 2022. I expect we might see some further upward momentum in home sales later in 2024 if or when we see further relief in mortgage interest rates. More on that later. Here is an illustration of the two overall trends we're seeing right now in Harrisonburg and Rockingham County... 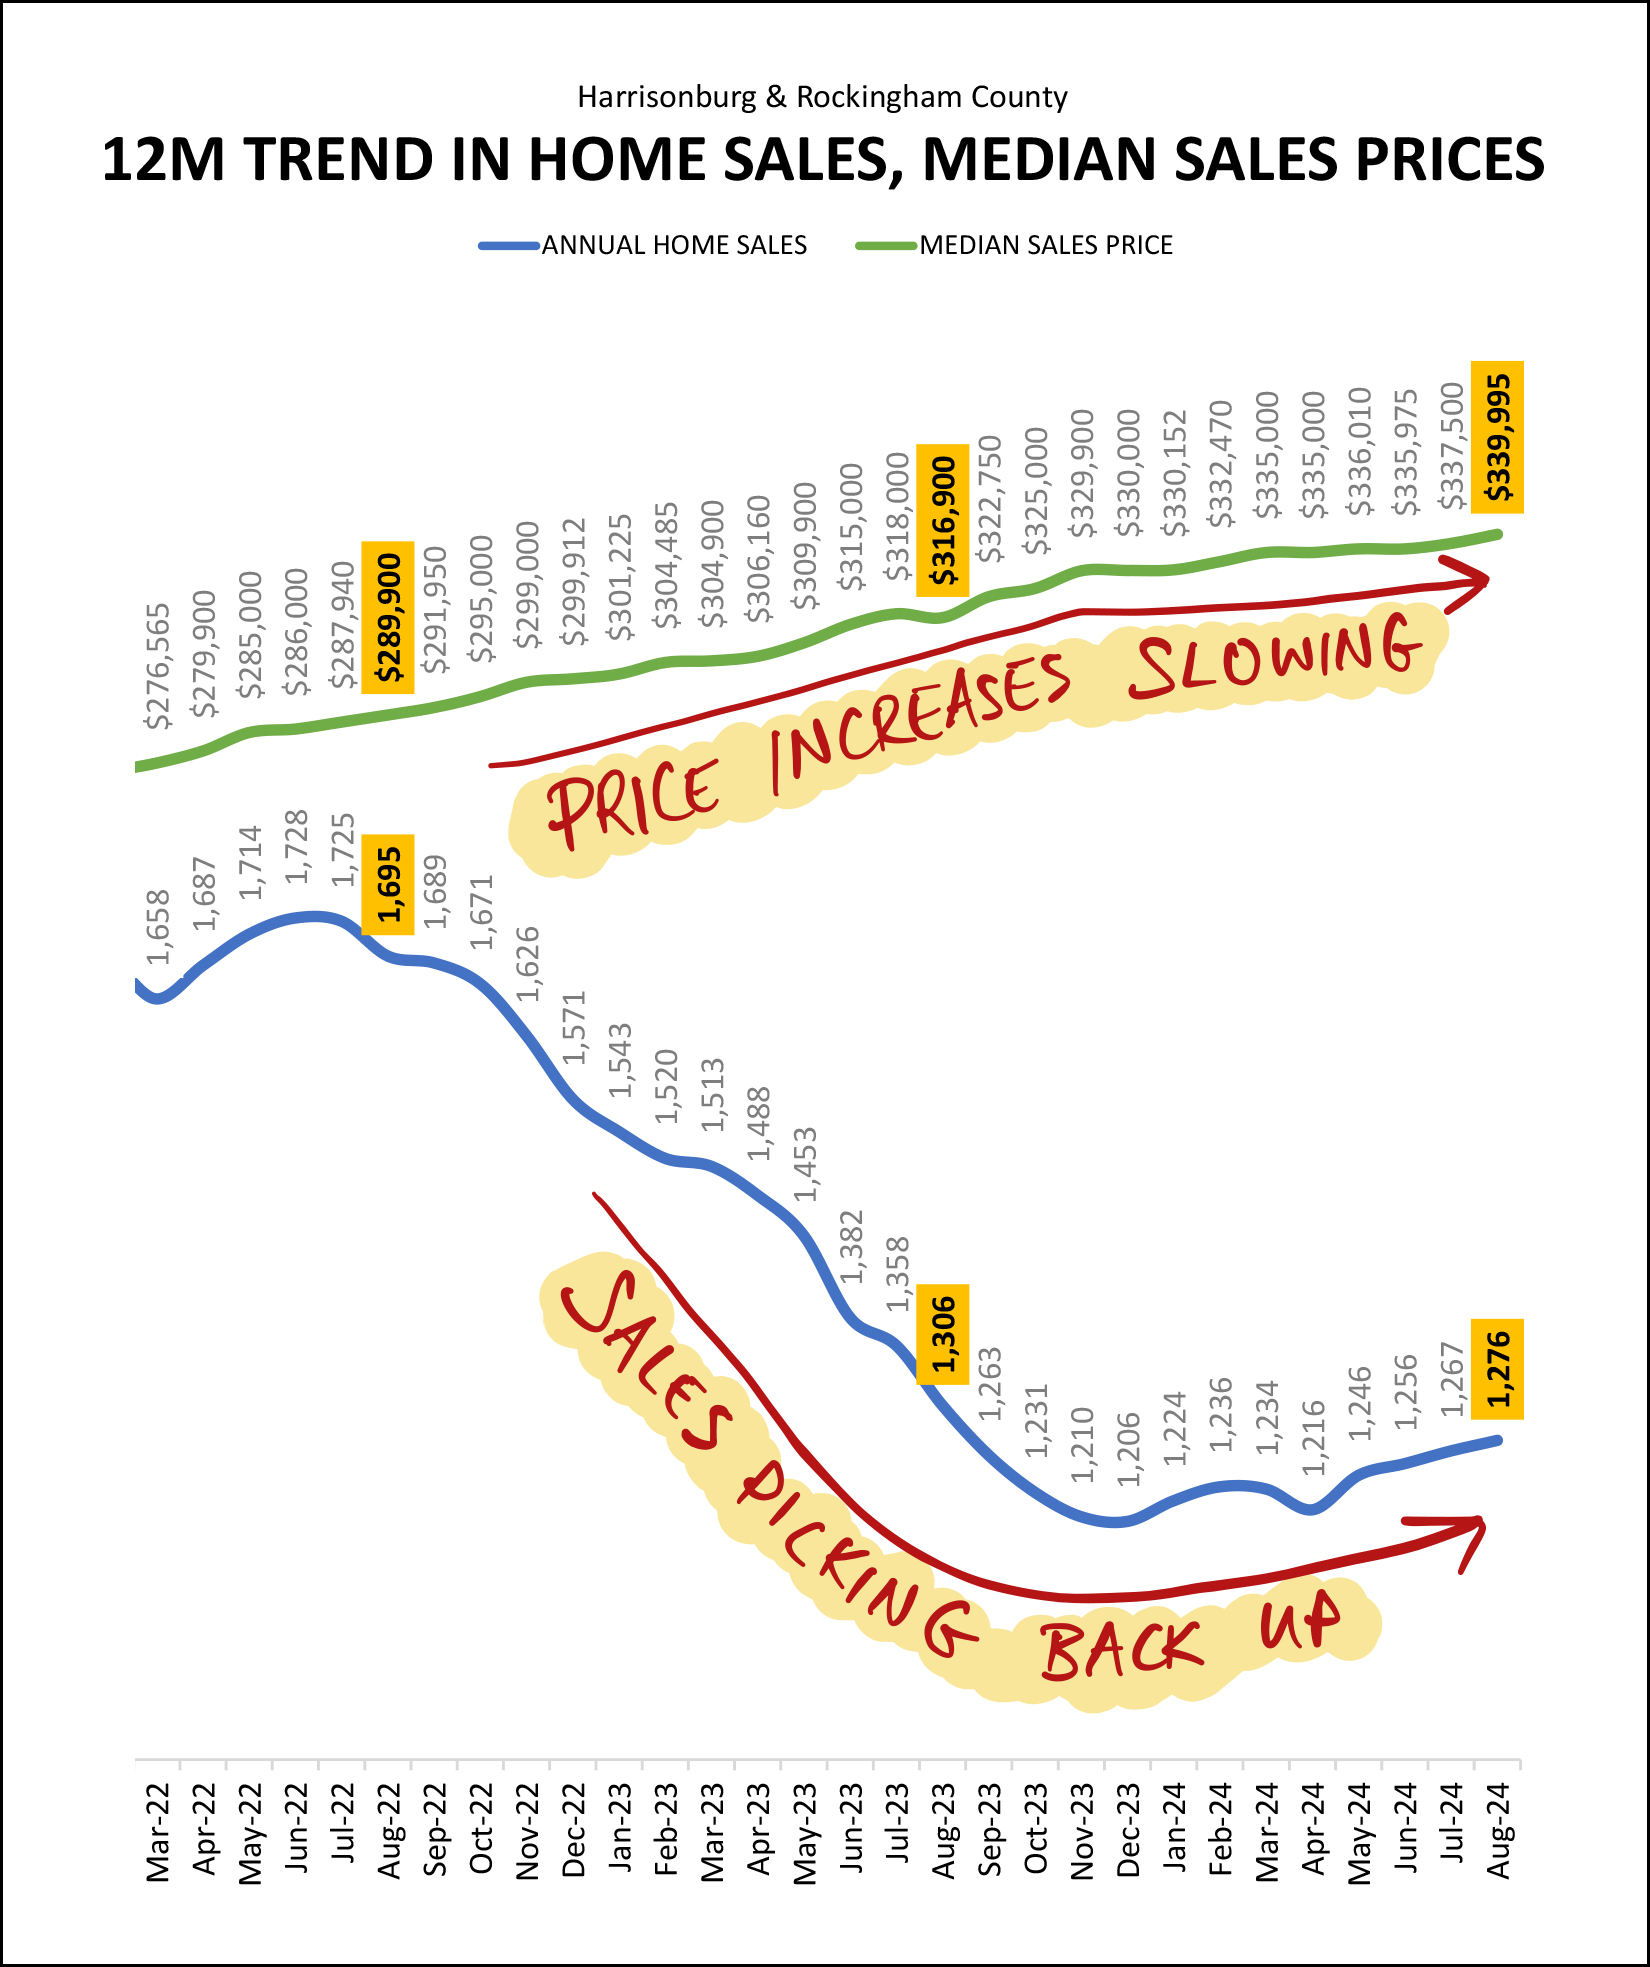 First off, at the top, home price growth is slowing. Testing your reading comprehension and short term memory... do you recall that the overall market is seeing only a ___% increase in the median sales price while the detached home segment of the market is seeing an ___% increase in the median sales price? ;-) Overall Market = 4% increase; Detached Homes = 11% increase. And... that second line (the blue one) at the bottom... shows us that aver steady declines from over 1,700 sales a year down to about 1,200 sales a year, we are now seeing some overall increases in the number of homes selling in our market. Back to those detached homes for a moment... 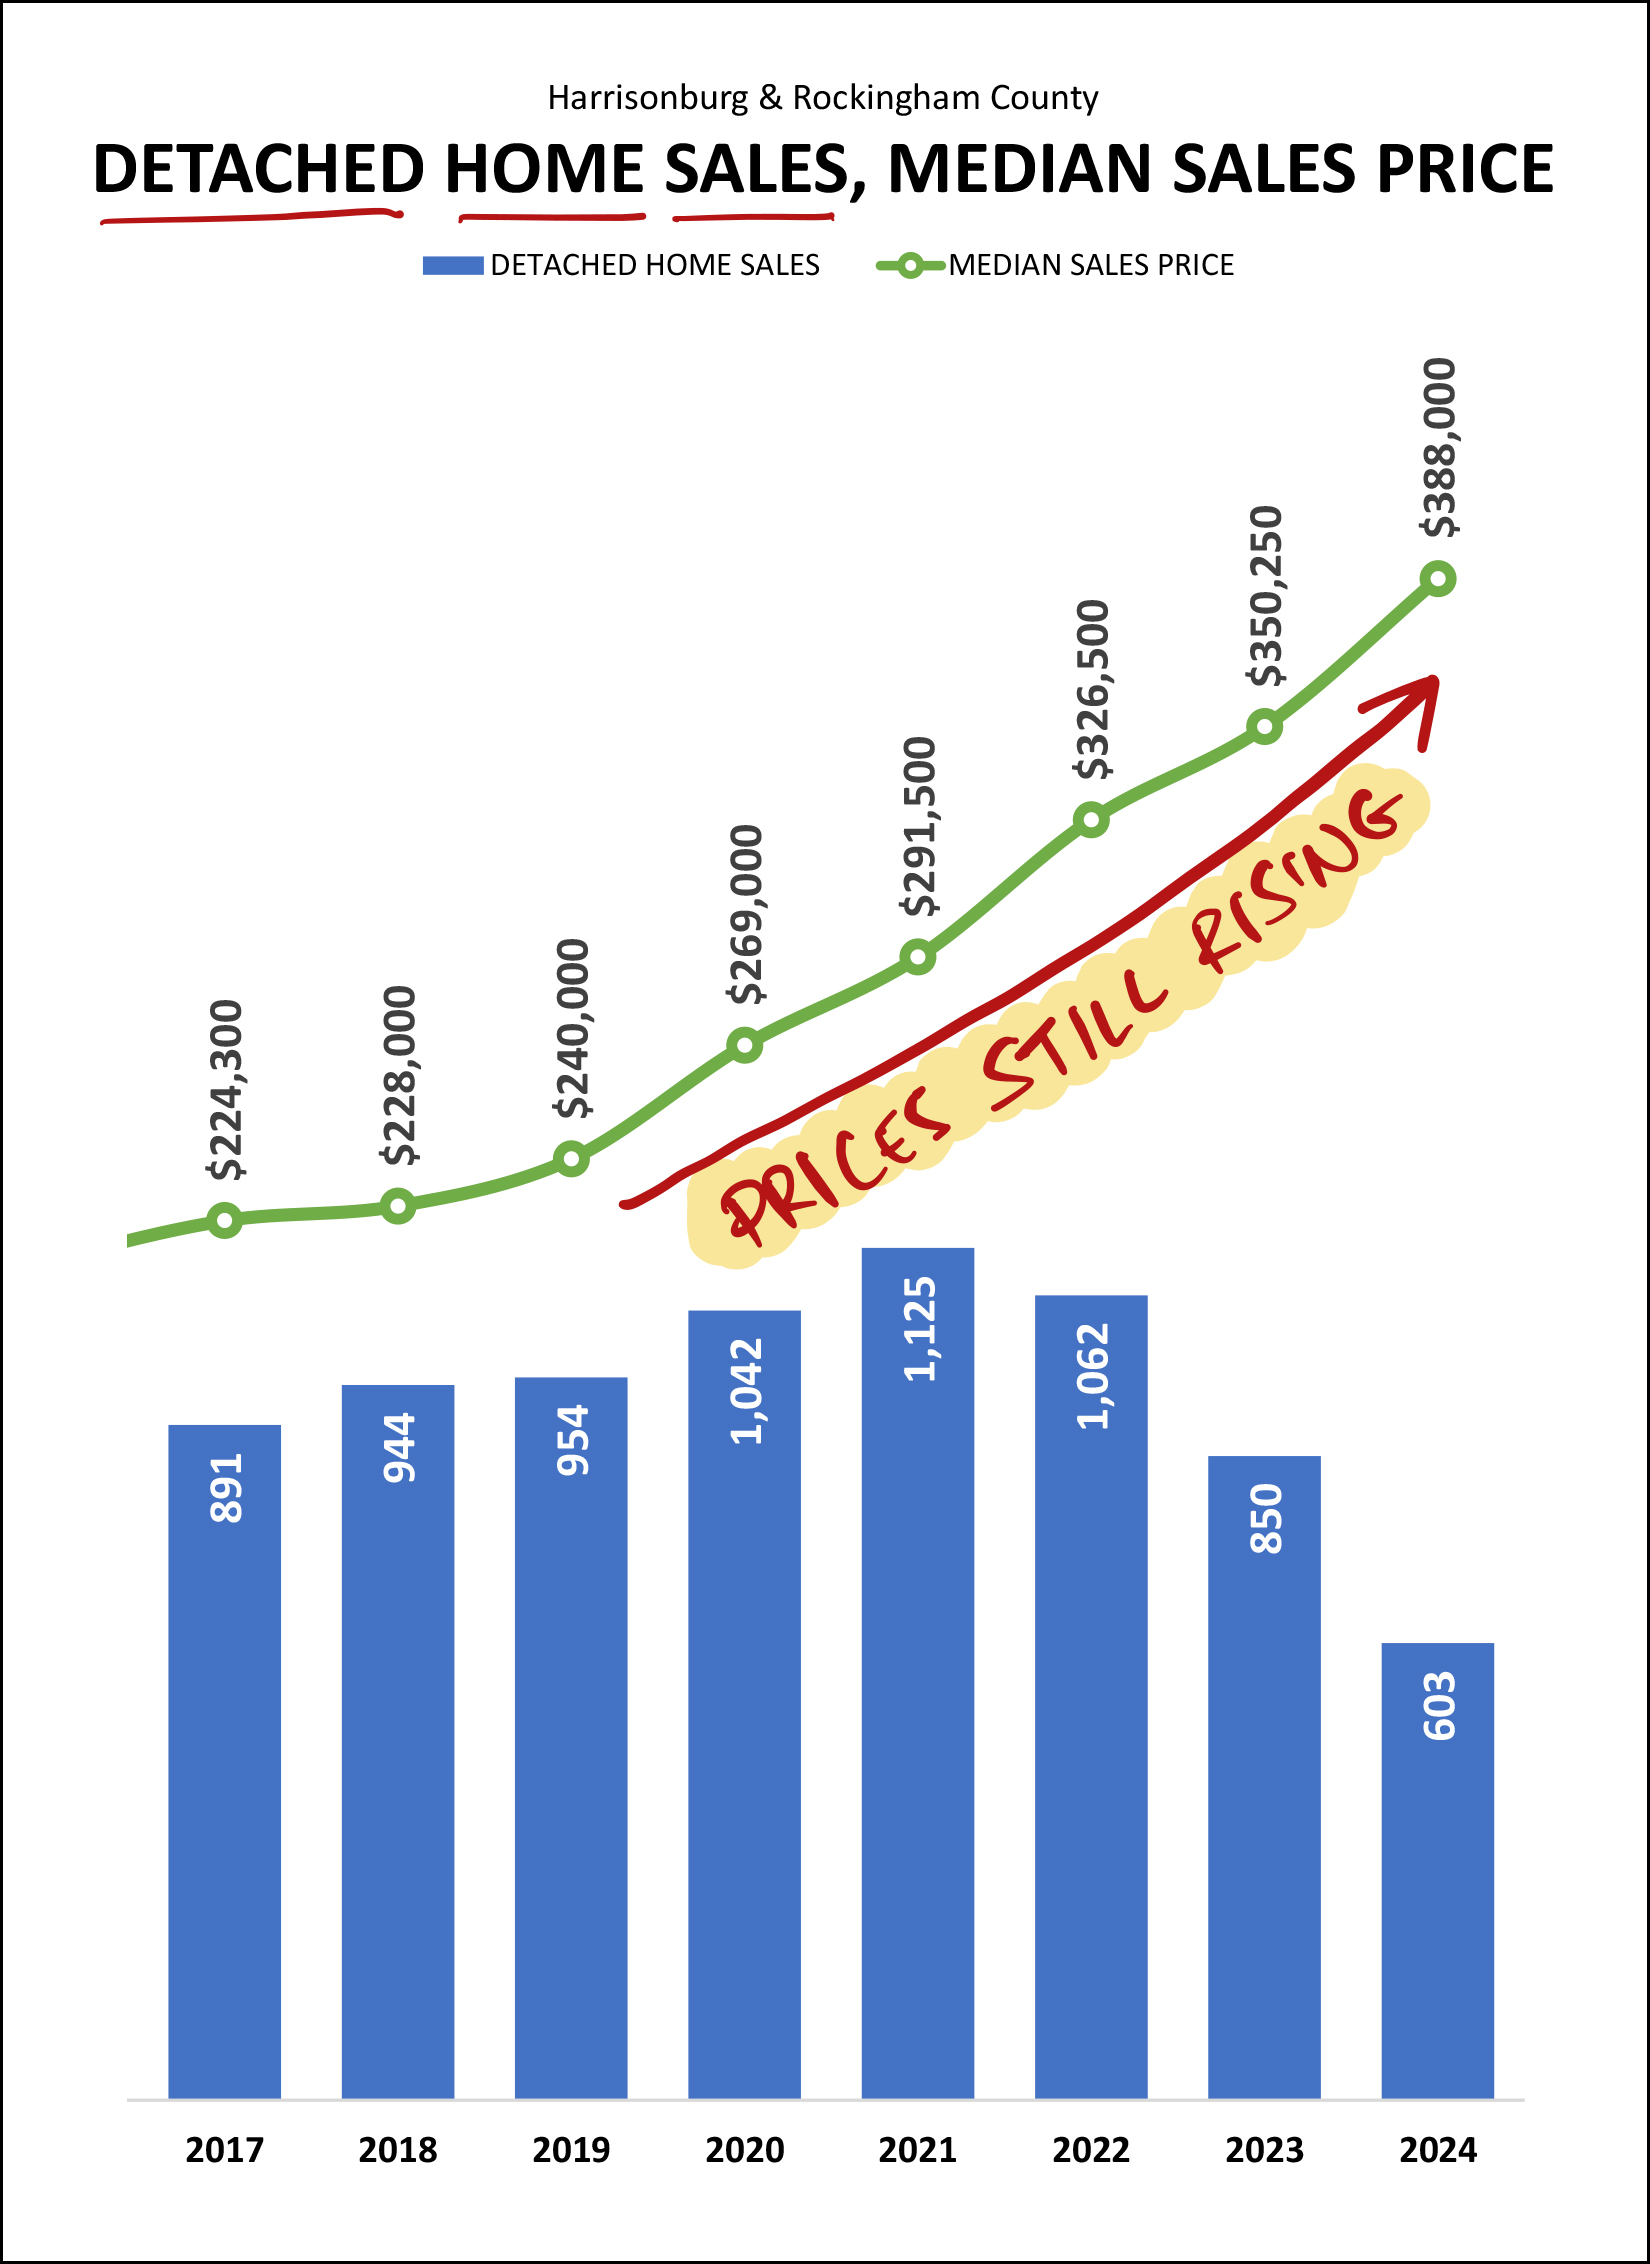 Here's you'll note the *absence* of a flattening out of the median sales price line in green. While the overall market is only seeing a 4% increase in median sales prices in 2024, thus far this year detached homes have been selling at prices that are 11% higher than last year. Earlier I talked about a busy summer of closings which was a result of earlier contract activity. This next graph shows current contract activity, which is a predictor of home sales activity over the next month or two... 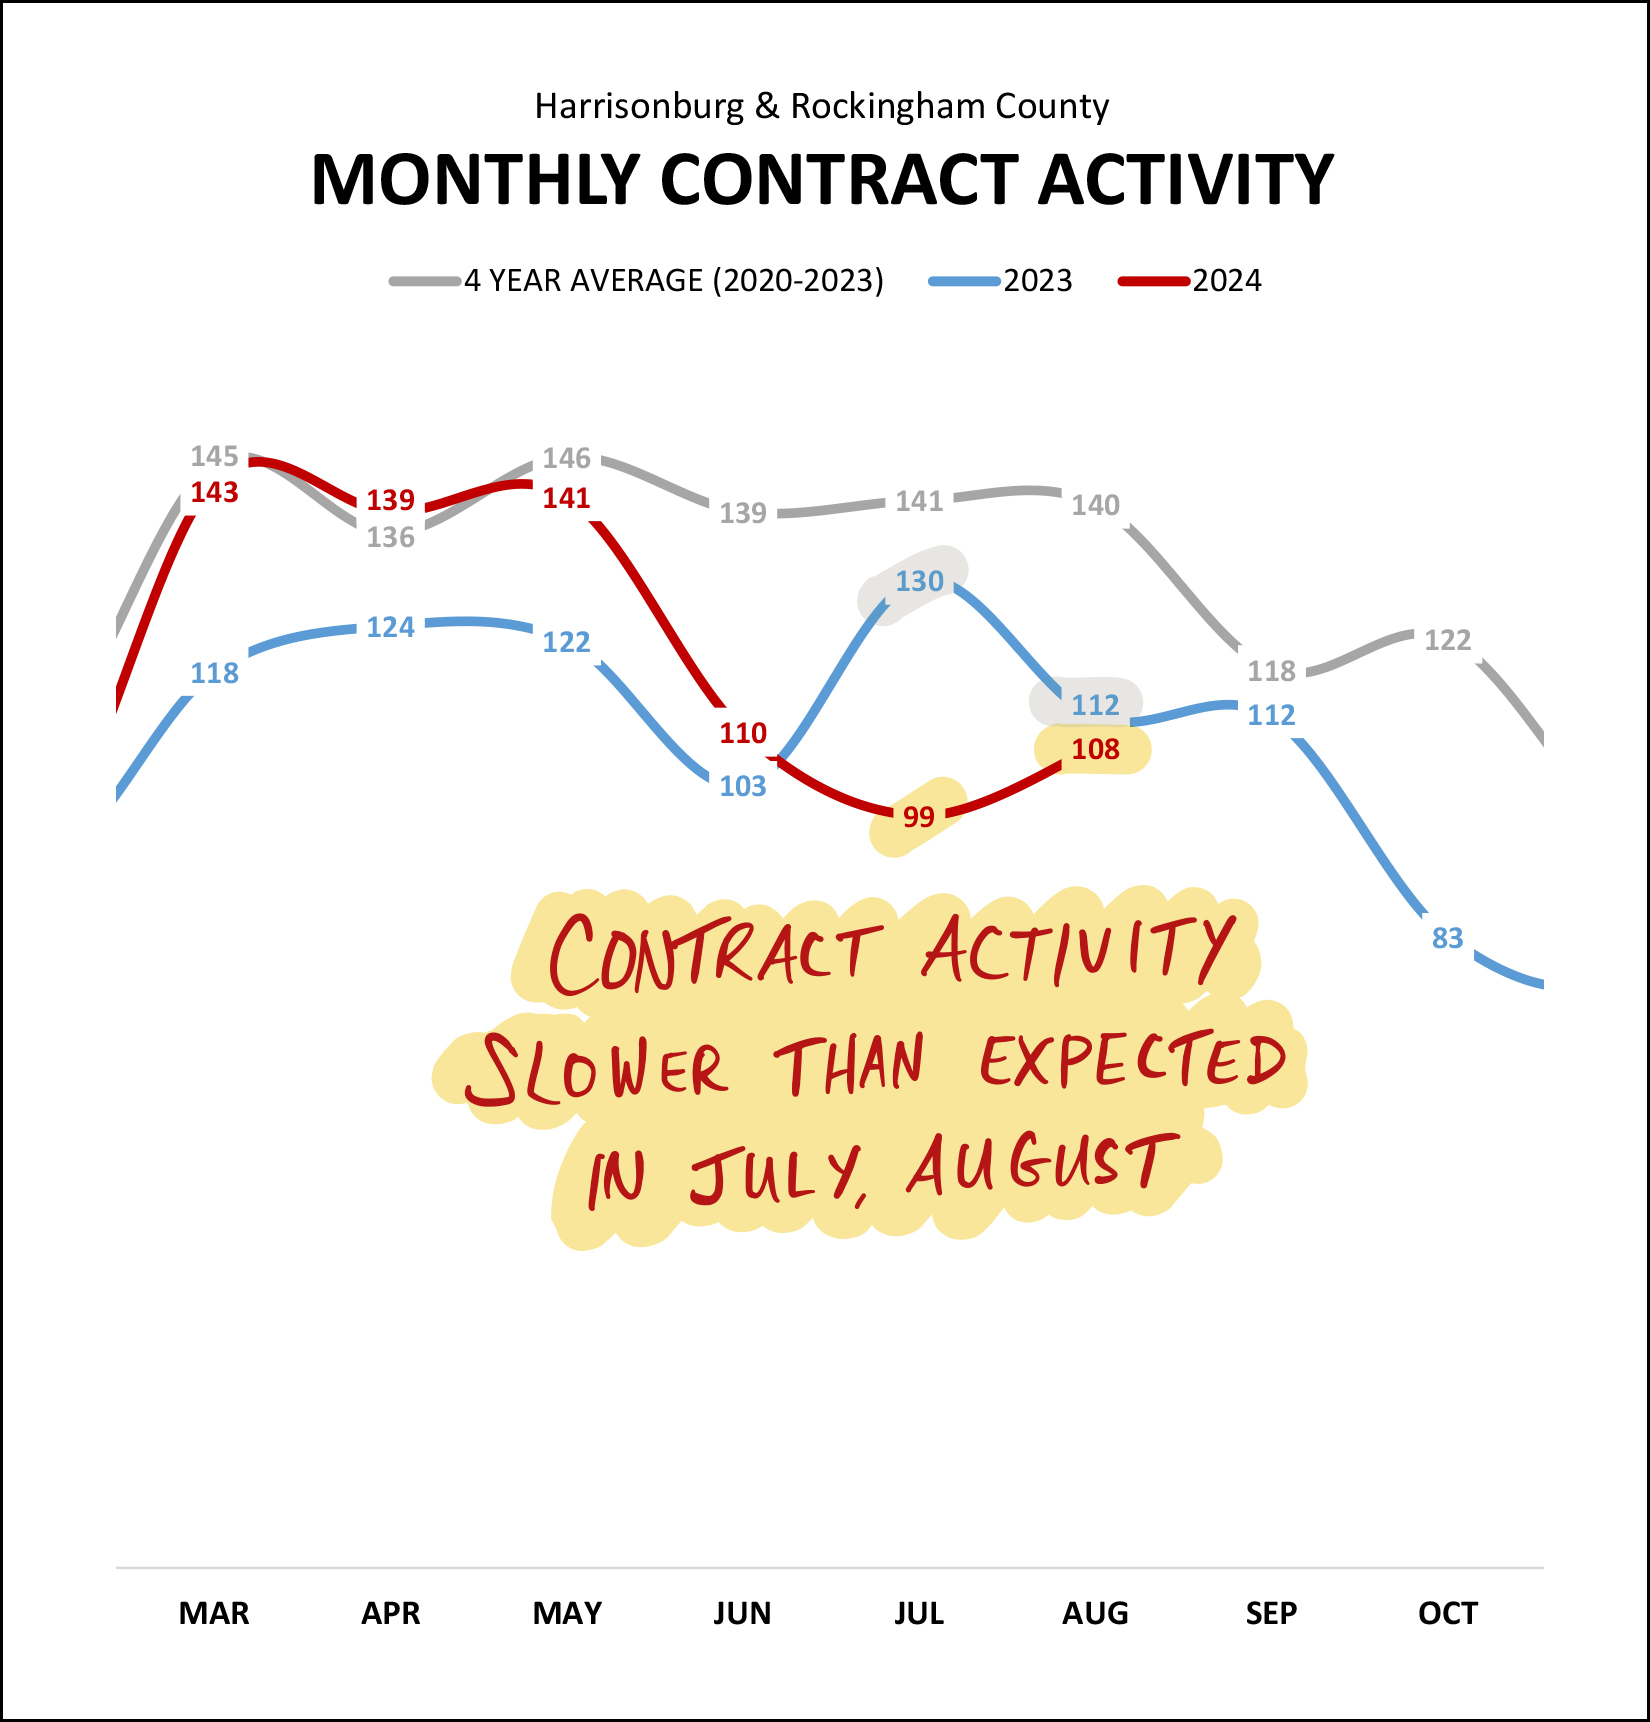 On the left side of the graph above you can see quite a few months of much higher contract activity this year (red line) than last year (blue line) -- particularly in March, April and May. But then, contract activity declined in July and August to levels below where we were a year ago. Looking ahead, we will most likely see a similar number of homes going under contract in September as we did in August, before contract activity likely starts to decline even further in October. This recent slow down in contract activity has also shown up in the pending sales metric, which tracks how many homes are under contract at any given point... 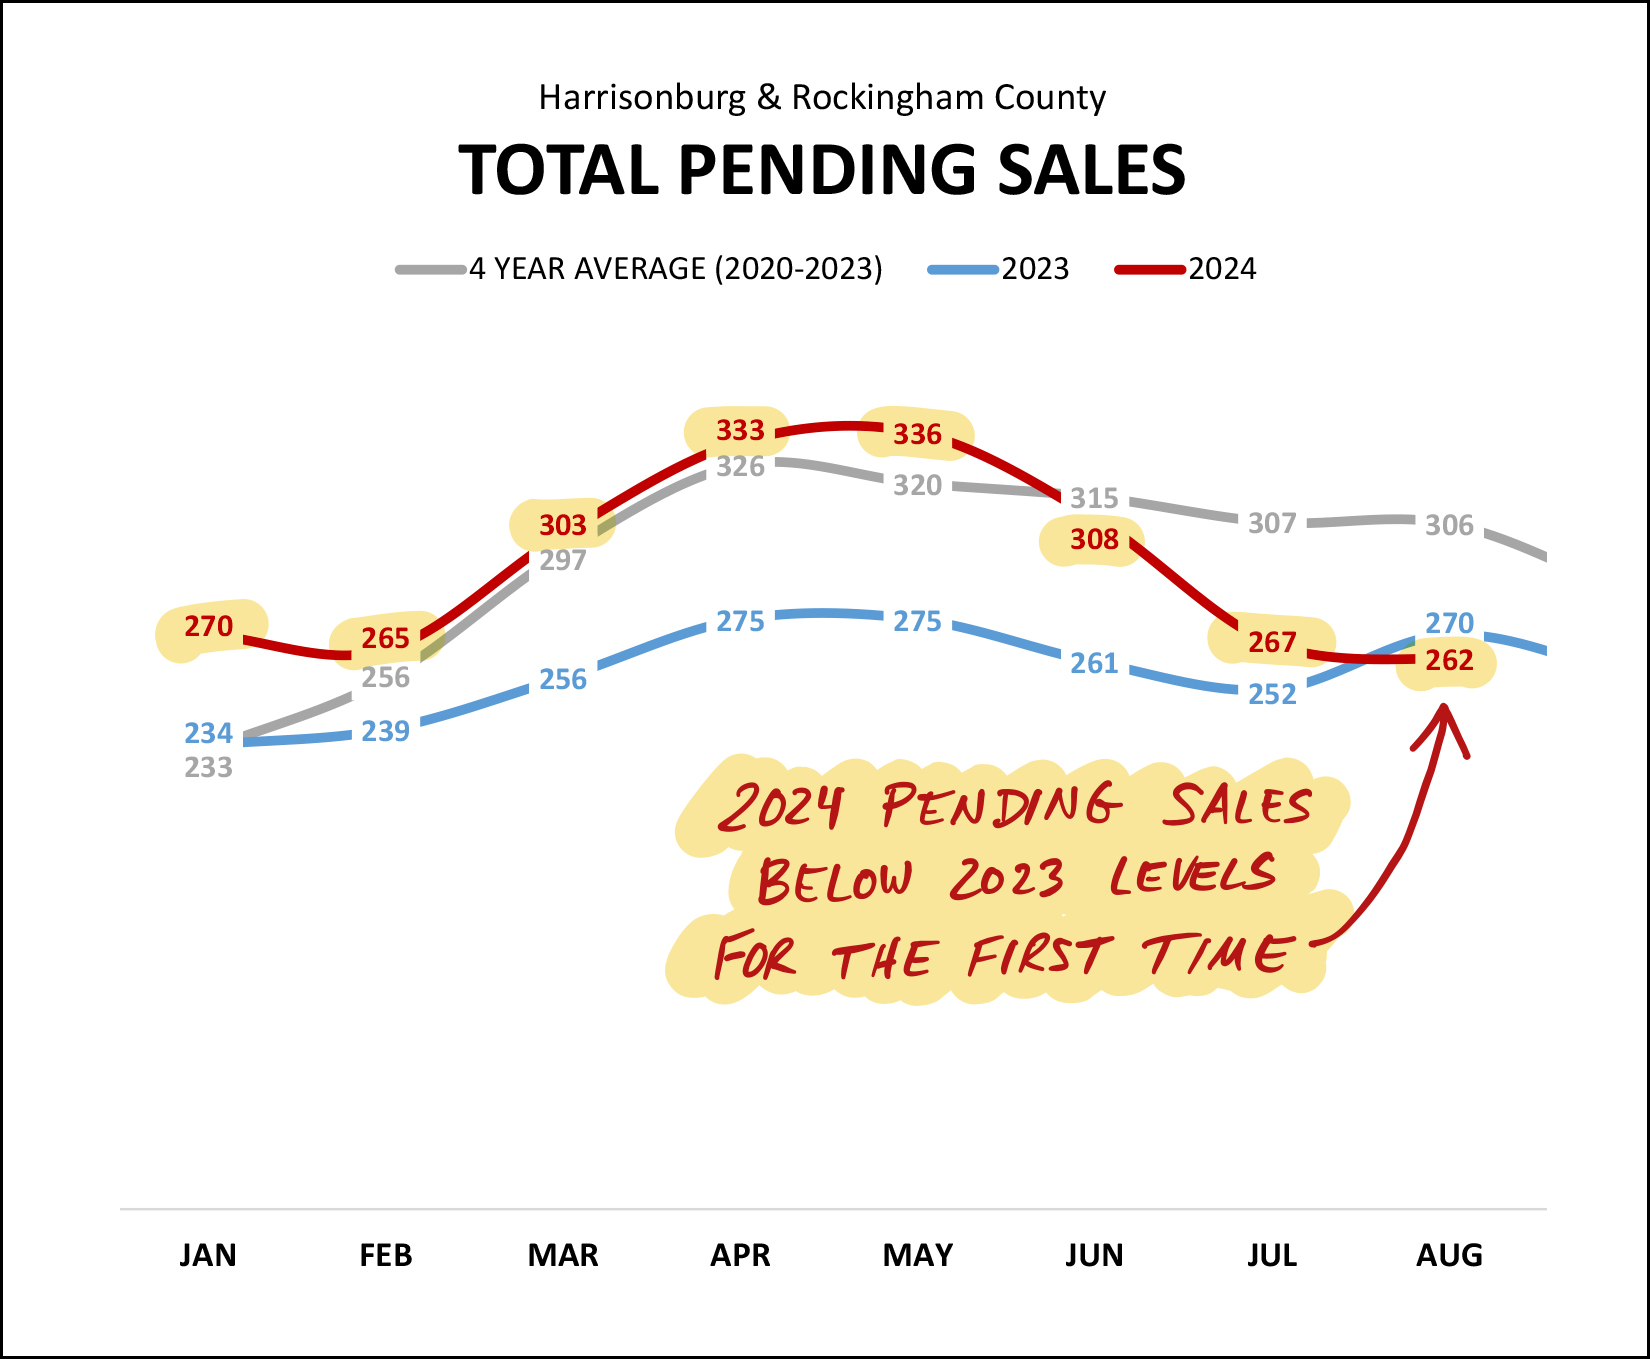 After seven months of riding high above 2023 levels, we have now seen pending sales drop below 2023 levels in August. This is mostly a result of slower months of contract activity in July and August. It's certainly possible that we'll see pending sales pop back up again as we work our way through September and October... but the 2023 and 2024 trajectories have crossed as of the end of August. But wait... if pending sales are declining, that must mean inventory is rising? 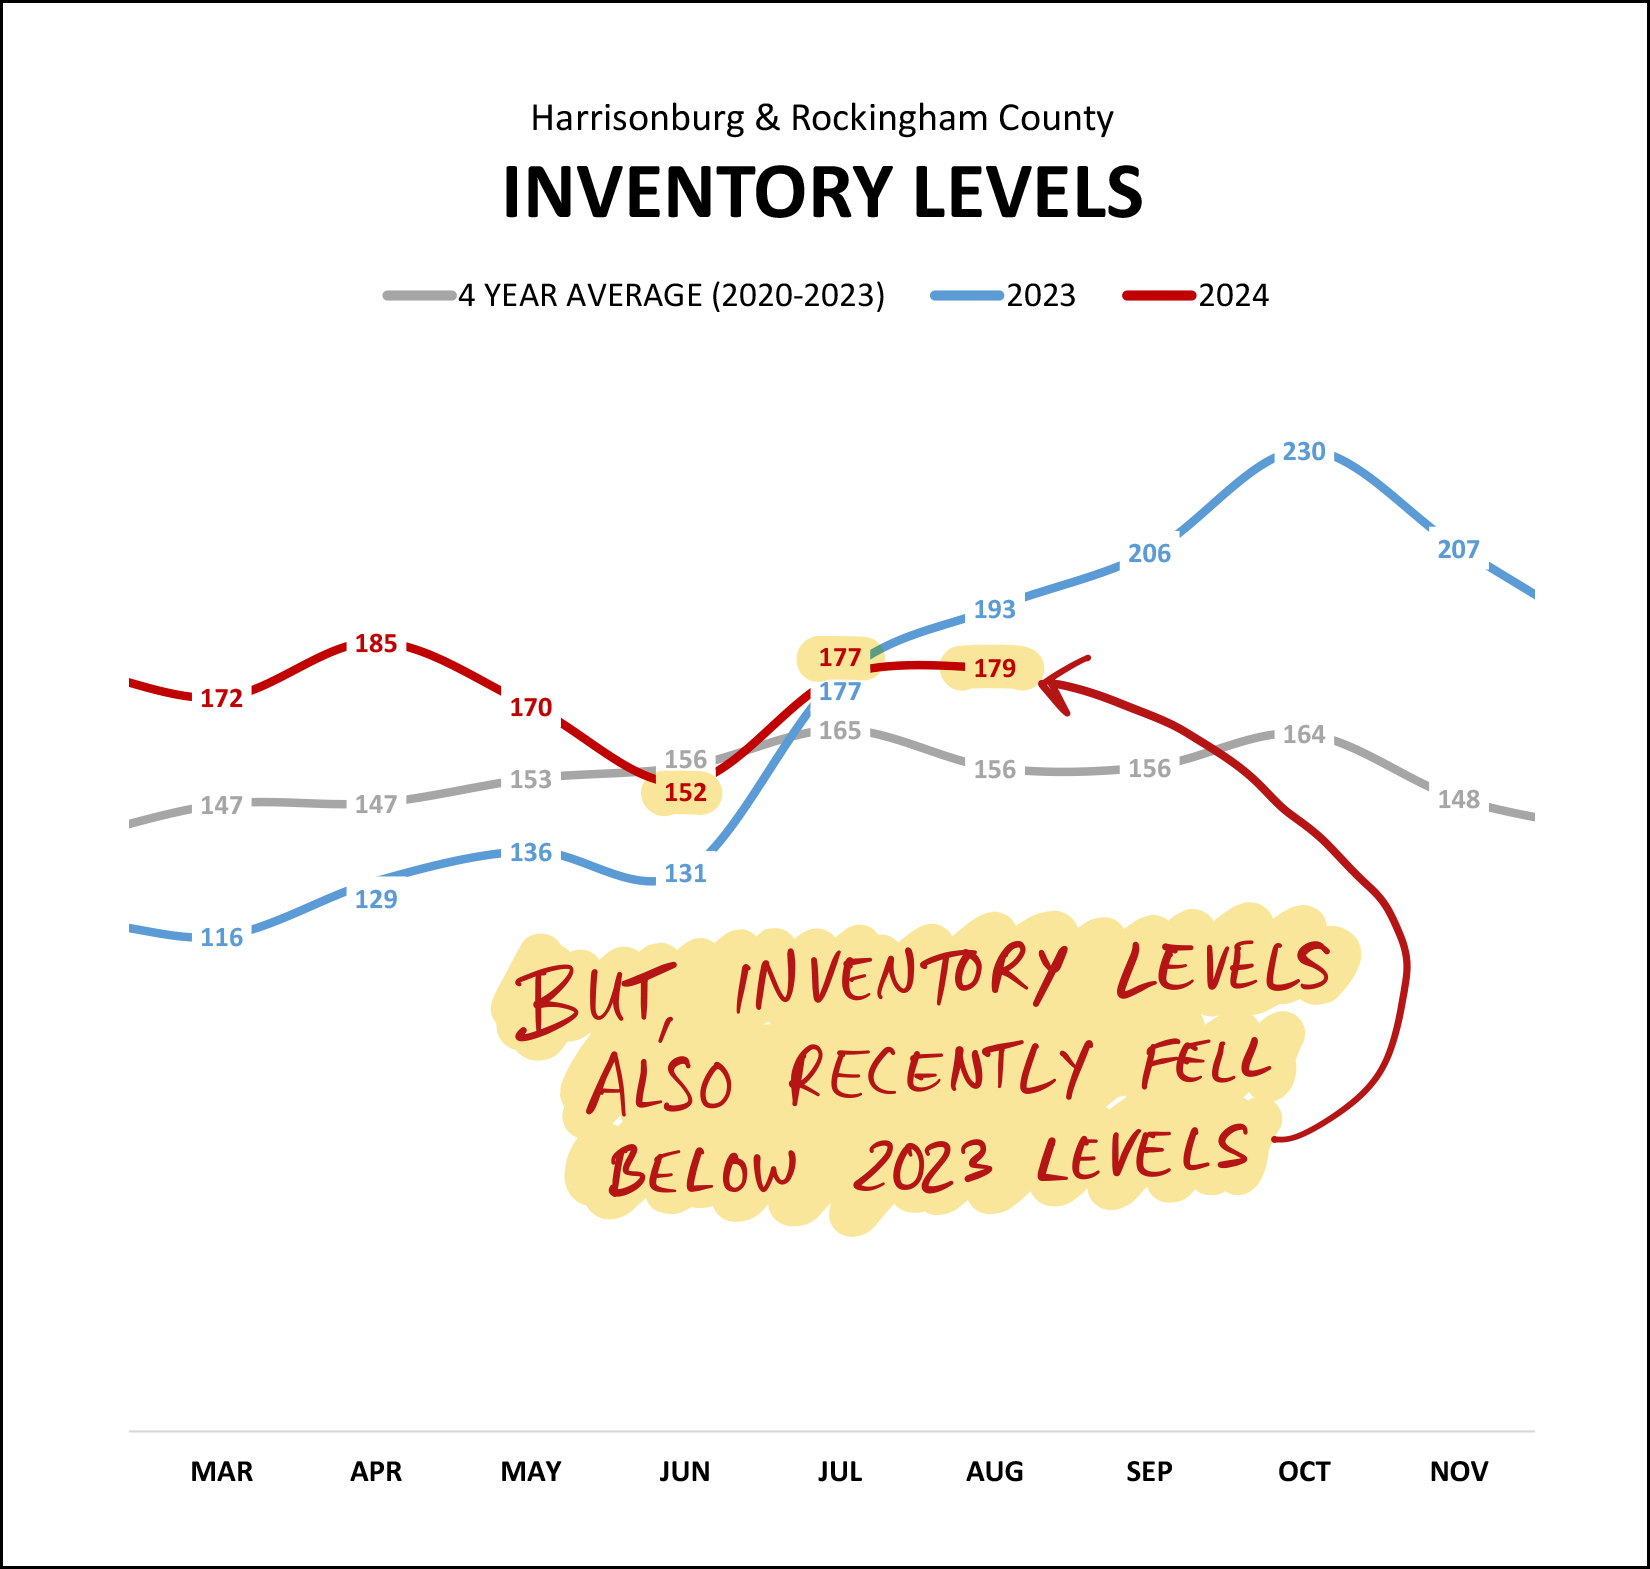 Sorta kinda. Inventory levels dropped to their lowest levels at the end of June... but rose again in July and remained steady at that point in August. Of note... inventory levels consistently climbed last year between June and October... but that was during the exact same timeframe when mortgage interest rates were climbing to their highest levels in 20 years. I do not expect that we will see inventory levels climb that high in September and October this year. But speaking of climbing... will days on market start to climb soon? 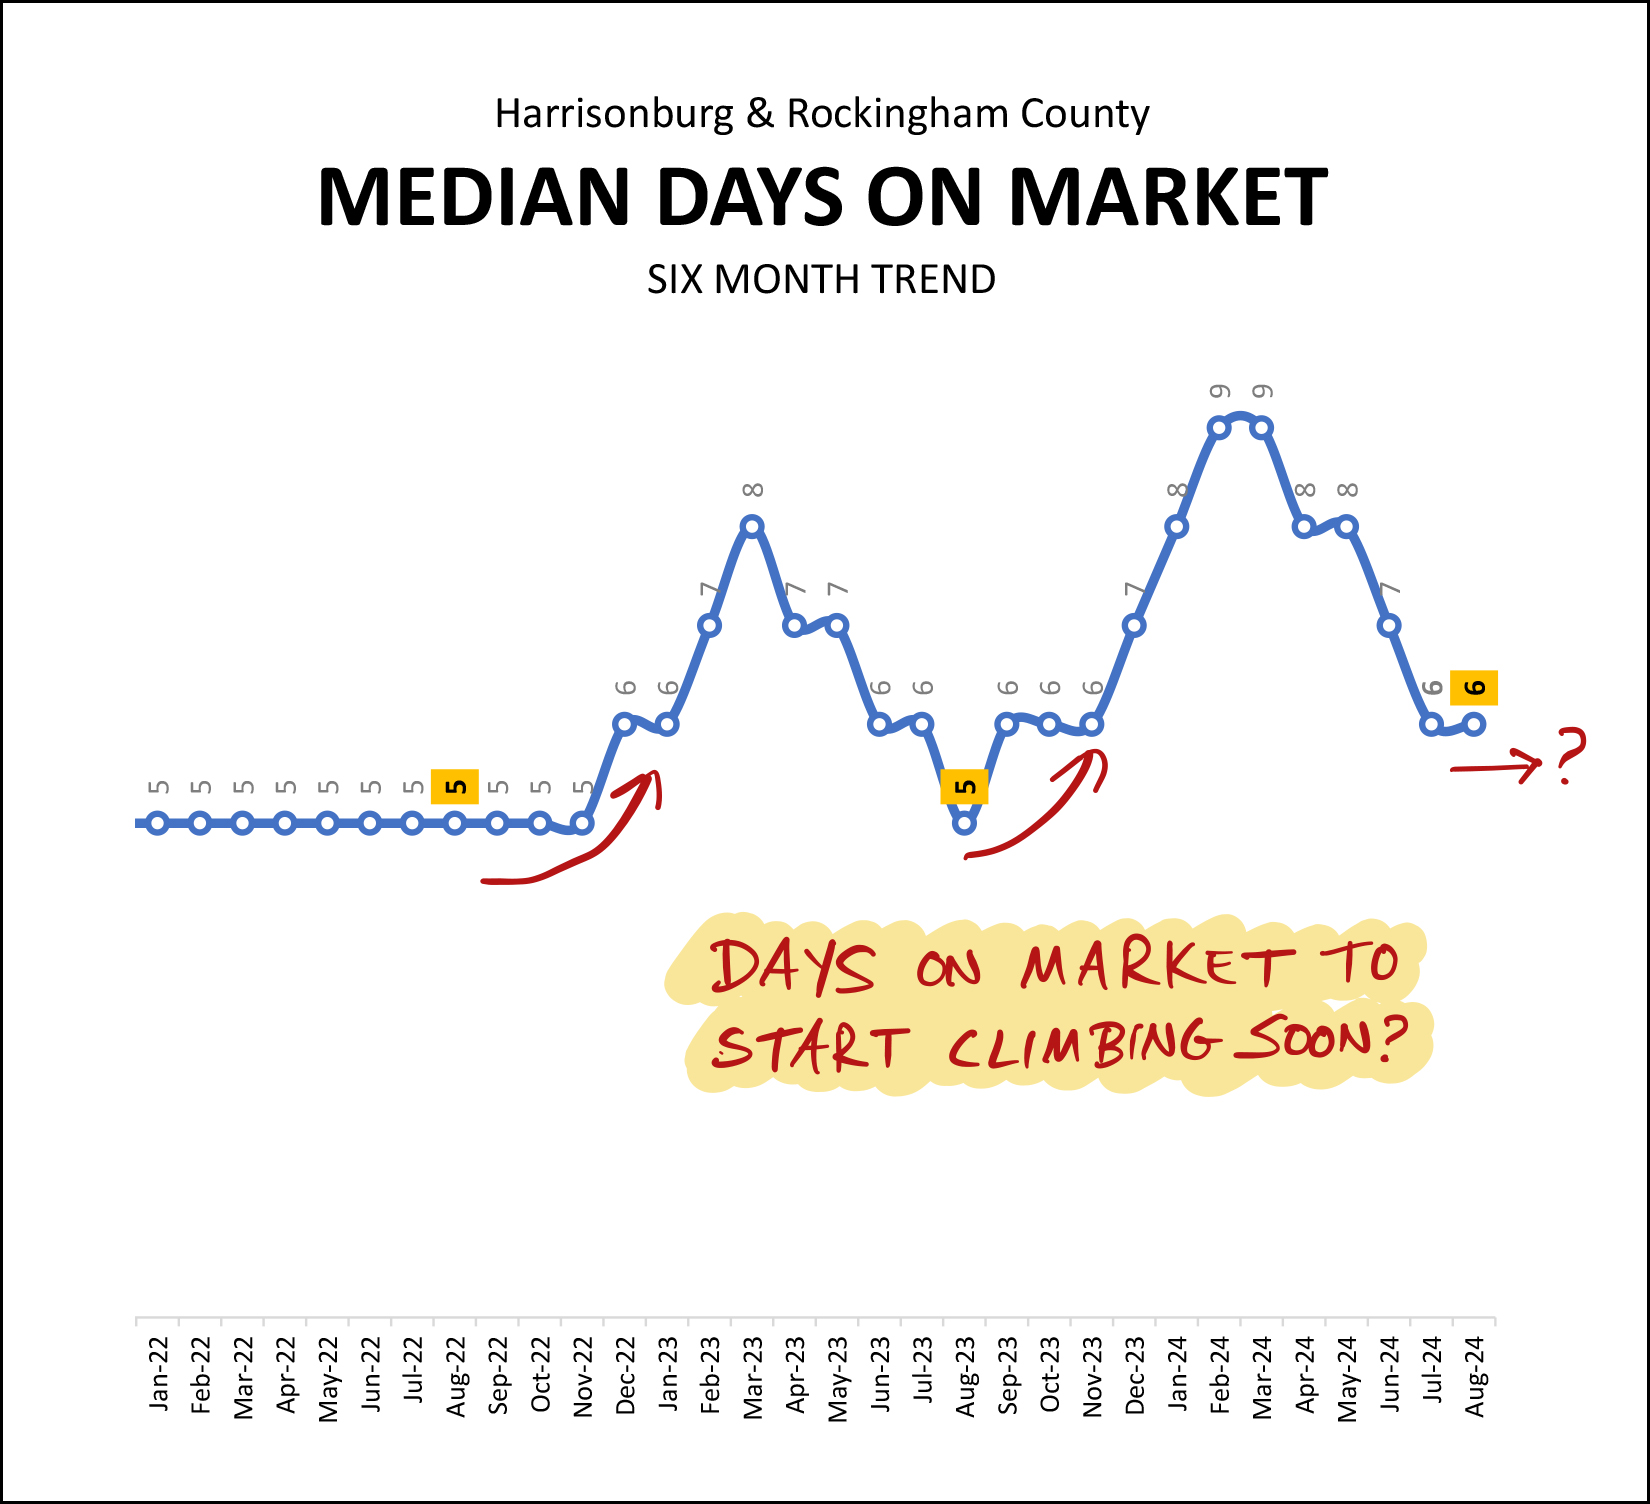 After quite a few years of absurdly, consistently low median days on market, we have seen some variability in this metric over the past two years. That pace at which homes go under contract (days on market) slowed during each of the past fall/winter seasons, so perhaps we'll start seeing that again in 2024. Finally, that one little (or big) number that seems to have been having an oversized impact on the housing market over the past few years... mortgage interest rates... 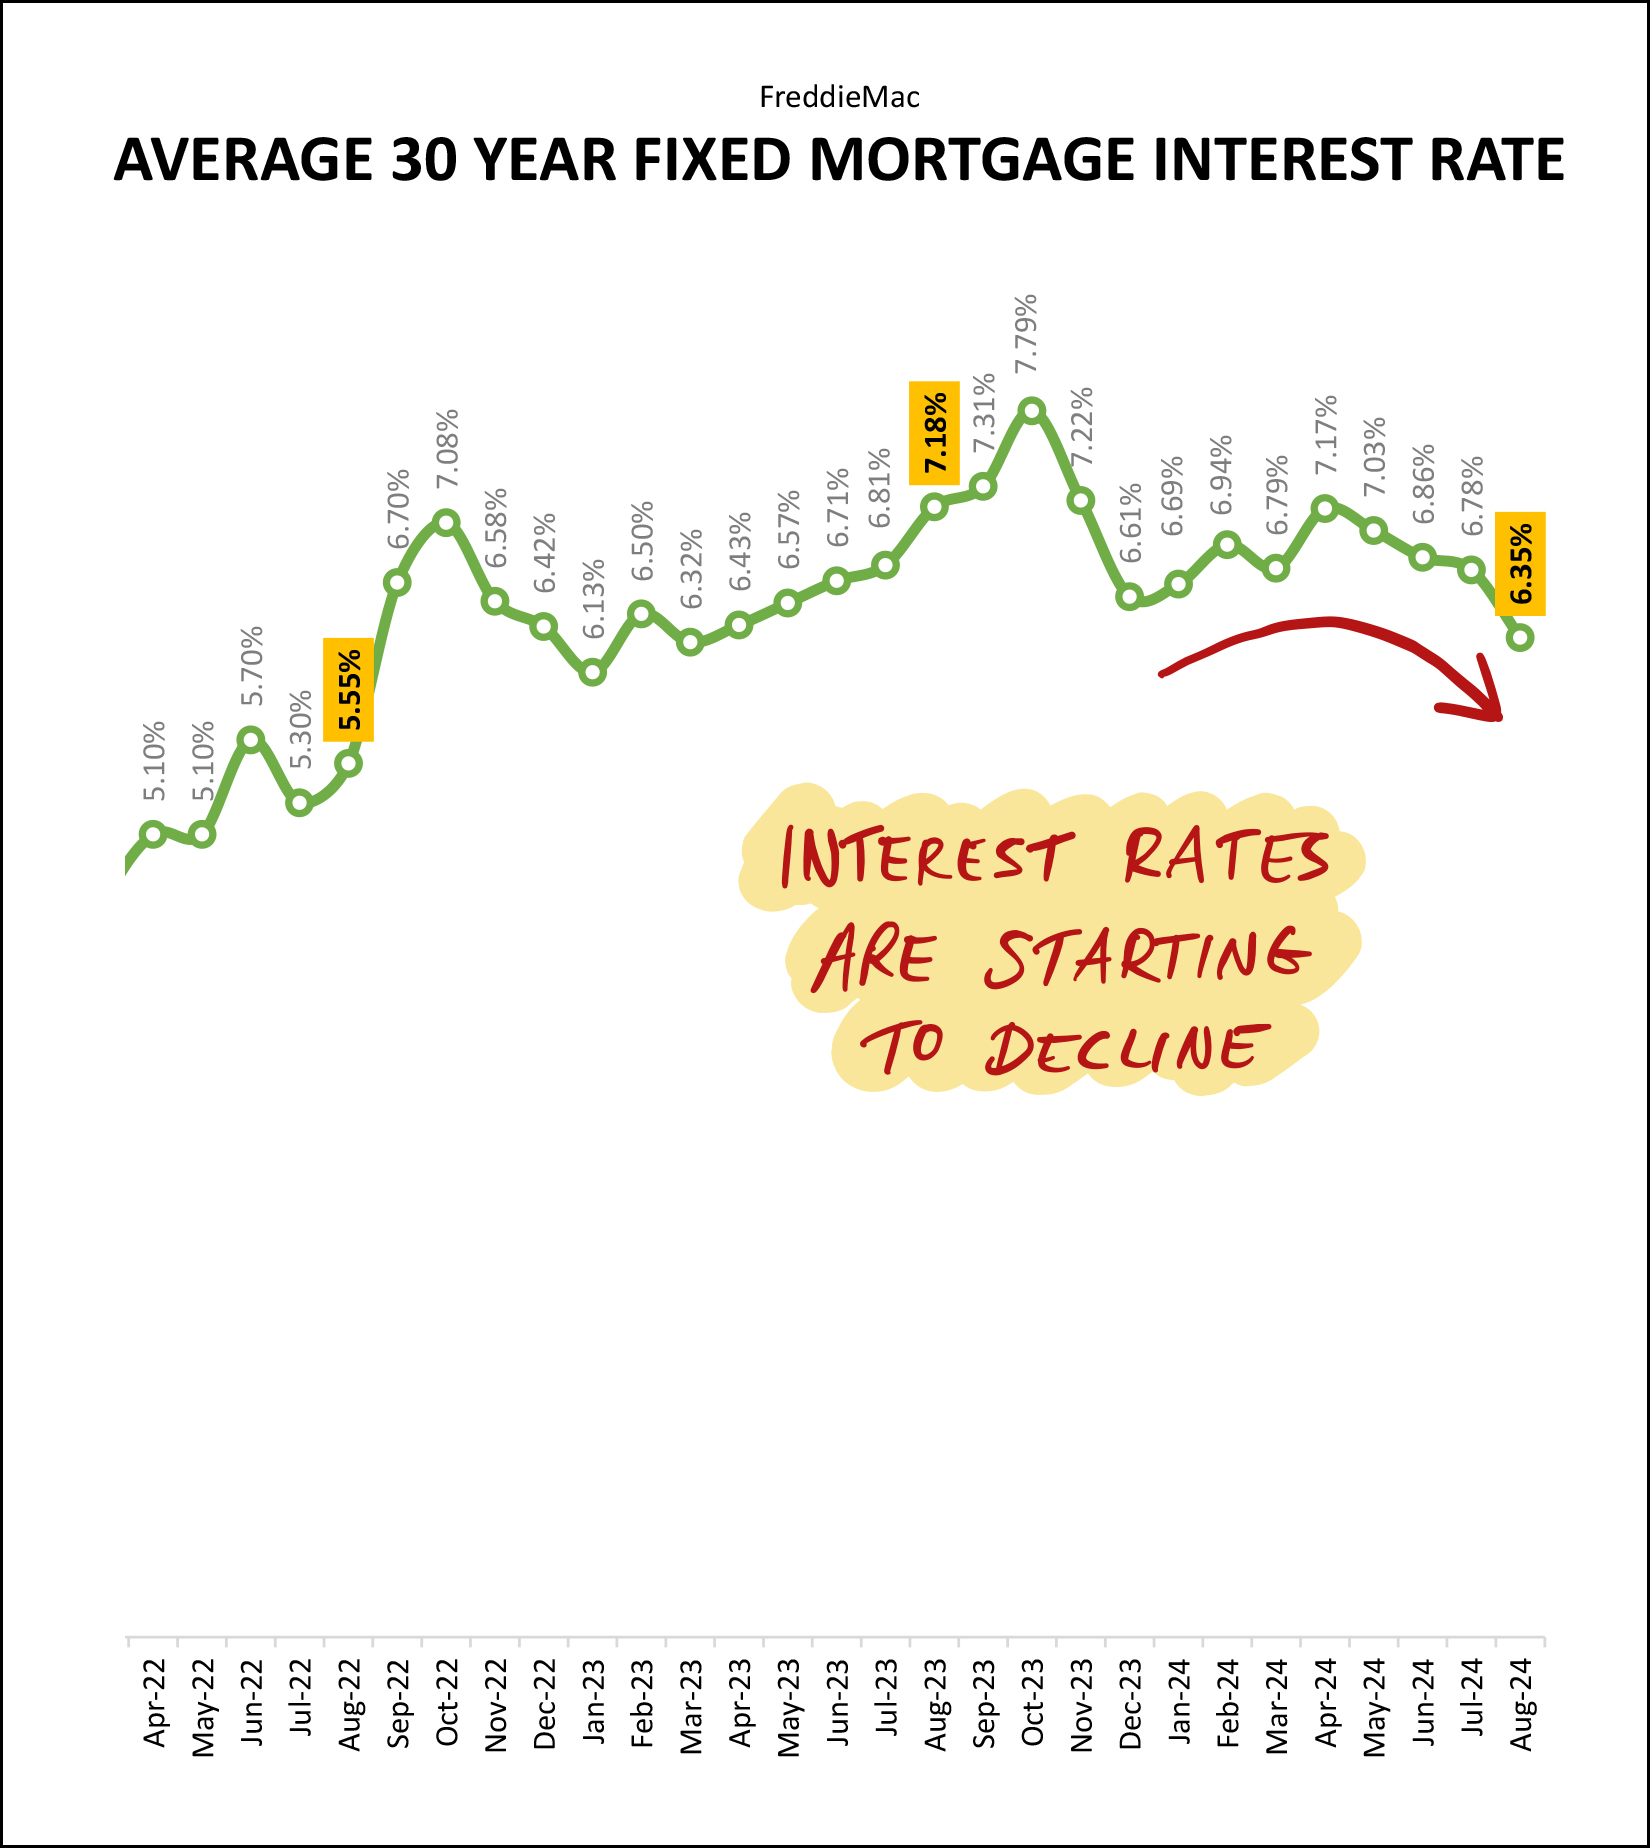 After peaking at 7.79% last October (the highest level in 20+ years) we have started to see some relief in mortgage interest rates -- particularly over the past three to six months. As of June, the average 30 year fixed rate mortgage had fallen below 7%, and now we're closer to 6% than 7%. The Federal Reserve might be announcing a rate cut this Wednesday... though some say that the recent anticipation of that rate cut has already been priced into adjustments in mortgage interest rates. So, let's play a bit of up and down in 2024...
So, as we look ahead at the final three and a half months of the year (yes, that's all that remains) here are a few things to keep in mind... Home Buyers - Many segments of the local market are still rather competitive (multiple offers) but plenty of homes aren't going under contract within two days. Get preapproved now, go see houses quickly when they hit the market, and be prepared to make a rapid, but thoughtful decision about whether to make an offer. Home Sellers - Some, but not all, houses are going under contract quickly. The more broadly appealing your home is to buyers (based on size, location, house features, lot features, etc.) the more quickly we are likely to receive offers. If there are some attributes of your home that disqualify broad segments of the pool of potential buyers, then we are likely to have a longer wait for an offer... and we might have to adjust your list price more than the market data would otherwise suggest in order to inspire a buyer to make an offer. The data and observations I have presented in this market report are a high level overview of our overall market. If you're getting ready to buy or thinking about selling, we should be chatting more specifically about your segment of the market -- what you will be buying, or selling. Feel free to reach out anytime with questions or to set up a time to meet. You can contact me most easily by phone/text at 540-578-0102 or by email here. | |
An Early Look At August Contract Activity |
|
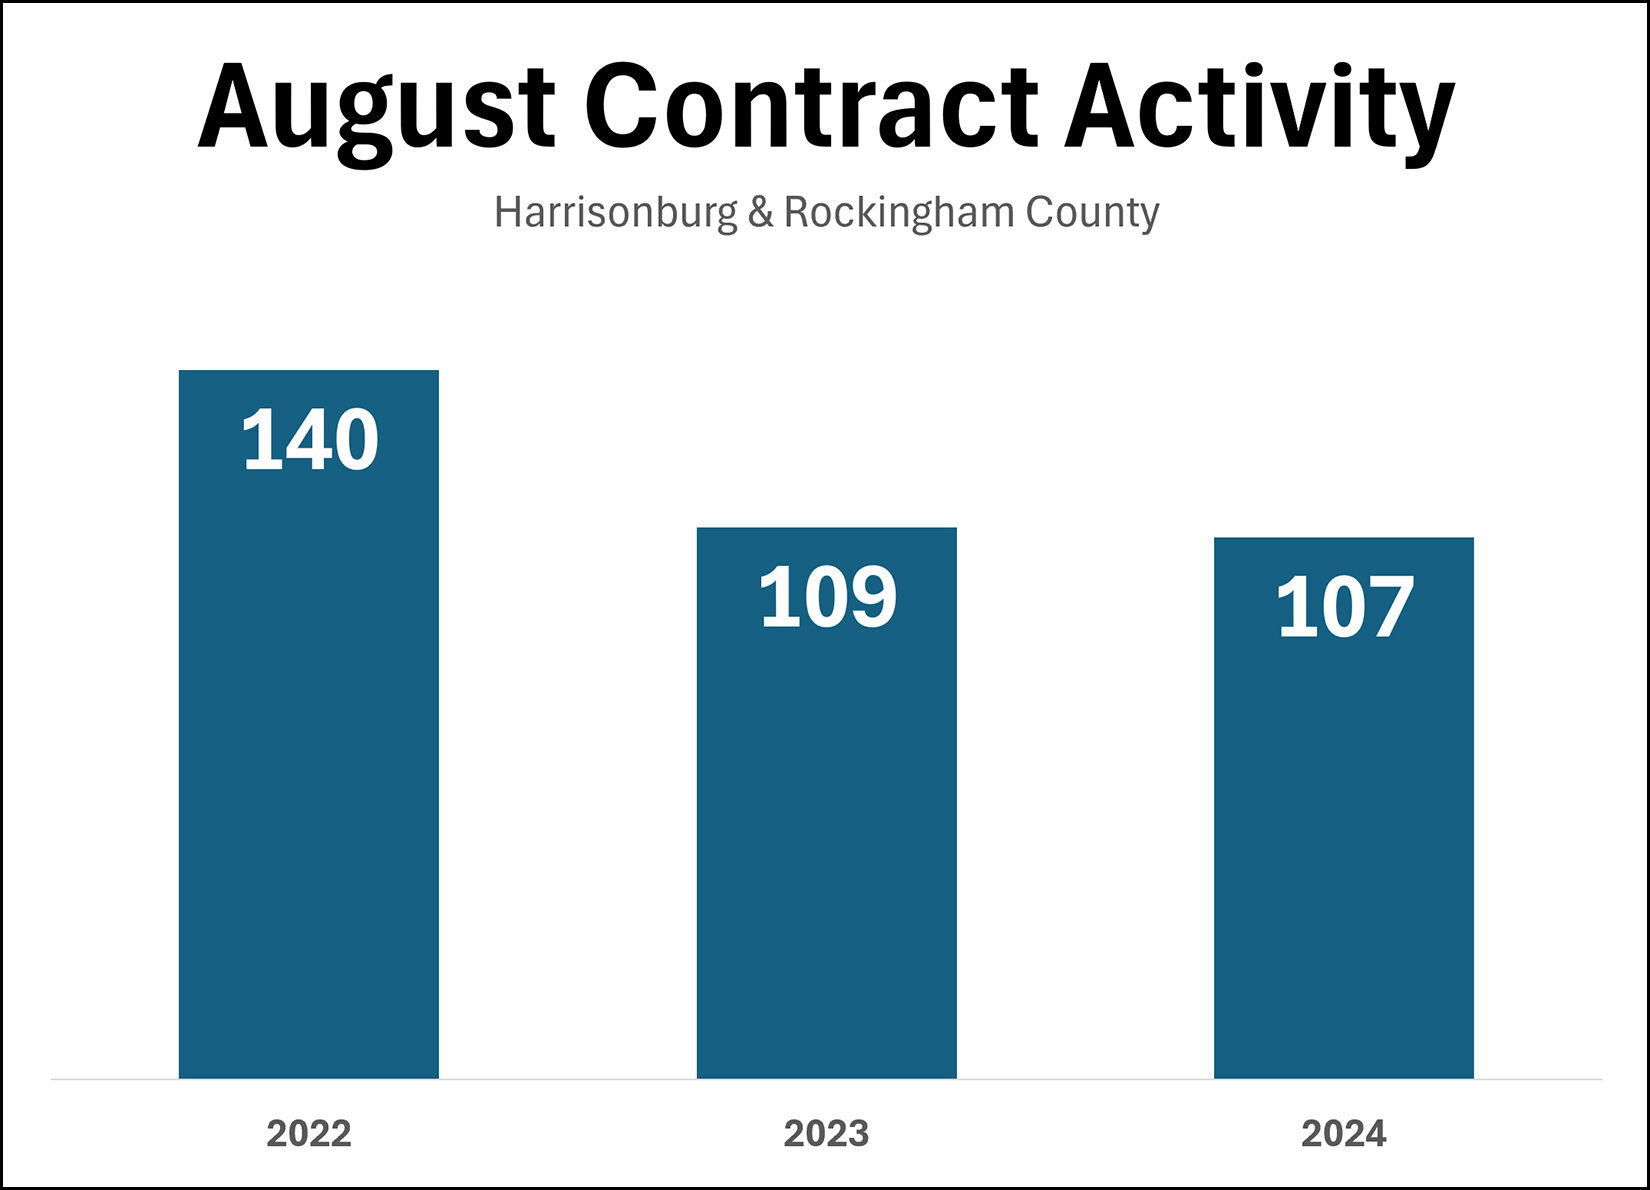 August 2024 was another busy month of buyers and sellers signing contracts to buy and sell homes. While 109 buyers and sellers signed contracts last August (2023) we saw about the same number (107) sign contracts this August (2024). Looking in a slightly longer context, both of these months of August are a good bit below the 140 contracts signed in August 2022. For a bit more context, here is the average 30 year fixed mortgage interest rate at the start of August for each of the past three years... August 2024 = 6.73% August 2023 = 6.90% August 2022 = 4.99% I think it is very reasonable to conclude that the lower numbers of sellers being willing to sell and buyers being willing to buy in August 2023 and 2024 are related to the higher mortgage interest rate during those years. | |
Fewer City Home Sales, More County Home Sales In 2024 With Higher Prices All Around |
|
 Happy Thursday morning to you! The summer seems to have flown by, and soon school will be starting for many of us... as parents of K-12 students, as parents of college students, as teachers or administrators at a K-12 school or professors or administrators at a local college or university. If you have a such a transition coming up, I hope you had a full and fun and relaxing summer and are excited for the school year ahead.  Shaena, Luke, Emily and I had a fun and fulfilling summer and soon Luke will be starting his second year of college and Emily will start 11th grade. The years fly by quickly! Before we start looking through the latest trends in our local real estate market, each month I offer a giveaway for readers of my market report. This month I'm giving away a $50 gift card to Jack Brown's. If you find me at Jack Brown's it will probably be enjoying one of their delicious burgers and some sweet potato fries. Click here to enter to win the gift card. Now then, where were we... ah, yes, the latest housing market data...  The chart above outlines some of the main trends in our local housing market and a few things stand out to me... [1] We have seen strong sales over the past three months as compared to last year, with a 14% year over year increase in the number of home sales taking place in Harrisonburg and Rockingham County. [2] This latest surge over the past three months (+14%) has been pushing back against the 7% decline in sales when we look at the past 12 months of home sales compared to the 12 months before that. [3] When looking just at the current calendar year, we have seen an 8% increase in the number of home sales taking place in Harrisonburg and Rockingham County in 2024 compared to 2023. ...and on sales prices... [4] Over the past year the median sales price has increased 6% from $318,480 to $337,500. [5] But when we look just at the current year to date (Jan-Jul) we have only seen a 4% increase in the median sales price compared to the same seven months last year. So, we're seeing more home sales in the first seven months of this year compared to the first seven months of last year... but sales prices seem to be rising a bit more slowly than they had been over the past few years. Sneaking a quick glance at detached single family homes, and then attached homes...  The median sales price of detached homes has increased 11% thus far in 2024 as compared to the same timeframe in 2023... to a median sales price of $388,000. That is to say that half of detached homes selling in Harrisonburg and Rockingham County are selling for $388K or more and half are selling for $388K or less. And how about those attached homes...  We have only seen a 5% increase in the median sales price of attached homes... which includes townhomes, duplexes and condos. The median sales price of these properties thus far in 2024 is $310,000... which means that half of the attached homes selling in Harrisonburg and Rockingham County are selling for $310K or more and half are selling for $310K or less. If you're looking to buy a home, the number of opportunities you might have will likely vary depending on if you want to buy in the City or the County. Here's what we're seeing in the City of Harrisonburg...  City home sales (shown above) have declined 17% in the first seven months of 2024 compared to the same timeframe last year. While 200 homeowners sold their homes last January through July, only 167 homeowners sold this January through July. This is largely a supply side issue... fewer sellers selling... not fewer buyers buying. Meanwhile, in Rockingham County...  If you have been hoping to buy a home in Rockingham County, you're in luck, there are many more opportunities to do so than in the City of Harrisonburg. In the first seven months of this year we have seen 17% more home sales in the County than during the same timeframe last year. But... one of the reasons why there are more home sales in the County than in the City is because most new homes currently being built are in the County (not the City) and new home sales are on the rise...  While only 175 new homes sold in the first seven months of 2023... we have seen 227 new home sales during that timeframe this year... which marks a 30% increase in new homes selling in our area. We have not, though, seen a 30% increase in existing homes selling...  We have seen... only a 1% increase in the number of existing homes selling in the first seven months of 2024 as compared to 2023. Looking one year further back on the chart above you'll note that the mid-500-ish home sellers who sold during this timeframe in 2023 and 2024 is well below the 708 existing home sales seen during that timeframe in 2022. Mortgage interest rates being what they are continues to impact how many homeowners are willing to sell their home. And now, some graphs to provide some visual insights into these latest trends...  May, June and July have been busy months for home buyers and sellers this year with a total of 401 home sales... as compared to only 352 in the same three months last year. Looking ahead, we are likely to see fewer home sales taking place in August if we track along last year's trend. These last three months have helped 2024 eek ahead of 2023...  After a significant decline in the number of homes selling in our area (1600-ish down to 1200-ish) between 2022 and 2023 we are now seeing a modest increase in home sales activity in 2024. The 789 home sales thus far in 2024 exceeds the 730 seen last year through the end of July, though it is well below the 943 seen in January through July of 2022. And as we have been seeing for quite a few months now, sales are slowly rising and price increases might be slowing a bit...  The bottom blue line, above, shows the annual pace of home sales in Harrisonburg and Rockingham County - measured monthly. Over the past seven months we have been (mostly) seeing this pace of home sales trend upwards. The top green line, above, shows the annualized median sales price in Harrisonburg and Rockingham County - measured monthly. We are still seeing steady increase in the median sales price, but it is not increasing quite as quickly as it has over the past few years. But of note... the median sales price of *detached* home sales is definitely still steadily increasing...  Market-wide median sales price trends can be affected by how many detached vs. attached homes are selling... or how many new vs. resale homes are selling. While the median sales price in our overall market is trending upwards a bit more slowly than in recent years, the detached median sales price is still *steadily* increasing. Just three years ago the median sales price of a detached home was just below $300K and now we are edging closer and closer to $400K. Lots of circles and arrows on this next graph... focus, folks, focus...  The graph above shows the number of contracts being signed each month. We saw much higher levels of contract activity this March, April and May than we did last March, April and May. Then, contract activity in June was about where it was last June... and July contracts were well below levels seen last July. This likely means that we will see fewer closed sales over the next few months, which is confirmed by the latest pending sales trends...  The number of pending sales (under contract homes) peaked in May 2024 and has been declining ever since. That said, current levels (267 pending sales) are still above where we were a year ago (252 pending sales) in Harrisonburg and Rockingham County. Another quirky metric of late has been inventory levels...  Inventory levels (the number of homes for sale at any given time) were steadily trending now between April and June, and then popped back up again in July 2024. The blue line above shows inventory levels last year and you can see a similar increase between the end of June and the end of July... so the increase this year is not unexpected, but does run counter to the steady decreases we had been seeing over the past few months. This following graph, tracking median days on market, has become much more interesting over the past year and a half...  For quite a few years (see the first third of the graph above) the median sales on market was sticking right around five days, regardless of the time of year. All homes were selling very quickly at all times of year. Now, we seem to be seeing a bit more seasonality in this trend, with median days on market (how quickly homes go under contract after they are listed for sale) trending upwards through the fall and winter and then back downwards in the spring and summer. So, don't be surprised if median days on market starts to rise again over the next few months. And finally, one of the main drivers of buying and selling activity of late...  Those darn, silly, pesky, mortgage interest rates. As mortgage interest rates rise, the cost of a monthly housing payment rises, assuming the same sales price. Over the past few years we have seen steadily rising home prices AND rising mortgage interest rates. When we see higher rates, buyers aren't quite as capable or as interested in buying... and sellers (if they would have to then buy again) aren't quite as interested in selling. If or as or when we see mortgage interest rates start trending downwards, we will likely see more buyers AND sellers enter the market. As noted above, during August, rates have fallen even further than shown on the graph... down to 6.47% and I have seen some buyers locking in as low as 5.99% recently. So, having absorbed all of those insights into the latest trends in our local housing market, what does it all mean for you? If you are thinking about buying a home in the next few months... things might see a smidge more hopeful. Mortgage interest rates are trending down a bit. Inventory levels are trending up a bit. Days on market might trend upwards a touch. Many segments of the market are still moving very quickly and are still very competitive, but not all segments of the market. Depending on what type of property you want to buy, and its location, and its price range -- you might be competing with multiple other buyers within a day of a house being listed for sale -- or you might actually be able to sleep on your decision about whether to make an offer on a new listing. If you are thinking about selling your home in the next few months... it is still relatively likely that it will sell quickly and almost certainly at a very pleasing price... but all property types, locations and price ranges are not performing equally right now. We'll want to dive a bit deeper into the data related to your specific home to devise the best pricing strategy and to give you reasonable expectations as to how quickly your home will sell. If you have questions about buying, selling, the process, the market or anything else, you are more than welcome to reach out anytime. You can contact me most easily by phone/text at 540-578-0102 or by email here. All the best to your and your family as this new school year begins... and if you don't have anyone in your life starting a school year, then just get excited about the eventual return of cooler temperatures as we head into the autumn months. :-) | |
Annual Home Sales Have Been Declining For Two Years But Might Be Rising Again In 2024 |
|
 The green bars above show years when the number of home sales (per year) increased compared to the prior year. The red bars above show years when the number of home sales (per year) declined compared to the prior year. The past two years (2023, 2022) showed declines compared to the previous year -- but we seem likely to see an increase in 2024. Home Sales In The First Six Months of 2023 = 610 Home Sales In The First Six Months of 2024 = 658 Perhaps we'll be able to add another green bar to the chart above for 2024, showing an increasing number of annual home sales, yet again. | |
Midway Through 2024, Home Sales Are Increasing But Sales Price Increases May Be Slowing |
|
 Happy Thursday... and... Happy Free Slurpee Day! ;-) We are officially halfway through 2024! Wow! It has been a whirlwind of a start of the year... and a HOT start to summer. I enjoyed seeing many of you at Red Wing Roots Music Festival earlier this summer, and I am looking forward to several upcoming trips with my family. I recently ran in VA Momentum's Valley 4th Run (5K) and felt both accomplished and old to have been an age group winner. Accomplished for winning my age group... and old for having moved up to the 45 - 54 age group... which is probably also why I was able to win my age group. ;-) But, as a client pointed out... better to feel accomplished and old... than to just feel old!  Before we get started on the latest data on our local housing market, each month I offer a giveaway for readers of my market report. This month I'm giving away a $50 gift card to Broad Porch Coffee. If you haven't checked out their new location on Court Square, you should. I recommend the bread pudding... and many other items on their food and drink menu. Click here to enter to win the gift card. And now, let's take a look at what has been happening in our local housing market over the first half of 2024... 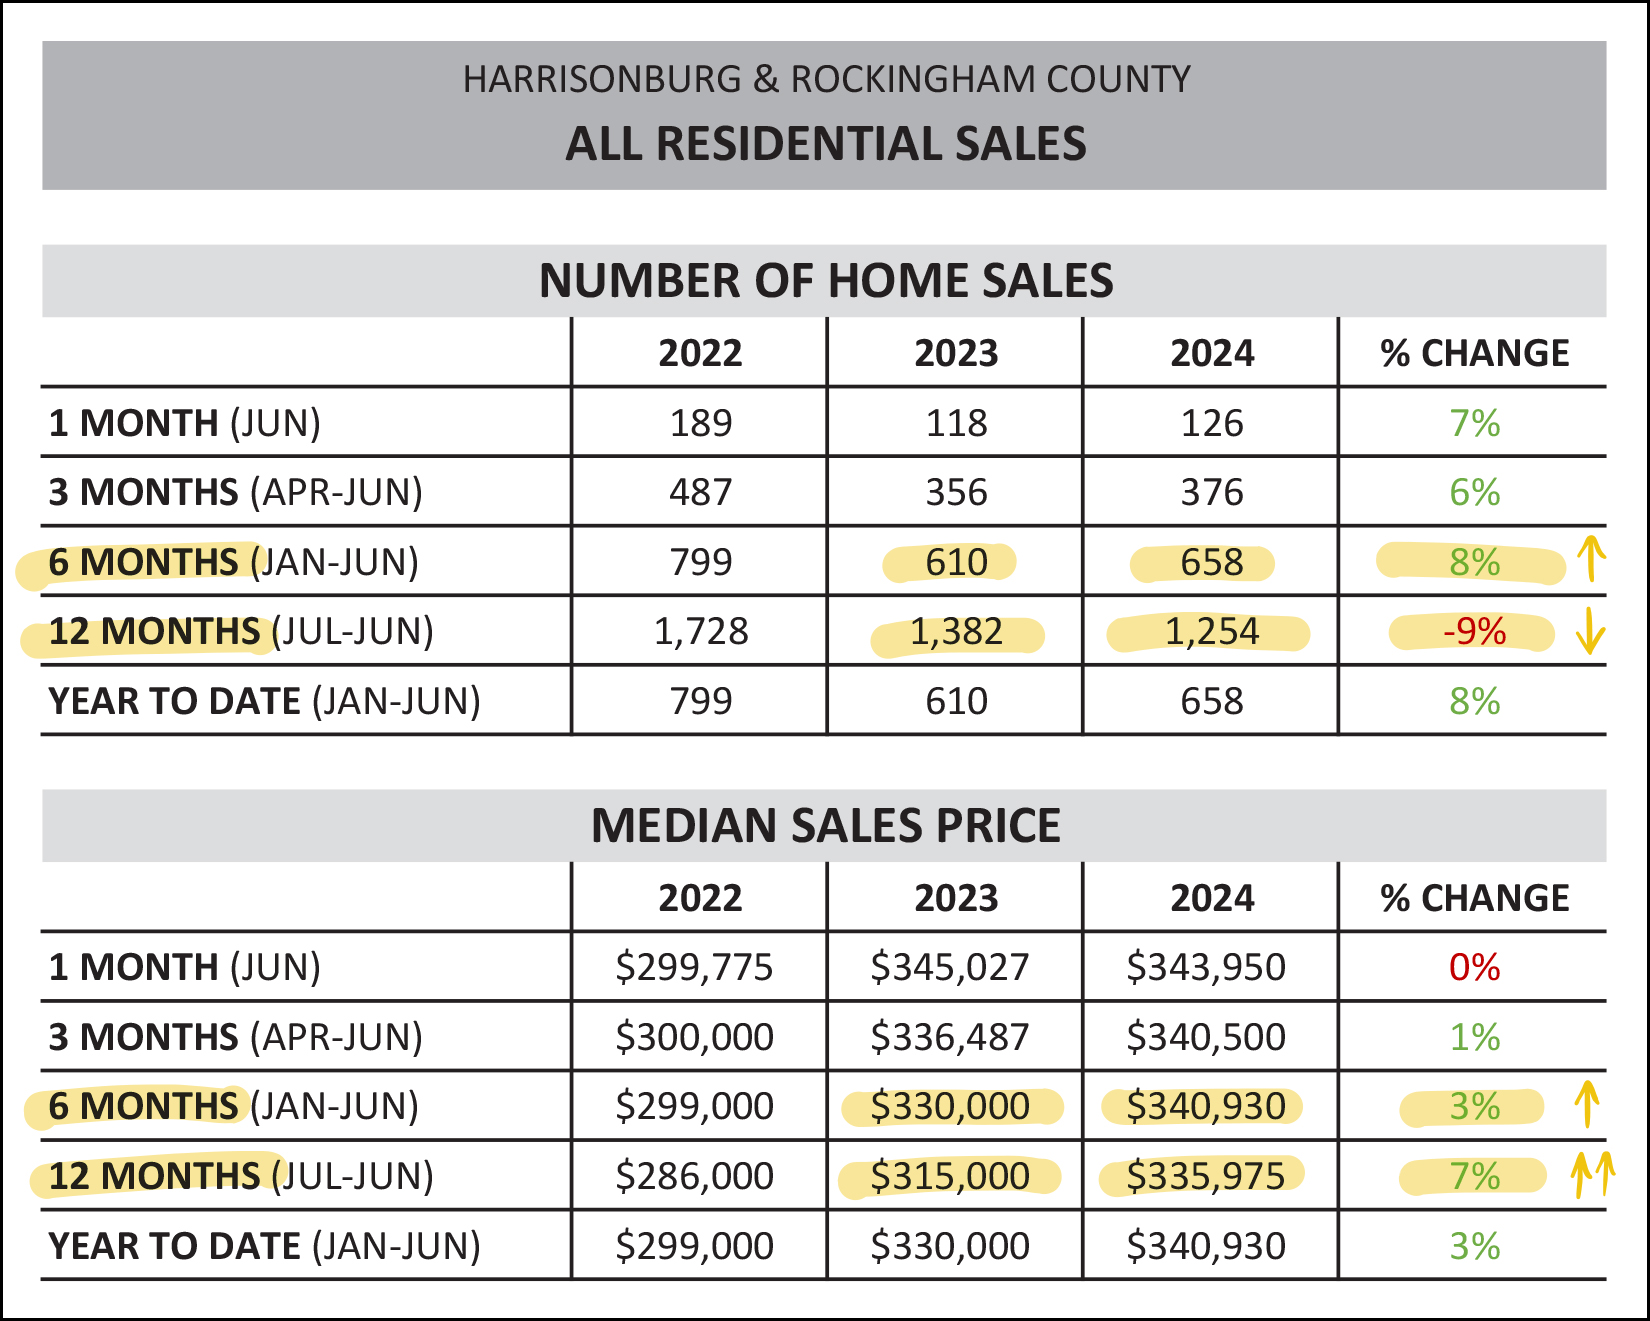 The chart above captures all home sales in Harrisonburg and Rockingham County as reported in the HRAR MLS. I'm noting a few things... [1] Despite a 9% decrease in sales when we compare the past 12 months to the 12 months before that... there has been an 8% increase in home sales when comparing the first six months of 2024 to the first six months of 2023. So... home sales seem to be increasing again in 2024 as compared to where things were in 2023. [2] We have only seen a 3% increase in the median sales price when comparing the first half of 2024 to the first half of 2023... compared to a 7% increase when we look back 12 months compared to the prior 12 months. So... it seems that price increases may be slowing a bit. Read that again, though, prices are still increasing... just more slowly than they had been. But let's dig a bit deeper into a few subsets of the market, starting with detached homes... 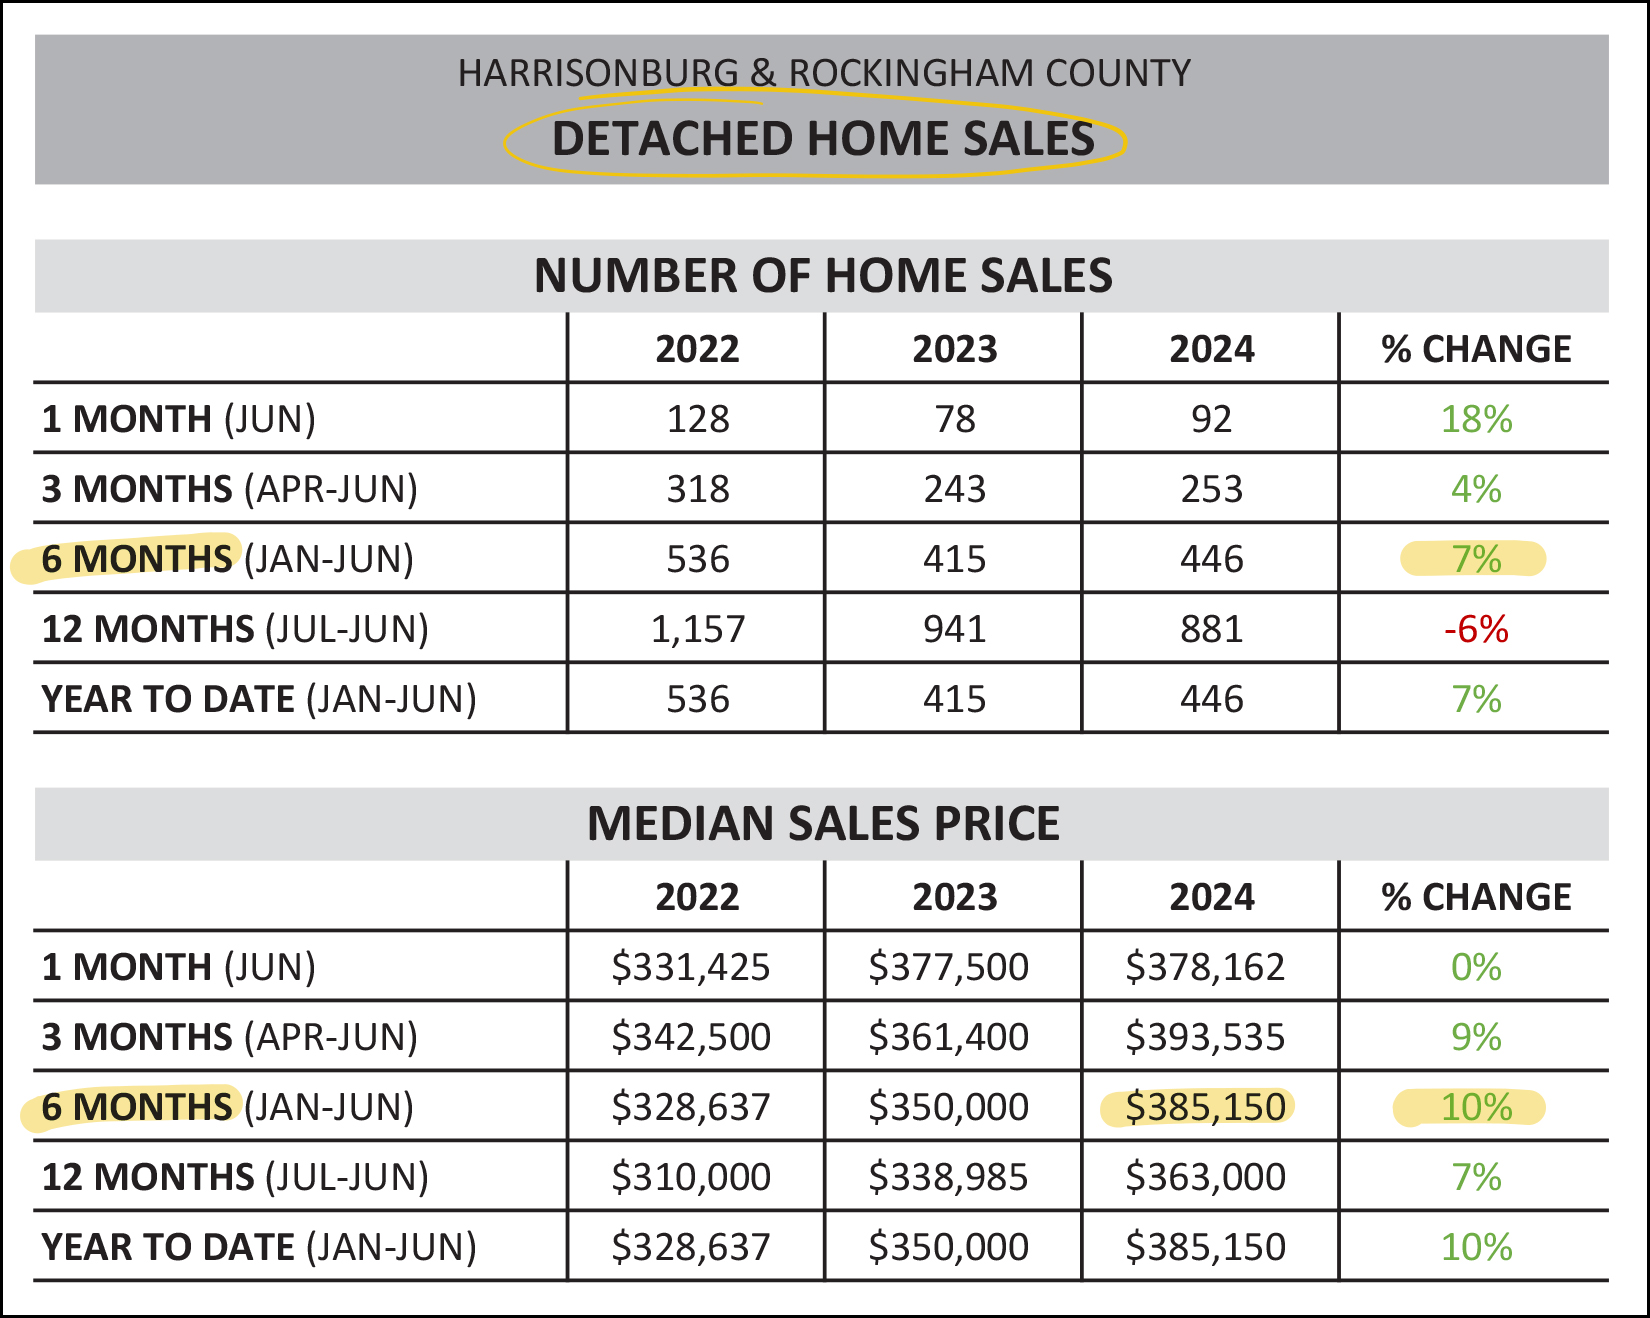 When looking only at detached homes (which does not include duplexes, townhomes or condos) we find... [1] There have been 7% more home sales in the first half of 2024 compared to the first half of 2023... which is pretty similar to the 8% increase in the overall market. [2] The median sales price of detached homes has increased 10% in the first half of 2024 to a median sales price of $385,150. That is to say that half of single family homes sold in the first half of 2024 sold for $385,150 or more... and half sold for $385,150 or less. Now, how about those attached homes... 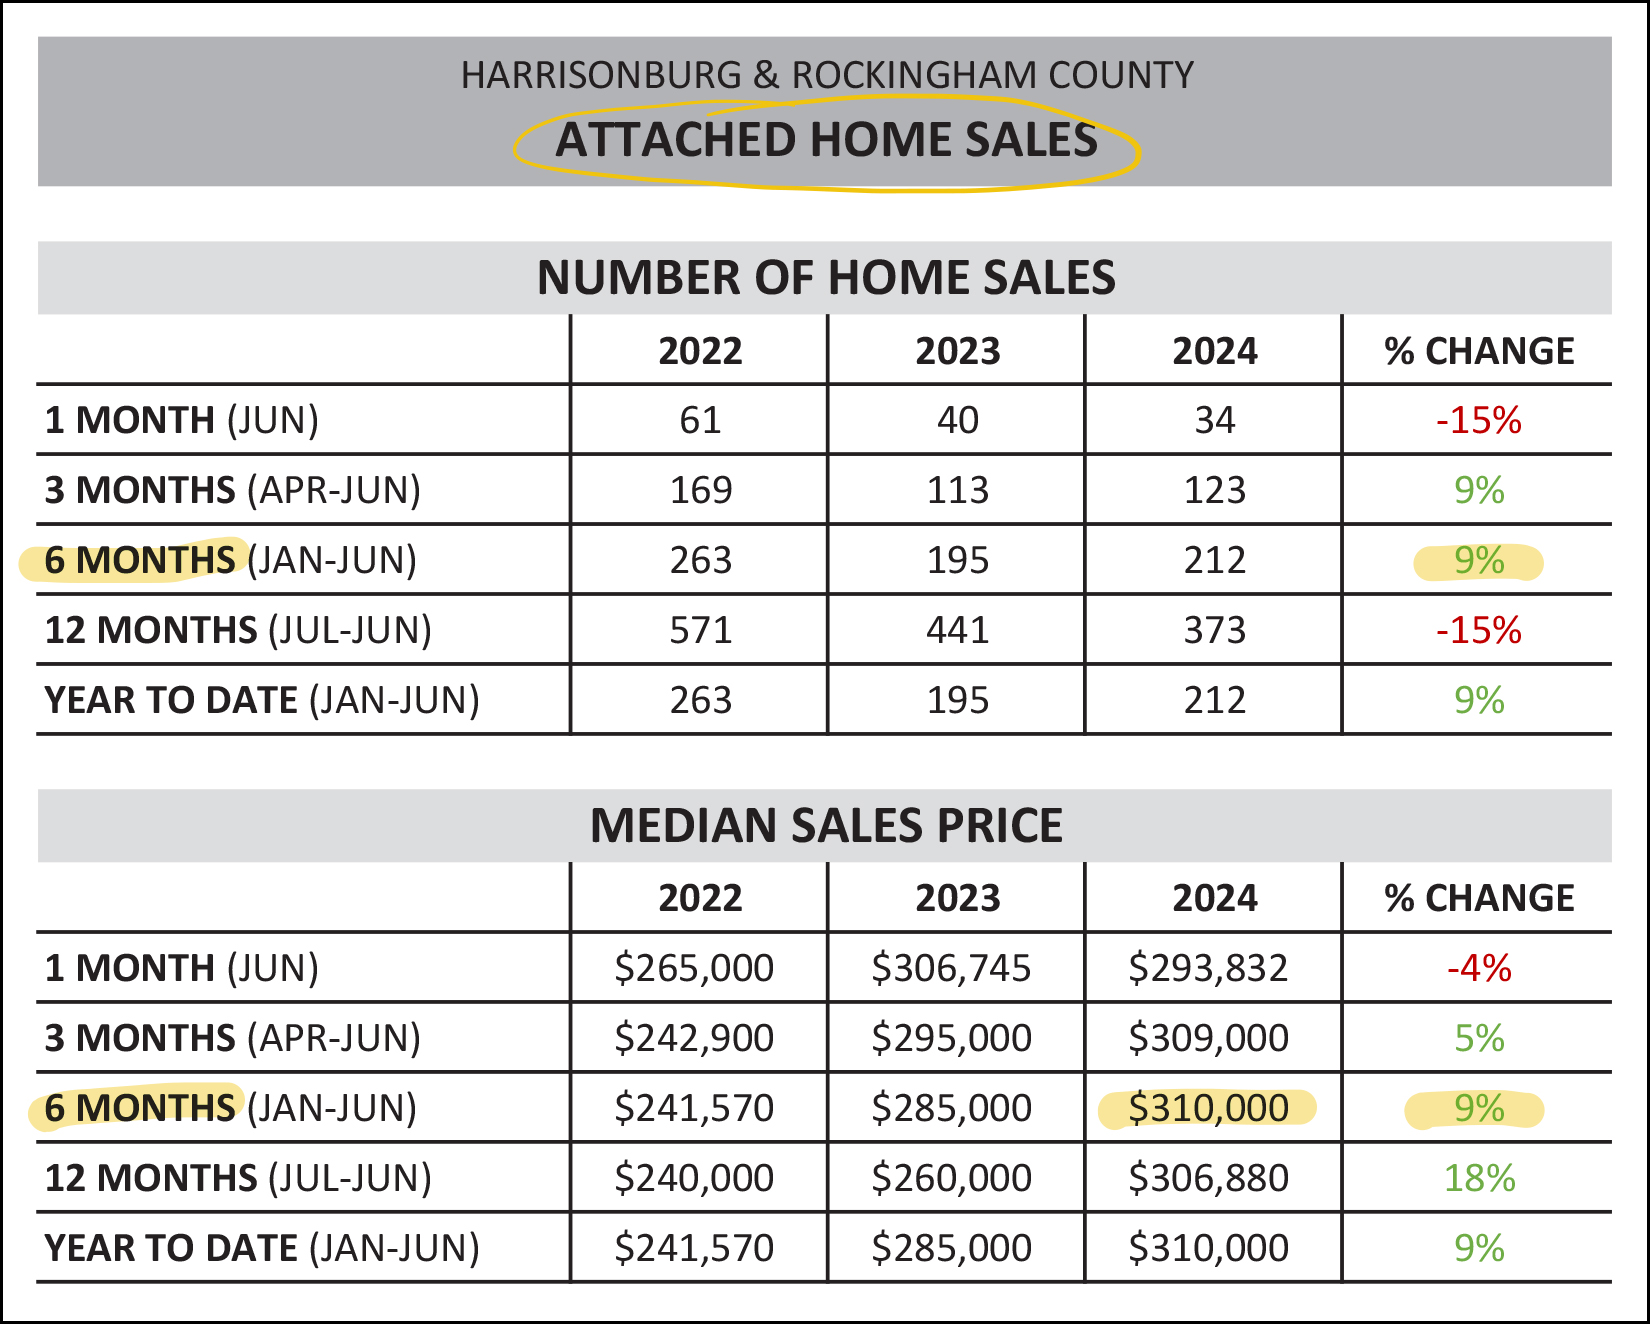 When looking only at attached homes (duplexes, townhomes, condos) we find that... [1] There have been 9% more attached home sales in the first half of this year as compared to the first half of last year. [2] The median sales price of attached homes has risen 9% to $310,000. Again... that means that half of attached homes (that have sold) have sold for $310K or higher, and half sold for $310K or lower. Now what about just the City of Harrisonburg... 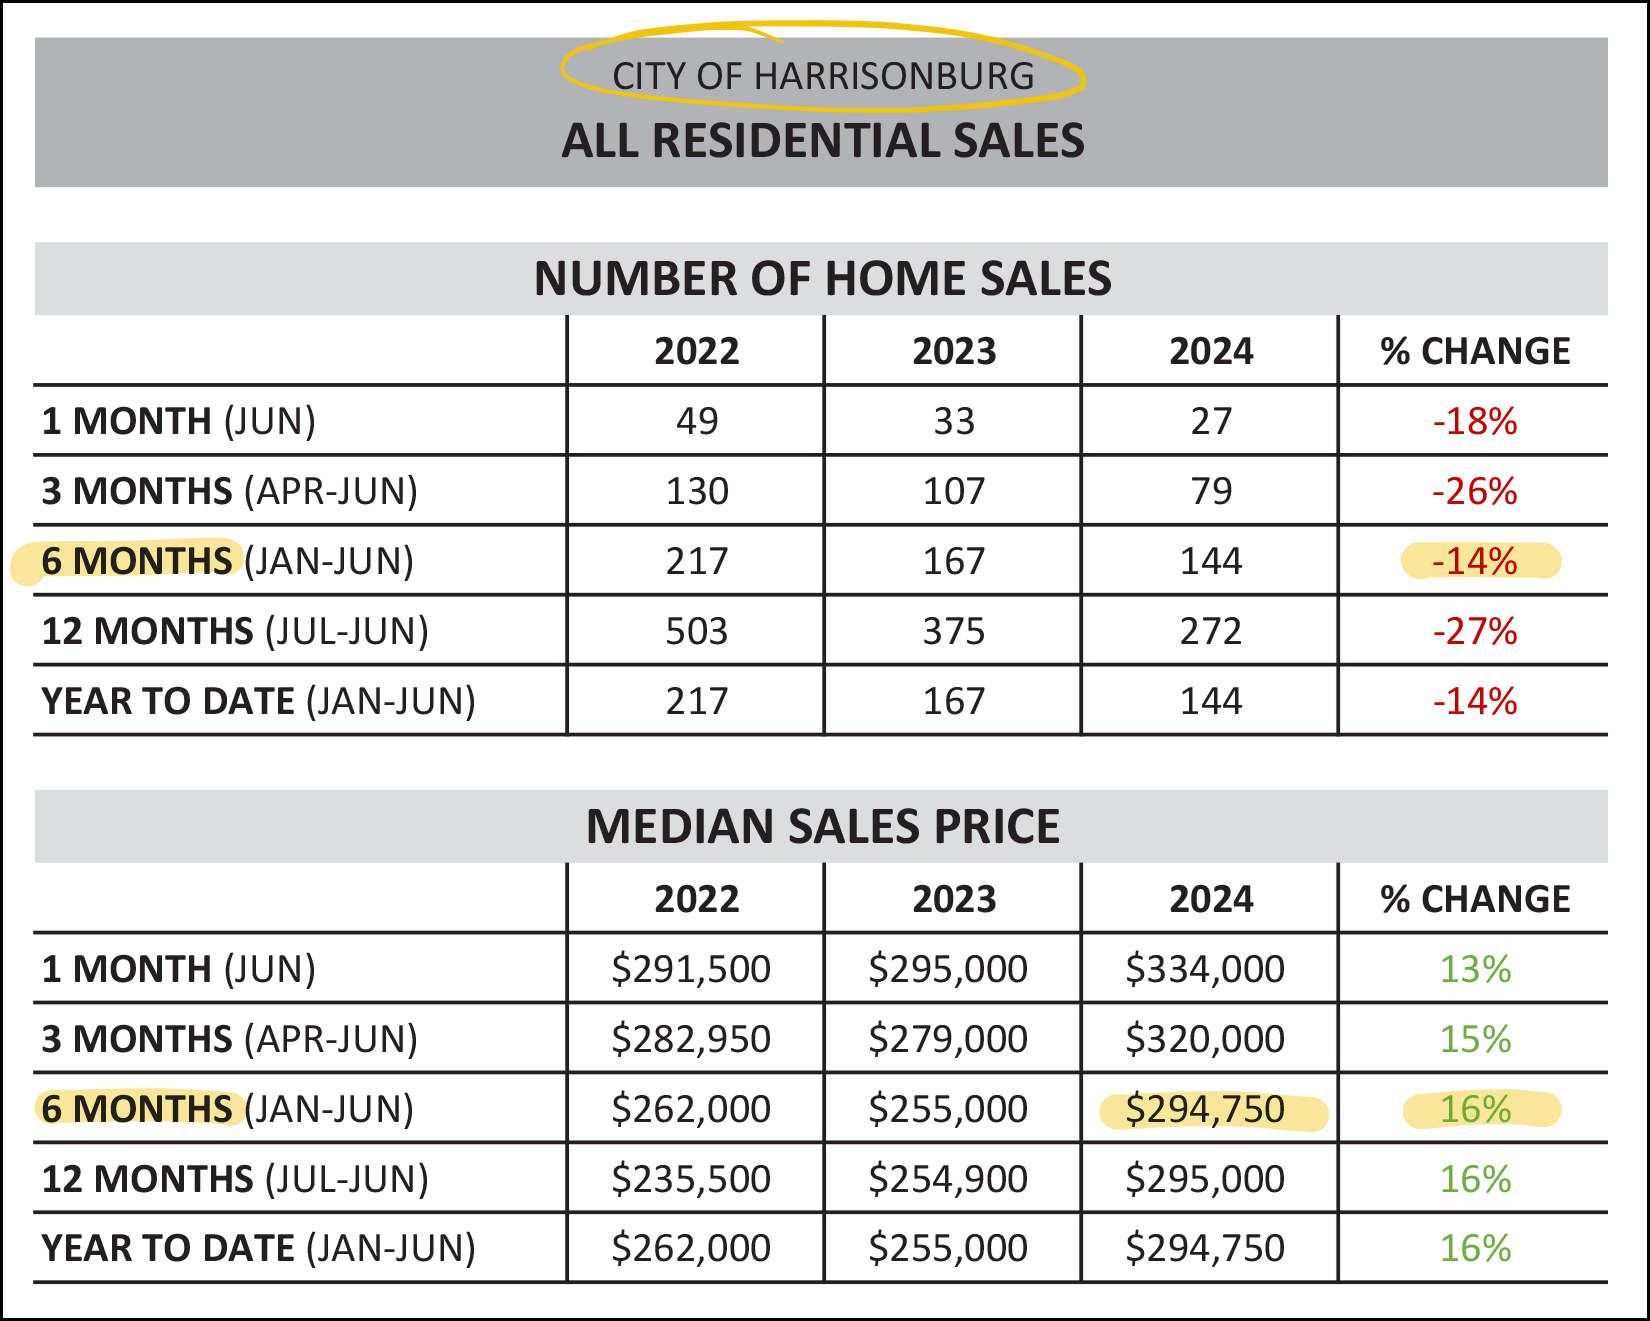 It has been a bit harder to find a home to buy in the City this year... with 14% fewer homes selling in the first half of the year as compared to the same timeframe last year. At least part of this is explained by the large number of new homes being built in the County and the small number being built in the City. Without much "for sale" housing being built in the City, the number of homes selling in the City relies almost entirely on resale homes -- current homeowners deciding to sell. Perhaps the limited supply of homes selling in the City is why we have seen a larger (16%) increase in the median sales price of homes sold in the City thus far in 2024. In contrast, in the County... 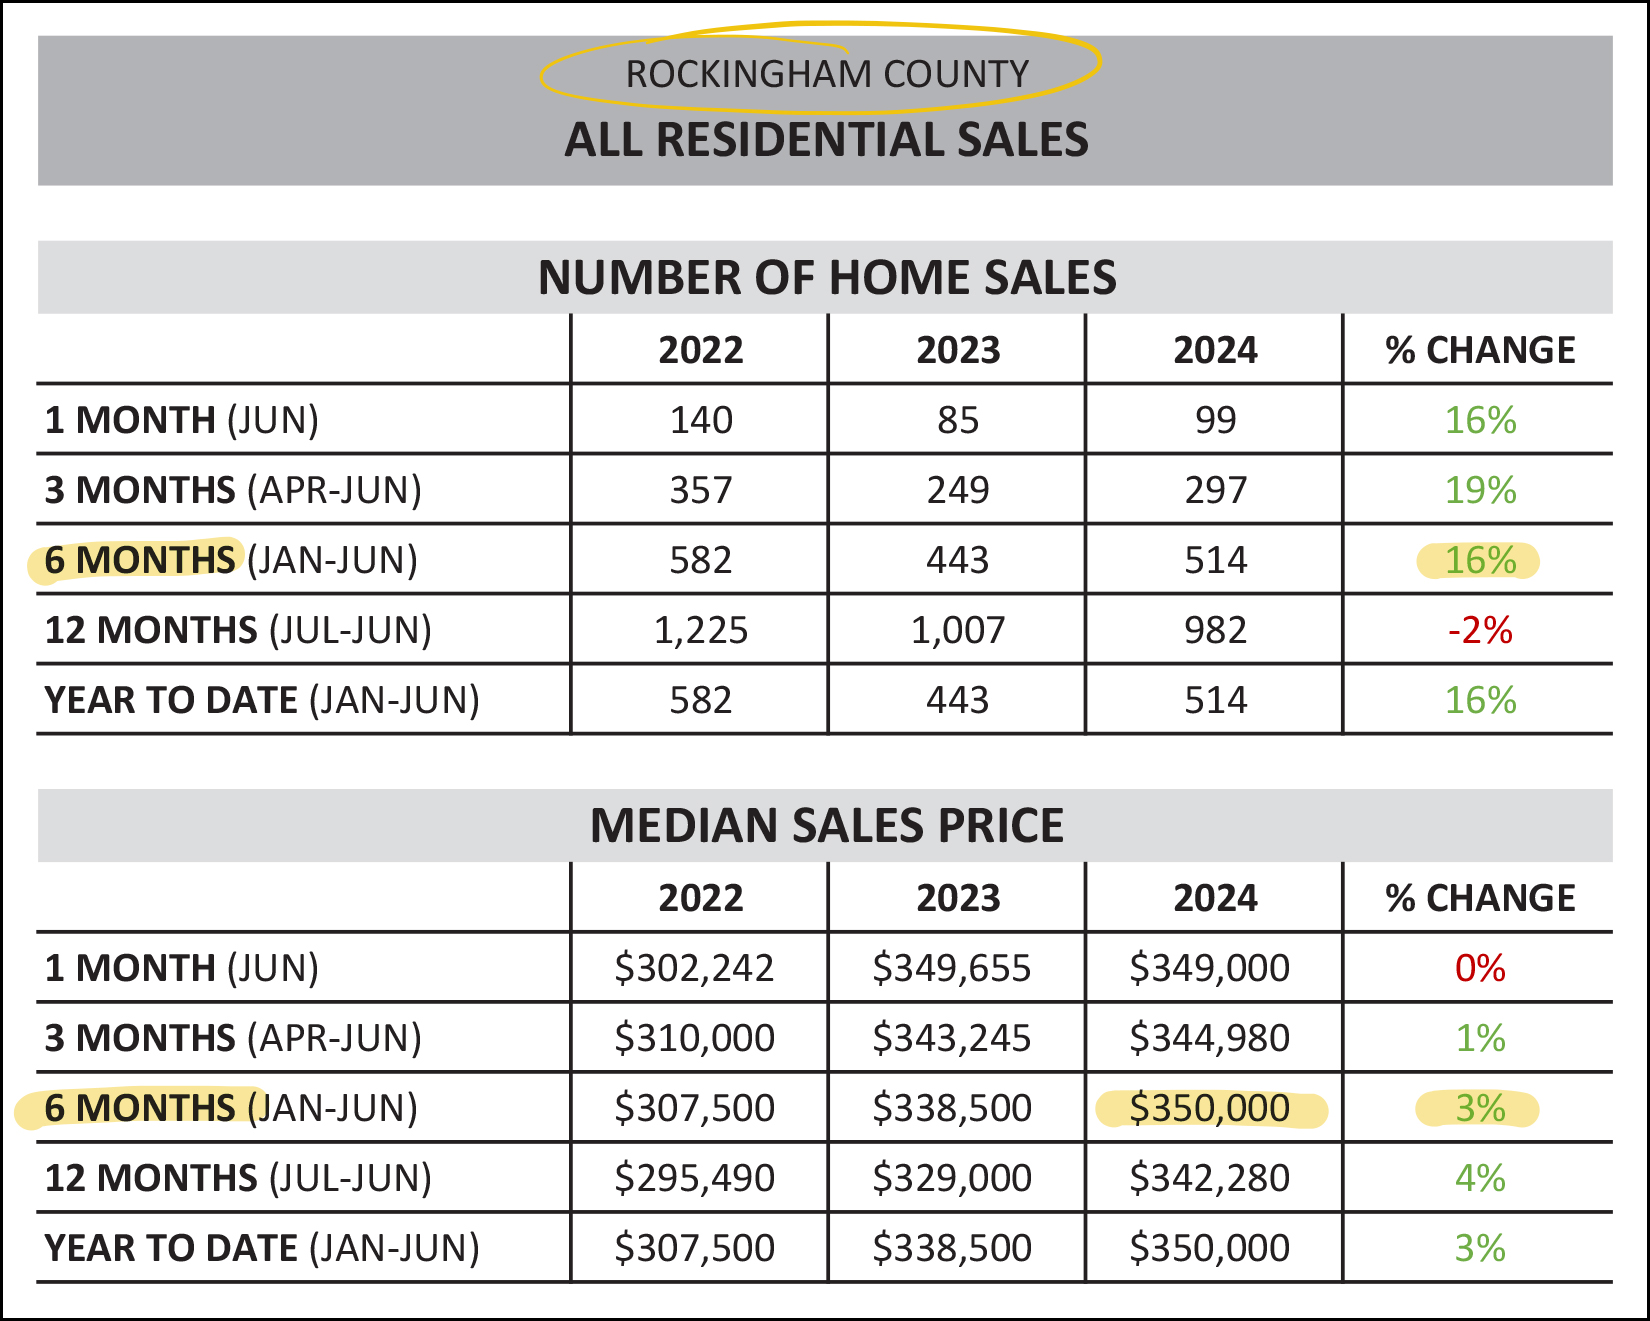 Perhaps due to the larger number of new homes being built in Rockingham County, we have seen a 16% increase in the number of home sales taking place in the County in the first half of this year compared to the first half of last year. The median sales price, however, has only increased by 3% in Rockingham County compared to the 16% referenced earlier in the City of Harrisonburg. Since I've mentioned new home sales a few times, let's take a look at what is happening there... 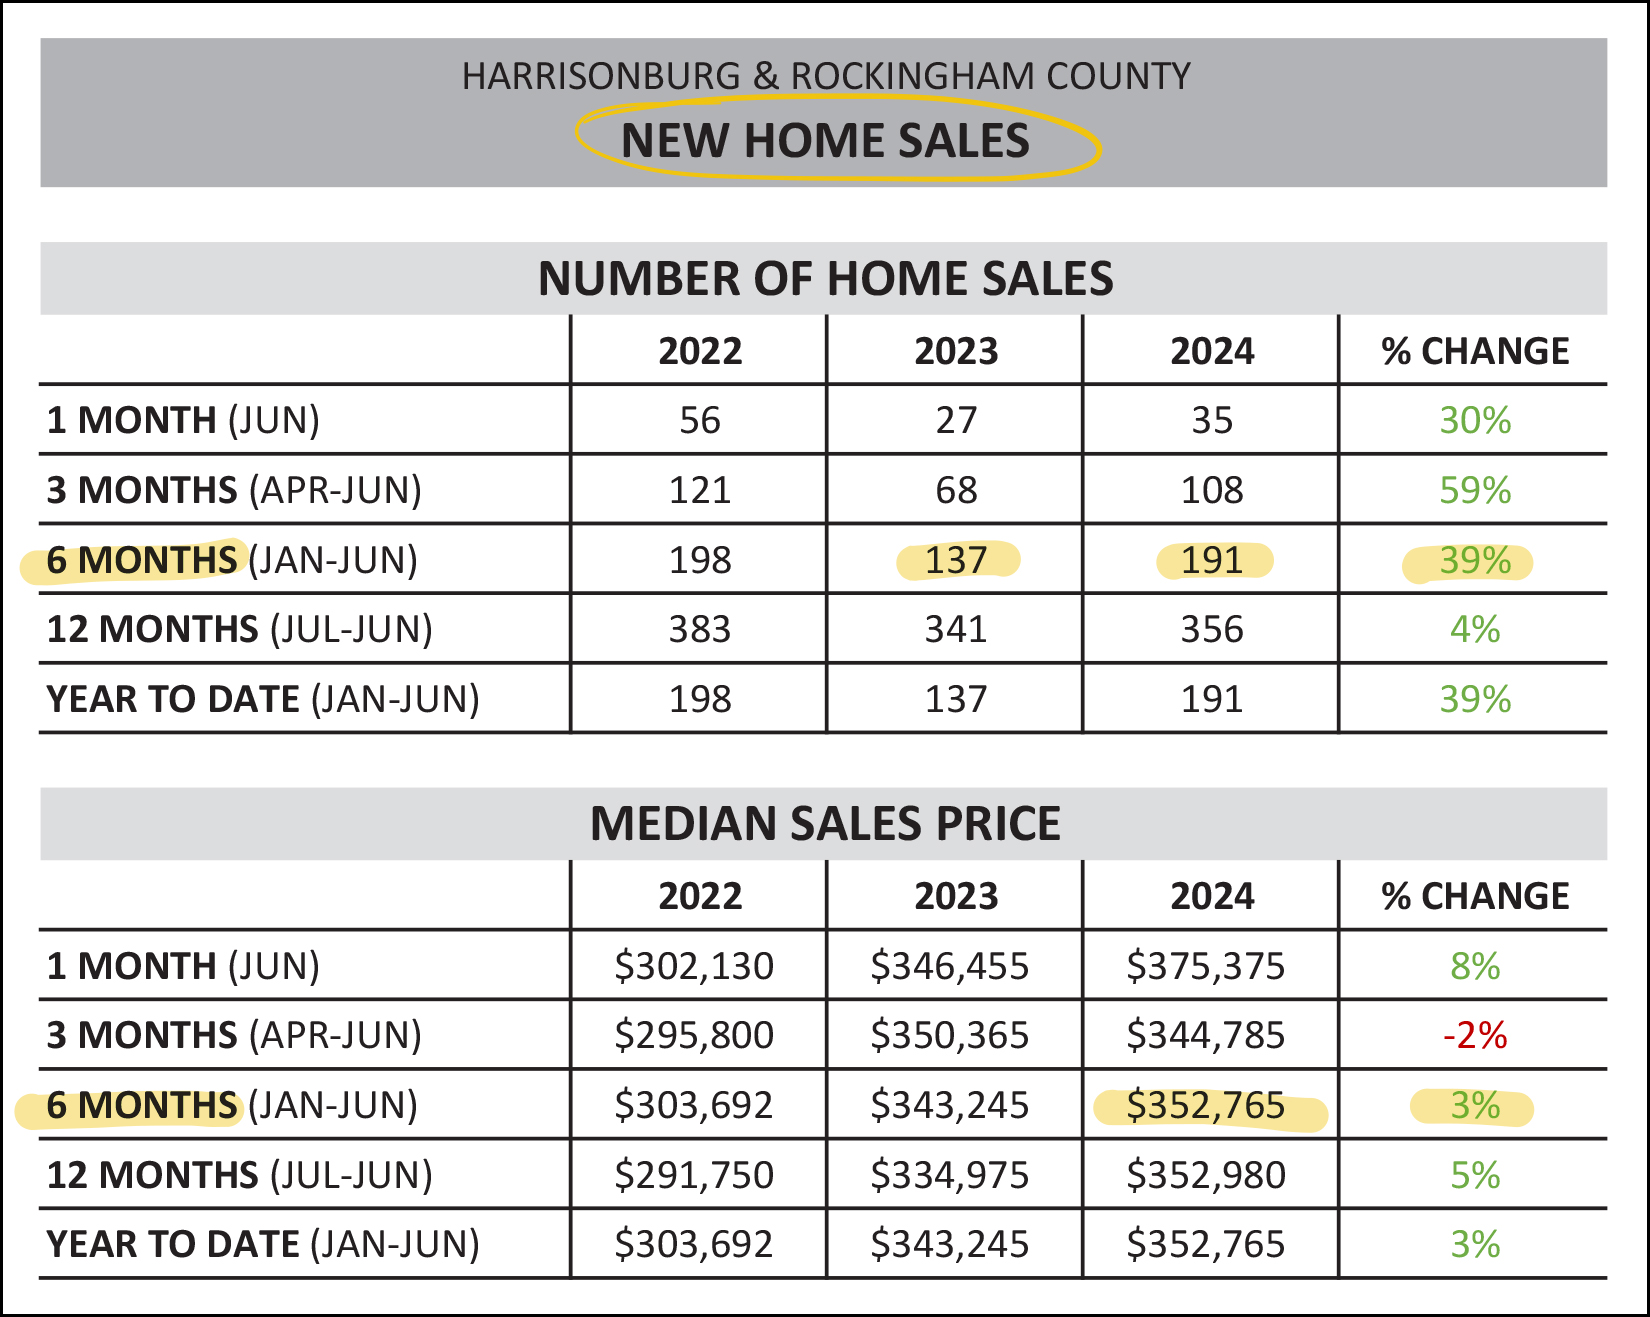 As shown above, we have seen a 39% increase in new home sales in the first half of this year (191) compared to the same timeframe last year (137) though this really just brings us back to the same approximate amount that we saw two years ago (198) in the first half of 2022. Also, the median sales price of new homes has only increased 3% over the past year... from $343K-ish to $353K-ish. And if we strip out all of the new homes, here's what we find in the resale market... 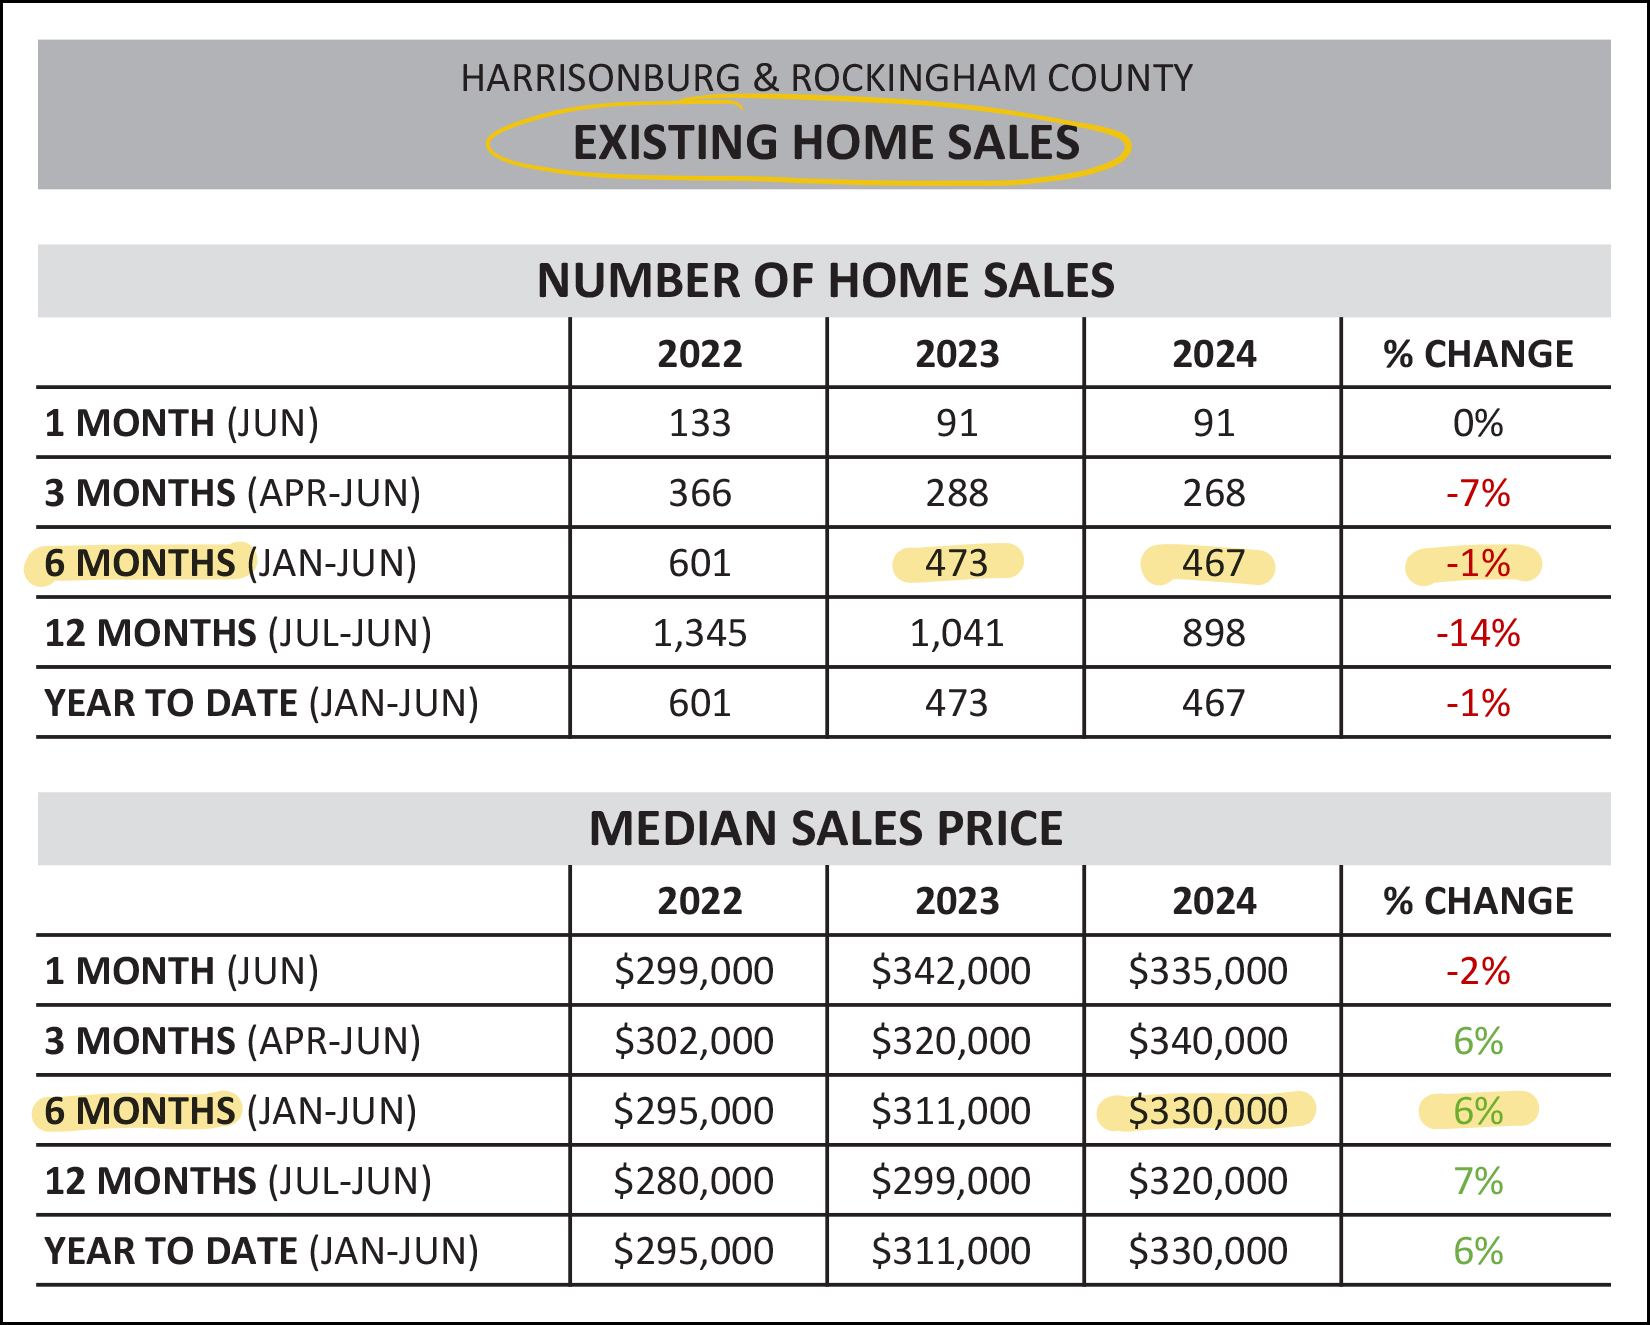 Despite an increase in the overall number of homes that are selling in Harrisonburg and Rockingham County... there has actually been a 1% decrease in the number of existing homes that are selling. That's a small change, but it is headed in the opposite direction of our overall market. If the smaller number of existing home sales is at all related to a decreased number of sellers being willing to sell their homes, that might explain the slightly higher increase in the median sales price of existing home sales this year (+6%) as compared to the increase in the median sales price of all homes (3%). OK, taking a breath now... that's all of the charts and numbers. Now let's allow some graphs to help us visual learners understand the latest trends in our local real estate market... 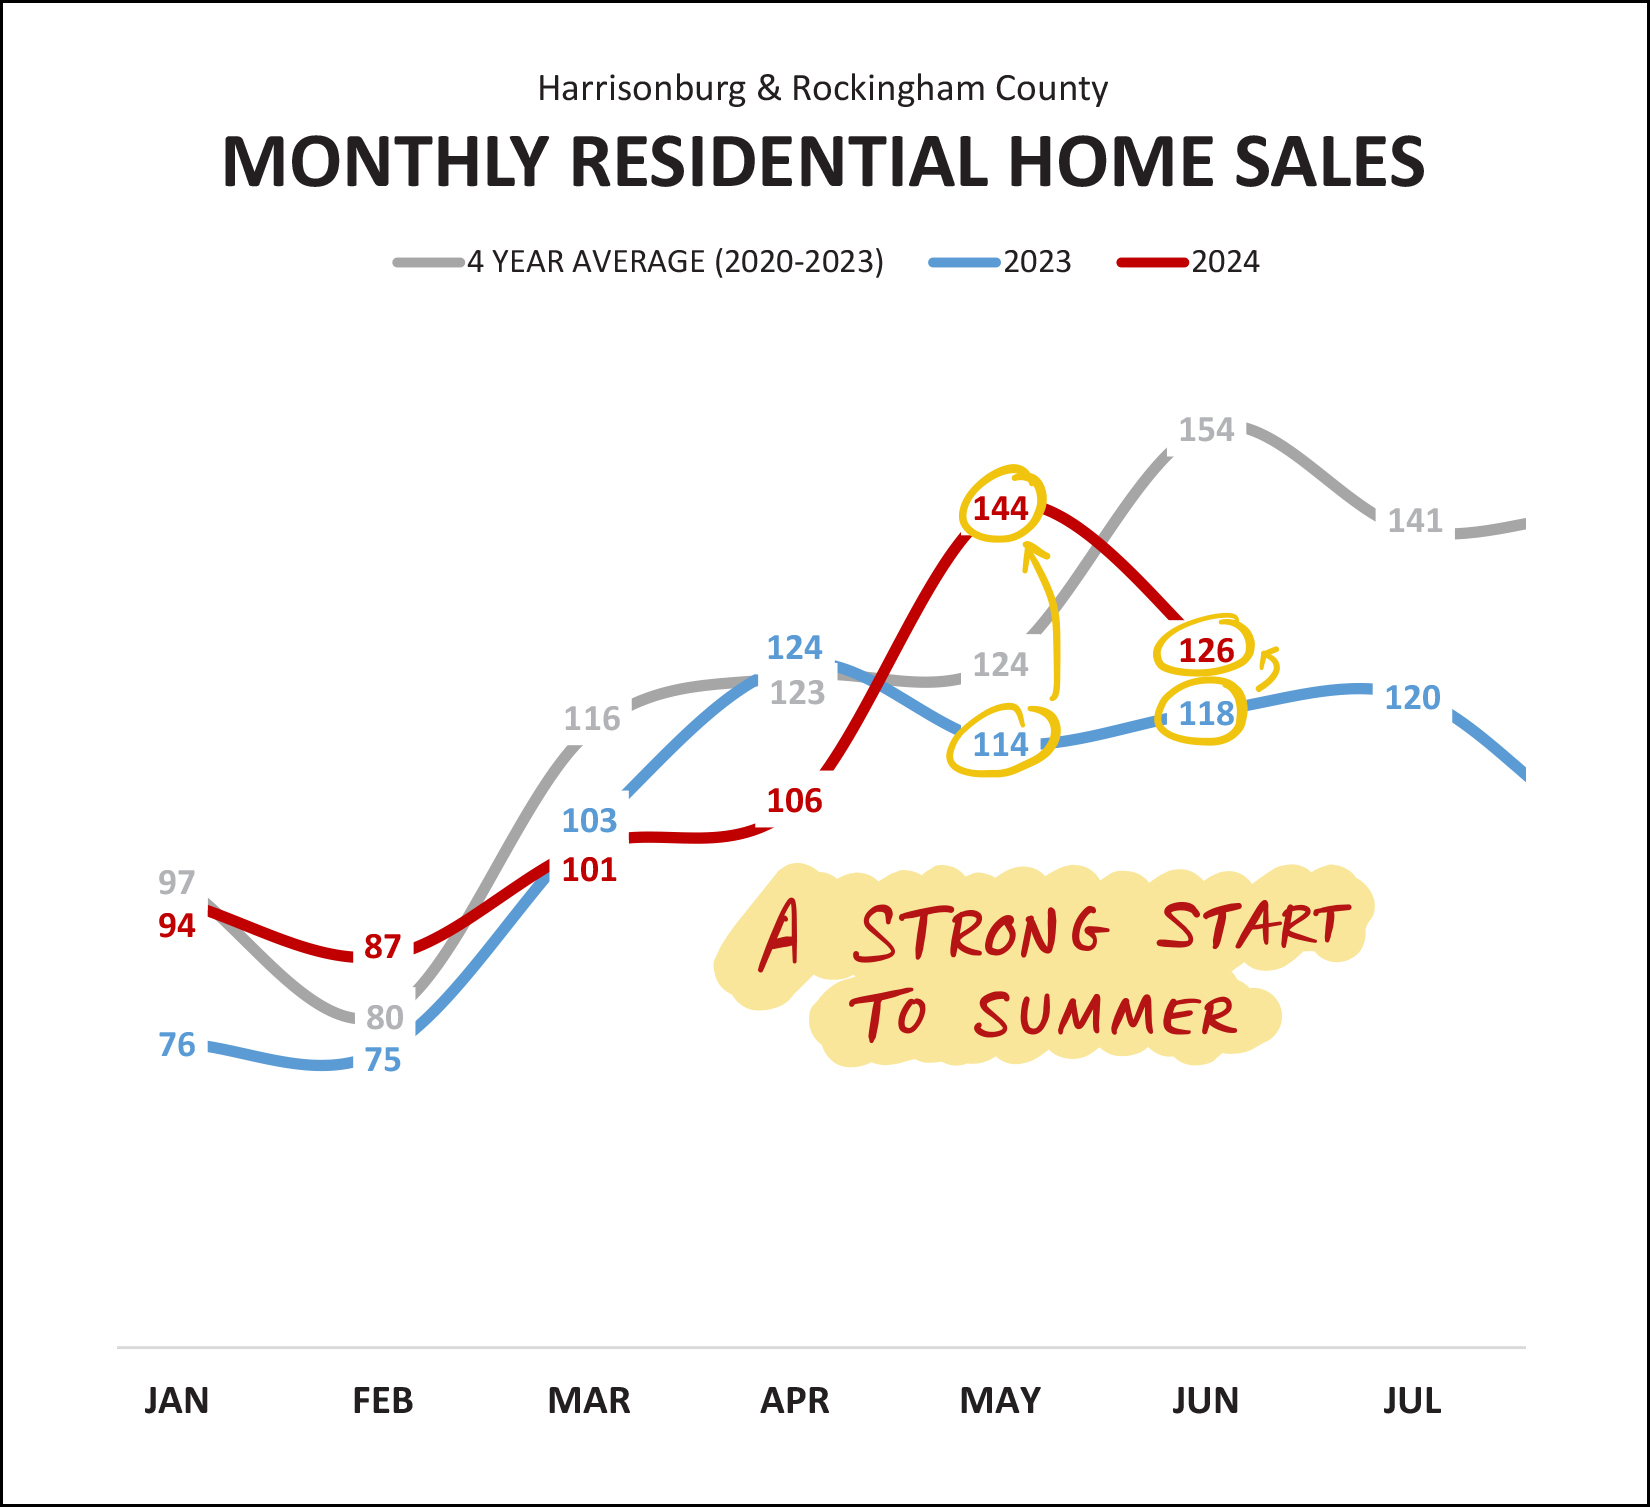 We saw a LOT of home sales in May 2024... 144 of them... compared to only 114 the prior May. This left me at least partially wondering whether we would see fewer home sales this June than last June due to that particularly busy May. But this June outperformed last June, even if not by as much as the month of May. These two months of stronger sales (May, June) compared to last year have contributed to the overall increase in home sales between the first half of 2023 and the first half of 2024. Which is shown... here... 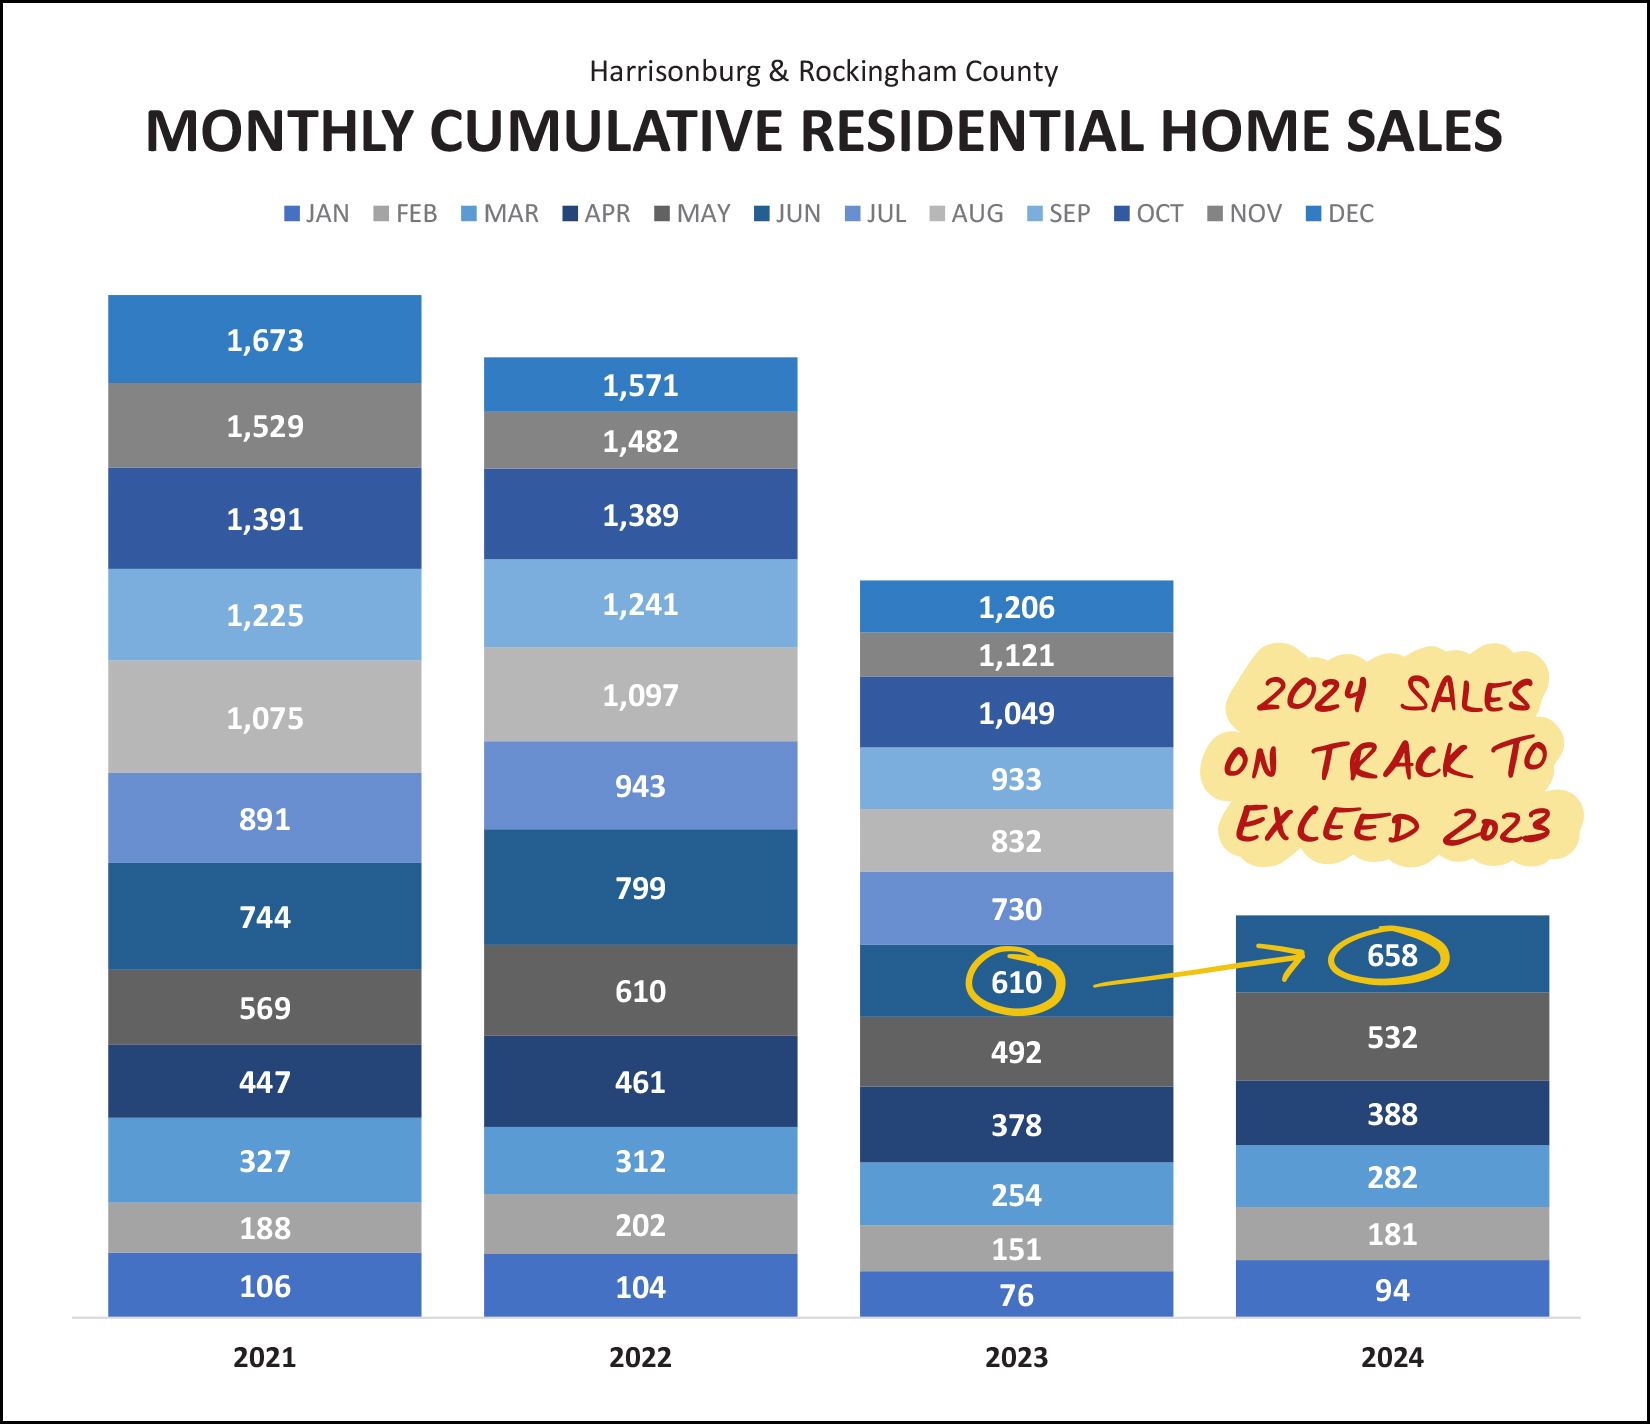 After several years (2022, 2023) of declining numbers of home sales in Harrisonburg and Rockingham County, perhaps we will see an increase in 2024. Given the increase from 610 sales to 658 sales in the first half of 2023 and 2024, it seems likely that we will finish out 2024 with more than the 1,206 home sales seen last year. You can also see that turnaround in the pace of home sales here... 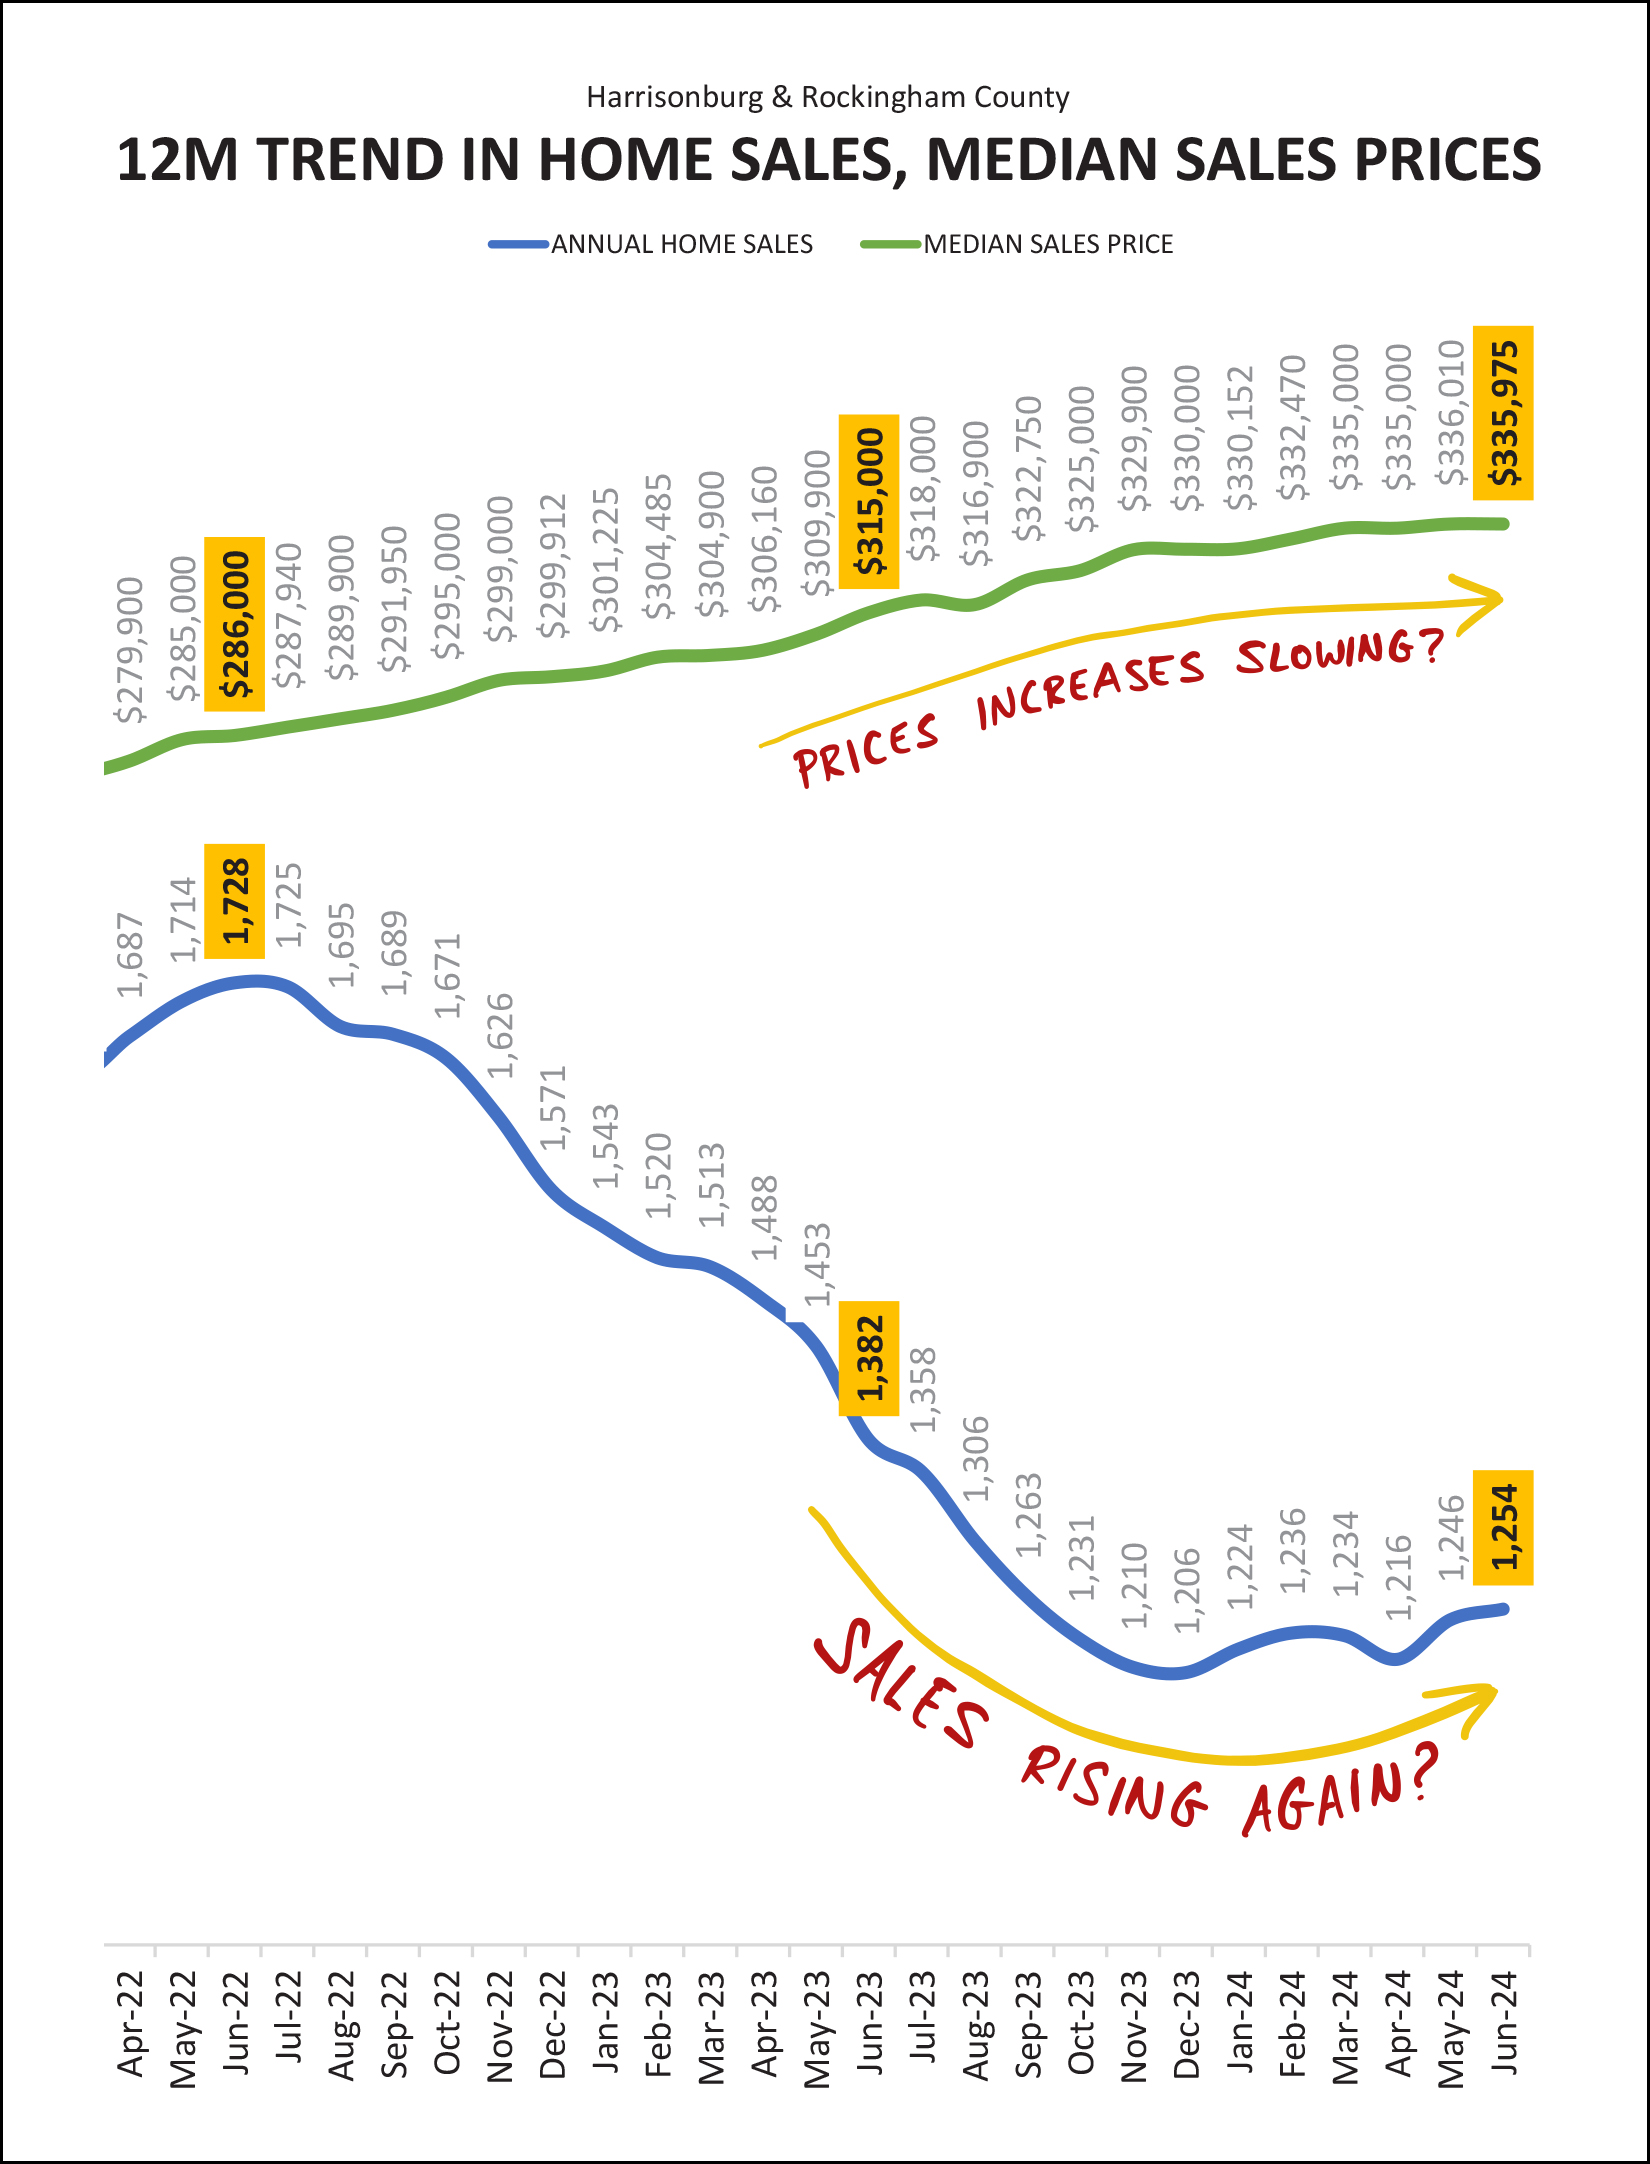 The blue line above is tracking the number of home sales taking place in a year's time, measured each month. As you can see, that metric has started to trend upwards again over the past six-ish months after over a year of declines. The green line above shows the median sales price, which has been steadily increasing for years. The median sales price is still increasing, but those increases might be slowing. Technically, the median sales price decreased a bit over the past month, but only by $35, so we'll wait to see what happens over the next few months before jumping to any conclusions. Here's another look at those same metrics of quantity of sales and home prices... 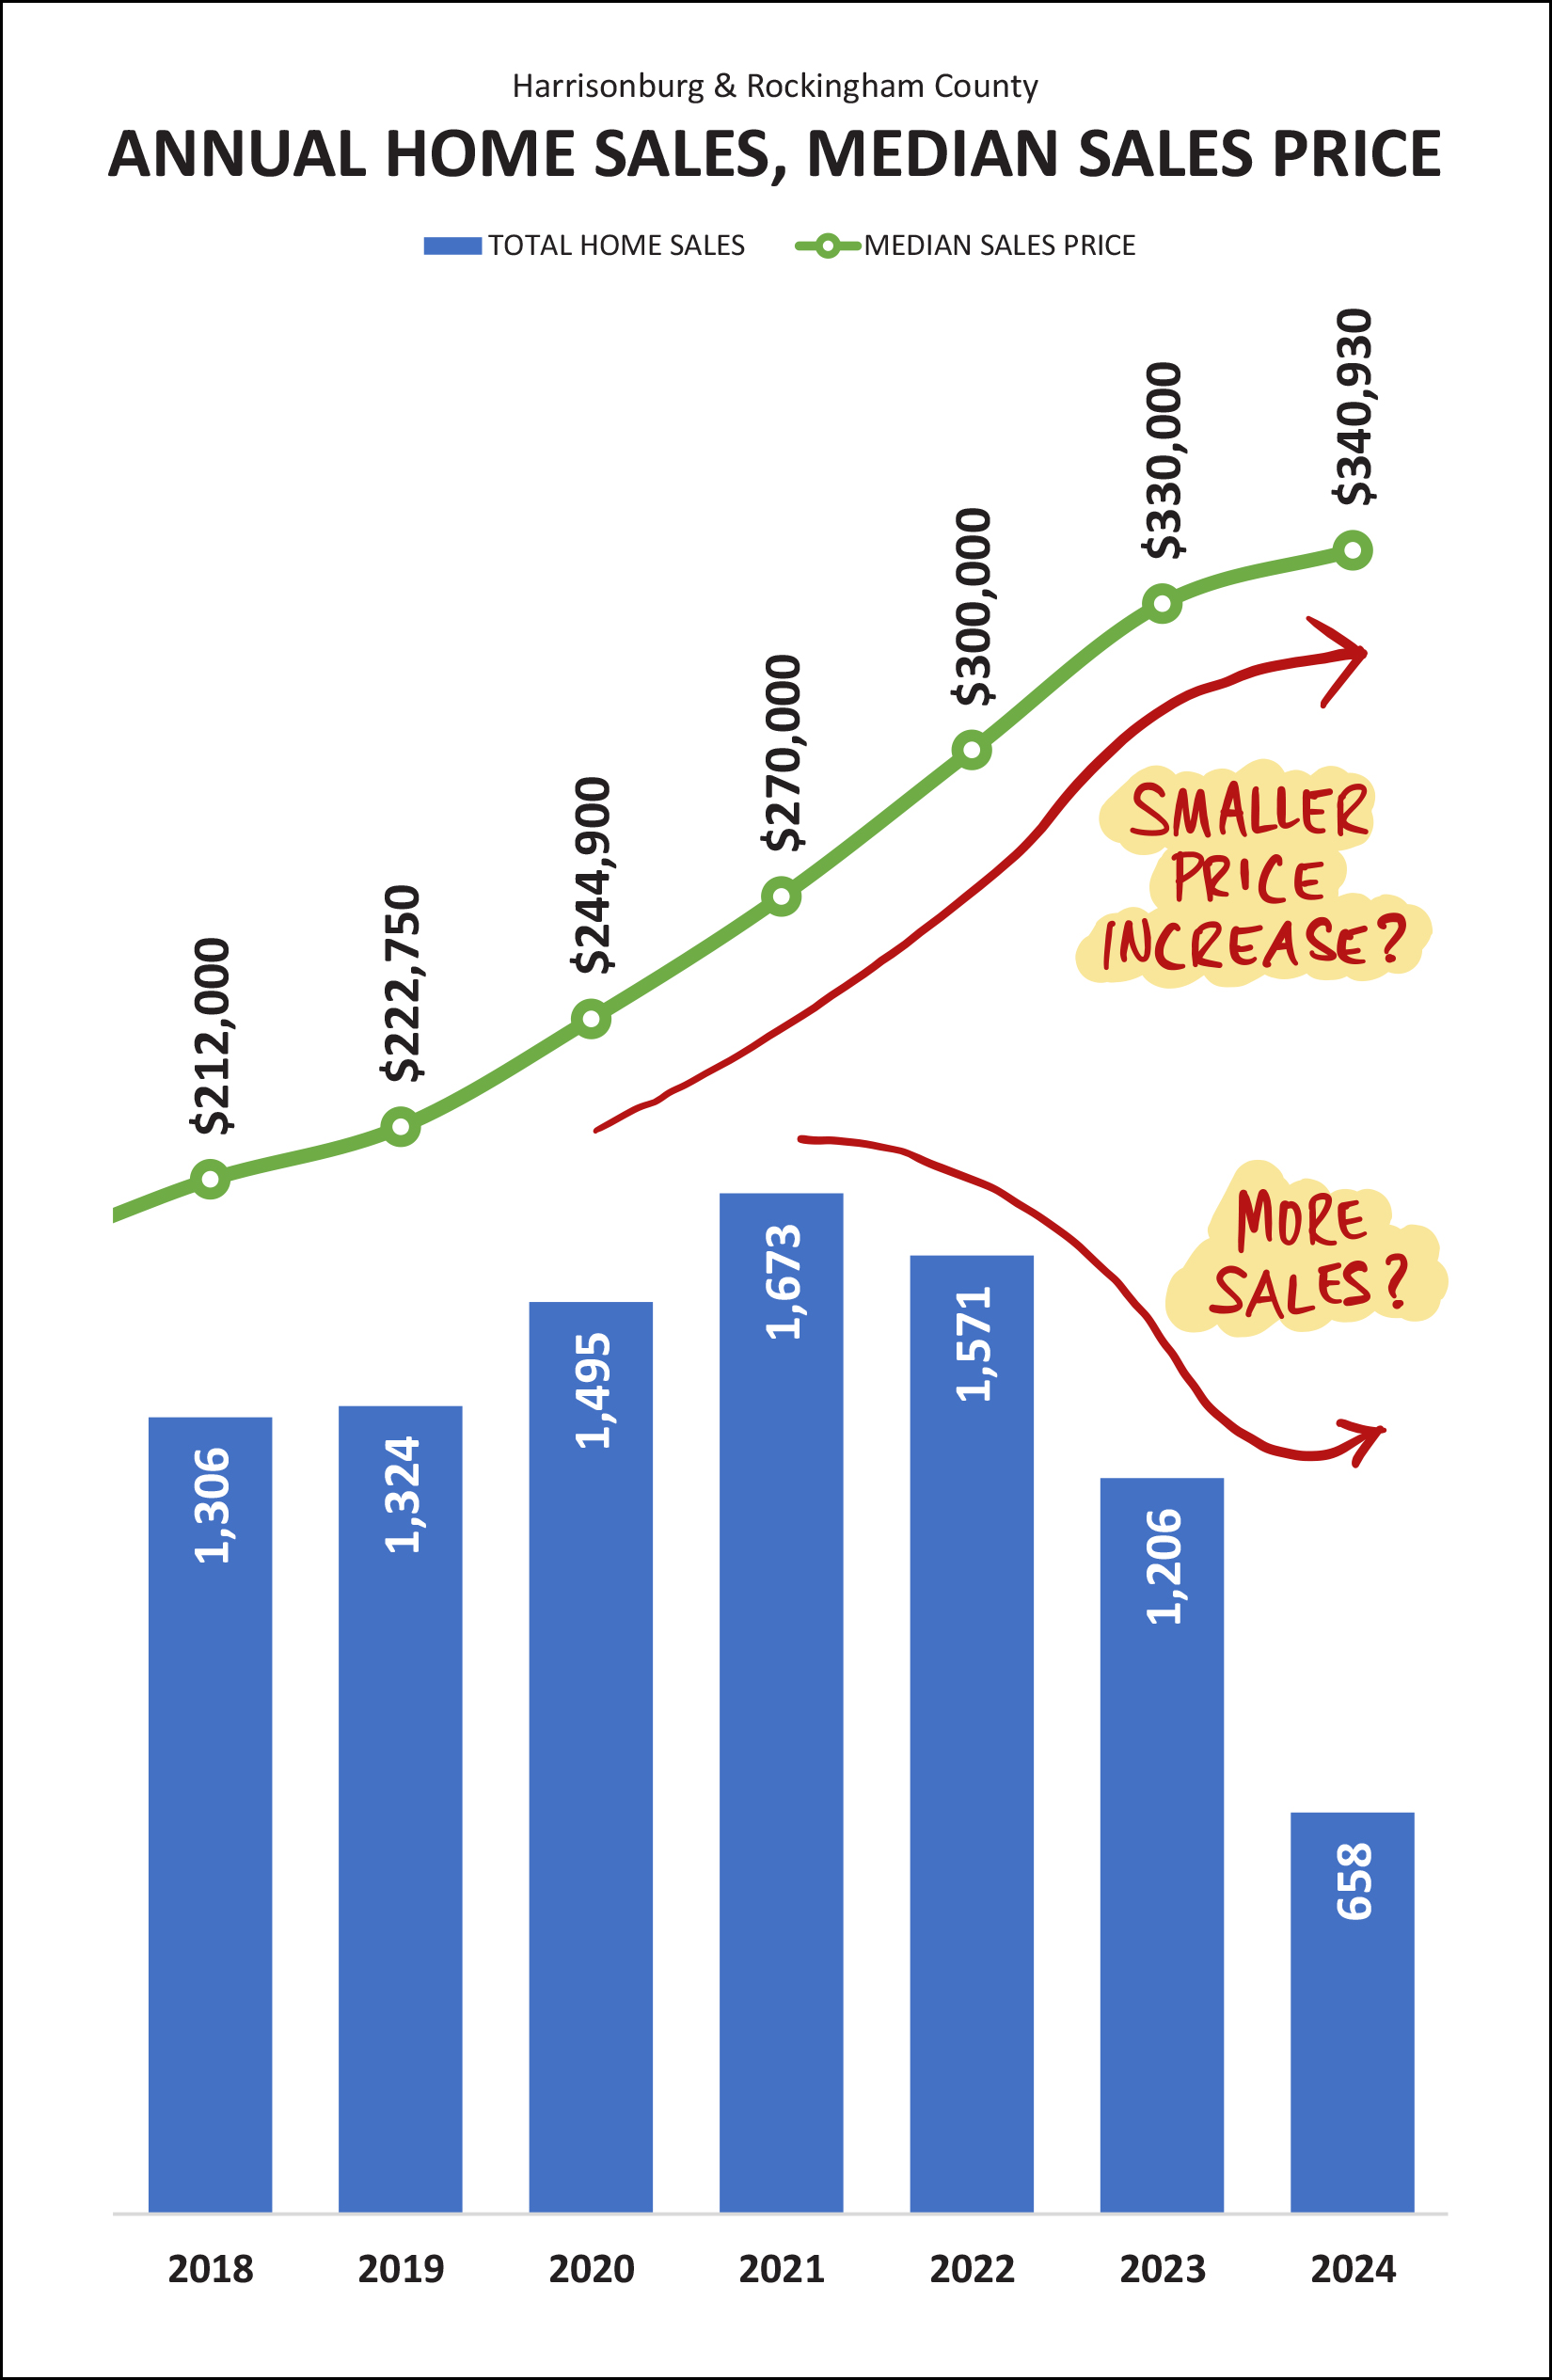 The green line (median sales price again) clearly seems to be going up (increasing) more slowly in 2024 than it has in previous years. Keep in mind, though, that the rate of price increase over the past few years has been 10% -- per year -- so a smaller increase in prices would certainly be expected at some point. The graph above also shows a few more past years history of the number of homes selling. The 1,206 homes sold in 2023 was the smallest number in more than five years (while not pictured - it was the slowest year since 2014) but we might see more home sales in 2024 than we did in 2023. Interestingly... when we strip out the attached homes (duplexes, townhouses, condos) we actually see a more steady increase in median sales prices... 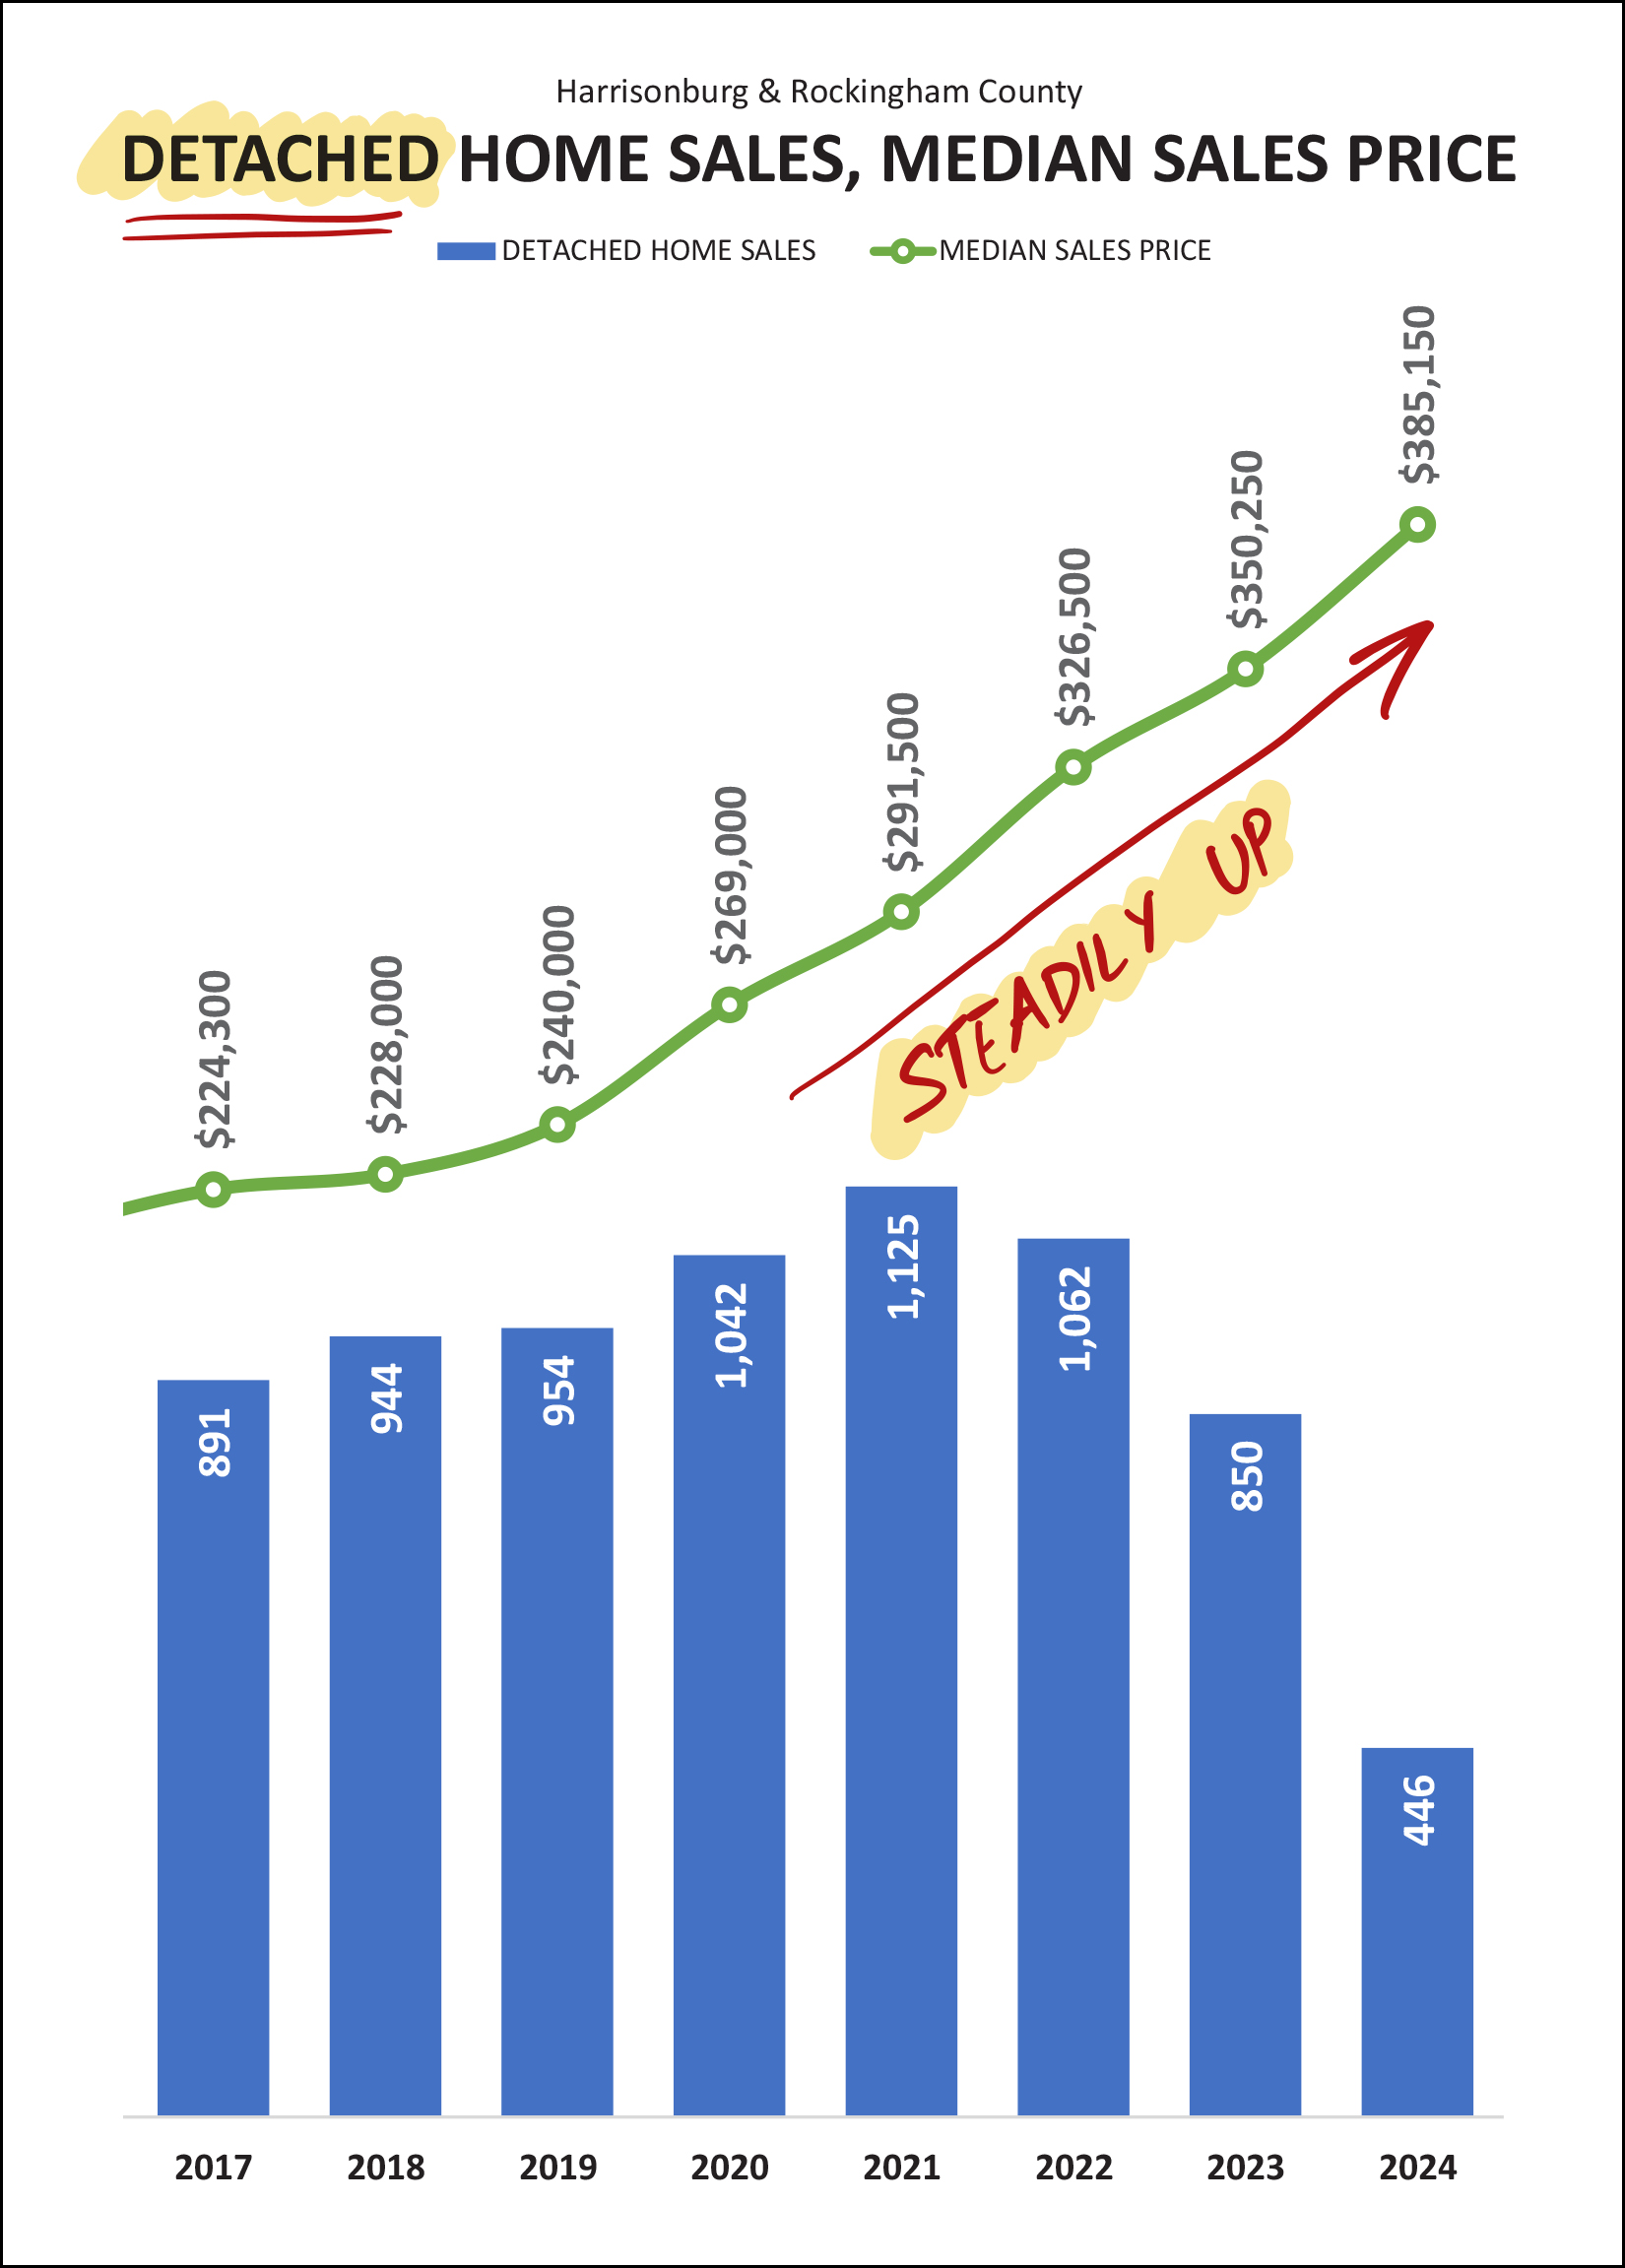 And when we look only at the duplexes, townhomes and condos we see that slow down in price increases more clearly... 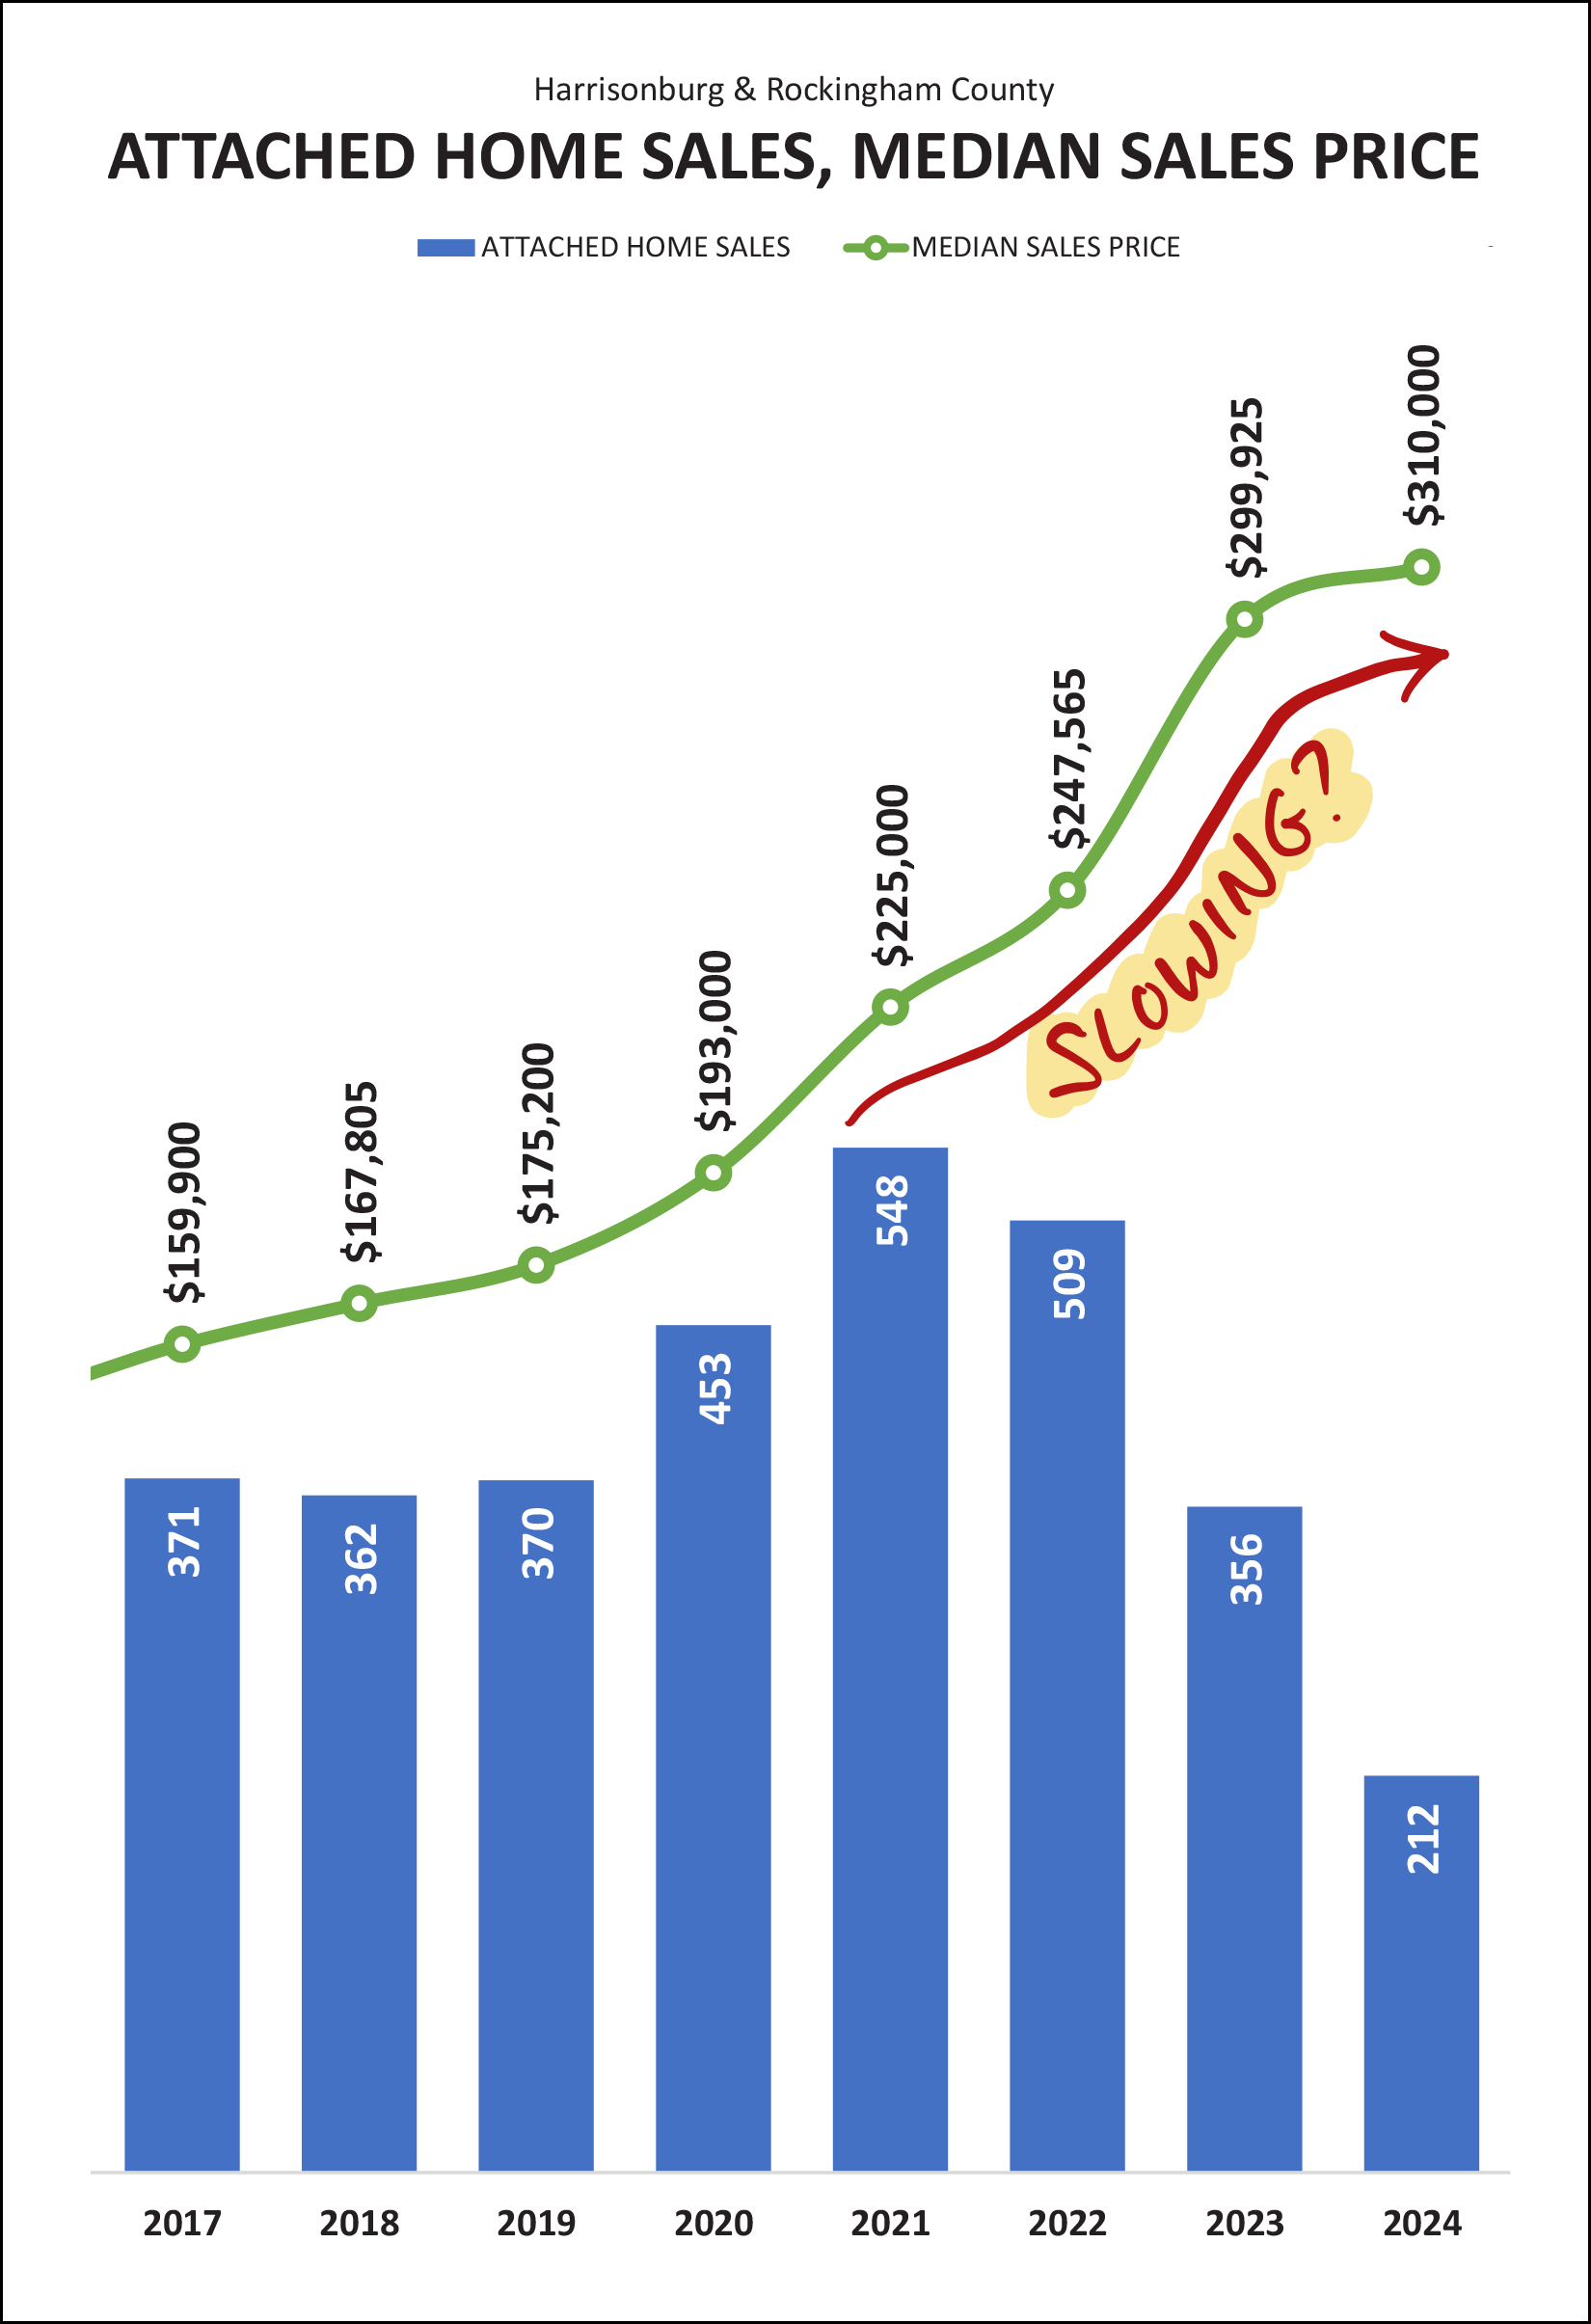 Shifting gears a bit, let's look at contract activity to take a guess at what the next few months of home sales might look like... 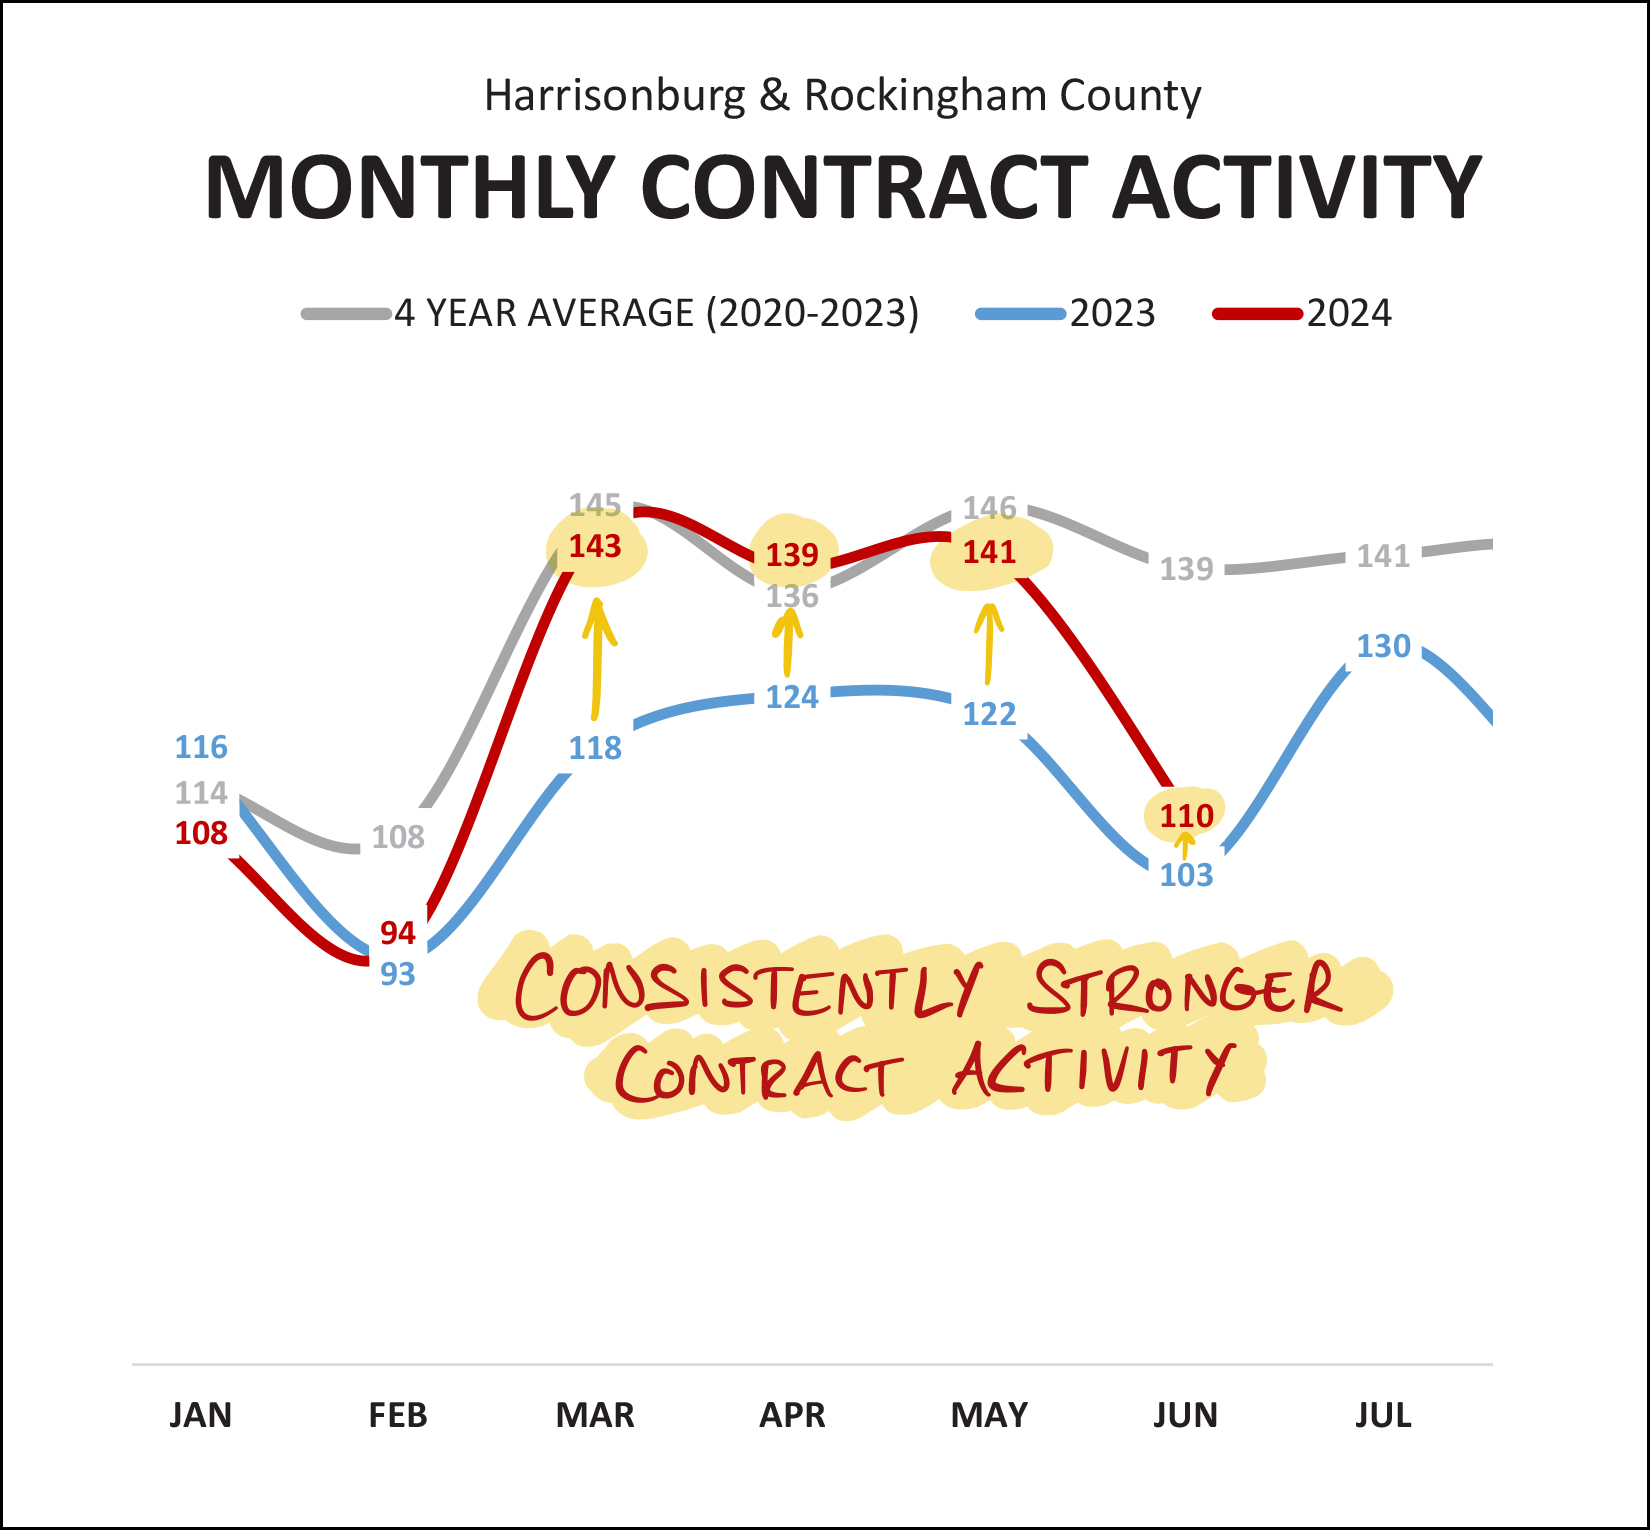 June marks the fourth month of stronger contract activity when comparing contracts signed this year to the same month last year -- though the contract signing frenzy cooled a bit in June. These stronger months of contract activity likely mean we will continue to see steady increases in home sales over the next few months. This same trend is seen when tracking pending sales... 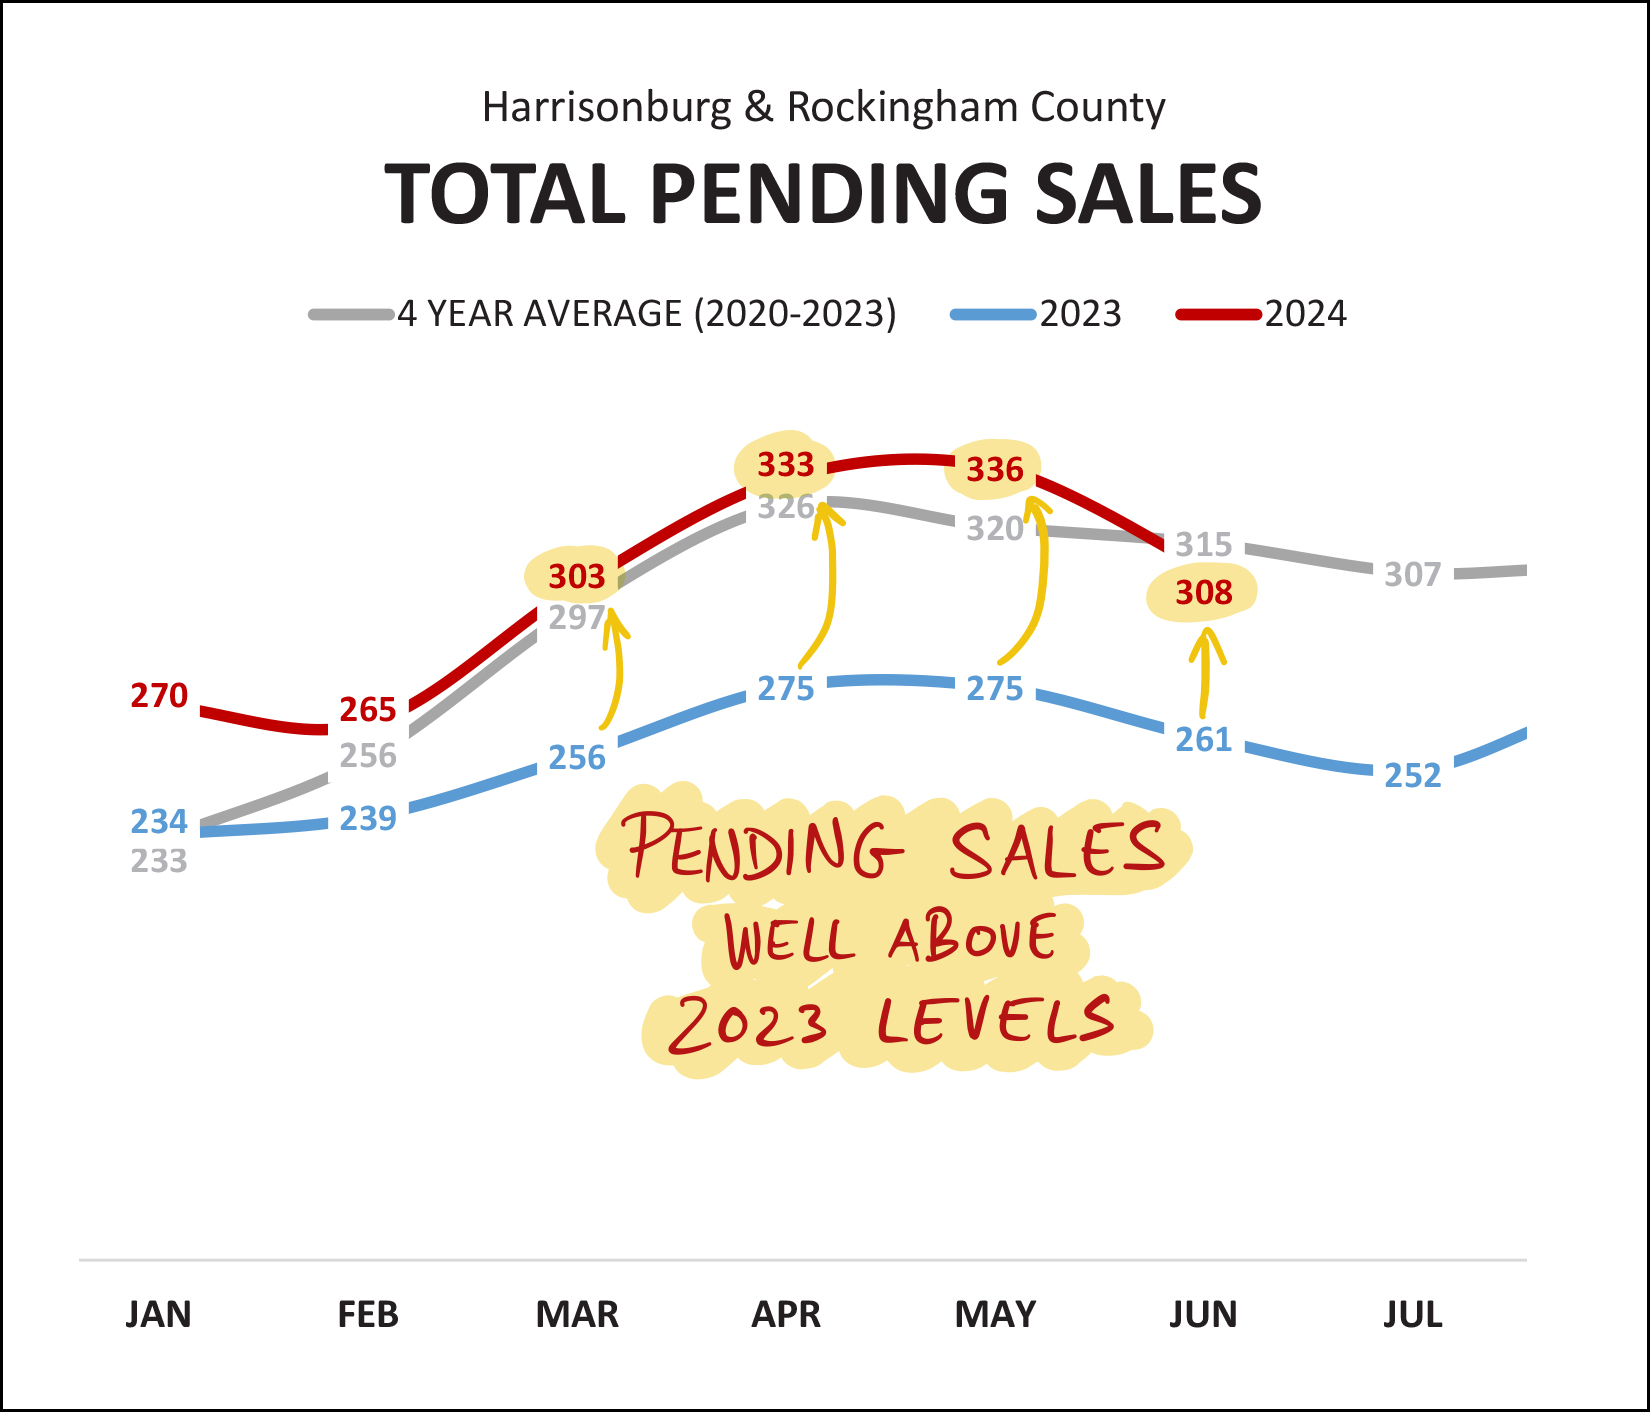 Pending sales is a measure of how many homes are under contract, waiting to make it to settlement. There are currently 308 such homes... as compared to only 261 a year ago. This pending sales total in 2024 (red line) has been tracking well above where things were a year ago (blue line) since the start of the year. Lots of buyers and sellers signing contracts sometimes leads to lower levels of homes available for sale... 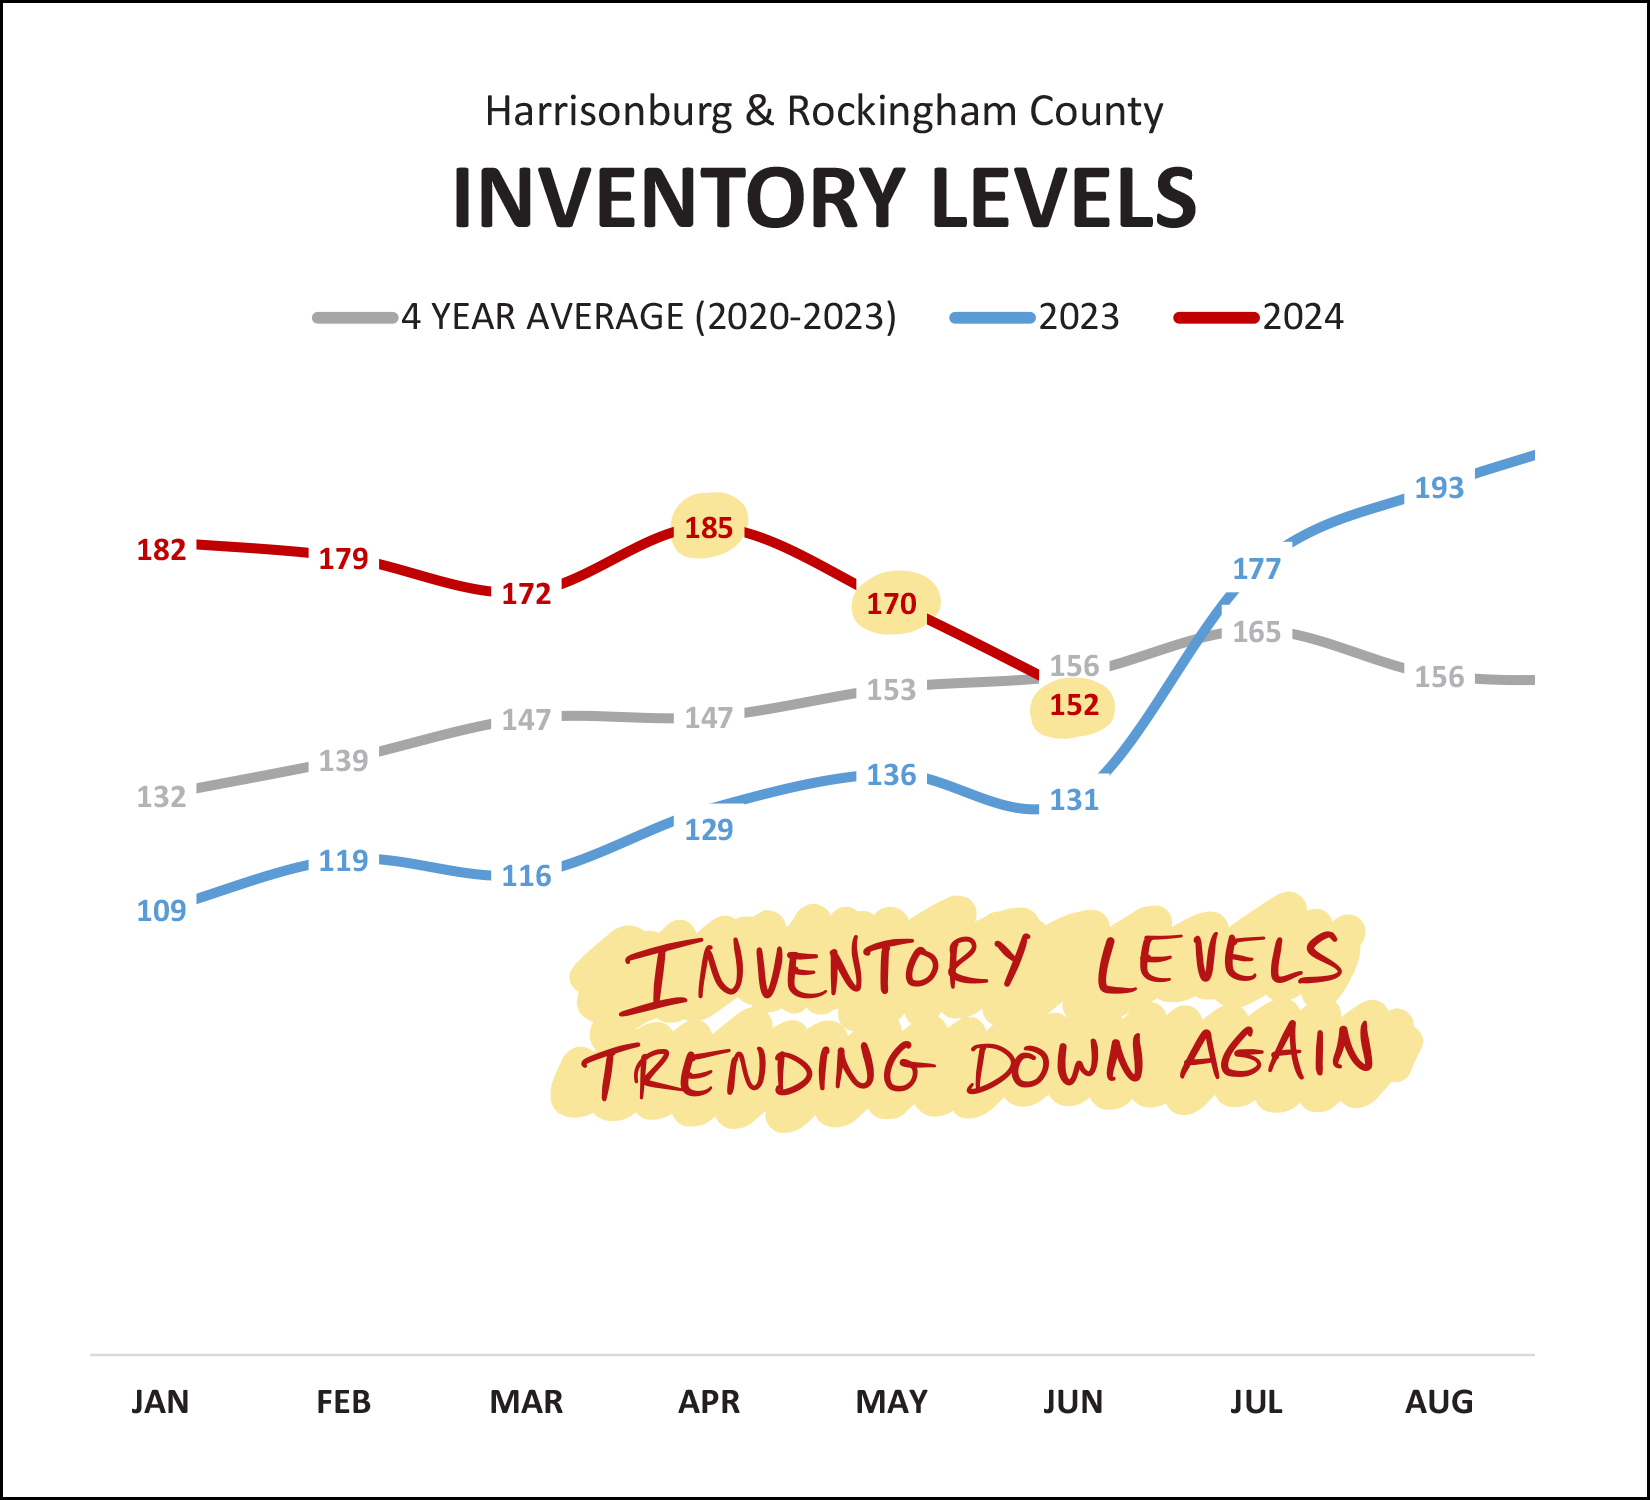 The last few months of strong contract activity has been followed by steady declines in the number of homes available for sale. Inventory levels have dropped from 185 homes for sale to 152 homes for sale over the past two months. These inventory levels in 2024 (red line) are still higher than they were a year ago (blue line), but that might change within the next few months. With so many homes going under contract, are they going under contract more quickly? 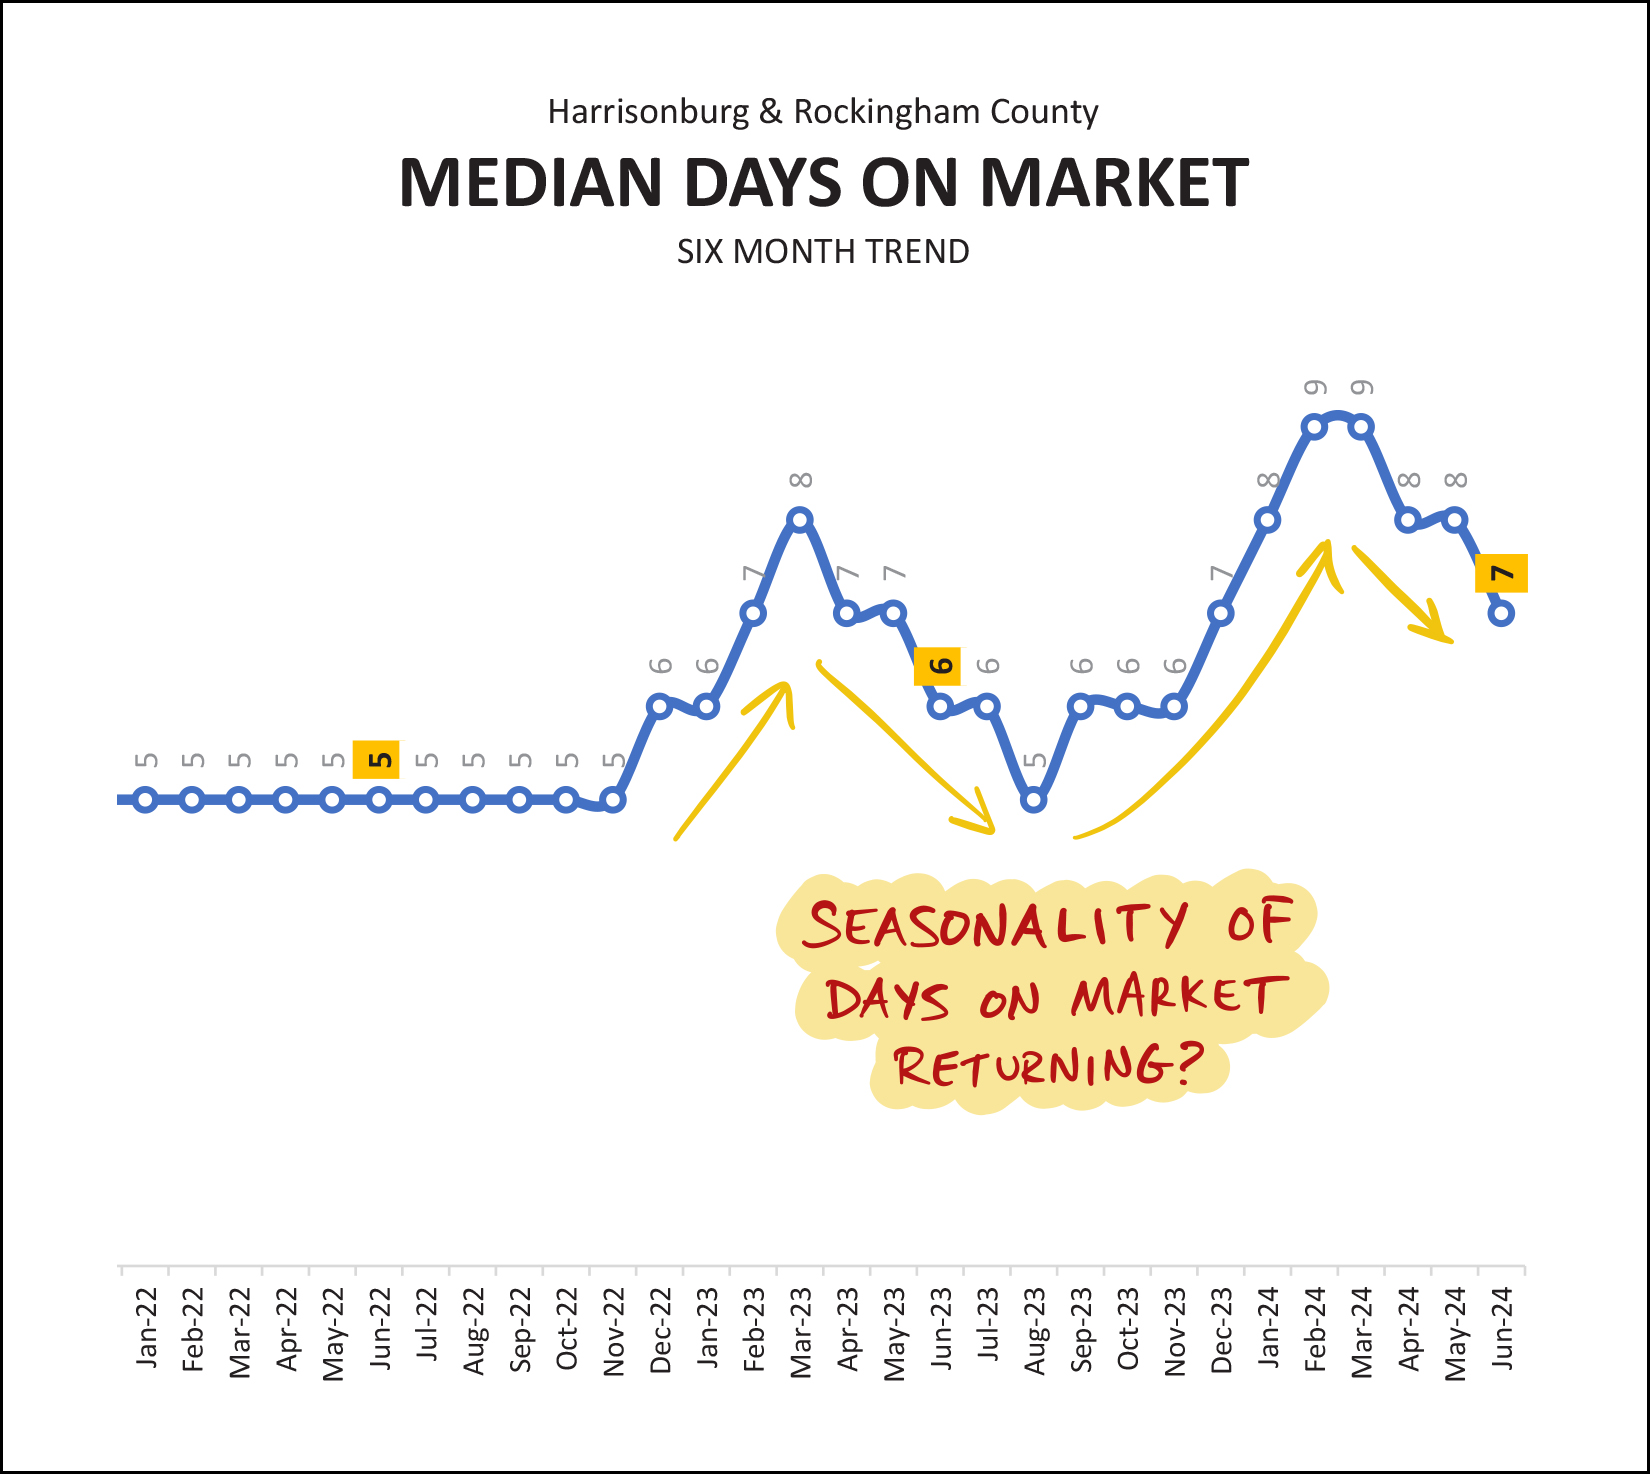 It seems so! The median "days on market" has been trending back downward again over the past few months... and the past year (plus) of data suggests that we might be starting to see some seasonality in this metric once again. In years gone by we would see homes go under contract more quickly in the spring/summer/fall than they would in the winter... though for the past few years (due to Covid, low interest rates) we saw homes go under contract rapidly regardless of the time of year. It seems we might be headed back to a market with a bit more seasonality when it comes to how quickly buyers are contracting to buy homes. But... I will also point out that this median days on market figure does not clearly show that there are plenty of homes that are taking longer than a week (or longer than a month) to go under contract. All homes are not going under contract within seven days... and while most homes are... that "most" is only 51% per how a "median" calculation works. Finally (alert, alert - last graph) mortgage interest rates have been bouncing around this year... but trending downward most recently... 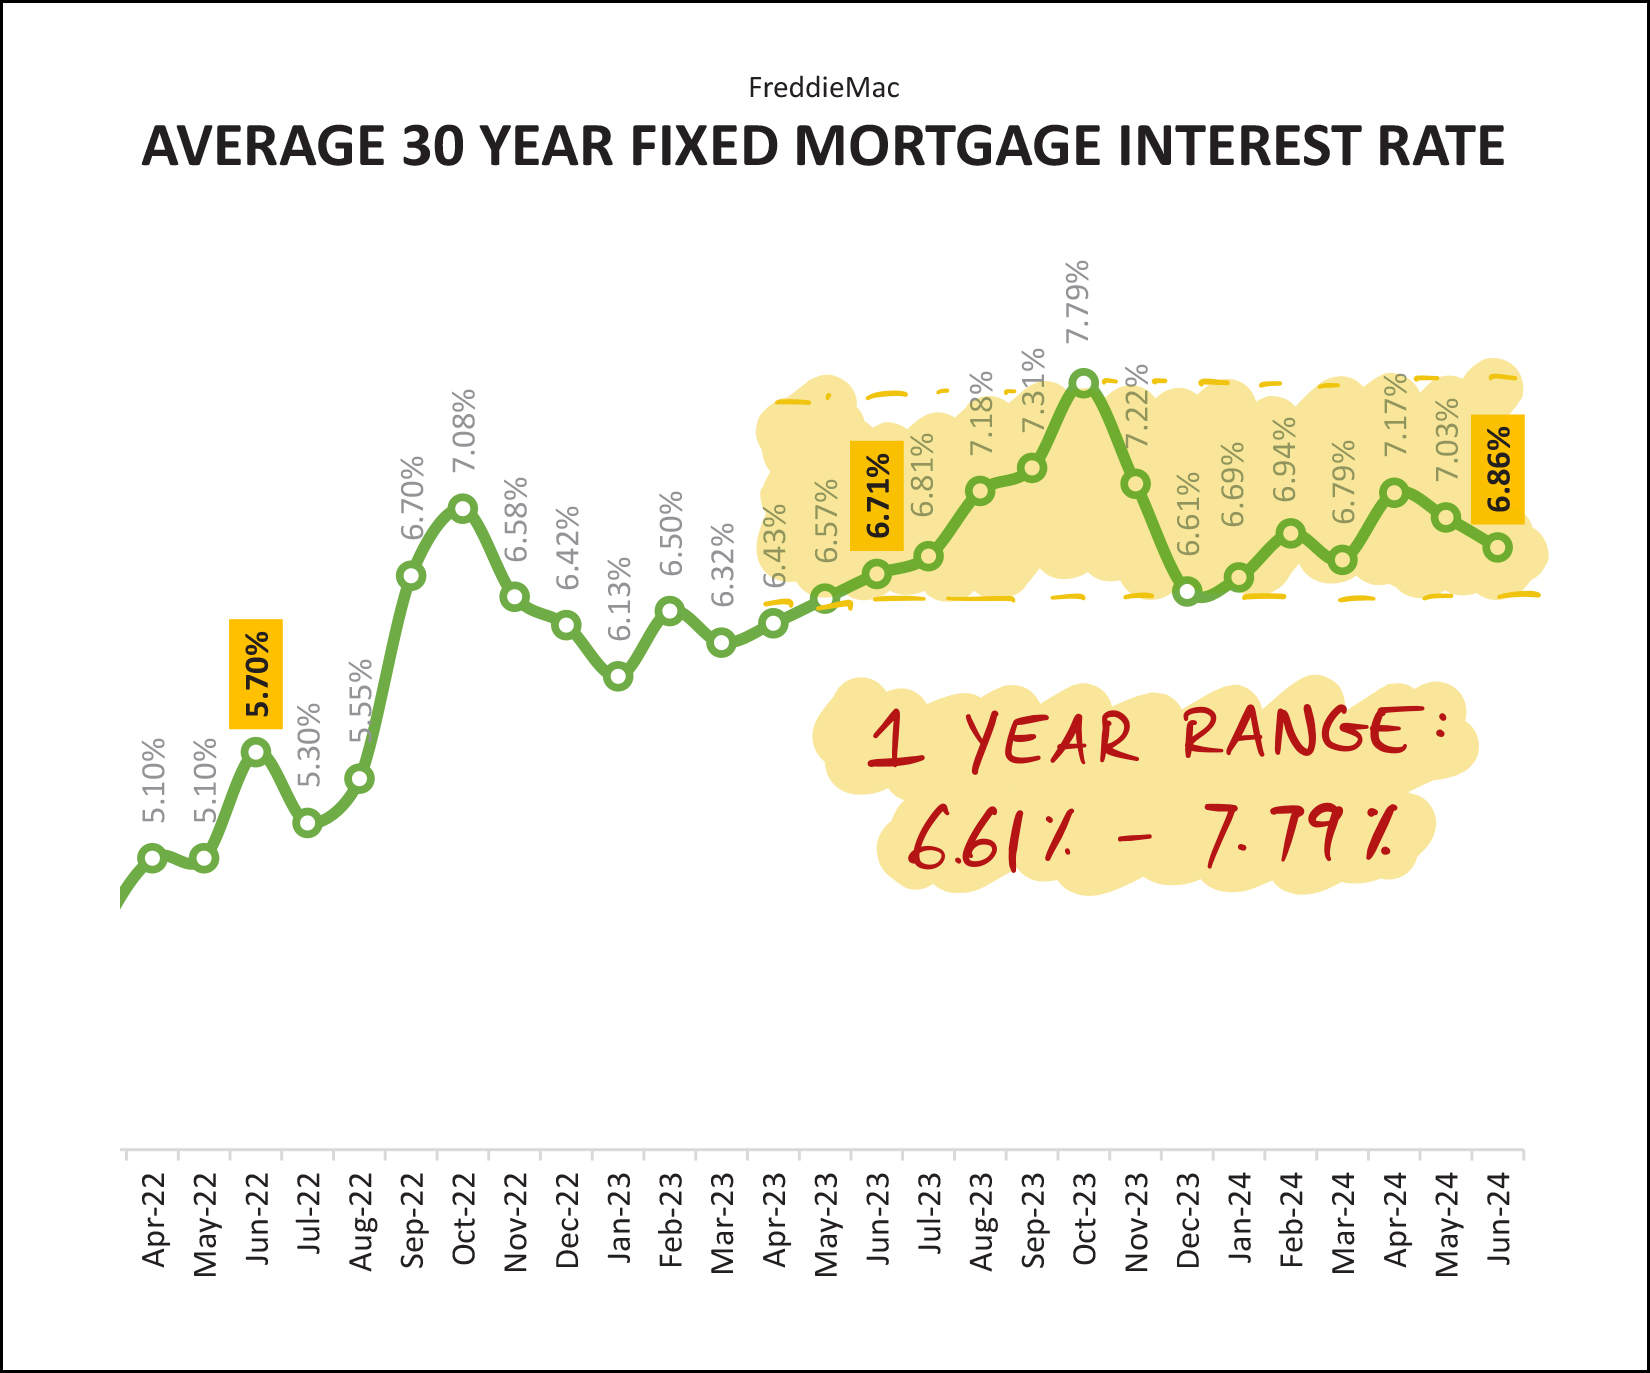 Way back on the far left edge of this graph (above) you'll see that rates were below 5% in early 2022... but they have been above 6% since September 2022, and have been above 7% for six of the past 12 months. It has been a topsy-turvy world when it comes to mortgage interest rates over the past year. Some buyers may have purchased when rates were as high as 7.25% or 7.5%... though today's buyers are likely to be locking in below 7%. I am cautiously optimistic that we might get back down to the 6% - 6.5% range in 2024 or early 2025, but mortgage interest rate trends have been anything but predictable lately. And that brings us to the end of this month's overview of our local housing market. If you made it through all of the charts and graphs, kudos to you for educating yourself on the intricacies of our local housing market. If you plan to buy a home in the second half of 2024... get pre-approved for a mortgage if you haven't already and be sure to go see new listings of interest quickly once they hit the market given that many are still going under contract in a matter of days. If you plan to sell your home in the second half of 2024... you will likely still find selling conditions to be quite favorable, with high levels of buyer interest depending on your price range, property type and the location of your home. If I can be of help to you as you explore the possibility of buying a home, or selling your home, feel free to reach out to chat. You can reach me most easily by phone/text at 540-578-0102 or by email here. I hope you enjoy the remainder of your week (high temp of only 80 degrees tomorrow!) and that you find some time to get away this summer to relax and spend time with family and friends. | |
| Older Posts |
Scott Rogers
Funkhouser Real
Estate Group
540-578-0102
scott@funkhousergroup.com
Licensed in the
Commonwealth of Virginia
Home Search
Housing Market Report
Harrisonburg Townhouses
Walk Through This Home
Investment Properties
Harrisonburg Foreclosures
Property Transfers
New Listings


