Market
| Newer Posts | Older Posts |
Just How Unusual Was The Pace of Home Sales In January 2020? |
|
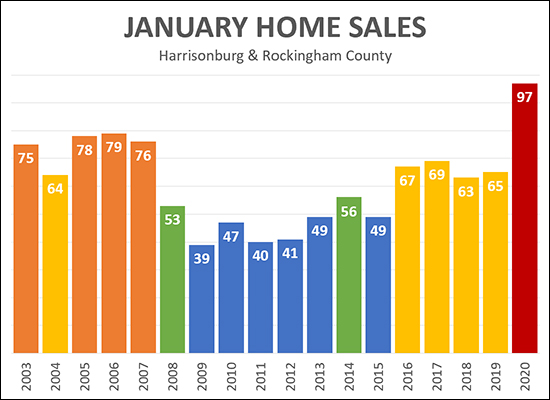 Particularly unusual, I'd say. Looking back 17 years, the highest number of home sales we had ever seen in January was 79 home sales -- but this January (last month) there were 97 home sales! What a month! Stay tuned to see if we'll have another high octane month of sales in February. In the meantime, feel free to check out my full market report and commentary here. | |
Home Sales Soar To Surprising New Heights in January 2020 |
|
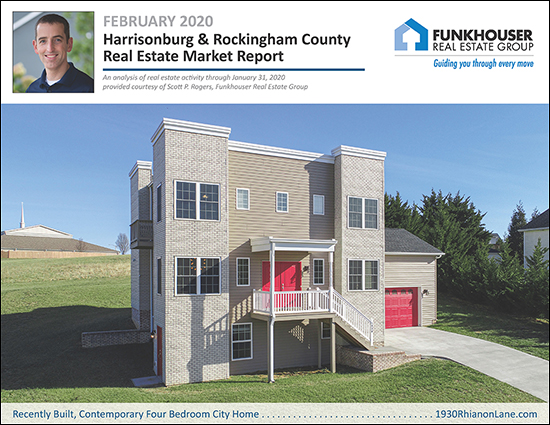 Time seems to be passing quickly these days, perhaps because my two kids are growing up faster than I can believe - age 15 (also known as "almost driving") and 11 (but 12 next month!). In the vein of time passing quickly, I was surprised to realize this week that the year is essentially 1/8th of the way over now!? How does the time slip by so quickly? Well, if you blinked, and missed January - you missed a LOT of home sales in Harrisonburg and Rockingham County. We'll get to that soon (keep reading) but first I'll point you to a few quick links... OK - now back to the business at hand - breaking down the latest trends in our local housing market. First, some of the basics... 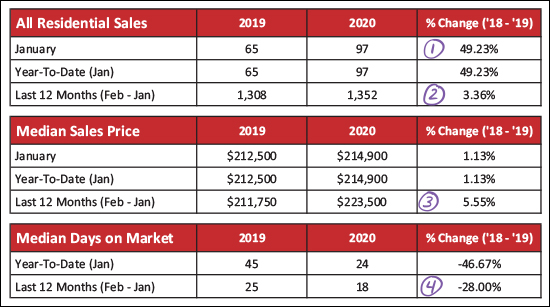 As shown above...
If we then dive into detached (single family homes) and attached (townhouses, duplexes and condos) we find relatively similar trends... 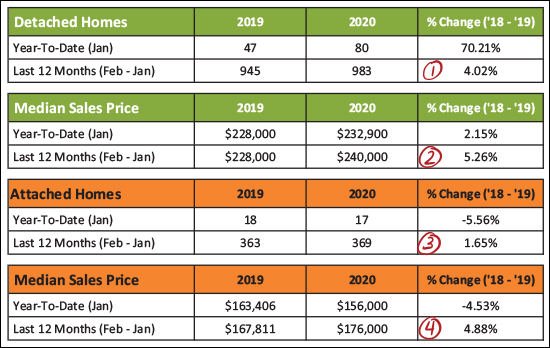 In the breakdown above, you might note that...
And now, the visual of what we'll call a crazy January... 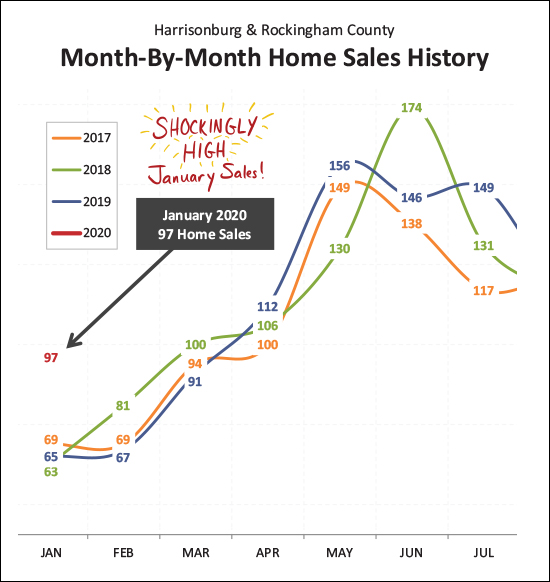 If there was one thing it seemed we could count on, it was that we'd see between 60 and 70 home sales in January. That's what we've seen for the past three years - and looking back even further (2010-2016) we find even lower months of January sales - 47, 40, 41, 49, 56, 49, 67. But not this year. This year started off with a BANG with a shockingly high 97 home sales in Harrisonburg and Rockingham County. Could this be an anomaly? Will February sales be miserably slow, bringing a January/February average to more normal levels? Maybe. Will every other month this year fall back in line with normal historical trends? Maybe. Or -- will this year be unlike any prior with much higher sales than expected, all year long? Maybe. Stay tuned to see how things shape up after this blockbuster month of sales in January. And look what this crazy January contributed towards... 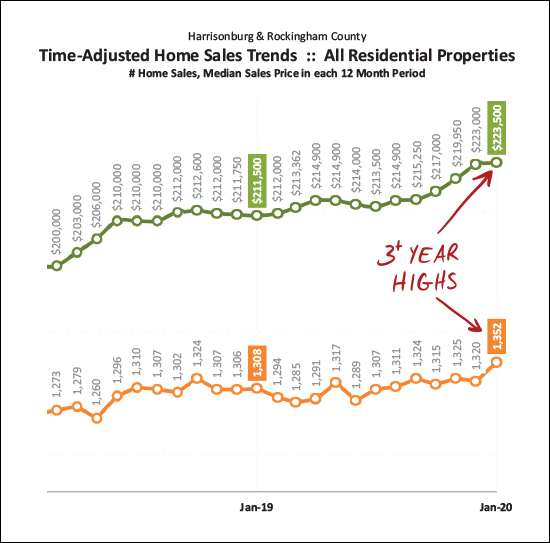 The data above looks at 12 months of data at a time - month after month - to see long term trends. These long term trends have now pushed us to the point of having 3+ year highs in both categories shown - the pace of sales and the price of sales. The median sales price of $223,500 is higher than it has been in many more than three years. Likewise, the annual pace of 1,352 home sales is higher than it has been in over three years. So, it's a wild time right now in the local housing market with steady growth in sales prices and stable but strong numbers of home sales. Circling back to the prior question - will home sales taper off in February? 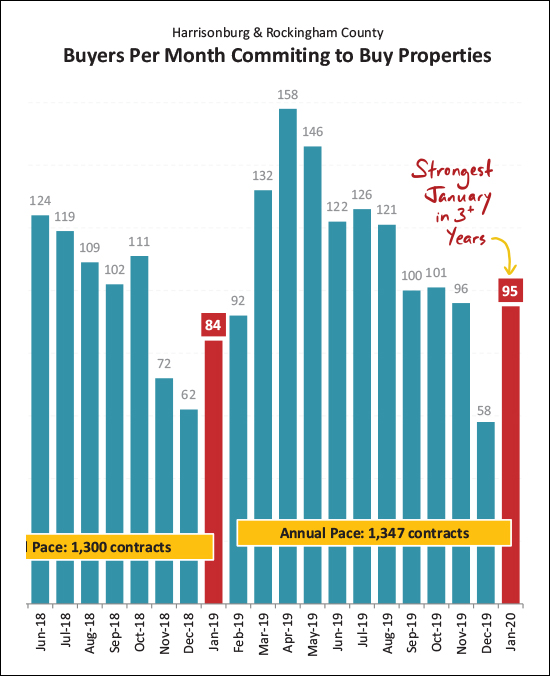 I'm going to lean towards "no" -- given that 95 contracts were signed in January -- many of which will result in February home sales. As an aside - I have been tracking "under contract" data since 2008 -- and there has never been a January with quite so many contracts signed as we saw this January. So, maybe February will be a relatively strong month for home sales as well? And these increases, while one major metric keeps decreasing... 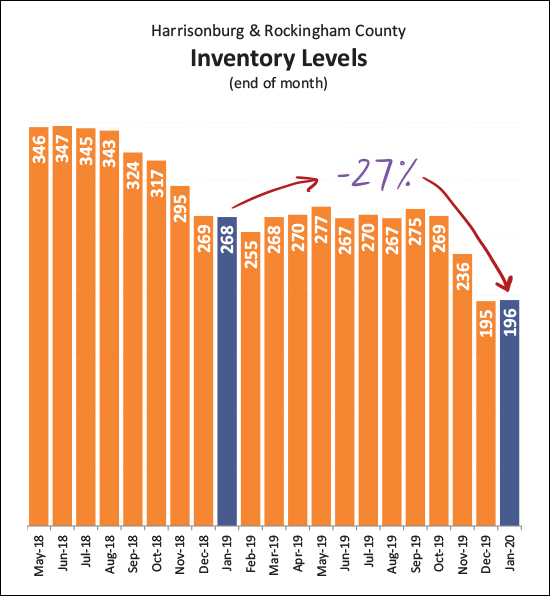 Indeed, despite increasing sales, the number of homes on the market at any given time keeps declining. We've seen a 27% year-over-year decline in the number of active listings on the market. So, how do more homes sell if fewer homes are on the market? It seems that plenty of homes are coming on the market for buyers to buy - but because buyers are contracting to buy them so quickly these new listing aren't staying on the market long enough to allow inventory levels to see an effective increase. Speaking of buyers contracting to buy homes quickly... 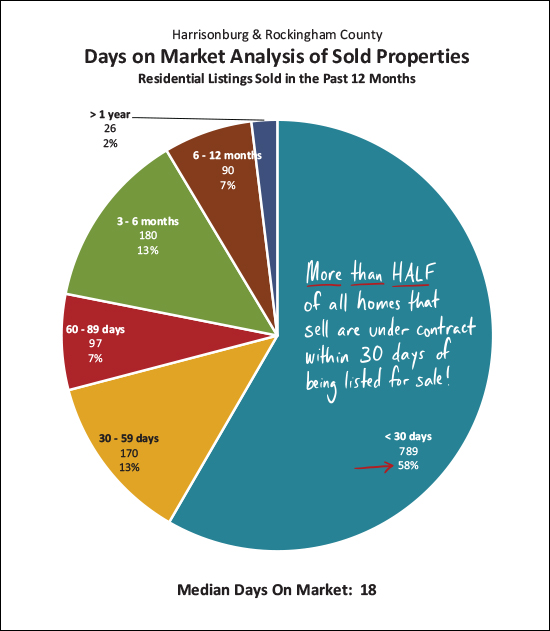 More than half (58%) of homes that have sold in the past year were under contract within 30 days of being listed for sale. Homes are, indeed, selling quickly. The median "days on market" currently stands at 18 days. A nice time to be a home seller if you're hoping not to have a prolonged period of time having buyers coming to view your house. Depending on your home's price, condition, layout, location, it may very well go under contract quickly! And today's buyers are paying lower mortgage interest rates than we've seen in a while... 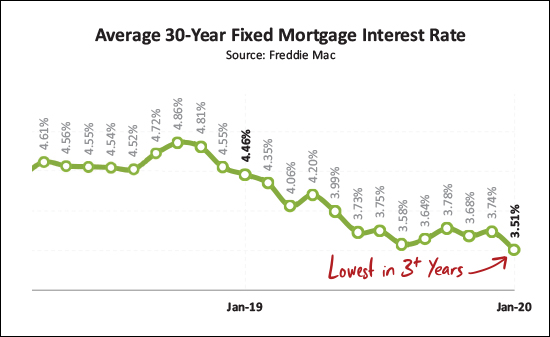 The average mortgage interest rate on a 30 year mortgage has now dropped to 3.51% - the lowest rate seen in over three years. Buyers who are currently buying a home are fixing in lower monthly payments than they would have seen with any recent mortgage interest rate - though that is offset somewhat by the increases in median sales prices over the past few years. OK - that's it for now - I'll be diving into a few more market dynamics in the coming days. But until then... If you're planning to sell your home in 2020 -- let's chat SOON about the best timing for doing so, what you should do to prepare your home for the market, and of course, we'll want to start by analyzing your segment of the market. If you're planning to buy a home in 2020 -- get ready to compete with lots of other buyers in a low inventory housing market. To assist you, sign up to get alerts of new listings, talk to a lender to get pre-approved, and let's get ready to make a mad dash to see new listings as soon as they come on the market! As always -- shoot me an email if you have follow up questions or if you want to chat about your plans to buy or sell. | |
Who Is Winning In 2020 In The Local Real Estate Market? |
|
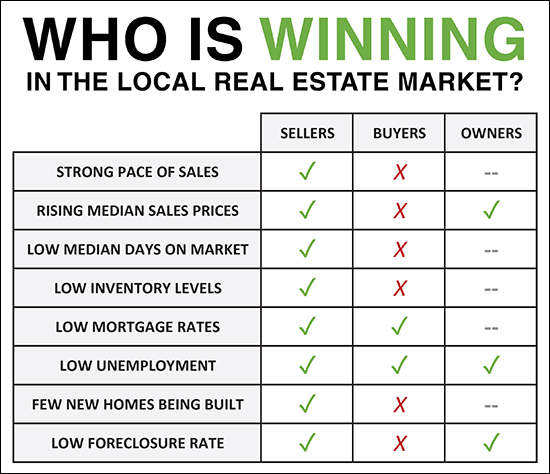 Sellers are winning - rather universally. Every market metric works in their favor. Buyers are losing - in most categories. Buyers are happy about low rates and low unemployment, but otherwise, all market metrics are working against them. Homeowners are winning - they are indifferent to most market shenanigans - but are glad home values are increasing. SELLER-BUYERS - If you will be a seller AND a buyer -- things may balance out -- you may benefit as a seller and struggle as a buyer. | |
City Townhouses Are Selling QUICKLY! |
|
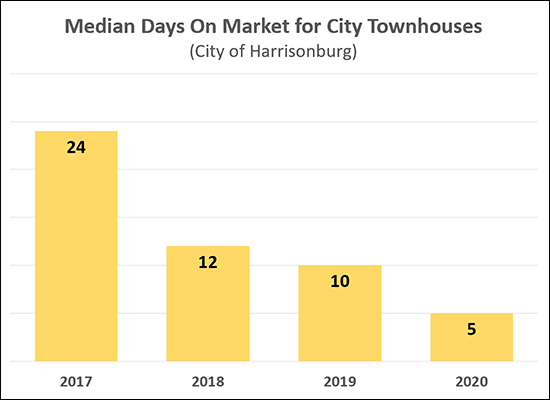 Townhouses in the City of Harrisonburg are selling QUICKLY! The "Days On Market" referenced above is the number of days between when a property is listed for sale and when it goes under contract. Just three years ago, the median days on market was 24 days - which means that half of the townhouses that sold went under contract in fewer than 24 days, and half took longer than 24 days. But now, the median days on market has dropped down to just FIVE days in 2020. Oftentimes, sellers of townhouses who want to buy a single family home are worried that they won't be able to sell their townhouse quickly enough to then make an offer on the house they want to purchase - this should be at least somewhat less of a concern now given the speed at which townhouses are going under contract! | |
Home Sales Rise In County, Fall In City |
|
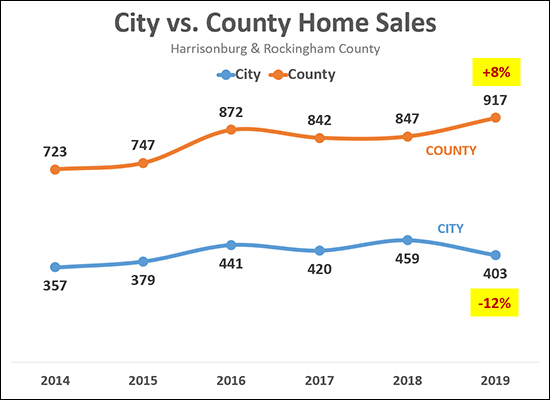 Home sales rose 8% in Rockingham County last year -- from 847 sales in 2018 up to 917 sales in 2019. This is the highest number of home sales we have seen in Rockingham County in at least the past six years. But in the City, it was a different story. Home sales declined 12% in the City of Harrisonburg in 2019, from 459 sales in 2018 down to only 403 sales in 2019. This is higher than some recent years, but the lowest number of homes ales in the past four years. A few more notes...
There are any number of factors that affect whether buyers end up buying in the City or County, including what type of property they are seeking, how much land they desires, school systems, employer locations, and much more. | |
Monthly Housing Cost for Median Priced Home Climbs Further in 2019 |
|
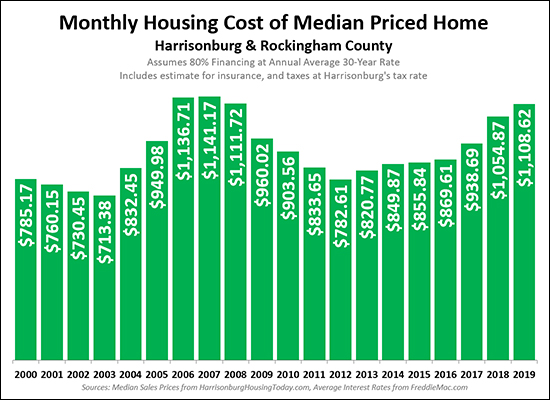 As should come as no surprise, the monthly cost of housing is increasing -- and has been increasing more quickly over the past several years (2018, 2019) as compared to many prior years. The graph above devises a monthly cost of housing using the median sales price of homes sold in Harrisonburg and Rockingham County and the mortgage interest rate at the time. The payments above assume that a buyer finances 80% of the purchase price at the prevailing rate -- and these housing costs include an estimate of real estate taxes and homeowners insurance. Of interest -- this monthly cost...
Over the next few years, it seems likely we will see a continuation of this trend, as sales prices and mortgage interest rates are both likely to continue to increase. | |
Lower Priced Market Segments See Largest Swings In Housing Inventory |
|
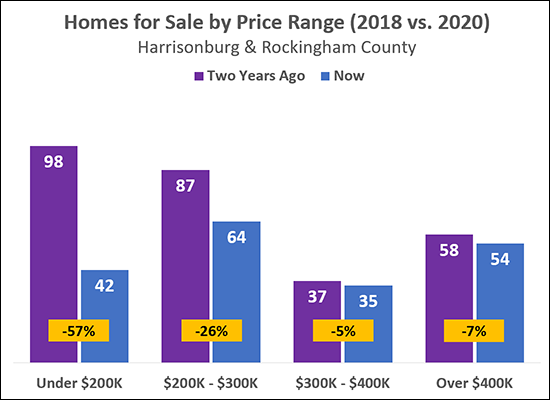 Not all price ranges are created equally, it seems. The hardest hit price range, perhaps unsurprisingly, is the under $200K price range -- where we have seen a 57% decline in the number of homes for sale over the past two years. Of note -- part of the problem here is increasing home values -- which prices some homes out of the "under $200K" price range. Regardless, though, buyers looking to stay under $200K for their home purchase are having an ever more difficult time doing so. The $200K - $300K market also had a sizable (26%) decline in the number of homes actively listed for sale as compared to two years ago. Both the $300K - $400K and the $400K+ price ranges only saw slight (-5%, -7%) declines in inventory levels - so not a marked difference from where inventory levels were two years ago.. | |
20 Year History of Harrisonburg Area Median Home Sales Price |
|
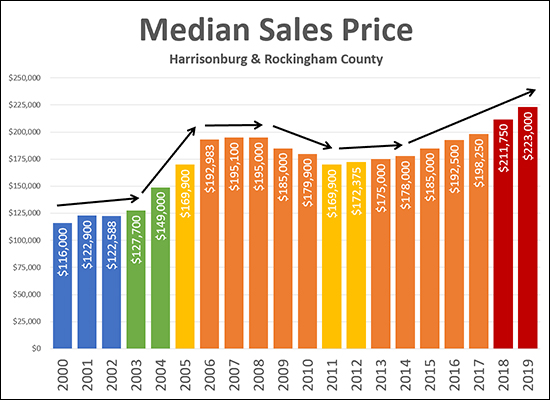 Here's a really long look back at the median sales in Harrisonburg and Rockingham County. There have been a variety of different stages in the market over the past twenty years...
Where do we go from here? I think we'll see another solid increase in the median sales price in 2020 and likely over the next few years. What do you think? Email me at scott@hhtdy.com. | |
20 Year History of Harrisonburg Area Home Sales |
|
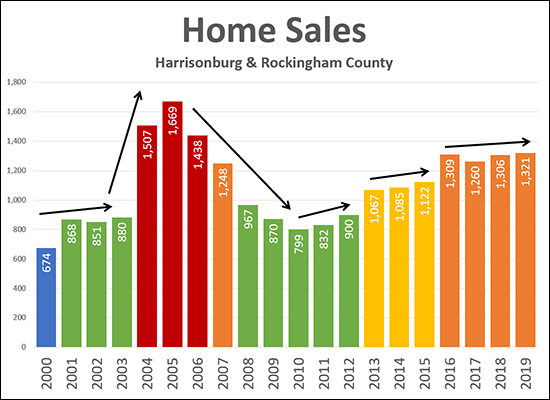 Here's a really long look back at the number of homes that sell each year in Harrisonburg and Rockingham County. There have been a variety of different stages in the market over the past twenty years...
Where do we go from here? I think we'll see 1,300+ home sales per year for the next few years. What do you think? Email me at scott@hhtdy.com. | |
More Homes Sold... More Quickly... at Higher Prices in 2019! |
|
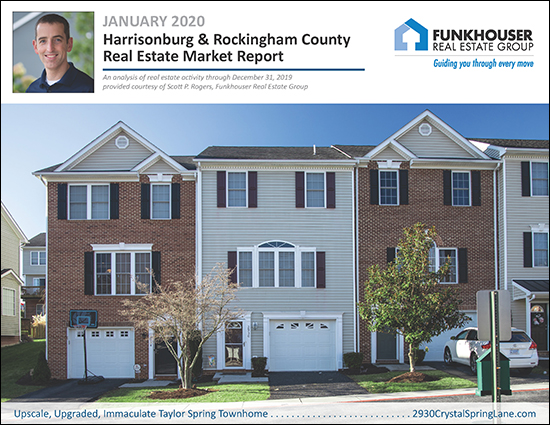 Happy New Year and New Decade! And what a decade it was for the Harrisonburg and Rockingham residential real estate market! Read on to learn more about the new highs (and lows) we experienced in 2019 to finish out the decade -- or download the PDF here. But first -- feel free to explore this month's featured home -- an upscale townhouse in Taylor Spring that just hit the market this morning. Visit 2930CrystalSpringLane.com for details. And now, on to the some highlights of what's new and exciting in our local real estate market... 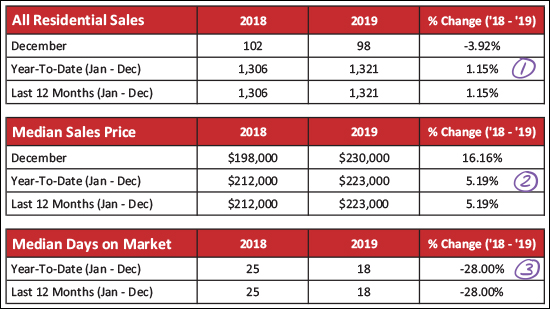 [1] First things first -- we saw more home sales in 2019 than we did in 2018 -- though barely. There was a 1.15% increase in the number of homes selling in Harrisonburg and Rockingham County. This 1.15% increase did set some new (recent) records though, so keep on reading for that fun detail. [2] If the increase in the pace of sales was possibly smaller than expected -- the increase in the median price of those homes was probably larger than expected. I typically reference that median home prices usually increase around 2% to 3% per year over the long term -- but last year the median sales price jumped 5.19% in a single year to $223,000. This is certainly exciting for home owners and home sellers -- though not as thrilling for home buyers. [3] Finally, the time it took for homes to sell in 2019 dropped 28% to a median of only 18 days! This is a measure of how many days it takes for a house to go under contract once it is listed for sale. In summary, more homes sold, at higher prices, more quickly in 2019. But let's dig a bit deeper... 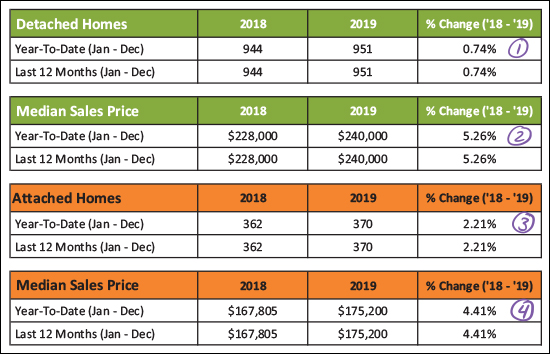 [1] The number of detached (single family) homes that sold in 2019 was only 0.74% higher than in 2018. So, we'll say about the same number of detached homes have sold in each of the past two years. [2] The median price of those detached homes has risen - a full 5.26% over the past year to the current median sales price of $240,000 for all of Harrisonburg and Rockingham County. [3] There was a slightly larger (+2.21%) increase in the pace of sales of attached homes (duplexes, townhouses, condos) in 2019 -- though that small increase (362 sales to 372 sales) isn't anything to write home about. [4] The median price of the attached homes that sold in 2019 was 4.41% higher than the prior year -- bringing us to a $175,200 median sales price for attached homes in Harrisonburg and Rockingham County. Zooming in a bit on December and the fourth quarter of 2019 we find... 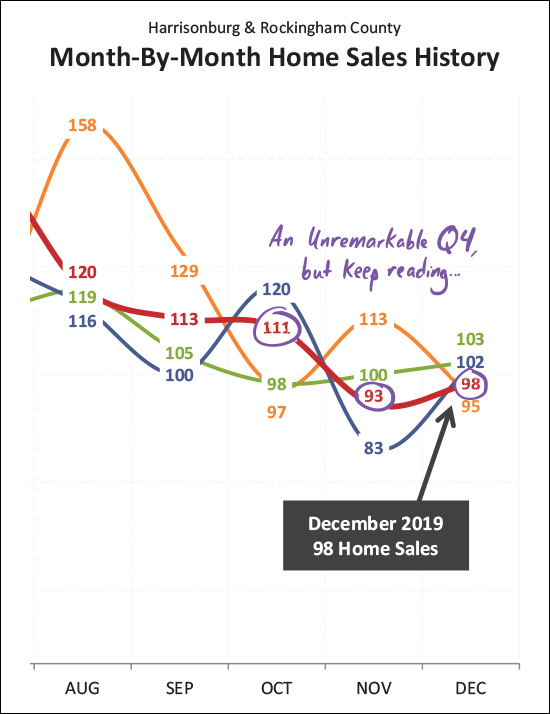 ...just about nothing extraordinary. Darn. :-) Home sales during October, November and December of 2019 were squarely in the middle of the pack as compared to the past few years. So, no main takeaways there -- it seems we had a typical end of the year in our local housing market. But that typical end of the year piled on to the first nine months... 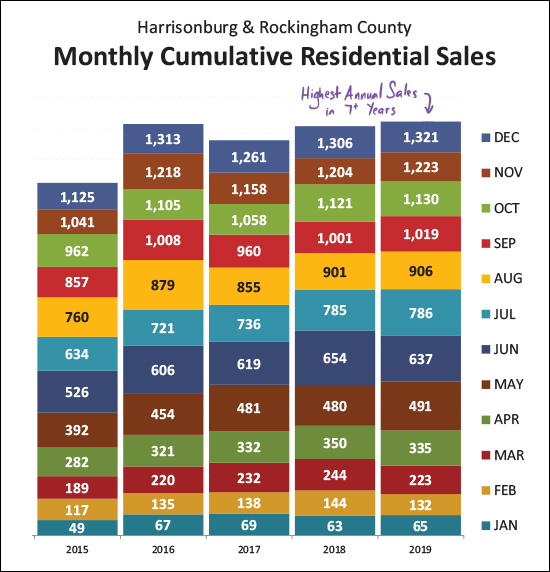 As shown above, it was only a small (small, small) increase in the number of homes selling between 2018 and 2019 -- but it was enough to push us above the two recent highs seen in 2016 and 2018. I cropped this graph a bit too tightly to see it, but 2019 home sales were the highest we have seen in 7+ years. Oh, and it seems I can make an even broader statement... 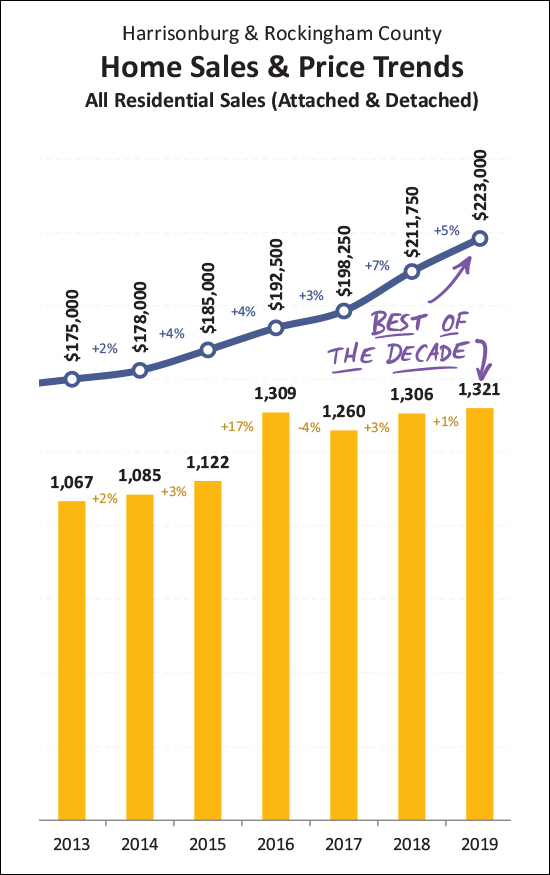 We hit some of the best number of the decade in Harrisonburg and Rockingham County... The 1,321 home sales seen last year was the highest number of home sales seen any time in the past decade! The median sales price of $223,000 seen last year was the highest median sales price seen any time in the past decade! So, there's that! Exciting, indeed -- again, for everyone except those looking to buy right now. Speaking of the future... 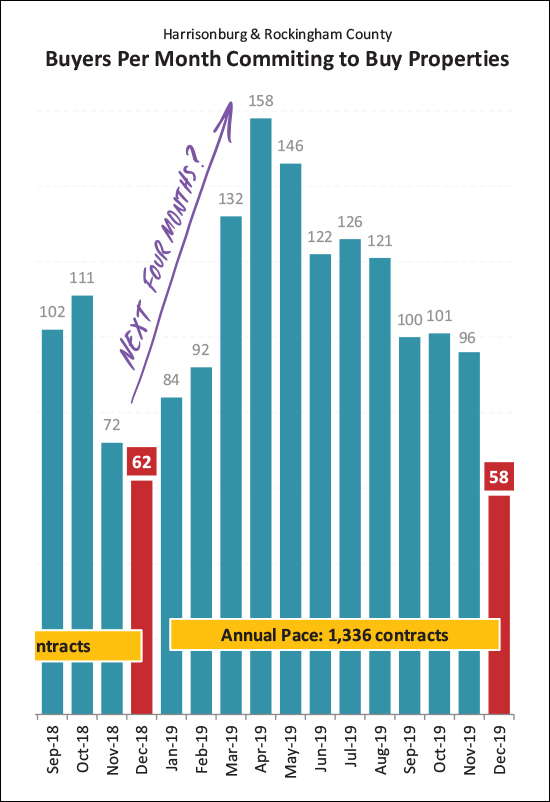 Looking back can often help us understand what we'll see when moving forward. The graph above illustrates when buyers sign contracts to buy homes and the purple arrow is marking the typical January through April trajectory in our local housing market. So -- January and February are likely to be slow for contract activity -- but we should see things starting to pop in March and April. Get ready! And now, possibly the worst news in this market re-cap... 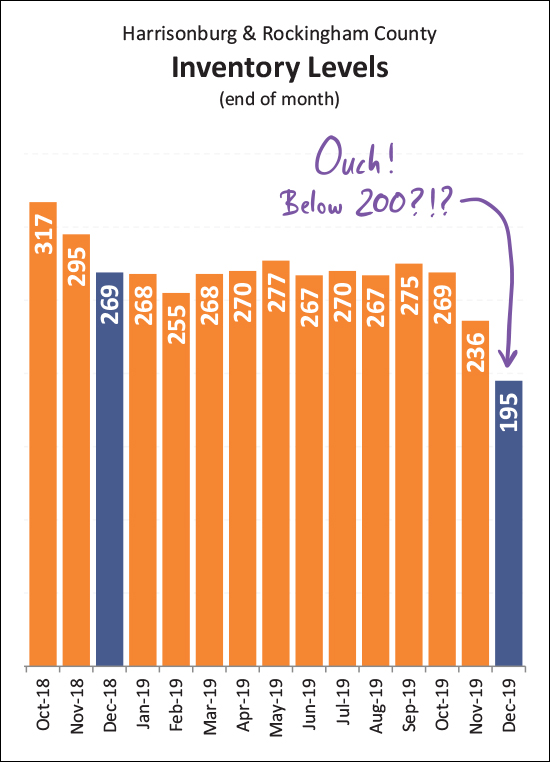 Inventory levels were not contingent to have dropped below 250 homes for sale at the end of November -- they dropped even lower (!?!) by the end of the year to where there are now only 195 homes for sale! We can conclude several things here -- today's buyers won't have many choices -- and when good choices do come on the market they are likely to go under contract quickly! Just to further dissect the depressing decline in inventory... 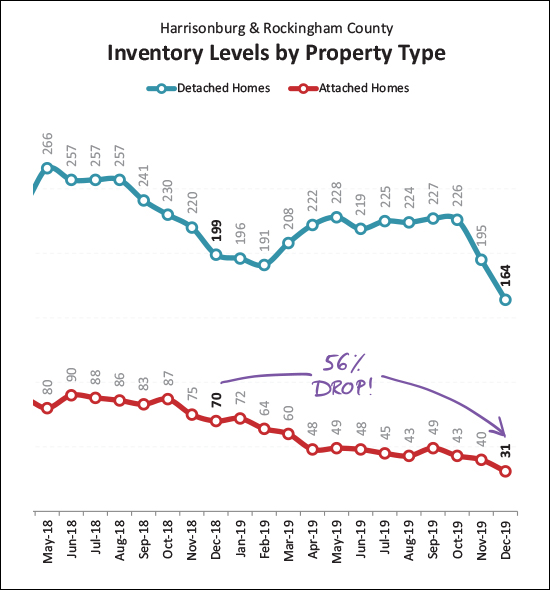 The larger drop in inventory over the past year has been in attached homes (the red line above) where there are now 56% fewer homes on the market as compared to a year ago. This is largely because there haven't been many new townhouses constructed in the past year as compared to many previous years. And when we look at the City compared to the County (brace yourself) we find... 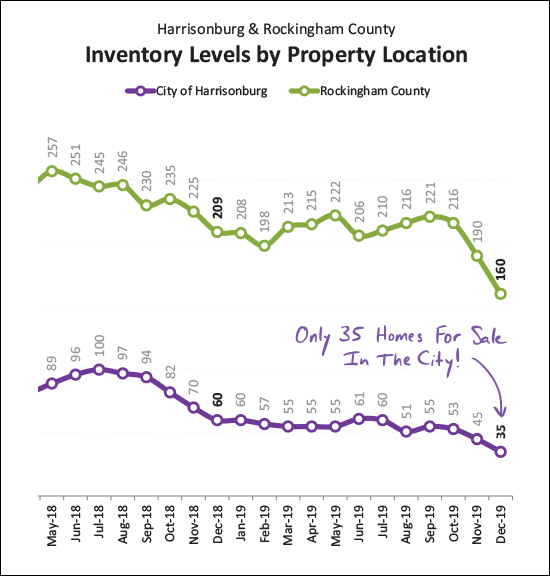 The purple line above is showing you that there are only (it's real folks) 35 homes on the market for sale in the City of Harrisonburg! This is a 42% decline from a year ago. There was also a sizable decline in the number of County properties on the market, but buyers looking to buy in the City right now will find it to be a particularly tight market. OK - that's it for now - I'll be diving into a few more market dynamics in the coming days. Until then... If you're planning to sell your home in 2020 -- let's chat soon about the best timing for doing so, what you should do to prepare your home for the market, and of course, we can chat about pricing. If you're planning to buy a home in 2020 -- sign up to get alerts of new listings, talk to a lender to get pre-approved, and let's get ready to make a mad dash to see new listings as they come on the market to give you a shot at buying a home in a very tight real estate market. Happy 2020, friends! I am looking forward to a great year and hope to work with many of you to help you accomplish your real estate goals. As always -- shoot me an email if you have follow up questions or if you want to chat about your plans to buy or sell. | |
When Will Home Buying Activity Ramp Up in 2020? |
|
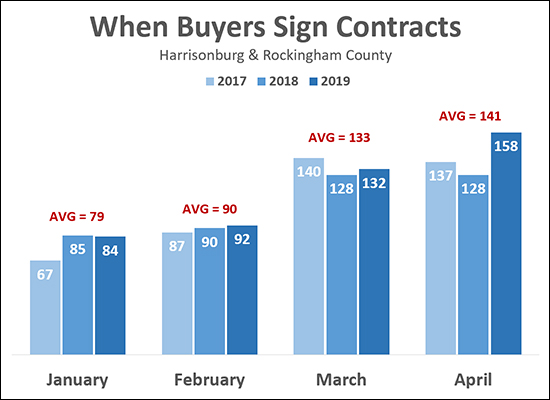 It should be no surprise that buying activity (contracts being signed) slows down over the Winter. As shown above -- an average of 79 buyers sign contracts in January, which then increases a bit, to 90, in February, and then makes a much larger jump in March to an average of 133/month. So, we're going to say the MARCH is when we first seem a big jump in buyer activity. For that reason, many sellers wait until March (or even April) to put their homes on the market -- though the Spring market brings more competition from other sellers in addition to meaning that we'll start to see more buyers. I have also read several articles (locally, regionally and nationally) talking about how this year the "Spring housing market" is taking off just after Christmas instead of in March like in past years. Let's take a look... Contracts Signed Between December 26 and January 8...
So, over the past three years, there have been an average of 26 contracts between during the two weeks after Christmas. And how about this year?
So, this year is actually starting off just about the same as we've seen for the past three years. The Spring market isn't quite here yet despite what you might read. :-) | |
My Predictions for the 2020 Real Estate Market |
|
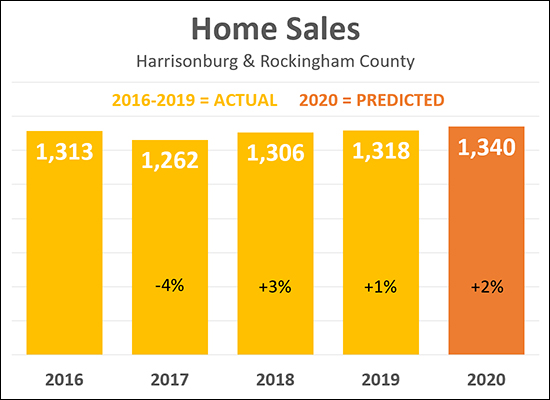 As is my annual tradition, I am making some predictions about what we'll see in the Harrisonburg and Rockingham County real estate market in 2020. Above, you'll note that there was only a 1% increase in home sales between 2018 and 2019 -- and I am predicting a 2% increase between 2019 and 2020. A few thoughts along those lines...
So -- I'm betting on another increase, albeit a small increase, in the number of home sales in Harrisonburg and Rockingham County in 2020. And how about those prices... 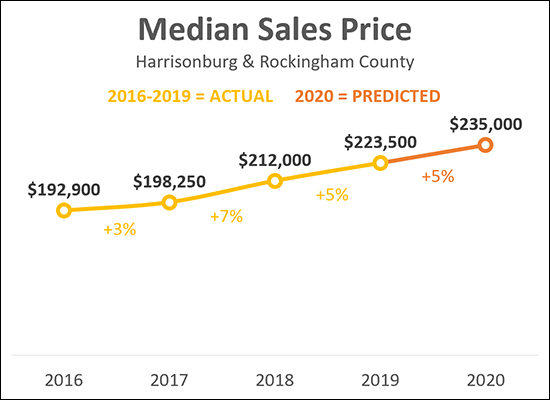 As shown above, we saw a 7% increase in the median sales price in 2018, followed by a 5% increase in 2019! I am -- perhaps too boldly (?) -- predicting we'll see another 5% increase in the median sales price this year. If I'm wrong on either prediction, perhaps it will be this one -- perhaps we'll start to see prices rising, but not quite as fast as they have over the past two years. The chances seem relatively low that we'd see an actual decline in the median sales price in 2020. OK - enough about my predictions --what about for you? Email me (scott@HarrisonburgHousingToday.com) and let me know where you think our local market will go in 2020. And keep up with all the market data between now and next January by signing up to receive my monthly housing market report by email if you are not already receiving it. | |
Comparing My 2019 Housing Market Predictions To Reality |
|
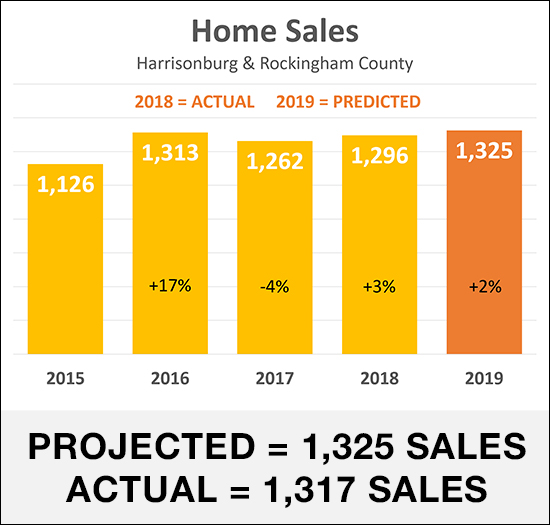 As shown above, I was slightly (just slightly) too optimistic about the pace of home sales that we would see in Harrisonburg and Rockingham County in 2019. I was predicting that we'd see a 2.2% increase to 1,325 home sales -- and we only saw a 1.6% increase to 1,317 home sales. So -- pretty close -- we did see a slight increase in the pace of home sales, and it was less than the 3% that we saw in 2018. Just as I observed last year -- even though we had low inventory levels all year long, buyers still found homes to buy -- which created a slight increase in the pace of sales, and a further decline in "days on market" in 2019. 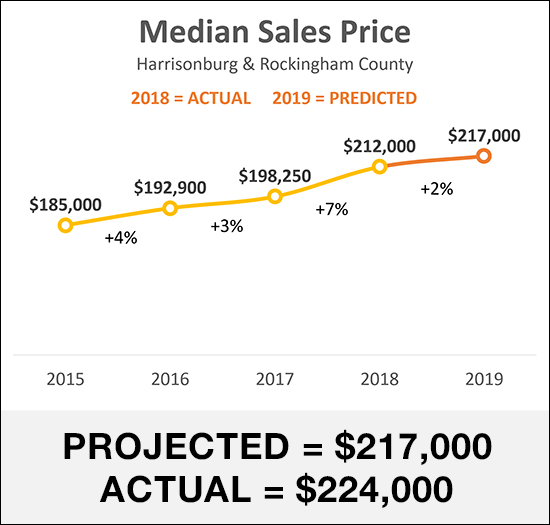 If I was ever-so-slightly too bold in my prediction as to the pace of home sales, I was too conservative in my prediction as to the change in median sales price we'd see during 2019. I was predicting we'd see a 2.4% increase to a median sales price of $217,000 -- and we actually saw a 5.7% increase to a median sales price of $224,000 in 2019. This is similar to the 6.9% increase that we saw in 2018. So, we did see a smaller increase (5.7% is smaller than 6.9%) during 2019 than we saw in 2018 -- but it was still a larger increase than has been seen in most recent years. Stay tuned for some predictions for 2020 in the coming days! | |
Home Sales Rise Around One Percent In 2019 |
|
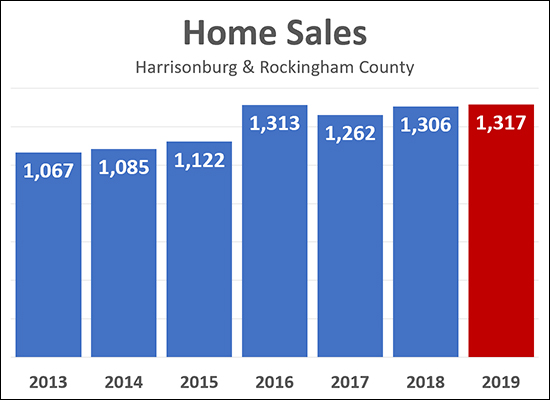 All home sales have not yet been reported but it is seems that we will see around a 1% increase in the pace of home sales in Harrisonburg and Rockingham County between 2018 and 2019. There have been 1,317 home sales recorded in the MLS thus far for last year and we may see that figure rise a bit more over the next few days, but not by much. This is a slight increase compared to last year -- and marks the highest year in recent memory...
Stay tuned for my full market report in the next week or so, as well as predictions for the 2020 housing market. Oh, and HAPPY NEW YEAR! | |
JMU On Campus Enrollment Seemingly Plateauing Just Under 21K |
|
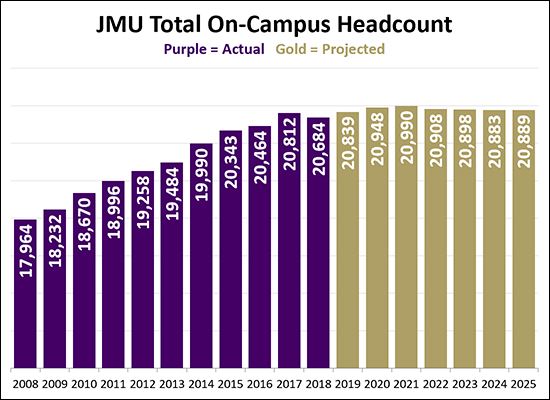 Based on JMU's enrollment projections approved by the State Council of High Education for Virginia, on campus enrollment...
These figures, and their changes over time, are the best numbers to be using when analyzing the need for off campus student housing in Harrisonburg -- and seem to be indicating that our local market does not need more student housing -- since enrollment is only anticipated to rise by 205 students between now and 2025. | |
Housing Inventory Levels Plummet in December |
|
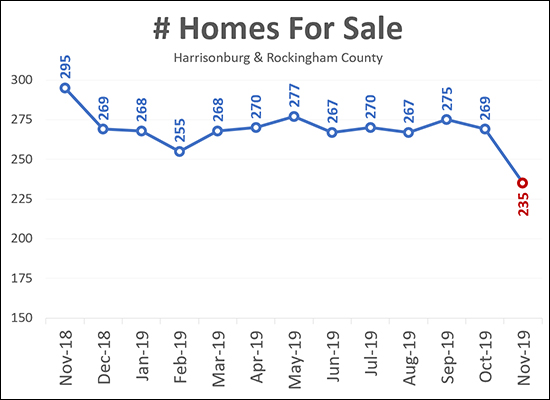 First - a note - each data point above is for the end of the given month. Thus, the 235 homes for sale in November are at the end of November -- or, as the case may be, the very beginning of December. Now, there are a few disclaimers I could make about the above data...
Regardless of the reason or explanation, though, the current inventory levels are SUPER low! Which is terribly frustrating for buyers -- and a great opportunity for any home owner who does need to sell right now. You are not likely to have much competition from other sellers! Stay tuned later in the month when I compile my full monthly report and we'll see if inventory levels perked back up as we made our way further into December. | |
Detached Homes in the City of Harrisonburg Under $200K Are Harder To Find |
|
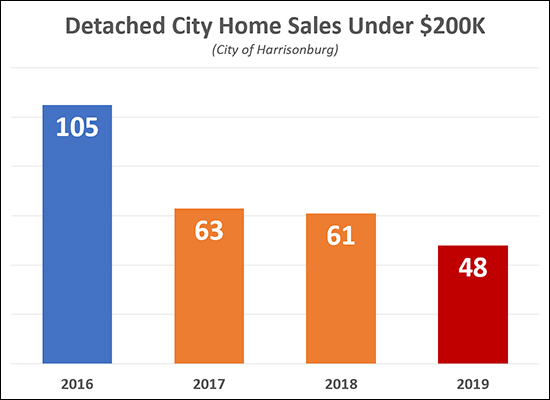 It's harder and harder to find a (detached) home in the City of Harrisonburg under $200K. As shown above, there have been fewer and fewer such home sales over the past few years. As a side note -- the 48 such homes that sold thus far in 2019 have had a median days on market of 5 days. So, when these under $200K homes do come on the market they usually go under contract quickly! As of today, there are 11 such properties on the market - but 7 of them are under contract. Explore all 11 of them here. | |
Home Sales Steady, Prices Slowly Rising in Harrisonburg, Rockingham County |
|
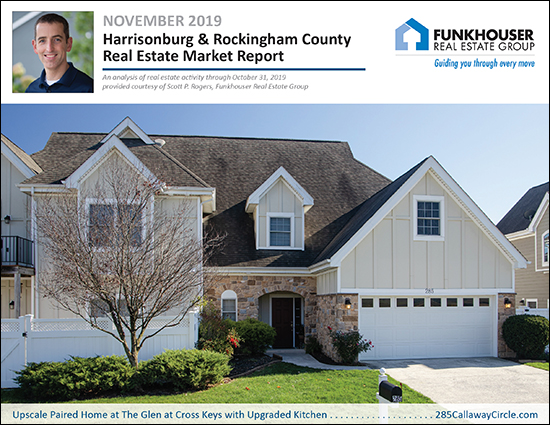 Despite rapidly declining temperatures (15 degrees last night!?) the local housing market is still rather hot! Read on for an overview of the latest market trends in Harrisonburg and Rockingham County, or download a PDF of the full report here. But first, check out this new listing at The Glen at Cross Keys, pictured above, by visiting 285CallawayCircle.com. OK, now, diving into some data... 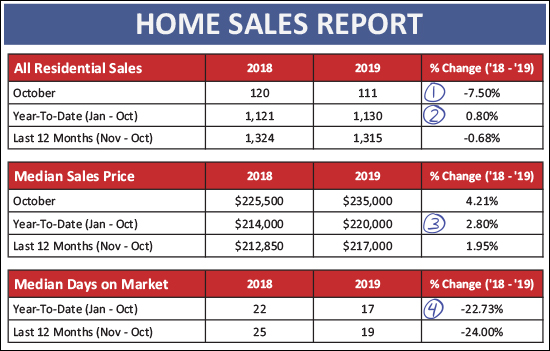 Several things to note above, as we can now look at 10 out of 12 months of 2019...
Now, looking at the detached sales trends vs. attached trends, we see similar but slightly different trends... 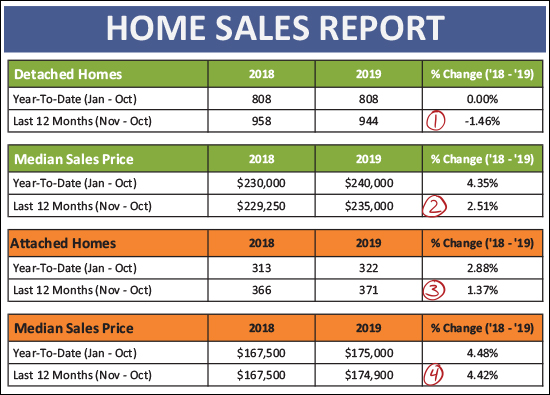 Above, you might note that...
Next, let's pause for a moment to evaluate sales in the City vs. the County... 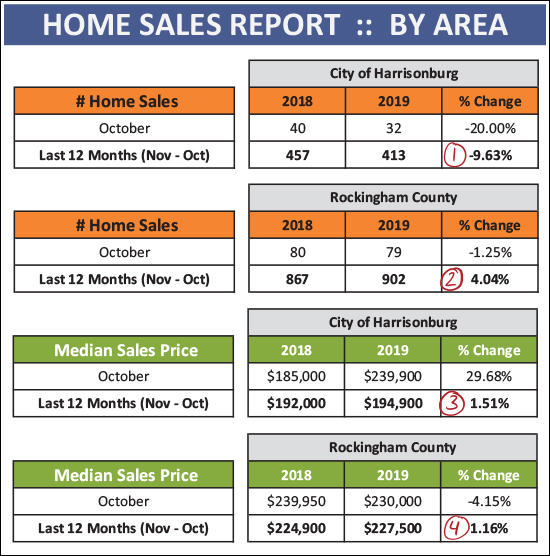 As you'll see above...
Now, for the roller coaster of the month-by-month activity... 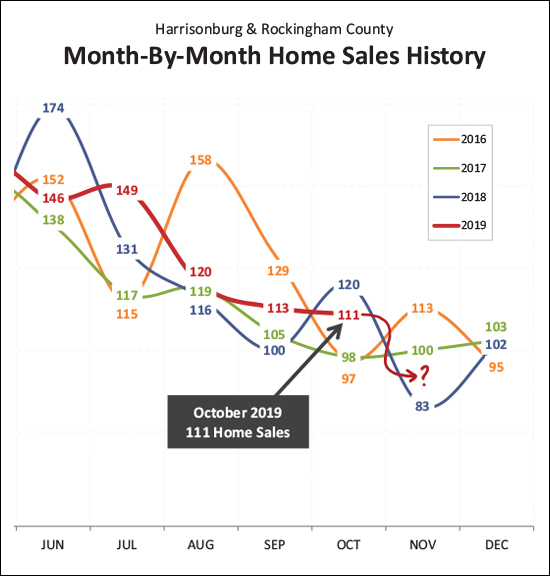 As shown above, October home sales in 2019 were certainly stronger than we saw in 2016 and 2017 -- but not as strong as last year. That said, home sales then slowed down quite a bit (!!) last November, so perhaps we'll see a stronger performance this November? I'm guessing we'll see 90 to 100 home sales in November 2019. 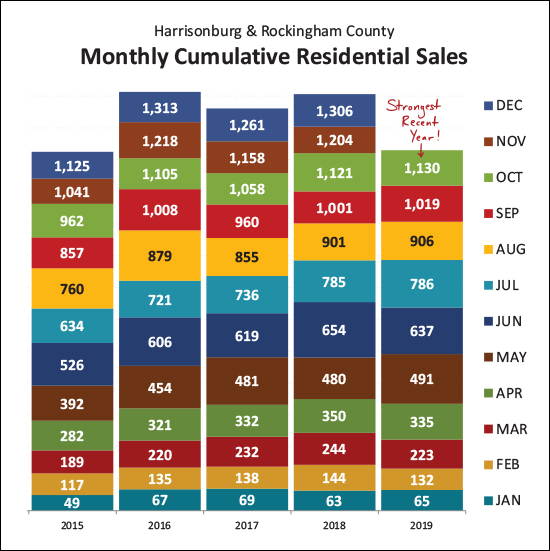 How do these monthly home sales stack up towards annual sales? The graph above breaks it down -- and we're moving at the fastest pace this year (1,130 sales in 10 months) that we've seen anytime in recent years. We seem to be on track to eclipse 1300 home sales again in 2019 - just as we did (barely) last year. 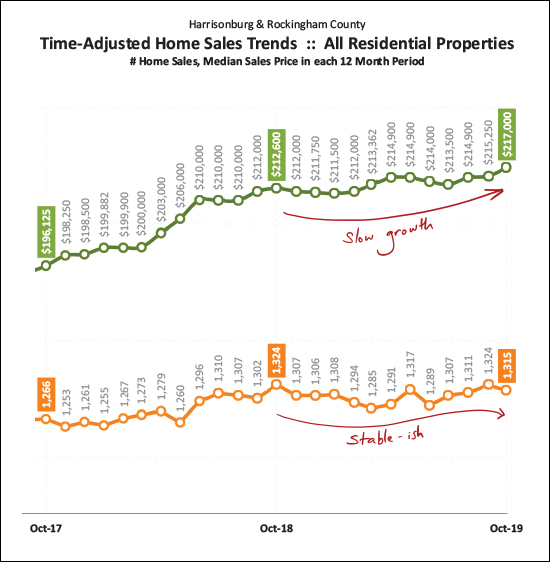 We can often get the best sense of long term trends by looking at a rolling 12 months of data, as shown above. Here we see that growth in the median sales price has been relatively slow over the past year (compared to a faster increase last year) and the pace of homes selling has remained relatively stable over the past year. 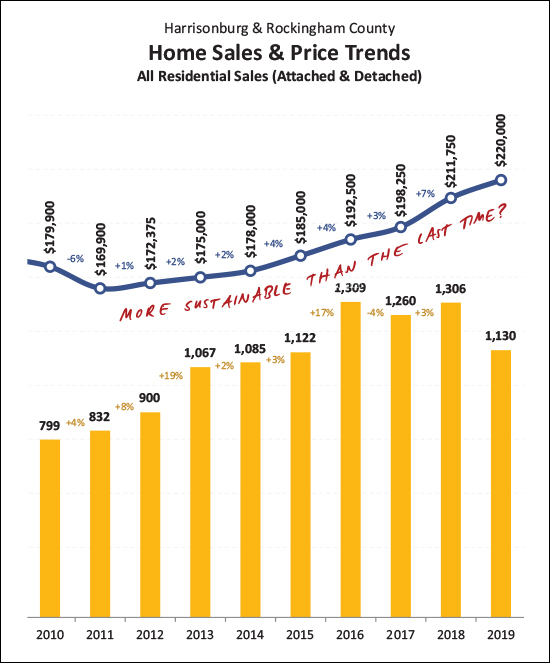 Looking back a few more years, it is clear that median sales prices (and home values) have been increasing steadily for quite a few years now -- ever since 2011 per this data set. But, the increases per year are smaller (1%, 2%, 2%, 4%, 4%, 3%, 7%, 4%) than during the last real estate boom when we had three years of double digit (17%, 14%, 14%) increases in the median sales price. So, perhaps this increase in home prices is more sustainable than the last time we saw steady increases over time. 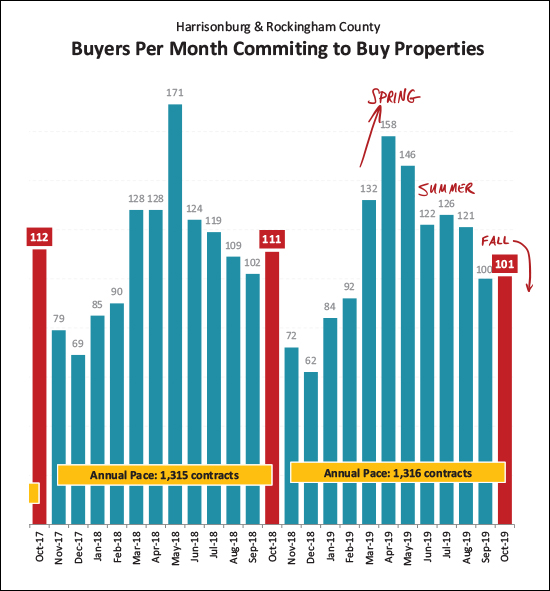 Back to temperature and seasonality - even though the annual pace of buyer activity is up, right now contract activity is starting to decline. The strongest months of buyer activity are typically in the Spring and Summer. We have started to see the usual slow down this Fall and will likely see continued declines in monthly contract activity as we move through November, December and January. 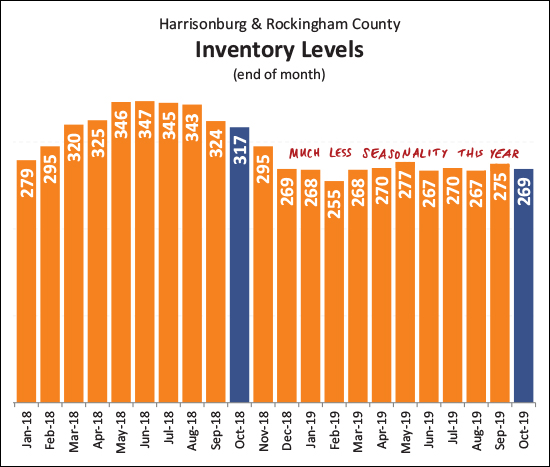 Somewhat curiously, despite the seasonality of buyer activity -- the inventory levels have stayed relatively steady for the past year -- or at least the last 10 months. We did not see the usual increase in inventory levels in the Spring and Summer this year -- perhaps because buyers were poised and ready and snapped up the new listings as soon as they hit the market. Thus, we may not see much of a decline in inventory levels over the next few months either. 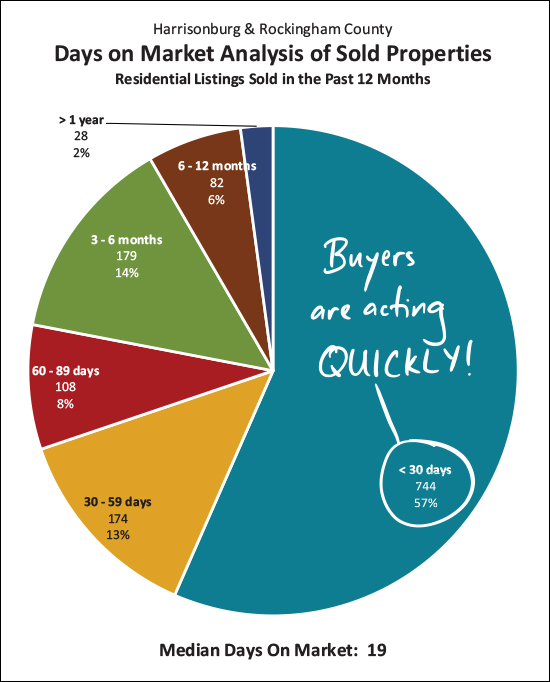 Ah, yes, the buyers DID snap up the listings quickly! In fact, over the past 12 months, 57% of homes that sold were under contract in less than 30 days -- and the median days on market was only 19 days! 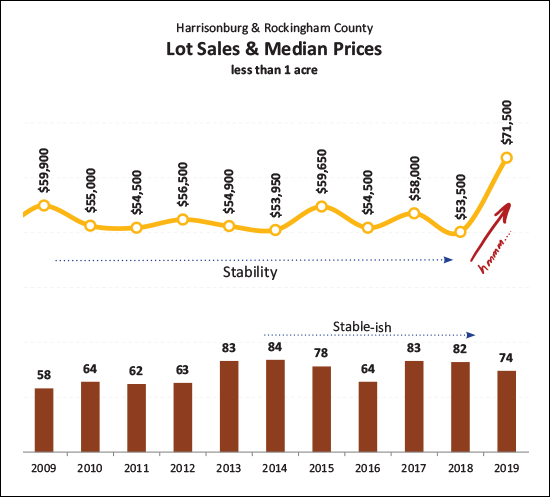 Breaking out of the "house" mold for a moment -- look at lot sales this year It seems we'll likely see a similar number of lots of less than an acre selling this year (around 80) but the median sales price has increased quite a bit over any recent past year!? 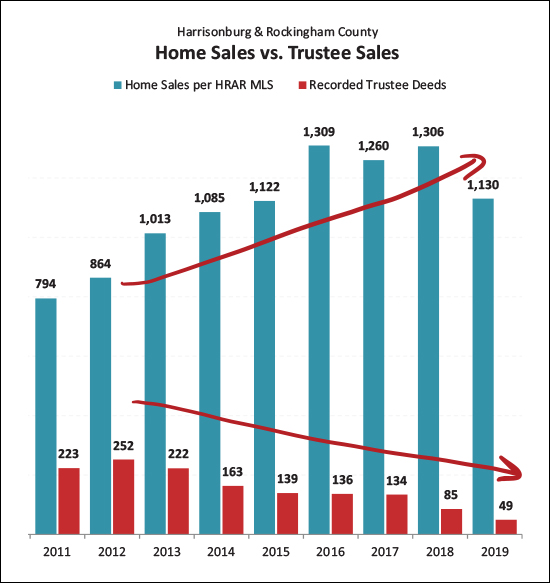 If you're looking for a sign of relative health in the local housing market -- look no further than the declining foreclosure rate in this area. As shown above, we have seen fewer (and fewer) foreclosures over the past eight years as more and more homes have sold. 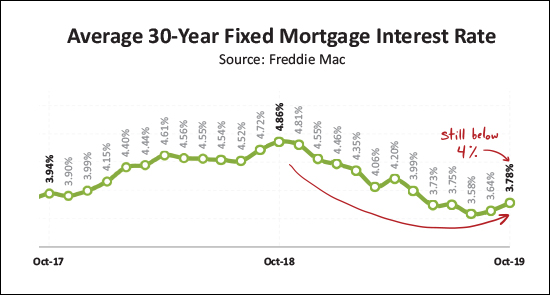 And finally, if you're buying now or soon, you'll likely still be locking in a fixed mortgage interest rate below 4%. The average mortgage rate has risen a bit over the past two months, but we're still seeing absurdly low mortgage interest rates for folks buying principal residences. OK -- that's it for now. Again, you can download a PDF of my full market report here, or feel free to shoot me an email if you have follow up questions. In closing... If you're planning to sell over the Winter -- let's chat sooner than later about timing, preparations for your house, pricing within the current market and more. Call (540-578-0102) or email me and we can set up a time to meet to chat. If you're planning to (or hoping to) buy a home soon, be ready to be patient and then to ACT QUICKLY! :-) Make it a bit easier for yourself by knowing the market, knowing the process, knowing your buying power, and closely monitoring new listings! That's all for now. May we find warmer days ahead! :-) | |
Inventory Levels Seem Unable To Drop Below 250 |
|
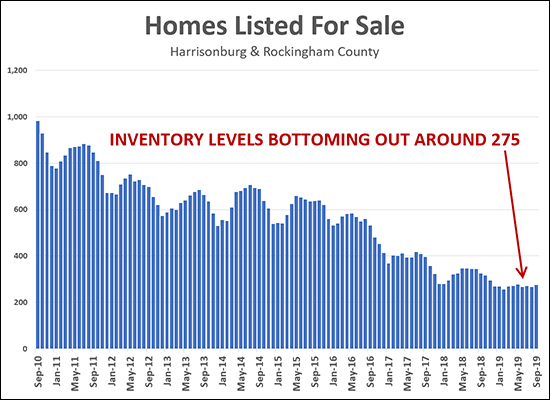 It's been the story for quite a few years now (at least 10 years, it seems) that inventory levels are dropping -- buyers have fewer and fewer homes from which to choose when they are looking to buy in Harrisonburg and Rockingham County. Here are how many homes have been on the market in October for the past 10 years...
So, it's certainly a more challenging time to be a buyer than anytime in the past 10 years -- but inventory levels seem to now be bottoming out around 275. Here's what the past six months have looked like...
So, over the next year, I wouldn't be surprised if we never dipped lower than 250 and we never rose above 300. Given these limited inventory levels, it is more important than ever that buyers in today's market are ready to be patient and then to ACT QUICKLY! :-) Buyers can make it a bit easier on themselves by knowing the market, knowing the process, knowing your buying power, and closely monitoring new listings! | |
Home Sales, Prices Continue To Rise in Harrisonburg, Rockingham County |
|
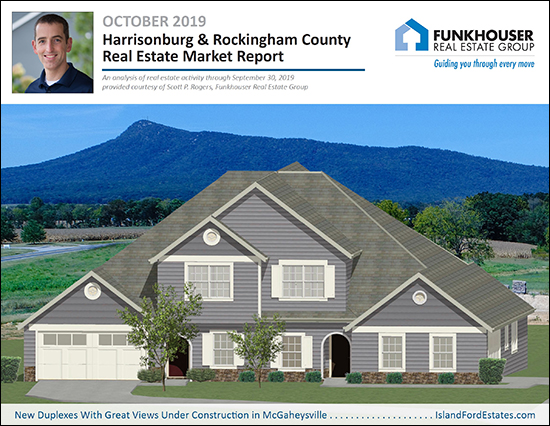 Autumn is here! Leaves are falling. Temperatures are falling. Home sales are not -- and prices are not! So, brew yourself a cup of coffee or tea, and let's take a look at some market trends for our local housing market... But first -- find out more about the new homes (rendering above) being built in McGaheysville by visiting IslandFordEstates.com. Now, onto the data, though you can skip to the full PDF report here. 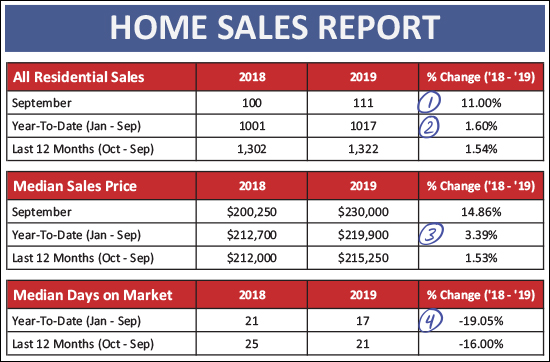 September was another solid month of home sales in Harrisonburg and Rockingham County. As shown above...
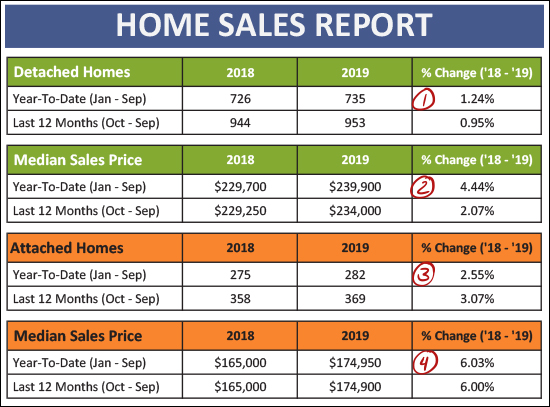 Breaking things down between detached homes (single family homes) and attached homes (duplexes, townhouses, condos) we see some trends that have been consistent throughout the year...
And let's look a bit closer at the month to month trajectory... 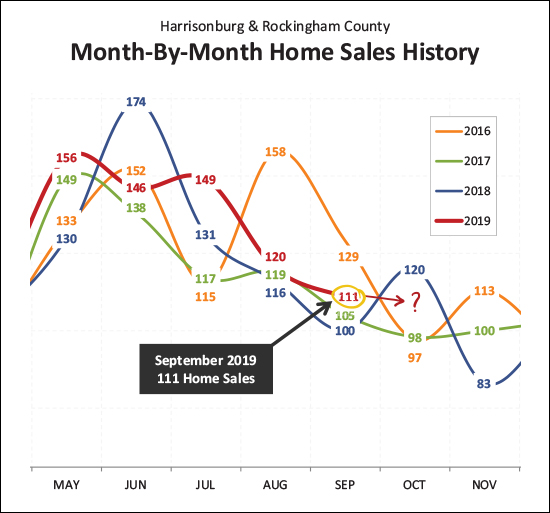 A few things stand out above...
Looking afresh at how this year stacks up to prior years... 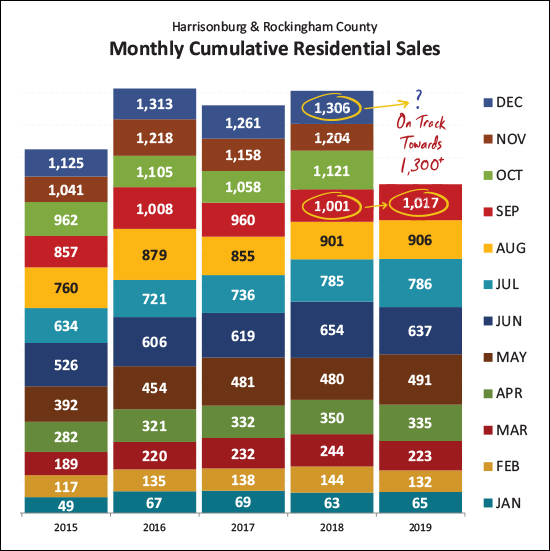 This has been the fastest (though not by a huge amount) start to the year that we've seen in a while. The 1,017 home sales through the first three quarters of the year surpasses sales seen during the same timeframe in each of the prior four years. So, it seems we may see another year of 1,300+ home sales in our area. 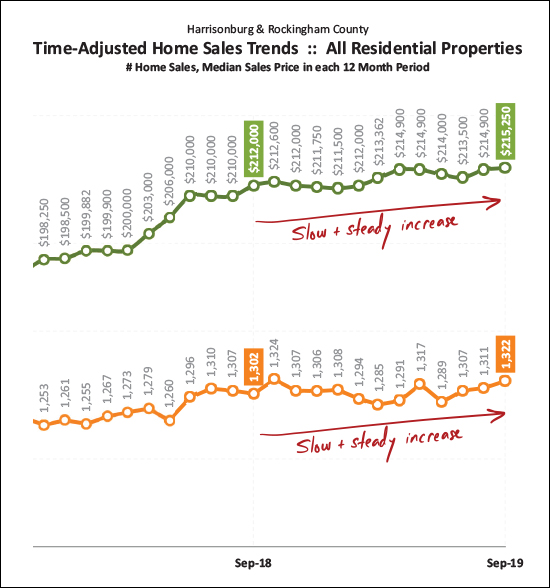 Zooming out -- looking at a rolling twelve months of market data -- we find a slow and steady increase in sales prices over the past year, and a slow and steady increase in the pace of home sales. All indications are that this could / might / should continue on into the remainder of 2019 and potentially 2020. 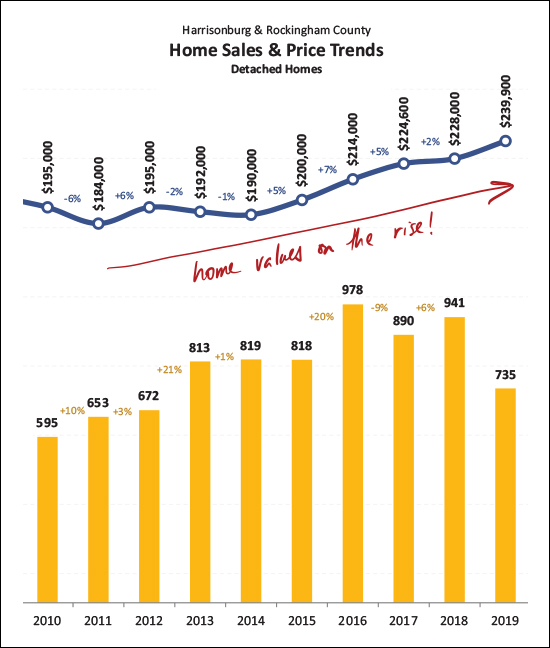 Taking one more look (above) at value trends we see that the median sales price of detached homes was a190K five years ago -- and has risen to $240K today. That's a healthy increase in home values, though with annual increases of 2% to 7%, it doesn't seem that the overall increases are as unsustainable as they were during the 2003-2007 market boom. 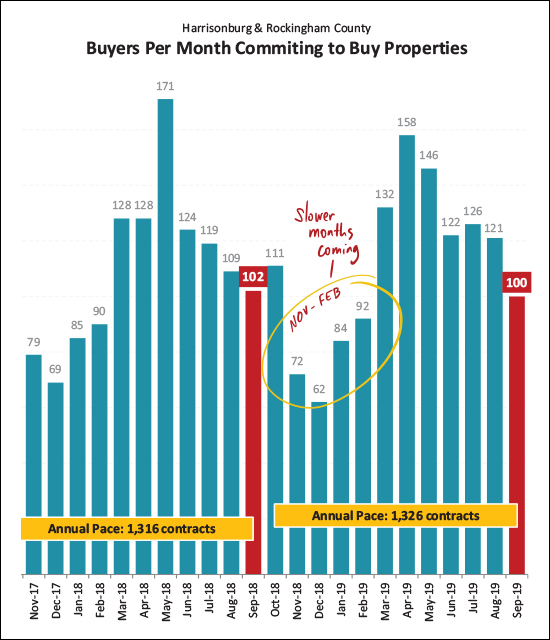 This (October) could be the last strong month of contract activity for a while. Above you'll note that contract signing slowed quite a bit between November and February -- and I expect we'll see something similar this year. The 100 contracts signed in September 2019 was on pace with the 102 seen last September. 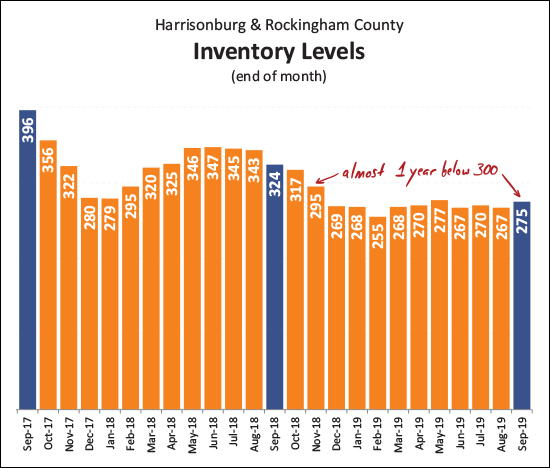 The new norm seems to be fewer than 300 homes on the market at any given time. Over the past 11 months there have always been fewer than 300 homes for sale -- though no fewer than 255. This is a far cry from where inventory levels were a few years ago, but perhaps this is where we'll be staying for a while. Buyers don't have many options at any given time, and yet, we're on track for a record setting year of home sales. 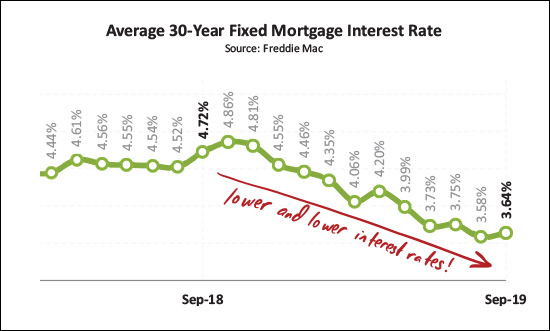 If buyers are sad about declines in inventory levels, they certainly aren't sad about declining interest rates! A year ago, the average 30-year interest rate was 4.72% and now it's down over a full percentage to 3.64%. This certainly makes it an affordable time to lock in a housing payment. A few closing thoughts...
| |
| Newer Posts | Older Posts |
Scott Rogers
Funkhouser Real
Estate Group
540-578-0102
scott@funkhousergroup.com
Licensed in the
Commonwealth of Virginia
Home Search
Housing Market Report
Harrisonburg Townhouses
Walk Through This Home
Investment Properties
Harrisonburg Foreclosures
Property Transfers
New Listings

