| Newer Posts | Older Posts |
Is October Too Late In The Year To List Your Home For Sale? |
|
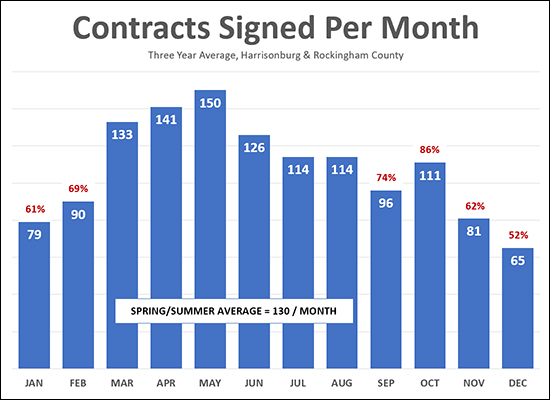 I believe this question is best answered by evaluating when buyers make an actual buying decision -- which is when they sign a contract. The data above shows when buyers sign contracts -- calculated by averaging data from the three most recent years. As can be seen, the busiest buying season is March through August when an average of 130 buyers per month make a buying decision. The remaining six months of the year (September through February) show anywhere between 52% and 86% as many buyers as the average of 130 per month seen in the busiest six months of the year. So -- listing your home in October is not at all a bad idea based on this data! As shown above, the it's likely the highest month of buyer activity that we'll see until we get to next March. Even late October can work, as we're likely to see 62% as many buyers signing contracts in November as compared to the average busy month. That said, in the following month (December) we're likely to only see about half as many buyers as compared to the average month. So -- looking to sell before next Spring? Now is the time! | |
No, Home Values Are Not Falling In Belmont Estates |
|
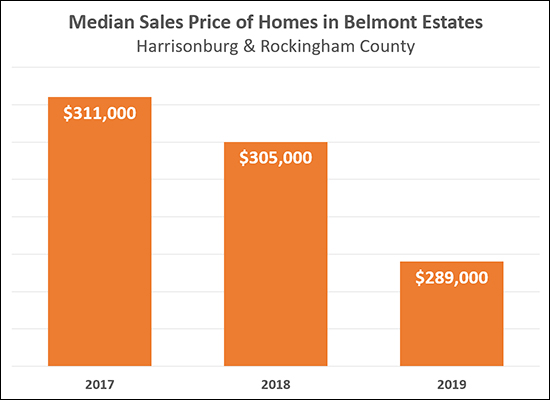 This post could also be called "The Dangers of Micro Market Analysis" as you'll discover... The graph above shows that the median sales price of homes in Belmont Estates has been falling over the past few years -- from $311K down to $305K and now down to $289K. How could this be!? After all, aren't home values generally going up right now? 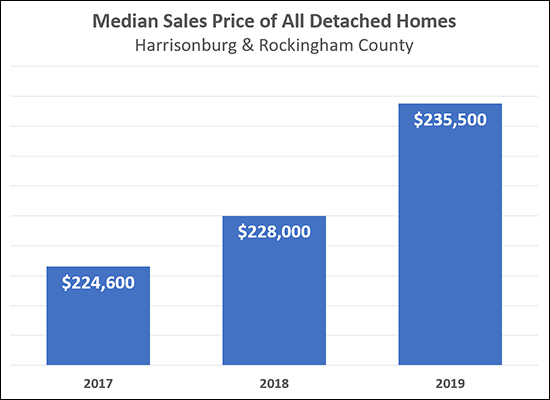 Yes, in fact, home values are going up right now. Above you'll see that the median sales price of all homes in Harrisonburg and Rockingham County has risen from $224,600 in 2017 to $228,000 last year to $235,500 in 2019. So, if home values are going up in our overall market area, why is the median sales price going down in Belmont Estates? Do folks just not want to live there any longer? I would suggest that the decline in the median sales price in Belmont Estates is not a result of home values falling, but rather, a result of which specific homes happen to have sold in Belmont Estates over the past three years. We can see this when we look at the size of the homes that sold each year... 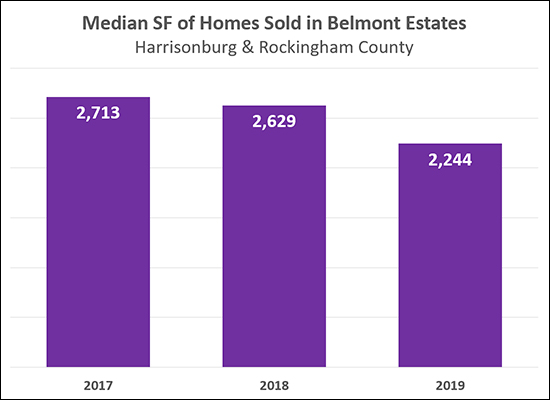 As you can see, smaller homes have sold in Belmont Estates as we moved from 2017 to 2018 to 2019. So -- either homes in Belmont Estates are shrinking (ha ha - just kidding) or the median sales price appears to have declined over the past two years because smaller and smaller homes have happened to have sold each year. And thus, this is the danger of analyzing a micro market -- a small amount of data points might lead you to incorrect conclusions. | |
Home Sales Stable, Median Prices Slowly Rising in Harrisonburg, Rockingham County |
|
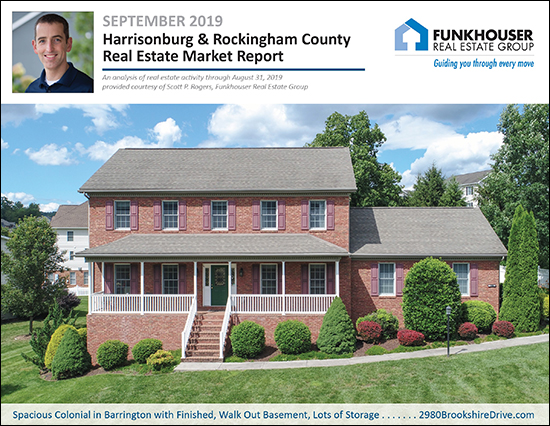 Summer might not officially end for another six days, but today has certainly has been a nice taste of the cool Autumn days to come. That said, even if the temperatures are starting to cool down, home sales are not yet ready to do so in our local market. Before we take a look at the most recent market trends, take a few minutes to check out this spacious Colonial in Barrington that is pictured above by visiting 2980BrookshireDrive.com. Now, then, let's get down to some overall market stats... 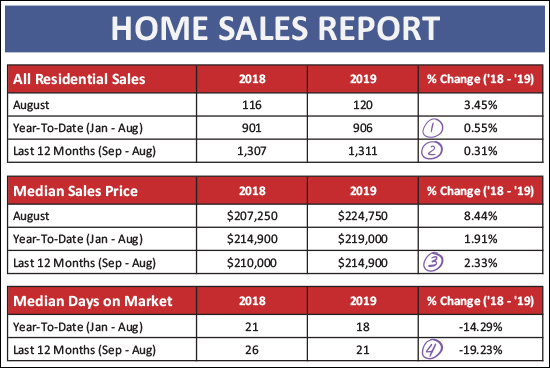 First above, lots (and not much at all) to observe here...
And how about if we break it down between detached homes (almost all purchased by owner occupants) and attached homes (mostly purchased by owner occupants, but also purchased by investors)... 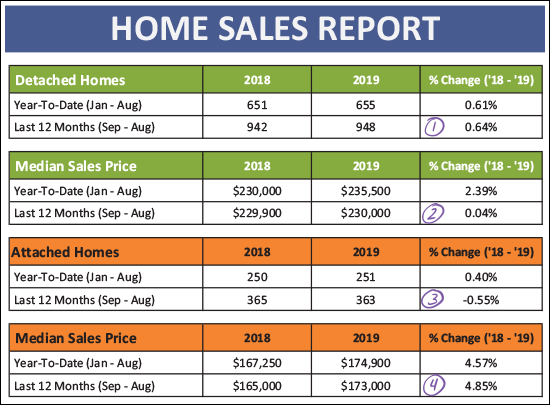 Here's what we're finding...
And now for that pretty visualization of the month to month ebb and flow of home sales... 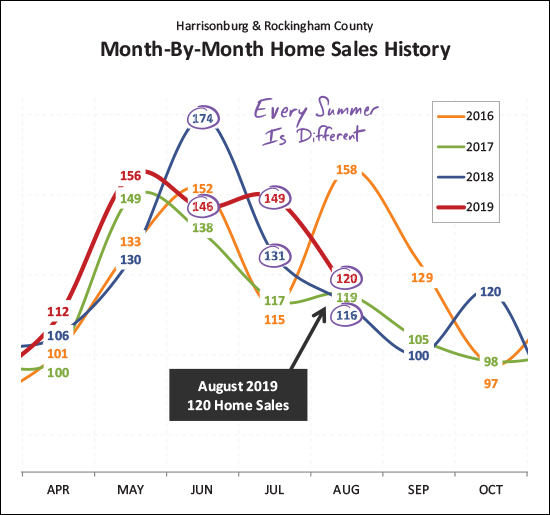 Here (above) we note that every summer is different. Last year (blue line) June was a spectacular month for home sales - with 174 closings - more than seen anytime (ever!) in our local area. This year (the red line) June home sales were mediocre at best. But then, July and August home sales were stronger this summer as compared to last year. Looking ahead to September, I anticipate that we're likely to see around 110 home sales - slightly more than the past two years, but not quite as many as back in 2016. 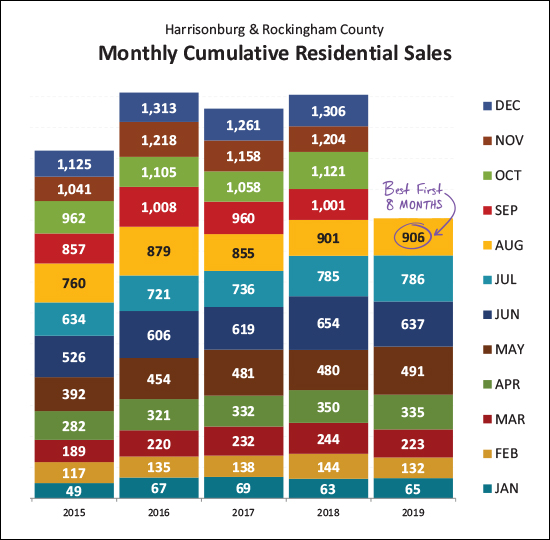 When we pile all of the months on top of each other we can get a clearer view of how the first eight months of this year (Jan-Aug) compares to the first eight months of the past four years. And this is where we find that we have had the best first eight months of anytime in at least the past five years. Given the current trajectory, it seems likely that we'll see at least 1,300 home sales this year. 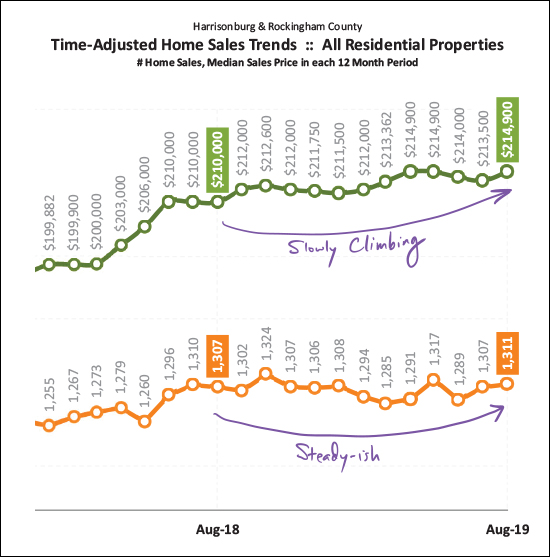 This graph shows us the overall long term trends in local home sales. The green line is the median sales price which has been creeping its way up over the past year. The orange line shows the annual rate of home sales, which has been hovering around 1,300 home sales for the past year. 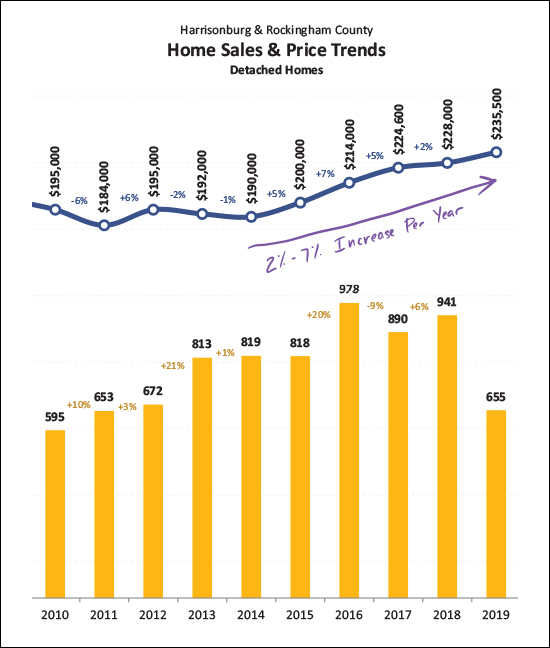 Focusing in just on the detached homes, we see that the median sales price has been increasing anywhere from 2% to 7% per year for each of the past four years. This year we are likely to see another increase in the median sales price somewhere in that range. 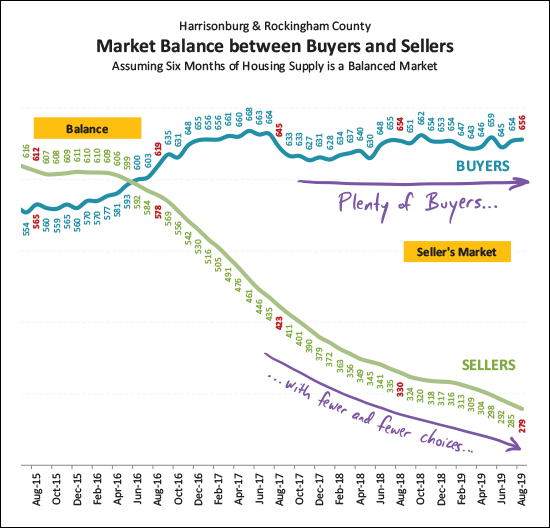 With steady home sales and increasing sales prices, it's a great time to be a seller. But not as great of a time to be a buyer. As shown above, there have been a relatively stable number of home buyers over the past few years, but the number of homes for sale at any given point has been steadily declining for over three years. 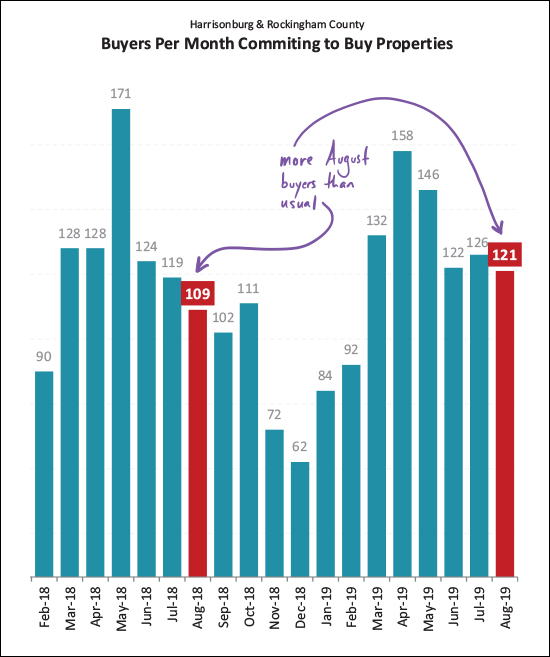 Why do I think we'll see 110 home sales in September? Well, partially because 120 home buyers signed contracts in August. This was a higher rate of contract activity than last August and suggests that sales will continue to be relatively strong as we continue into the Fall. 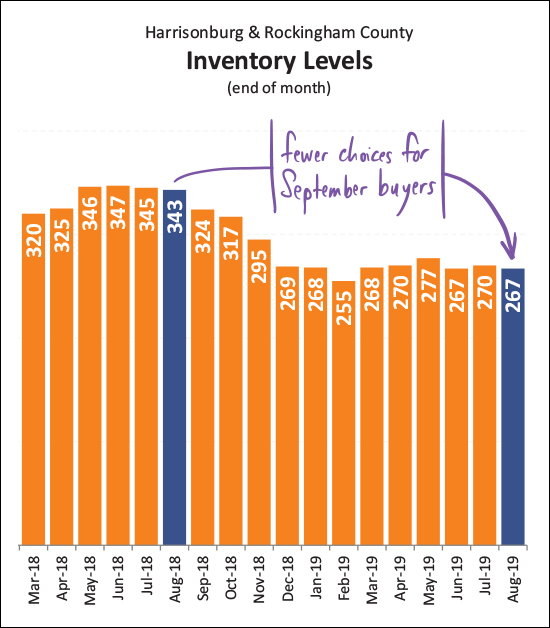 And here (above) are those overall inventory numbers. The number of homes for sale has been declining over the past year. We used to see much more of an increase in available inventory during the Spring months but this past year buyers were contracting on new listings almost as fast as they were being listed, which kept the inventory levels low. 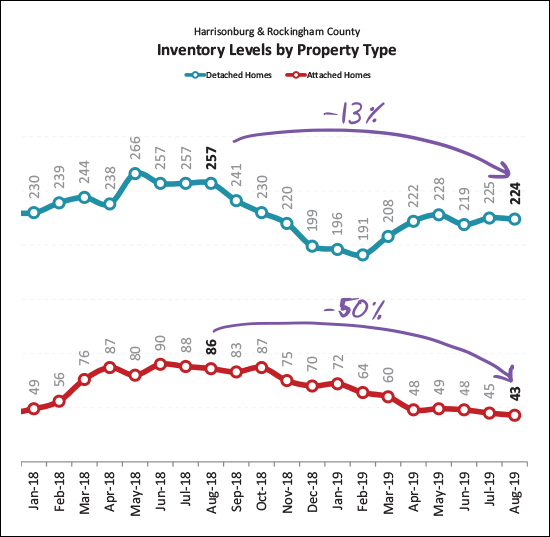 Here's a startling statistic. Inventory levels have declined 13% over the past year when we look just at detached homes -- but when we look just at attached homes (duplexes, townhouses, condos) we find a shocking 50% decline in the number of homes for sale! It is a tough time to be a first time buyer these days! 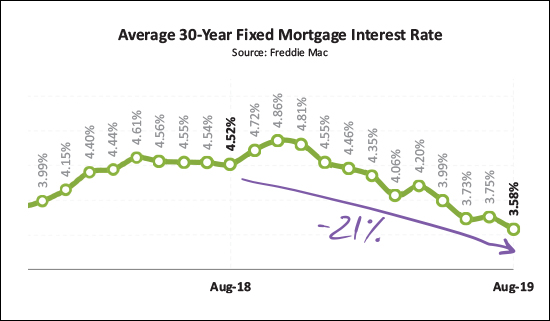 Finally, mortgage interest rates. If there is any consolation for today's home buyer it is that their mortgage interest rate is likely to be lower than anytime in the past year or longer. Interest rates have fallen 21% over the past year -- from 4.52% to 3.58%. A few final notes and thoughts for those that made it this far...
That's all for today. Have a delightful, pleasant, cool evening! | |
Do Detached Or Attached Homes Appreciate More Over Time? |
|
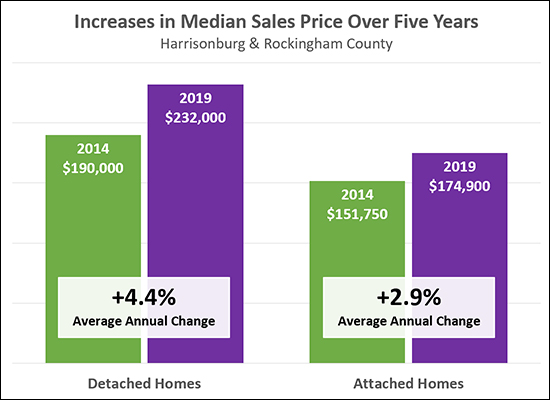 Over the past five years, detached homes have increased more in price (on average, per year) than attached homes (townhouses, duplexes, condos). This wouldn't always be the case if we looked back over the past 20 years -- we could find time periods when this were not true -- but we have seen some larger than normal swings in home values during some of those past 20 years. My general sense (beyond the numbers) is in line with what the graph above shows -- which is that over time (5+ years) both detached and attached homes are likely to increase in value, but detached homes are likely to increase in value a bit more quickly than attached homes. | |
Fewer and Fewer Foreclosures in Harrisonburg, Rockingham County |
|
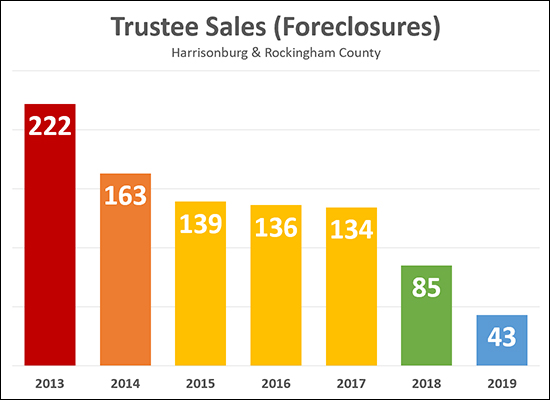 Here's a reminder of what is a good indicator that our local housing market continues to get healthier over time -- as shown above, the number of foreclosure sales per year has declined over the past several years. To put these into an even larger context:
All in all, it is a good sign for our local housing market when the number of foreclosures per year declines. It means more homeowners are able to stay in their homes, and make their mortgage payments, which is a general sign of a stronger local economy. | |
Harrisonburg Area Home Sales Over $500K Small But Strong Segment of Local Market |
|
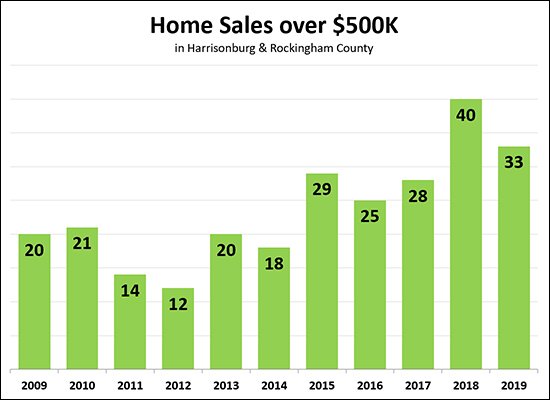 Only 3% of local home buyers spend $500K or more on their home purchase (per sales data over the past year) but this segment of the local housing market has been strong over the past few years. As shown above, there were 40 home sales over $500K last year - more than any time in the past decade. This year we seem to be on track to possibly match that, with 33 home sales over $500K in the first eight-ish months of the year. Reigning in our enthusiasm a bit, though, this is a relatively small number of buyers. If you are selling a home over $500K, you need to keep in mind that only about 40 buyers per year (just over 3 per month) spend that much money on a home in ALL of Harrisonburg and Rockingham County! Let's look a bit further into even smaller segments of the high end local market... 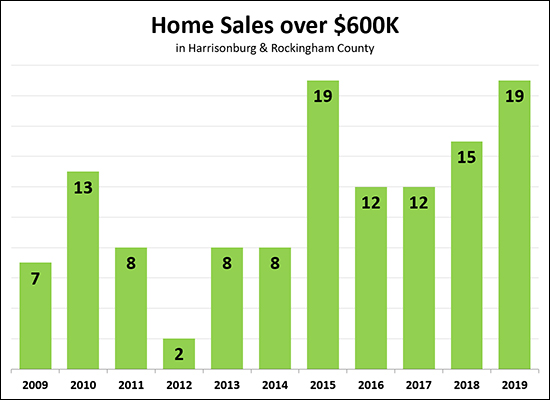 While last year (15 home sales) wasn't quite the strongest year for $600K+ home sales -- this year looks like it will be. We have already -- in eight months -- matched the highest number of $600K+ home sales seen in a year when looking back for 10 years. And one more look at an even higher price point... 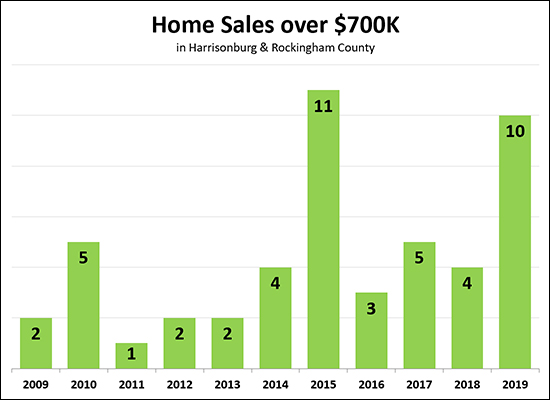 Above, you'll see that most years there are only 5 or fewer home sales over $700K. But back in 2015 there were 11 (which was more than double the norm) and this year there have already been 10 such home sales! So -- overall, the high end home sales market is doing well -- comparatively, but that is not to say that selling a home over $500K is an easy task - it's not. Home sellers over $500K are aiming for a tiny pool of potential buyers -- even if that pool of buyers might be slightly stronger this year than last. | |
Fewer Than 1 In 4 Home Buyers Spend Over $300K in Harrisonburg, Rockingham County |
|
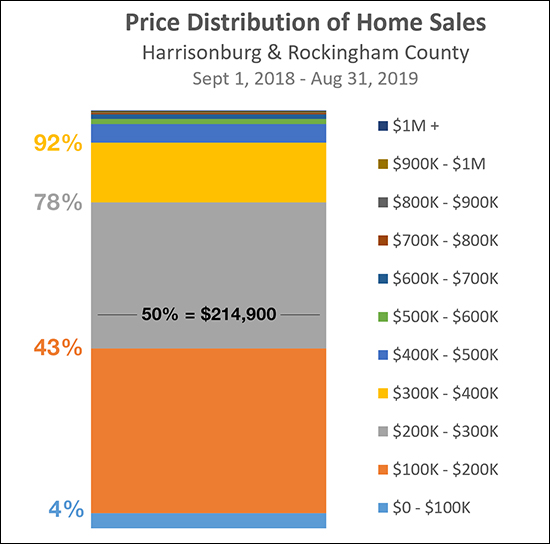 Lots to observe / conclude here...
| |
Fall Is Not The Worst Season For Selling Your Home |
|
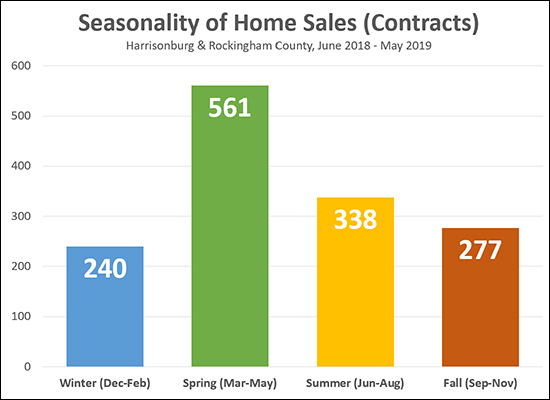 As is likely no surprise -- the busiest time for home sales (contracts) is SPRING -- by far! There is then a relatively large drop off from Spring to Summer. Somewhat surprisingly, it is not an enormous decline between Summer and Fall. So -- Fall is not the worst season for selling your home, but it is far from the best. Of note, the data above reflects the timeframe during which properties went UNDER CONTRACT -- not when they closed. Plenty of the Summer contracts turned into Fall closings -- but the 277 figure is a reflection of how many buyers made buying decisions (signed contracts) between September and November of last year. So....if you want to sell your home (and close on it) in 2019, you should be thinking about getting it on the market sooner rather than later. Fall is definitely a better time to sell than Winter! | |
How Big (in Square Feet) Is Your Home? |
|
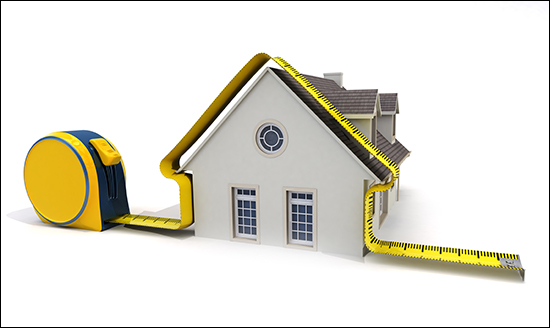 So -- are you trying to figure out the square footage of your home? Here are a few methods that are NOT necessarily going to give you the correct answer....
So, how do you really measure square footage? It starts outside the home! You'll need to measure the exterior dimensions of each level of your home -- and then subtract any open areas, such as the open space above a foyer. This measurement method, as odd as it may be, is what is used by nearly every appraiser, as it is how "gross living area" is defined by Fannie Mae, HUD, FHA, ERC and ANSI. As such, it is important that you're measuring the square footage of your home in the same way that nearly every appraiser and Realtor would be measuring it, so that you're comparing apples to apples when comparing the size (SF) of your home to another home that has sold or that is on the market for sale. And here's why I consider it to be an odd way to measure square footage....
| |
Summer Is Fading Away. Home Sales Are Not. |
|
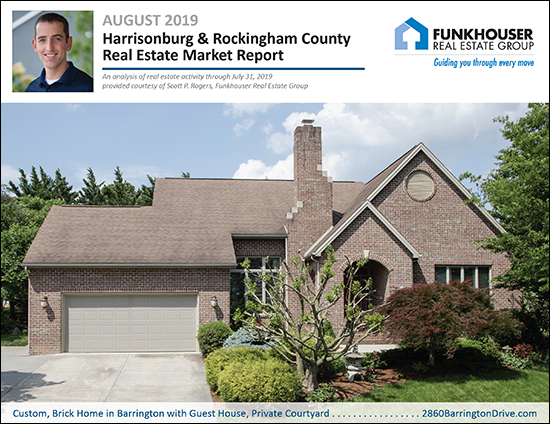 Summer is here! Oh wait, summer is gone!? Once that first week of August hits, it seems it's almost time for school to start again. Where did the summer go!?! While I ponder how another summer flew by so fast, let's take a few minutes to reflect on the state of our local housing market. But first - the beautiful home pictured above is this month's featured home - a spacious upscale home in Barrington with a finished basement, guest house and private courtyard! Check out the details at 2860BarringtonDrive.com. Now, onto the data! Download the full 28-page market report as a PDF, or read on... 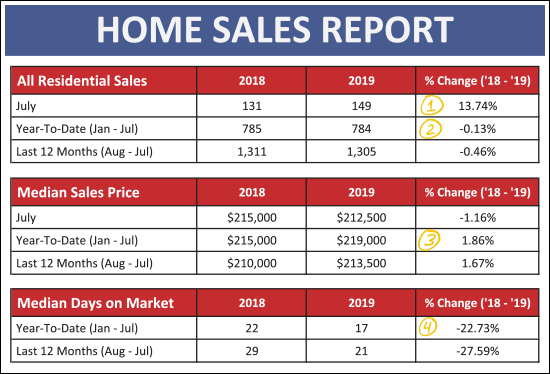 As shown above, July was a strong month for home sales...
Diving slightly deeper, let's see how detached homes compared to attached homes. An "attached home" is a duplex, townhouse or condo... 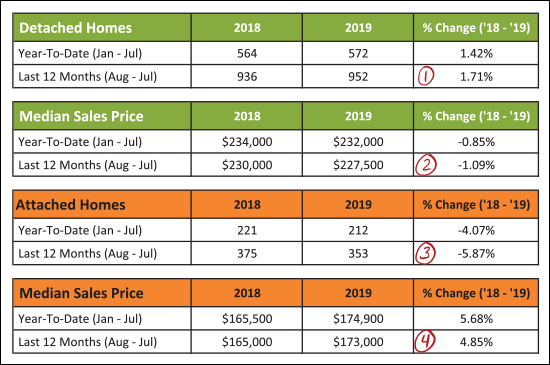 As shown above, there are some differences in these two broad segments of our local market...
And just how did this past July compare to some other months of July? 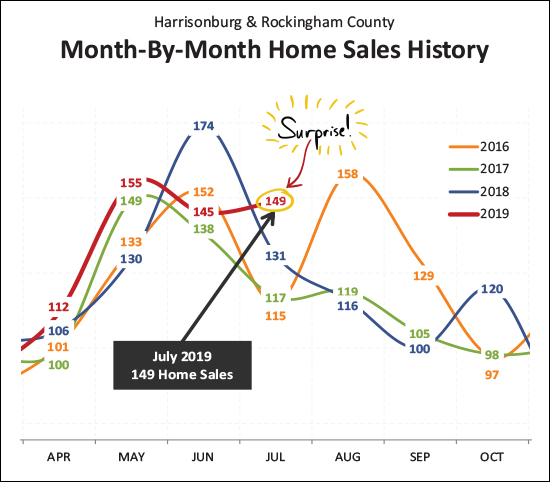 This was a bit of a surprise to me! June home sales were rather slow compared to previous months of June. I didn't anticipate that a slower June would so quickly translate into a faster paced July - but wow! Looking back at the past three years we have seen 115, 117 and 131 homes sales during July. This year it was 149 home sales! An impressive showing for buyers in the local marketplace! And here's how that strong month of July contributed to the overall year... 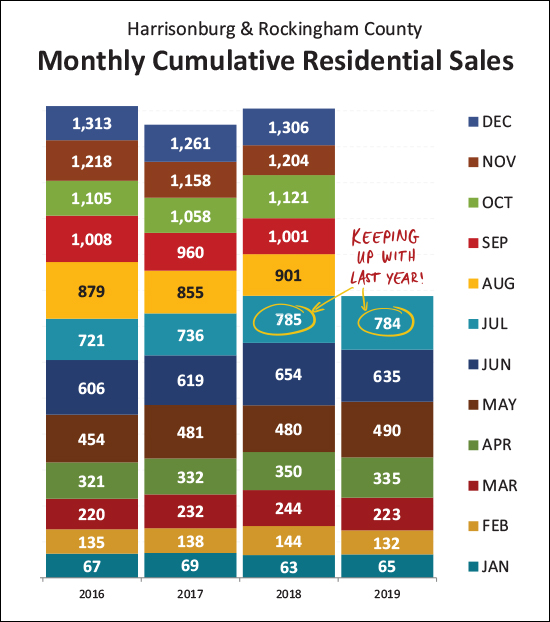 If we were a bit behind as of the end of last month (635 vs. 654) we just about (just about!) caught back up in July -- as there have now been 784 home sales thus far in 2019 compared to 785 last year. it would seem we'll probably make it back to around 1300 home sales this year. And now, let's step back a bit... 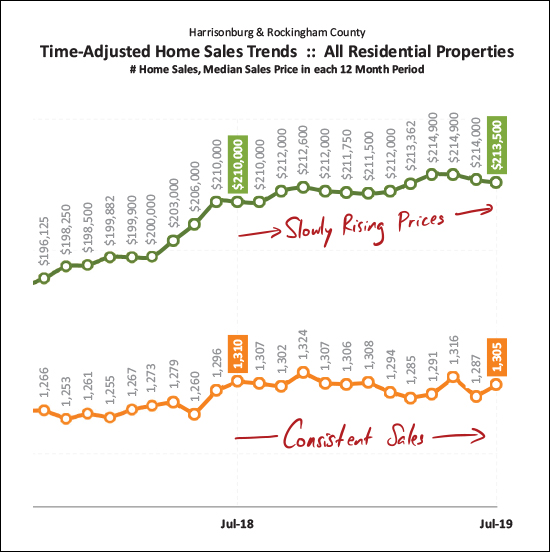 This is the slooooooooowest moving graph ever - it looks at a rolling twelve months of sales data. Here, though, we see that the general trend is a consistent-ish pace of home sales -- and slowly rising prices. And when we look for some overall indicators just for detached homes... 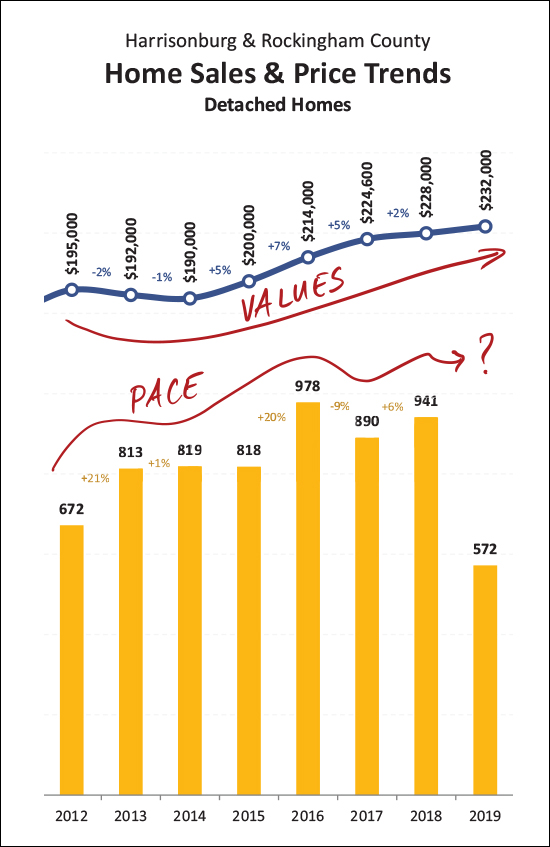 This is where we see (above) that despite some year to year turbulence as to the pace of home sales, we're seeing overall increases in sales prices all the way back to 2014. Some years (2015, 2016, 2017) have been larger increases than others (2018, 2019) but it has followed the same general trend. So, what's next? 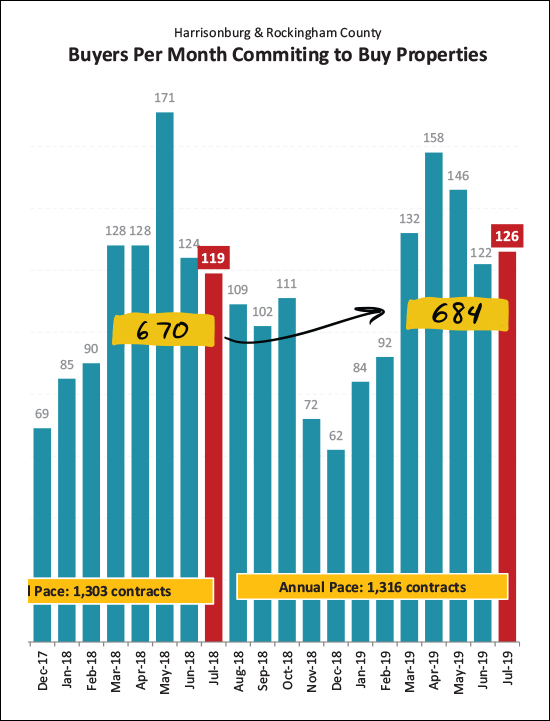 Well -- it would seem we are likely to see another strong month of home sales in August. After all, we saw an uptick (from 119 to 126) in July contracts, and over the past five months there have been 684 contracts signed, as compared to only 670 during the same months last year. How, though, will those contracts come together with such limited inventory? 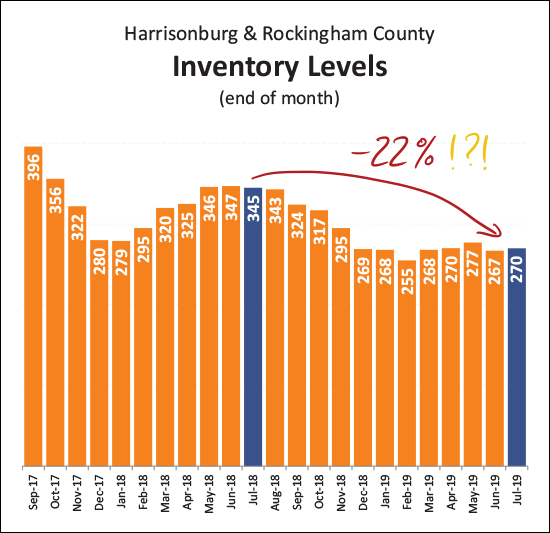 That is, of course, an excellent question! Inventory levels have fallen 22% over the past year. This means today's buyers are finding fewer and fewer options when looking for a home to buy at any given time. That said - a relatively consistent number of homes are selling - so a buyer might just have to be a bit more patient, and then be ready to jump quickly when the right house comes on the market. And one last note about mortgages and financing... 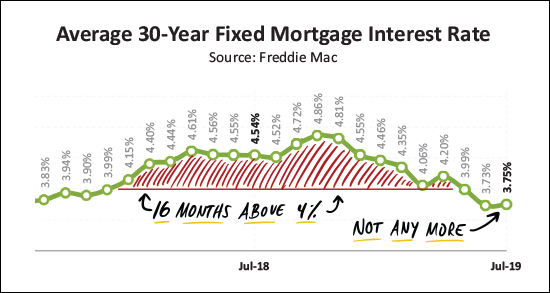 In case you missed it, today's buyers are locking in below 4% on 30 year fixed rate mortgages! We went through 16 months with rates above 4%, and we have now been back below 4% over the past few months. Anyone who locked in at 4.25%, 4.5%, 4.75%, etc., still has a wonderful long-term fixed rate mortgage interest rate -- but 3.something? Wow! I'll wrap it up there for now, with a few closing thoughts...
Until next time, have wonderful remainder of your summer, and a great start to your school year if you or someone you know will be getting back to the classroom this month! | |
Median Price Per Square Foot Rising Again In 2019 |
|
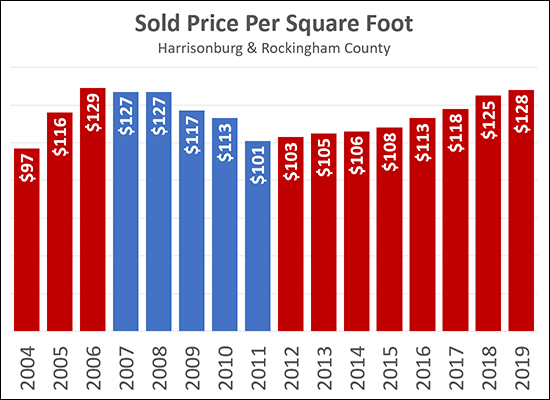 In addition to watching how the median sales price changes over time, it can be quite insightful to see how the median price per square foot of sold homes changes over time. The graph above tracks the median price per square foot of single family homes (not townhouses, duplexes or condos) in Harrisonburg and Rockingham County over the past 15 years.
Price per square foot fell 22% between 2006 and 2011 as the market cooled back off. Since that time, however, we have seen a slow and steady increase in this metric -- from $101/SF in 2011 to $125/SF last year -- which marks a 24% increase over the past seven years. I do not expect that we will see any drastic increases in this metric in the next few years, though an increasing number of buyers (more demand) and significantly fewer sellers (less supply) does make you wonder if we will start to see more rapid increases in sales prices, and thus in price per square foot. ALSO OF NOTE -- this metric is most helpful in understanding value trends over time -- not in calculating the value of one particular property. This median price per square foot is the mid point of many very different homes -- new homes, old homes, homes with garages, homes without garages, homes with basements, homes without basements, homes with acreage, homes on small lots, etc. A median price per square foot can be more helpful in understanding the potential value (or value range) of a single property if we pull that median value based on a smaller data set of more properties more similar to the single property. | |
Home Sales Slow, Prices Inch Higher In First Half of 2019 |
|
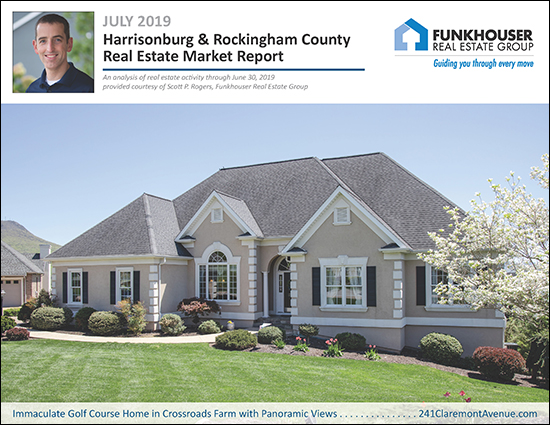 It's hard to believe, but half the year has already flown past! Let's take a few minutes to review some recent trends in the local housing market -- but first...
Now, starting with some data packed charts before we get to the colorful graphs... 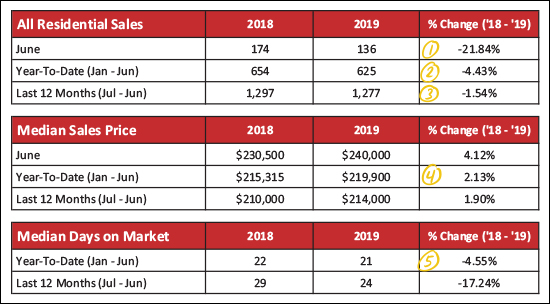 Looking at the market overview above, here's what's popping out to me...
Now, let's see how detached home sales compare to the sale of attached homes. Attached homes are townhouses, duplexes and condos... 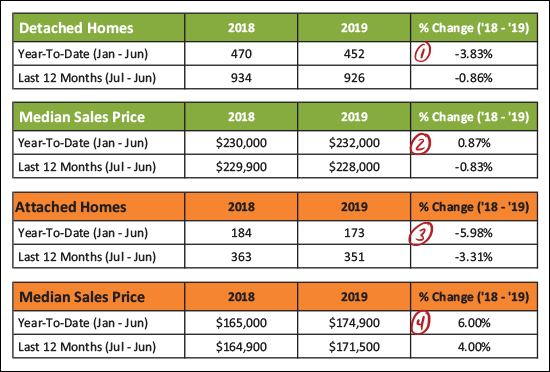 The green chart above is detached home sales, and the orange chart is attached home sales, and here's how things break down...
And now, the pretty graphs... 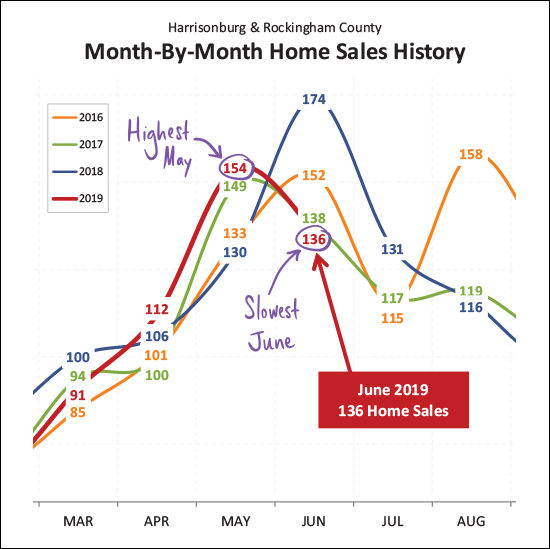 What a roller coaster! As shown above we just experienced the HIGHEST month of May home sales in the past few years, and then the LOWEST month of June home sales in the past few years. So, right, hard to conclude much there -- other than that May and June are some of the busiest months for home sales. Looking ahead, hopefully we'll see a nice mid-range July -- how about 120 or 125 sales? 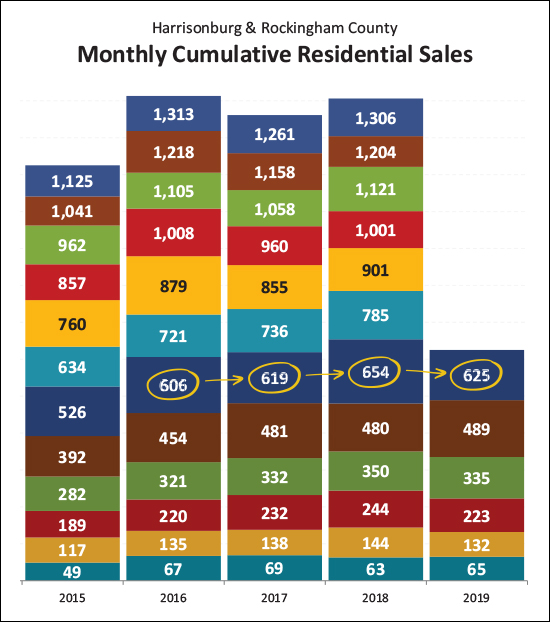 I use the graph above to see how we're doing in the current year as compared to the prior four years. As you can see, the 625 home sales in the first half of this year is about on par (above two, below one) with the past three years when we have ended up with 1250+ home sales. So, if I had to guess, we'll probably see between 1250 and 1300 home sales in total this year. 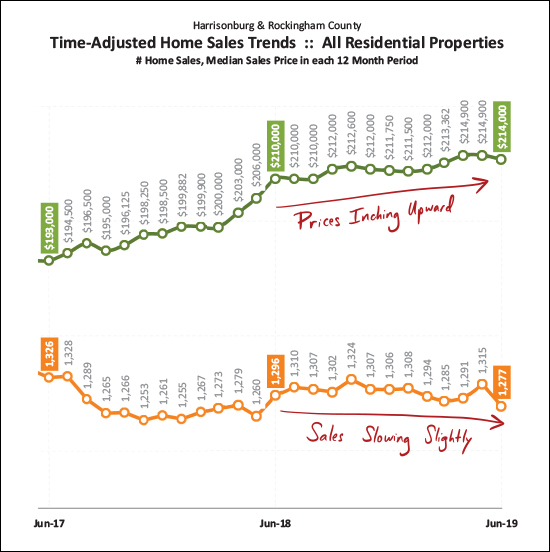 The graph above is the best indicator of overall long term trends. Each data point reflects 12 months of sales data. As you can see, the pace of home sales (orange line) has been declining slightly over the past year -- while the median price of those home sales has been inching upwards to its current level of $214,000. 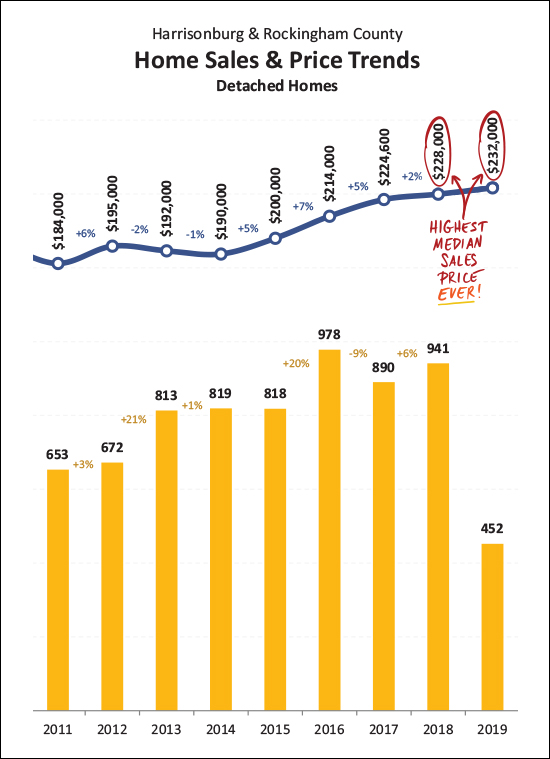 I'm throwing this one (above) in for fun - because I haven't highlighted this fact lately. The median sales price of detached homes is $232,000 thus far in 2019, and was $228,000 in 2018. Both of these median sales prices are/were the highest median sales price we have seen for Harrisonburg and Rockingham County -- ever! We've come by these prices slowly and steadily over the past five years. 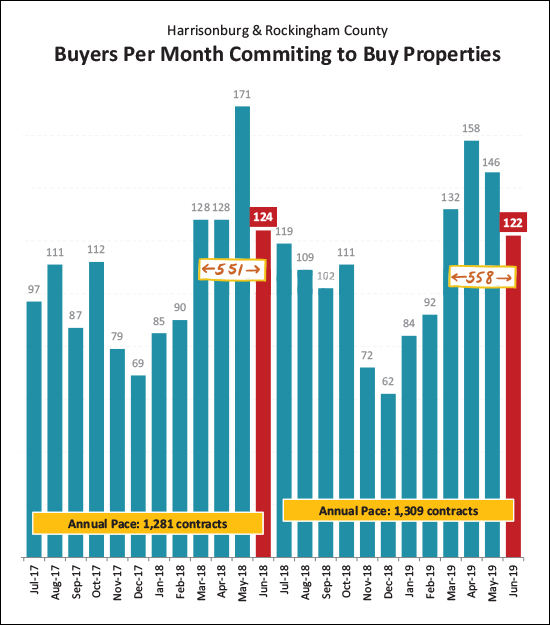 Those new contracts, they keep getting signed! A total of 122 properties went under contract in June 2019 as compared to 124 last June -- and when we look at the March-June timeframe, we find 558 contracts this year and 551 last year. As such, this year's Spring/Summer buyers (and, incidentally, sellers) are certainly keeping pace with last year at this point. 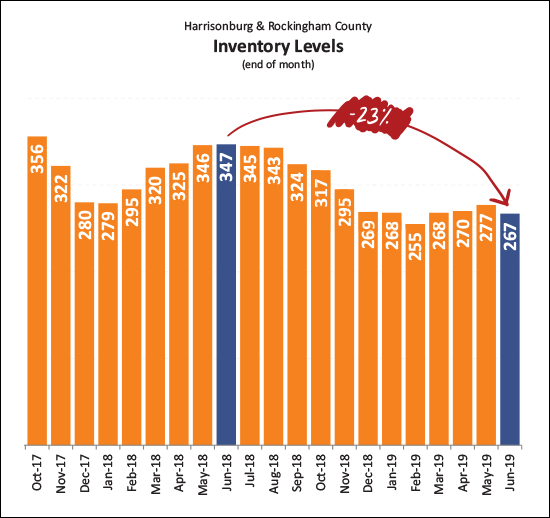 And what are those buyers buying? Well, it seems that they have fewer, and fewer, and fewer choices at any given point in time. As shown above, current inventory levels (267 homes for sale) are 23% lower than they were a year ago -- and just about as low as we saw inventory levels drop over this past Winter!?! Well priced, well prepared, well marketed new listings are going under contract quickly partially because of how few options buyers have these days. 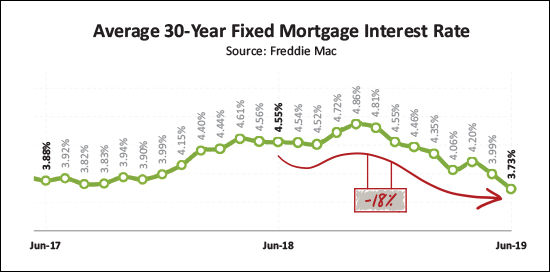 Those buyers who are fortunate enough to secure a contract on one of the few available listings are super fortunate to find astoundingly low mortgage interest rates! Over the past year, the average 30-year fixed mortgage interest rate has fallen 18%, down to its current level of 3.73%. I didn't think we'd see rates below 4% after they soared up to 4.5% a year or so ago - but today's buyers are certainly enjoying locking in some low housing payments given these low rates! Let's pause there, folks. Hopefully that gives you a good general sense of what is happening in our local housing market. And as always, if you have follow up questions about YOUR portion of the local housing market - based on price range, neighborhood, property type, etc. - just let me know! SELLERS -- even though it is a seller's market in just about every price ranges right now, you must still focus on price, condition and marketing. For further reading on buying or selling in this area, check out.... | |
All Square Footage Is Not Created Equally |
|
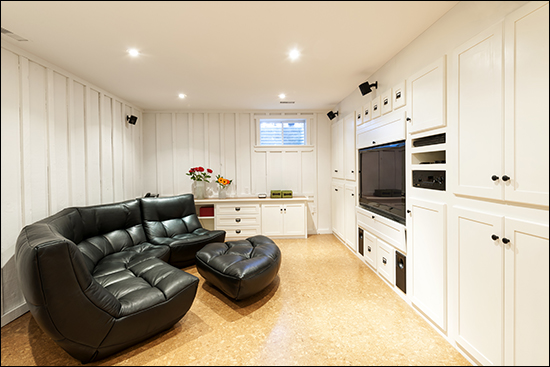 So -- if your neighbor's 2400 SF, circa 2000, 4 BR, 2 BA home just sold for $300K... Then it's probably reasonable to think that your 2400 SF, circa 2000, 4 BR, 2 BA home will also sell for $300K, right? After all, you have made the same updates (systems and cosmetic) over time -- and you're on the same street!
Well, maybe -- but maybe not! Consider the possibility that....
These two homes will not be seen as having an equivalent value -- not by potential purchasers and not by an appraiser. Above grade square footage has a higher value attached to it -- both specifically by appraisers, and generally by purchasers. Even if all of the other factors (condition, age, location, bedrooms, bathrooms) are the same between two houses, if one has a significant portion of the square footage in the basement then it will be seen as less valuable than the home that has all of its square footage above grade. | |
Summer Has Not Started, But For Real Estate, Summer Is Nearly Over |
|
 Technically, summer has not even started yet -- the first day of summer is June 21, 2019 - this Friday. I suppose then, that was why we had such pleasant temperatures over the past week or two -- it was really late Spring, not yet Summer. :-) But for real estate, summer is almost over, at least as a home seller. Home buyers that want to close on their home purchase before next school year are likely aiming to close on their purchase by around August 15, 2019. Most contracts take around 45 days (sometimes 30, sometimes 60, sometimes in between or longer or shorter) to get from a brand new contract to the settlement table. If you wanted to close on a home by August 15, and it was going to take 45 days to do so, you'd need to be under contract by July 1. So -- that leaves buyers with only about two weeks to get a house under contract if they want to close on their purchase and have a chance to move in prior to next school year. So, buyers, get ready to amp up your game and get that new house under contract! And sellers, if you want to sell your house this summer, you need to get it on the market soon, now, yesterday! | |
City Home Buyers Have Fewer and Fewer Choices (at any given time) |
|
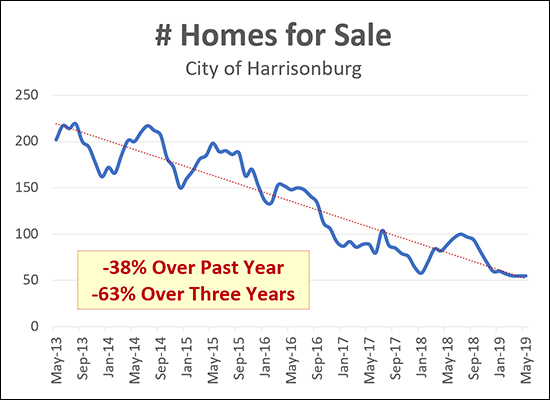 If you are a home buyers (or would-be home buyer) in the City of Harrisonburg, it can be a frustrating time to try to find that "right home" given the extremely low inventory levels. With only 53 homes currently on the market (and only 33 of those being detached homes) you might be waiting longer than you'd like to find a home that can work for you. This is a recent phenomenon, however, as the current inventory levels are 38% lower than a year ago and 63% lower than three years ago. Sadly, I don't think we're likely to see a significant increase in City housing inventory levels unless we (unexpectedly) see new homes starting to be built in the City. So, as a City home buyer -- be prepared to be patient, and then act quickly when the right house comes on the market! Read more about our local housing market in my monthly market report. | |
March thru May Contracts Strong, Again, in 2019 |
|
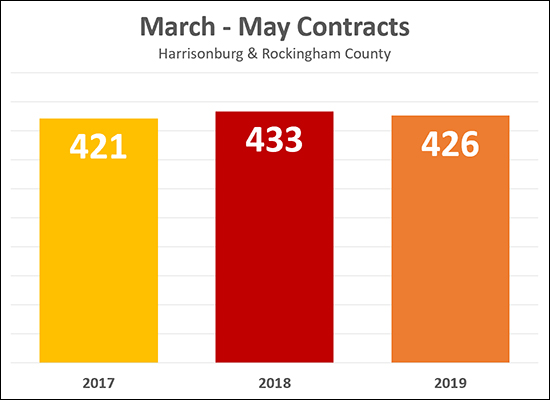 March, April and May are always VERY busy months of buyers (and sellers) signing contracts. This year was no exception. As you may recall from last year we had a record-breaking month of contracts in May -- with 171 contracts signed -- the highest number of contracts ever having been signed in any month, ever, in Harrisonburg and Rockingham County. And this May was certainly a bit slower -- with 143 contracts compared to last May's 171. But this April we saw an astonishing 158 contracts -- compared to last April's 128 contracts. So -- in the end, we came up just short of last year when looking at March through May contracts -- with 426 contracts signed compared to 433 last year. Despite low inventory levels, this year is shaping up to be just about as active of a year as last year for our local real estate market. | |
Settle In And Read These Reflections On the Dynamics of Our Local Housing Market |
|
 Settle in with a nice cup of coffee (or your beverage of choice) and enjoy some excellent recent articles about the state of our local housing market from The Citizen and Brent Finnegan. Harrisonburg's housing crunch leads to fewer homes on the market — and those that are don't stick around long The Citizen - May 3, 2019 The Citizen - May 6, 2019 The Citizen - May 13, 2019 Brent Finnegan - May 16, 2019
| |
Why Sell A Rental Property? |
|
 If you own a rental property, you might wonder from time to time whether you should keep or sell that property. I generally advise my clients to keep their rental properties, and not to sell them unless there is a good reason to do so. Here are some of those good reasons... VALUE - If the value of your rental property is currently high, and there is a reasonable chance that it won't be quite as high in the coming years, then now could be a good time to sell the rental property. INVENTORY - If there are very few competing properties for sale right now (which would lead to a speedy sale) but there will be many, many new properties built in the near future (which could result in a slow sale) then it might make sense to sell the rental property now vs. later. EQUITY - If you have owned the property for a decent period of time you may have a good bit of equity tied up in the property - and perhaps you'd like to do something else with that money. Maybe you'll use the sale proceeds for another investment (real estate or otherwise) or to pay off some debt, make a large purchase, go on a trip, who knows, but sometimes selling a rental property is a key part of freeing up some cash to make some other financial moves. HASSLE - Maybe you are tired of dealing with owning a rental property. Regardless of whether you manage the property yourself, or have a professional property manager, there can still be some annoying details to attend to with property maintenance, uncooperative tenants, etc. MAINTENANCE - Perhaps your rental property is 20 years old and you're pretty sure that if you keep it for another 3 - 5 years you'll have to pay for a new roof, new heating system and new water heater. If so, it might make sense to sell the property now to avoid those major capital expenses. TENANTS - If most of the prospective buyers for your rental property will be owner occupants, then the time between tenants might be the perfect time to sell your rental property. PARTNERS - If you purchased the rental property with a friend or family member, and they would like to move their investment dollars elsewhere, then it might be a good time to sell the property. RENTAL RATES - If rental rates are starting to decline, changing the performance of your investment, it might make sense to go ahead and sell, unless you see a turn around happening in the near future. IMPROVEMENTS - Perhaps your most recent tenant absolutely trashed the property, and you have just completely renovated it, such that the property has never looked better. This could be an ideal time to sell before the condition starts to deteriorate again. All of these potential reasons to sell are quite general - so feel free to touch base if you want to chat more specifically about your rental property and whether it would make sense to sell it now, or keep it for the next few years. | |
Second Highest Month of Contracts In Three Years |
|
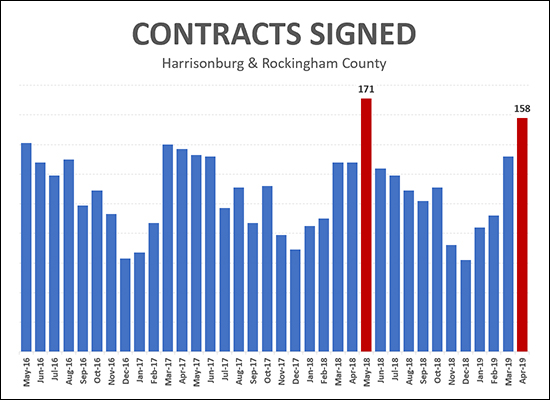 April 2019 was a busy month for buyers (and sellers) with 158 contracts being signed for the sale of homes in Harrisonburg and Rockingham County. This is the second highest monthly rate of contract signing seen anytime in the past three years! It was topped only by last May when 171 contracts were signed. This is bound to lead to strong months of closed sales in May and June. Find out more about our local real estate market by reading my most recent monthly market report. | |
Highest Month of April Home Sales in 10 Years |
|
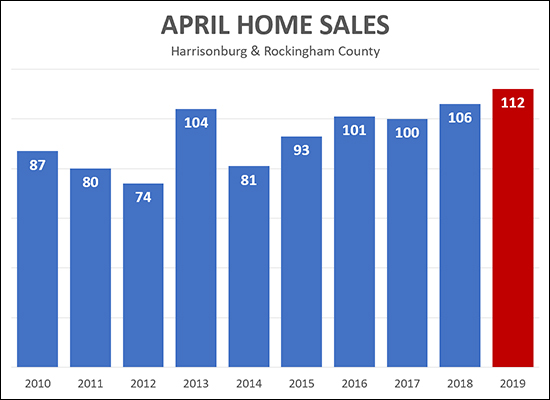 It's been a while -- more than 10 years -- since we've seen so many home sales in a month of April. As shown above, the 112 sales seen in April was higher than any month of April all the way back through 2010. There were a few years (2006-2008) where we saw more sales than that -- which was during the real estate boom when median sales prices were (unrealistically) increasing by more than 10% per year. Find out more about our local real estate market by reading my most recent monthly market report. | |
| Newer Posts | Older Posts |
Scott Rogers
Funkhouser Real
Estate Group
540-578-0102
scott@funkhousergroup.com
Licensed in the
Commonwealth of Virginia
Home Search
Housing Market Report
Harrisonburg Townhouses
Walk Through This Home
Investment Properties
Harrisonburg Foreclosures
Property Transfers
New Listings

