| Newer Posts | Older Posts |
When Are You Least Likely To Sell Your Home? |
|
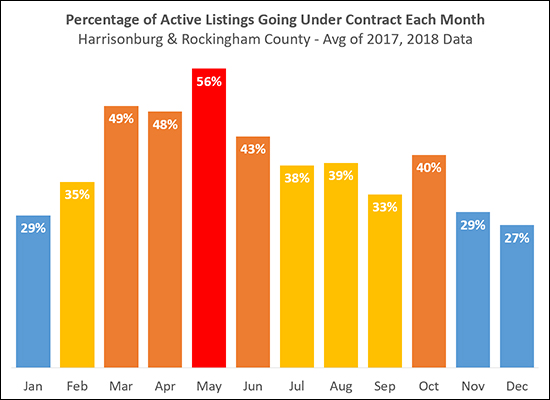 OK - these numbers are a bit abstract, but still interesting, in my opinion. The graph above is NOT showing a distribution of when buyers are buying homes. The likelihood of selling your home in a given month, per the graph above, is calculated by dividing the number of houses listed for sale at the start of each month by the number of houses that then go under contract that month. So -- if 300 houses are listed for sale at the start of the month, and 150 houses go under contract that month, you had a 50% chance of your house selling. This is somewhat inaccurate (we'll call it abstract, instead) because other houses do come on the market during that month. But still - by calculating the likelihood of selling in the same way each month we get a relatively reasonable comparative analysis of the likelihood of selling in any given month of the year. As should come as no surprise, you are most likely to sell your home in March, April, May or June -- or October! The months when you are least likely to sell your home are November, December and January -- and good news -- two of those months are already behind us! | |
My Predictions for the 2019 Real Estate Market |
|
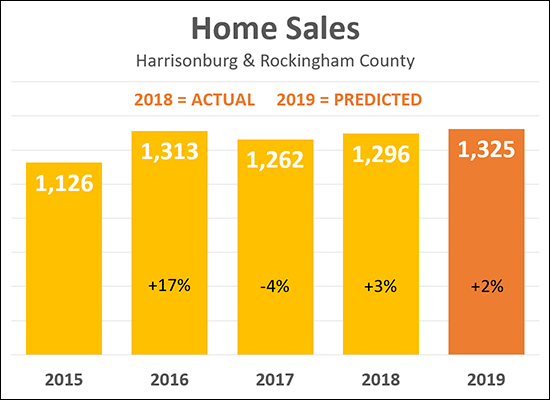 As is my annual tradition, I am making some predictions about what we'll see in the Harrisonburg and Rockingham County real estate market in 2019. As you'll note above, I am predicting that we will see 1,325 home sales this year - which is simultaneously a bold and conservative prediction. :-) If we see 1,325 home sales, it will be the HIGHEST number of home sales seen any time in the past year. But yet, those 1,325 home sales would only be a 2% increase over the pace of home sales in 2018 -- which would be the smallest annual increase in the pace of home sales seen over the past few years. I think we will still see relatively low inventory levels this year, but yet buyers will still find enough homes that match their criteria to allow for this increase in home sales. With a growing local population, a steady local economy and relatively low mortgage interest rates, it seems likely that we'll see a continuation of slow annual increases in the pace of home sales. And how about those prices? 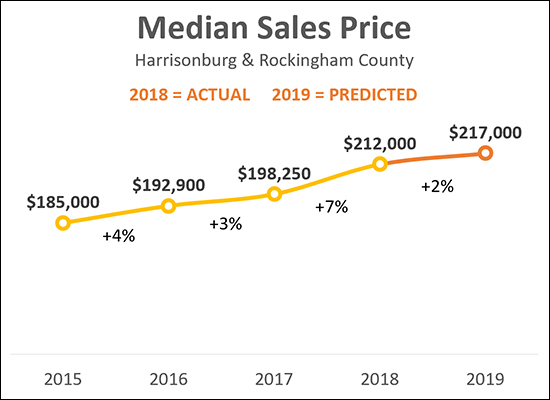 Above, you'll note that I am predicting that the median sales price in Harrisonburg and Rockingham County will increase 2% to $217,000 in 2019. Going with bold and conservative again -- this is a bold prediction, in that it be the highest median sales price ever seen in this area -- but at the same time is only a small increase in median price over last year, and a much smaller increase than seen between 2016 and 2017. Keep in mind (I know I've said it a lot lately) that the 7% increase in the median sales price in 2018 was not necessarily an actual 7% increase in home values -- but rather a shift towards more (higher priced) single family homes selling and fewer (lower priced) townhomes, duplexes and condos selling -- resulting in 7% increase in the median sales price of the combination of those two property categories. OK - enough about my predictions --what about for you? Email me (scott@HarrisonburgHousingToday.com) and let me know where you think our local market will go in 2019. And keep up with all the market data between now and next January by signing up to receive my monthly housing market report by email if you are not already receiving it. | |
Comparing My 2018 Housing Market Predictions To Reality |
|
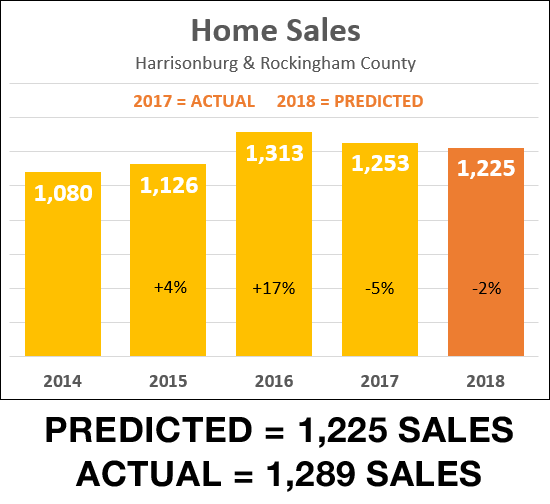 As shown above, I was a bit too conservative in predicting 2018 home sales. After we saw a 5% decline in the pace of home sales between 2016 and 2017 I was predicting we'd see another (smaller) decline of 2% between 2017 and 2018. As it turns out, we actually saw almost a 3% *increase* between 2017 and 2018. Even though we had low inventory levels all year long, buyers still found homes to buy -- which created a slight increase in the pace of sales, and a further decline in "days on market" in 2018. 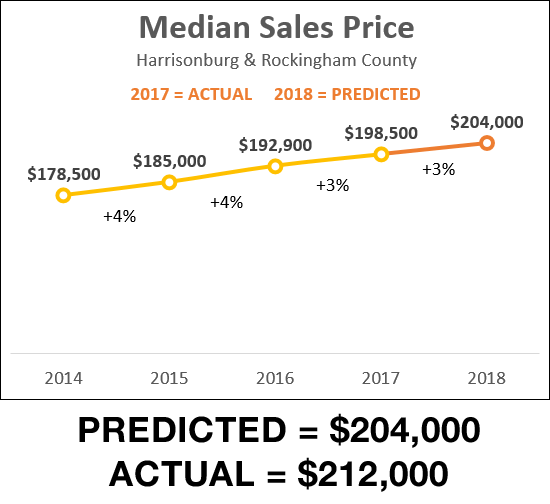 And -- I was a bit too conservative on the change in median sales price as well! After a 3% increase between 2016 and 2017 I was predicting another 3% increase between 2017 and 2018. But no, we actually saw almost a 7% increase between 2017 and 2018 up to $212,000. Please note, again, that this 7% increase in the median sales price might be (almost certainly is?) the result of a change in the mix of what (detached vs. attached) as opposed to all values actually increasing by 7%. Read more here. Stay tuned for some predictions for 2019 in the coming days! | |
Home Sales Rise By (at least) 2% in 2018 |
|
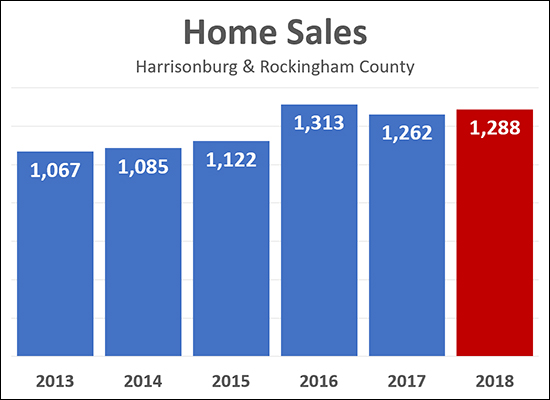 All home sales have not yet been reported but it is seems that we will see around a 2% increase in the pace of home sales in Harrisonburg and Rockingham County between 2017 and 2018. With 1,288 home sales recorded in the MLS thus far for last year, we may see that figure rise a bit more over the next few days, but not by much. This is a slight increase compared to last year -- though still a slight decline as compared to the high seen in 2016...
Stay tuned for my full market report in the next week or so, as well as predictions for the 2019 housing market. Oh, and HAPPY NEW YEAR! | |
Pending Home Sales Down 7.5% |
|
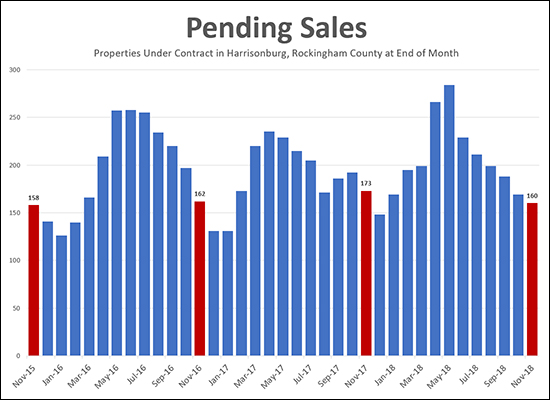 The graph above shows the number of properties "under contract" at the end of the month for each month over the past three years. As you can see, at the end of November there were 160 properties under contract in Harrisonburg and Rockingham County -- down 7.5% from the 173 properties that were under contract at the same time one year ago. Of note, this past Spring (end of April, May) we reached a high point for this metric that we had not seen over the past few years. | |
Very Few Homes For Sale in the City of Harrisonburg |
|
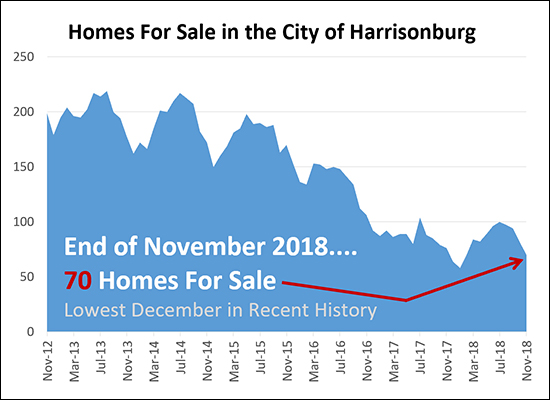 The number of homes for sale in the City of Harrisonburg keeps dropping. That's not to say that homes aren't selling -- a total of 423 homes have sold in the City of Harrisonburg during the first 11 months of the year -- putting us at a pace of 38 home sales per month. But the number of homes available to buyers continues to decline -- now down to 70 homes for sale. Here's a bit longer of a context....
If you're looking to buy a home in the City of Harrisonburg it might be difficult to find a home that is a perfect fit or you given a very limited supply of homes for sale. And when a home does come on the market that works for you, it is likely to sell quickly. | |
Despite Slower November, Home Sales Still Stronger Than Last Year |
|
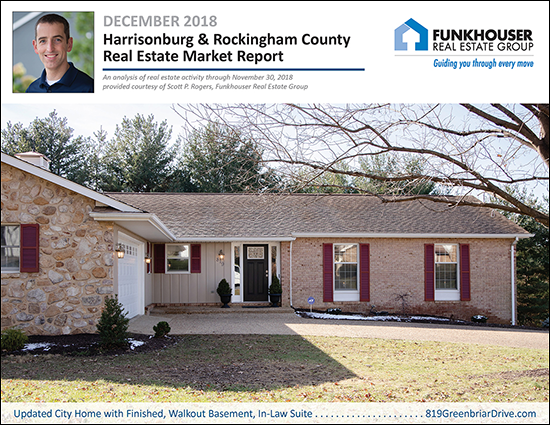 Before we dive into this month's market report, check out this featured home by visiting 819GreenbriarDrive.com. Now, on to our local real estate market -- I just published my most recent monthly market report, and as usual, you can read on for an overview, download the full report as a PDF or tune in to my monthly video overview of our local housing market... VIDEO OVERVIEW: Click here to watch (and listen) to my overview of the market. Now, let's take a look at some the trends we're currently seeing in our local housing market... 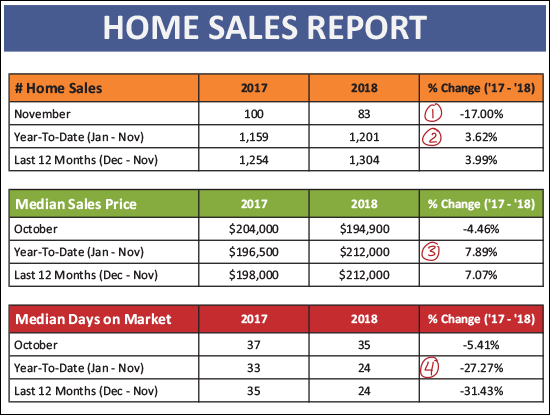 As we can see above...
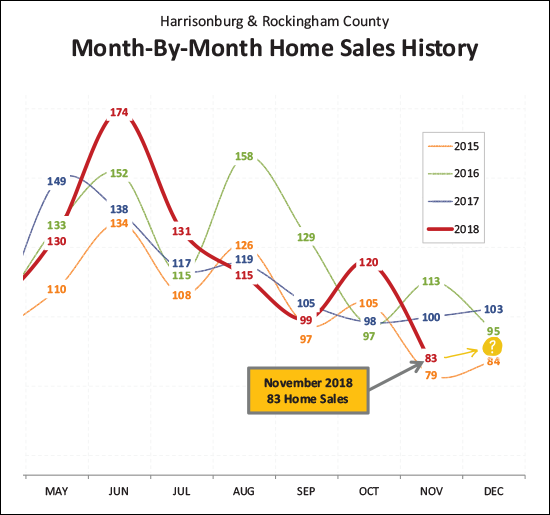 This has been a bit of an odd year, as shown above. We have seen quite a few months of new "highs" for monthly home sales. They aren't all shown above, but you can see that June, July and October were the highest such months in the past several years. But then you have months such as November -- where we fell to one of the lower such months of sales in recent years. So -- what about December? I'll guess we'll end up around 90 or so home sales -- maybe 95 -- or even 100? 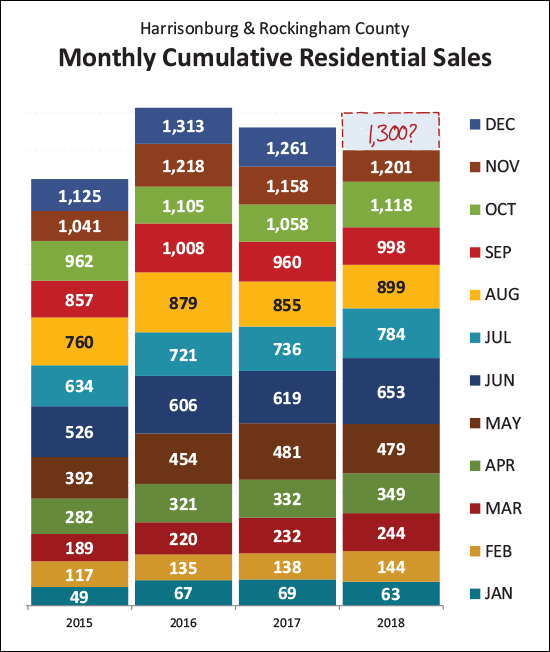 This graph shows each month of home sales stacked upon the previous months -- and you can see that we're beating every recent year except 2016 when you look at home sales through November -- shown in a light brown color. It seems almost certain that we'll beat the 1,261 total we saw last year -- but will we get up to 1300 home sales this year? We'd need 99 home sales in December! 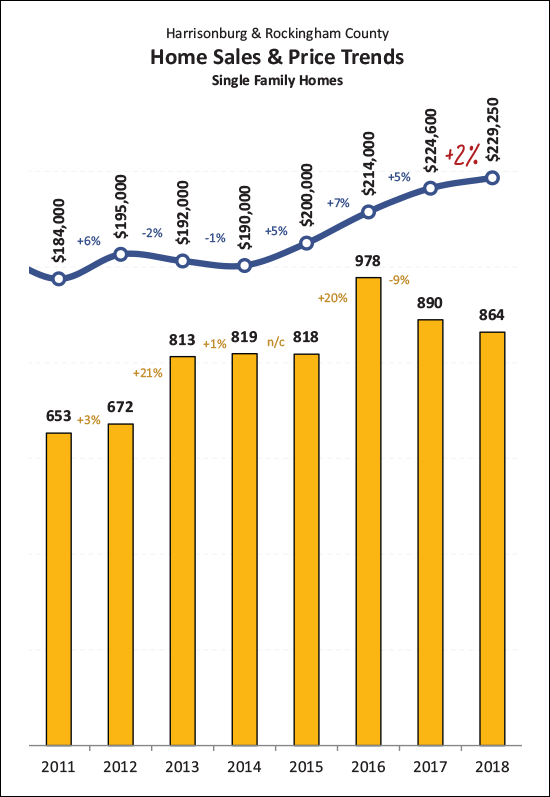 As I have mentioned in a few recent market reports -- the 7% (or so) increase that we're seeing in the median sales price for all residential sales might not mean that homes are selling for 7% more than they were last year. That 7% rise seems to be more a result of a greater number of (higher priced) single family homes selling in 2018 as compared to how many sold in 2017. Read more about this phenomenon here. That said, the graph above might give us a better idea of value trends -- where we see that the median sales price of single family homes has increased 2% over the past year. 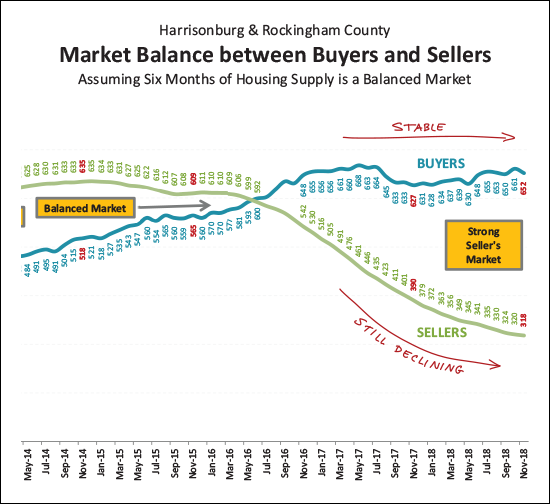 It's a good time to be a seller right not -- and not as exciting of a time to be a buyer. As shown above, the supply of buyers is steady -- with right around 650 buyers buying in a six month period. But at the same time, the number of sellers (and their homes) in the marketplace keeps on declining -- giving those buyers fewer and fewer options from which to choose. 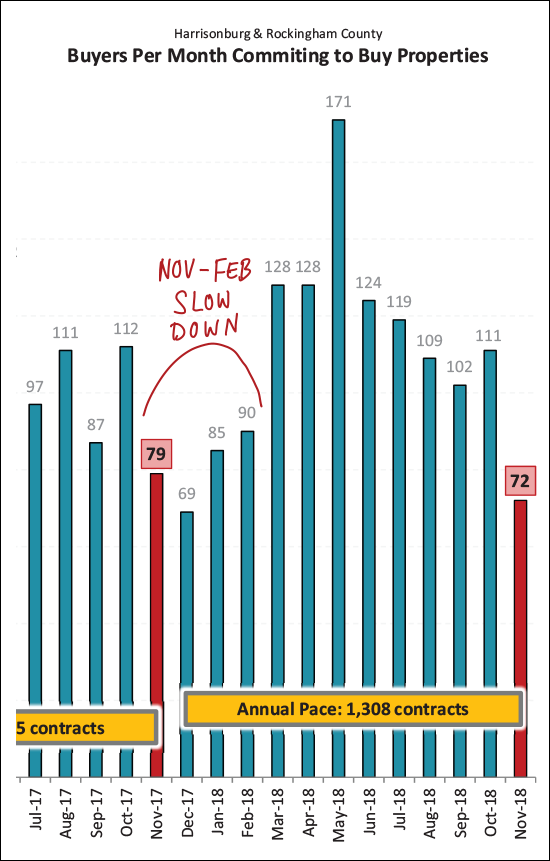 Hmmm -- 99 home sales in December might not be completely realistic after all. As shown above, only 72 buyers (and sellers) signed contracts in November 2018. This, combined with some lingering October contracts, means we're probably more likely to see 80 - 90 home sales in December. And -- for you current or near future sellers out there -- buyer activity is likely to stay a bit lower over the next few months. A strong surge of buyers is likely to return in March. 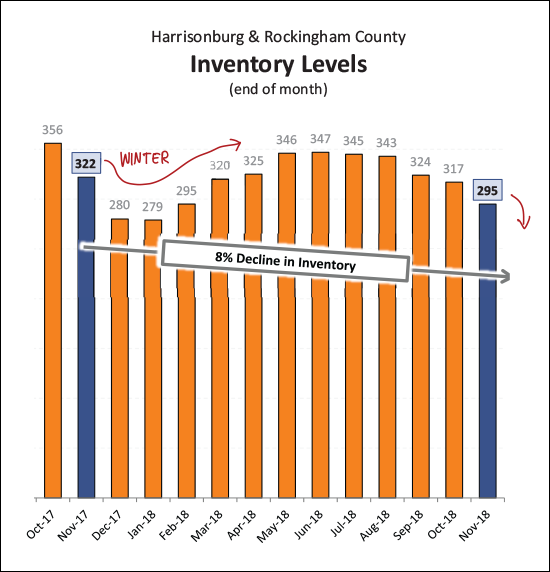 Well -- we dropped below 300 homes for sale again this month -- and we're likely to dip a bit lower as we move through December, January and February. Last year it took until March to rise above 300 homes for sale. So -- if buyers don't want to buy in the Winter, it seems that sellers also might not want to sell. 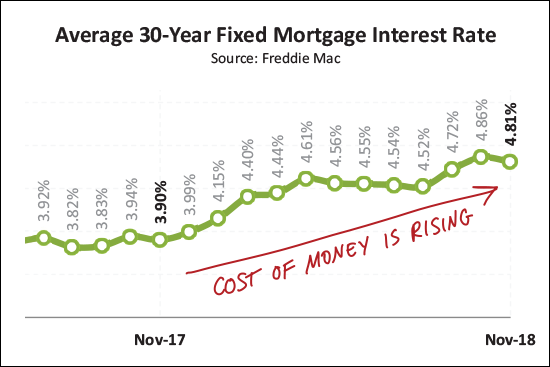 Unless you're paying cash -- it will cost you more (in your monthly housing payment) to buy a house now as compared to a year ago. The average mortgage interest rate on a 30 year mortgage has risen almost an entire percentage point (from 3.90% to 4.81%) over the past year. It ticked down slightly in November -- and hopefully we'll (somehow?!) stay below 5% as we roll into the new year. I'll pause there, for now. As usual, you can download the full report as a PDF, or tune in to my monthly video overview of our local housing market And a few tips for anyone thinking of buying or selling soon -- SELLERS -- even though it is a seller's market in many price ranges right now, you must still focus on price, condition and marketing. For further reading on buying or selling in this area, check out.... | |
The Value of Your Home Based On When You Bought It |
|
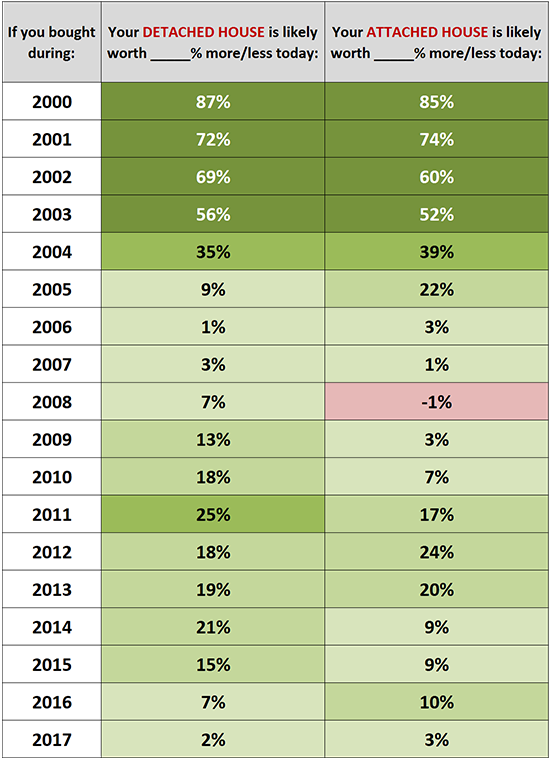 Can historical median sales prices give you some sense of your home's current market value? Perhaps so! The values in the chart above are calculated by comparing the 2018 median sales price to the median sales price in each of the past 17 years. Do remember, of course, that while this might provide a general guide to market changes over the past 18 years, every home and neighborhood is unique. Let's chat about your specific house if you want to know what it is worth in today's market. | |
Contract Activity Slows Heading Towards Thanksgiving |
|
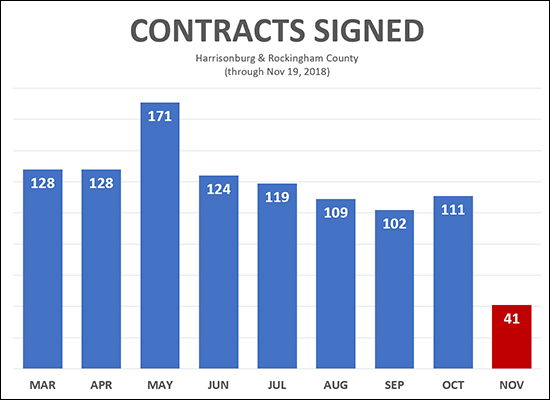 And -- as we might have expected -- home sales activity is slowing as we roll into late November. The graph above shows the number of contracts signed per month for each of the past eight months -- and those signed in the first 19 days of November. Now, it's possible that we'll have a huge surge of contracts on Black Friday (oh wait, homes aren't going to be on sale that day) but if not, we're likely to see pretty big drop in contract activity this month. Again, nothing new or surprising - just the seasonal shift that we always see in November. We should expect to see low levels of contract activity for the next few months before buyer activity jumps up again in March. If you're a seller who just listed their home for sale, or if your house is lingering on the market, we should talk about strategies related to pricing and timing to meet your goals for selling your house. | |
Will housing inventory levels improve next year? |
|
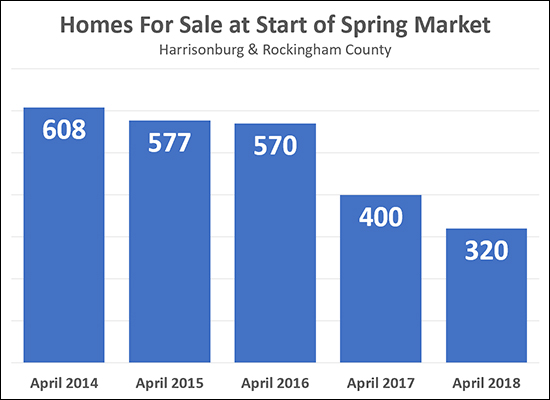 If you have been looking for a new home to buy all Spring and Summer and Fall of this year -- and didn't find one, which you blame on having very few homes from which to choose -- are you likely to have better luck next year? I'm guessing not. The graph above shows that inventory levels have dropped significantly over the past two years based on how many homes are on the market at the start of the main buying season, which I'm defining as April in the graph above. So -- after seeing a 20% decline in inventory levels between April 2017 and April 2018 -- are we likely to see inventory levels start increasing again in 2019? Again, I don't think so, and here's why.... To reverse this trends of declining inventory we would need one or more of the following to happen in our local market....
Again -- none of the changes above seem likely to happen at a scale that would allow inventory levels to see much, if any, of an increase next year. As such, I am expecting we'll see relatively similar inventory levels next Spring and Summer. | |
Foreclosures Slow Considerably in 2018 |
|
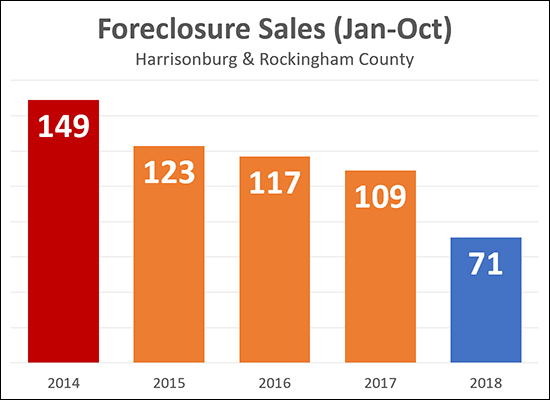 Fewer and fewer homeowners are finding themselves in a situation where they are being foreclosed on in Harrisonburg and Rockingham County. The data above reflects the number of completed foreclosure sales in the first ten months of the year for each of the past four years as well as the current year. The number of foreclosures (in the first 10 months of the year) has fallen 35% over the past year -- and an astonishing 52% from where we were four years ago. This is likely a result of rising home values, leaving fewer homeowners in a situation where they cannot sell their home if they are no longer able to make their mortgage payments. | |
Home Sales Rise Yet Again In October 2018 |
|
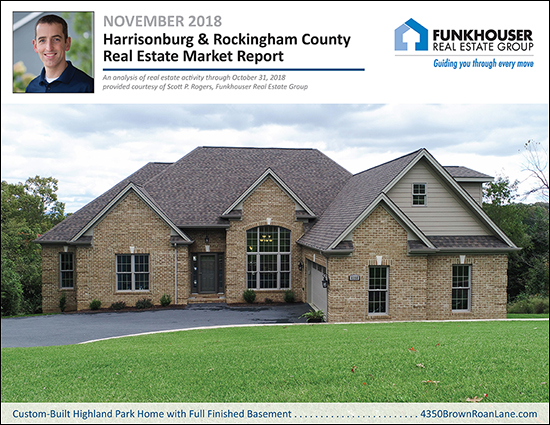 Before we dive into this month's market report, check out this featured home in Highland Park by visiting 4350BrownRoanLane.com. Now, on to our local real estate market -- I just published my most recent monthly market report, and as usual, you can read on for an overview, download the full report as a PDF or tune in to my monthly video overview of our local housing market... VIDEO OVERVIEW: Click here to watch (and listen) to my overview of the market. Now, let's take a look at some the trends we're currently seeing in our local housing market... 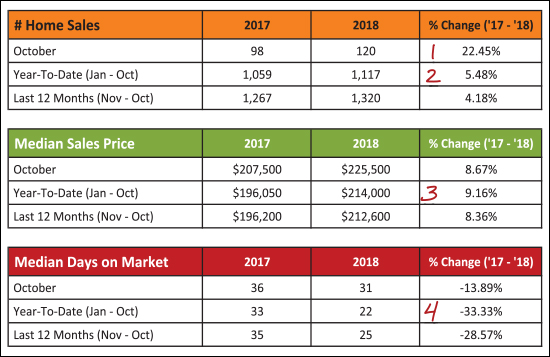 As shown above --
Now let's look at the monthly home sales visually... 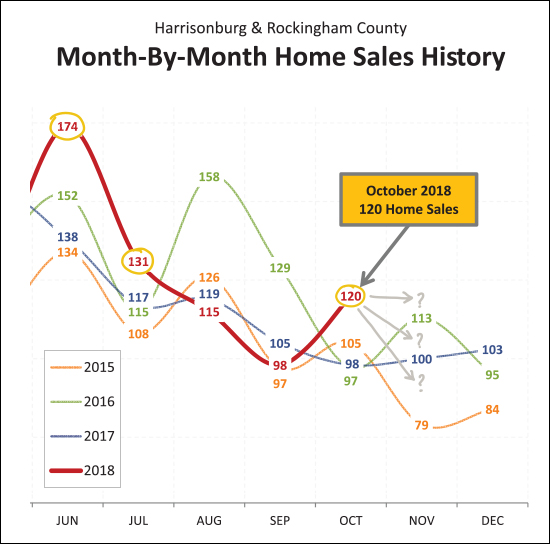 This past June and July were stellar months of home sales -- with the highest sales level seen in the past three years. Then, sales fell in August and September, and it was seeming that rising interest rates might have finally started to affect buyer behavior. But then, October. We saw a sharp increase in home sales in October -- the strongest month of October home sales in the past several years. So -- where do we go from here? Will we have the best November of late? Or will we slip back into the middle of the pack? Regardless of how November goes, it seems 2018 will be a strong year... 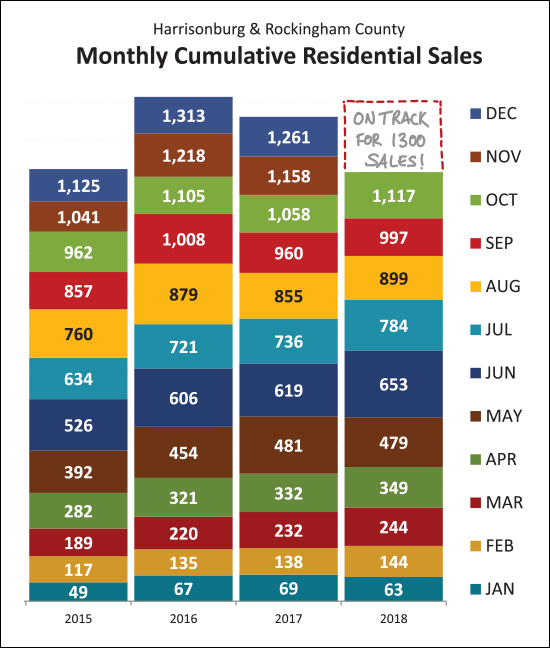 We've seen 1,117 home sales in the first ten months of 2018 -- this is the strongest first ten months of the year seen anytime in the past six years, not all of which are shown above. It seems, thus, that we're likely to get back up to a 1300/year pace of homes selling in Harrisonburg and Rockingham County. Can it happen? What is your prediction? 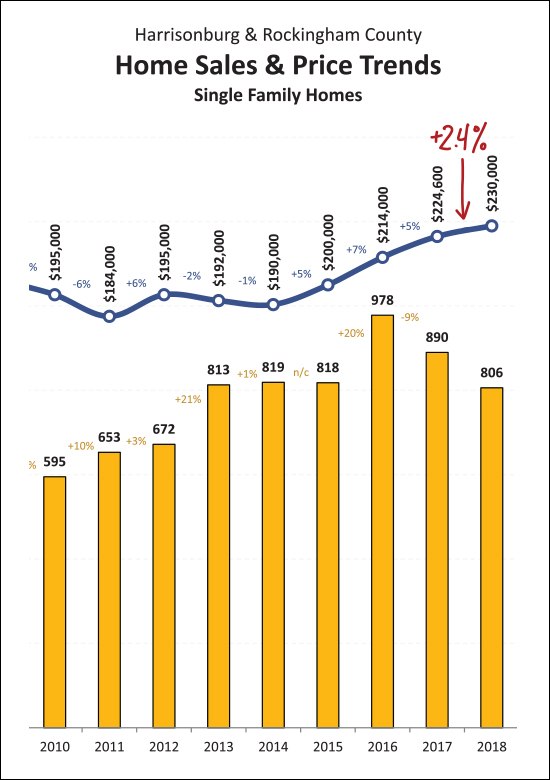 As mentioned earlier, even though the market-wide median sales price has increased 9% in 2018 -- that is not an indication that home values are up 9%. There are more single family homes selling this year than last, which is affecting the overall median sales price. The graph above, then, is a reasonable substitute for understanding value trends in our local market. When we look only at single family homes (not duplexes, townhouses or condos) we see that the median sales price has increased 2.4% over the past year. This seems much more sustainable than a 9% increase. 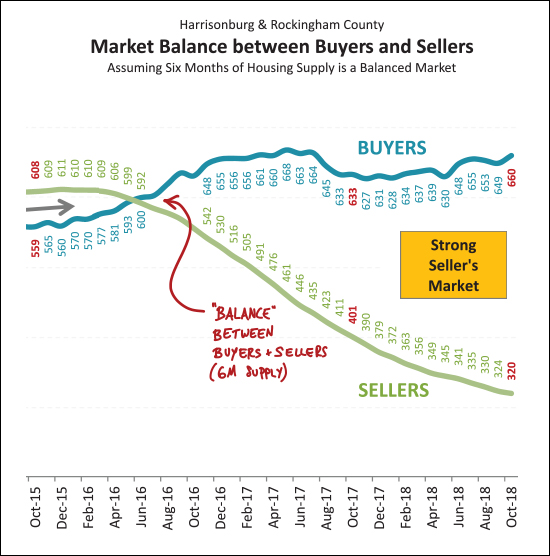 In some ways, it is surprising that home values aren't increasing more than they are. We have been in an increasingly strong seller's market for the past two years -- with more and more buyers fighting over fewer and fewer seller's homes on the market at any given point. Certainly, "enough" sellers are selling -- as the total number of closed sales is increasing -- but strong buyer activity is keeping overall listing inventory down at most times of the year. 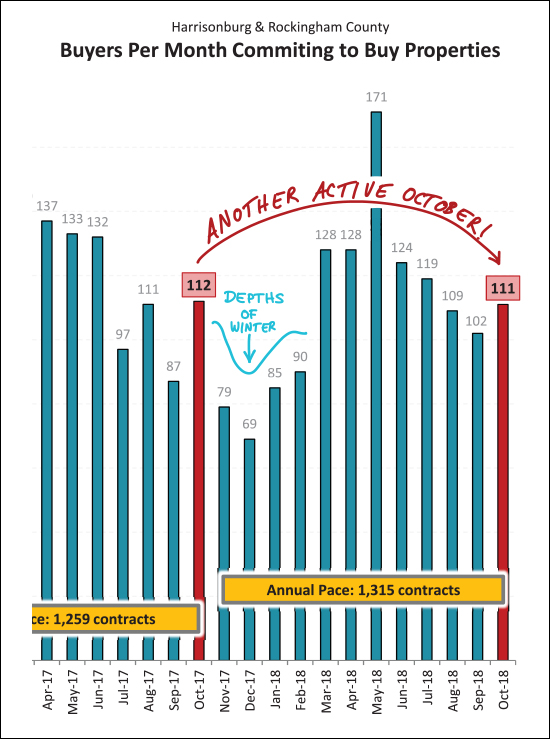 Why do I think we'll finish out the year with 1300 or so home sales? Partly because of the strong month of contract activity seen in October. A total of 111 contracts were signed in October, most of which should turn into closed sales by the end of the year. As a side note, winter is coming. Contract activity is likely to slow over the next four months. 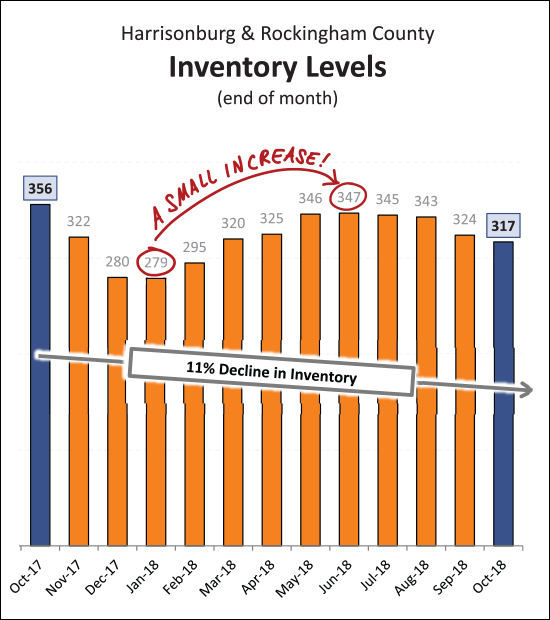 And there are those inventory levels -- low and getting lower. We've seen an 11% decline in the number of homes on the market over the past year -- and inventory levels didn't rise all that much during the Spring / Summer markets this year. So, basically, as fast as sellers are listing their homes, buyers are snapping them right up -- in most price ranges, in most locations, etc., etc. 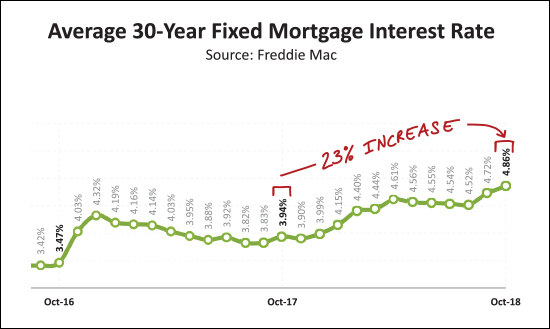 And finally -- mortgage interest rates. Most folks don't pay with cash -- they finance part of their home's purchase price -- and it is getting more expensive to do so these days. We have seen a 23% increase (from 3.94% to 4.86%) in the average 30 year fixed mortgage interest rate over the past year. This means that today's buyers are paying more per month than they would have last year, for the same home, even before we start calculating how that sales price would have increased over the past year. I'll pause there, for now. As usual, you can download the full report as a PDF, or tune in to my monthly video overview of our local housing market And a few tips for anyone thinking of buying or selling soon -- SELLERS -- even though it is a seller's market in many price ranges right now, you must still focus on price, condition and marketing. For further reading on buying or selling in this area, check out.... | |
Early Preview of October Home Sales Activity |
|
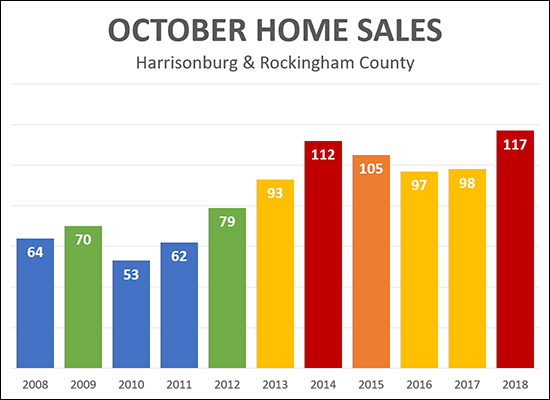 I'll put my full market report together later this week, but an early look at October home sales data shows that buyers turned out in force during October 2018 -- in fact -- it appears that there were more buyers in October 2018 than in any other October in the past 10 years! This shouldn't be entirely surprising, since September contracts (102) were a good bit stronger than last September (87). Stay tuned for more data as later this week. | |
City Housing Inventory Levels Stabilizing, At Extraordinarily Low Levels |
|
 Perhaps inventory levels (number of houses for sale) can only go so low in the City of Harrisonburg. As shown above, inventory levels are "stabilizing" around 100 homes for sale. This is still a significant decline from where we have been over the past six years, but at least the trajectory is not still declining. What would it take for this inventory level to start rising again?
There is no easy way to turn this trend around -- and to have more options for City home buyers -- and until this does change, it can be quite challenging for buyers to find a home they want to purchase in the City. So, if you are looking to buy a home in the City, be ready to patiently wait for the right opportunity to come along, and then be ready to act quickly! Stalk homes for sale @ NewListingsInHarrisonburg.com. | |
Higher End Harrisonburg Area Homes Selling Well in 2018 |
|
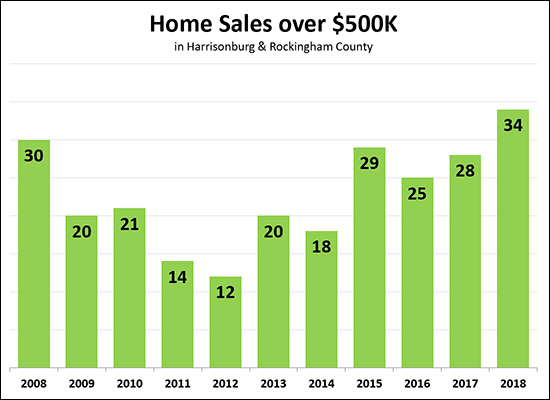 We're only 10.75 months through the year and it has already been a record setting year for higher end home sales in Harrisonburg and Rockingham County. As shown above, there have been 34 home sales over $500K thus far this year -- which is more than were seen in any full year in the previous 10 years. Of note -- there were 39 home sales over $500K in 2006 (not shown) -- and only time will tell if we can beat that this year. 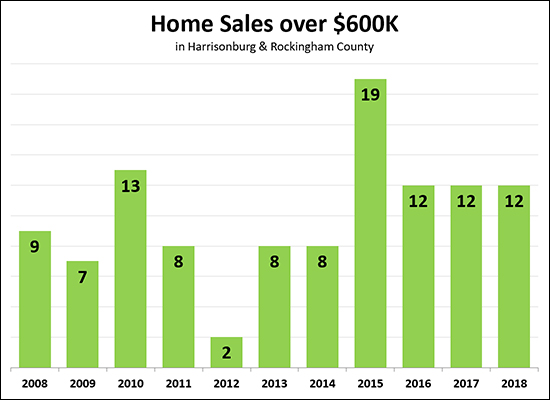 Above, I have narrowed the market a bit, looking only at home sales over $600K. We have seen 12 such sales thus far in 2018, which already matches the full year of sales seen in 2016 and 2017. It seems relatively unlikely that we'll get up to 19 sales as were seen in 2015. As a side note -- only one buyer per month is paying over $600K for a home in Harrisonburg and Rockingham County, at least as recorded in the MLS. 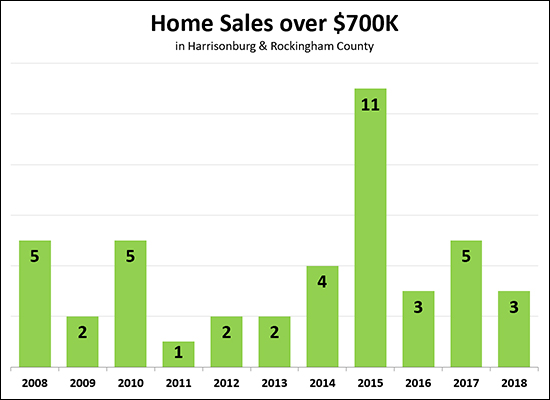 And -- one last look. The over $700K market looks likely to finish out within what would seem to be a normal range of 2 to 5 sales per year. Looking back, clearly, 2015 was an absolutely crazy year for these high end home sales. | |
The Median Sales Price of Single Family Homes Has Risen 2 Percent in 2018 |
|
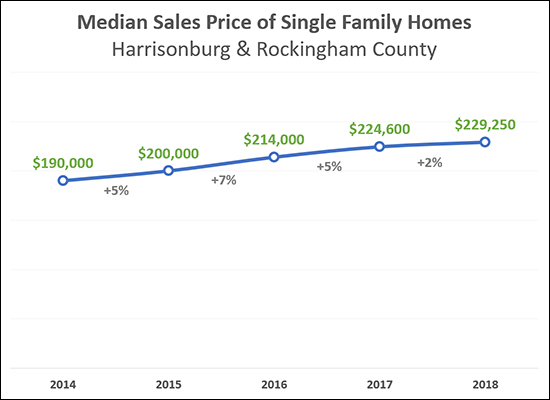 The housing market is hot, right? Home values are rising quickly, right? Well, sort of, but maybe it's not exactly like that. As shown above -- over the past three years (between 2014 and 2017) the median sales price of single family homes has increased by 5%, 7% and then 5%. But during 2018 the median sales price has only increased 2% as compared to 2017. The increases in single family home sales prices seems to be slowing in 2018. If you thought home values had risen much more than 2% over the past year, it may partly be a result of the overall residential sales price having increased 8.42% over the past year (read more here) but that is mostly a result of a change in WHAT is selling (more single family homes) as opposed to a change in the prices for which those properties are selling. So -- if you could have sold your home for $300K last year, perhaps you can sell it for $306K this year (+2%) and you probably can't sell it for $324K this year (+8%). | |
Are Local Home Sales Prices Actually 8 Percent Higher This Year Than Last? |
|
 I'm going to say yes, but no, and mostly no. Keep reading -- this is important, as it can give us an indication of whether our local housing market is heating up too quickly. OK -- at first glance, it would seem that home prices have increased 8.42% over the past year...  But let's look closer -- breaking home sales down into two categories...
Here's where things get confusing -- if the median sales prices of all properties has increased 8.42%, why are we only seeing a 3% (+/-) increase in each of the two categories?   So, wait, what? Single family home sales prices are up 3.03% this year -- and duplex/townhouse/condo sales prices are up 3.77% this year -- but when you throw all of the data together it somehow appears as if prices have risen 8.42% over the past year??!!?? How can this be?? It turns out it's all about how many of each type of property are selling...  As shown above -- last year only 70% of home sales were single family homes, with 30% being duplex/townhouse/condo sales. This year, that ratio has shifted, and 75% of home sales have been single family homes, with only 25% being duplex/townhouse/condo sales And therein lies the answer. When single family homes sell for around $230K and duplexes/townhouses/condos sell for around $165K -- if there is a shift in how many of each property type sells (relative to the other) then the median sales price for the combined ALL residential sales will adjust more than sales prices of each property type are actually adjusting. So -- Sellers: You are likely to be able to sell your home for 3% more than you would have last year -- NOT 8% more. Buyers: You are not being expected to pay 8% more for homes this year than last. Everybody: Let's not be disappointed that we're not seeing an 8% increase in home prices -- let's be happy with 3%. An annual increase of 3% is (historically) normal, and seems to be quite sustainable. An annual increase of 8% (especially if back to back with another similar year) would likely mean that home sales prices are adjusting upwards too quickly and they may have to come back down at some point. So -- good news, bad news, but in my book, mostly good news! Home prices have risen 3% over the past year -- not 8%. | |
Home Sales Slow Slightly in September But Prices Still On The Rise |
|
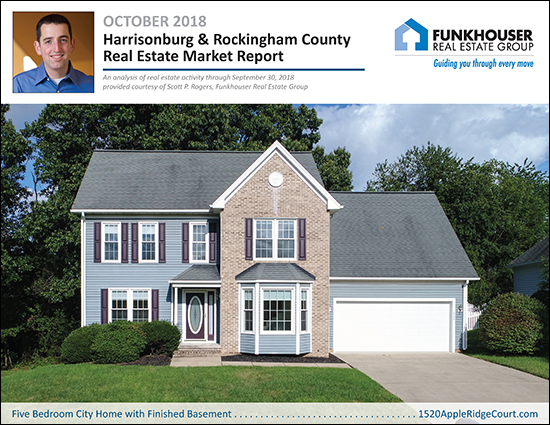 Before we dive into this month's market report, check out this featured home in Stone Spring Village by visiting 1520AppleRidgeCourt.com. Now, on to our local real estate market -- I just published my most recent monthly market report, and as usual, you can read on for an overview, download the full report as a PDF or tune in to my monthly video overview of our local housing market... VIDEO OVERVIEW: Click here to watch (and listen) to my overview of the market. Now, let's take a look at some the trends we're currently seeing in our local housing market... 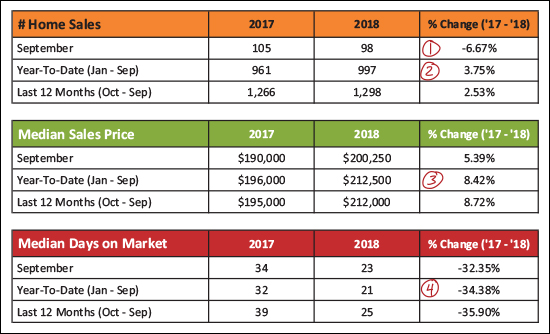 As shown above...
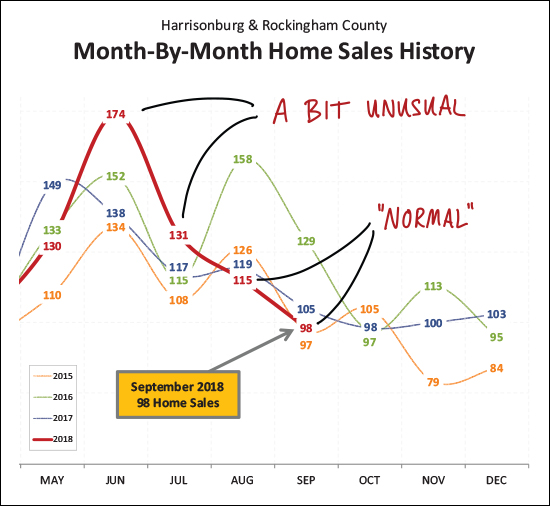 Looking backwards a bit -- the crazy months of sales we saw in June and July of this year were a bit unusual -- way out of the norm. The slower months of sales seen in August and September were much more "normal" -- even if a bit slower than usual. 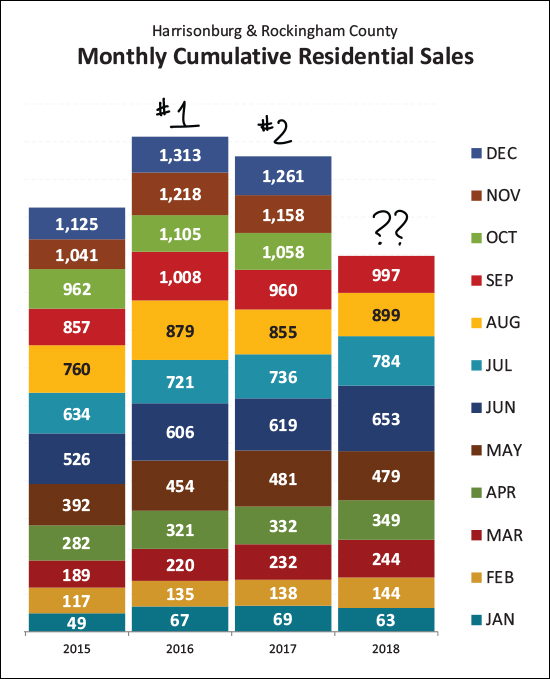 Two years ago was a rock star of a year of real estate sales. After only 1,125 home sales in 2015 -- the local market saw a huge increase to 1,313 home sales in 2016. And then -- 2017 -- darn, we slipped a bit. It's hard to say at this point where 2018 will fit into the mix. I am guessing we'll beat last year's 1,261 home sales -- but probably won't make it all the way up to 2016 levels. 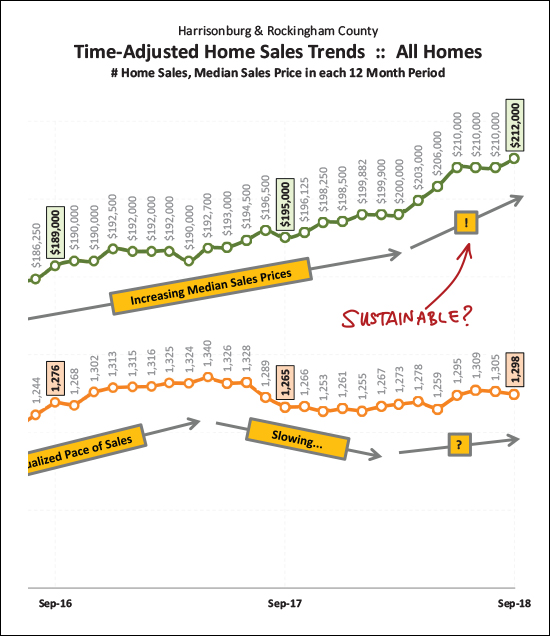 So -- as shown above with a green line -- sales prices have sort of been escalating a bit lately. Less than a year ago we had just cleared a $200K median sales price -- and now we're way up to $212K. Hmmm -- doesn't seem sustainable. What gives? Read on. 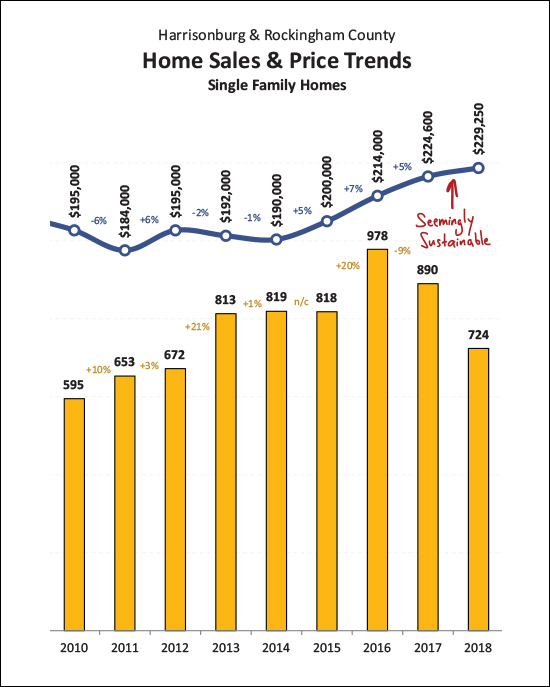 If we dial it back a bit and just look at single family homes (not duplexes, condos, townhouses -- all of which are prime real estate investor targets) we see a much (!!) more modest increase in the median sales price. An increase from $225K to $229K over a one year period seems to be a much more reasonable increase in the local median sales price -- and one that seems like it could be sustainable. This calms my nerves a bit after having seen that sharp rise in the overall median sales price. 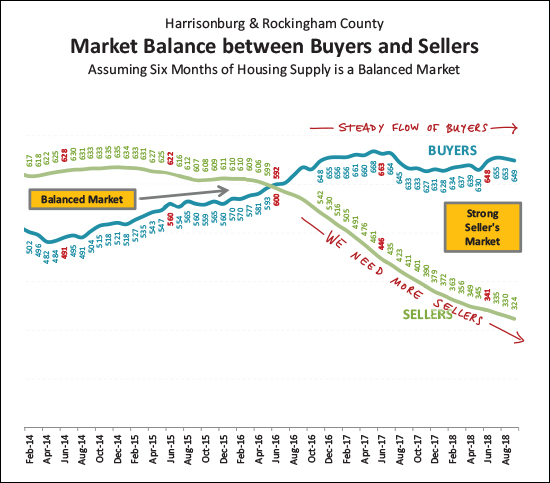 So -- how's the market, you might ask? Pretty balanced? Not at all! There are a steady flow of buyers in the local market -- and an ever smaller group of sellers. We desperately need some new sellers in the market -- preferably who aren't also buying -- which often will mean we need to see some new construction. 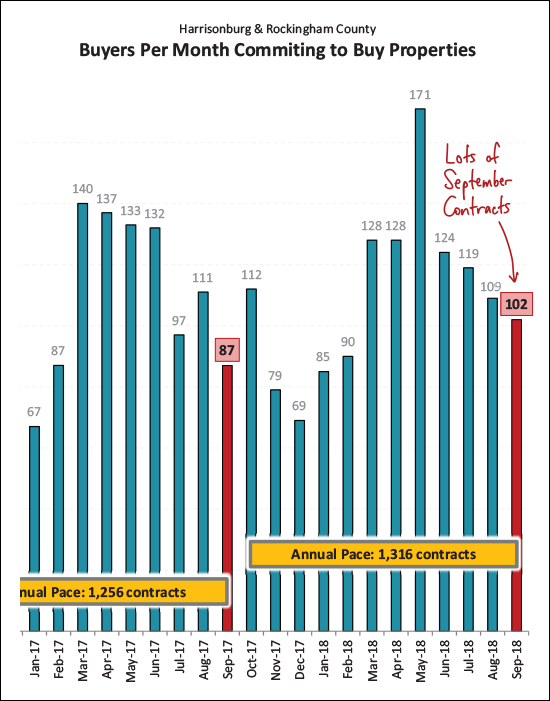 Looking ahead, we might see a bit of a pop in October home sales after all! September contracts were strong -- and markedly higher than last September. In fact, contracts over the past year (1316) were a good bit higher than the previous 12 months (1256). October sales figures might look better than expected! 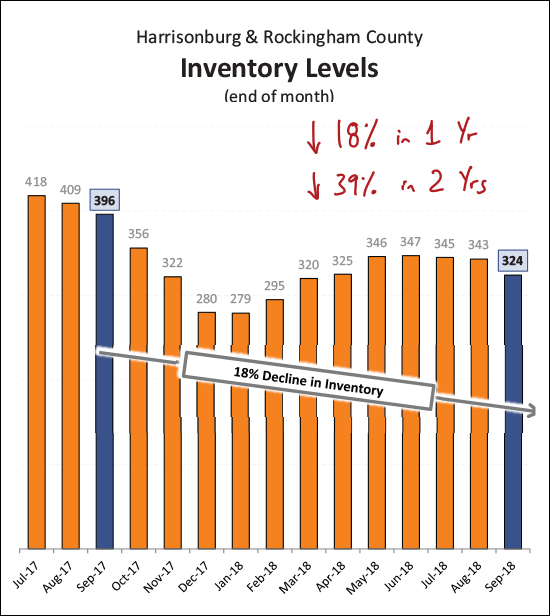 And here is that inventory issue - visualized slightly differently. Today's buyers have 18% fewer choices as compared to a year ago -- and 39% fewer choices as compared to two years ago! What is a buyer to do these days? I'll pause there, for now. As usual, you can download the full report as a PDF, or tune in to my monthly video overview of our local housing market And a few tips for anyone thinking of buying or selling soon -- SELLERS -- even though it is a seller's market in many price ranges right now, you must still focus on price, condition and marketing. For further reading on buying or selling in this area, check out.... | |
Early Indications Show Many Home Buyers Contracted in September |
|
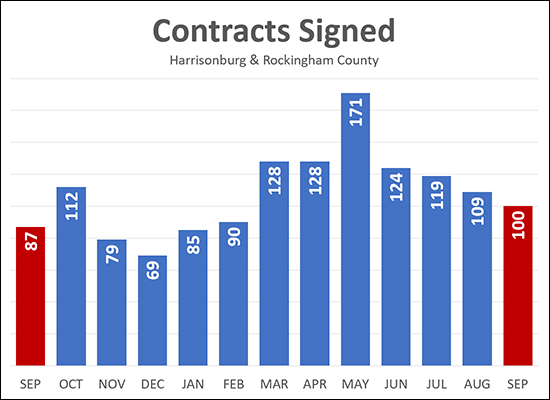 Home buying activity slowed for the fourth straight month in September 2018 -- but -- it was 15% higher than it was last September! As shown above, 100 buyers signed contracts to buy homes in September 2018, a slight decline from 109 the previous month, but an increase over last September. If last year is any indication, we may see an uptick in buying activity in October before things then cool down between November and February. | |
Local Housing Market Cools, Slightly, in August 2018 |
|
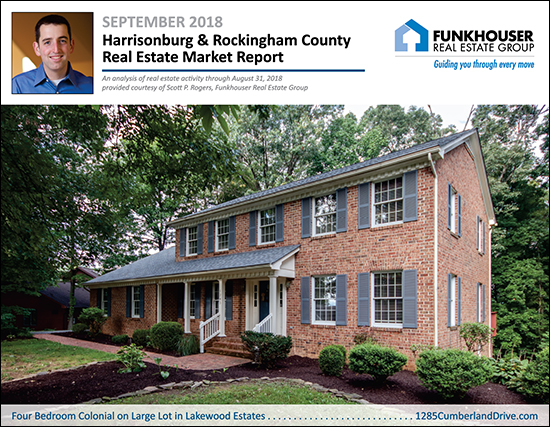 First, learn more about this new listing in Lakewood Estates by visiting 1285CumberlandDrive.com. Now, on to our local real estate market -- I just published my most recent monthly market report, and as usual, you can read on for an overview, download the full report as a PDF or tune in to my monthly video overview of our local housing market... Now, let's take a look at some the trends we're currently seeing in our local housing market... 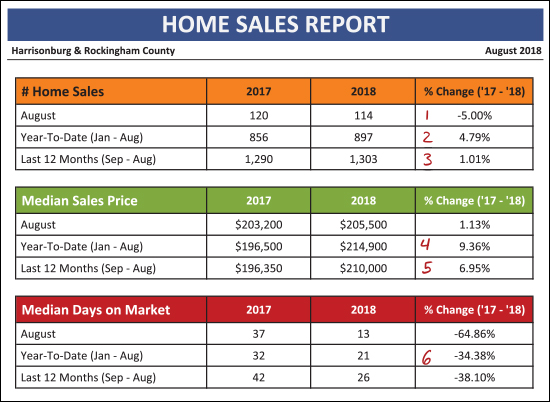 As shown above...
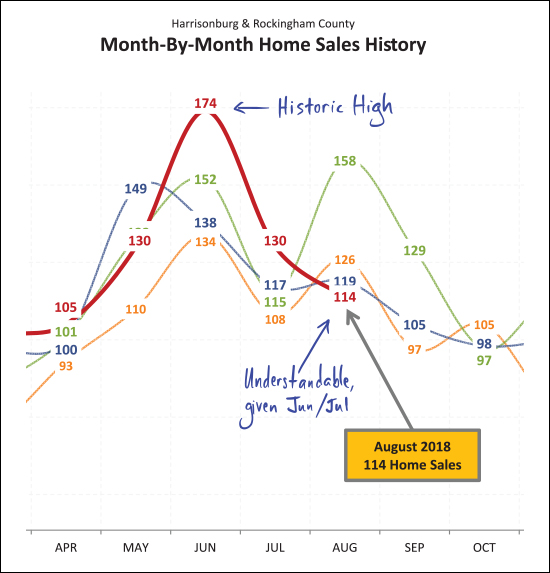 After an extraordinarily robust month of sales in June (174 -- third highest month ever) home sales slowed a bit in July, but remained (at 130) higher than in any recent July. It should be no surprise then that home sales cooled (even if temperatures did not) in August. Perhaps many summer buyers bought earlier in the summer this year than last. In the chart above, orange = 2015, green = 2016, blue = 2017 and red = 2018. So... Jun + Jul + Aug in 2016 = 425 summer buyers Jun + Jul + Aug in 2017 = 374 summer buyers Jun + Jul + Aug in 2018 = 418 summer buyers 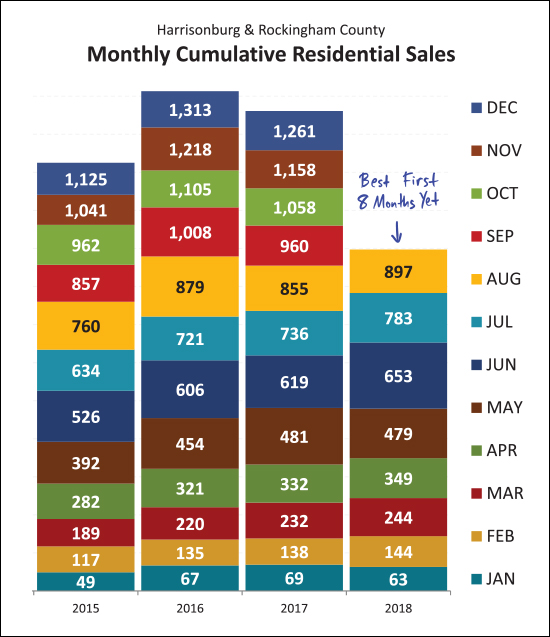 We have seen 897 home sales in the first eight months of the year -- this is more home sales than we've seen in any recent first eight months of the year. At this point, we seem poised to see another 1300+ year of home sales -- which we have only seen one other time in the past decade. 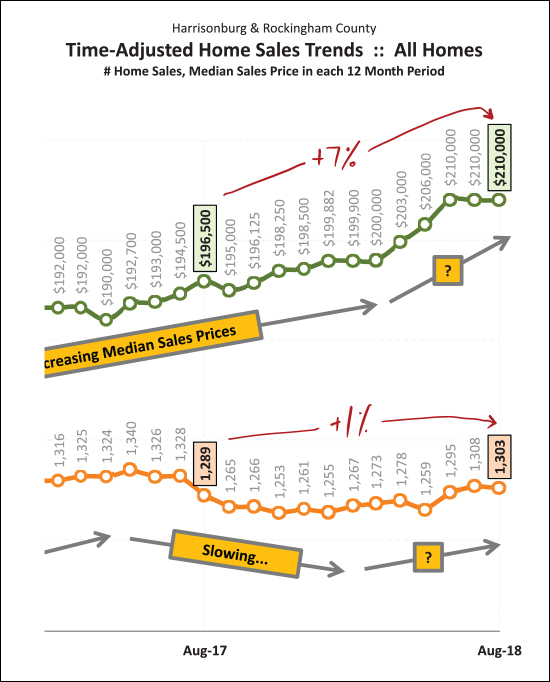 Looking at a rolling 12 month data window -- we see that there has been a net 1% increase in the pace of home sales per year (up to 1303/year) and a 7% increase in the median sales price (up to $210K) over the past year. The median sales price escalated quickly from $200K to $210K this Spring but now has stayed put at $210K for the past few months. 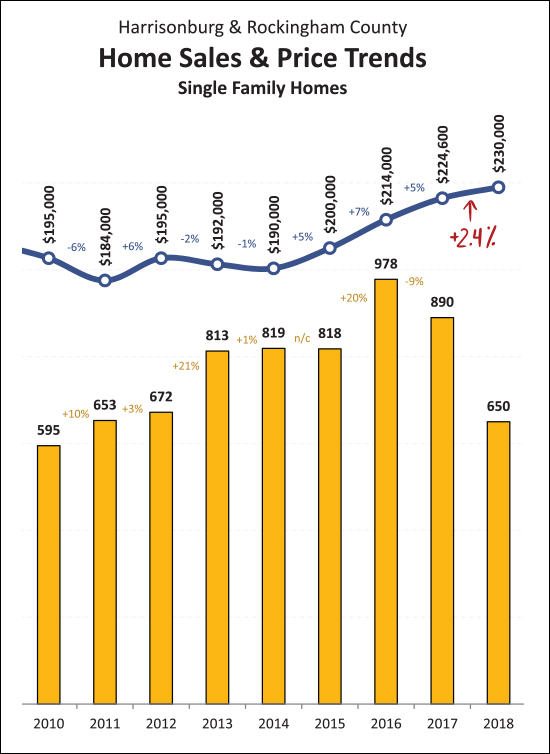 I have never been happier to see such a modest increase in prices as I am to see the 2.4% increase in the median sales price of single family home as shown above. The 7% increase in median sales prices shown on the prior graph reflects not just increases in home values but perhaps a shift in which homes are selling. By looking at only single family homes (excluding duplexes, townhouses and condos) we can (sometimes) get a better sense of actual changes in home values. Here we see that single family home sales prices have increased only 2.4% over the past year. 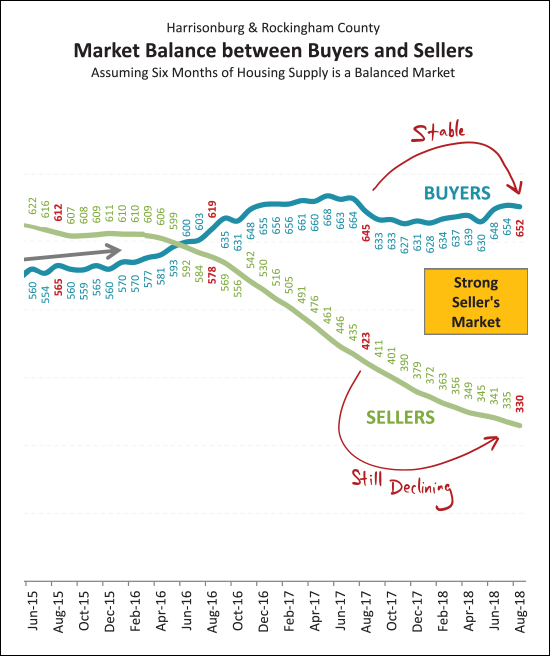 The balance (or imbalance) between buyers and sellers doesn't show any signs of shifting any time soon. After multiple years of increasing buyer activity we are now seeing a relatively stable number of buyers in the market -- around 650 every six months. But at the same time, inventory levels continue to decline -- making it an even stronger seller's market -- with the usual disclaimers of "in most areas, in most price ranges, for most property types, etc." 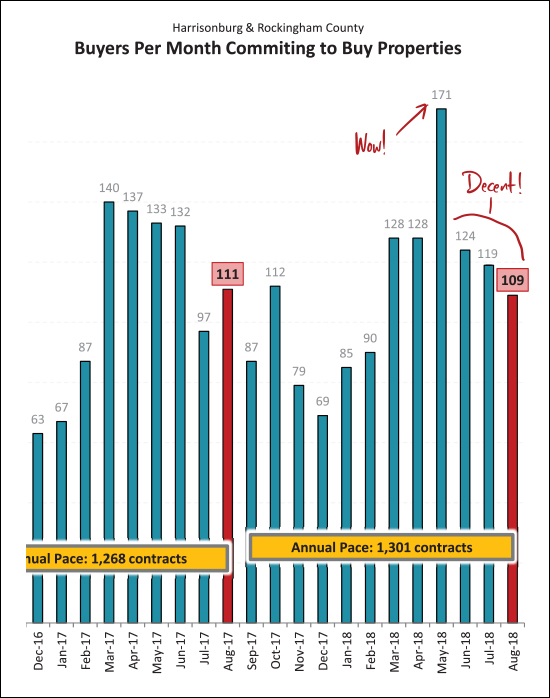 The huge month of sales in June 2018 was foretold by the enormous month of contracts in May 2018. Since that time, we've seen relatively normal months of contract activity. The 109 contracts signed in August 2018 is pretty much in line with the 111 contracts we saw last year. Looking forward, we're likely to see a dip in contract activity in September, possibly a spike in October, before much lower contract numbers between November and February. 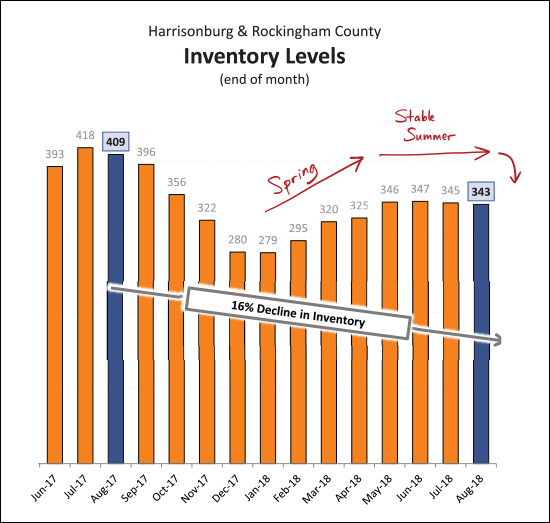 If you thought inventory levels have been low recently, you haven't seen anything yet. After a 16% year over year decline, we're about to head into the Fall and Winter where we inevitably see fewer homes on the market. It seems likely we'll dip below the 300 homes for sale mark again as we did last December and January. An increase in new construction is likely the only thing that can break this drought of listing inventory. 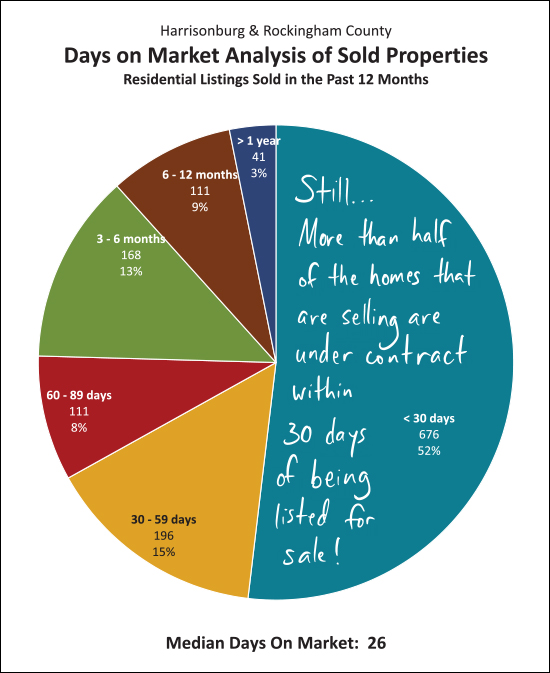 This is absolutely no consolation at all to any home seller who has had their home on the market for 2, 3, 4, 6 or 10 months -- but for sellers about to put their homes on the market, you have a decent chance of selling your home quickly -- again, depending on price point, location, features, finishes, condition, marketing, etc. But, as shown above, slightly more than half of the homes that sold in the past year were under contract within 30 days of being listed for sale. 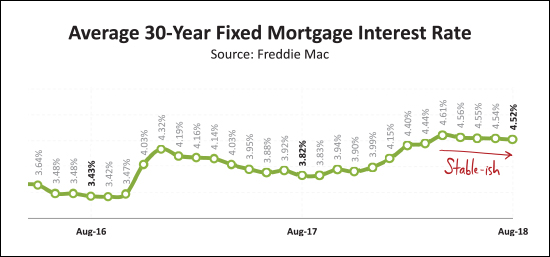 Yes -- interest rates have risen over the past year -- by about 0.75%, which we shouldn't minimize. That said, at 4.5% -- which seems to be where we are hovering for the moment -- this doesn't seem to be drastically changing buyer behavior or housing affordability. OK -- I'll stop there for now. Again, you can download the full report as a PDF, or tune in to my monthly video overview of our local housing market And a few tips for anyone thinking of buying or selling soon -- SELLERS -- even though it is a seller's market in many price ranges right now, you must still focus on price, condition and marketing. For further reading on buying or selling in this area, check out.... | |
| Newer Posts | Older Posts |
Scott Rogers
Funkhouser Real
Estate Group
540-578-0102
scott@funkhousergroup.com
Licensed in the
Commonwealth of Virginia
Home Search
Housing Market Report
Harrisonburg Townhouses
Walk Through This Home
Investment Properties
Harrisonburg Foreclosures
Property Transfers
New Listings

