| Newer Posts | Older Posts |
Townhouse Sales Trends in Harrisonburg and Surrounding Areas |
|
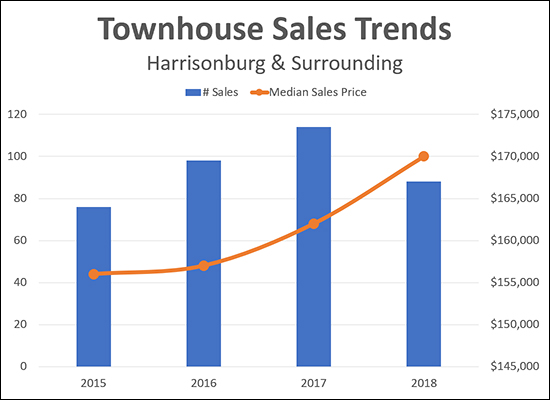 This is a somewhat limited analysis, but I think it can be helpful to understand what we're seeing in changes in demand for new-ish townhouses in the City of Harrisonburg and just surrounding. The analysis above includes the following townhouse developments of properties built since 2000:
As shown on the chart, there are an increasing number of sales happening in these developments (88 sales in 2018 is for the first eight months of the year) and the median sales price is rising -- more quickly now than a few years ago. I expect sales of this type of townhouse to continue to be strong over the next few years -- though if we see a large number of new construction townhouse developments coming online it could affect the pace of sales in resale townhouse developments. | |
Fall Is Not The Worst (Nor The Best) Season For Selling Your Home |
|
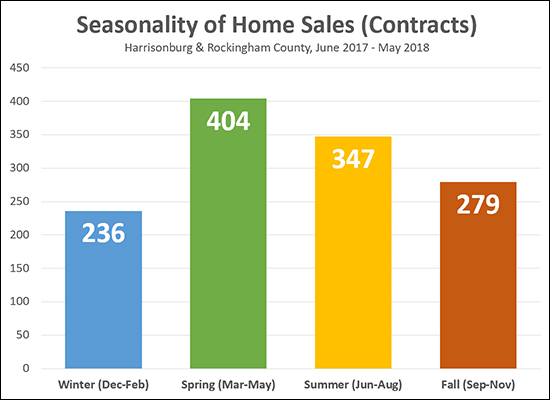 As is likely no surprise -- the busiest time for home sales (contracts) is SPRING -- followed by SUMMER. Fall, though, is the third best -- ok, also the second worst -- season for home sales. Of note, the data above reflects the timeframe during which properties went UNDER CONTRACT -- not when they closed. Plenty of the Summer contracts turned into Fall closings -- but the 279 figure is a reflection of how many buyers made buying decisions (signed contracts) between September and November of last year. So....if you want to sell your home (and close on it) in 2018, you should be thinking about getting it on the market sooner rather than later. Fall is definitely a better time to sell than Winter! | |
Fewer and Fewer Homes For Sale in the City of Harrisonburg |
|
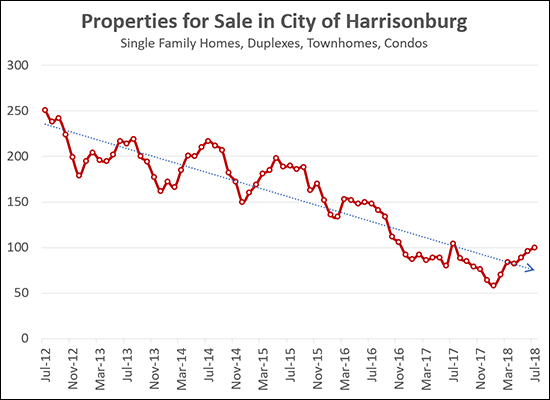 Home buyers looking to purchase in the City of Harrisonburg are finding fewer, and fewer, and fewer options at any given time. As shown above, inventory levels have been steadily dropping over the past six years -- from over 200 homes for sale to less than 100 homes for sale. Now, of note, this is not an indication that fewer homes are selling in the City -- but rather, that with as fast as homes are selling in the City, there are a smaller number available for sale at any given time. Buyers in the City, thus, are finding themselves in competitive offer situations more often, or are having to make decisions much more quickly when a house of interest is listed for sale. Learn more about our local housing market in my most recent monthly market report -- click on the image below to read it. | |
Local Home Sales and Prices Surge in July |
|
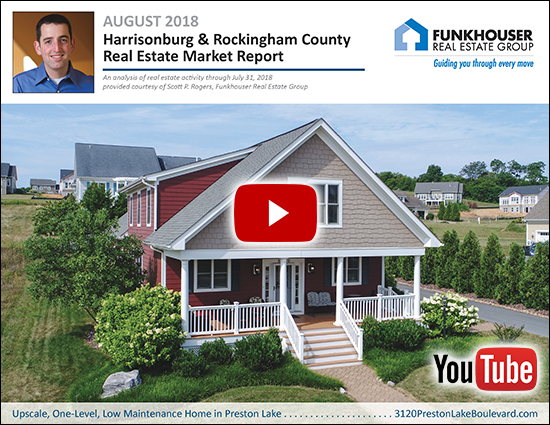
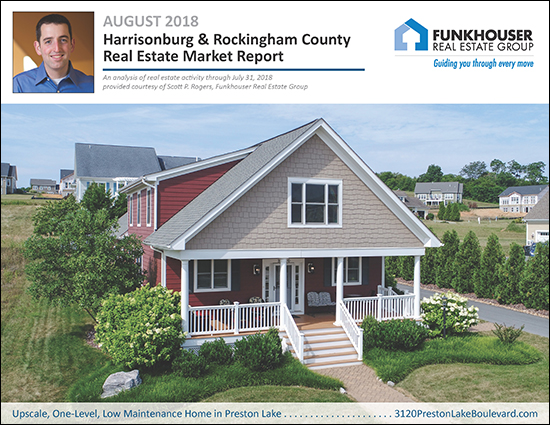 First, learn more about this fantastic home (my dad's house), via a 3D Walk Through and more by visiting 3120PrestonLakeBoulevard.com. Now, back to our local real estate market -- I just published my most recent monthly market report, and as usual, you can read on for an overview, download the full report as a PDF, read the entire report with commentary online, or tune in to my monthly video overview of our local housing market... Now, let's take a look at some the trends we're currently seeing in our local housing market... 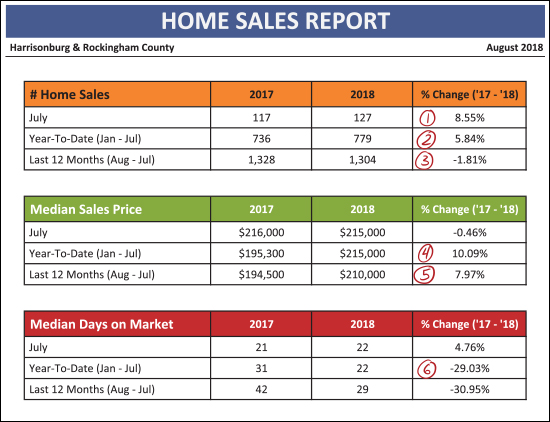 As shown above, it has been an exciting month -- and year -- in our real estate market...
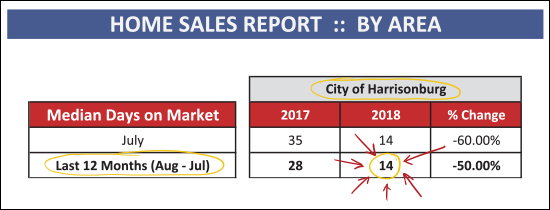 OK -- this one is a random snippet. Above you will find a STARTLING statistic about the housing market in the City of Harrisonburg -- not including Rockingham County. When we look at all homes that sold in the past 12 months, in the City, half of them were under contract within 14 days of being listed for sale! Wow! 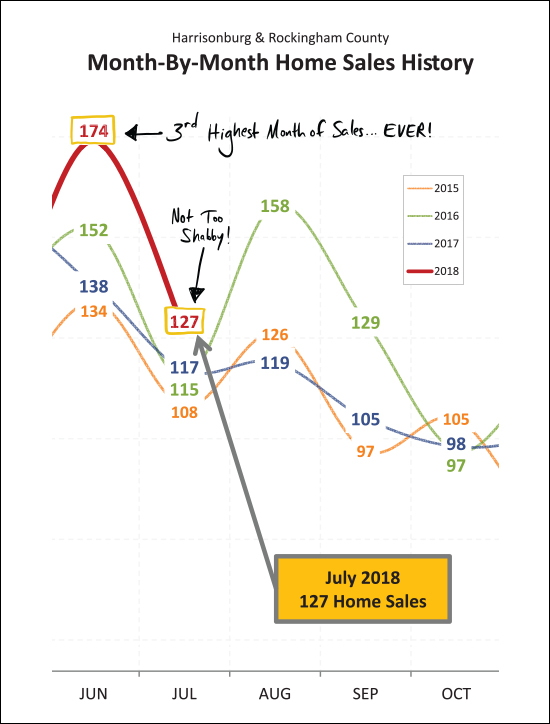 Back to the big picture -- June 2018 home sales (all 174 of them) was the third highest month of home sales we have ever seen in our local market -- topped only by two summer months back in 2005 and 2006. I thought we'd see home sales drop off in July, as a result, but we had the best month of July sales in recent years -- with 127 home sales! Next month I'm not expecting we'll pop back up to August 2016 levels -- we're more likely to be in the 120 - 130 range for sales in August. 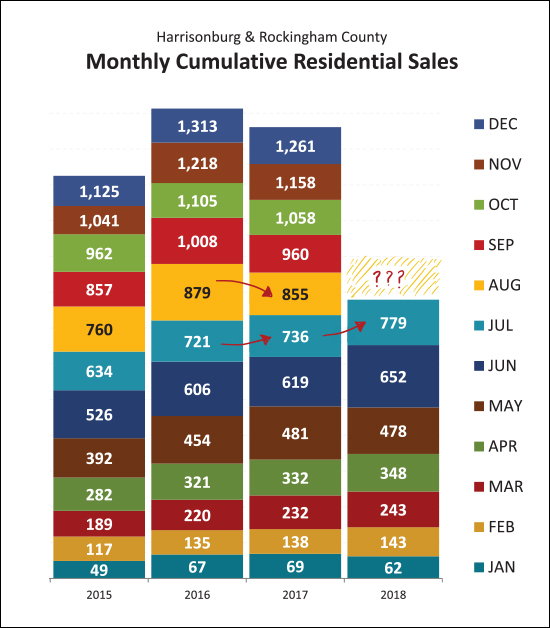 August, oh August, that magical month. Last year at this time (end of July) we had seem more home sales (in 2017) than during that same timeframe the prior year (2016). And then, August. After August passed, 2017 never caught back up -- and ended up being a slower year than 2016 when all sales were accounted for. So -- what will happen this August? Will we keep on pace with 2017? Or even with 2016? Will we fall behind again? Stay tuned. 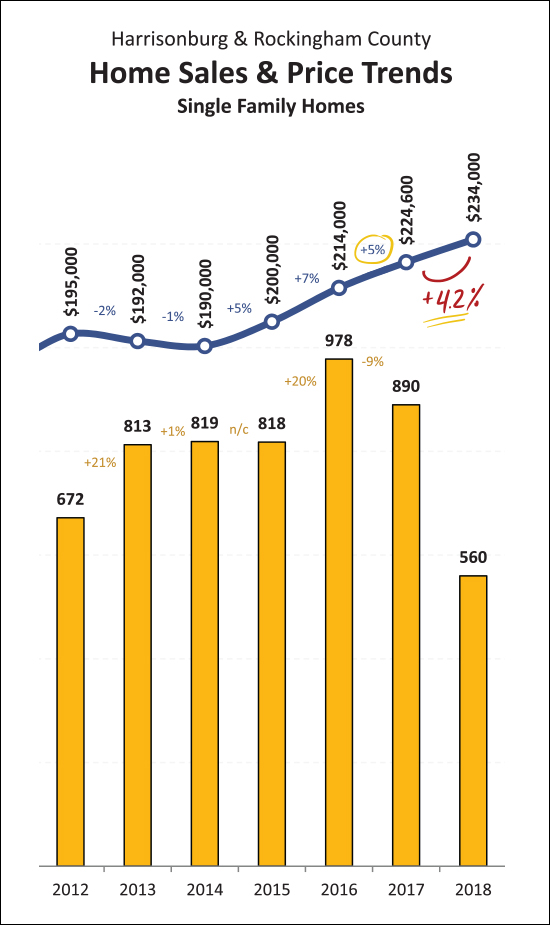 When I see the YTD market-wide median increasing by 10%, I get a bit worried -- wondering if these are sustainable increases. Then, however, when I look at single family home sales alone, I am (at least a bit) reassured. You'll note that thus far the median sales price has increased only 4.2% between 2017 and 2018. This is much more in line with (or close to) long-term historical averages, and makes me think that the strong seller's market might not be leading to unsustainable price increases. Why, might you ask, is the single family detached market a better indicator of changes in market value? Mainly because it is not as easily affected by the number of investors engaging in our market. When the market gets hot we often see lots of investors buying properties -- often townhouses or other attached dwellings -- which can affect price trends. Most single family home purchases are made by folks who actually intend to live in the properties. 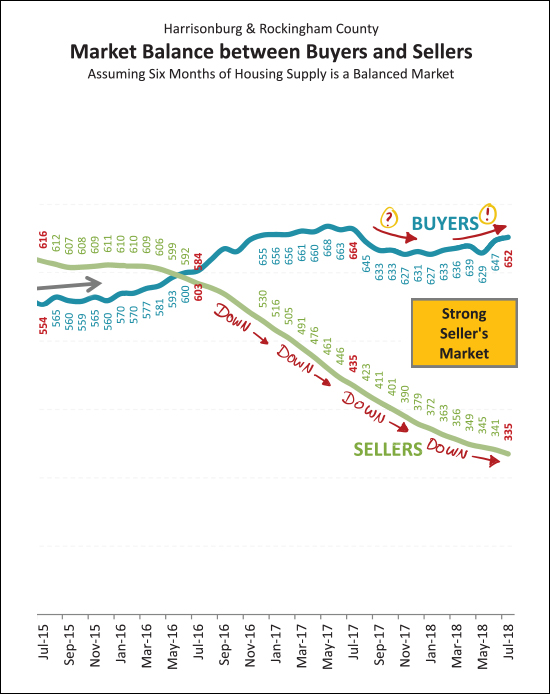 Which would you rather do, buy or sell in the current market? The answer should be "sell" -- given the strong seller's market we're currently experiencing. A few things to note above -- first, there are still plenty more buyers in the market than there are sellers. Second, the number of sellers in the market continues to decline (and decline, and decline). Third, after a brief slow down in buyer activity, the pace seems to be increasing again. 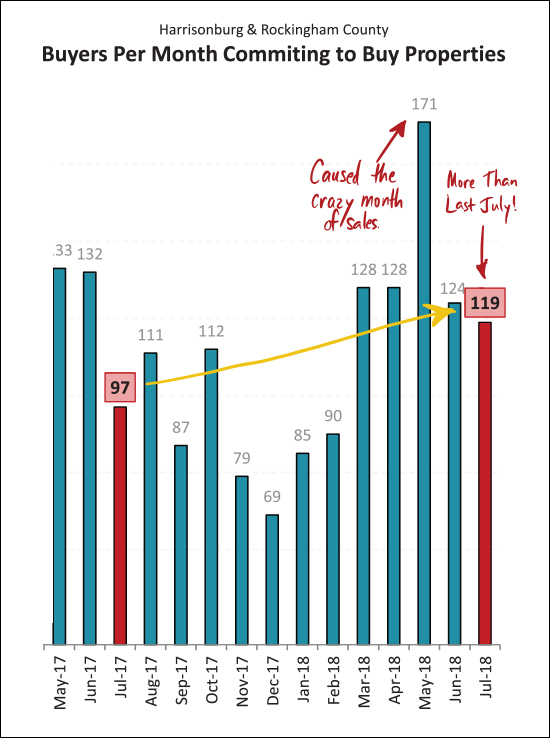 What comes next for our local market? Looking at contract activity (above) we can see the pop in May 2018 that lead to a wild month of June sales. Looking, then, at July -- we actually see a sizable increase from last July -- so maybe we'll have a stronger than expected month of sales in August after all!? 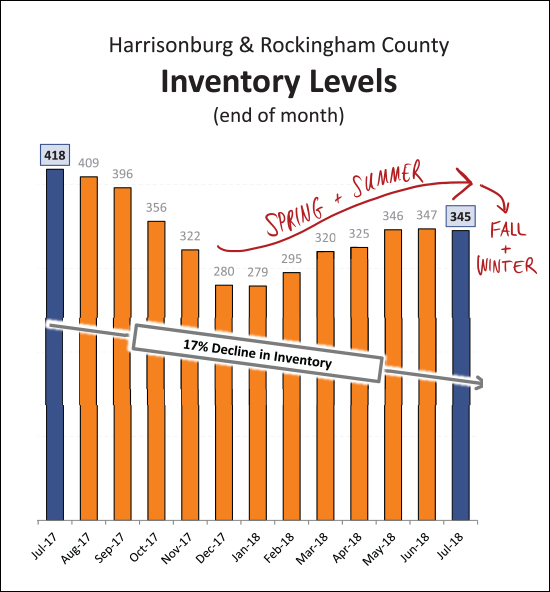 If you're buying soon, you might have already passed the time in our local market cycle when you would have the most options from which to choose. That's not to say that plenty of new listings won't be coming on the market in the next 30 / 60 / 90 days -- they will -- but inventory levels have likely peaked and will start to decline as we (eventually) head into Fall and Winter. 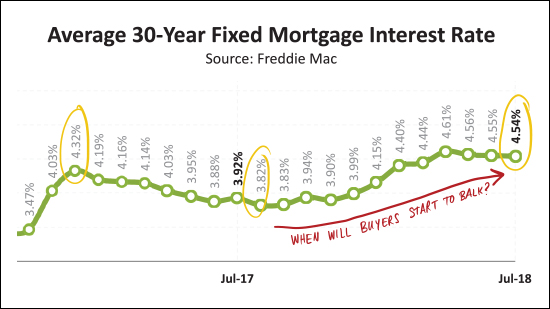 Lastly, how about those interest rates? We were actually close to 4.5% about 20 months ago -- but then dropped below 4% again. Now, over the past year, we have seen steady increases to where we are currently hovering around 4.5%. I have not seen this playing a major role in whether buyers are willing and able to buy -- but I do wonder if buyer activity (or interest or capability) would start to be affected if the interest rates rose to 5% or 5.5%. OK -- I'll stop there for now. Again, you can download the full report as a PDF, read the entire report with commentary online, or tune in to my monthly video overview of our local housing market One last note for anyone thinking of buying or selling soon -- SELLERS -- even though it is a seller's market in many price ranges right now, you must still focus on price, condition and marketing. For further reading on buying or selling in this area, check out.... | |
Prices of Single Family Home Sales Relatively Close to Harrisonburg |
|
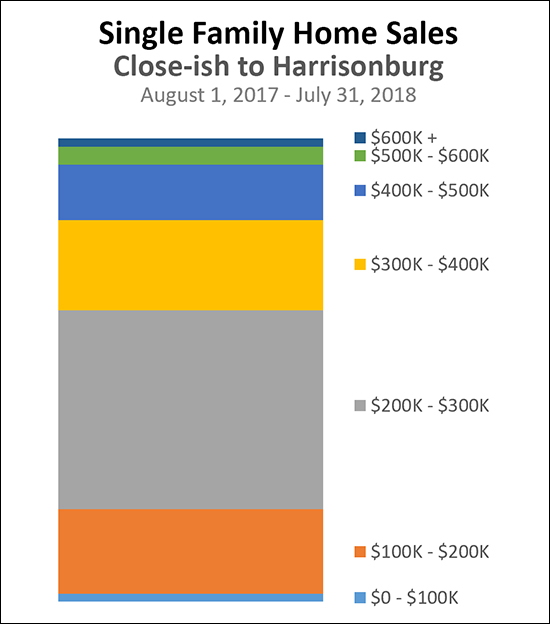 Here is a break down of a year's single family home sales by price range:
A reader asked the following in response to my analysis earlier this week of all home sales in Harrisonburg and Rockingham County... "These stats don't seem to portray the same market in which I hunted unsuccessfully for months in the 200-300k range and, ultimately, felt pushed to purchase far beyond my comfort zone amid intense competition. How does the picture change if you include only detached single family properties? (i.e., are the numerous sales of sub-100k student townhome units skewing things?) I'm just trying to understand why my experience seems to have differed so greatly from the market reality." This is an excellent point. When we look at a large amount of data (all sales in Harrisonburg and Rockingham County) the large number of home sales in a particular price range can obscure some market realities that are hiding just below the surface. In the case of the buyer commenting above, the reason that she found very few options in the $200K - $300K price range relates to property type, location, size, age and features. Property Type - Indeed, the original analysis includes all property types, including townhouses and condos. Under $100K, this includes many student rentals. Between $100K and $200K, this includes many townhouses, some of which are rental properties. Between $200K and $300K this also includes quite a few townhouses. In the new analysis (above) I have only included single family detached homes. Location - Rockingham County is a large county. It's actually the third largest county in Virginia, behind Pittsylvania and Augusta. Many buyers looking to be close-ish to Harrisonburg aren't going to be looking at homes in Broadway, Elkton or Massanutten, based simply on location. In the new analysis (above) I have only included areas close-ish to Harrisonburg, as shown below. 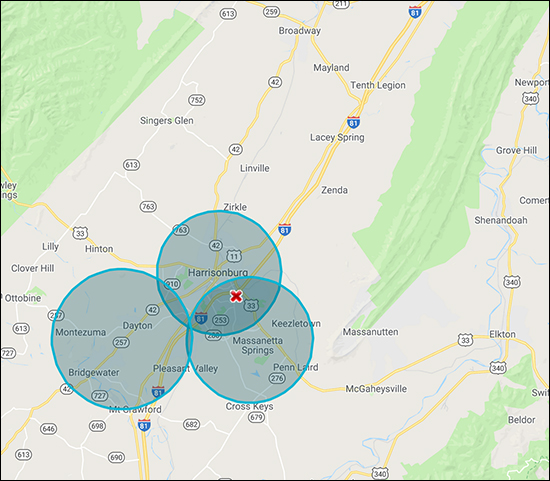 Size - It's easy to look at the data above and wonder how there could really be 182 homes that sold between $200K and $300K, in the geographic area bounded above, and to not (as a buyer) have thought any or many were good options. A whole lot of this has to do with the size of the home -- many buyers need more than X bedrooms, or more than X square feet. When we start putting some lower bounds on the space needed in a house, we quickly narrow down the number of viable homes. Age - The age of a home doesn't narrow things down quite as quickly as the size of a home, but it makes an impact. Many buyers are going to be significantly less excited about buying a 60 or 80 or 100 year old home as compared to buying a home that has been built in the past 10 to 20 years. Features - Then, when we start adding on needs (garage, basement) or wants (open floor plan, level lot), we narrow it all the way down to a relatively small number of homes that often match exactly what a buyer is hoping to buy. So -- when you look at the large number of homes selling in a given price range, don't think that all of those homes will be homes that will be viable options for you and your family. Once we add some of your additional (reasonable) criteria, the options will start constricting, often rather quickly. | |
Fewer Than 1 In 4 Home Buyers Spend Over $300K |
|
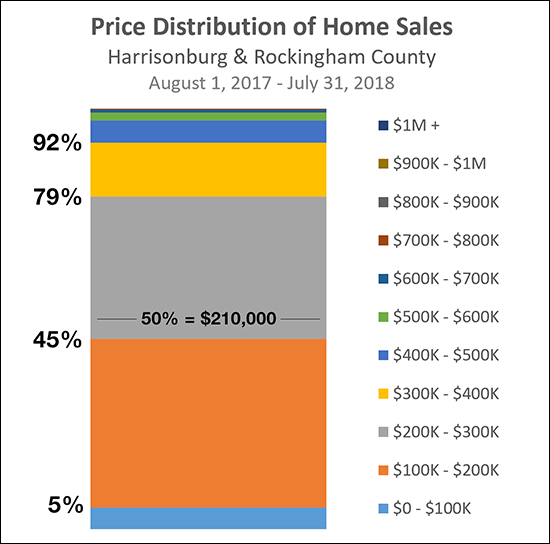 So much that can be unpacked here...
| |
Housing Inventory Levels May Have Peaked For The Year |
|
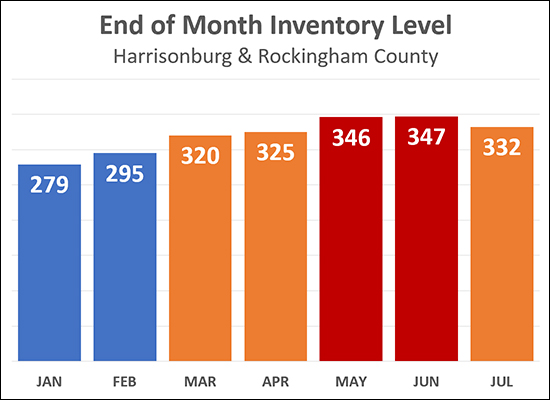 The number of options that you have today, as a buyer, may be the most options you'll have at any given point between now and the end of the year. As shown above, inventory levels (the number of active listings in the MLS at the end-ish of each month) climbed through the first six months of the year, but seemed to peak in May/June and now would appear to be starting to decline again. Now, certainly, there will be new listings over the next five months of this year -- so there will be some new inventory options -- but the total inventory available at any given point is not likely to increase again until next Spring. | |
Local Home Sales, and Prices, Soar in June 2018 |
|
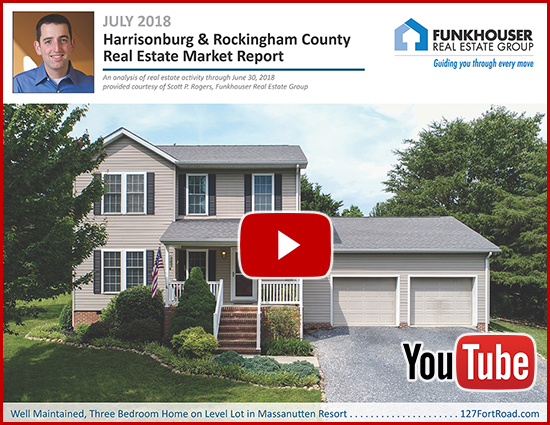
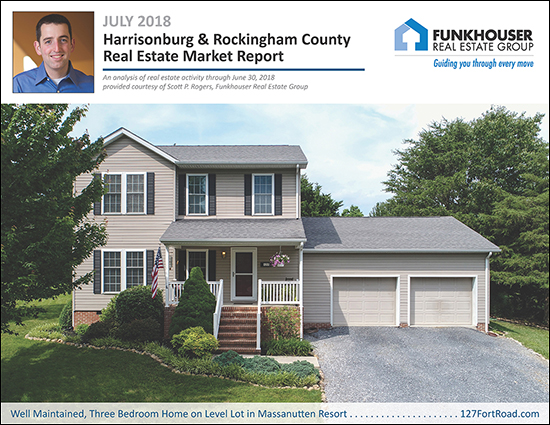 Learn more about this fantastic home in Massanutten Resort: 127FortRoad.com. I just published my most recent monthly market report, and as usual, you can read on for an overview, download the full report as a PDF, read the entire report with commentary online, or tune in to my monthly video overview of our local housing market... OK -- now, let's take a look at some of the overall market indicators this month... 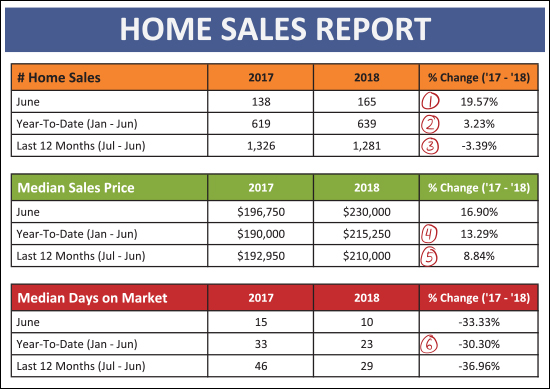 As shown above...
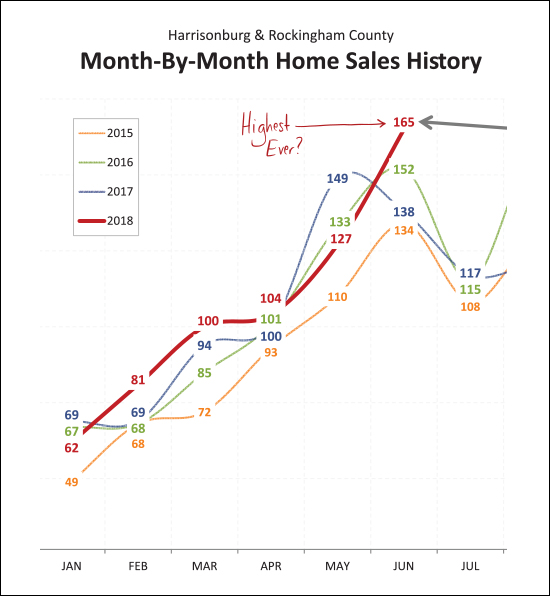 Wow! Just wow! The 165 sales seen in June 2018 is the highest seen any time in the past several years -- in fact -- it is the most sales in a single month any time in the past 10 years! I actually have data back to 2003, and the only times that we have seen more than 165 home sales in a single month have been: June 2004 (174), June 2005 (173), July 2005 (166), August 2005 (183) and June 2006 (192). 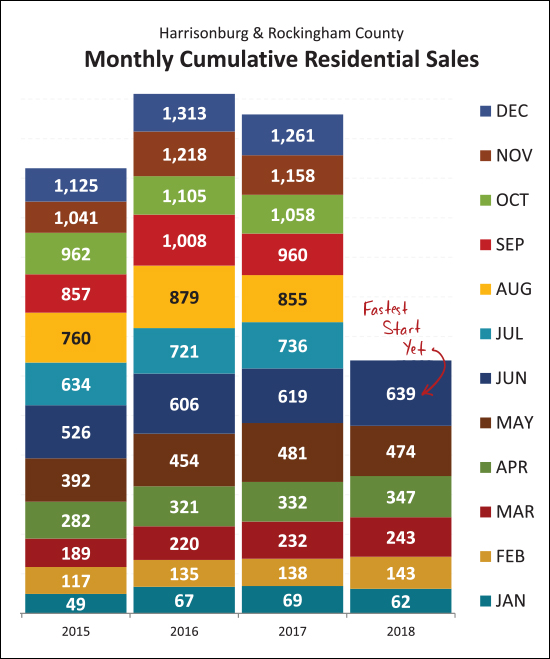 Needless to say, this is the fastest start to the year we have seen anytime in recent history. As shown above, the 639 home sales in the first half of 2018 exceeds the number seen in the first half of the past three years. Looking back further, the only times we saw more home sales in the first half of the year were in 2004 (706), 2005 (764) and 2006 (759). 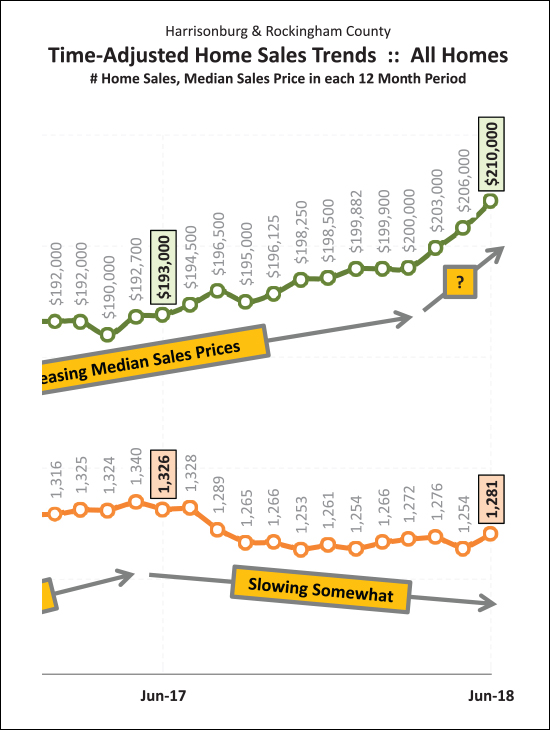 As shown above, despite slowing sales over the past year-ish, median sales prices have been slowly rising -- and over the past three months have started escalating quickly -- from $200K to $210K between March 2018 and June 2018. So -- record numbers of sales, quickly rising prices -- hmmm -- something about this seems familiar. Should we be worried? Maybe, or maybe not... 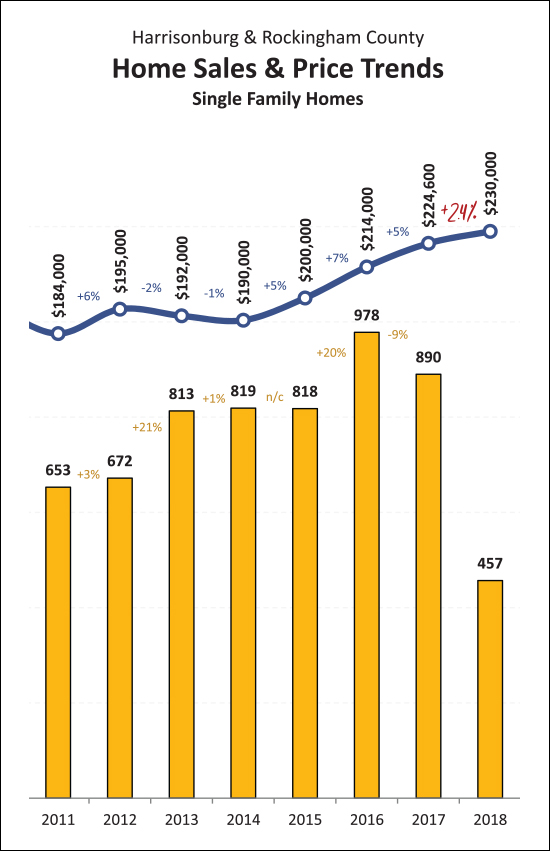 The figures shown in all prior charts and graphs has been for all residential sales -- including detached homes, duplexes, townhouses and condominiums. The graph immediately above focuses only on Single Family (detached) Homes and this can often give us the truest indicator of market trends. Perhaps it is (or could be) some comfort, then, that the median sales price of these detached homes has only risen 2.4% over the past year. This may mean that the rapid increases in prices we are seeing has more to do with what is selling (property type, price range) and/or is being skewed by non-owner occupied home sales/purchases. 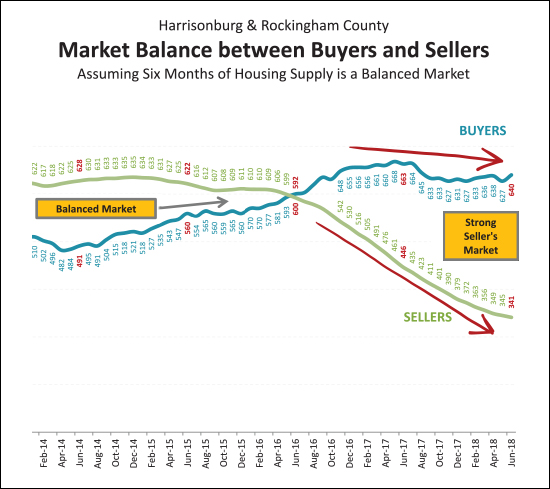 It is also important to note that while the number of home sales has been dropping slowly (3% decline comparing past 12 months to prior 12 months) part of that may be due to a change in market balance. It is a strong seller's market now, as there are a roughly equivalent number of buyers in the market as compared to a year ago -- with a drastically lower number of sellers in the market. 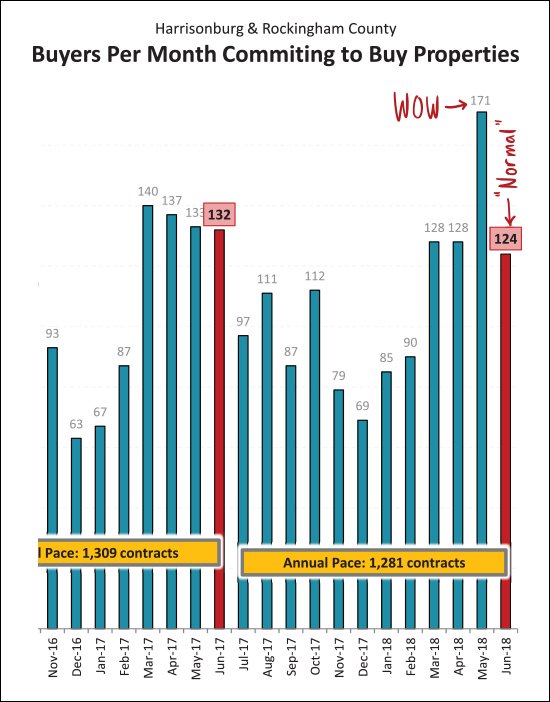 And here, folks, is the reason why we saw so many home sales this month -- it was a result of the crazy number of contracts signed last month. Last month's 171 contracts was the highest number I have seen anytime since I have been tracking these figures. Thus, slightly slower contracts in June is to be expected -- and we are likely to still see a strong month of sales in July based on some May contracts rolling over into July closings. 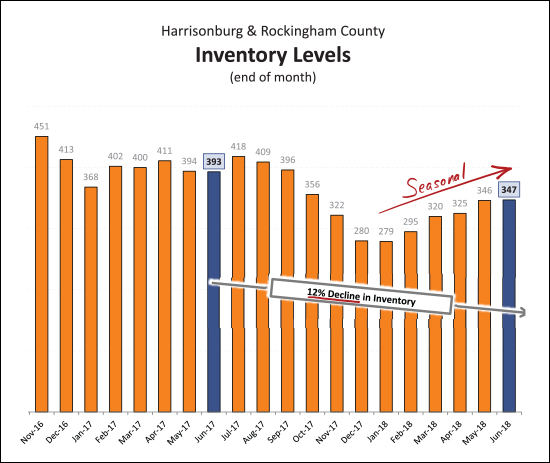 And here it is again -- declining inventory levels. While inventory levels have seen a seasonal increase over the past six months, there has been a net year-over-year decline of 12% in the number of homes on the market. Fewer homes for sale, with a roughly equivalent number of home buyers, has lead to a strong seller's market -- and a frustrating time for many buyers! 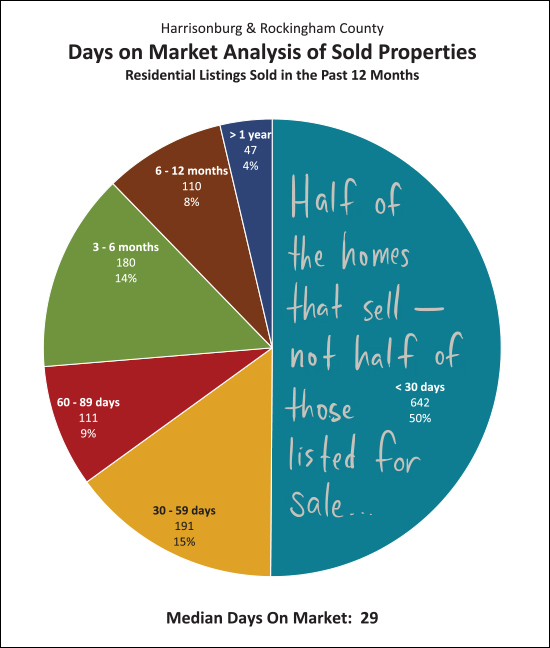 Perhaps because there are so many buyers fighting over each listing, homes are selling more quickly. Half of the homes that have sold in the past year have been under contract within 30 days of having been listed for sale. Again, this is not half of all properties that are listed going under contract in 30 days -- just half of those that actually do sell. 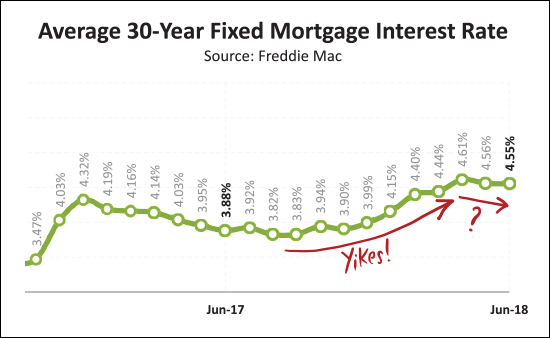 As shown above, mortgage interest rates have been increasing over the past year -- almost an entire percentage point. This has not seemed to have made a drastic difference in the pace of buyer activity (yet) and it has been nice to see these edge downward somewhat over the past few months. OK -- I'll stop there for now. Again, you can download the full report as a PDF, read the entire report with commentary online, or tune in to my monthly video overview of our local housing market One last note for anyone thinking of buying or selling soon -- SELLERS -- even though it is a seller's market in many price ranges right now, you must still focus on price, condition and marketing. For further reading on buying or selling in this area, check out.... | |
Monthly Housing Costs On The Rise |
|
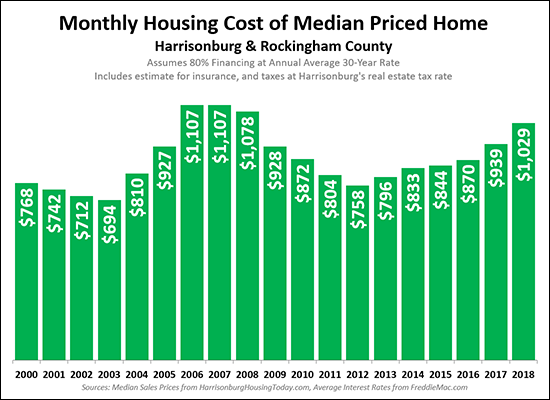 It should come as no surprise that monthly housing costs are increasing, after all...
Thus, the 22% increase in monthly housing costs over the past three years should not be too surprising. For this analysis, I am measuring "monthly housing cost" by determining the mortgage payment amount (principal, interest, taxes and insurance) for a median priced home in Harrisonburg and Rockingham County, if a buyer were financing 80% of the purchase price and paying Harrisonburg real estate taxes. Looking forward, I would expect that all three of these factors (prices, interest rates, tax rates) that influence housing costs would likely continue to increase. | |
Just How Fast Are Home Selling These Days? |
|
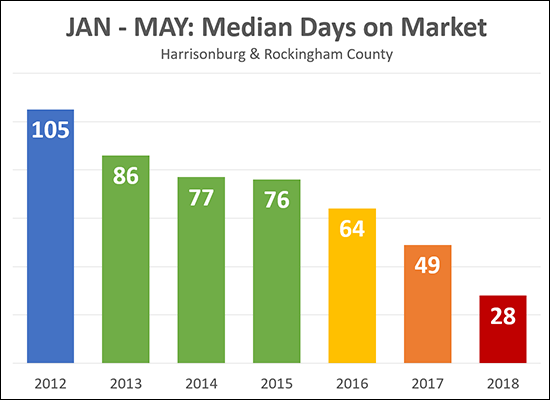 "Days on Market" is the number of days that pass before a property is under contract. Thus, if a home is on the market for 10 days before a contract is signed, the "days on market" will be 10 for that property. The "Median Days On Market" for any given time frame gives us a good sense of how quickly homes are selling. For example, the median of 28 days for the first five months of 2018 means that half of the homes that sold in the first five months of 2018 were under contract less than 28 days after they hit the market -- and half took more than 28 days to go under contract. It is important to note that this does NOT mean that half of homes that are LISTED are under contract within 28 days -- just that half of those that actually SOLD were under contract within 28 days. The trend line here is rather remarkable. Just six years ago (2012) the median days on market was right around 3.5 months -- and now the median is just under one month! | |
More Buyers Signed Contracts in May 2018 Than In Any Other Month, Ever |
|
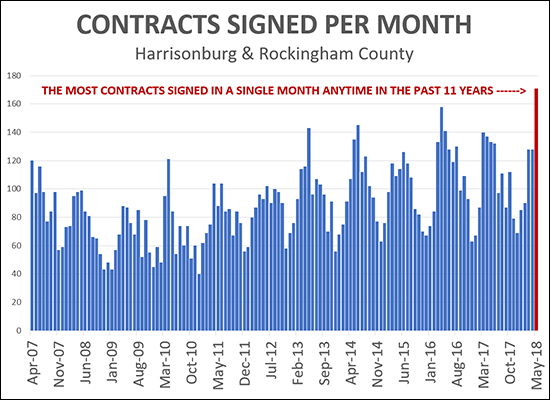 To say that May 2018 was a busy month for contract signing seems to be an understatement. I have data all the way back to April 2007 -- and the number of contracts signed last month (171) seems to be the highest month of contract activity we have ever seen in Harrisonburg and Rockingham County. It's hard to say how those contracts will show up as closings -- they will likely spread out between June and July -- so we might not have the highest month of home sales ever in June 2018. But, then again, we might. :-) Read more about our local housing market in the most recent edition of my monthly market report... | |
Home Sales Slow, Prices Pop, Contracts Climb |
|
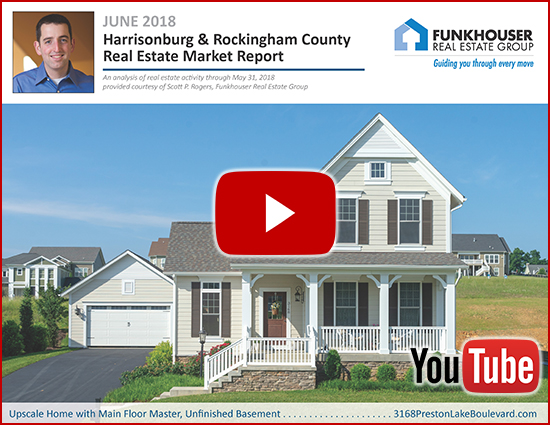
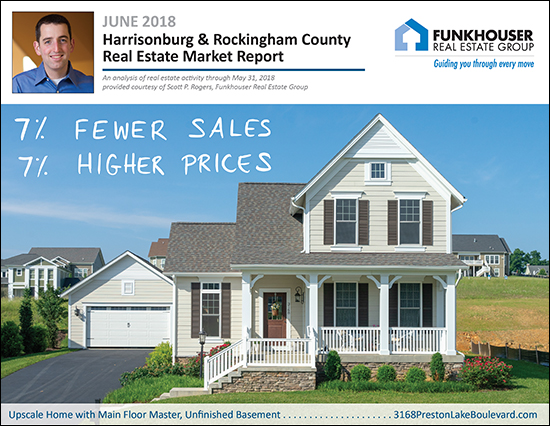 Find out about this beautiful home at Preston Lake: 3168PrestonLakeBoulevard.com. I just published my most recent monthly market report, and as usual, you can read on for an overview, download the full report as a PDF, read the entire report with commentary online, or tune in to my monthly video overview of our local housing market... OK -- now, let's take a look at some of the basic market indicators this month... 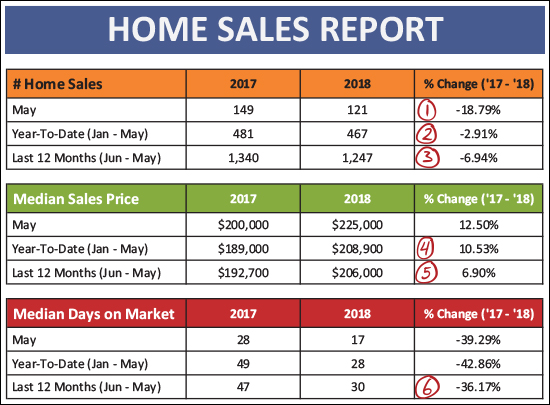 Plenty of statistics of interest above, including...
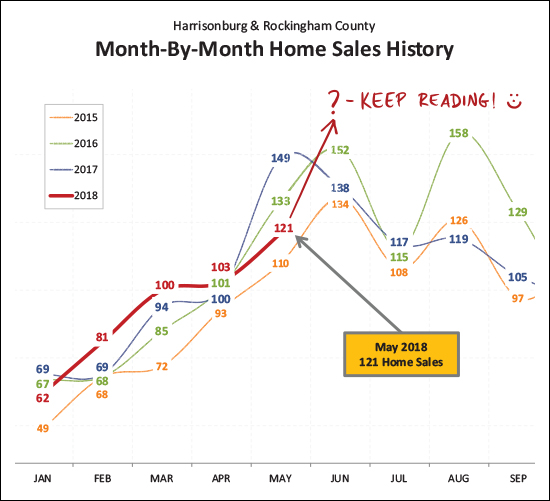 So, as seen above, May sales were slower than (I) expected. After the best February, March and April in recent memory -- home sales in May 2018 fell below both May 2017 and May 2016. What gives? Well, perhaps, it is just some month-to-month variation between years. Keep reading to find out why all is not lost when it comes to late-Spring and early-Summer home sales. :-) 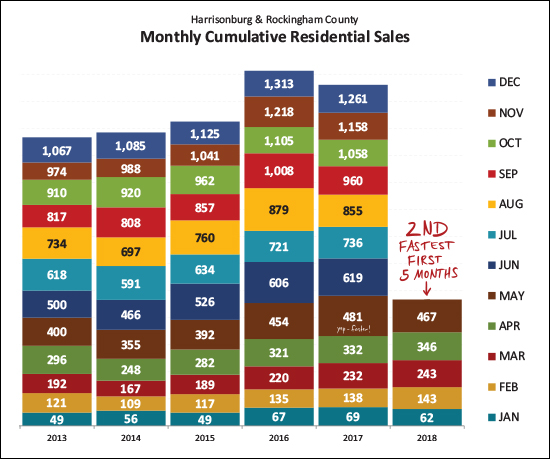 Looking at a slightly longer timeframe, the pace of home sales in the first five months of this year is only lagging slightly behind where we were last year -- and thus putting us in second place for the pace of home sales in Harrisonburg and Rockingham County. 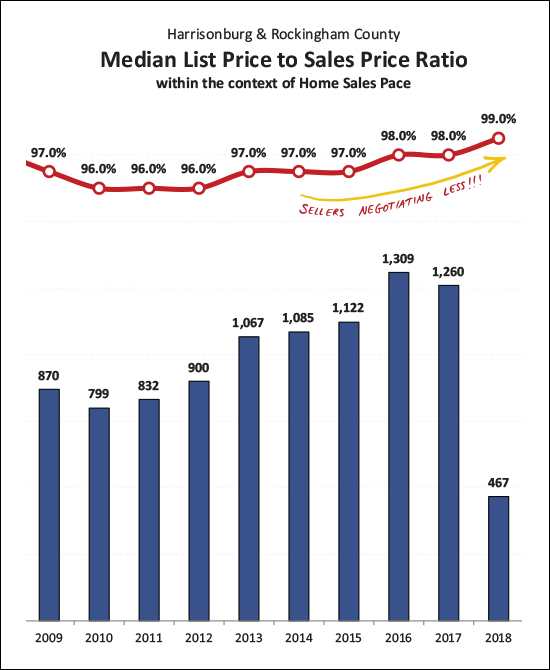 Have you heard it's a seller's market? There are fewer and fewer sellers (keep reading for details) and this has buyers fighting over properties in some price ranges (and locations) -- which has resulted in sellers needing to negotiate a bit less on their price than in years past. The median ratio between the sales price and list price is now 99%, as compared to 97% - 98% over the past five years. 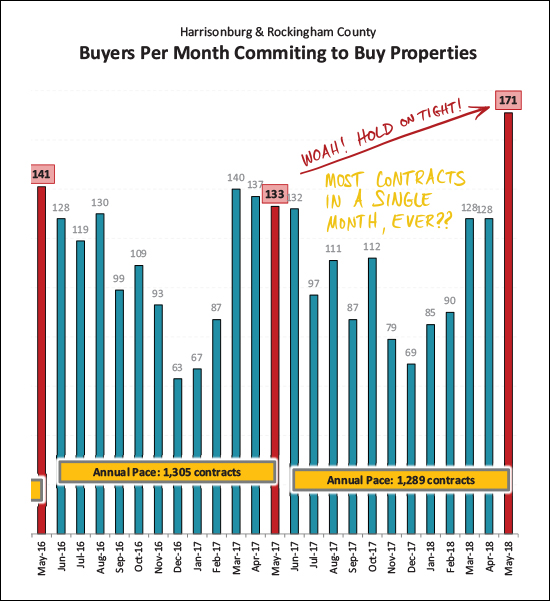 Yep -- this is the crazy one! Last May we saw 133 homes go under contract -- this May there were 171!?! I'll have to check my historical archives to be sure, but I think this may be the MOST contracts we have EVER seen in a single month EVER. Wow. So -- even if we were despairing that home sales were slowing in May -- perhaps we can excitedly look forward to June (and July) when these May contracts start turning into closed sales. Again -- wow! 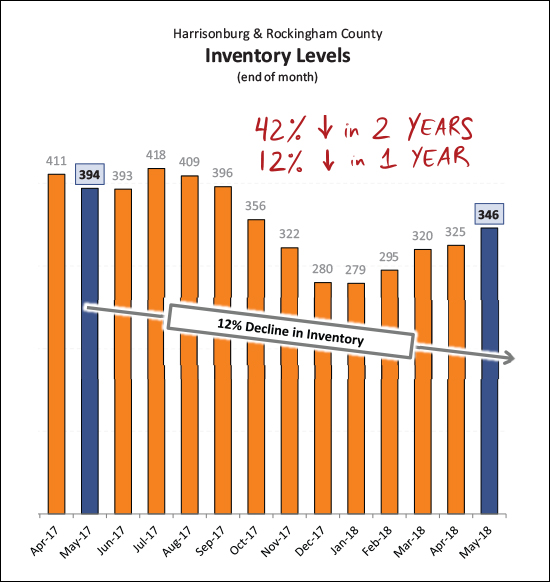 And yes, as mentioned above, inventory levels are falling -- fewer and fewer homes are on the market available to a buyer on any given day. We have seen a 42% decline in inventory levels over the past two years -- and a 12% decline in the past 12 months. The decline is slowing -- which might mean this inventory level can only go so low -- but this is what is causing so much frustration for buyers -- and oftentimes, so much delight for sellers! :-) 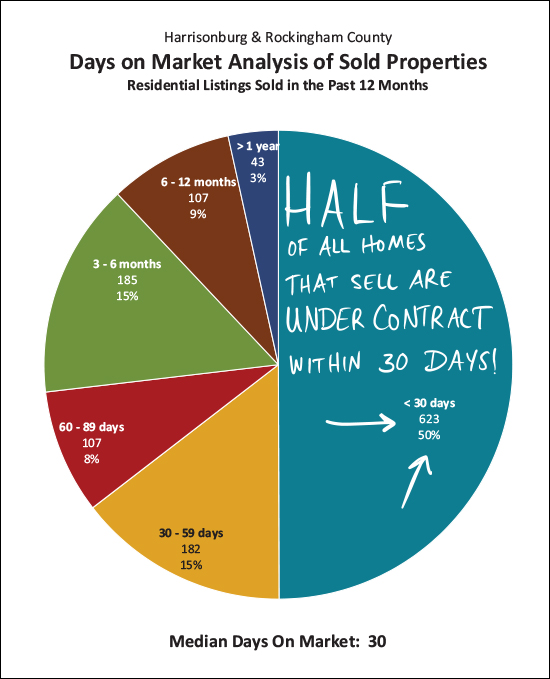 Faster and faster and faster, oh my! Indeed, homes are selling even more quickly now than they were a year ago. Half of the homes that sold in the past year were under contract within 30 days of hitting the market. If you are a buyer -- be ready to act FAST! 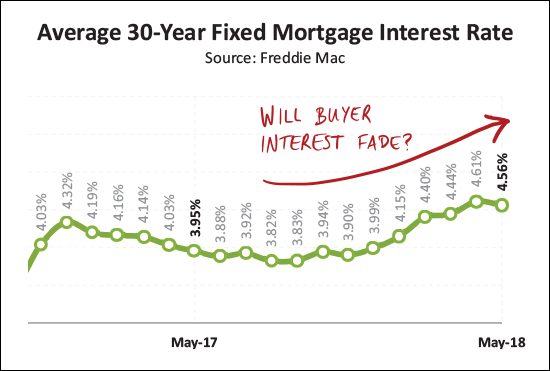 And finally, interest rates are on the rise. :-/ It costs more to finance a home purchase now than it did a year ago. I commented to a client today that today's interest rates are still ridiculously low compared to any longer-term historical perspective, but he was quick (and wise) to point out that this fact doesn't necessarily matter much for today's buyers. Why are they going to appreciate that today's interest rates are lower than they have been for most of the past 20 years -- all they care about is that they are going to be paying more to finance their home purchase now than if they had bought six months of a year ago. OK -- I'll stop there for now. Again, you can download the full report as a PDF, read the entire report with commentary online, or keep reading my blog in the coming days for further commentary. One last note for anyone thinking of buying or selling soon -- SELLERS -- even though it is a seller's market in many price ranges right now, you must still focus on price, condition and marketing. For further reading on buying or selling in this area, check out.... | |
Buyers Buying Faster This May Than Last |
|
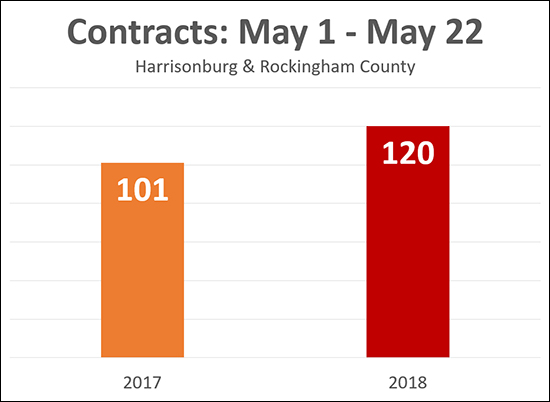 In the past 12 months there have been 1274 home sales -- compared to 1324 in the 12 months prior -- so, technically, the pace of home sales in our market has slowed by 4% over the past year. But -- home sales are POPPING so far this year... Closed sales last January through April = 332 Closed sales this January through April = 345 (4% increase) And -- as shown above, we've seen 120 buyers (and sellers, of course) sign contracts in the first 22 days of May -- as compared to only 101 last year. Hold onto your hat (?) everybody -- this could be a rather active year, yet again, in our local housing market. | |
Fewer and Fewer Foreclosure Sales in Harrisonburg, Rockingham County |
|
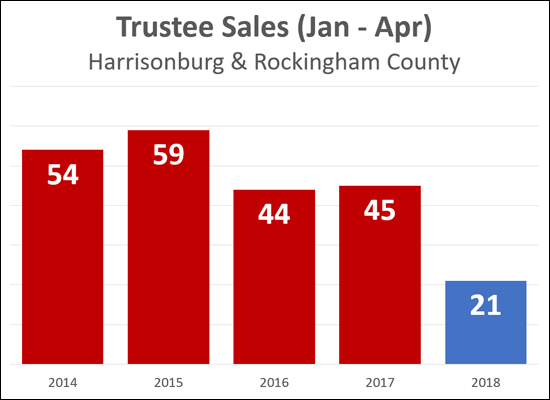 In good news for area homeowners, fewer and fewer homes are being foreclosed upon in Harrisonburg and Rockingham County. The graph above shows the number of foreclosures that took place in the first four months of each of the past five years. As can be seen, the number of foreclosures in 2018 is less than half of how many were seen in the same time period during each of the past four years. Fewer foreclosures is a sign of a healthy local economy and housing market. Read more about our local housing market in my most recent monthly market report. | |
Home Prices Edge Upward As Demand Exceeds Supply |
|
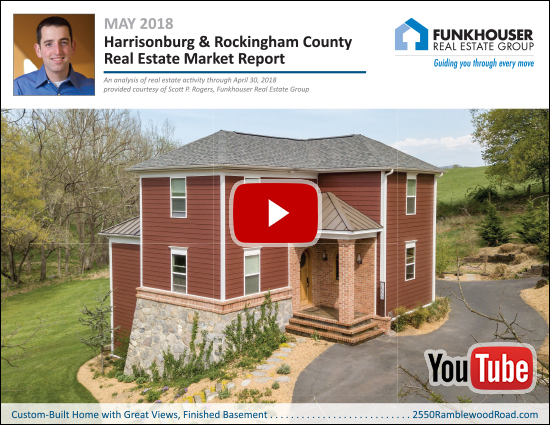
 Find out about this newly listed custom home: 2550RamblewoodRoad.com. I just published my most recent monthly market report, and as usual, you can read on for an overview, download the full report as a PDF, read the entire report with commentary online, or tune in to my monthly video overview of our local housing market... Now, let's dive into some of the latest data from our local real estate market.... 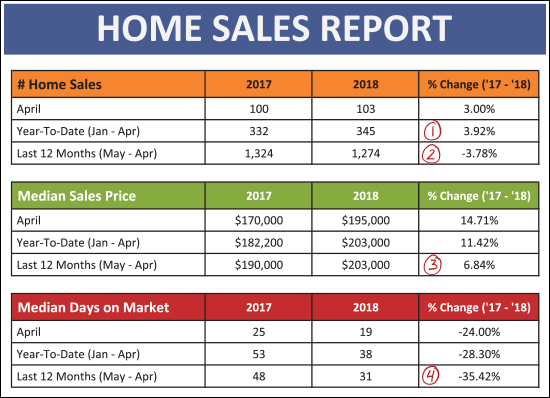 As shown above, it's been an interesting start to the year...
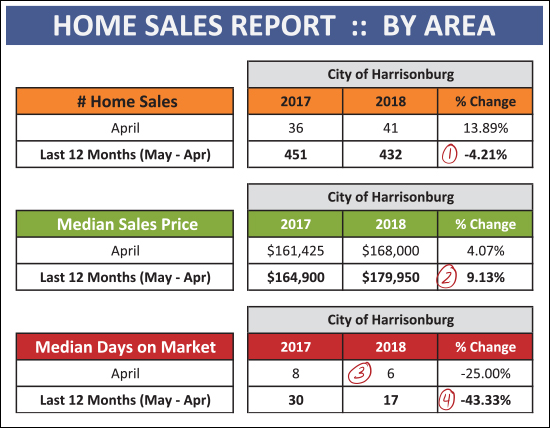 Shining a spotlight, briefly, on the City of Harrisonburg alone (not the County) we find...
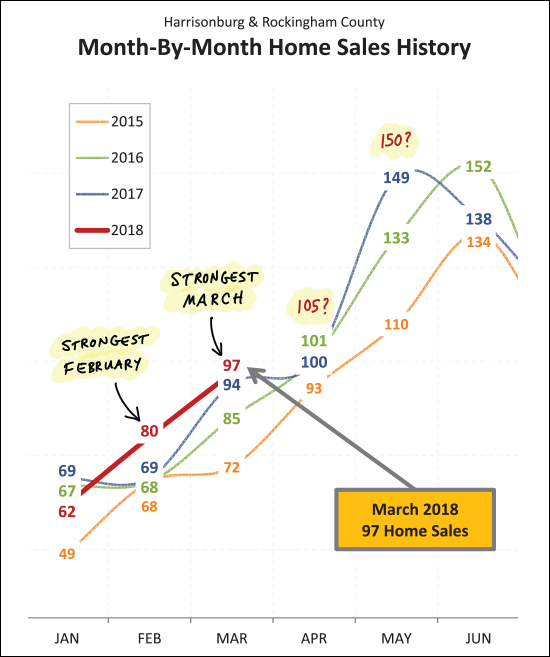
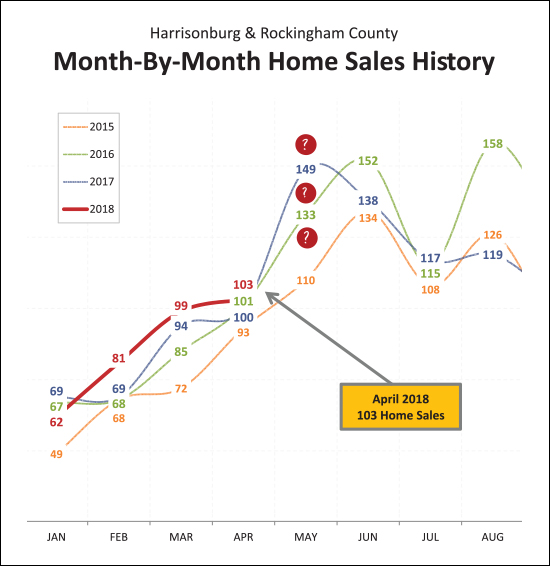 January 2018 was a tad slow -- but then February, March and April easily outpaced the same months last year. Wow! So -- where will we go in May? Could we really see a 50% increase (from April to May) as we saw last April (100) to May (149) or will the increase be a bit more tame? 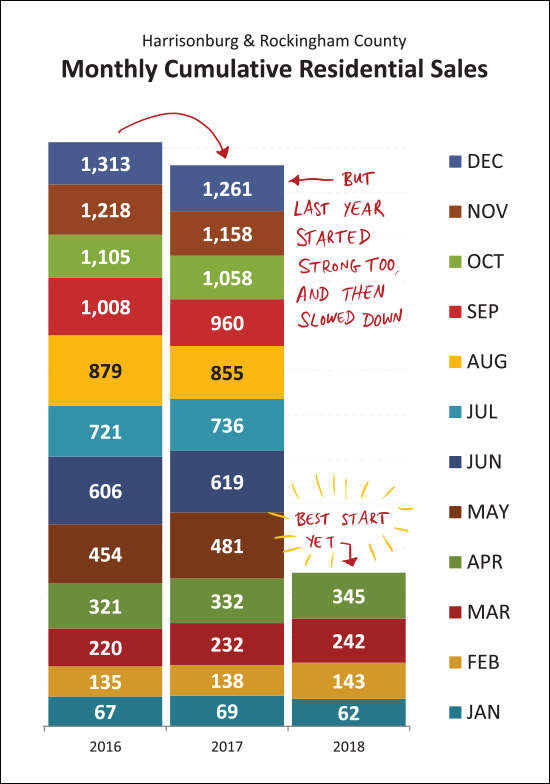 Lest we get toooo overjoyed about the fantastical pace of home sales in the first four months of this year -- I will point out that the last four months of last year also looked QUITE promising, before sales slowed down during the rest of the year to actually show a net decline in the number of home sales in 2017 as compared to 2016. So -- get excited -- slowly? Cautiously? 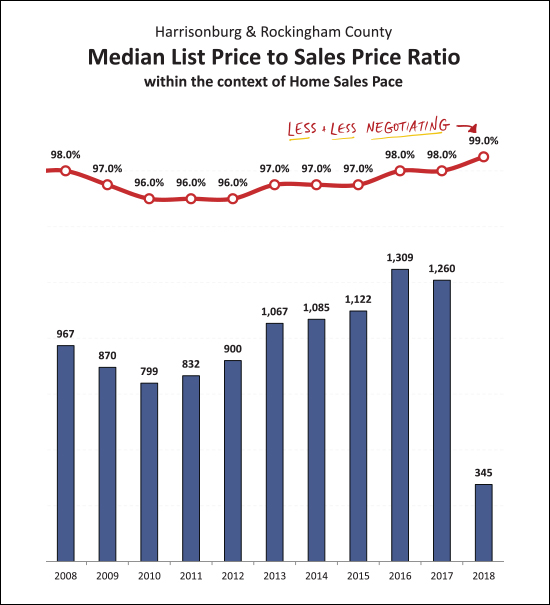 Sellers seem to be able to hold firm on their price a bit more this year than -- oh, I don't know -- any of the past 10 years!? Yes, that is true. Sellers negotiated anywhere between 2% and 4% off of their last list price over the past 10 years -- but so far in 2018, they have only negotiated 1% off of their last list price! 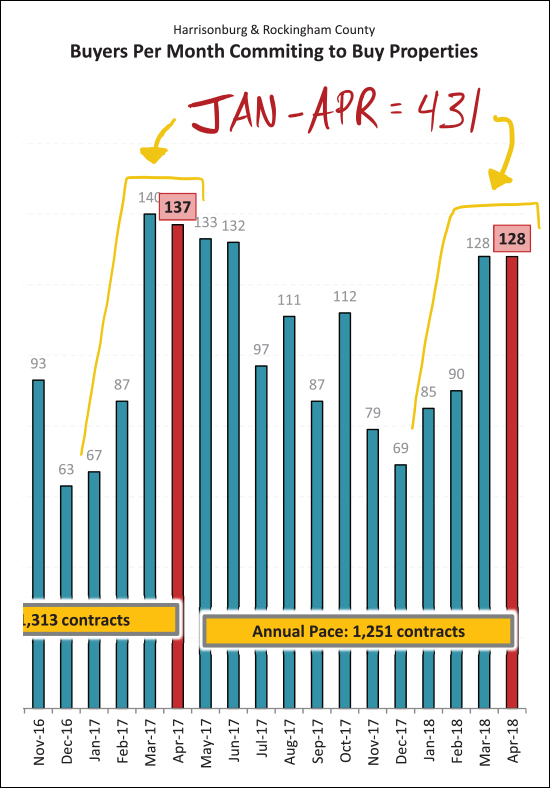 What comes next, you might ask? Well -- we generally look at the pace of contracts to have an idea of what home sales might look like in the coming month or two. So -- what do we see now? Well, curiously, this January through April 431 properties went under contract -- and -- last January through April 431 properties went under contract. So -- yes -- it seems possible that the HOT months of home sales in May and June might be seen again this year. 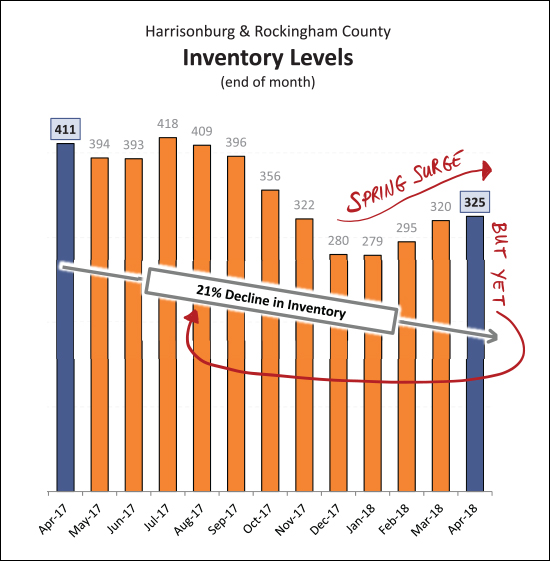 One of the reasons why there has been an overall decline in home sales (when looking at the past 12 moths compared to the previous 12 months) is because of declining inventory levels. There are currently 21% fewer homes on the market as compared to one year ago -- EVEN THOUGH we have seen a mini Spring surge in listings over the past few months. 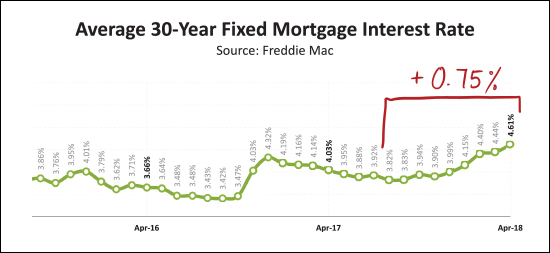 And finally -- those interest rates. They seem to be on the rise, woah, quite a bit! We have seen interest rates rise three quarters of one percent over the past nine-ish months. What's next? Will we push past 4.61% and start approaching 5%? Some say so. I don't think we will, but I have been wrong plenty of times over the past 5+ years about trends in mortgage interest rates. OK -- I'll stop there for now. Again, you can download the full report as a PDF, read the entire report with commentary online, or keep reading my blog in the coming days for further commentary. AND -- if you're thinking of buying or selling soon --- SELLERS -- even though it is a seller's market in many price ranges right now, you must still focus on price, condition and marketing. For further reading on buying or selling in this area, check out.... | |
Is $250K The Sweet Spot of our Local Housing Market? |
|
 As Hannah observed out this morning (thanks Hannah!) the $250K price point seems to be the sweet spot for our market. As a random aside, while I use the expression "sweet spot" with some regularity, I had forgotten its primary meaning, which Google informs me is... "the point or area on a bat, club, or racket at which it makes most effective contact with the ball" As a further aside, I have no idea if the tennis player pictured above is about to hit the tennis ball at the sweet spot of the racket!? But I digress. The second definition of "sweet spot" per Google is... "an optimum point or combination of factors or qualities" And that, I believe, sums up Hannah's point about the $250K price point... 1. There are LOTS of buyers who would like to buy $250K-ish homes. 2. Inventory is extremely low around the $250K-ish price point. 3. Builders aren't really hitting that $250K price point with many new homes being built. So - if you own one of these homes already - congrats, and know that you could likely sell it if you need to do so. And if you want to buy one of these homes, consider my usual advise for buyers in this fast paced market -- know the market, know the process, know your buying power, and closely monitor new listings! | |
What homes are NOT being built? |
|
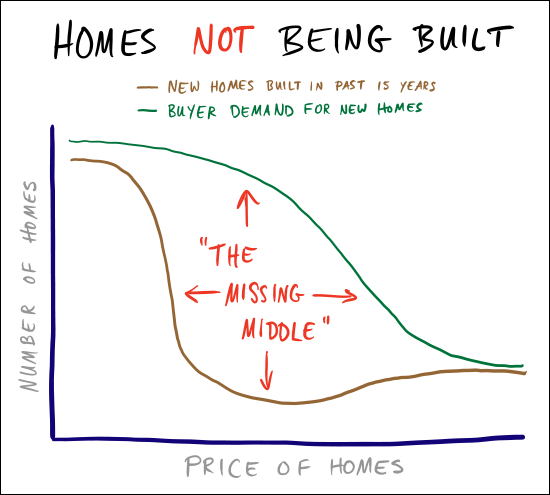 The graph above is not based on any actual data -- it's based on my experience of our local market, and conversations with a variety of buyers over the past few years. It seems that most of what has been built as new housing stock in this area over the past 15 years has either been townhouses -- or high end homes. This has left quite a gap in the middle of the market, where there is a LOT of buyer demand, but where there is NOT a lot of new housing stock to help meet this demand. How and when will this change? What will these buyers buy if they can't buy a home in that middle of the market price range? | |
Contract Activity Actually Slowed in April 2018 |
|
 This has been a ridiculously fast paced first four months of the year in my small corner of the local real estate world. As shown above, sometimes, my desk seems to be taking flight and I'm just fighting to keep up -- and, apparently, growing a beard because I don't have time to shave? :-)
146 buyers signed contracts during April 2017. 123 buyers signed contracts during April 2018. As shown above, contract activity actually slowed a bit when comparing this most recent month of April to last April. This (fewer contracts) could, of course, be related to buyers having limited options because of low inventory levels. Homes for Sale in early May 2017 = 411 Homes for Sale in early May 2018 = 323 I'll publish my full monthly market report in another week or so (if I can jump off this speeding train of sales activity for a few hours to do so) and we'll see what the other numbers show. For now, though, it is interesting to note that contract activity actually slowed in April 2018 as compared to last April. | |
Hey Builders, Harrisonburg is an Increasingly Popular Place to Live, Keep Up, Please! |
|
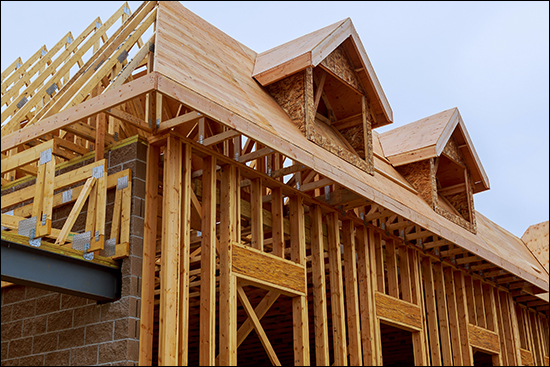 OK -- no numbers today. Just a few thoughts that have been coming up in conversation after conversation over the past year. Inventory levels (the number of houses for sale at any given time) have been quite low when looking at the City of Harrisonburg and immediately surrounding areas. Many buyers are having a tough time finding a home to buy. Many houses are selling quickly because there are many buyers who want to buy them when they hit the market. I believe a significant reason why housing inventory levels are so low is because people are deciding they want to live in (or stay in or move to) Harrisonburg faster than builders are building new homes for them to purchase. Sometimes it is young adults who just graduated from JMU, EMU, or Bridgewater College and who want to stay in the area. Sometimes it is a local college grad moving back after having had a taste of life in the big City. Sometimes it is parents of these college grads turned Harrisonburg residents who are moving to Harrisonburg to be close to the grand kids. Whomever it happens to be -- more and more people are deciding they want Harrisonburg (or close to it) to be their home. And I believe they are deciding this at a faster rate than new homes are being built. Side note -- lots of rental housing is being built right now. This sort of helps -- people can rent if they can't find something to buy -- but it is not a viable long-term solution. So -- builders -- let's get to building some new homes, why don't we? It is time -- the home buying population is growing, and needing housing.... | |
Home Sales and Prices Rising, Time on Market Falling |
|
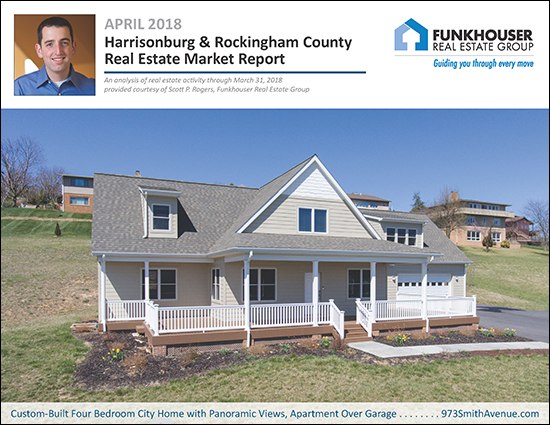 Find out about this newly listed custom-built home with amazing views: 973SmithAvenue.com. I just published my most recent monthly market report, and as usual, you can read on for an overview, download the full report as a PDF, read the entire report with commentary online, or tune in to my monthly video overview of our local housing market...  Now, let's dive into some of the latest data from our local real estate market.... 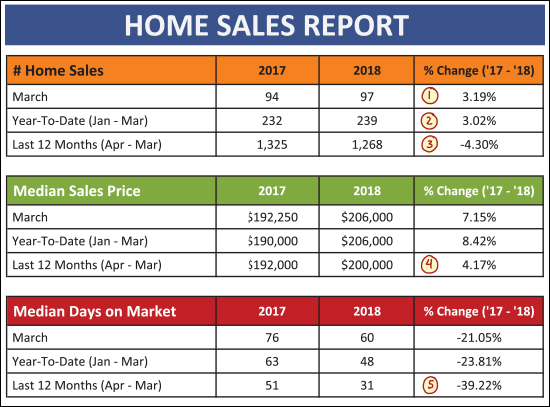 As shown above, most market indicators are quite positive....
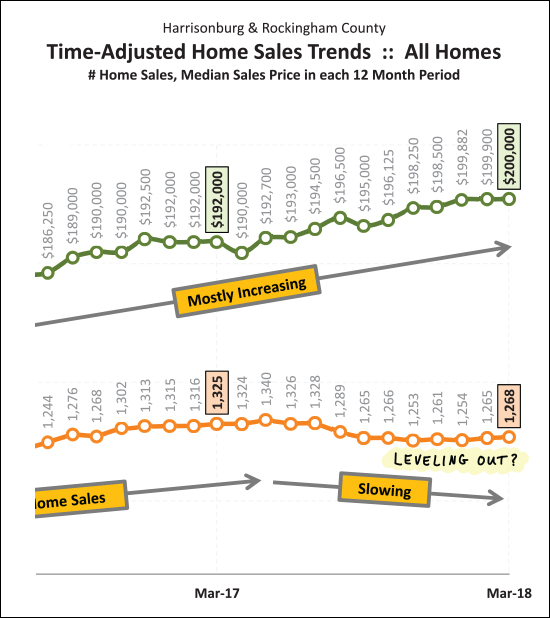 Two important items to note above....
One last tidbit....
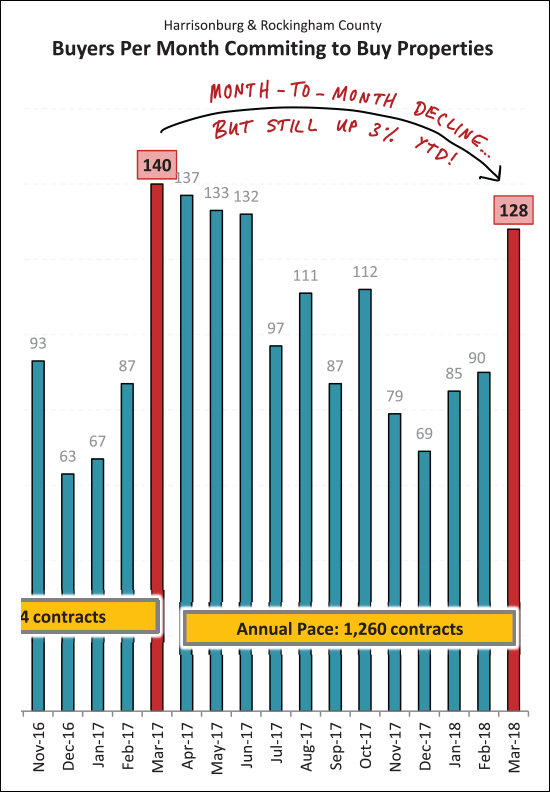
As shown above -- contract activity declined slightly in March 2018 -- but -- wait for it -- year-to-date (Jan-Mar) contract activity is still 3% higher than last year. So -- perhaps we will still have a reasonably strong month of closed sales in April and May after all. OK -- I'll stop there for now. Again, you can download the full report as a PDF, read the entire report with commentary online, or keep reading my blog in the coming days for further commentary. AND -- if you're thinking of buying or selling soon --- SELLERS -- even though it is a seller's market in many price ranges right now, you must still focus on price, condition and marketing. For further reading on buying or selling in this area, check out.... Enjoy this cold-again, hot-again month of April! | |
| Newer Posts | Older Posts |
Scott Rogers
Funkhouser Real
Estate Group
540-578-0102
scott@funkhousergroup.com
Licensed in the
Commonwealth of Virginia
Home Search
Housing Market Report
Harrisonburg Townhouses
Walk Through This Home
Investment Properties
Harrisonburg Foreclosures
Property Transfers
New Listings

