| Newer Posts | Older Posts |
Local Real Estate Market Starts to Pop in February 2018 |
|
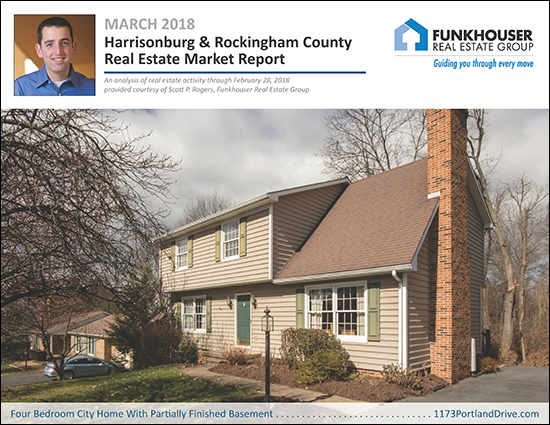 Find out about this newly listed (today!) City home at 1173PortlandDrive.com. I just published my most recent monthly market report, and as usual, you can read on for an overview, download the full report as a PDF, read the entire report with commentary online, or tune in to my monthly video overview of our local housing market...  OK -- now, let's dig into some of the main market metrics.... 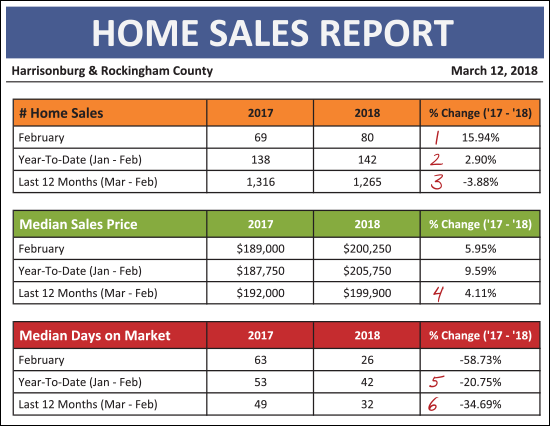 As shown above....
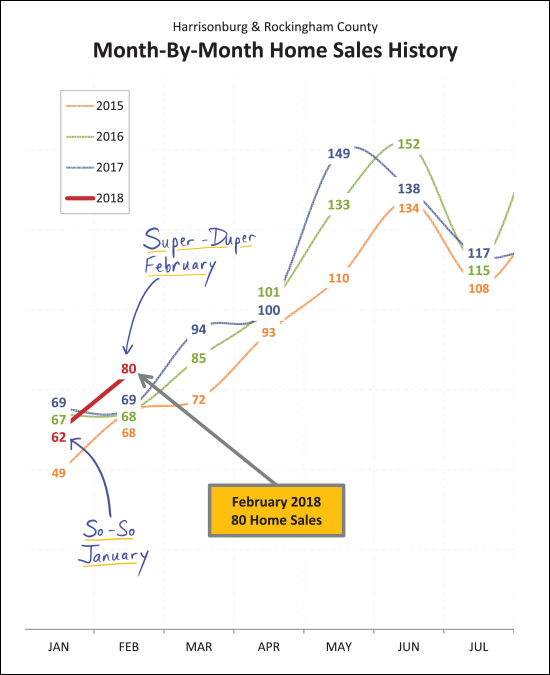
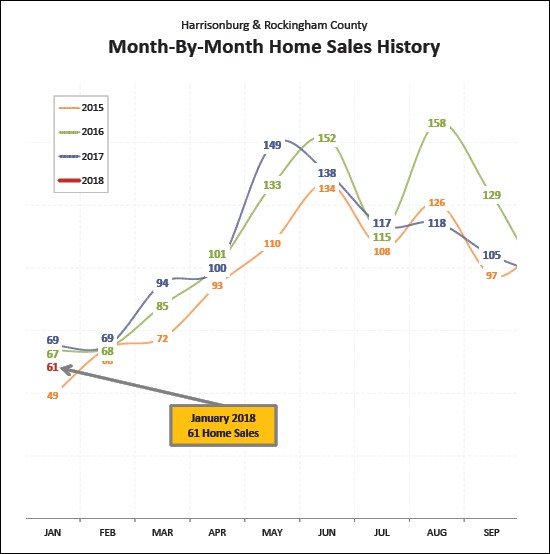
January 2018 wasn't the best January in the past few years, though it wasn't the worst either. It was in the middle of the pack, as shown above. February, however, was a strong month of sales -- jumping out ahead past the past three months of February. It seems likely we'll see between 90 and 100 home sales in March.
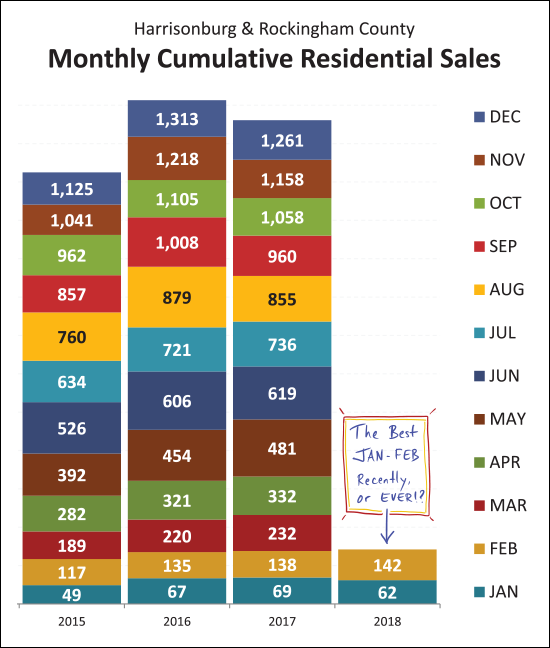
The graph above is actually a bit of a warning against too much exuberance over the BEST January-February combo we've seen in any recent year. Because, look carefully at last year -- you'll note that 2017 home sales were ahead of 2016 all the way through the end of July. So, for the first seven months of the year, it looked like we were poised to break even more records for the number of home sales in this area. And then in August and September of last year, we fell behind, and never caught back up. So -- it is exciting to see record numbers of sales in the combined first two months of this year -- but it in no way means that we'll see an actual increase in annual sales by the time December 31 rolls around.
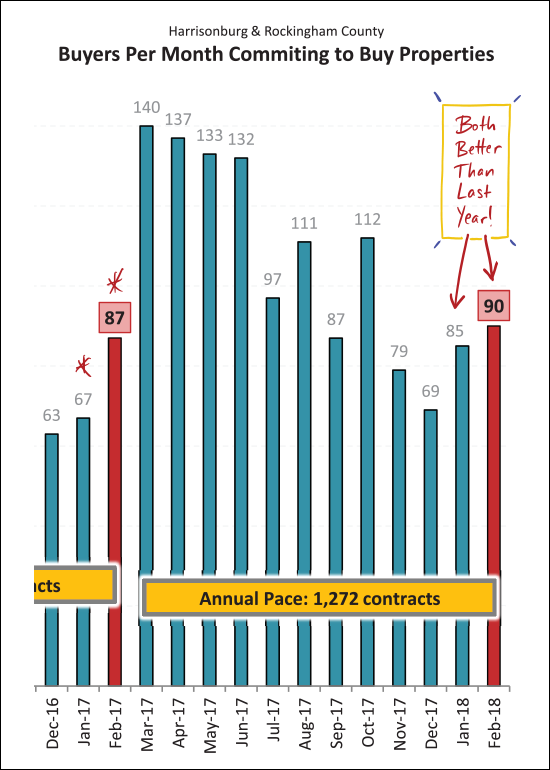
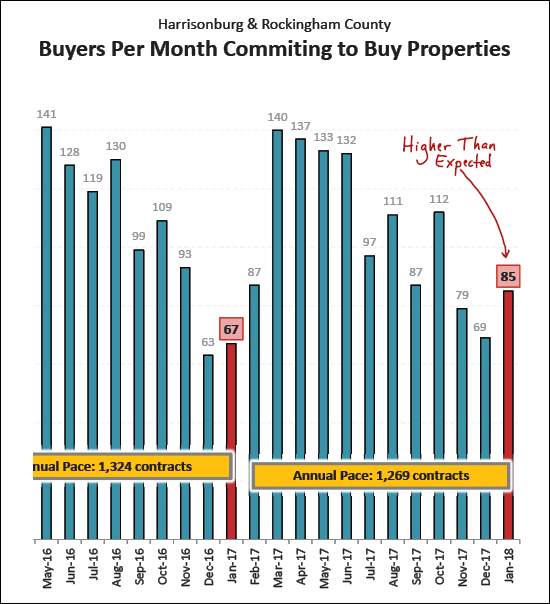
Having now brought you down to earth, I'll pump you up again. :-) The 85 and then 90 contracts seen in January/February of 2018 is a nice increase from last January/February when we saw 67 and then 87 contracts. So -- the faster (closed) sales pace may at least continue into March, and maybe April given the contracts signed to date.
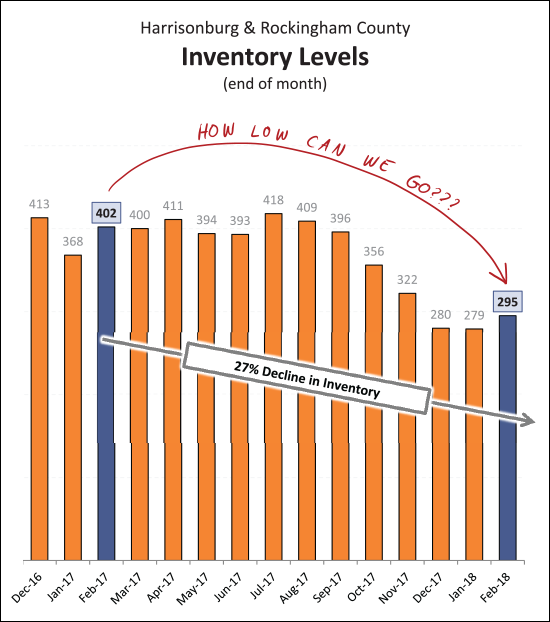
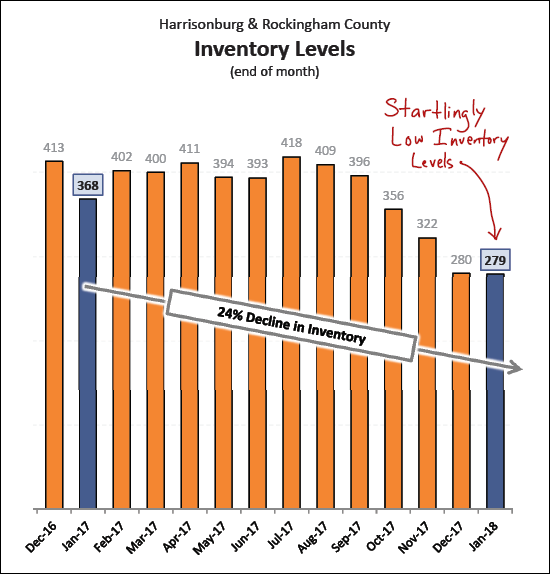
Oh yes, and don't forget about those sinking inventory levels. The decline in home sales we saw in our local market in 2017 is considered by many to have been at least partially caused by consistent declines in the number of homes listed for sale. We have seen inventory levels drop for the past few years -- and the 27% decline from 402 homes to 295 homes over the past 12 months certainly does not help provide enough homes for an increasing pool of buyers to purchase. We should (??!??) see an increase in these inventory levels as we get into the Spring market -- but that theoretical increase never substantially materialized last year.
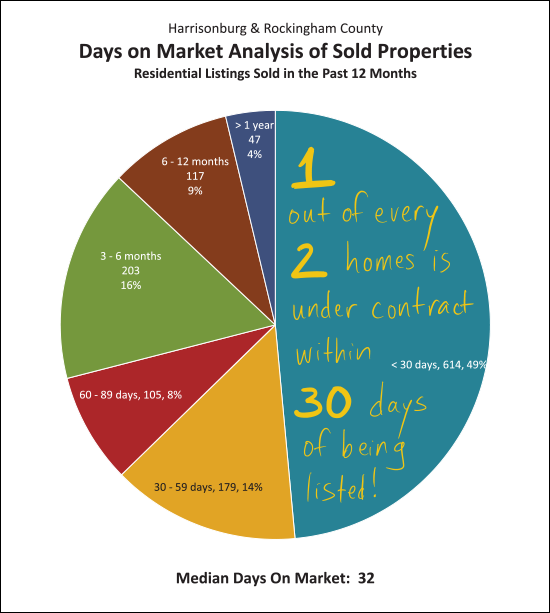
All of these market trends are tied up together, intertwined and interdependent upon each other. Here is another. One out of every two homes that sold in the past year (ok -- I rounded -- 49% if you need to know) went under contract within 30 days of being listed for sale. This low inventory environment is causing buyers to be extremely fast to view and then consider homes as they are listed for sale. OK -- I'll stop there for now. Again, you can download the full report as a PDF, read the entire report with commentary online, or keep reading my blog in the coming days for further commentary. AND -- if you're thinking of buying or selling soon --- SELLERS -- even though it is a seller's market in many price ranges right now, you must still focus on price, condition and marketing. For further reading on buying or selling in this area, check out.... Happy March! | |
Does Your House Disappear In The Spring? |
|
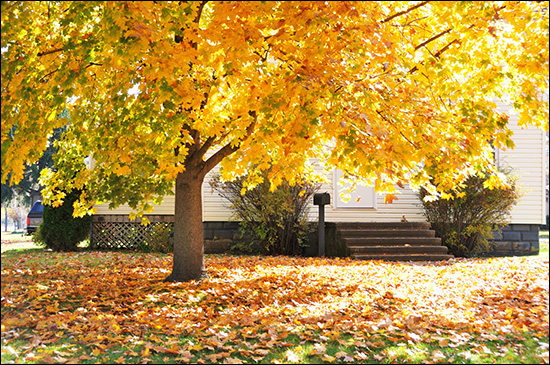 Many sellers list their homes in the Spring or Summer, which is often ideal for the timing of their move, and aligns well with when most buyers are in the market. However -- some houses are very difficult to be seen (and photographed) in the Spring and Summer because of large trees in the front yard. So -- if you're thinking of selling this Spring or Summer, and you have trees (especially large house-obscuring trees) we should discuss taking some exterior photos SOON rather than waiting until later when we can't see your house at all. Certainly, the grass isn't as green as it could be right now, and the flowers aren't blooming -- but it could be nice to see your house in the main view of your future real estate listing -- rather than just a tree. | |
Median Price Per Square Foot Keeps On Rising |
|
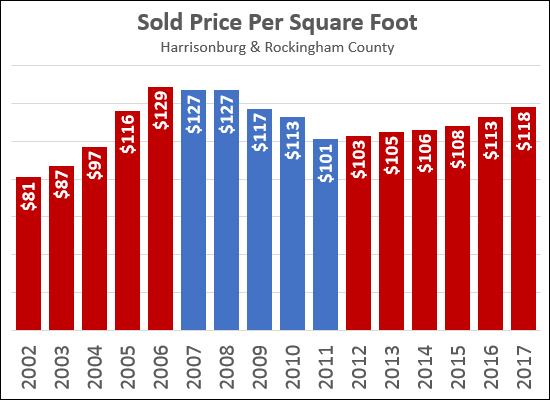 In addition to watching how the median sales price changes over time, it can be quite insightful to see how the median price per square foot of sold homes changes over time. The graph above tracks the median price per square foot of single family homes (not townhouses, duplexes or condos) in Harrisonburg and Rockingham County over the past 15 years. Price per square foot increased 59% between 2002 and 2006 during the housing boom, but then fell 22% between 2006 and 2011 as the market cooled back off. Since that time, however, we have seen a slow and steady increase in this metric -- from $101/SF in 2011 to $118/SF last year -- which marks a 17% increase over the past six years. I do not expect that we will see any drastic increases in this metric in the next few years, though an increasing number of buyers (more demand) and significantly fewer sellers (less supply) does make you wonder if we will start to see more rapid increases in sales prices, and thus in price per square foot. ALSO OF NOTE -- this metric is most helpful in understanding value trends over time -- not in calculating the value of one particular property. This median price per square foot is the mid point of many very different homes -- new homes, old homes, homes with garages, homes without garages, homes with basements, homes without basements, homes with acreage, homes on small lots, etc. A median price per square foot can be more helpful in understanding the potential value (or value range) of a single property if we pull that median value based on a smaller data set of more properties more similar to the single property. | |
City Homes Selling Three Times Faster This Year Than Last |
|
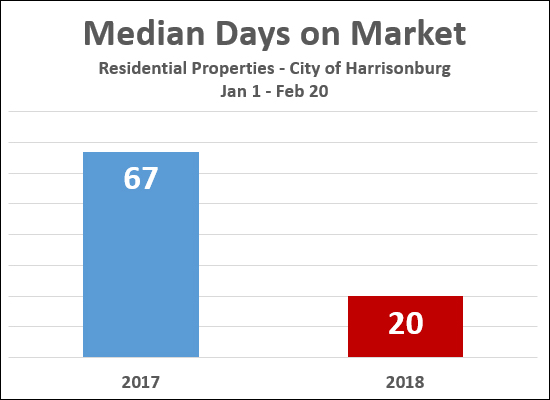 Here is a somewhat startling statistic.... Looking at the start to last year (Jan 1 - Feb 20) the homes that sold (went under contract) in the City of Harrisonburg did so with a median "days on market" of 67 days. This year during the same timeframe (Jan 1 - Feb 20) the homes that sold (went under contract) in the City of Harrisonburg did so with a median "days on market" of 20 days. So -- homes are selling (more than!) three times faster than they were last year. Wow! And -- a few more homes are selling.... Contracts between Jan 1 and Feb 20:
Buckle up! It seems like it might be a fast paced market for much of 2018. Low inventory levels and rising interest rates certainly are contributing to this. | |
Are Sellers Negotiating Less On Price? |
|
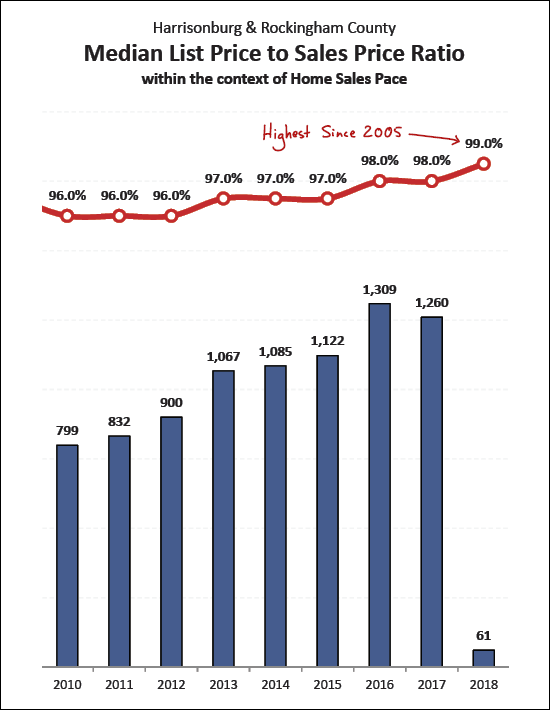 This graph above shows the median list price to sales price ratio (red line) over the past 15 years as compared to the overall pace of home sales. At the peak of the housing boom (2004-2006) sellers were able to obtain a median of 99% of their asking price --- up from a median of 97.7% in 2001 before the pace of home sales started escalating. Then, when the pace of home sales slowed (through 2010) this metric dropped to 96%, where it stayed for three years. Sellers started selling for slightly more in 2013-2015 when they could obtain 97% of their list price. This increased to 98% in 2016, held steady in 2017, and is flirting with 99% in 2018. Of note -- the 99% figure in 2018 is based on only one month of data - January 2018. Stay tuned to see how this adjusts as we continue through 2018. | |
Local Home Sales Off To Slightly Slow Start In 2018 |
|
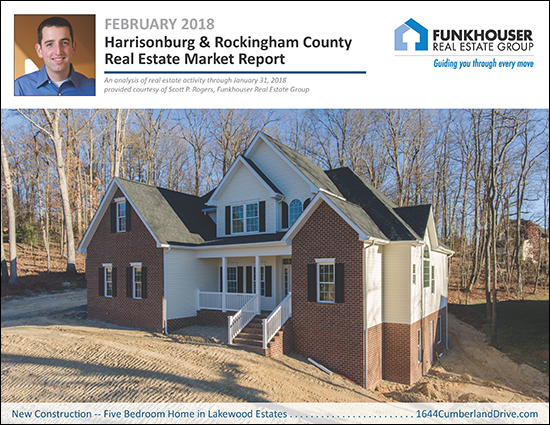 Find out more about this newly built home in Lakewood Estates at 1644CumberlandDrive.com. I just published my most recent monthly market report, and as usual, you can read on for an overview, download the full report as a PDF, read the entire report with commentary online, or tune in to my monthly video overview of our local housing market... 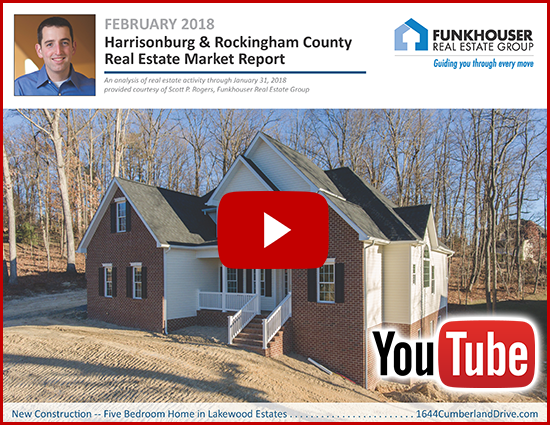 OK -- now, let's take a look a few of the main indicators for our local housing market.... 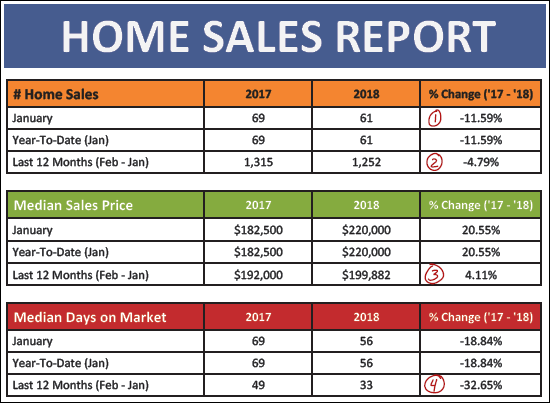 As shown above....
As shown above, January 2018 home sales were right in the middle of the pack as contextualized by the previous three years. And in some ways, we should expect to see around 70 home sales next month -- however....
Contract activity in January 2018 was much stronger than could have been expected. Buyers (and sellers) signed 85 contracts in January -- as compared to only 67 last January. Thus, it is reasonable expect we'll probably see somewhat of a bump in home sales in February.
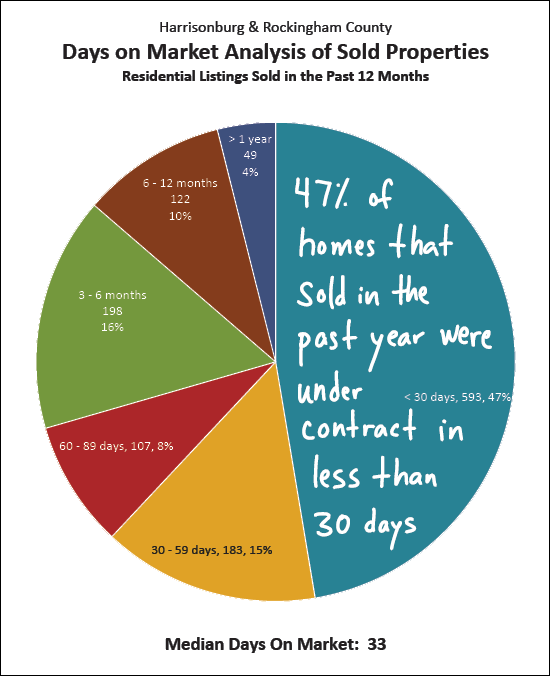 And perhaps that is why so many homes are selling so quickly. Almost half of the homes that have sold in the past year have gone under contract within 30 days of coming on the market! OK -- I'll stop there for now. Again, you can download the full report as a PDF, read the entire report with commentary online, or keep reading my blog in the coming days for further commentary. If you're thinking of buying or selling soon --- SELLERS -- even though it is a seller's market in many price ranges right now, you must still focus on price, condition and marketing. For further reading on buying or selling in this area, check out.... | |
Will Single Family Home Sales Ever Return to 2016 Peak? |
|
 Apparently, 2016 was a special year for single family home sales in Harrisonburg and Rockingham County. After three years straight (2013, 2014, 2015) of seeing a very consistent number of single family homes in the City and County (813-819) there was a 20% increase in 2016 to 978 home sales! Then, in 2017 -- sales of single family homes fell 10% to 884 sales. Hmmm..... This was likely at least partially an inventory issue....
And inventory levels got even worse during 2017....
All that is to say that I would be shocked if we saw more than 978 home sales in 2018. I think we may have peaked in 2016 -- and we might not return to that peak for some time. Perhaps some home builders need to start creating new single family home supply in this area?? | |
When Will Home Buying Activity Start in Earnest? |
|
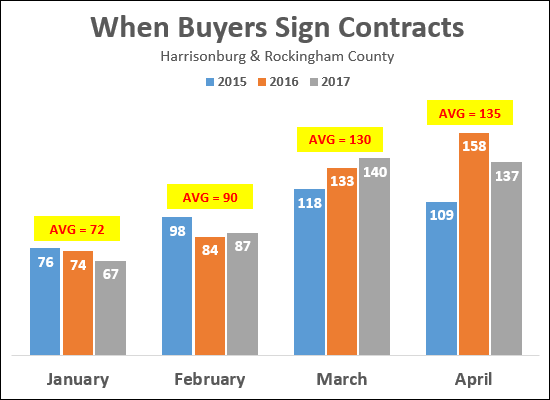 It is no surprise that buying activity (signing contracts, not closings) slows down over the Winter. As shown above -- an average of 72 buyers sign contracts in January, which then jumps up to 90 in February, and then an even larger jump in March to an average of 130/month. So, we're going to say the March is when we first seem a big jump in buyer activity. For that reason, many sellers wait until March (or even April) to put their homes on the market -- though the Spring market brings more competition from other sellers in addition to meaning that we'll start to see more buyers. Of note -- staying relatively true to form, there have been 75 contracts signed thus far in January 2018. Who knows, maybe we'll come out slightly ahead? | |
Which price range of homes have been hit the hardest with reduced inventory levels? |
|
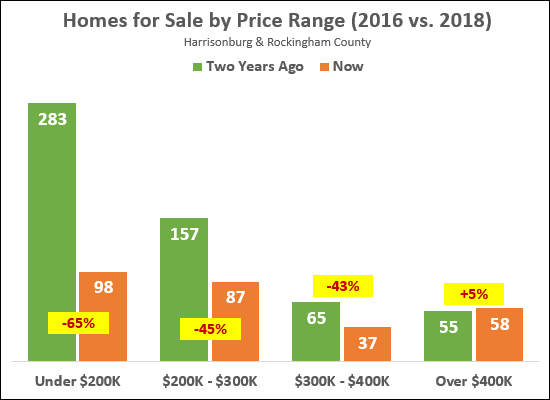 Clearly, the under $200K market is extremely tight right now -- with a sharp (65%) decline over the past two years. Some of this is the lack of availability of this housing because more people want to buy these homes than sellers want to sell them -- and some is a result of increases in property values over the past two years, resulting in some "just under $200K" homes becoming "just over $200K" homes and falling into the next price bracket. As shown above, there has also been a significant (45%, 43%) drop in housing inventory levels between $200K-$300K and $300K-$400K. The only stable price range has been the "over $400K" price range where there are just about the same number of homes for sale now (58) as there were two years ago (55). I expect that inventory levels under $200K will drop even lower over the next 12 months You can find out more about the Harrisonburg and Rockingham County real estate market by visiting....  | |
January Inventory vs. Past Year of Home Sales |
|
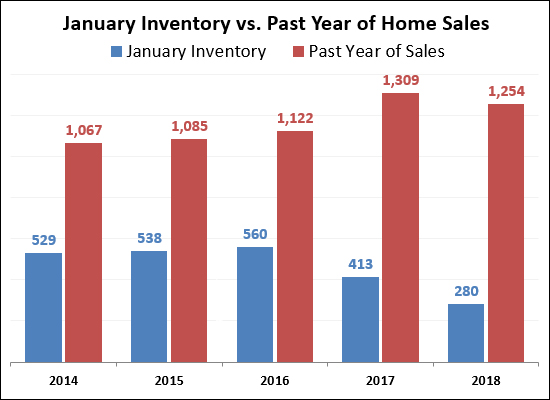 In 2014, 2015 and 2016 we started off the year with enough homes actively listed for sale to last us for right around six months -- or a bit longer. This balance (a six month supply of housing inventory) is considered by many analysts to be an indicator of a balanced housing market. Last year (2017) was quite different. Inventory dropped 26% from 2016 to 2017 and sales rose 17%. As you would, thus, expect - we started off last year (Jan 2017) in a slightly different spot, as shown above. Which is, arguably, why we ended up seeing slightly FEWER home sales last year -- sales declined 4% in 2017 from 1309 to 1254. So, now, starting of 2018 -- are things any better? No. There are even FEWER homes for sale now than there were a year ago. Inventory levels dropped another 32% between January 2017 and January 2018 -- and the current inventory of active listings (280 homes) will / would only last us 2.7 months -- as compared to that balance point of six months. So, what then will this lead to in 2018? I am predicting slightly fewer sales than last year -- and likely faster sales -- and at slightly higher prices. Stay tuned! | |
In 2017, Median Sales Price Finally Surpasses 2007 Peak |
|
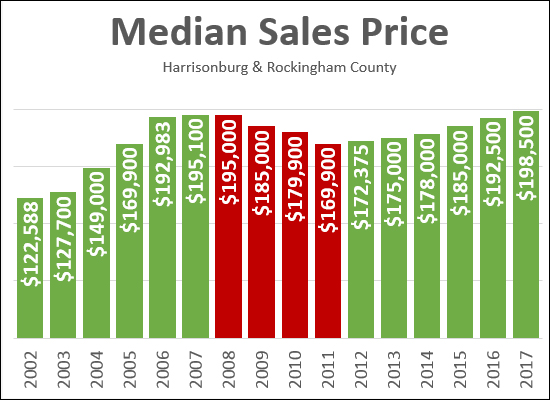 It should be noted, perhaps with some fanfare, that in 2017, the median sales price in Harrisonburg and Rockingham County finally surpassed the prior peak seen in 2007. Yes, that 2007, the one after a rapid run up of sales prices as a result of a largely nationwide real estate BOOM, followed thereafter by a decline in sales prices, at different speeds in different areas. But now, in 2017 -- ten years later (!!!!) -- we finally hit a median sales price of $198,500 -- slightly edging out that previous high of $195,100 seen in 2007. Thank goodness. Now, folks who bought in 2006, 2007 or 2008 might finally not be underwater based on their original purchase price. It's been a long time coming.... | |
Local Home Values Rise in 2017 |
|
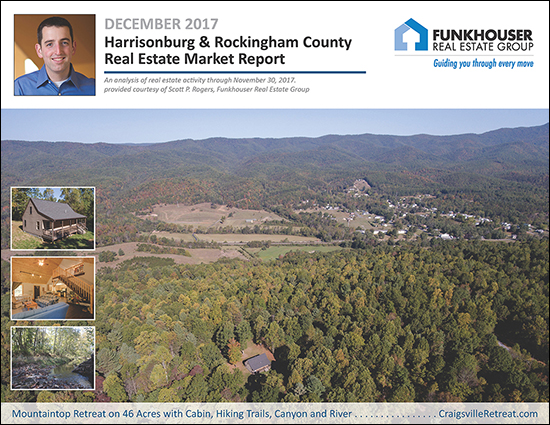
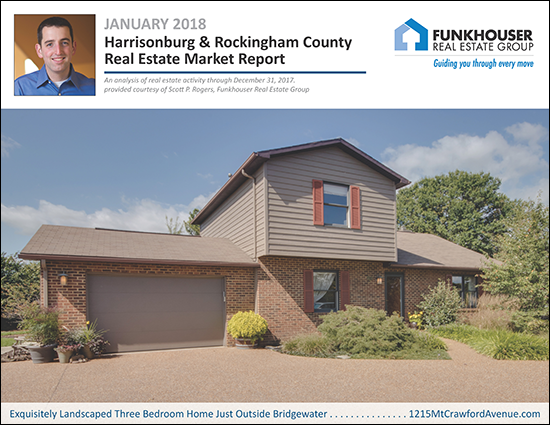 Find out more about this stellar home just outside Bridgewater at 1215MtCrawfordAvenue.com. I just published my most recent monthly market report, and as usual, you can read on for an overview, download the full report as a PDF, read the entire report with commentary online, or tune in to my monthly video overview of our local housing market...  OK - now, let's dive into the market data behind this month's report.... 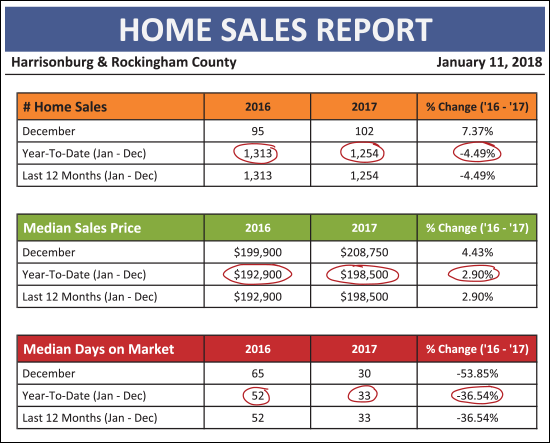 As shown above....
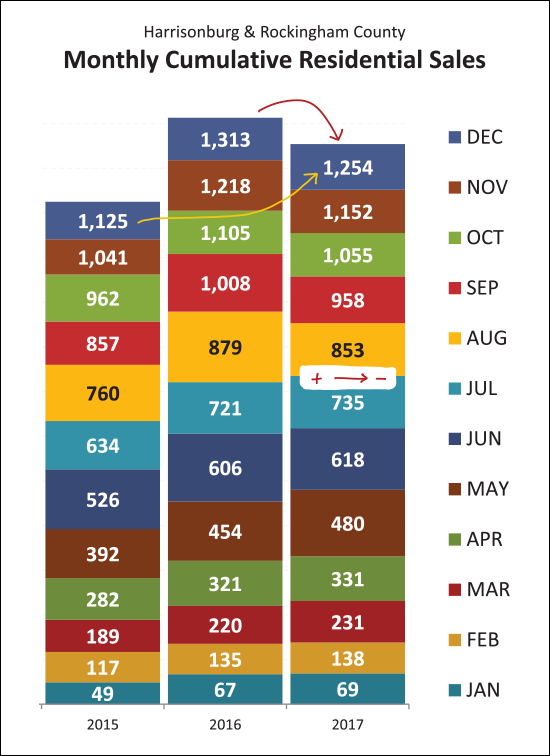 Two observations here (above)....
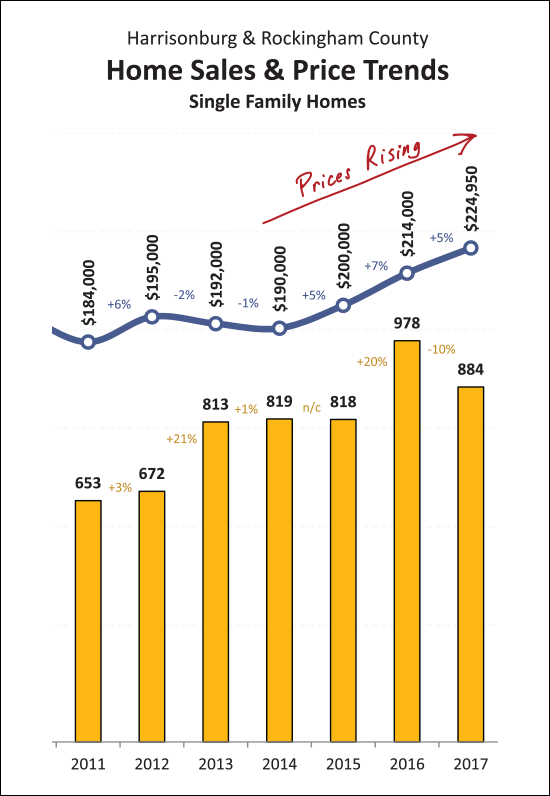
Perhaps the truest analysis of the trends in housing values -- single family homes on their own. The waters can be muddied, a bit, on townhouses, duplexes and condos -- with investors buying the properties as rentals. Most single family homes are bought as residences, and thus there are fewer external factors that affect these home sales. As noted above, there were 10% fewer single family home sales in 2017 -- but the median price rose for the third year in a row, to $224,950. This is a good indicator that home values are rising in our area. And finally, the disturbing statistic I was hesitant to even go look for this month....
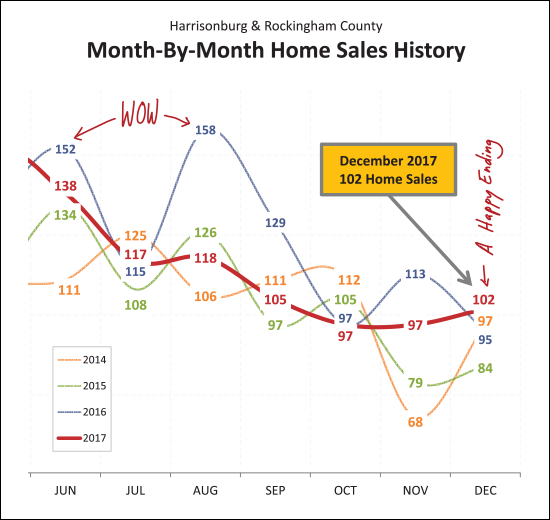
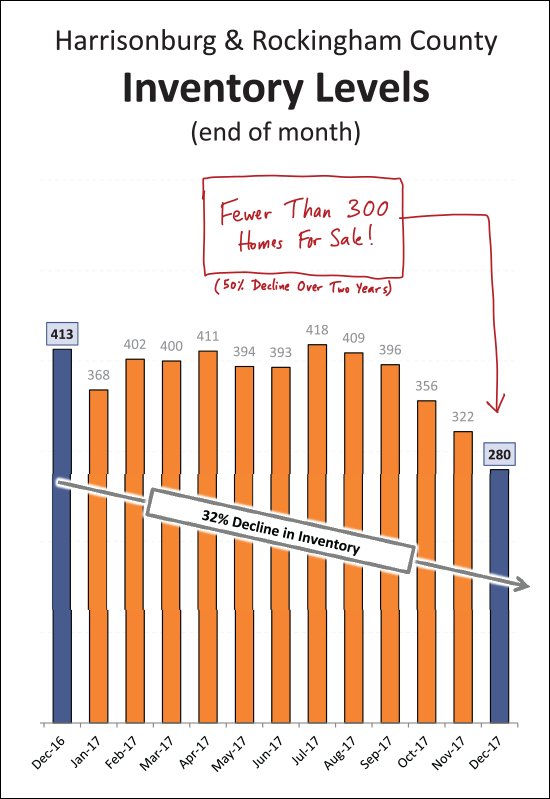
Indeed -- after free falling for most of 2017, the number of homes for sale in Harrisonburg and Rockingham County has now plunged below 300 -- to only 280 homes for sale as of this morning!?! Two crazy further notes -- there are only 46 townhouses/duplexes/condos listed for sale in the entire City/County -- and there are only 64 homes for sale in the City of Harrisonburg!?! OK -- I'll stop there for now. There is plenty more in my full market report, so feel free to download it as a PDF, read the entire report online, or watch/listen to a video overview of this month's report. And, my reminders for buyers and sellers last month still apply.... SELLERS -- even though it is a seller's market in many price ranges right now, you must still focus on price, condition and marketing. For further reading on buying or selling in this area, check out.... | |
My Predictions for the 2018 Real Estate Market |
|
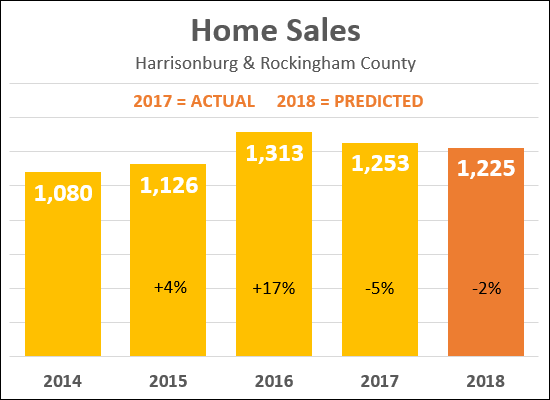 As is my annual tradition, I am making some predictions about what we'll see in the Harrisonburg and Rockingham County real estate market in 2018. As you'll note below, I am optimistic about the coming year as it pertains to home values -- but as shown above, not so much when it comes to sales volume. Just as we saw a 5% drop in sales in 2017 -- I believe we will see a further decline in the number of home sales in 2018. I am predicting a 2% year-over-year decline in the number of homes being sold. This will largely be a result of a lack of supply -- not a lack of demand. I believe we will still see high levels of buyer interest in many or most price ranges, but a lack of housing supply (listing inventory) will keep us from seeing as many home sales as we did in 2016 and 2017. 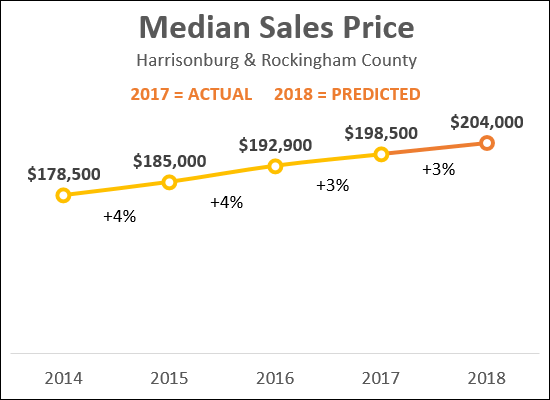 As shown above, I am predicting another 3% increase in the median sales price during 2018. Over the past several years we have seen steady increases in the median sales price, and I believe that trend will continue, partially as a result of continued high demand for housing and low supply of housing. My hope is that we do not see a significant increase (greater than 6%) in the median sales price, as these types of increases are typically short-term, cannot be sustained, and can lead to future downward corrections. Those are my predictions, what about for you? Email me (scott@HarrisonburgHousingToday.com) and let me know where you think our local market will go in 2018. And keep up with all the market data between now and December 31 by signing up to receive my monthly housing market report by email if you are not already receiving it. | |
Comparing My 2017 Housing Market Predictions To Reality |
|
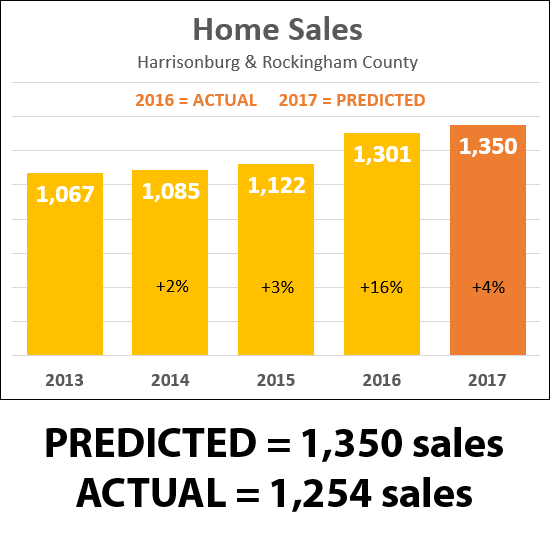 As shown above, I was horribly inaccurate with my prediction of how many home sales we would see in 2017. After a 16% increase in the pace of sales between 2015 and 2016 I thought I was being sufficiently conservative to only point to a potential 4% increase in the pace of sales between 2016 and 2017. Perhaps what I did not fully account for was the limiting impact of low inventory levels -- which I believe are a key reason why we did not see more home sales in 2017. So -- not only did we not see 1350 home sales in 2017 (as I predicted) we also did not see 1301 home sales (the 2016 total). We ended up with right around 1,254 home sales for 2017. Now, let's see how I did in predicting market values in 2017.... 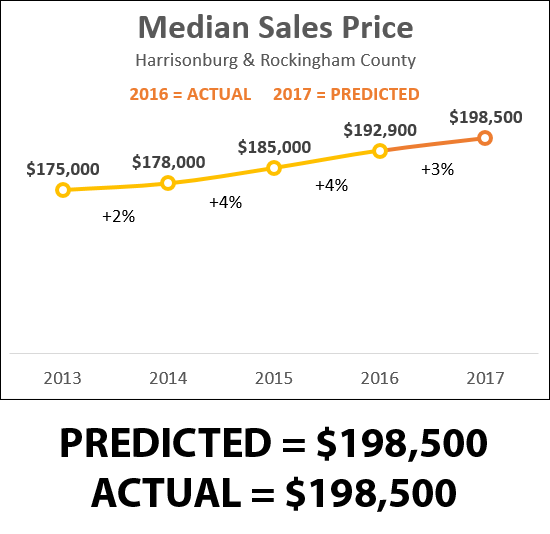 Woah! I think I'm going to say his prediction mattered much more than the first. :) As you can see -- I predicted that we would see the median sales price climb from $192,900 up to $198,500 in 2017. And --- it did! The median sales price for the 1,254 sales reported thus far in the Harrisonburg-Rockingham MLS show a median sales price of.... $198,500! That means (as conveniently shown in this one year old graph above) we ended up seeing a 3% increase in median sales prices -- only slightly below the 4% increases seen in 205 and 2016. Stay tuned for some predictions for 2018 in the coming days! | |
Home Sales Slow By (perhaps as much as) 5% in 2017 |
|
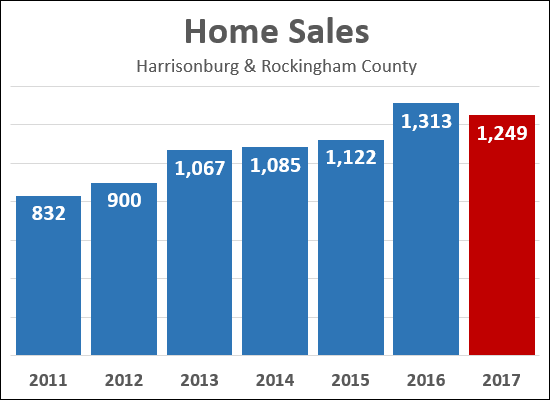 All home sales have not yet been reported but it is now clear that we did not clear the 1300 sales/year mark in Harrisonburg and Rockingham County last year. With 1,249 home sales recorded in the MLS thus far, we are likely to see that figure rise a bit more over the next few days, but not by much. This is a slight drop off compared to last year after several years of increases over previous years....
Stay tuned for my full market report in the next week or so, as well as predictions for the 2018 housing market. Oh, and HAPPY NEW YEAR! | |
Introducing HarrisonburgNeighborhoods.com |
|
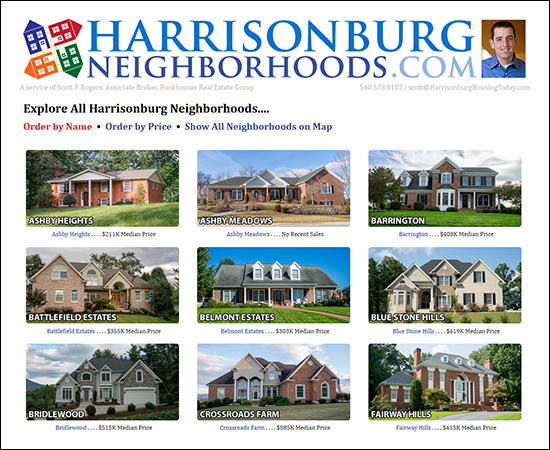 Happy New Year! On this absurdly chilly morning, I'm excited to announce a brand new website that I hope you will find to be a helpful resource for you as you buy real estate, sell real estate, or study the real estate market.... HarrisonburgNeighborhoods.com On this new website, you can explore 34 neighborhoods in and surrounding Harrisonburg..... 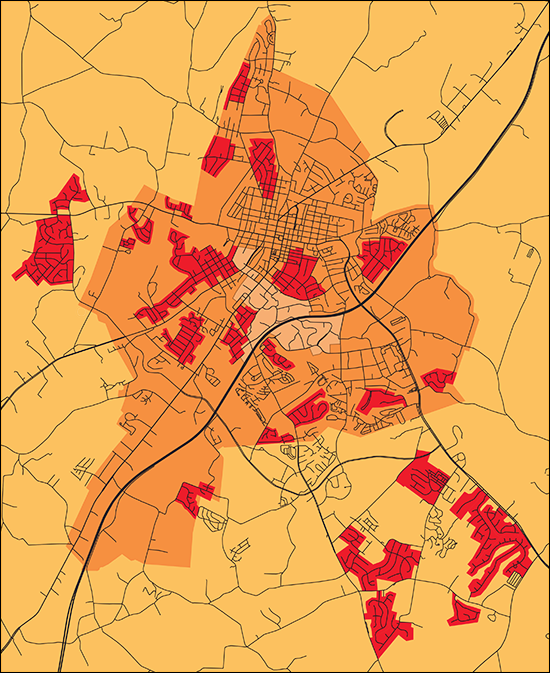 Here is an overview of the type of information you will find about each of these 34 neighborhoods.... First, an aerial view of each neighborhood.... 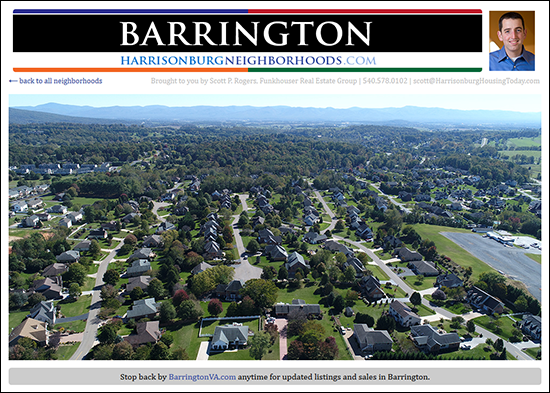 Next, a statistical overview and analysis of the neighborhood.... 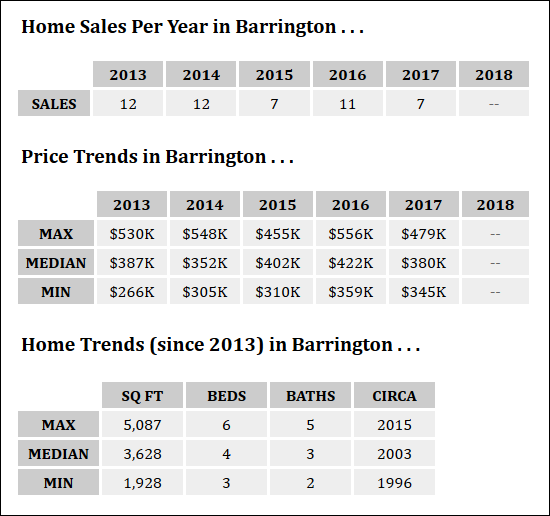 Next, all active (and pending) listings in the neighborhood.... 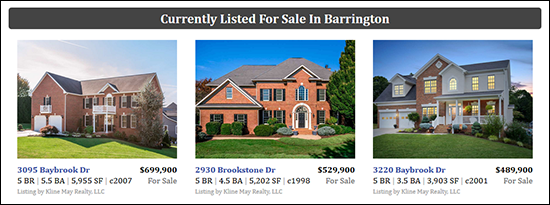 Next, all home sales from the past year, plus an option to look back even further.... 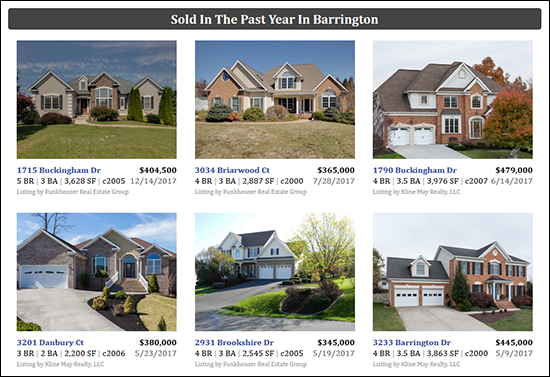 And finally -- one of the most exciting features of this new website....  Indeed -- as shown above -- for any of the neighborhoods featured on this new website, you can sign up to receive email alerts of all new listings and home sales in the neighborhood. I recommend that you sign up to receive email alerts for the neighborhood in which you currently live -- as well as the neighborhood where you are considering a home purchase, if there is such a neighborhood. Oh, and yes, the new website is mobile friendly and will give you helpful info on the go as well.... 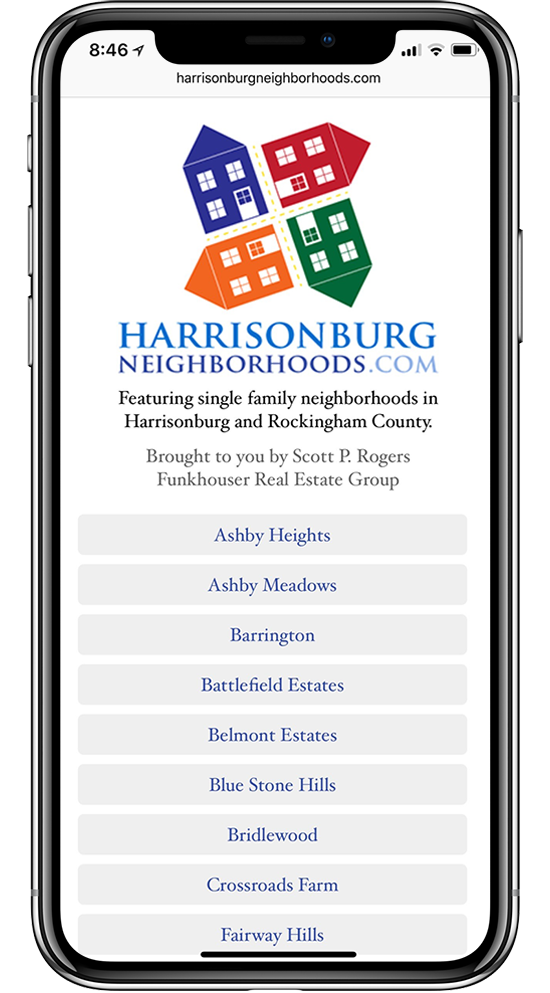 So -- what are you waiting for -- go check it out at HarrisonburgNeighborhoods.com and let me know what questions you have or recommendations for further improvements. Here's to an exciting 2018! | |
Price Per Acre of Land Sold in Rockingham County |
|
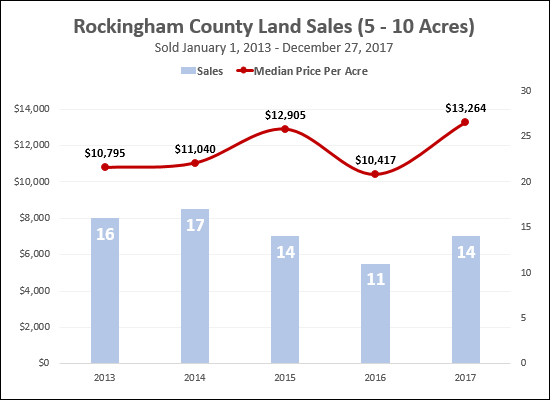 As shown above, the price per acre of 5 - 10 acre tracts has increased over the past several years to a median of $13,264 per acre. We are consistently seeing between 10 and 20 (between 11 and 17) of these parcels selling each year. 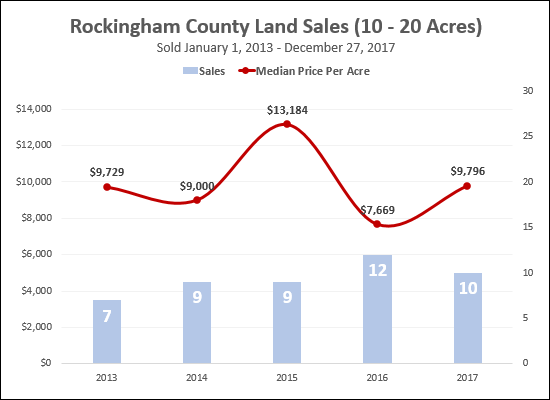 The median price per acre of 10 - 20 acre tracts jumped up to $13,184 in 2015, but settled back down in 2016 to $7,669 and has now risen again in 2017 to $9,796. The small-ish number of sales per year in this price range leads to more variability in the median sales price per acre depending on which particular tracts sell in any given year. 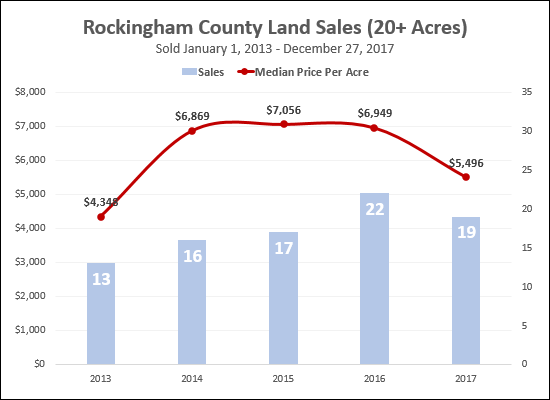 We saw almost 20 sales over 20 acres this year -- but the median price per acre fell from $6,949 (last year) to $5,496. | |
Bidding Wars over City Townhouses |
|
 The last few townhouses listed for sale in the City of Harrisonburg (under $175K, built since 2000) have gone under contract QUICKLY -- with multiple offers. So far, we have not seen a wild uptick in median prices of townhouses based on this excessive demand (and limited supply) but we could start to see that at some point.... Median Townhouse/Condo Sales Price in Harrisonburg and Rockingham County:
If you are fortunate enough to own one of these -- and be in the market to sell it -- you should not have difficulty in securing a buyer. If you are unfortunate enough to want to buy one of these -- bid early, bid aggressively, and if you keep missing out on properties, be prepared to bid often. | |
Fewer and Fewer Foreclosures |
|
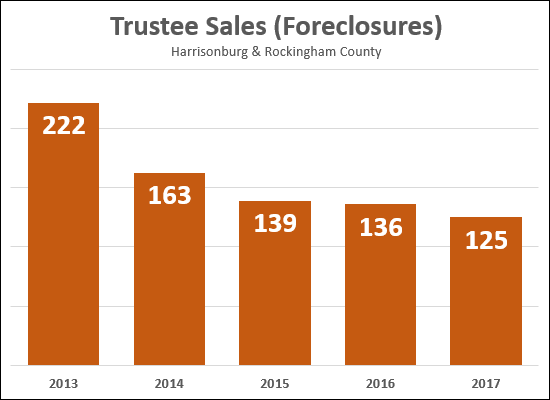 Well, here's a good indicator that our local housing market continues to become healthier over time -- as shown above, the number of foreclosure sales per year has continued to decline over the past several years. To put these into an even larger context:
All in all, it is a good sign for our local housing market when the number of foreclosures per year declines. It means more homeowners are able to stay in their homes, and make their mortgage payments, which is a general sign of a stronger local economy. | |
Median Sales Price Poised To Increase 3% in Harrisonburg, Rockingham County in 2017 |
|
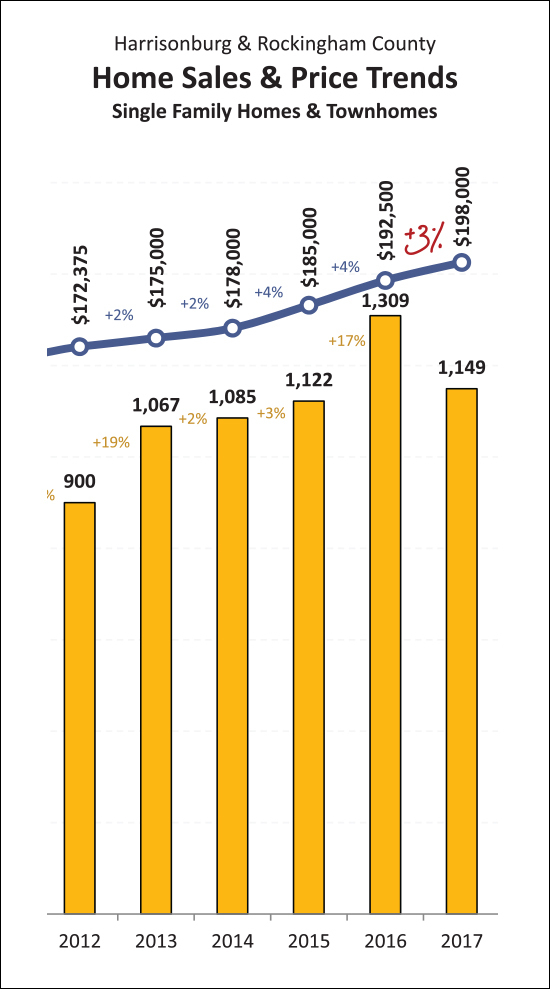 With 11 out of 12 precincts reporting -- wait, no, that was earlier this week -- With 11 out of 12 months behind us this year, it seems that the median sales price of residential properties (single family homes, duplexes, townhomes, condominiums) will have increased by 3% in 2017 to $198,000. A bit more context, not shown above....
So -- we might finish the year with the highest median sales price seen anytime in the past fifteen years -- and ultimately, the highest median sales price, ever, in Harrisonburg, Rockingham County. Read more about our local housing market via my market report published yesterday.... | |
| Newer Posts | Older Posts |
Scott Rogers
Funkhouser Real
Estate Group
540-578-0102
scott@funkhousergroup.com
Licensed in the
Commonwealth of Virginia
Home Search
Housing Market Report
Harrisonburg Townhouses
Walk Through This Home
Investment Properties
Harrisonburg Foreclosures
Property Transfers
New Listings

