| Newer Posts | Older Posts |
Local Home Sales Slow, As Inventory Declines, But Prices Are Rising! |
|
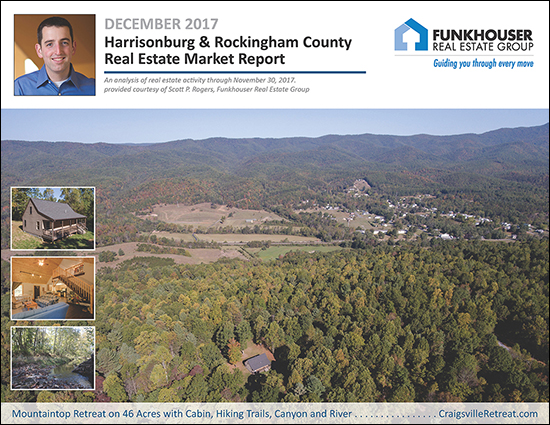 Find out more about this Mountaintop Retreat on 46 acres with a cabin, hiking trails, canyon and river here. I just published my most recent monthly market report, and as usual, you can read on for an overview, download the full report as a PDF, read the entire report with commentary online, or tune in to my monthly video overview of our local housing market...  Now, let's take a closer look at some of this month's data.... 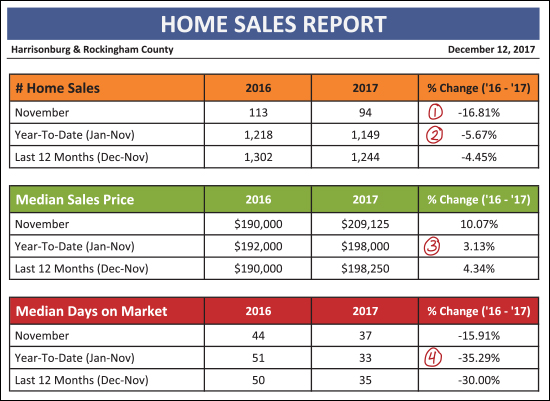 As can be seen above....
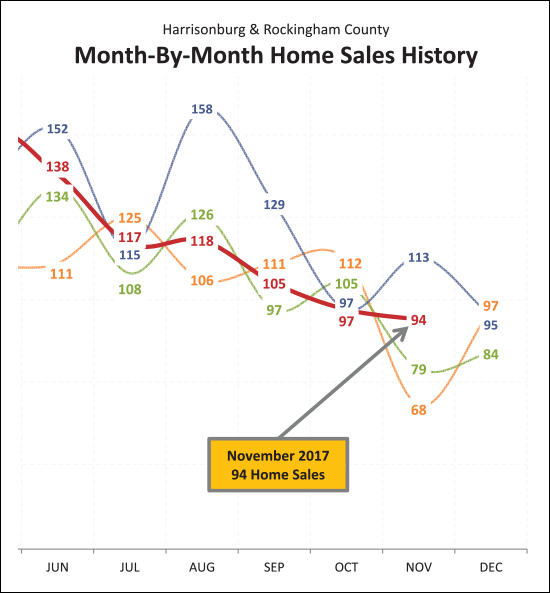
Last year certainly was interesting!?! Or odd!?! Last August, September and November were OFF THE CHARTS as far as a record number of home sales for those months -- which then makes this year's sales trajectory seem as slow as mud in August, September and November. This November's sales were a good bit higher than in 2014 and 2015 -- but were solidly below November 2016.
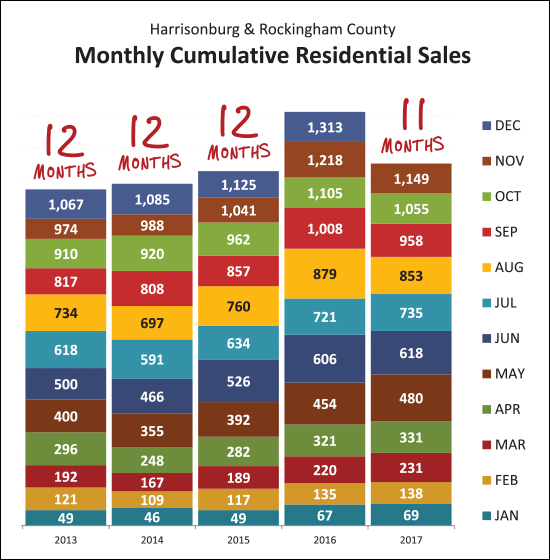
So -- despite the fact that 2017 is hiding in the shadows of a towering year of sales in 2016 -- it is interesting to note that the 11 months of home sales thus far in 2017 (all 1,149 of them) has already surpassed the full 12 months of sales seen in 2013 (1067 sales), 2014 (1085 sales) and 2015 (1125 sales). As such -- while total home sales will likely be 5% to 6% lower this year than last -- that will still mark a solid improvement as compared to any other recent year.
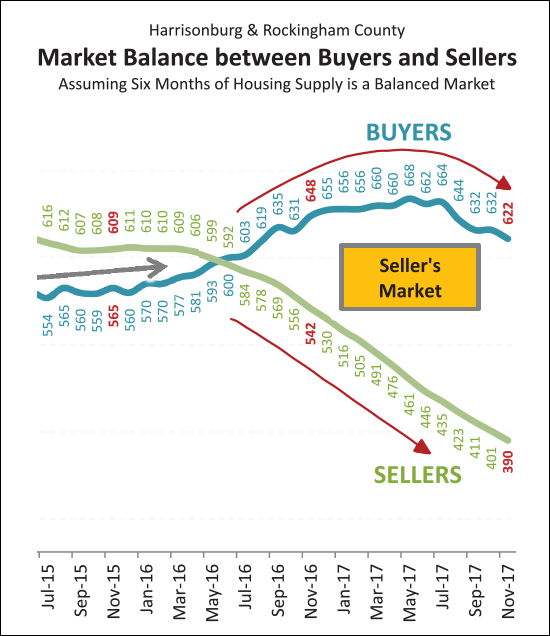
After quite a few years of steady increases in buyer activity -- we are starting to see a decline. Over the past six months we have seen buyer activity taper off and start to decline. I believe this is a direct result of the drastic reductions in the availability of homes for those buyers to buy. As the number of sellers in the market at any given time has declined, eventually that also resulted in a reduction in the pace of buying activity.
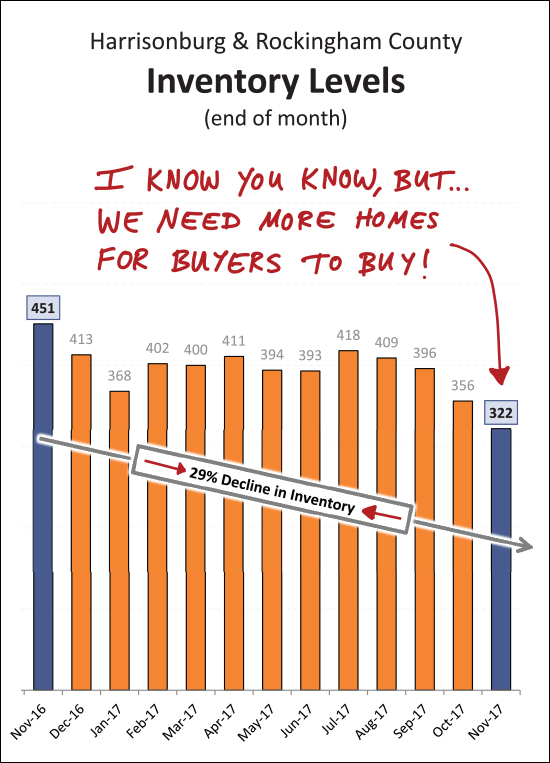
Yeah, so, about those inventory levels. They are low and getting lower!?! And, realistically, when and how do we think that would or could change? In theory, inventory levels will rise this coming Spring -- except they didn't during 2017. Looking back, the end of last November was the highest inventory level we saw for the following 12 months!?! So -- hmmm -- absent any outside factors (new home construction, anyone?) it is possible that the current inventory level (322 homes for sale) could be the highest inventory level we will see for the next 12 months!?! Stop and think about that for a moment....
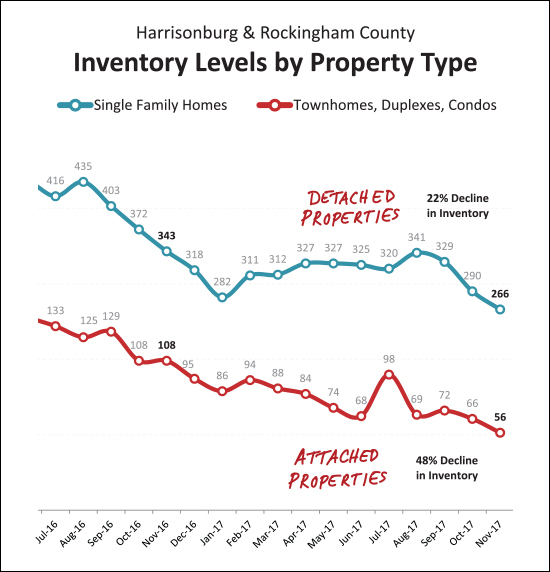
Somewhat interestingly, as shown above, there has been a larger (proportional) decline in inventory levels for attached properties (townhouses, duplexes, condos) than for single family detached properties. There are now only 56 townhouse/duplex/condo properties available for sale in all of Harrisonburg and Rockingham County! And finally -- one last look at some interesting trends....
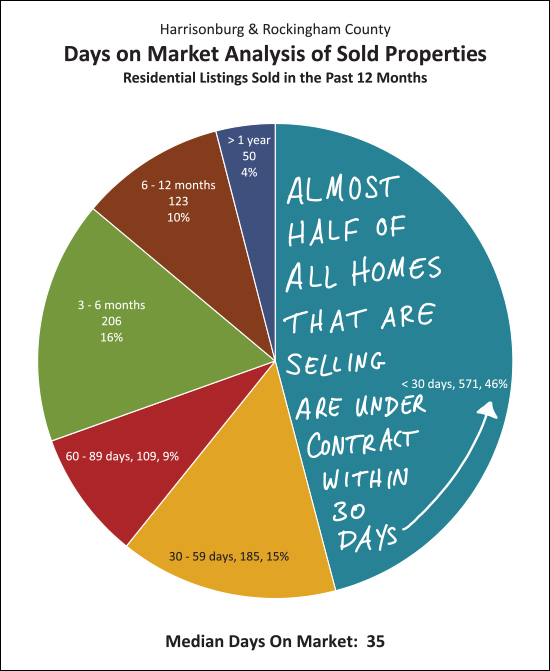
As shown above, nearly half (46%) of homes that are selling (not of all that are listed) are selling (going under contract) within 30 days of hitting the market. So -- yes -- the market is moving pretty quickly in many locations and price ranges! OK -- I'll stop there for now. There is plenty more in my full market report, so feel free to download it as a PDF, read the entire report online, or watch/listen to a video overview of this month's report. And, my reminders for buyers and sellers last month still apply.... SELLERS -- even though it is a seller's market in many price ranges right now, you must still focus on price, condition and marketing. For further reading on buying or selling in this area, check out.... | |
Realtor Association and Madison Center for Community Development Publish Local Housing Needs and Market Analysis |
|
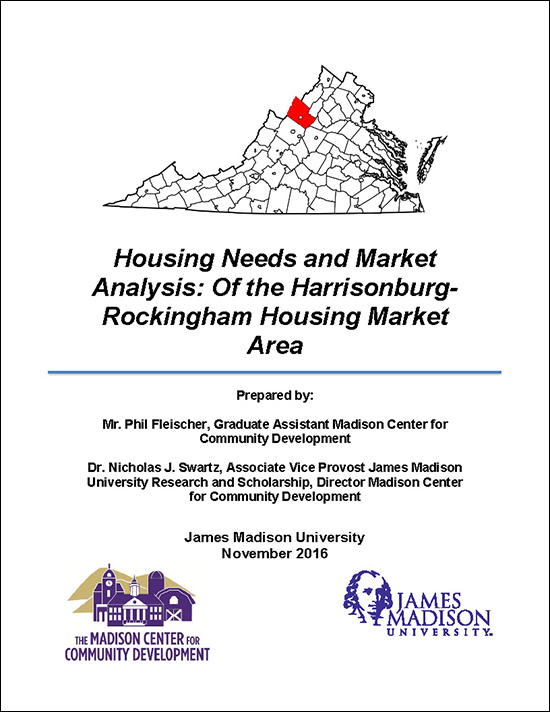 The Harrisonburg-Rockingham Association of Realtors and the Madison Center for Community Development recently (Nov 2016) published a Housing Needs and Market Analysis of the Harrisonburg and Rockingham County area. There is a LOT of data, analysis and insight in this report -- so feel free to download and read it if this is of interest to you -- or I'll bring some further highlights from it to my blog in the near future. Download the report here. | |
Contract activity slightly stronger than expected in October 2017, but Winter is coming! |
|
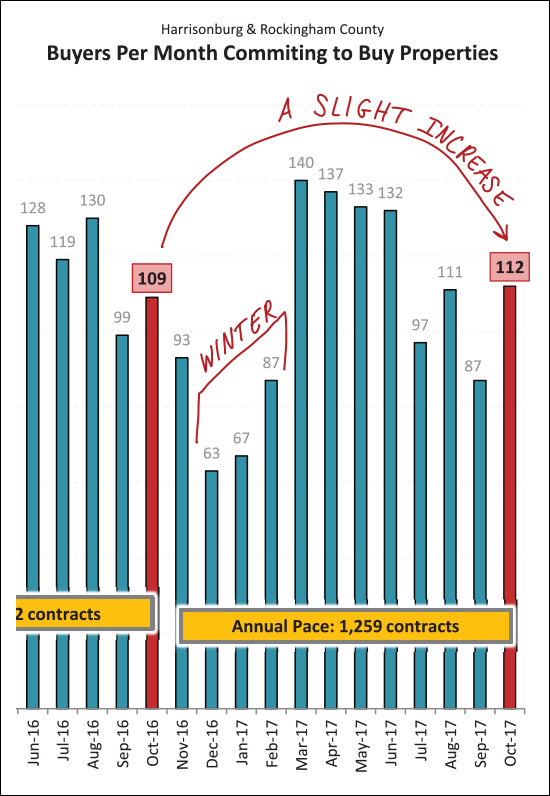 Contract activity in July, August and September 2017 (295 contracts) was a good bit slower than last year when there were 348 contracts during that same timeframe. Some of this decline in the number of contracts being signed is certainly a result of lower inventory levels. Thus, it was somewhat of a surprise that contract activity in October 2017 (112 contracts) was slightly higher than last October when there were only 109 contracts signed. So -- a slight uptick in buyers being able to successfully negotiate deals with sellers -- BUT don't forget, Winter is coming! Over the past eight months there have been an average of 119 contracts signed per month. If last Winter (+/-) is any indication, that is likely to drop slightly in November, and then much more significantly in December, January and February. Last Dec-Feb, there were an average of 72 contracts signed per month -- a good bit less than the 119/month average from the past eight months. Read more about our overall housing market in my most recent monthly market report.... 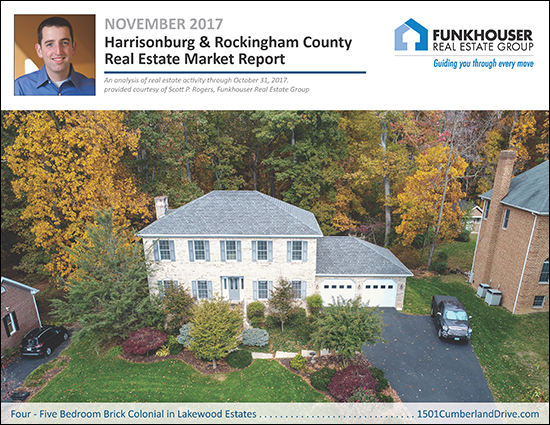
| |
Strong Sales Year for Duplexes, Townhouses, Condos |
|
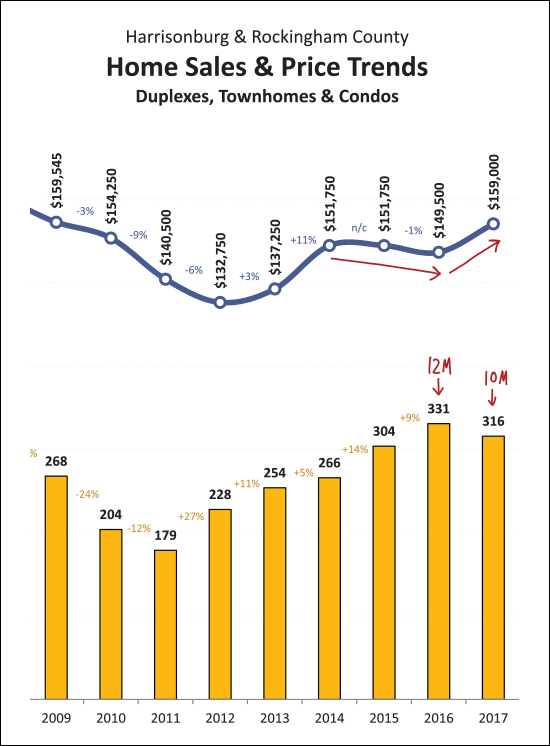 As shown above, this has been a strong year for "attached home sales" -- which includes duplexes, townhomes and condominiums -- but does not include single family detached homes....
Stay tuned for the end-of-year results, but the sales trajectory in this property category is looking promising. Read more about our overall housing market in my most recent monthly market report.... | |
Local Home Prices Rise Despite Slightly Slower Sales Pace |
|
 Find out more about this new listing in Lakewood Estates shown above by clicking here. I just published my most recent monthly market report, and as usual, you can read on for an overview, download the full report as a PDF or read the entire report with commentary online. Taking a look, first, at a high level overview of the market thus far in 2017.... 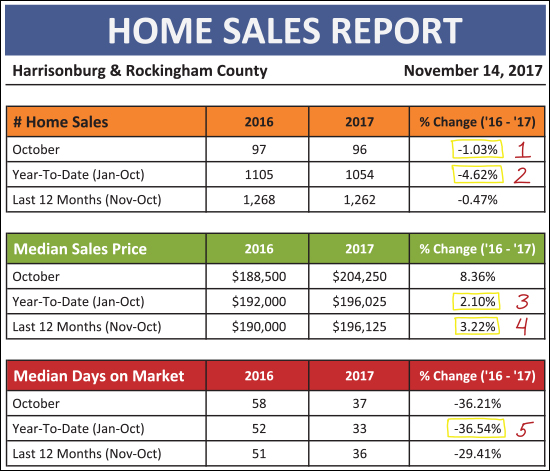 As shown above....
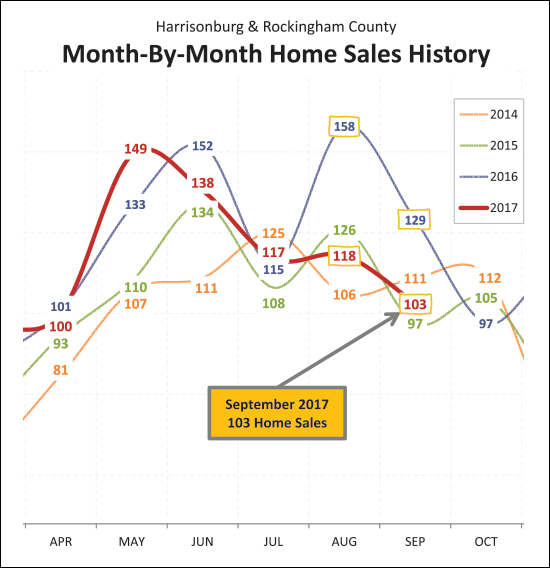
So -- while slightly fewer (-5%) homes are selling this year, they are selling at higher (+2%) prices, and are selling much (+37%) more quickly! 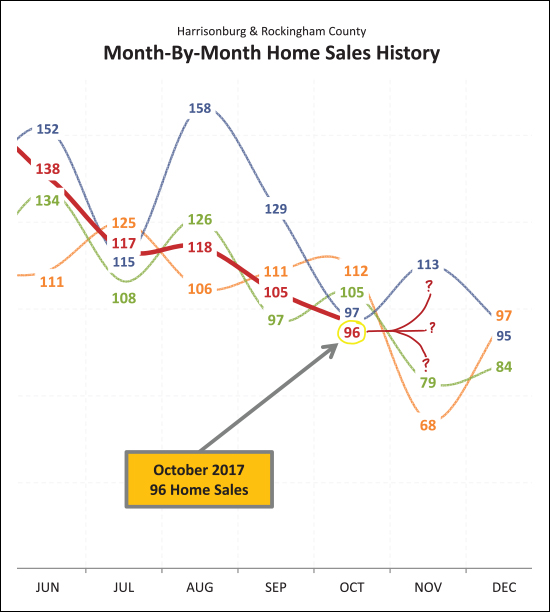 As shown above, this year lost its momentum in August and September -- where monthly home sales (118, 105) were no match for last year (158, 129). Things leveled out, a bit, in October -- with just about the same number of home sales (96 vs. 97) this year as last year. Where things will go next month is anyone's guess -- looking at the past three years, November home sales have ranged from 68 all the way up to 113! 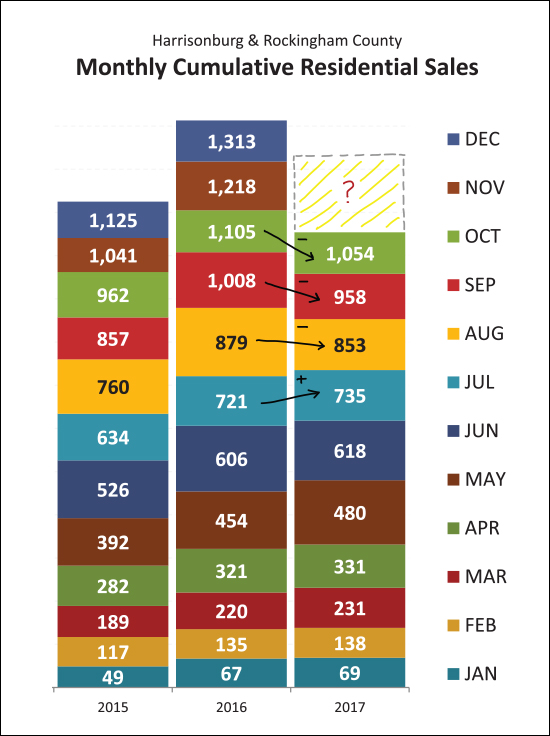 Above, visualized slightly differently, you can see that 2017 home sales were on par with (actually exceeding) last year up and through July before we then fell behind in August, September and now October. It seems certain that we'll finish out the year with fewer home sales this year than last, but more than in 2015. All that said -- as one of my clients pointed out -- maybe we shouldn't care if home sales slow down? 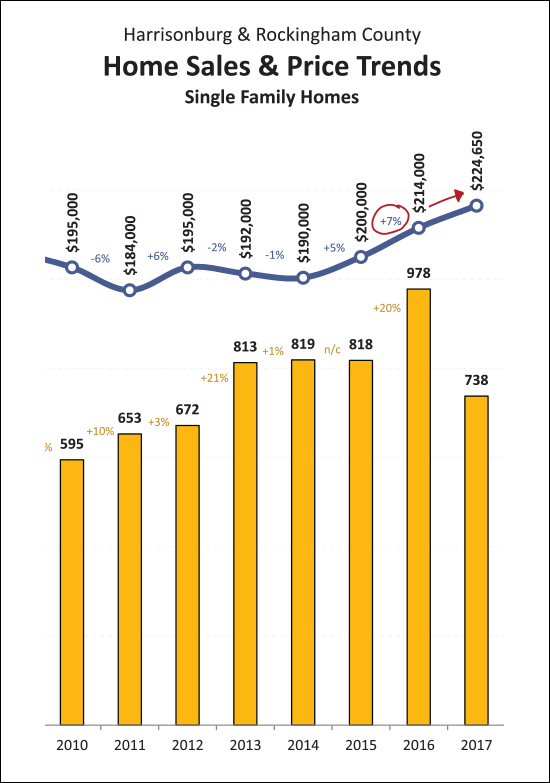 Indeed -- a slightly slower pace (-5%) of home sales might not be an negative indicator of market health -- that decline could be a result of declining inventory levels. Perhaps a better sign of a robust and improving local real estate market is the 7% increase in the median sales price of single family homes between 2015 and 2016, and the apparent 5% increase we seem likely to end up with in 2017. 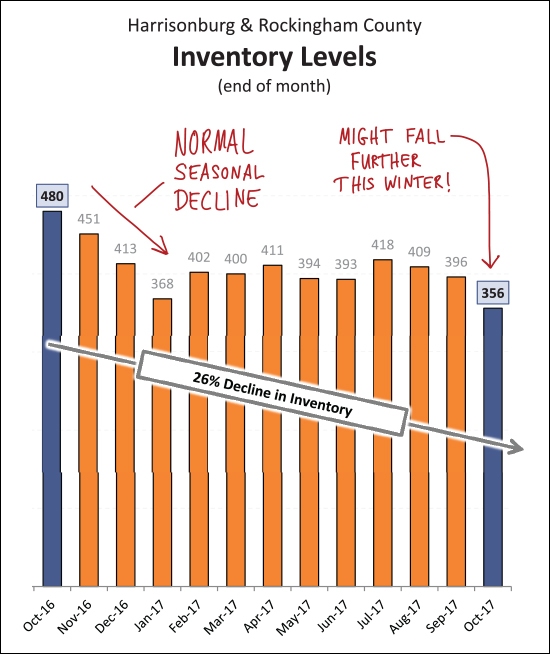 Speaking of slowing sales possibly being a result of lower inventory levels -- yes -- inventory levels are still way (-26%) below where they were last year at this time. And -- no good news here -- it would seem that we will likely see a further seasonal decline in the number of homes on the market as we continue through November, December and January!? Home buyers will likely have a tough time finding options over the next few months -- depending on their price range, where they want to (or are willing to) buy, etc. Let's pause there for now -- though I will continue to explore the latest trend in our local housing market in the coming days on my blog. Until then -- feel free to download and read my full market report as a PDF, or read the entire report online. And if you will be preparing to sell your home soon, you might find these websites helpful.... | |
Housing Inventory In Short Supply Under $200K, $300K |
|
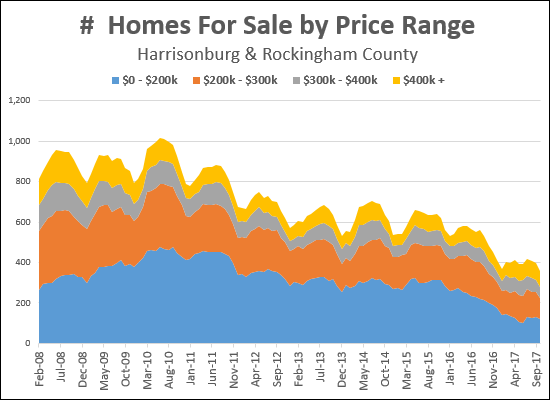 No new news here -- I've been saying it for some time -- fewer and fewer options exist for buying a home in our city/county for less than $200K, and even under $300K. But this visualization (click here for a larger version) was inspired by a comment from Brad - thanks Brad! We know that housing inventory, overall, is at a 10+ year low right now, but Brad observed that not all price ranges are created equal. As (somewhat clearly) shown above, the $300K - $400K and $400K+ price ranges have maintained a relatively stable/healthy supply over the past ten years -- and the under $200K and $200K-$300K price ranges have been the most significant declines. | |
Will housing inventory levels improve next year? |
|
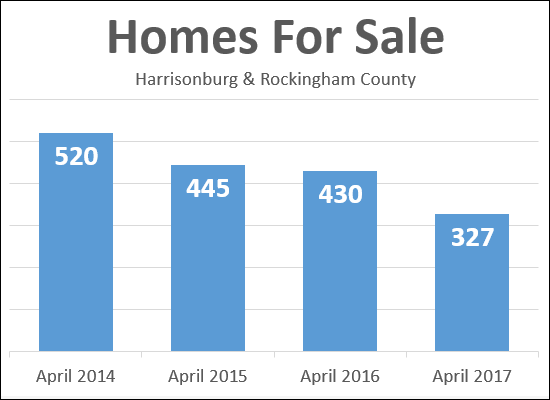 Short Answer = I don't think so. Several buyers who I have been chatting with lately have expressed dismay at the low inventory levels, which results in very few options for them to consider in their home search. The question inevitably comes up as to whether inventory levels are likely to improve next year. The graph above shows that at inventory levels have been consistently declining over the past four years as measured by how many homes are on the market at the start of the main buying season, which I'm defining as April in the graph above. So -- after seeing a 24% decline in inventory levels between April 2016 and April 2017 -- are we likely to see inventory levels start increasing again in 2018? Again, I don't think so, and here's why.... To reverse this trends of declining inventory we would need one or more of the following to happen in our local market....
Again -- none of the changes above seem likely to happen at a scale that would allow inventory levels to see much, if any, of an increase next year. As such, I am expecting we'll see relatively similar inventory levels next Spring and Summer. Sorry to be the bearer of bad news -- as always, just trying to give folks realistic expectations for the future. | |
Is it a good time to buy an investment property in Harrisonburg? |
|
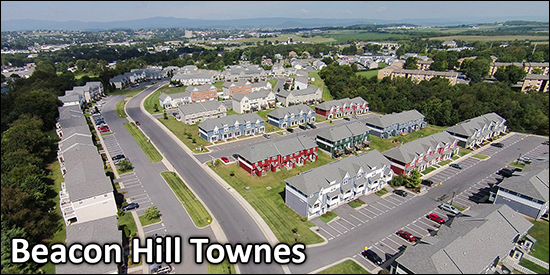 I had an interesting conversation with a real estate investor who is considering the purchase of a rental property (or properties) in the City of Harrisonburg, and they asked whether Harrisonburg was a good market in which to buy such a property -- or, put differently, is now a good time to buy a rental property in Harrisonburg. After some discussion, and further processing since then, I think I'm sticking with my original "yes and no" answer.... Yes -- it is a great time to buy a rental property in Harrisonburg:
There are a variety of other factors that could be put on one of the lists above -- but at the end of the day, it is not a clear or obvious decision to buy or not to buy. Some of the factors that should likely weigh in as you think about this decision are:
Below, then, also are a variety of resources that might be helpful to you as you think about this decision and as you consider specific rental properties....
| |
The mid sized homes that ARE being built |
|
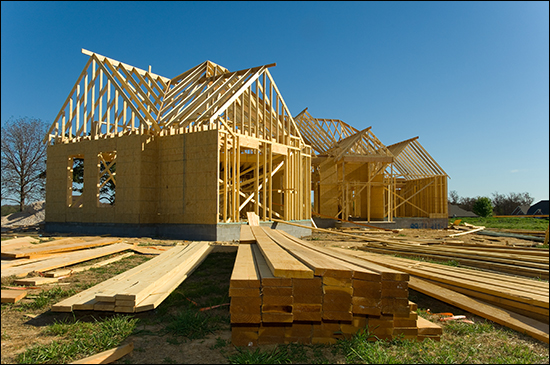 Last week I spent some time discussing the market need that I perceive for mid sized detached homes in or near the City of Harrisonburg. I went further, to suggest that these might be 1750 - 2150 SF homes for less than $300K. Thinking further about it over the weekend, I think it is important to note that there are actually SOME homes being built that meet these criteria. Below are the three homes that sold with these specs thus far in 2017.... 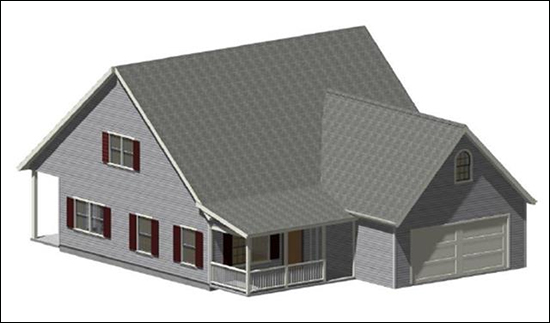 1240 Cottage Lane (just outside Harrisonburg) 3 BR / 2.5 BA / 2336 SF / $275,230 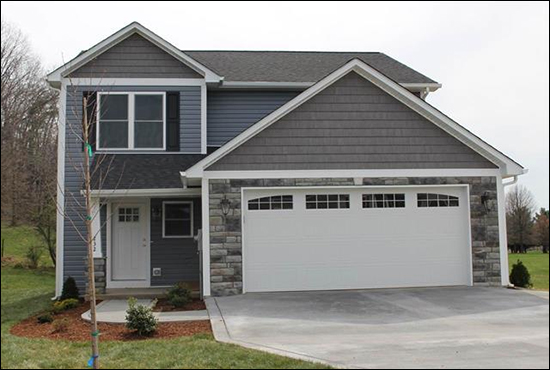 246 Dylan Circle (Bridgewater) 4 BR / 2.5 BA / 1818 SF / $247,000 [no photo available] 395 Acme Company Street (Broadway) 3 BR / 2.5 BA / 2257 SF / $277,000 And if we relax the criteria a bit, down to 1600 SF, we pick up a few more.... 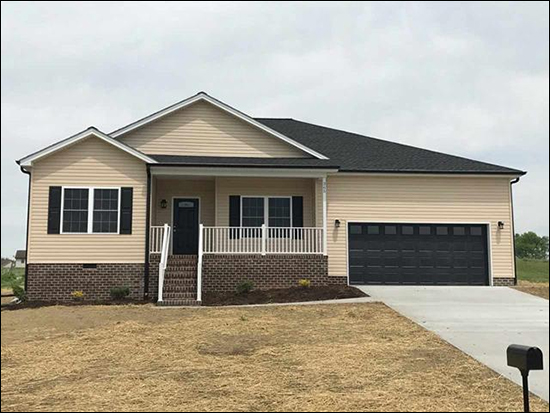 365 Coyote Run (Broadway) 3 BR / 2 BA / 1600 SF / $$222,500 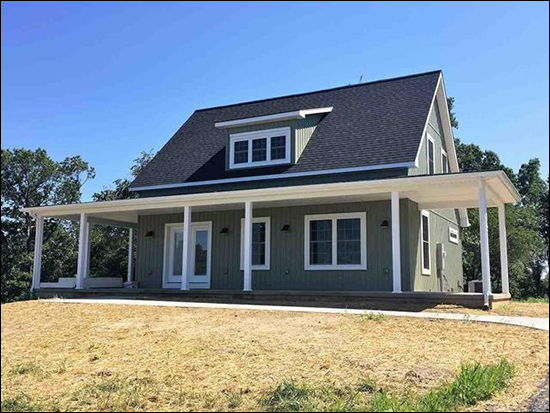 2587 Calico Drive (Broadway) 3 BR / 2.5 BA / 1639 SF / 5 Acres / $249,100 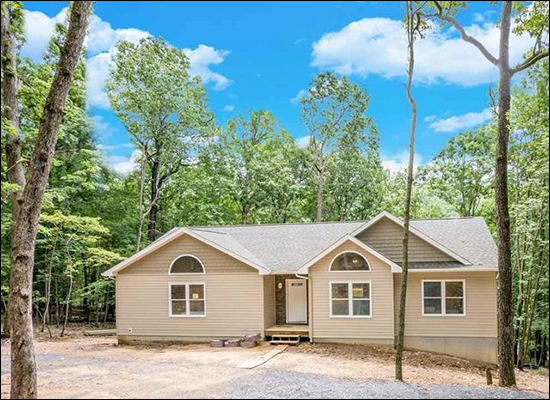 190 Grouse Drive (Massanutten) 3 BR / 2 BA / 1700 SF / $287,500 So, clearly, none in Harrisonburg proper, and most quite a ways from Harrisonburg -- and most importantly, VERY FEW homes at all that are being built and sold in this price range (under $300K) with these specs (1600+ or 1750+ SF). Switching, then, to what is currently available -- we find three options under $300K with 1750+ SF for buyers currently in the market.... 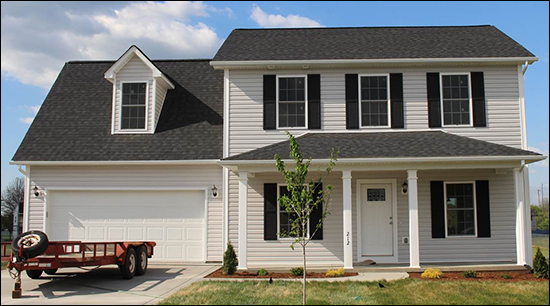 265 Dylan Circle (Bridgewater) 4 BR / 2.5 BA / 1808 SF / $246,900 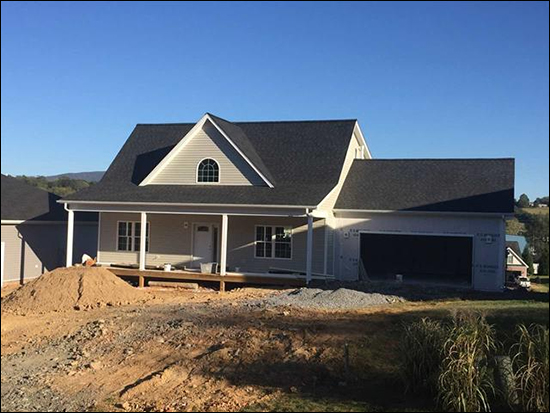 4150 Tanners Court (just outside Harrisonburg) 3 BR / 2 BA / 1830 SF / $279,900 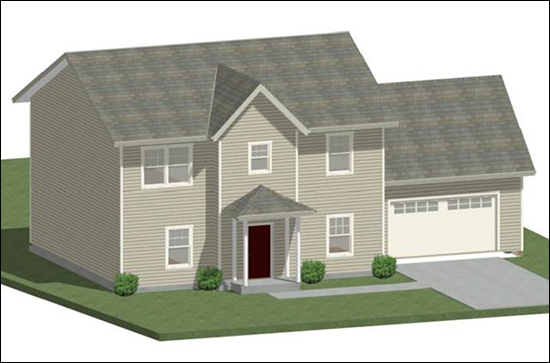 1250 Cottage Lane (just outside Harrisonburg) 4 BR / 2.5 BA / 2266 SF / $299,400 So, indeed, extremely limited options for new homes under $300K with 1750+ square feet in or near Harrisonburg. This brings me back to my same conclusions as I mentioned last week, and I'll mention again here....
| |
Can New Homes Be Built That Buyers Will Want and Can Afford? |
|
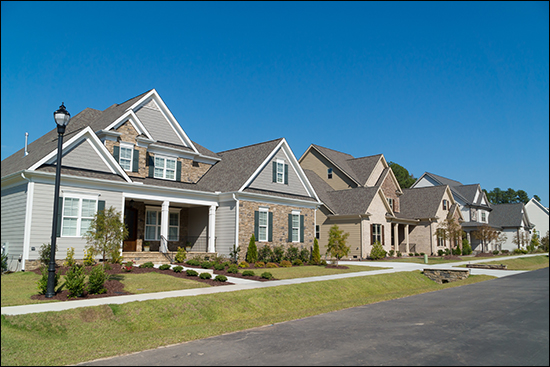 OK -- lots of great thoughts from folks over on Facebook yesterday, and in person as I talked to people around town yesterday, after I suggested that our market needs lots of mid size detached homes to be built. I'm going to think aloud about all of that by capturing a bit of that conversation here.... --- WHAT TYPES OF HOUSES? I had suggested that homes along these lines were needed for current townhouse owners that want to buy their first detached home....
These types of homes have not been built in large quantity over the past ten years, and I believe there are plenty of buyers who would love to buy this type/size of home. --- COSTS ARE HIGH BEFORE THE ACTUAL CONSTRUCTIONAs Jim, Jerry and Keith pointed out, It is expensive (!!!) to create a developed lot. The cost of building roads, installing water an sewer lines, utility hook up fees, etc. all add up to make the costs quite high even before construction (pouring the foundation, framing the home) begins. And as Nate points out -- if the land cannot be purchased by a builder at an affordable price, the rest of the equation downstream won't work out. High costs for land, plus development costs, plus building costs, will result in unrealistically high prices for homes, that then won't be affordable (or desirable at that price point) to buyers. Nate then ponders whether larger, regional builders can do better than local builders in this regard based on economies of scale. I'm not sure if the savings would be in buying a larger tract of land, lower development (infrastructure costs), or lower building costs -- but I wonder the same. Gary and Renee also point out that some of these "costs before you even start building" are high because of utility connection fees, requirements for stormwater management, proffers, etc., that are coming from government regulations and development requirements. Ginny points out that the final cost of a house is largely dependent on the initial land and development costs. Thus, to have smaller single family homes built, we may need to see smaller lots, to keep those initial costs down. --- DEMAND NEEDS TO DISCUSSED WITHIN THE CONTEXT OF PRICE As Jim succinctly puts it, "If I want something I can't afford then it isn't really demand." An excellent point -- which means that we need to think about (and talk about) the demand for the homes I outlined above (for example) within the context of the price for bringing such a home to market. If the houses I described (1750 / 1950 / 2150 square feet) were able to be sold for $150K, $175K and $200K (obviously not realistic) then clearly, there would be a ridiculously high demand for them. I believe that if the houses I described could be sold for $250K, $275K and $300K there would still be a strong demand for them. But, clearly, if the homes could not be sold for any less than (I'm exaggerating again) $400K, $425K and $450K then likely NOBODY would want want to buy them. So, yes, when we talk about demand for a particular type of housing, it likely should be -- as best as possible -- set within a context of price. That price-based demand can then be compared to development and building costs to see if developer and builders can bring such a product to market at a price that it will sell. --- WHAT SHOULD WE BE ADDING TO OUR HOUSING STOCK? As Jim also points out, the high demand and low supply environment we're in right now COULD cause a large quantity of under-qualified builders to start building homes. This doesn't help, in the long-term, as it is adding lower quality homes to our housing stock, which I do not believe helps our community in the long-term. Jim goes on to suggest that we should be ensuring that we are adding quality homes to our housing stock. I agree -- though I do think that we need to find a balance. If the quality of materials and finishes is too high, we're pricing ourselves out of the ability to meet the demand we're discussing. Michael takes us in a different direction when considering what should be built. He points out that even beyond building for all of those townhouse buyers (the original reason for my suggestion that we need to build mid sized detached homes) that he believes there is also a significant demand for affordable housing for the elderly in our community. He points out that retirement communities are not affordable for everyone, and plenty of older adults in our community would love to move into an affordable, (one-level), wheelchair accessible home. Again -- another market segment where we are not seeing much new construction. --- WHAT ARE PEOPLE GOING TO DO IF WE DON'T BUILD THESE HOMES? Ginny suggests that homeownership may be delayed for some families. A good point -- if the homes they want aren't available at the prices they can afford, perhaps they'll keep renting or keep living in the townhome they purchased. Ginny also suggests that we'll see more remodeling or upgrading of current homes to accommodate growing families, which also makes sense. Keith suggests that people will just have to move to some of the more affordable towns surrounding Harrisonburg. There are more affordable detached housing options when you look to Broadway, Timberville, Elkton and Grottoes. So, perhaps the townhome owners will just have to settle for a bit of a commute in order to buy a mid sized detached home that fits their budget. Jim suggests that maybe higher costs for new homes means that it will take much longer for families to be able to buy a home -- and perhaps they will have to stay in one home for a lifetime, instead of moving every 5 - 7 years. Gary concludes that many in our community may simply have to rent, or keep living in a townhouse, because of the cost of building new homes. --- CONCLUSIONS There were many other great points made, and discussions beginning, so thanks to all who engaged in this topic. A few big picture thoughts that come to mind for me....
Keep the conversations going, folks, on Facebook, with me, with each other. As Jim points out, "we're going to have to do housing differently than it has been built in the past 30 years if we are going to provide sustainable, affordable housing." | |
We need mid sized detached homes, and lots of them, soon! |
|
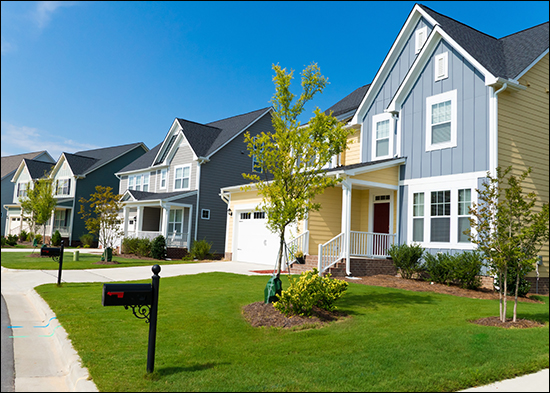 Between 2000 and 2012, three centrally located townhouse developments were built in Harrisonburg:
Some of these townhomes were purchased by investors. Some were purchased by folks who have since sold and left the area. Some were purchased by folks who have since sold and bought a new, larger home, in or near Harrisonburg But I believe a lot of the original (or second) owners of these 614 townhouses are now looking around Harrisonburg wondering where they will, where they can go next. I believe our market desperately needs mid sized detached homes to be built, as these many townhouse owners are now older, often have started a family, and are looking for more space -- but can't jump up to buying a $350K to $400K home. What might these mid sized detached homes look like? Perhaps....
So -- who is going to build them? And where can the be built? In many conversations I have had lately, one of the main challenges is finding land that can be purchased at a price that will allow for the development and construction of this type of housing without making them $350K homes. | |
Introducing JustSoldInHarrisonburg.com |
|
 If you like keeping up with everything happening in our local real estate market, I have just launched a new website that I think you'll enjoy. You can now visit JustSoldInHarrisonburg.com to keep track of every home being sold (via the MLS) in Harrisonburg and Rockingham County! 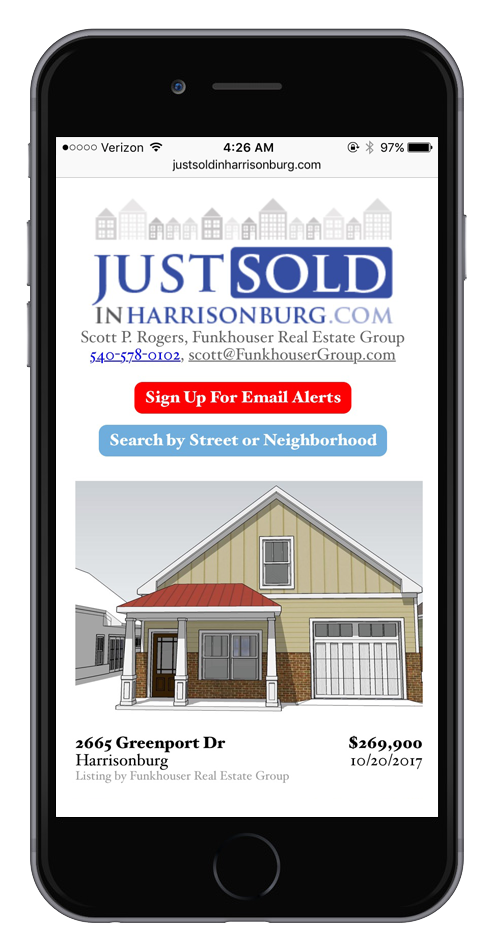 Now you can quickly scroll through the most recent home sales in Harrisonburg and Rockingham County, viewing all sorts of interesting details, such as:
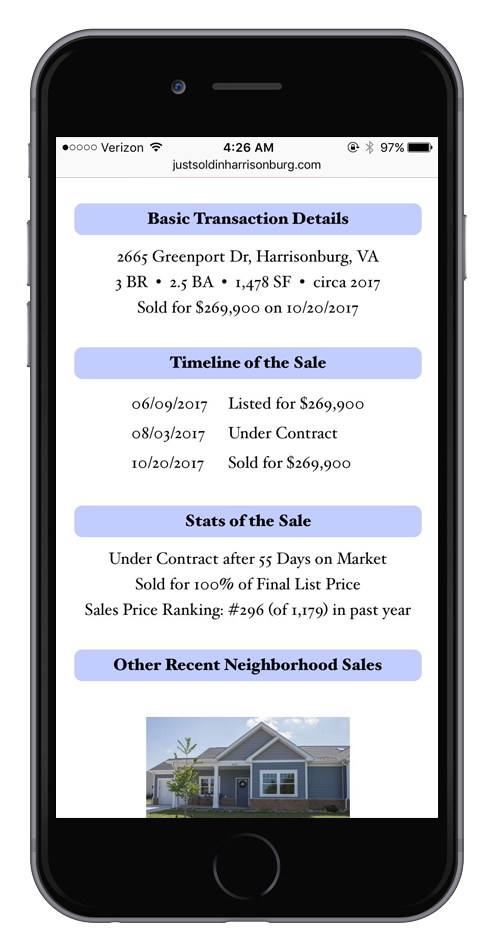 AND -- you can sign up to receive an email alert every time a home sells in Harrisonburg and Rockingham County. Click here to sign up for these email alerts.  AND -- if you're looking for a specific home sale, or for home sales on a particular street, or for home sales in a particular neighborhood -- you can search on this new website.... 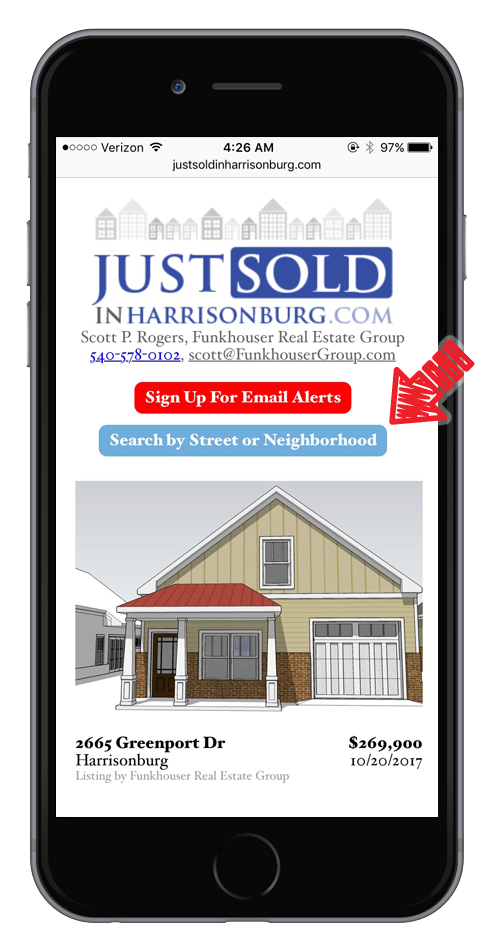 AND -- you can add the website to the home screen of your phone if you'd like, for quick and easy access....  So -- check out this new website, JustSoldInHarrisonburg.com, sign up for the email alerts if you'd like, and let me know how I can make this website even more helpful for you as you seek to better understand our local real estate market. | |
Who cares if home sales are slowing down |
|
 The pace of home sales is down 5% this year as compared to last year. But here's an interesting perspective offered up by one of my clients.... Who cares if home sales are slowing down!? As he points out -- the number of homes selling each month might be of more interest to the Realtor profession than the buying and selling public. What an interesting point! He then goes on to call out several data points that are much more important to him, and that he suspects (I agree) are more important to homeowners:
Indeed -- these three indicates are great benchmarks for the health of our local real estate market, and ultimately, he's right -- if prices are going up, inventory levels are low, and foreclosures are infrequent -- it doesn't matter quite so much whether home sales are slightly slower this year than last. So, chew on that for a bit. Home sales being higher than the previous year (at any given point) is not a necessary ingredient for a healthy real estate market. Read more about our local (slower-than-last-year) real estate market in my most recent monthly market report by clicking on the cover of the report below.... | |
Townhouses (and duplexes and condos) finally increasing in value |
|
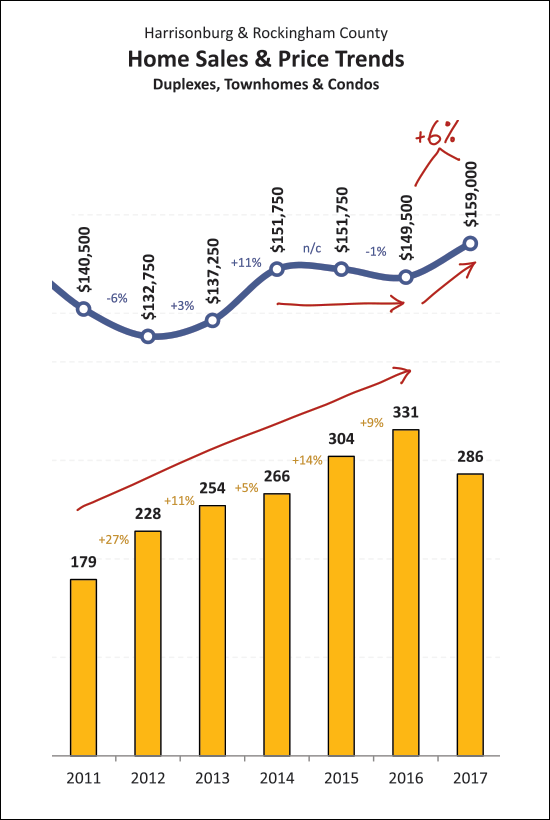 We've been waiting a few years for this. Attached homes -- townhouses, duplexes and condos -- have not seen much of a change in median sales price over the past three years. In fact, the median sales price declined slightly in 2016 after staying unchanged at $151,750 between 2014 and 2015. But now, we're seeing a (YTD) median sales price of $159,000 -- which is 6% higher than last year. This is a welcome sign of some price recovery in the "attached dwelling" category -- and in some ways it is just surprising that it took so long, as there has been a steadily increasing demand for these types of properties over the past six years. The number of these properties selling per year has increased from 179 in 2011 up to 331 last year -- which is an 85% increase. Read more about our local real estate market in my most recent monthly market report by clicking on the cover of the report below....  | |
Low Inventory Levels Lead to Slowing Home Sales in September 2017 |
|
 Find out more about this beautiful Barrington home shown above here. I just published my most recent monthly market report, and as usual, you can read on for an overview, download the full report as a PDF, read the entire report with commentary online, or tune in to my monthly video overview of our local housing market... 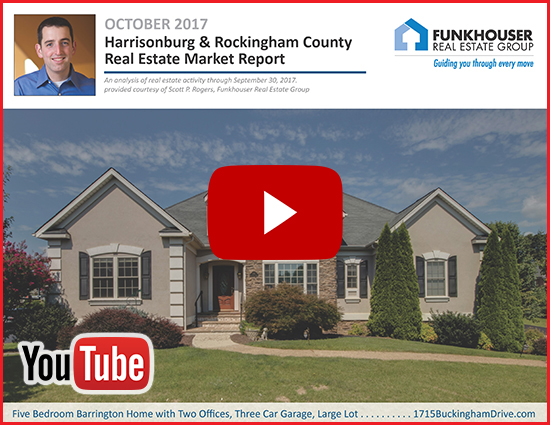 OK -- now, let's break down a bit of this data.... 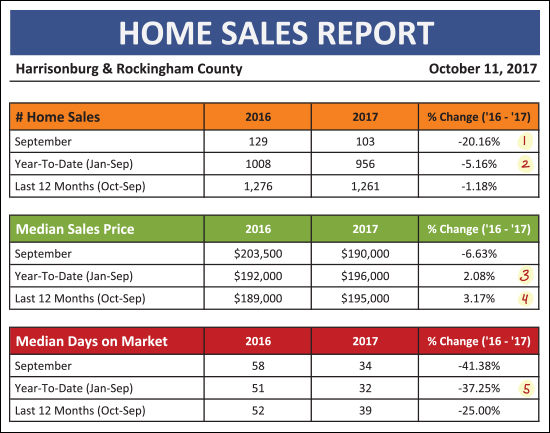 As shown above....
In summary, I believe slower sales are a result of lower inventory levels, not a result of lower buyer interest. If buyer interest were waning, we would be seeing level or declining median sales prices, and increasing time on market, neither of which are happening in the current market.
As shown above -- we saw a LOT of home sales last August and September -- a total of 287 sales. This year, during the same two months, there have only been 221 home sales. This decline of 66 home sales (Aug/Sep to Aug/Sep) has put 2017 a good bit behind 2016 when it comes to year-to-date home sales -- and it does not seem likely that the final quarter of 2017 will somehow close that gap.
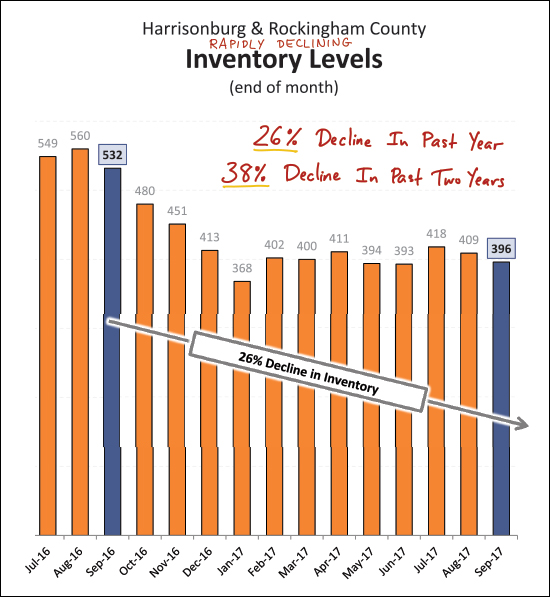
Above you will see what I'm referring to when I say that inventory levels are falling at a pace that is causing home sales to decline. Today's buyers have 26% fewer choices than buyers one year ago -- and 38% fewer choices than buyers to years ago. We knew that this would eventually cause sales to decline, as buyers won't just buy anything if it does not meet their needs now and into the future.
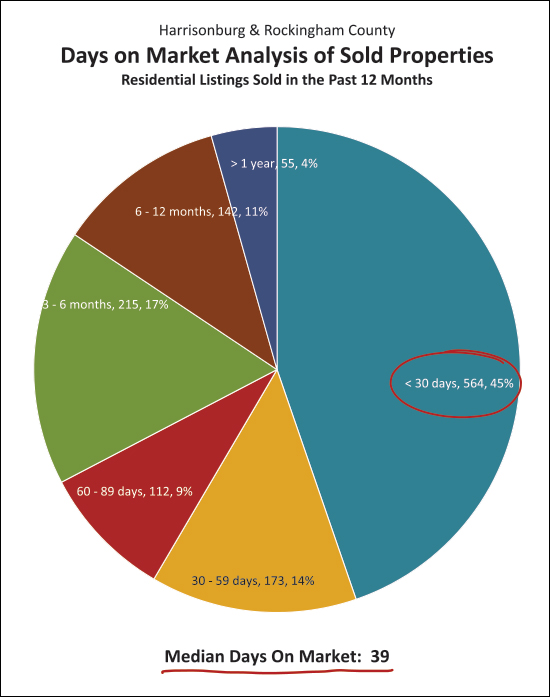
Not all homes are selling -- and not all homes are selling quickly -- but quite a few are selling quickly! The median days on market of homes sold in the past year has been 39 days! Furthermore, 45% of homes that have sold have gone under contract within 30 days! Yet another sign of strong buyer demand paired with low inventory levels. And -- one more time to drive home my point....
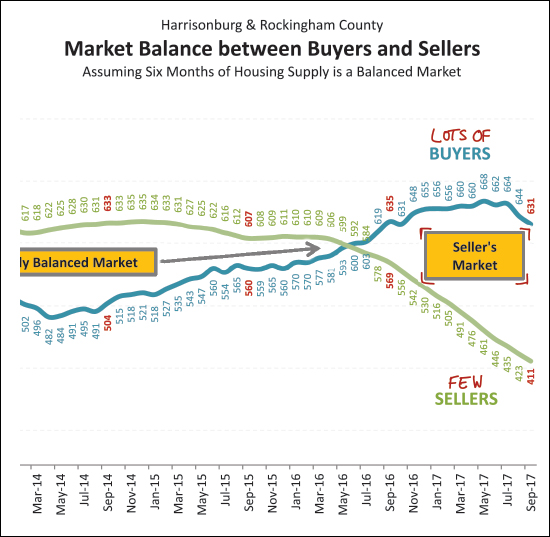
Above you will see that we are experiencing a strong seller's market right now -- with lots of buyers (having steadily increased over the past few years) and very few sellers (having steadily decreased over the past few years). There are now so few sellers that buying activity is starting to fade a bit in recent months. OK -- I'll stop there for now. I will continue to explore the latest trend in our local housing market in the coming days on my blog. And, my reminders for buyers and sellers last month still apply.... SELLERS -- even though it is a seller's market in many price ranges right now, you must still focus on price, condition and marketing. For further reading on buying or selling in this area, check out.... | |
Has the Market Slowed Down in September? |
|
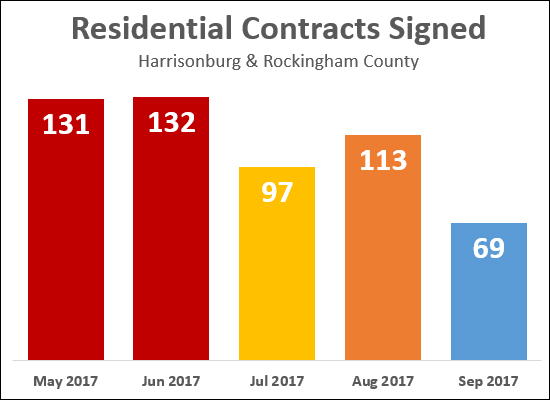 It seems it may have.... As shown above, only 69 properties have gone under contract thus far in September 2017 -- as compared to 113 last month. Of note....
Regardless, home buying activity (at the point of contract signing) seems to be slowing down as we head into the Fall. On a completely unrelated note, do we really call these 80 degree days "Fall"? | |
The Value of Your Home Based On When You Bought It |
|
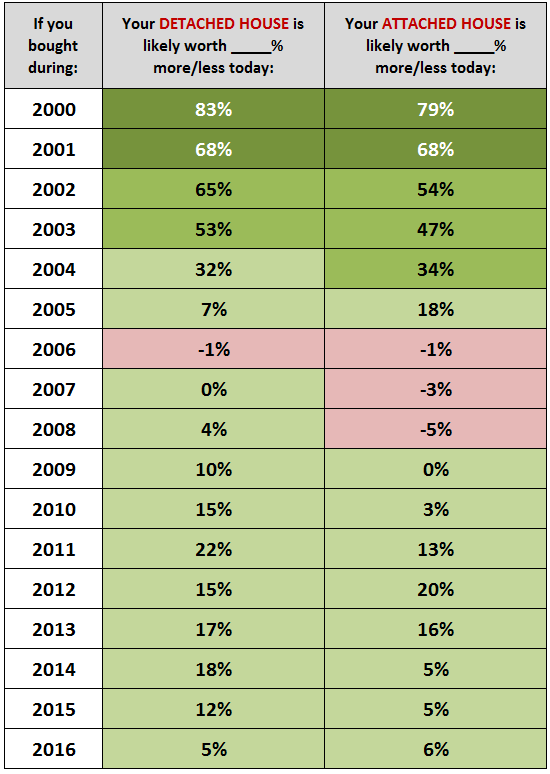 Can historical median sales prices give you some sense of your home's current market value? Perhaps so! The chart above is calculated based on comparing the 2017 median sales price to the median sales price in each of the past 16 years. Do remember, of course, that while this might provide a general guide to what has happened with home values over the 17 years, every home and neighborhood is unique. Let's chat about your specific house if you want to know what it is worth in today's market. Also, if you bought your home in one of the (now few) red years (2006, 2007, 2008), while your home might still be worth less today than when you bought it, you may have paid down your mortgage to the point that you could sell your without bringing money to closing. | |
How much of the City of Harrisonburg single family housing stock sells in any given year? |
|
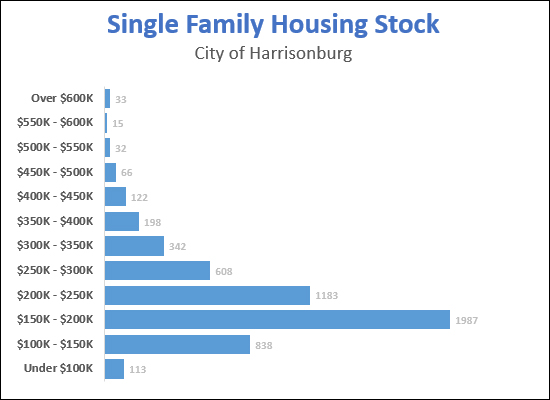 OK -- I'll point out, from the start, that I'm making things a bit more complicated here. I'll partially blame Derik, as he asked the question. OK - the graph above, is the same one I posted yesterday -- a look at how many single family homes exist in the City of Harrisonburg in a variety of price ranges, based on their assessed values. But -- if that's how many actually exist -- it is probably reasonable to wonder how many homes actually sell in each of those price ranges in each year. So, here are the City single family home sales in the same price ranges for all of 2016.... 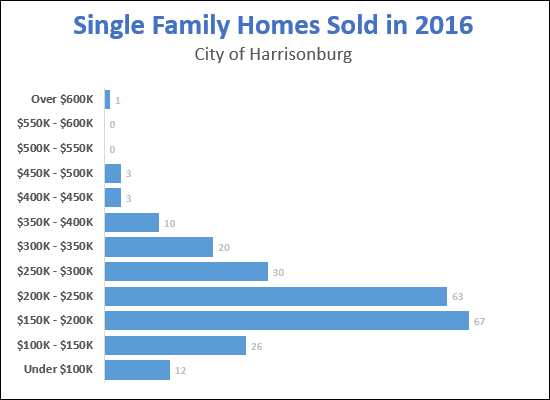 You'll notice that the two graphs above don't look altogether that different. Then, to combine these two, rather than just put really little numbers (how many sell) next to really big numbers (how many physically exist) I thought I"d look at what percentage of each price segment of the City housing stock sells in a given year.... 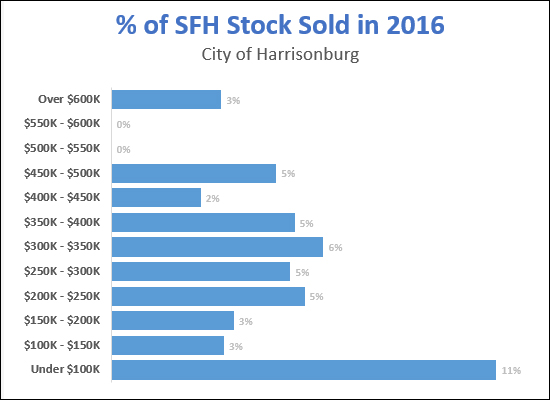 I think this makes it more helpful, though slightly less specifically meaningful absent scrolling back up and also remembering how many houses we're talking about in each given price range. For example, the chart directly above shows that:
OK -- next, a few flaws and disclaimers:
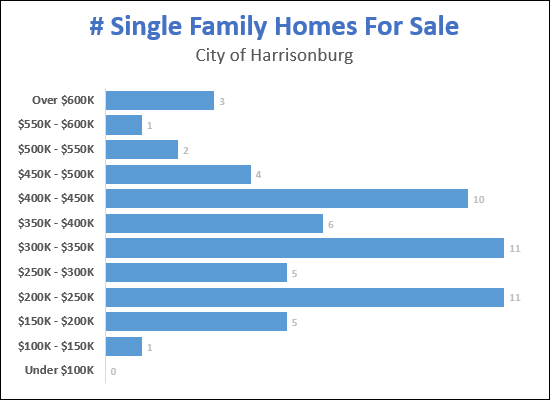
OK -- it continues -- I think it is probably necessary to try to contextualize this with "active listing" data -- to see how some of these numbers compare to what is available today for a buyer to purchase. Here is a breakdown of single family homes currently for sale....
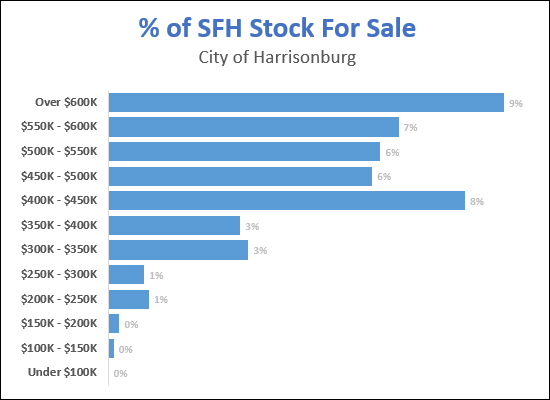
As you can see, above, there are NOT a lot of homes for sale in the City of Harrisonburg right now. And let's see if we can flesh anything out if we break it down by how many homes are available to be purchased as compared to the overall number of homes that actually exist....
This graph might have been the one I was looking for -- at least to support my understanding of the world.... Right now -- almost 9% of the homes over $600K are listed for sale -- and 6% to 8% of homes over $400K are listed for sale in the City of Harrisonburg. On the other hand, only 3% of homes between $300K and $400K are listed for sale, only 1% of homes between $200K and $300K and less than 1% of homes under $200K are listed for sale. This would seem to be about as clear of an indicator as one could find that homes under $300K (or even better, under $200K) are in short supply and in high demand in the City of Harrisonburg. Finally, lastly, ultimately, some "overall market" stats....
Questions? Thoughts? Observations? Insights? Suggestions? Email me: scott@HarrisonburgHousingToday.com | |
Single Family Housing Stock in the City of Harrisonburg |
|
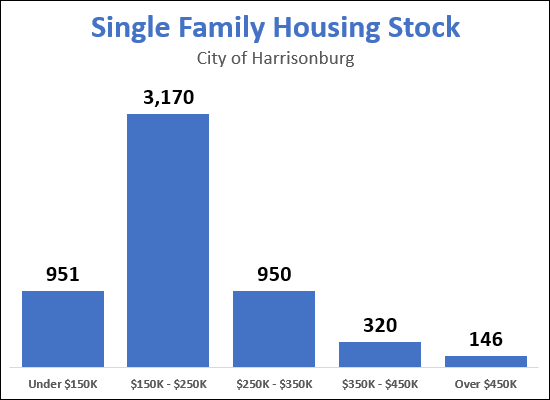 Forget about what actually SELLS in any given timeframe, or even what is available FOR SALE at any given point in time. Let's get down to what housing actually EXISTS in the City of Harrisonburg. The graph above shows the number of single family detached homes (Use Code 006 in the City's property database) that exist in the City of Harrisonburg in five different price ranges. The homes are sorted into these price categories based on their 2017 assessed values. So -- what surprises you? If more single family homes are to be built in the City, what price range should they fit into? | |
Are $150K - $250K Detached Homes Available in the City of Harrisonburg? |
|
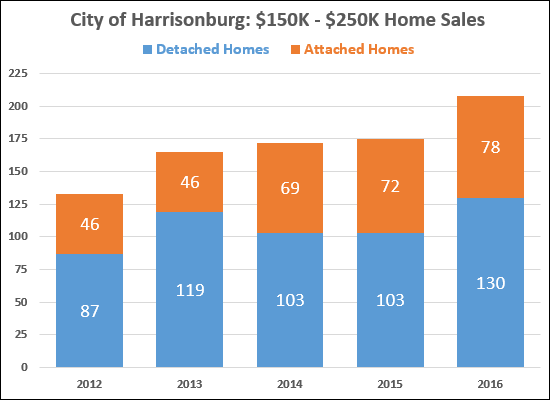 HINT -- this is a bit of a trick question. Again.... Are $150K - $250K Detached Homes Available in the City of Harrisonburg? Ignore the graph above for a moment -- and let's see what we find.... There are only 15 detached homes currently on the market in the City of Harrisonburg priced between $150K and $250K. Wow! At first blush, this is (or seems to be) very significant. One might conclude that we are seeing a significant under supply of these "mid-priced" homes in the City of Harrisonburg, and assume that this under supply is causing very few of these homes to actually sell. But wait -- looking further (now you may refer to the graph above, thank you for your patience) it seems that plenty of these homes are actually selling. In fact, 130 detached homes between $150K and $250K sold in the City of Harrisonburg last year. The tricky part is this -- if 130 buyers are buying per year, that's an average of 10.83 buyers per month. And thus, if there are only 15 such homes on the market, that is a 1.4 month (42 day) supply of homes for sale. Which is -- rather absurdly low. Most folks consider a six month supply to provide a balanced market between buyers and sellers. So -- yes, homes are SELLING between $150K and $250K -- but they aren't widely AVAILABLE at any given point. When they come on the market, they sell quickly! A few other observations....
| |
| Newer Posts | Older Posts |
Scott Rogers
Funkhouser Real
Estate Group
540-578-0102
scott@funkhousergroup.com
Licensed in the
Commonwealth of Virginia
Home Search
Housing Market Report
Harrisonburg Townhouses
Walk Through This Home
Investment Properties
Harrisonburg Foreclosures
Property Transfers
New Listings

