| Newer Posts | Older Posts |
Local Real Estate Market Starts to Pop in February 2018 |
|
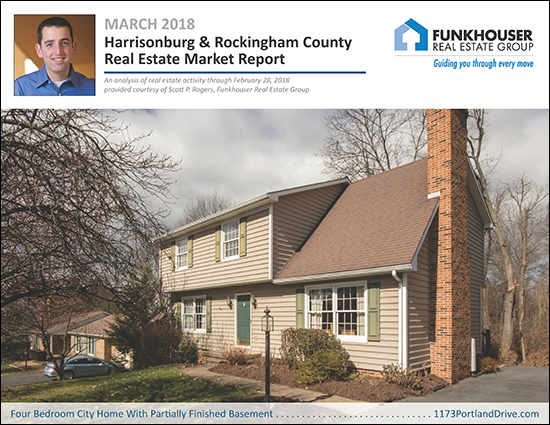 Find out about this newly listed (today!) City home at 1173PortlandDrive.com. I just published my most recent monthly market report, and as usual, you can read on for an overview, download the full report as a PDF, read the entire report with commentary online, or tune in to my monthly video overview of our local housing market...  OK -- now, let's dig into some of the main market metrics.... 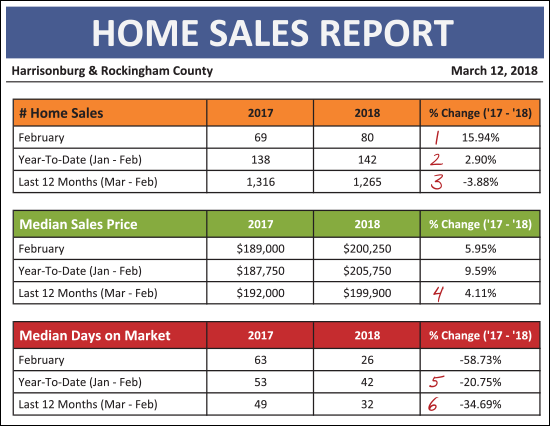 As shown above....
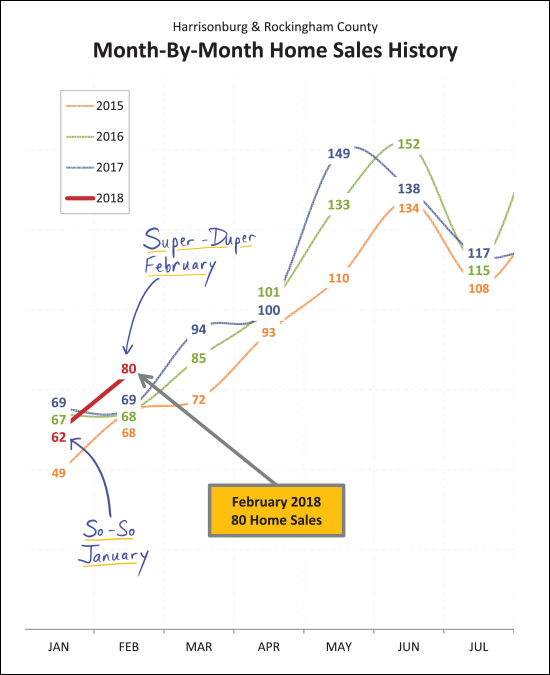
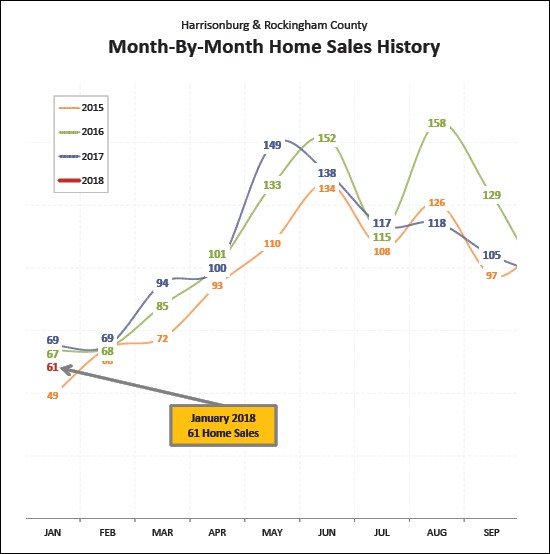
January 2018 wasn't the best January in the past few years, though it wasn't the worst either. It was in the middle of the pack, as shown above. February, however, was a strong month of sales -- jumping out ahead past the past three months of February. It seems likely we'll see between 90 and 100 home sales in March.
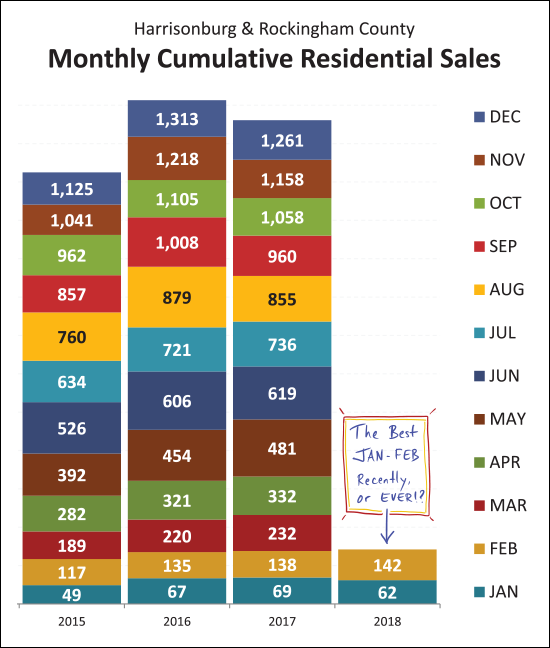
The graph above is actually a bit of a warning against too much exuberance over the BEST January-February combo we've seen in any recent year. Because, look carefully at last year -- you'll note that 2017 home sales were ahead of 2016 all the way through the end of July. So, for the first seven months of the year, it looked like we were poised to break even more records for the number of home sales in this area. And then in August and September of last year, we fell behind, and never caught back up. So -- it is exciting to see record numbers of sales in the combined first two months of this year -- but it in no way means that we'll see an actual increase in annual sales by the time December 31 rolls around.
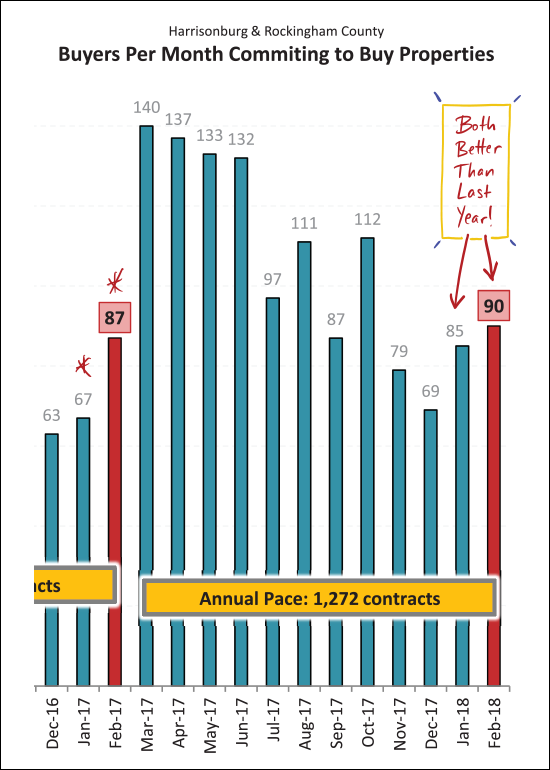
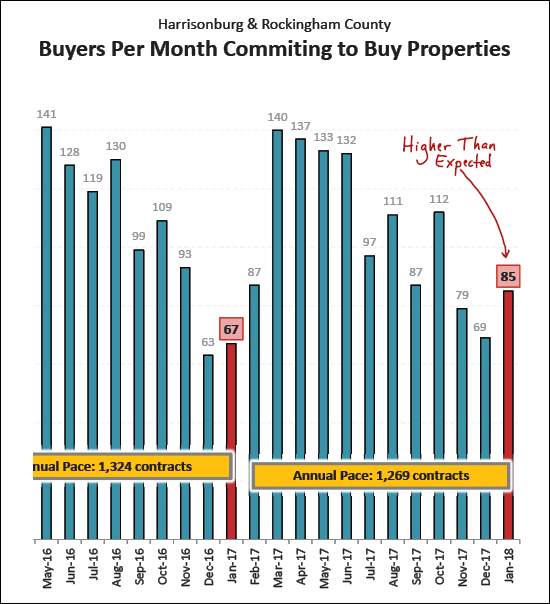
Having now brought you down to earth, I'll pump you up again. :-) The 85 and then 90 contracts seen in January/February of 2018 is a nice increase from last January/February when we saw 67 and then 87 contracts. So -- the faster (closed) sales pace may at least continue into March, and maybe April given the contracts signed to date.
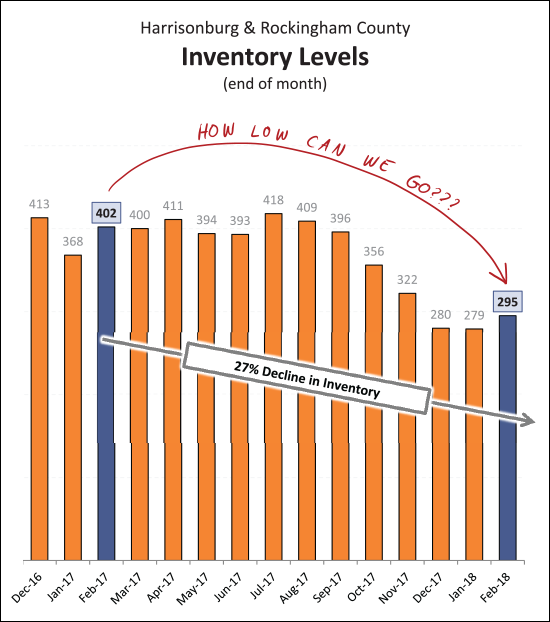
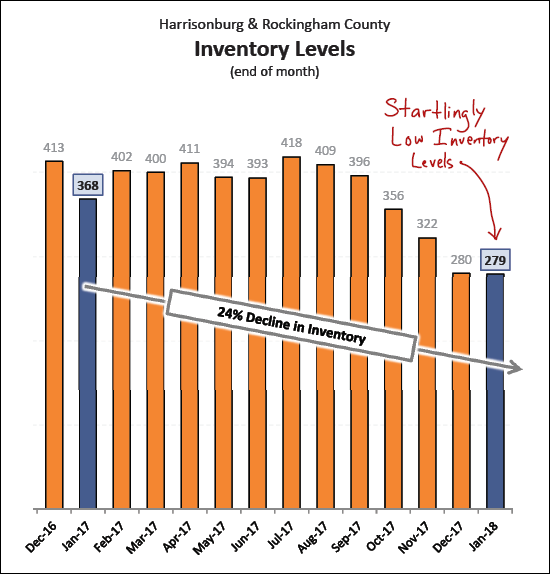
Oh yes, and don't forget about those sinking inventory levels. The decline in home sales we saw in our local market in 2017 is considered by many to have been at least partially caused by consistent declines in the number of homes listed for sale. We have seen inventory levels drop for the past few years -- and the 27% decline from 402 homes to 295 homes over the past 12 months certainly does not help provide enough homes for an increasing pool of buyers to purchase. We should (??!??) see an increase in these inventory levels as we get into the Spring market -- but that theoretical increase never substantially materialized last year.
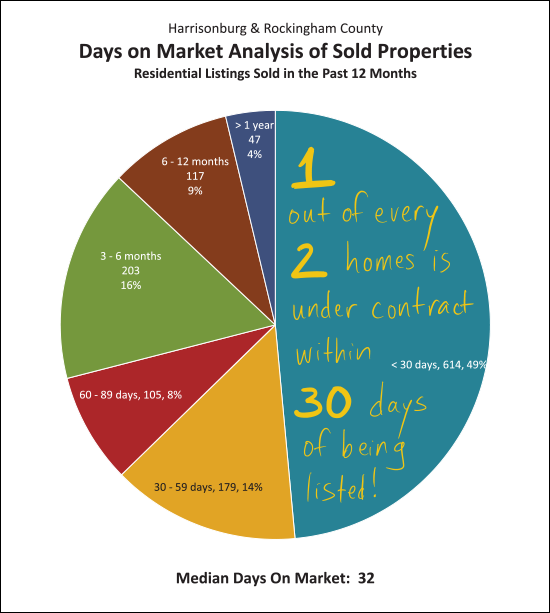
All of these market trends are tied up together, intertwined and interdependent upon each other. Here is another. One out of every two homes that sold in the past year (ok -- I rounded -- 49% if you need to know) went under contract within 30 days of being listed for sale. This low inventory environment is causing buyers to be extremely fast to view and then consider homes as they are listed for sale. OK -- I'll stop there for now. Again, you can download the full report as a PDF, read the entire report with commentary online, or keep reading my blog in the coming days for further commentary. AND -- if you're thinking of buying or selling soon --- SELLERS -- even though it is a seller's market in many price ranges right now, you must still focus on price, condition and marketing. For further reading on buying or selling in this area, check out.... Happy March! | |
Local Home Sales Off To Slightly Slow Start In 2018 |
|
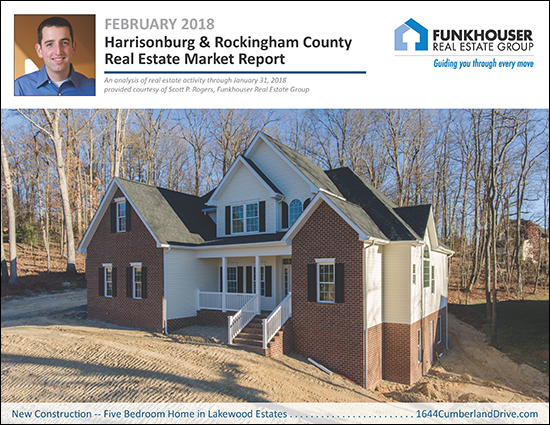 Find out more about this newly built home in Lakewood Estates at 1644CumberlandDrive.com. I just published my most recent monthly market report, and as usual, you can read on for an overview, download the full report as a PDF, read the entire report with commentary online, or tune in to my monthly video overview of our local housing market...  OK -- now, let's take a look a few of the main indicators for our local housing market.... 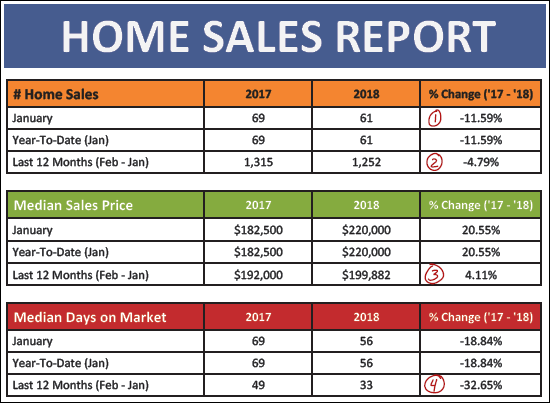 As shown above....
As shown above, January 2018 home sales were right in the middle of the pack as contextualized by the previous three years. And in some ways, we should expect to see around 70 home sales next month -- however....
Contract activity in January 2018 was much stronger than could have been expected. Buyers (and sellers) signed 85 contracts in January -- as compared to only 67 last January. Thus, it is reasonable expect we'll probably see somewhat of a bump in home sales in February.
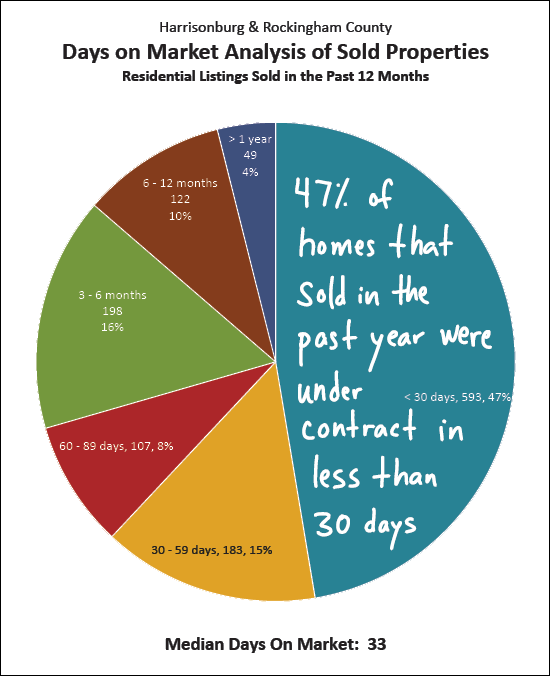 And perhaps that is why so many homes are selling so quickly. Almost half of the homes that have sold in the past year have gone under contract within 30 days of coming on the market! OK -- I'll stop there for now. Again, you can download the full report as a PDF, read the entire report with commentary online, or keep reading my blog in the coming days for further commentary. If you're thinking of buying or selling soon --- SELLERS -- even though it is a seller's market in many price ranges right now, you must still focus on price, condition and marketing. For further reading on buying or selling in this area, check out.... | |
Local Home Values Rise in 2017 |
|
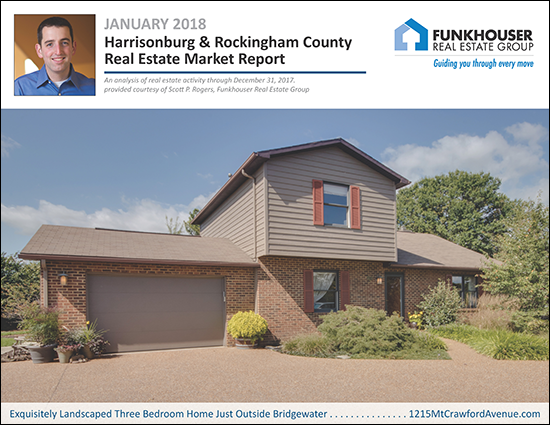 Find out more about this stellar home just outside Bridgewater at 1215MtCrawfordAvenue.com. I just published my most recent monthly market report, and as usual, you can read on for an overview, download the full report as a PDF, read the entire report with commentary online, or tune in to my monthly video overview of our local housing market...  OK - now, let's dive into the market data behind this month's report.... 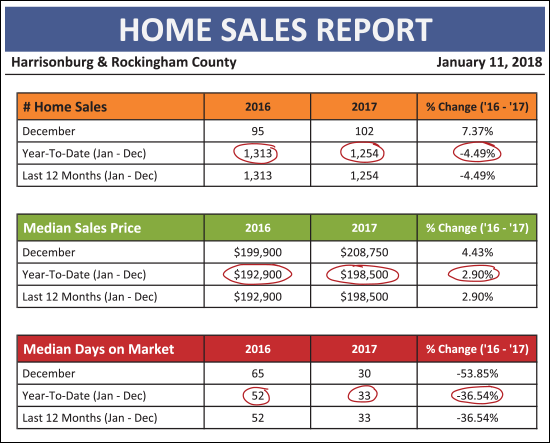 As shown above....
 Two observations here (above)....
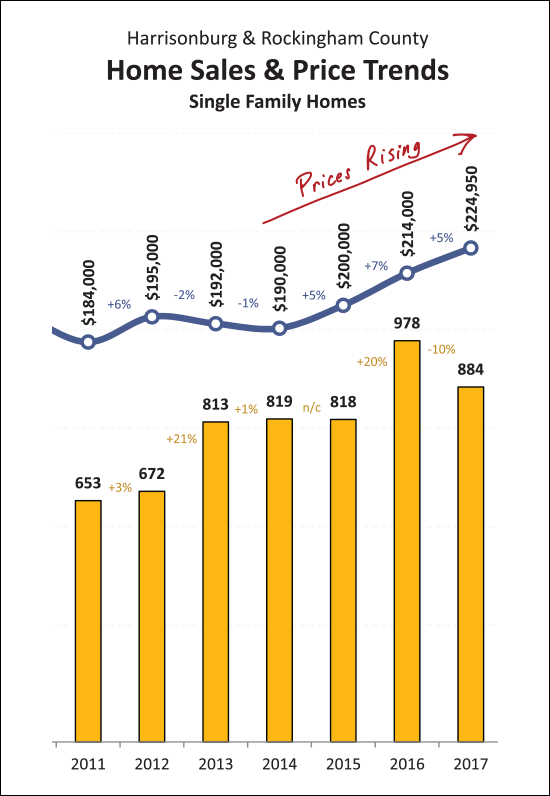
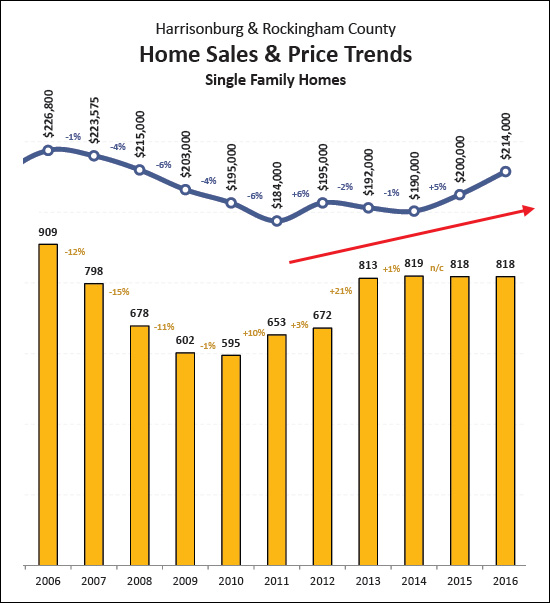
Perhaps the truest analysis of the trends in housing values -- single family homes on their own. The waters can be muddied, a bit, on townhouses, duplexes and condos -- with investors buying the properties as rentals. Most single family homes are bought as residences, and thus there are fewer external factors that affect these home sales. As noted above, there were 10% fewer single family home sales in 2017 -- but the median price rose for the third year in a row, to $224,950. This is a good indicator that home values are rising in our area. And finally, the disturbing statistic I was hesitant to even go look for this month....
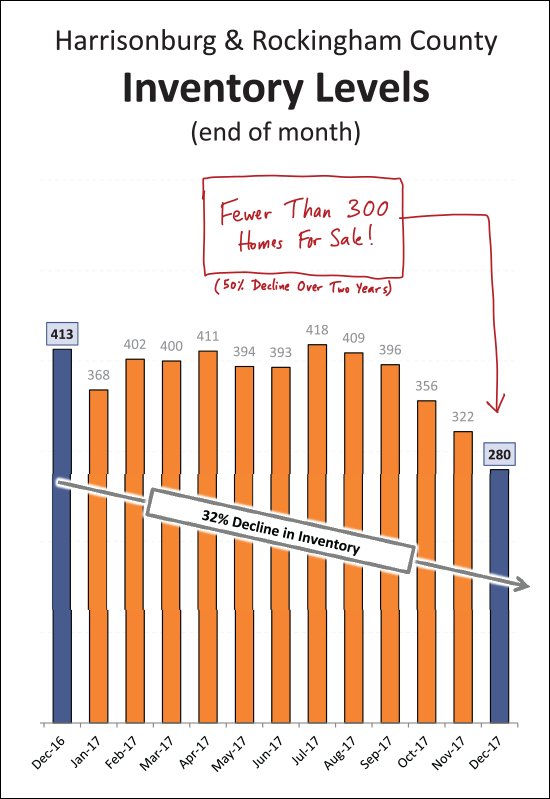
Indeed -- after free falling for most of 2017, the number of homes for sale in Harrisonburg and Rockingham County has now plunged below 300 -- to only 280 homes for sale as of this morning!?! Two crazy further notes -- there are only 46 townhouses/duplexes/condos listed for sale in the entire City/County -- and there are only 64 homes for sale in the City of Harrisonburg!?! OK -- I'll stop there for now. There is plenty more in my full market report, so feel free to download it as a PDF, read the entire report online, or watch/listen to a video overview of this month's report. And, my reminders for buyers and sellers last month still apply.... SELLERS -- even though it is a seller's market in many price ranges right now, you must still focus on price, condition and marketing. For further reading on buying or selling in this area, check out.... | |
Local Home Sales Slow, As Inventory Declines, But Prices Are Rising! |
|
 Find out more about this Mountaintop Retreat on 46 acres with a cabin, hiking trails, canyon and river here. I just published my most recent monthly market report, and as usual, you can read on for an overview, download the full report as a PDF, read the entire report with commentary online, or tune in to my monthly video overview of our local housing market...  Now, let's take a closer look at some of this month's data.... 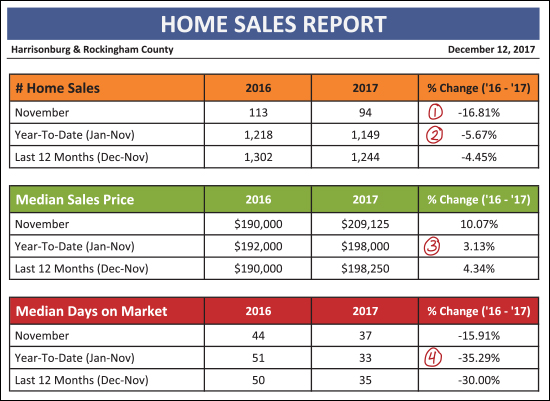 As can be seen above....
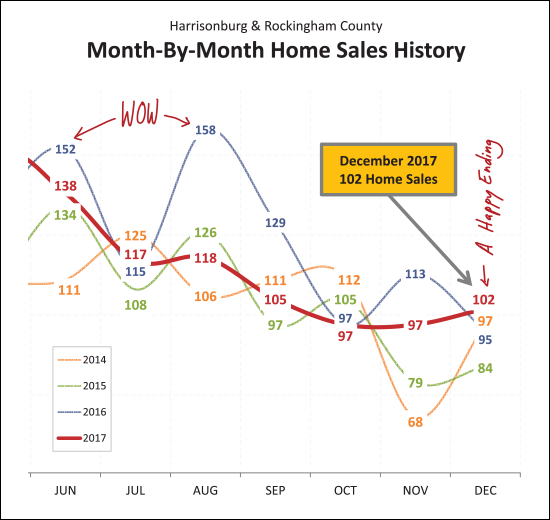
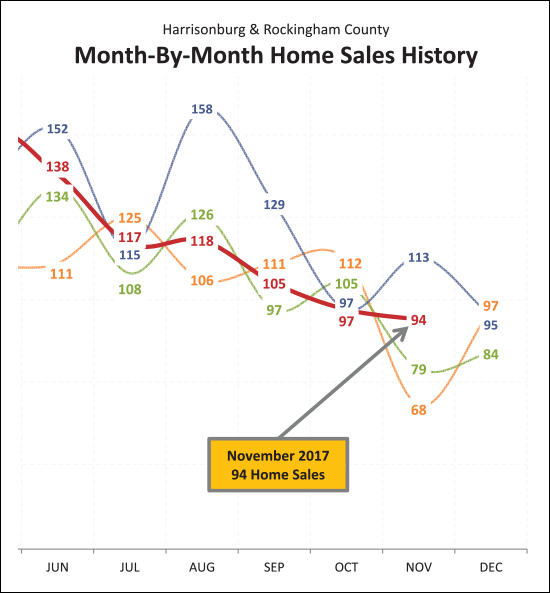
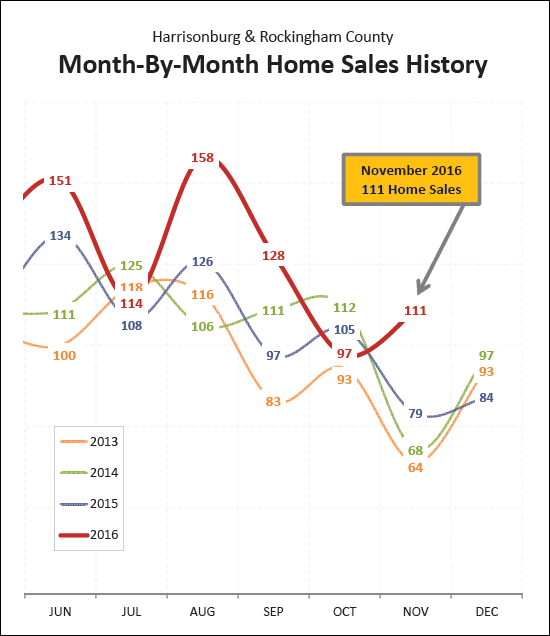
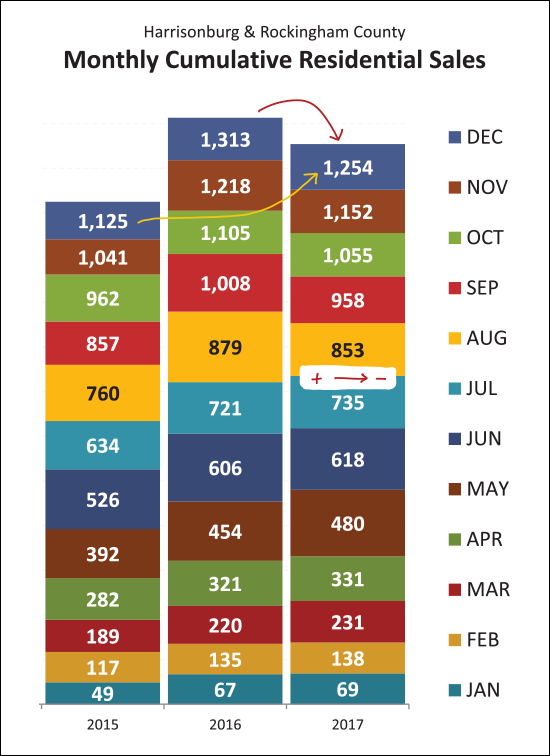
Last year certainly was interesting!?! Or odd!?! Last August, September and November were OFF THE CHARTS as far as a record number of home sales for those months -- which then makes this year's sales trajectory seem as slow as mud in August, September and November. This November's sales were a good bit higher than in 2014 and 2015 -- but were solidly below November 2016.
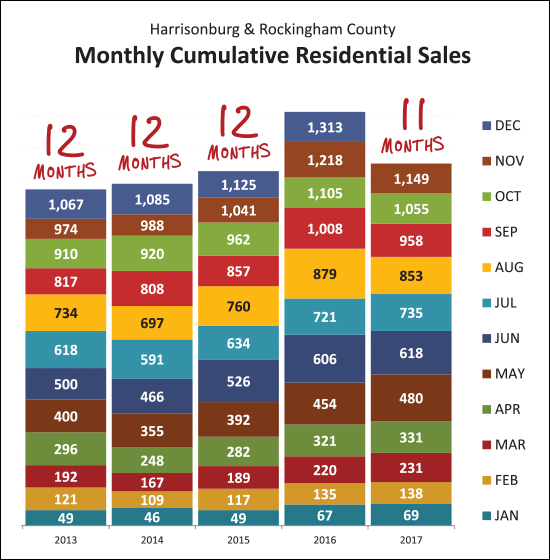
So -- despite the fact that 2017 is hiding in the shadows of a towering year of sales in 2016 -- it is interesting to note that the 11 months of home sales thus far in 2017 (all 1,149 of them) has already surpassed the full 12 months of sales seen in 2013 (1067 sales), 2014 (1085 sales) and 2015 (1125 sales). As such -- while total home sales will likely be 5% to 6% lower this year than last -- that will still mark a solid improvement as compared to any other recent year.
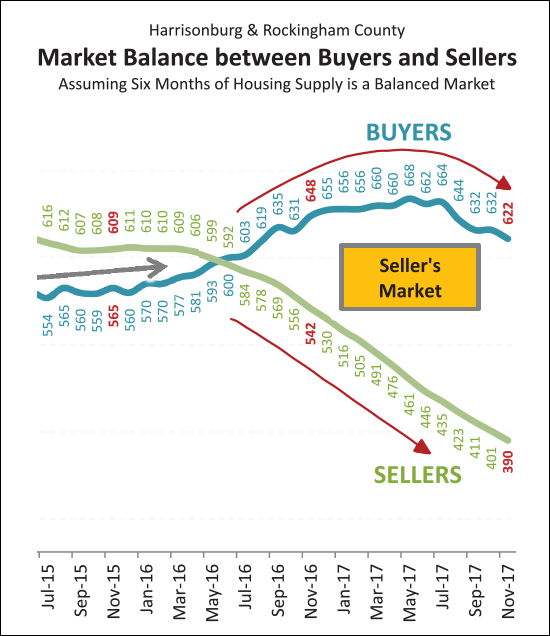
After quite a few years of steady increases in buyer activity -- we are starting to see a decline. Over the past six months we have seen buyer activity taper off and start to decline. I believe this is a direct result of the drastic reductions in the availability of homes for those buyers to buy. As the number of sellers in the market at any given time has declined, eventually that also resulted in a reduction in the pace of buying activity.
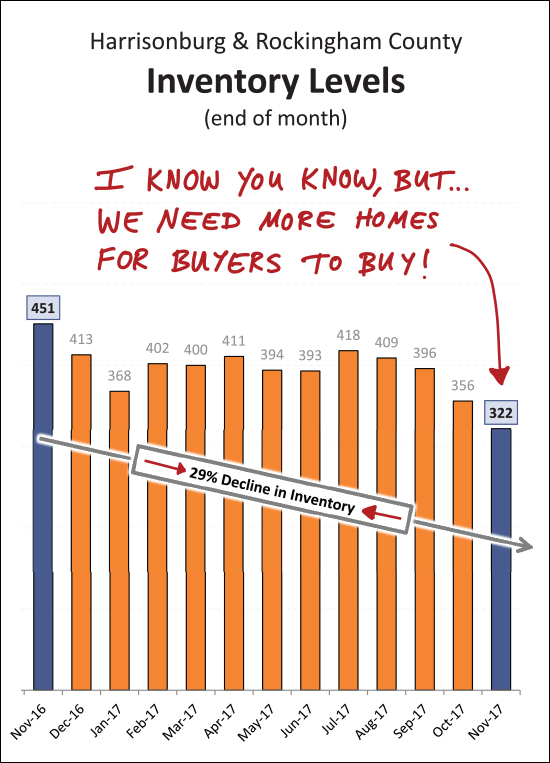
Yeah, so, about those inventory levels. They are low and getting lower!?! And, realistically, when and how do we think that would or could change? In theory, inventory levels will rise this coming Spring -- except they didn't during 2017. Looking back, the end of last November was the highest inventory level we saw for the following 12 months!?! So -- hmmm -- absent any outside factors (new home construction, anyone?) it is possible that the current inventory level (322 homes for sale) could be the highest inventory level we will see for the next 12 months!?! Stop and think about that for a moment....
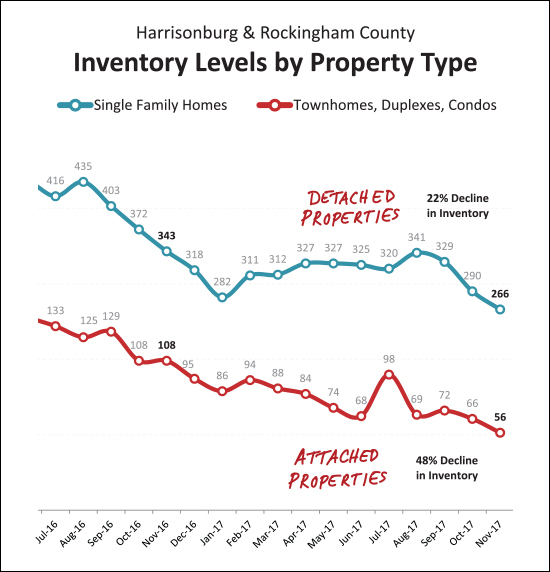
Somewhat interestingly, as shown above, there has been a larger (proportional) decline in inventory levels for attached properties (townhouses, duplexes, condos) than for single family detached properties. There are now only 56 townhouse/duplex/condo properties available for sale in all of Harrisonburg and Rockingham County! And finally -- one last look at some interesting trends....
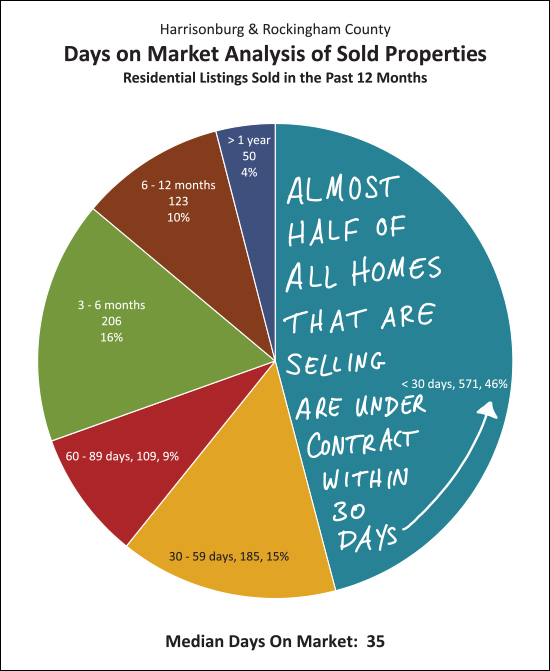
As shown above, nearly half (46%) of homes that are selling (not of all that are listed) are selling (going under contract) within 30 days of hitting the market. So -- yes -- the market is moving pretty quickly in many locations and price ranges! OK -- I'll stop there for now. There is plenty more in my full market report, so feel free to download it as a PDF, read the entire report online, or watch/listen to a video overview of this month's report. And, my reminders for buyers and sellers last month still apply.... SELLERS -- even though it is a seller's market in many price ranges right now, you must still focus on price, condition and marketing. For further reading on buying or selling in this area, check out.... | |
Local Home Prices Rise Despite Slightly Slower Sales Pace |
|
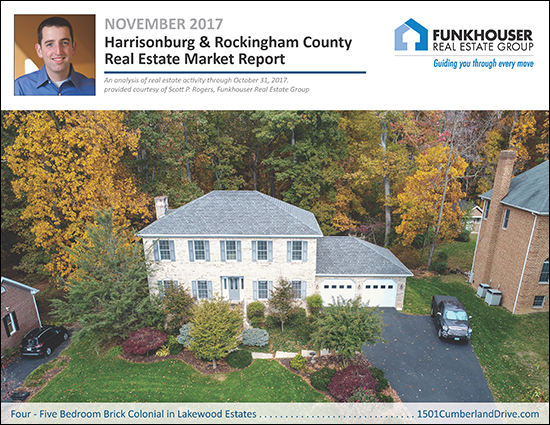 Find out more about this new listing in Lakewood Estates shown above by clicking here. I just published my most recent monthly market report, and as usual, you can read on for an overview, download the full report as a PDF or read the entire report with commentary online. Taking a look, first, at a high level overview of the market thus far in 2017.... 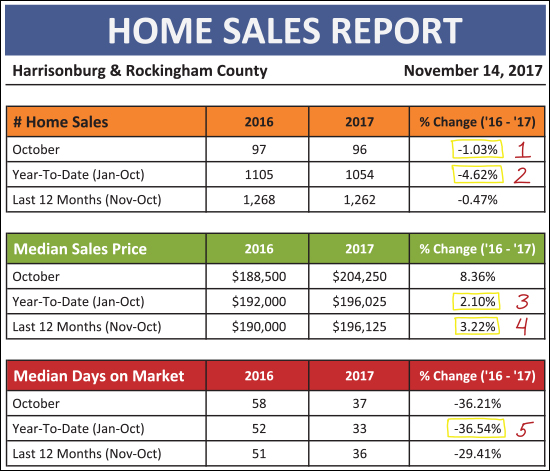 As shown above....
So -- while slightly fewer (-5%) homes are selling this year, they are selling at higher (+2%) prices, and are selling much (+37%) more quickly! 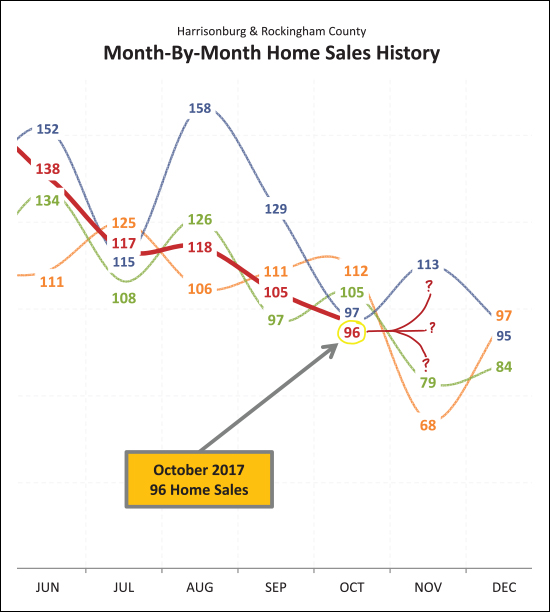 As shown above, this year lost its momentum in August and September -- where monthly home sales (118, 105) were no match for last year (158, 129). Things leveled out, a bit, in October -- with just about the same number of home sales (96 vs. 97) this year as last year. Where things will go next month is anyone's guess -- looking at the past three years, November home sales have ranged from 68 all the way up to 113! 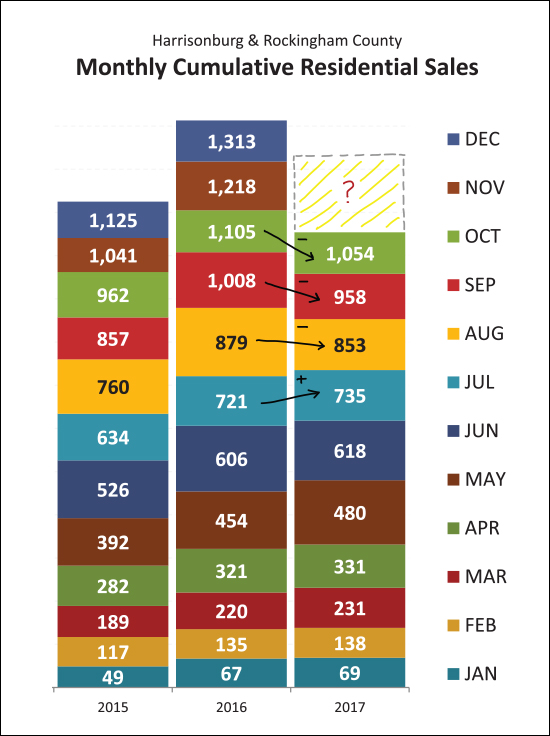 Above, visualized slightly differently, you can see that 2017 home sales were on par with (actually exceeding) last year up and through July before we then fell behind in August, September and now October. It seems certain that we'll finish out the year with fewer home sales this year than last, but more than in 2015. All that said -- as one of my clients pointed out -- maybe we shouldn't care if home sales slow down? 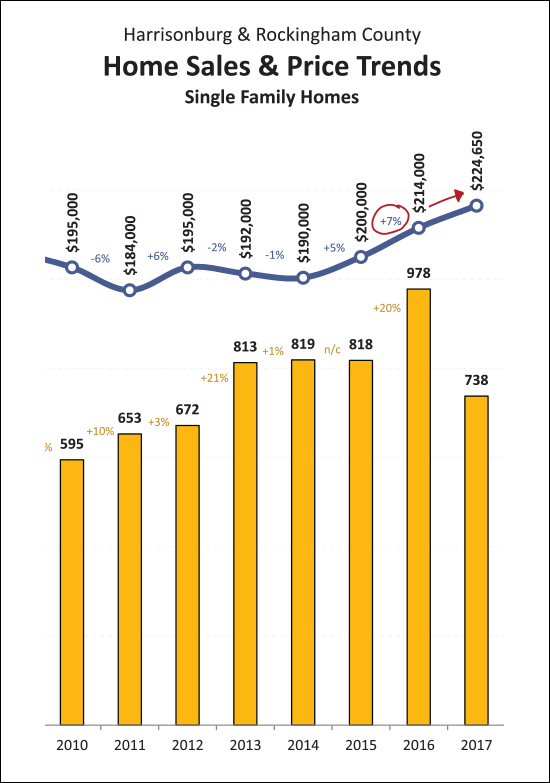 Indeed -- a slightly slower pace (-5%) of home sales might not be an negative indicator of market health -- that decline could be a result of declining inventory levels. Perhaps a better sign of a robust and improving local real estate market is the 7% increase in the median sales price of single family homes between 2015 and 2016, and the apparent 5% increase we seem likely to end up with in 2017. 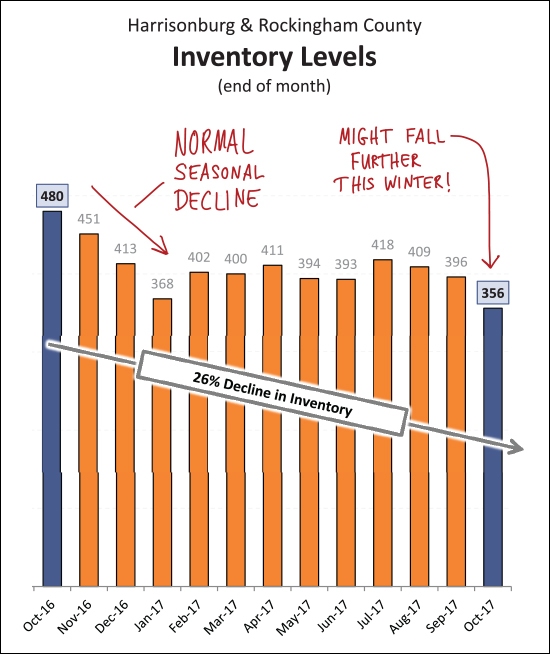 Speaking of slowing sales possibly being a result of lower inventory levels -- yes -- inventory levels are still way (-26%) below where they were last year at this time. And -- no good news here -- it would seem that we will likely see a further seasonal decline in the number of homes on the market as we continue through November, December and January!? Home buyers will likely have a tough time finding options over the next few months -- depending on their price range, where they want to (or are willing to) buy, etc. Let's pause there for now -- though I will continue to explore the latest trend in our local housing market in the coming days on my blog. Until then -- feel free to download and read my full market report as a PDF, or read the entire report online. And if you will be preparing to sell your home soon, you might find these websites helpful.... | |
Low Inventory Levels Lead to Slowing Home Sales in September 2017 |
|
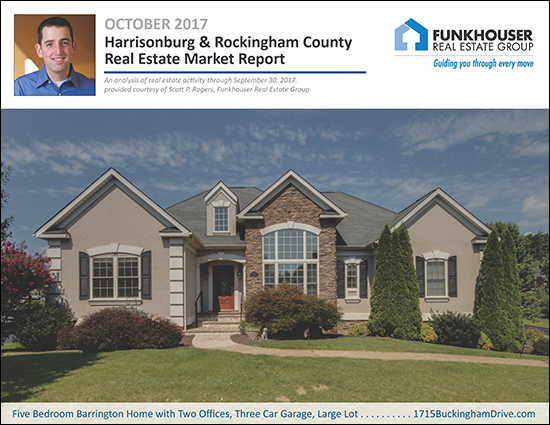 Find out more about this beautiful Barrington home shown above here. I just published my most recent monthly market report, and as usual, you can read on for an overview, download the full report as a PDF, read the entire report with commentary online, or tune in to my monthly video overview of our local housing market...  OK -- now, let's break down a bit of this data.... 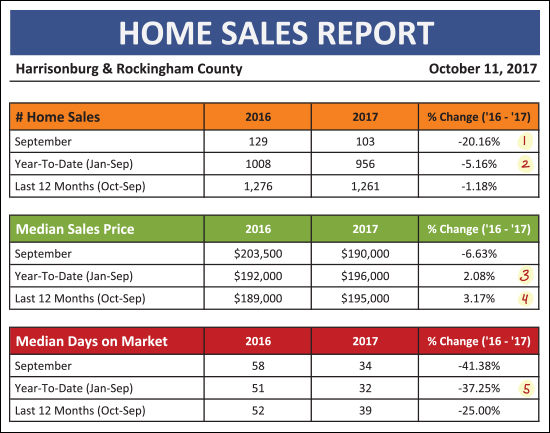 As shown above....
In summary, I believe slower sales are a result of lower inventory levels, not a result of lower buyer interest. If buyer interest were waning, we would be seeing level or declining median sales prices, and increasing time on market, neither of which are happening in the current market.
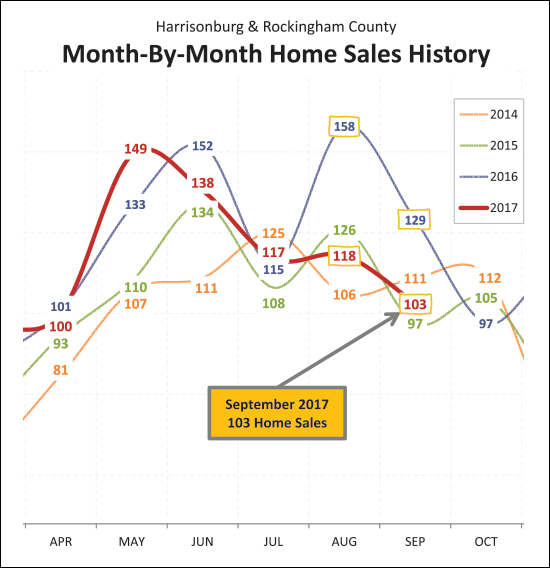
As shown above -- we saw a LOT of home sales last August and September -- a total of 287 sales. This year, during the same two months, there have only been 221 home sales. This decline of 66 home sales (Aug/Sep to Aug/Sep) has put 2017 a good bit behind 2016 when it comes to year-to-date home sales -- and it does not seem likely that the final quarter of 2017 will somehow close that gap.
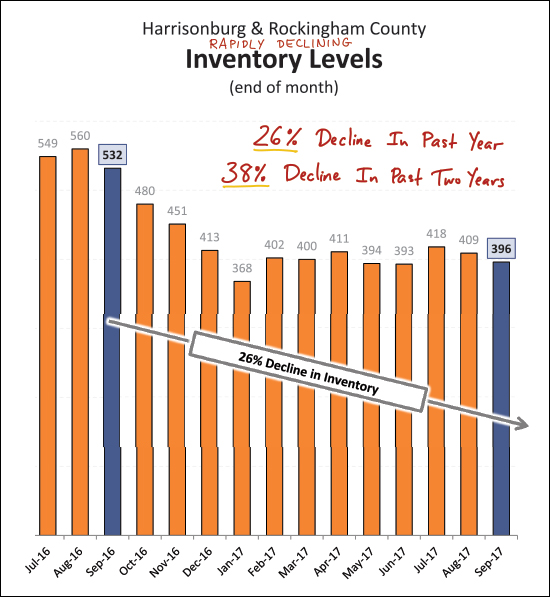
Above you will see what I'm referring to when I say that inventory levels are falling at a pace that is causing home sales to decline. Today's buyers have 26% fewer choices than buyers one year ago -- and 38% fewer choices than buyers to years ago. We knew that this would eventually cause sales to decline, as buyers won't just buy anything if it does not meet their needs now and into the future.
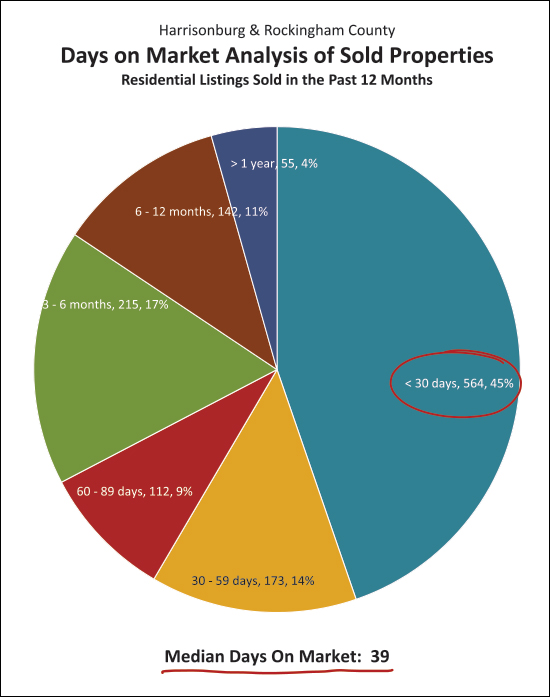
Not all homes are selling -- and not all homes are selling quickly -- but quite a few are selling quickly! The median days on market of homes sold in the past year has been 39 days! Furthermore, 45% of homes that have sold have gone under contract within 30 days! Yet another sign of strong buyer demand paired with low inventory levels. And -- one more time to drive home my point....
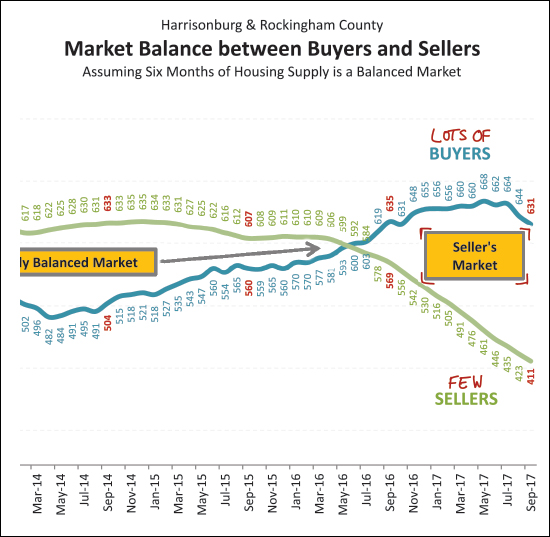
Above you will see that we are experiencing a strong seller's market right now -- with lots of buyers (having steadily increased over the past few years) and very few sellers (having steadily decreased over the past few years). There are now so few sellers that buying activity is starting to fade a bit in recent months. OK -- I'll stop there for now. I will continue to explore the latest trend in our local housing market in the coming days on my blog. And, my reminders for buyers and sellers last month still apply.... SELLERS -- even though it is a seller's market in many price ranges right now, you must still focus on price, condition and marketing. For further reading on buying or selling in this area, check out.... | |
Housing Market Slows (but prices rise) in August 2017 |
|
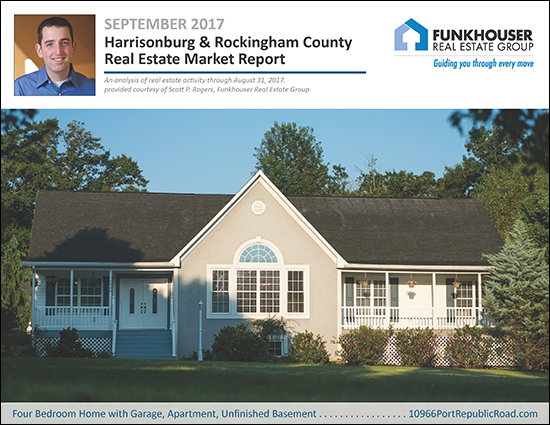 Find out more about the home shown above, with detached garage and apartment, here. As Geoffrey Chaucer put it - "all good things must come to an end" -- and August 2017 is when the "more and more home sales, every month, for ever and ever" came to an end in the Harrisonburg and Rockingham County housing market. OF NOTE -- this could be a temporary end, and it might be more about a lack of seller supply than a lack of buyer demand -- but I'm getting ahead of myself. I just published my most recent monthly market report, and as usual, you can read on for an overview, download the full report as a PDF, read the entire report with commentary online, or tune in to my monthly video overview of our local housing market...  OK, now, if you're still reading after that super easy opportunity to just listen to me explain the entire market to you, here is some further context and explanation for you.... 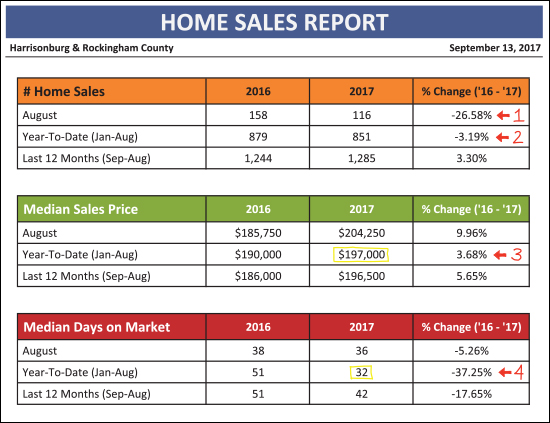 As shown above (#1), there was a significant (26.58%) decline in August home sales this year as compared to last year. This lead to (#2) an overall decline in year-to-date sales of 3.19% when comparing 2016 to 2017. Despite this slowdown in the pace of sales, the median sales price (#3) is still increasing year-over-year at a pace of 3.68% to the current level of $197,000. Furthermore, the pace at which homes are selling (#4) continues to accelerate -- with a 37.25% decline in median days on market over the past year. So --- slightly fewer homes are selling... faster... at higher prices. 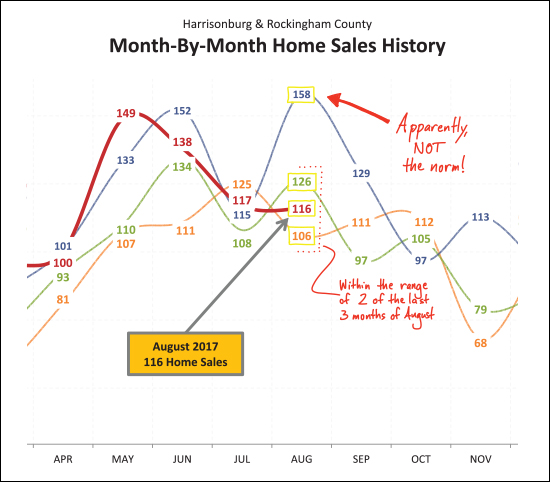 So -- here is the pretty (not pretty) picture of the difference between last year's SOARING month of 158 home sales in August 2016 -- and in comparison, the LOWLY month of 116 home sales in August 2017. Apparently, 158 home sales in the month of August is NOT the norm -- perhaps it was the result of a slow July 2016? AND -- if it is any consolation, the 116 home sales seen in August 2017 is within the range of two of the last three months of August. Hmmm....still hard to get excited about only 116 home sales in August! 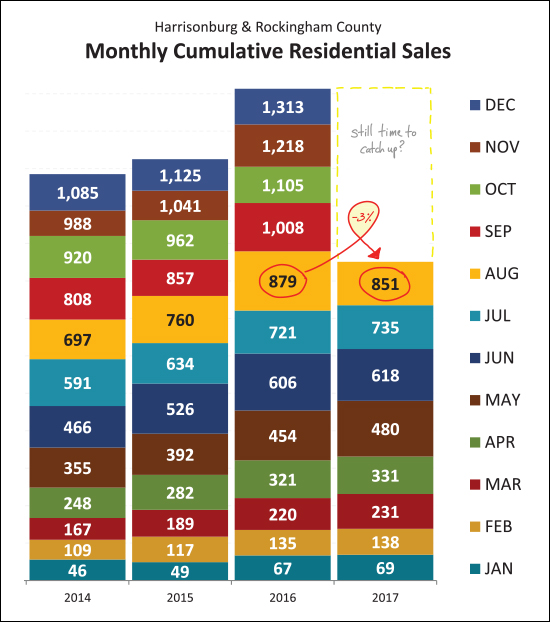 Here's another visual example of how things have changed -- every month thus far this year we have been "ahead" of 2016 home sales -- until August. We've now fallen behind (by 3%) and we only have four months to catch back up to match the overall pace of home sales in 2016. I suppose it is worth noting that there was a massive 16.7% increase in home sales between 2015 and 2016 -- so if we fall slightly short this year, it will still mark significant net growth in the pace of home sales as compared to 2014 and 2015. 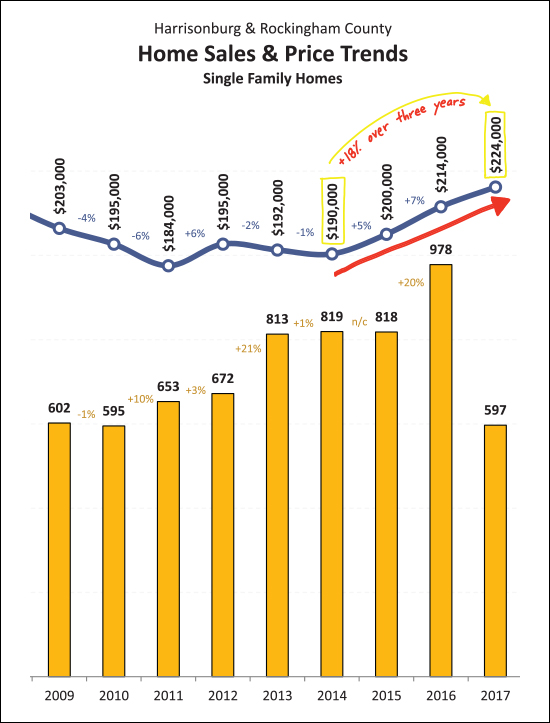 OK -- maybe I was looking for a bright spot amidst a so-so month of real estate news -- but here you go! As shown above, the median sales price of single family homes has risen 18% over the past three years! Of note -- we're close (but not quite there) to getting back up to the all-time high for our area's annual median sales price for single family homes -- which was $226,800 back in 2006. 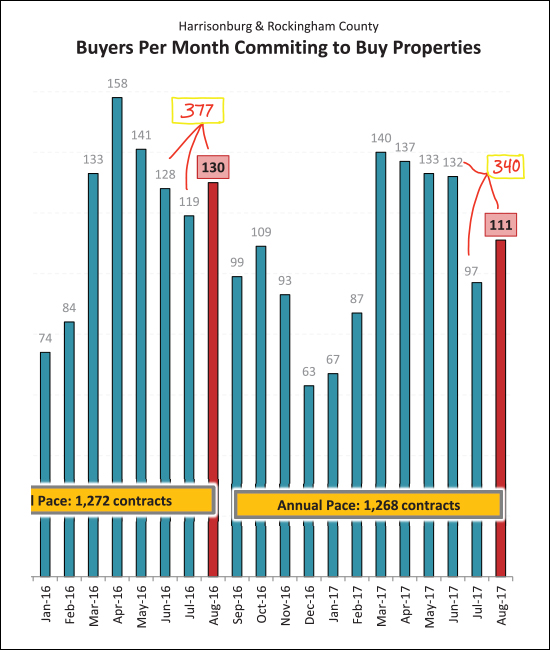 OK -- back to the not-quite-as-peppy news -- contracts were down in August as compared to last August. In fact, looking at summer (June, July, August) contracts -- there were only 340 of them signed this year, as compared to 377 last year. Possible explanations for this decline in contract activity include:
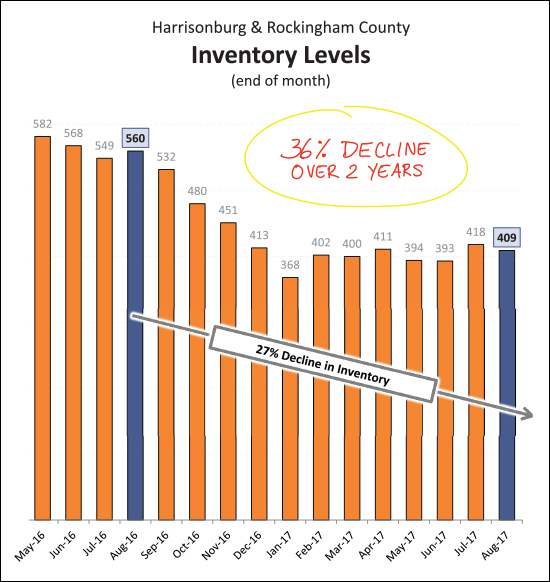 Indeed, as shown above, buyers today have 27% fewer options of homes to purchase in Harrisonburg and Rockingham County as compared to one year ago -- and 36% fewer homes to choose from as compared to inventory levels two years ago. This decline in inventory is likely playing a role in the slight (3%) year-over-year decline we are seeing in home sales in this area. OK -- I'll stop there for now. I will continue to explore the latest trend in our local housing market in the coming days on my blog. Until then -- feel free to download and read my full market report as a PDF, or read the entire report online. And, my reminders for buyers and sellers last month still apply.... SELLERS -- even though it is a seller's market in many price ranges right now, you must still focus on price, condition and marketing. For further reading on buying or selling in this area, check out.... | |
Home Sales Steady, Prices Rising in Harrisonburg Area |
|
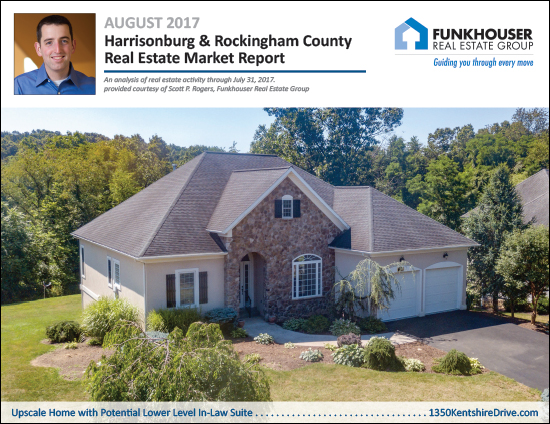 The beautiful home shown above is located in Kentshire Estates. Find out more here. July 2017 has come and gone -- and even if the temperatures don't yet feel like August -- that last month of summer is really upon us. I just published my most recent monthly market report, and as usual, you can read on for an overview, download the full report as a PDF, read the entire report online, or tune in to my monthly video overview of our local housing market...  You'll find that the video is in a new format this month, which I think you'll find much more helpful. Let me know. (click above to watch it) And now, a few items on our overall housing market.... 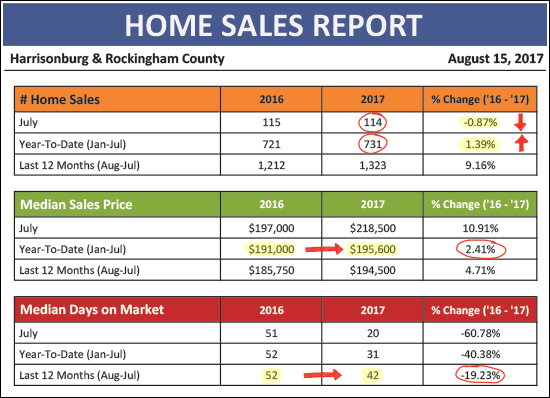 As shown above, home sales slowed, ever so slightly, in July 2017 -- to 114 sales, as compared to 115 last July. Home sales for the entire first seven months of the year, however, remained strong, at 731 home sales -- an increase of 1.39% over the pace of last year's home sales. Also of note, the median sales price has increased 2.41% over the past year, to a price of $195,600 --- and homes are selling 19% faster this year, in a median of 42 days. 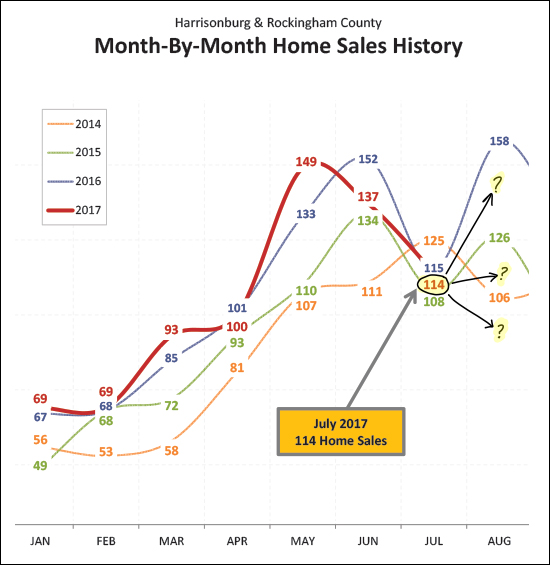 And....where do we go from here? We saw strong home sales in May and June -- but then a decline in July that put us in the middle of the pack as far as a typical July. Now, though, will we see a huge bump like last August? Or will home sales stay relatively steady, or even decline, in August? 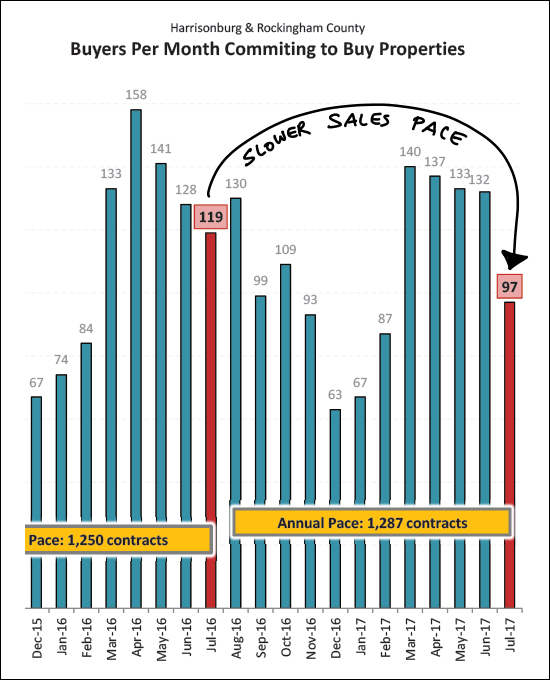 Based on the slowing rate of buyers signing contracts (shown above) I'm guessing we'll won't see a big upward spike in home sales in August. And perhaps, the slightly slower sales we're starting to see this year is a result of continually declining inventory levels.... 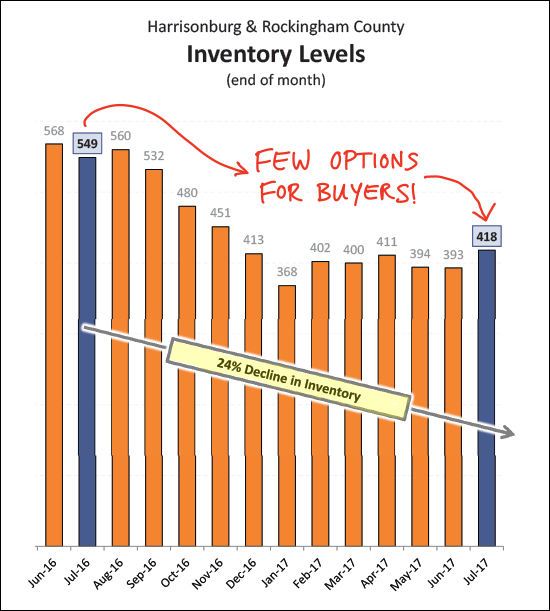 While we did see a slight upward tick in our inventory levels in July, overall, buyers still have significantly fewer options when buying in Harrisonburg and Rockingham County. And what does an increasing demand and decreasing supply lead to? 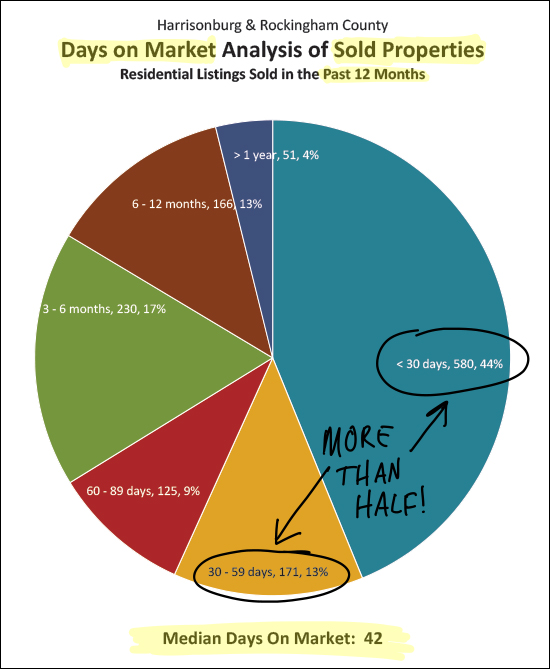 First of all, homes are selling quickly! Over half of the homes that sold in the past year went under contract within 60 days of being listed for sale. Actually, almost half of them (44%) went under contract in less than 30 days!?! 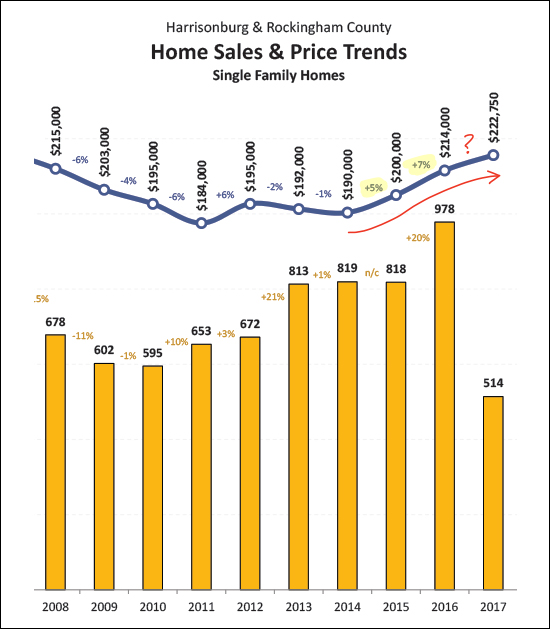 And, not only are homes selling faster, they are selling at higher prices as a result of more buyers and fewer sellers. The median sales price of single family homes has been increasing in recent years, which is likely at least in part due to more buyers buying and fewer sellers selling. Will we see another 5% or 7% increase in this median sales price this year? Only time will tell - but my money is on a 4% - 5% increase. There are actually quite a few astonishing tidbits in this month's report, but I'll get into those in the coming days on my blog. Until then -- feel free to download and read my full market report as a PDF, or read the entire report online. And, my reminders for buyers and sellers last month still apply.... SELLERS -- even though it is a seller's market in many price ranges right now, you must still focus on price, condition and marketing. For further reading on buying or selling in this area, check out.... | |
Home Sales Steady in Harrisonburg, Rockingham County in First Half of 2017 |
|
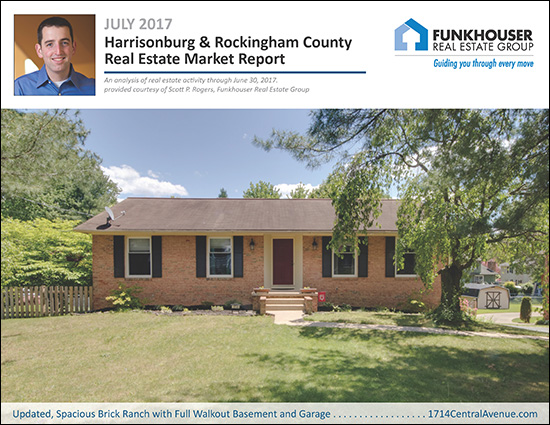 Check out fantastic home for sale on Central Avenue! June 2017 flew by like a blur -- and although home sales were a bit slower than in May 2017 -- nearly all housing market indicators are still showing signs of a robust and active local real estate market. I just published my most recent monthly market report, and as usual, you can read on for an overview, download the full report as a PDF, read the entire report online, or tune in to my monthly video overview of our local housing market...  OK -- now, back to a high level overview of where things are with the local real estate market.... 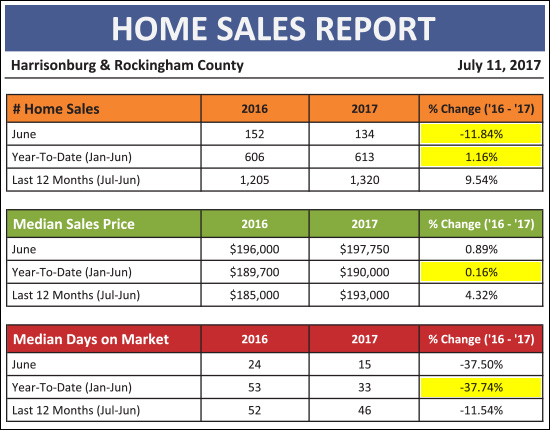 As shown above, most market indicators are looking good....
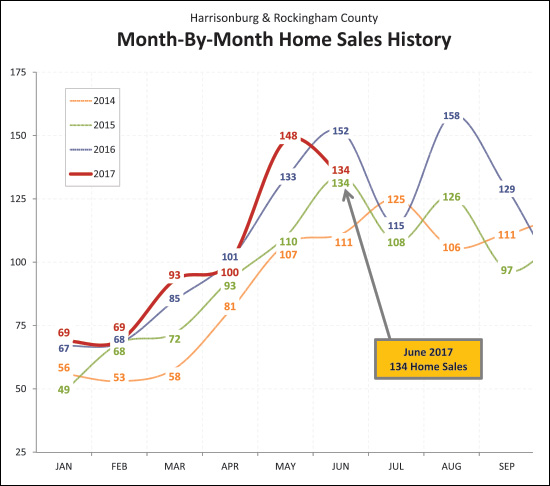 As you can see, above, home sales dropped from 148 in May to 134 in June this year -- but last year, they increased from 133 in May to 152 in June. It is hard to say why this trajectory is reversed this year -- it may have to do with when sellers happened to be ready to sell, and when buyers happened to be ready to buy this year as compared to last year. Regardless, the net change from last year to this year is a decline of only three home sales when combining May and June data. Looking forward, I believe we'll see a further decline in closings in July, or at least that is what has happened in most recent years. Unless contract activity convinces us otherwise.... 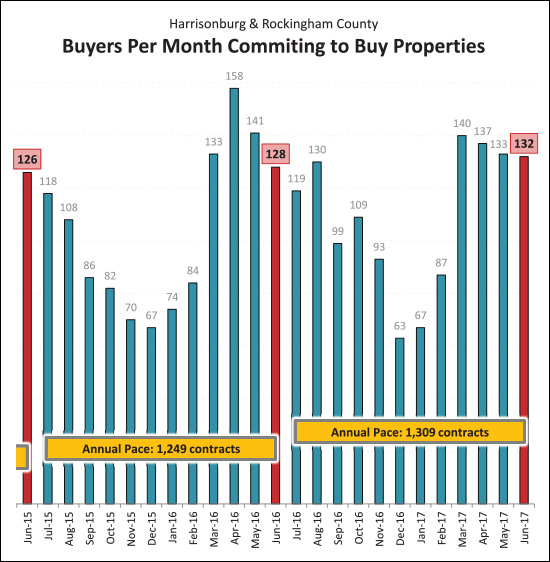 Looking at when buyers are signing contracts, it is notable that we have seen a steady stream of buyers (132 - 140 per month) over the past four months. This is a total of 542 contracts signed in the past four months -- as compared to 560 last year during the same timeframe. As we move forward, we should have at least two more months of 100+ contracts before contract activity inevitably starts to slow in September and October. And what are all of these buyers choosing from when they contract on a home? 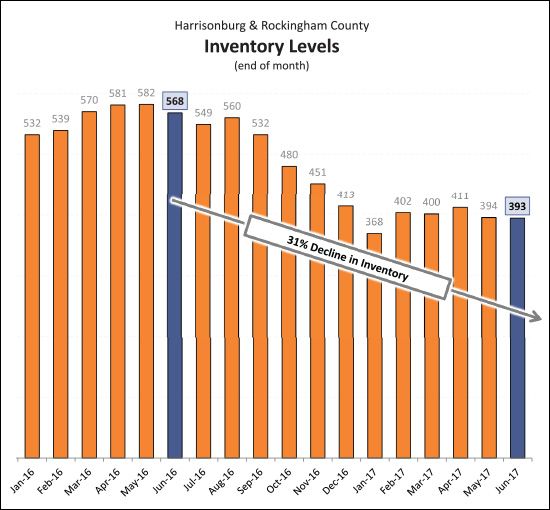 It seems that buyers are choosing from fewer and fewer homes these days! Inventory levels have been hovering around 400 homes for sale over the past six months -- and the normal influx of new listings in the Spring selling market has not been able to keep pace with a higher level of buyers buying homes. As such, we have not seen the typical increases in inventory levels between the Winter and Spring market -- there are actually FEWER homes on the market now than there were this past February! OK - now for a shocking statistic of the month.... 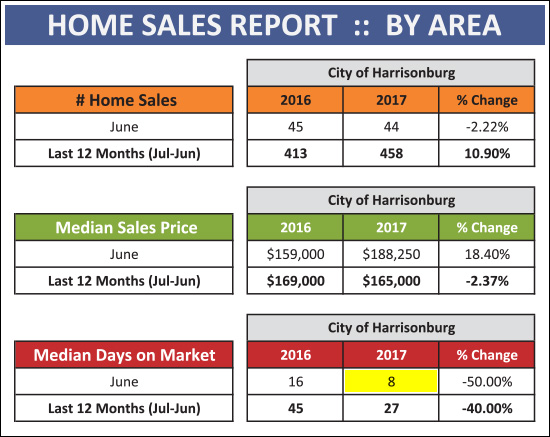 Did you catch that, above, in yellow? When looking at the homes that sold in the City of Harrisonburg during June 2017 -- the median "days on market" for those home sales was 8 DAYS!?! So, half of the homes that sold went under contract within 8 days of being listed for sale. Wow! I guess that's what you get with increasing buyer demand and decreasing inventory levels. There are actually quite a few astonishing tidbits in this month's report, but I'll get into those in the coming days on my blog. Until then -- feel free to download and read my full market report as a PDF, or read the entire report online. And, my reminders for buyers and sellers last month still apply.... SELLERS -- even though it is a seller's market in many price ranges right now, you must still focus on price, condition and marketing. For further reading on buying or selling in this area, check out.... | |
Best May Home Sales Ever! |
|
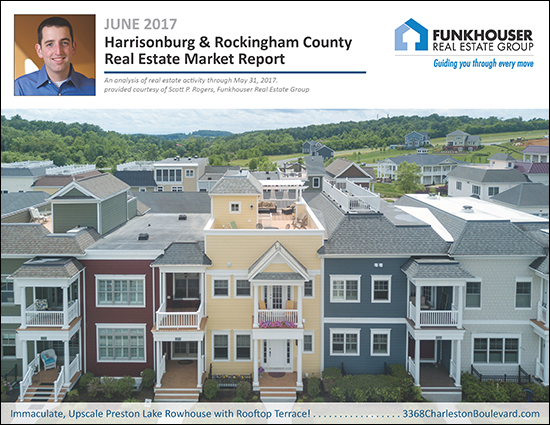 Check out this immaculate rowhouse at Preston Lake with a rooftop terrace! Wow! Both the temperatures and our local real estate market are certainly heating up! I just published my most recent monthly market report, so apply your sunscreen, read on for an overview of the blistering sales pace of 2017, download the full report as a PDF, or read it online. But first -- for those that would rather listen/watch than read -- tune in to my monthly video overview of our local housing market...  OK -- now, back to a high level overview of where things are with the local real estate market.... 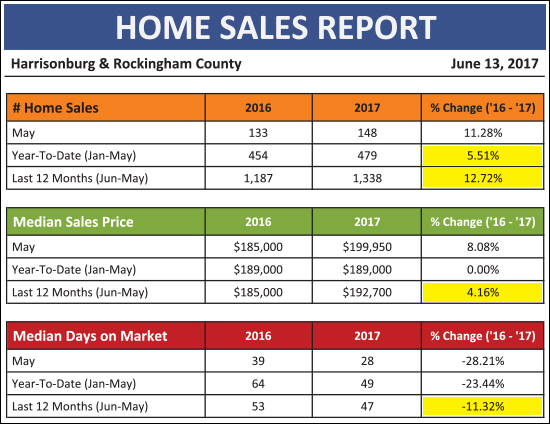 MORE HOMES ARE SELLING -- As shown above, we have seen a 5.51% improvement in the number of home sales in this area in the first five months of 2017 as compared to the same timeframe last year. Furthermore, looking at the past 12 months (1,338 sales) as compared to the prior 12 months (1,187 sales) we see a 12.72% improvement in the pace of sales. PRICES ARE SORTA-KINDA INCREASING -- Technically, the 2017 median sales price (January - May) of $189,000 is identical to where it was last year during the same time, however, over the past year the "rolling 12 month" median sales price has increased 4.16% from $185,000 to $192,700. So, we'll say that prices are sort-kinda-mostly increasing. HOMES ARE SELLING FASTER -- The median sales price of homes selling thus far in 2017 has been 49 days. This is 23% lower than last year when it took a median of 64 days for homes to sell. This calculation is based on how many days it takes for a property to be under contract after it has been listed for sale. 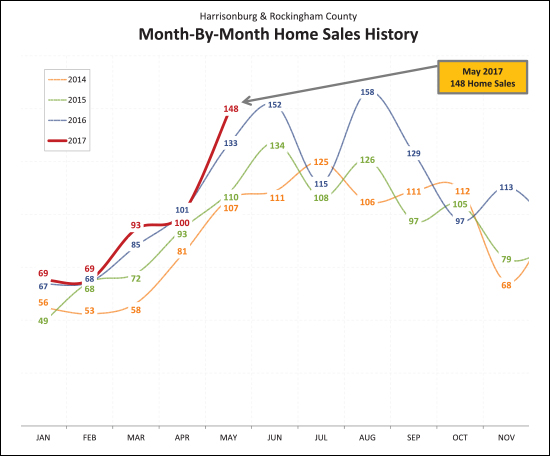 Inventory levels are LOW right now (more on that later) so when April concluded, I had some serious doubts about whether we would be able to match the 133 home sales in May 2016. But -- buyers (and sellers, I suppose) didn't disappoint -- there were an astonishing 148 home sales in May 2017! I'll delve into this history a bit more in coming days on my real estate blog, but take my word for it for now -- there have NEVER been 148 home sales in the month of May in Harrisonburg and Rockingham County! 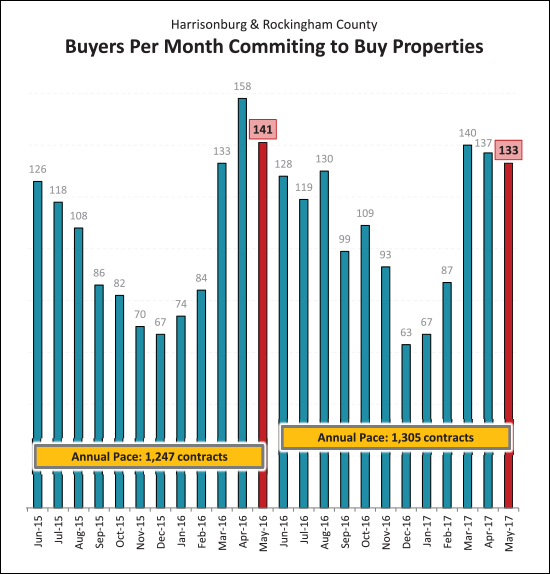 What is to come, you might ask? I'd say more sales -- maybe not quite 148 of them -- but hopefully 135 to 145 of them next month. After all, as shown above, there were 133 more contracts signed in May 2017 -- just a slight decline from the 140 and 137 seen in March and April. 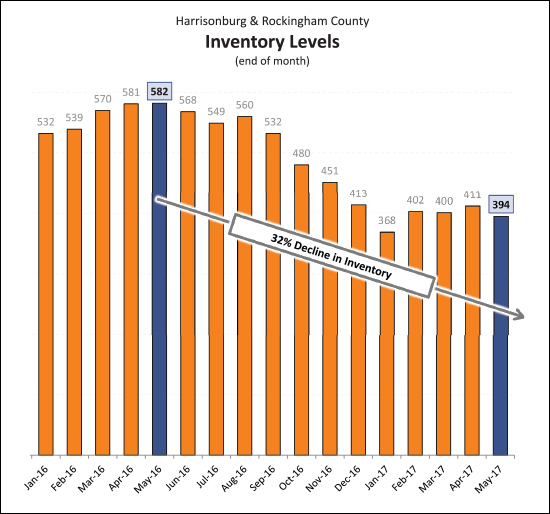 As mentioned previously, inventory levels are DROPPING! There are now only 394 homes for sale in Harrisonburg and Rockingham County -- which is 32% fewer than one year ago! Of note -- we only seem to have had sub-400 inventory levels once anytime in the past MANY years -- in January 2017. That wasn't too surprising -- inventory levels have been declining, and who wants their house on the market in January, anyhow? But now, in the month of May (June, actually)? Inventory levels below 400 are quite surprising at this time of year. 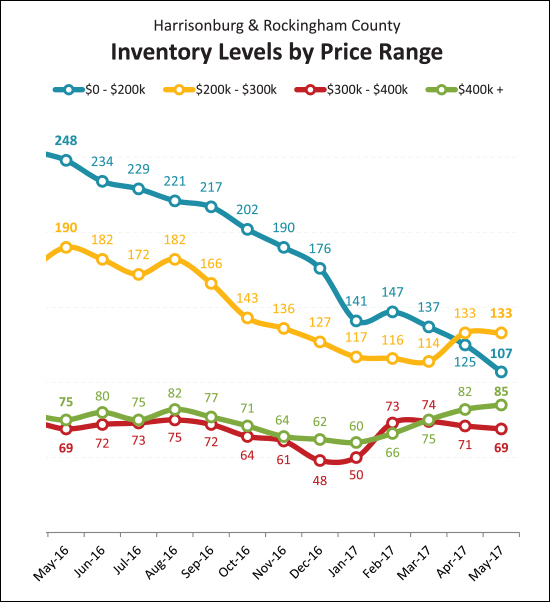 Oh -- but it gets worse -- for buyers, that is. Looking at homes under $200K, in ALL of Harrisonburg and Rockingham County, there are only 107 homes for sale!? This includes single family homes, townhouses, duplexes and condominiums. This marks a shocking 57% decline in this price range of homes in our area. OK -- there is a pile of additional information bout our local housing market in my monthly market report. If you are interested in more, feel free to download the entire thing as a PDF, or read it online. And, my reminders for buyers and sellers last month still apply.... SELLERS -- even though it is somewhat of a seller's market in many price ranges right now, you must still focus on price, condition and marketing. For further reading on buying or selling in this area, check out.... | |
Home Sales Slow Slightly in April, Perhaps Due To Low Inventory Levels |
|
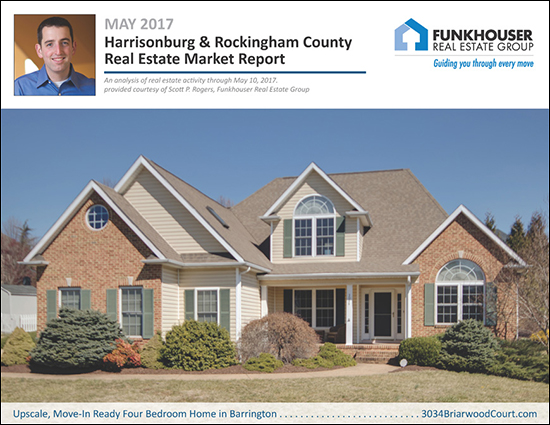 Don't miss out on this fantastic four bedroom home in Barrington -- details here. OK -- now for your local real estate news! Happy May, everyone! I have published my monthly market report, which you can download as a PDF, or read online. For the abridged version of the most important things for you to know, read on.... First -- for those that would rather listen/watch than read -- tune in to my monthly video overview of our local housing market. There's a someone humorous technical blooper 90% of the way through. It does not affect the market data being conveyed, so I left it in there for your enjoyment. :)  OK -- now, back to a high level overview of where things are with the local real estate market.... 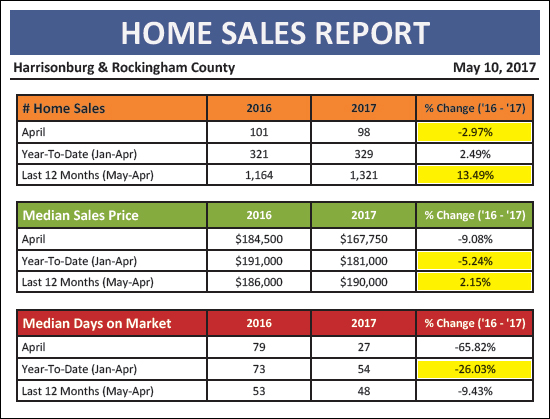 OK -- several potential stories to unpack here....
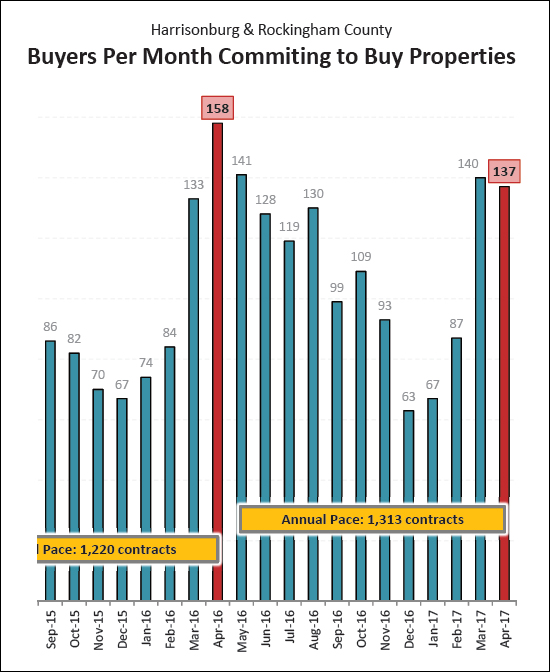
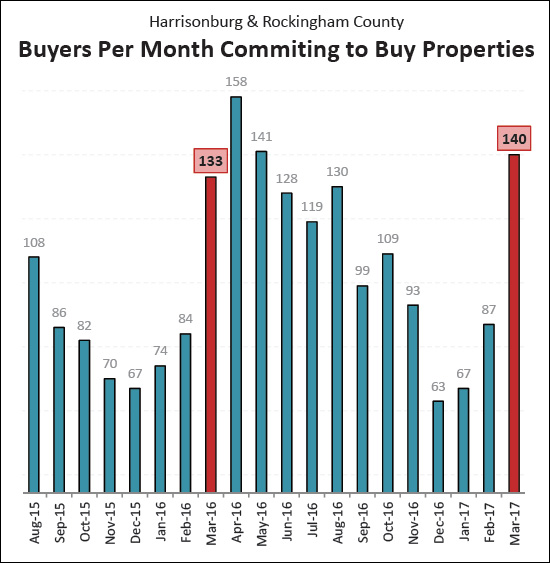
As shown above -- April 2017 was another active month of buying activity -- following closely after March's 140 contracts with 137 in April. Again, though, this does not quite stack up against the 158 contracts signed last April. The next few months could be even stronger (see 2015) or even slower (see 2016) -- and some of that may relate to how many choices buyers have from an inventory perspective. OK -- inventory, inventory, inventory -- let's get down to it....
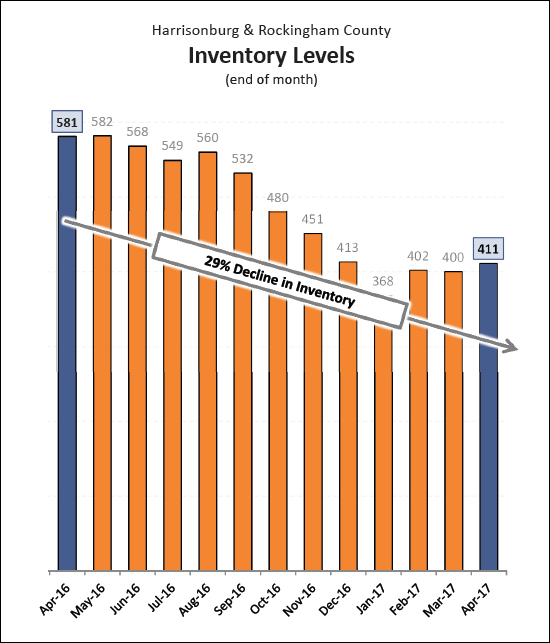
As shown above, today's buyers have significantly fewer homes to choose from -- with a 29% decline in the number of homes for sale in Harrisonburg and Rockingham County. That said, it gets even more striking in some price ranges....
That last one is shocking, and perhaps problematic -- our most active price range (average of 60 sales per month) has seen a significant drop in the number of home available to buyers. One year ago, these buyers could have selected from 256 homes -- today, only 125! OK -- there is a pile of additional information bout our local housing market in my monthly market report. If you are interested in more, feel free to download the entire thing as a PDF, or read it online. And, my reminders for buyers and sellers last month still apply.... SELLERS -- even though it is somewhat of a seller's market in many price ranges right now, you must still focus on price, condition and marketing. For further reading on buying or selling in this area, check out.... | |
Strong Home Buying (Contract Signing) Activity in March 2017 |
|
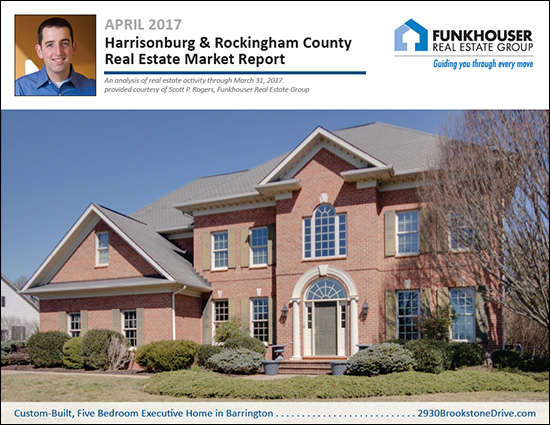 This beautiful home is 2930 Brookstone Drive - check it out here! Wow! March was a wild and crazy month in the real estate world in Harrisonburg and Rockingham County. Let's put it this way -- in the past three years, there have only been three months when more buyers have signed contracts than in March 2017! But I'm getting ahead of myself -- read on.... As you'd guess from the header image above, I have published my monthly market report, which you can download as a PDF, or read online. For the abridged version of the most important things for you to know, read on.... First -- for those that would rather listen/watch than read -- tune in to my monthly video overview of our local housing market....  And now, some general indicators of market performance.... 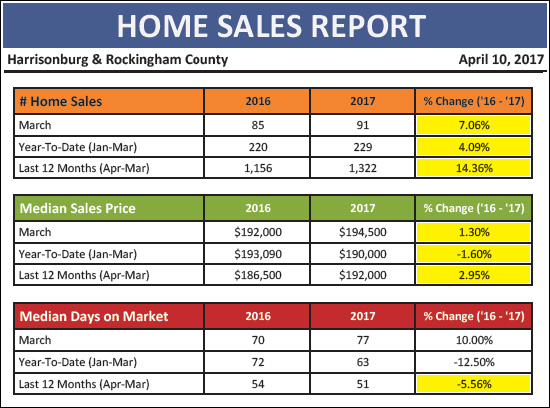 Some basic notes from this general market overview:
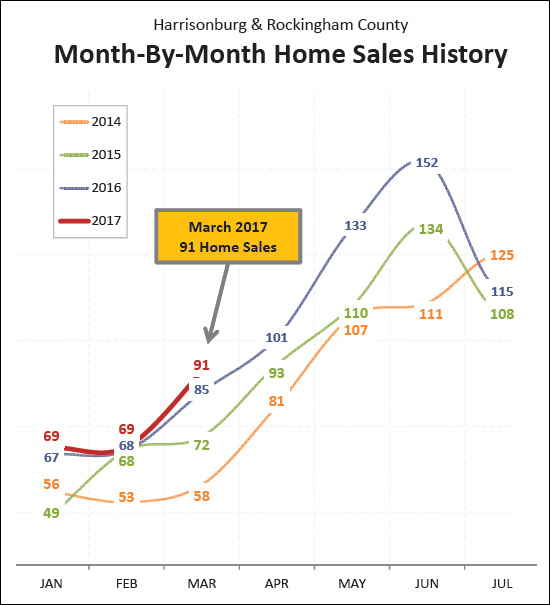
As shown above, each month of 2017 (so far!) has barely surpassed the same month of the previous year. That said, we may be about to see a significant change in that trend because....
As shown above, homes were flying off the shelf (buyers were signing contracts) faster (slightly) than I can eat donuts from Peace, Love and Little Donuts. No joking, though, as noted above, the 140 signed contracts in March 2017 exceeds all but three months from the past three years. So -- it seems likely that we'll see a pop in April 2017 home sales! With all of these homes selling, are we running out of homes for folks to buy?
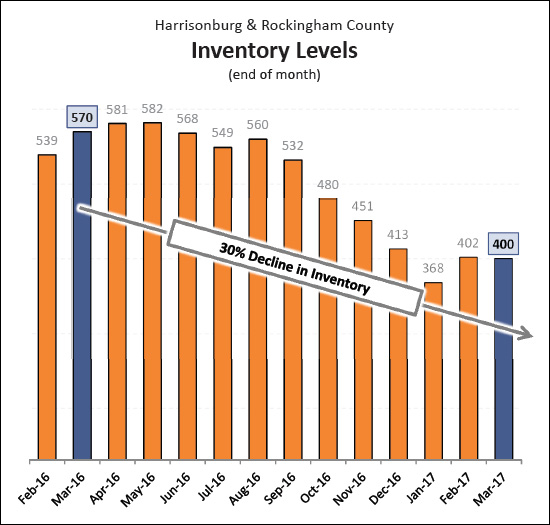
Why yes, we are! There has been a 30% decline in the number of homes for sale over the past year. And -- get this -- if we look solely at homes under $200K, there has been a 50% decline in housing inventory levels! OK -- so, more homes are selling, at higher prices, more quickly -- sounds good for sellers, right? Yes, but I would still remind all sellers that even in a seller's market it is still essential to focus on price, condition and marketing. And what is a buyer to do in some crazy times as these? Be prepared! Know the market, know the process, know your buying power, and monitor new listings closely! If you're interested in even more market data, read my full online market report, download the PDF, or click here to sign up to receive my real estate blog by email. Here are two handy references to prepare yourself to buy or sell a home.... | |
February Home Sales (and temperatures) Higher Than Expected |
|
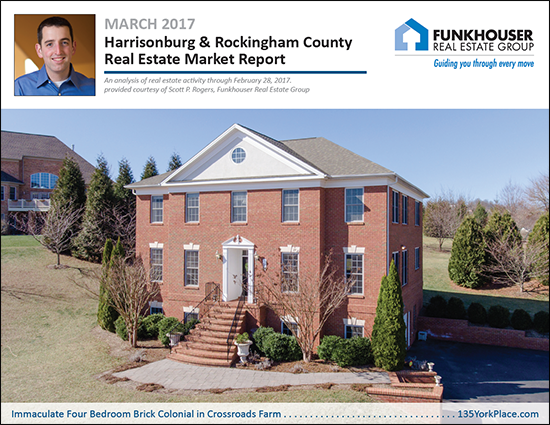 The beautiful home on the cover of my market report is 135 York Place - check it out here! Yes, yes, I know. Within mere hours of sending this market report that mentions are area's unseasonably warm temperatures of late -- it will be snowing -- but I am not going to believe it is really happening until I see the snowflakes myself. If it does snow, feel free to take a break from clearing the driveway to sit by the fire, drinking hot cocoa, reading my full monthly market report. Now, on with the news of our local housing market.... As you'd guess from the header image above, I have published my monthly market report, which you can download as a PDF, or read online. For the abridged version of the most important things for you to know, read on.... First -- for those that would rather hear me talk about this -- tune in to my monthly video overview of our local housing market....  Next, some basic stats that we keep up with on a monthly basis.... 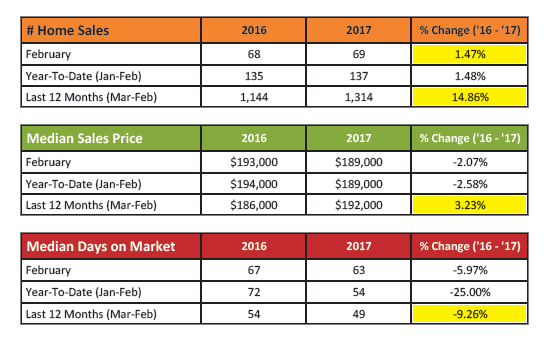 OK -- a few things to note here, based on the data table above.... First, so far, it is looking like one of my 2017 predictions might be wildly incorrect. I have had some concerns about whether there would be enough housing inventory to support the same sales levels as we experienced last year. So far, it has not been a problem. Even though there are now 25% fewer homes on the market as compared to a year ago, we have actually seen a net gain (small as it may be) of two more sales (137) in the first two months of 2017 as compared to (135) last year. Also referencing the data table above, when looking at the rolling 12-month median sales price, we are still seeing a 3-ish percent increase in median sales price as compared to a year ago. Finally, homes have been selling 9% faster in the past 12 months as compared to the previous 12 months. 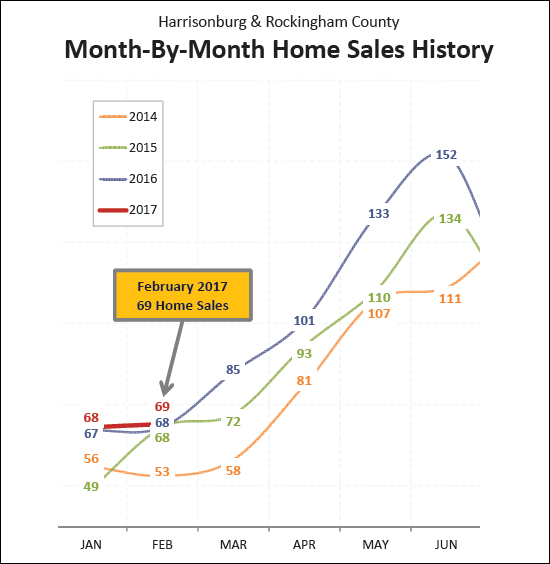 Looking at the graph above, you might note the extraordinarily high home sales seen last year in the months of March through June, as well August and September. The mystery this year is whether our local housing market can stay on pace with that aggressive pace of home sales. So far, so good! This January and February both barely edged out the same month last year -- so we are seeing a year-to-date increase in the number of homes sold in this local market. 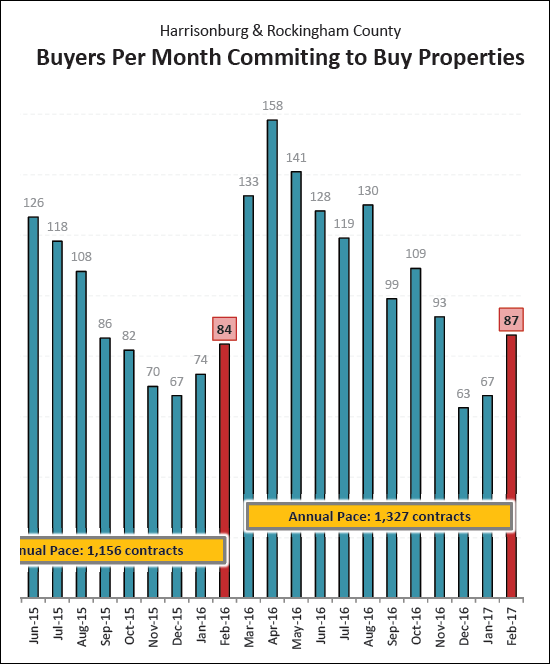 Next, looking at the graph above we note that February 2017 saw 87 buyers signing contracts to buy homes -- as compared to only 84 last February. This small jump is reassuring after having seen a decline from 74 contracts to 67 contracts when comparing the past to months of January. All-in-all, the annual increase in contract activity (from 1156 to 1327) make sense in the light of the 15% increase in the pace of home sales that we have seem over the past year. 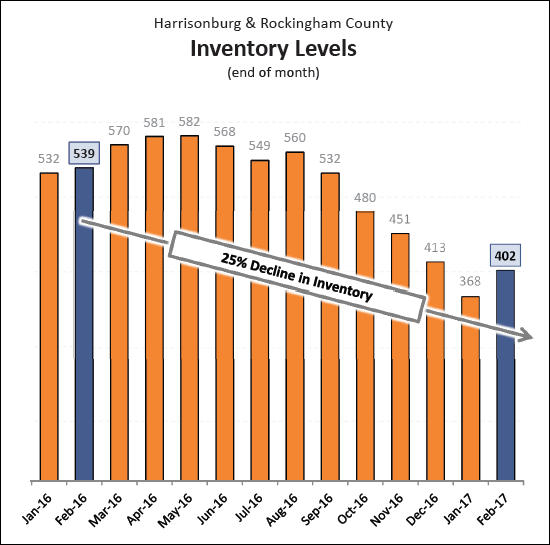 So -- how about those inventory levels? We have seen a 25% year-over-year decline in our market's overall inventory levels. Buyers today only have 402 homes to choose from as compared to 539 a year ago -- though that masks the super-limited choices buyers ACTUALLY have once they introduce their overlays of price, location, size, age, etc. All that said, we are finally starting to see the normal, seasonal increases in listing inventory we'd expect to see at this time of year. Inventory has climbed from 368 homes to 402 homes over the past month. OK -- I'm going to pause there for now and go try to find my snow boots. I'll look further at trends in our local housing market in coming days on my blog. Until then, feel free to read my full online market report, or download the PDF, or click here to sign up to receive my real estate blog by email. And -- as is always my encouragement -- if you will be buying or selling a home in the near future, start learning about our local housing market sooner rather than later! Being informed will allow you to make better real estate decisions.
| |
Sales Up, Prices Up, Inventory Declining Drastically |
|
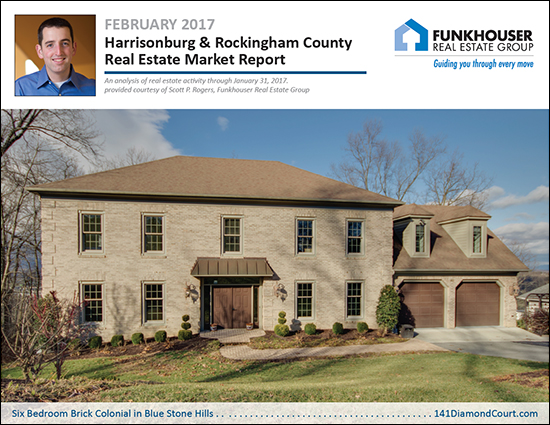 Learn more about this month's Featured Property: 141 Diamond Court I just published my monthly report on the Harrisonburg and Rockingham County real estate market. Jump to the full online market report, watch the video overview below, download the PDF, or read on for highlights.... First, a video overview....  Now, let's take a look at the overall market performance in January 2017.... 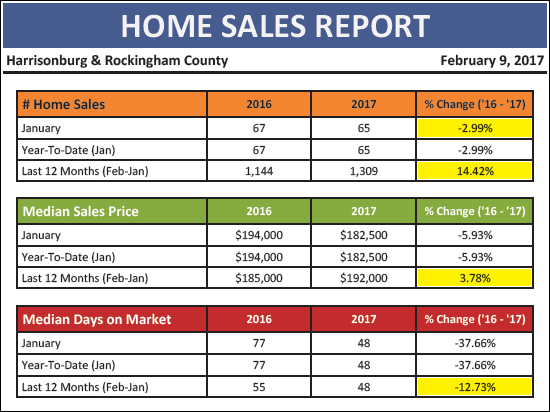 As shown above, home sales were slightly (3%) slower in January 2017 -- but added to recent strong months of sales to show a 14% year-over-year improvement in the annual pace of home sales. Furthermore, median sales prices have increased 3.78% over the past year -- and days on market has declined by 13%. Next, taking a look at buyer activity in the way of signed contracts.... 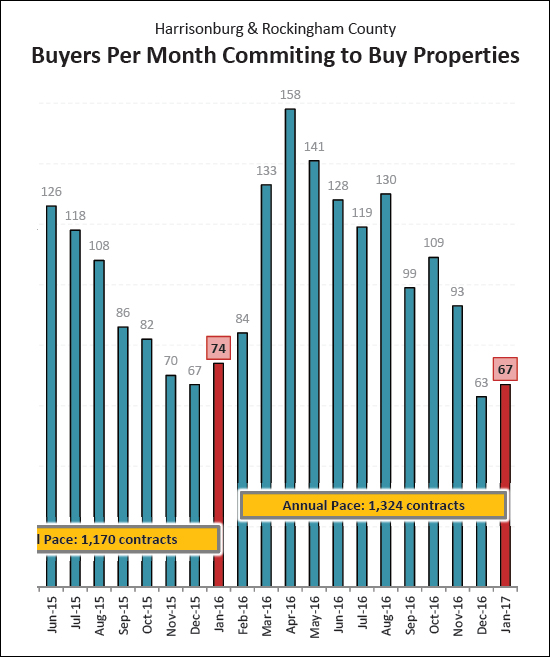 As shown above, buyers signed contracts at a slightly slower pace (67 contracts) in January 2017, as compared to in January 2016 -- when 74 buyers signed contracts. That said -- the annual pace of contract activity (1,324 in the past year) is still markedly above the prior year when there were 1,170 contracts signed. We are likely to see a bit more contract activity in February 2017 -- but really see things take off in March if last year is any indication. BUT NOW -- THE BIG STORY.... 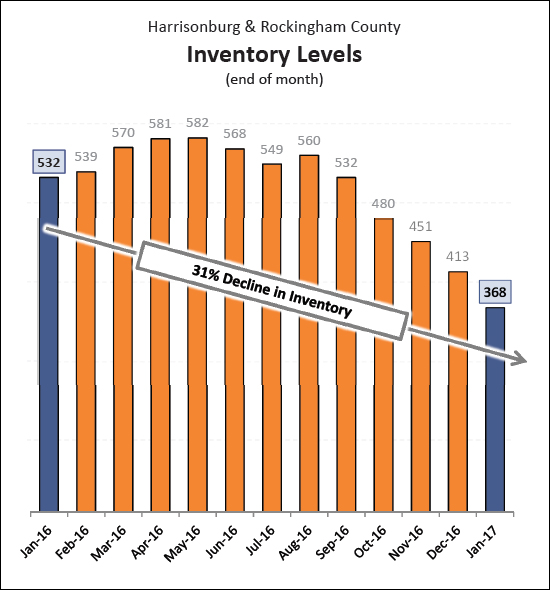 As shown above, we are seeing a DRASTIC decline in the number of homes for sale in our local market. One year ago, buyers in the market for a new home would be selecting from 532 homes (in all price ranges and locations) but now they would only have 368 options. This is a drastic reduction in the number of homes available for sale, which could lead to increases in sales prices, or reductions in the number of homes that actually sell this year -- due to not having enough homes on the market for buyers to purchase. BUT IT GETS EVEN MORE EXTREME.... 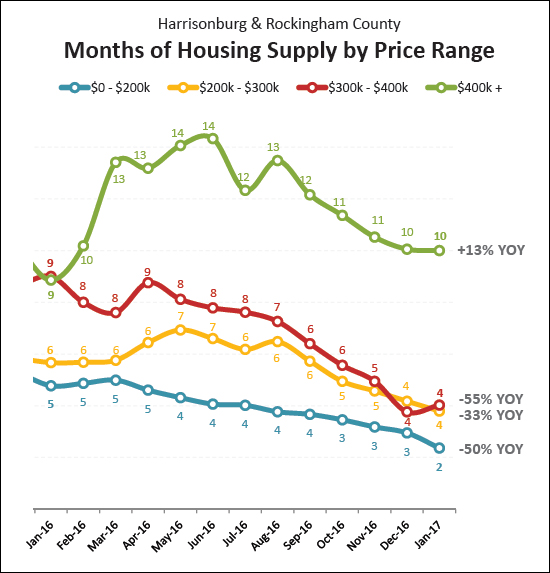 Many housing market analysts consider a six month supply of homes to be a balanced market between buyers and sellers. That is to say that if 100 homes are selling per month, then the market would be balanced if there were 600 homes for sale. As shown above, the market is out of balance in several price ranges. There are only four months of homes for sale in the $200K-$300K price range and the $300K-$400K price range -- but even more significant -- there are only TWO MONTHS of homes for sale under $200K. That is to say that if no other properties were put on the market under $200K, then in two months time, we could be all the way down to no inventory at all on the market. So, as is likely evident, we need more homes to be listed for sale in the next few months to have any chance at having a normal Spring and Summer market in Harrisonburg and Rockingham County. There is plenty more to learn and consider in this month's market report, such as....
I will explore many of these topics in coming days on my blog. Until then, feel free to read my full online market report, or download the PDF, or click here to sign up to receive my real estate blog by email. And -- as is always my encouragement -- if you will be buying or selling a home in the near future, start learning about our local housing market sooner rather than later! Being informed will allow you to make better real estate decisions. | |
Year End Home Sales Report Shows Rising Prices, Soaring Sales in 2016 |
|
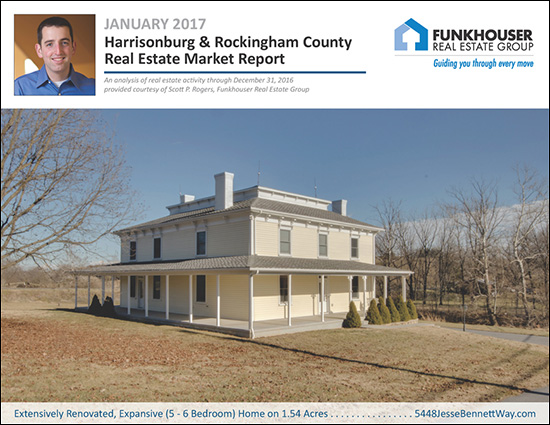 Learn more about this month's Featured Property: 5448 Jesse Bennett Way I just published my monthly report on the Harrisonburg and Rockingham County real estate market. Jump to the full online market report, watch the video overview below, download the PDF, or read on for highlights.... First, a video overview....  Now, let's take a look at the overall market performance in 2016.... 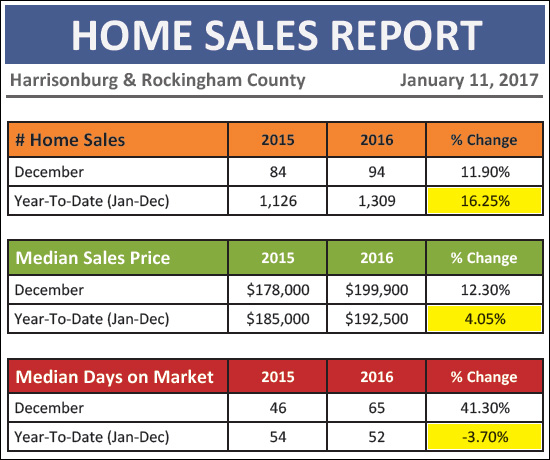 Home sales increased 12% in December 2016 to add to the overall excitement of the year and we now, finally have a full year of data to work with -- and my oh my, what a year it was in the Harrisonburg and Rockingham County residential real estate market! With all of the data in, we find....
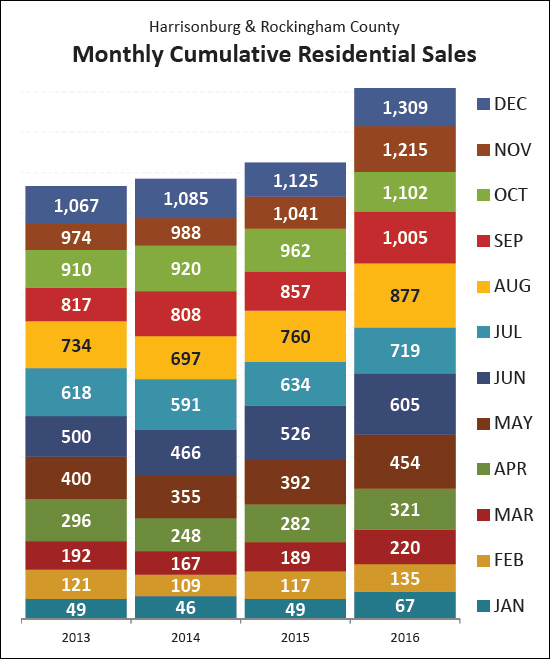 As you can see, above, home sales started quickly in 2016 and never slowed down -- finishing the year out well above the pace of home sales in any recent year. Now, let's take a closer look at the trends we have seen over the past two years.... 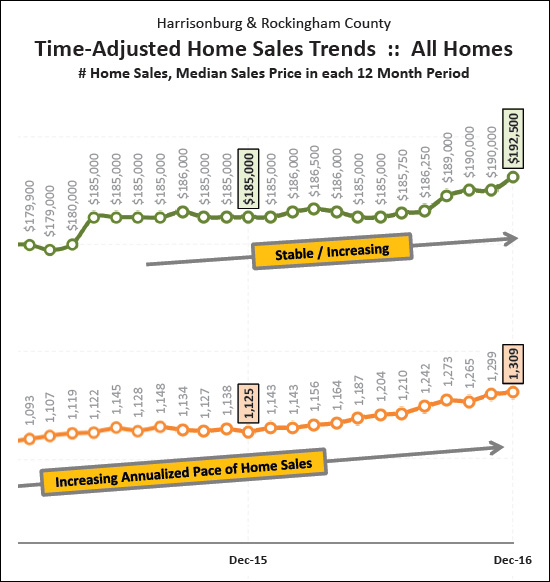 The graph above shows a rolling 12 months of the number of home sales in the Harrisonburg and Rockingham County area, as well as the median price of the homes that sold during these time frames. Each data point shows one year's worth of home sales, which eliminates the volatility of evaluating sales figures on a monthly basis. What jumps out to me is that....
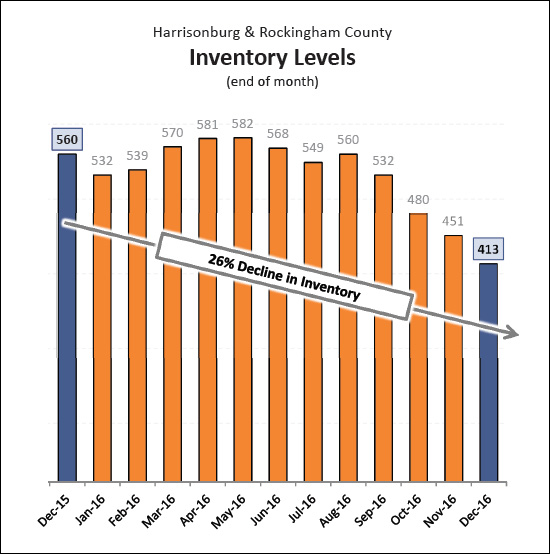 As shown above, buyers only have 413 homes to choose from today -- as compared to 560 one year ago. That is a 26% decline in the number of homes for sale over the past year -- all while we have seen a 16% increase in the number of homes sold. In some ways, the increased sales have created the inventory problem -- buyers have been purchasing homes left and right and depleting the inventory of homes for sale. But now that inventory levels are so low, we must wonder whether sellers will keep pace (in listing their homes) with the buyer demand that we are likely to see in 2017. I'll pause here for now, with you knowing that sales are up (16%), prices are up (4%) and inventory is down (26%) in Harrisonburg and Rockingham County. There is plenty more to read in my full monthly market report, which you can find over at HarrisonburgHousingMarket.com. In coming days on my blog, I'll be exploring....
Until then, feel free to read my full online market report, or download the PDF, or click here to sign up to receive my real estate blog by email. And -- as is always my encouragement -- if you will be buying or selling a home in the near future, start learning about our local housing market sooner rather than later! Being informed will allow you to make better real estate decisions. | |
Home Sales Surge, Prices Rise, Inventory Drops in November 2016 |
|
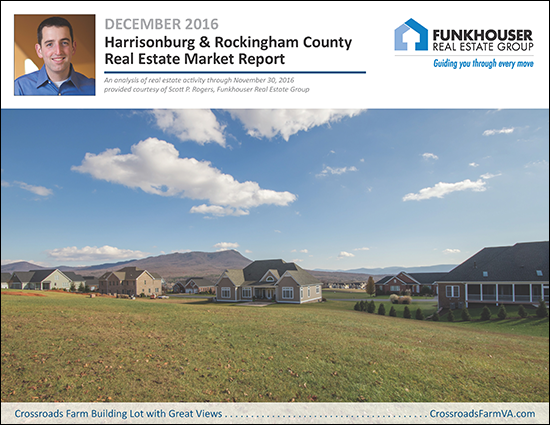 Learn more about this month's featured property: 130 Bedford Place I just published my monthly report on the Harrisonburg and Rockingham County real estate market. Jump to the full online market report, download the PDF, or read on for highlights.... First, let's take a look at the overall market performance in November.... 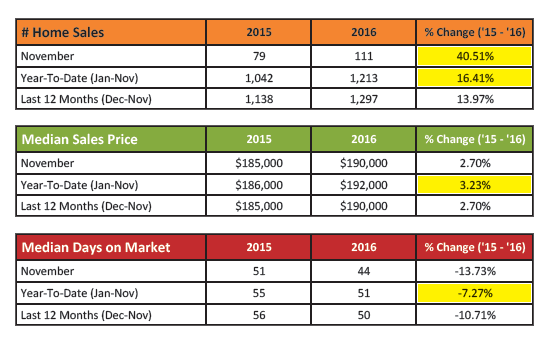 As shown above, it was a very strong month of sales performance in November. Here are a few highlights....
So, how is the overall year doing compared to previous years.... 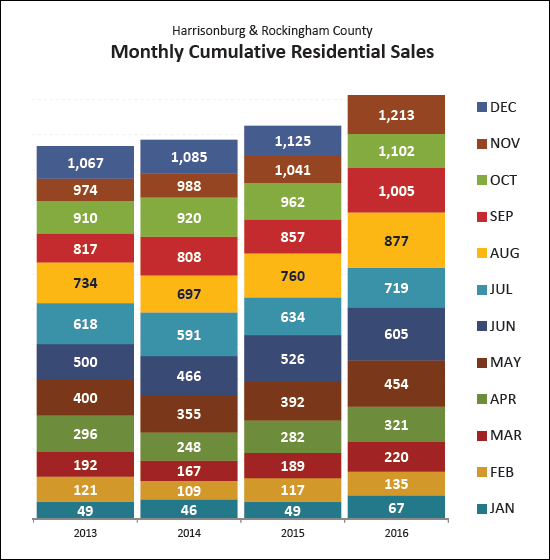 We have already seen more home sales in the first eleven months of 2016 than we saw in the full year of 2013, 2014 and 2015. At this point, we seem likely to finish out 2016 with more than 1,300 home sales! 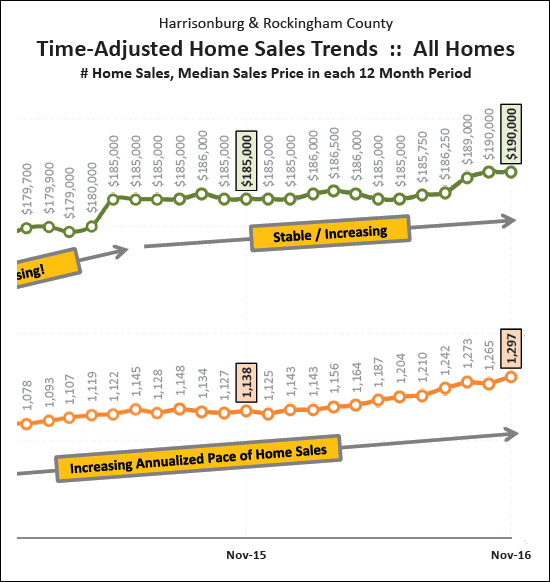 The graph above looks at a rolling 12-month window of sales data, showing the slow and steady progress we have made climbing to almost 1300 sales per year, and increasing (very recently) to a median sales price of $190,000. As demand increases (more buyers) prices start to increase if there is not more supply (more sellers) to meet that demand. Speaking of the supply of homes for sale.... 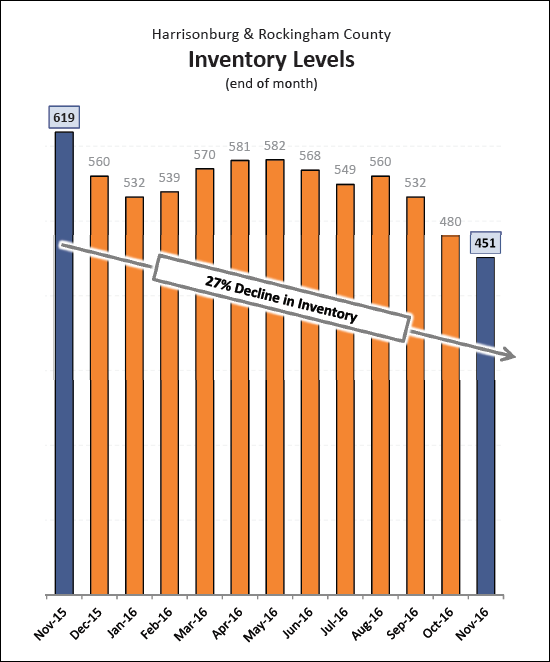 As mentioned above, increased demand (buyers) without increased supply (sellers) leads to increases in prices. Well, as shown directly above, we have certainly not been seeing an increasing supply of homes for sale -- in fact, we have seen a 27% decline in home sellers over the past year! To meet the increasing supply, we need more current homeowners to be selling, as well as more new construction to take place. 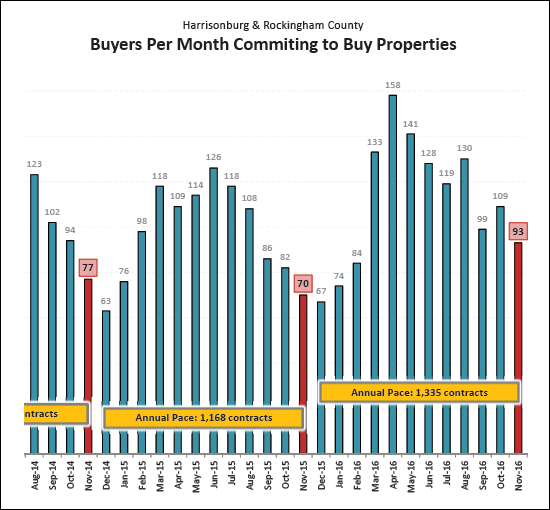 And -- guess what -- home sales are not likely to slow down much in December 2016, based on the 93 contracts signed during November 2016 -- which marks a 33% increase over the 70 contracts signed in November 2015. OK, there is plenty more to explore, such as....
But -- I'll let you read all about those tidbits via my full online market report, or by downloading the PDF, or by clicking here to sign up to receive my real estate blog by email. And -- as is always my encouragement -- if you will be buying or selling a home in the near future, start learning about our local housing market sooner rather than later! Being informed will allow you to make better real estate decisions. | |
Local Homes Sales Up 14% YTD Despite Slower Sales in October 2016 |
|
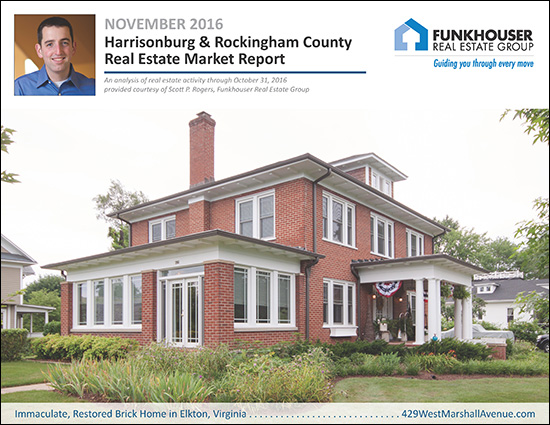 Learn more about this month's featured property: 429 West Marshall Avenue I just published my monthly report on the Harrisonburg and Rockingham County real estate market. Jump to the full online market report, download the PDF, or read on for highlights.... First, let's take a look at the overall market performance in October.... 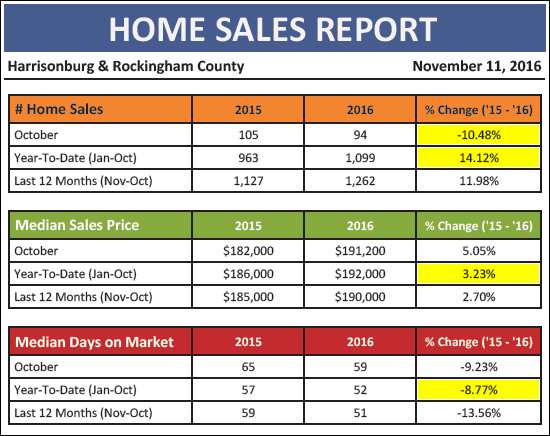 A few highlights from the quick snapshot above....
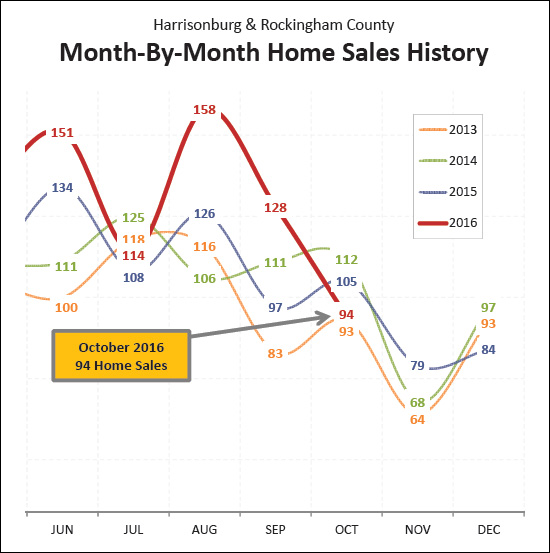
OK -- as noted above, the 94 homes sales seen in October 2016 mark a 10% decline as compared to the 105 home sales in October 2015, and that was even lower than the 112 home sales seen in October 2014. But before you get overly depressed about a slower October, remember....
So, it seems that the timing of home sales during the year can vary significantly from year to year. Looking at the past three months together can help put things in perspective in some ways....
There, not so bad now, right? That's a 16% improvement over last year when looking at these three months -- and as noted above, when looking at January through October, the pace of home sales in 2016 is 14% higher than it was last year. OK, on to some other items....
The median value of single family (detached) homes is often the best indicator of trends in home values in a local housing market. As shown above, we have been seeing those values increase over the past five years, most notably over the past two years. Also of note, as shown above, after hovering between 810 and 820 home sales per year for the past three years, it seems we are finally poised to break through that invisible barrier this year, as we are likely to see at least 900 and perhaps 950 single family home sales.
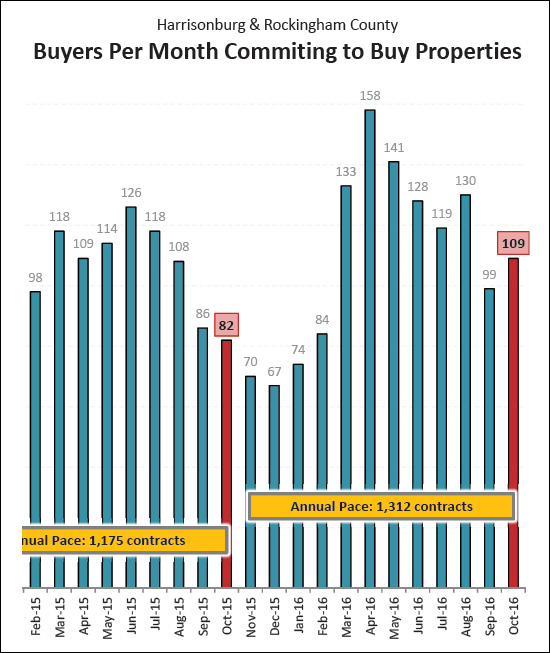
If my consoling notes above about why slower October home sales weren't so bad didn't help, then perhaps the graph above will help. Slower home sales in October 2016 does not mean that the fast and furious pace of 2016 home sales has come to an end. As shown above, buyers (and sellers) signed 109 home sales in October 2016 -- a 33% increase over the 82 contracts signed last October. So -- we might be in for another month of stronger sales in November.
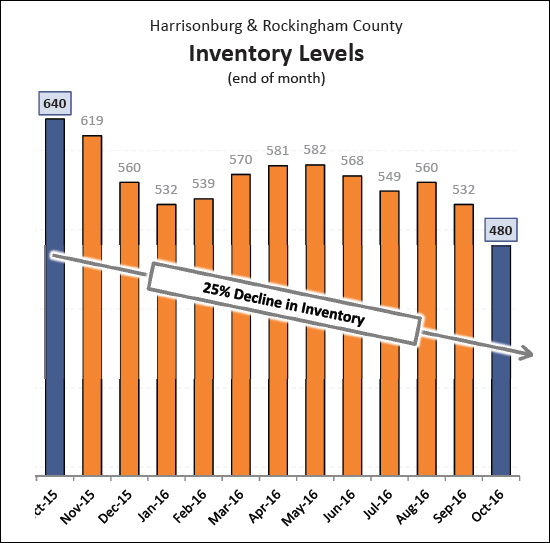
If you are trying to buy a home right now, it is quite possible that you are frustrated by not having many options to choose from. The graph above might explain why you are having this experience. Inventory levels continue to fall -- to where we now only have 480 homes on the market!?!?! This is as compared to a year ago when there were 640 homes on the market at this time -- showing a 25% year-over-year decline. This lack of inventory is slowly starting to tip the market in the favor of sellers, though not in all price ranges and not in all locations. OK, there is plenty more to say, such as....
But -- I'll let you read all about those tidbits via my full online market report, or by downloading the PDF, or by clicking here to sign up to receive my real estate blog by email. And -- as is always my encouragement -- if you will be buying or selling a home in the near future, start learning about our local housing market sooner rather than later! Being informed will allow you to make better real estate decisions. | |
Astonishingly High Home Sales in September 2016 |
|
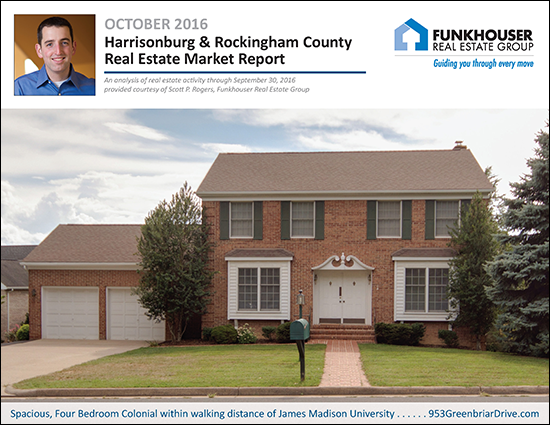 Learn more about this month's Featured Property: 953 Greenbriar Drive I just published my monthly report on the Harrisonburg and Rockingham County real estate market. Jump to the full online market report, download the PDF, or read on for highlights.... First, let's take a look at the overall market performance in September.... 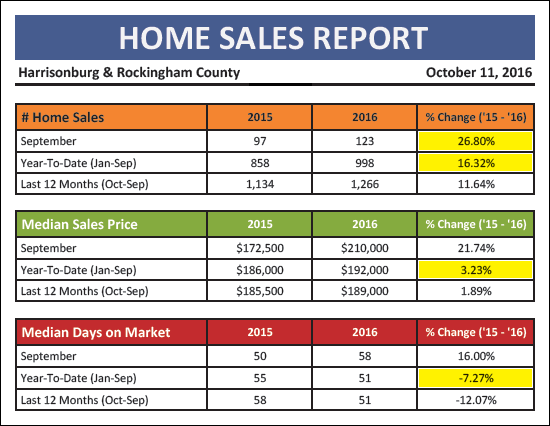 A few highlights from the basic data breakdown outlined above....
Now, let's contextualize those strong September sales.... 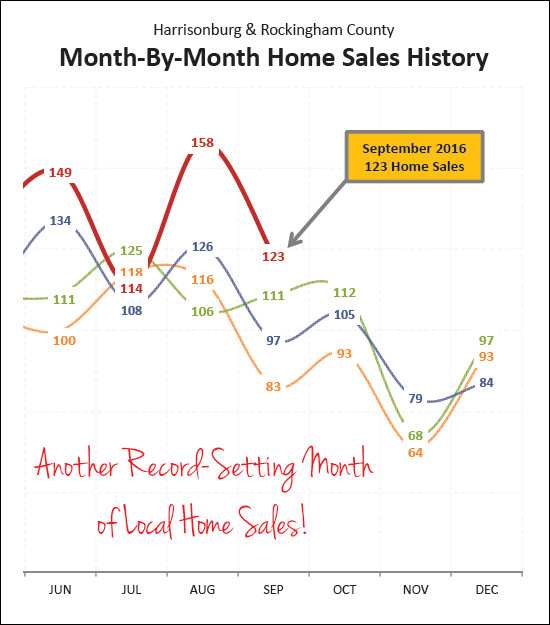 As stated above, there were a LOT of home sales in September 2016 -- a whopping 123 of them. When was the most recent time when we saw this many homes sales (or more) during the month of September? Waaaaaaay back in September 2005 when there were 136 home sales seems to be the only time we have ever seen more than 123 home sales. Wow! 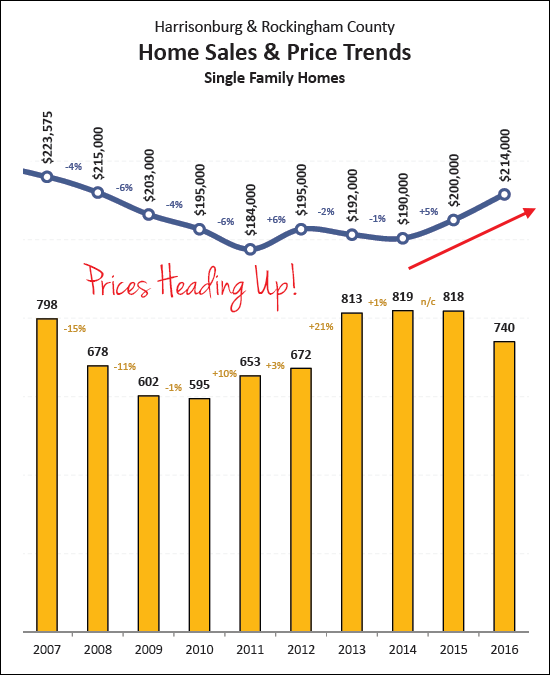 The median sales price of single family homes are often an excellent indicator of the price trends in a local real estate market, as they show a purer form of owner occupant supply and demand. When we examine townhouses as well, we are observing the buyer behavior of both owner occupants and investors -- and there can be much more short-term volatility in demand from investors. So, with the assumption that we'll get the clearest picture of price trends by looking at single family homes, it is striking to see a steady increase in median sales prices of these properties as shown in the graph above. 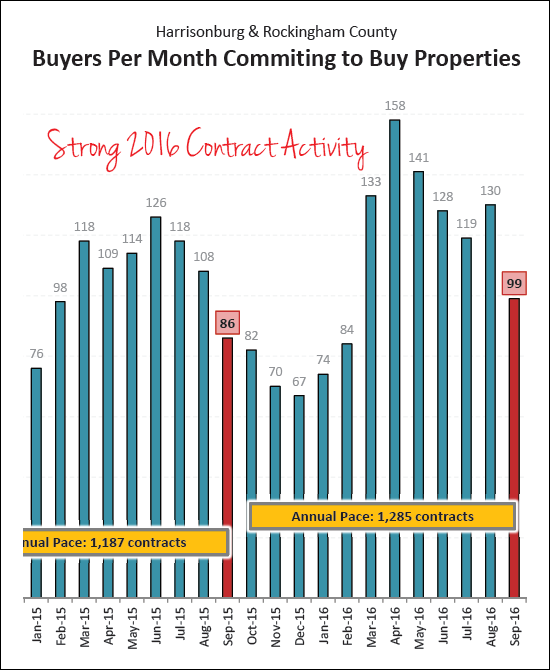 This graph clearly illustrates what a busy buying season it has been over the past seven months. We have seen an average of 130 contracts per month over the past seven months -- as compared to an average of only 96 contracts per month during the same timeframe in 2015. These strong contract numbers, clearly, are leading to the busy season of closings -- and we are likely to see yet another strong month of sales in October based on these contracts. 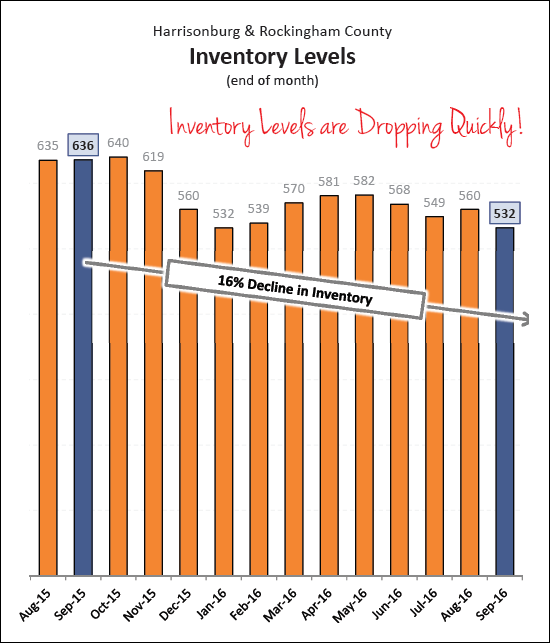 Finally -- buyers are finding fewer and fewer choices in the market -- as inventory levels (as shown above) have declined 16% over the past year. Looking back further (not shown above) there has been a 23% over the past two years! Well, there is much more to know, learn, read....but I'll pause here for now, and I'll let you explore that and read further on your own if you so choose. You can read my entire market report online....
| |
Record Number of Home Sales in August 2016 |
|
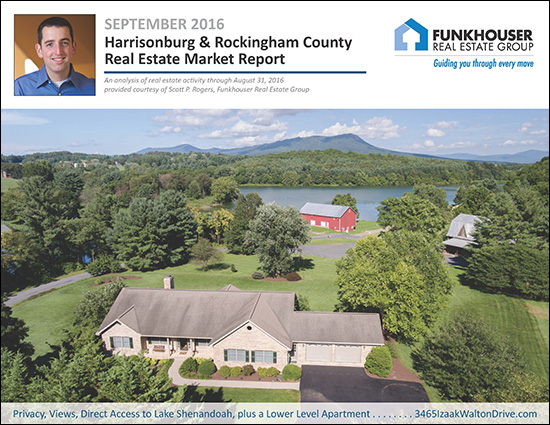 Learn more about this month's Featured Property: 3465 Izaak Walton Drive I just published my monthly report on the Harrisonburg and Rockingham County real estate market. Jump to the full online market report, download the PDF, or read on for highlights.... First, let's take a look at the overall market performance in August.... 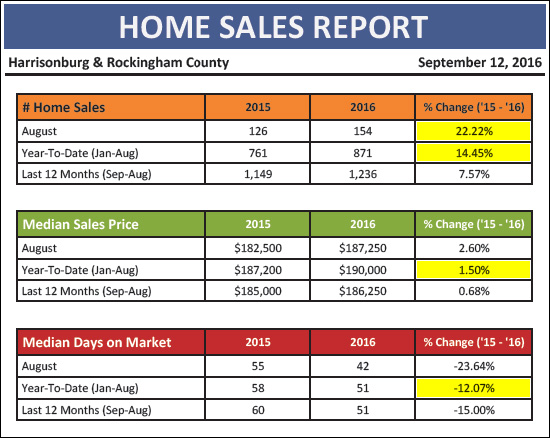 A few highlights from the basic data breakdown outlined above....
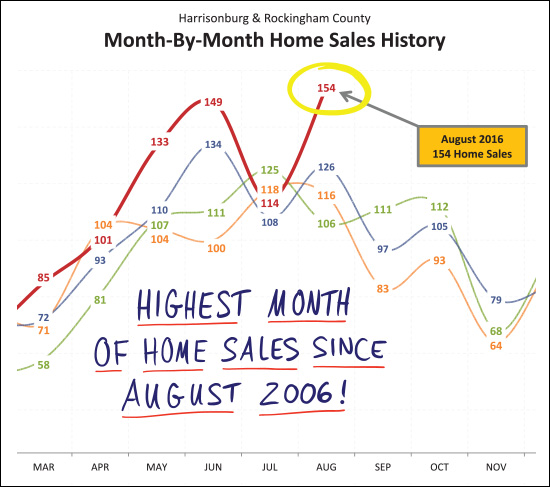
As promised, a bit more context. The 154 home sales in Harrisonburg and Rockingham County during August 2016 marked the HIGHEST number of home sales seen anytime in the previous 10 years. We'd have to stretch back 121 months to August 2006 to find the next highest month of home sales, when we saw 156 home sales.
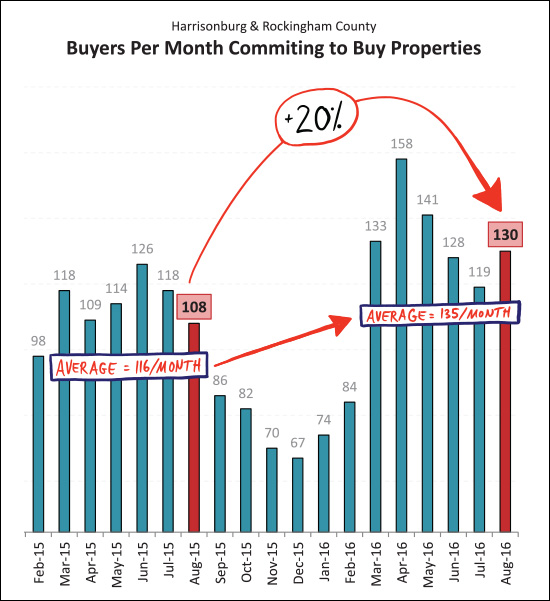
But wait, there's more. If you thought August home sales was the end of a series of strong months, you might be wrong. Take a look at the contract data (above) and you'll note that there were a whopping 130 contracts signed in August -- a 20% increase over last August. As such, we should expect to see strong September/October sales as well. Also of note, over the past six months we have seen an average of 135 contracts signed per months, as compared to only 116 per month a year prior.
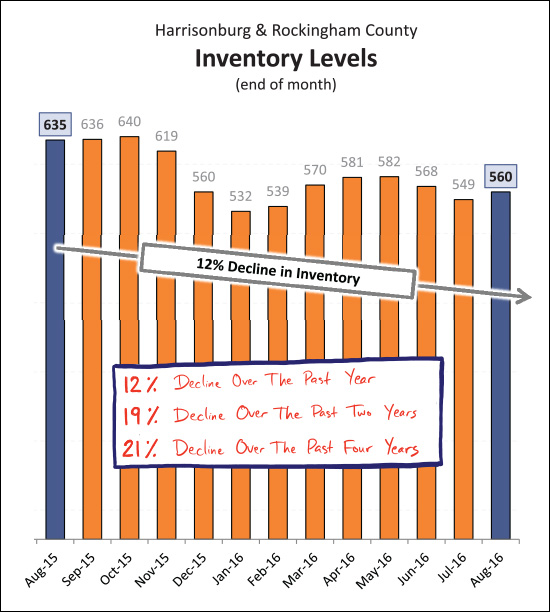
And the inventory levels keep on dropping. Buyers have fewer and fewer choices these days with current inventory levels hovering around 560 homes for sale in Harrisonburg and Rockingham County. This results in the best listings (price, condition, marketing) being sold quickly. There is much more to know, learn, read.... I'll pause here for now, but I'll let you explore that and read further on your own if you so choose. You can read my entire market report online....
| |
More Homes are Selling, Faster, at Higher Prices in Harrisonburg, Rockingham County |
|
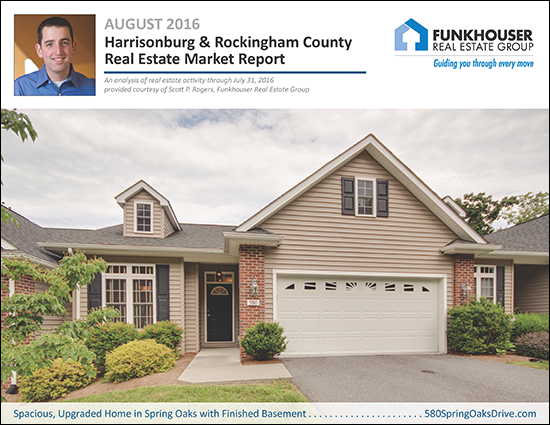 Learn more about this month's Featured Property: 580 Spring Oaks Drive I just published my monthly report on the Harrisonburg and Rockingham County real estate market. Jump to the full online market report, watch the video overview below, download the PDF, or read on for highlights.... First, a video overview....  Now, let's take a look at the overall market performance in July.... 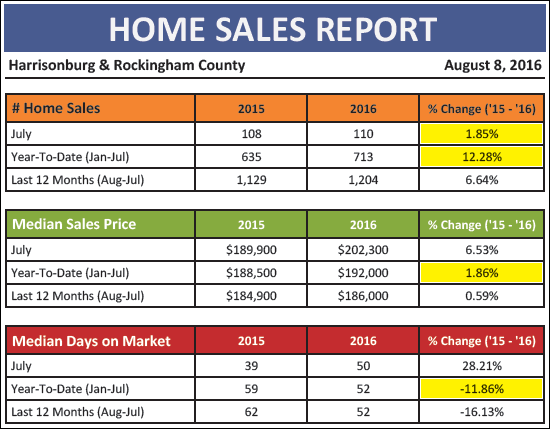 A few things jump out at me when looking at the chart above....
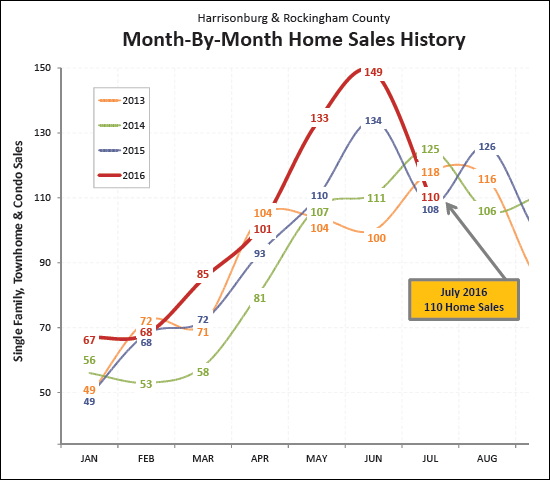
July could be seen as a disappointment in some ways. We didn't see sky high home sales, towering over all previous months of July. We only saw a tiny 1.85% increase in sales as compared to July 2015. But wait -- before we become too glum about the 110 home sales in July, let's not forget the record breaking months of sales that we saw in May and June! Just for fun, let's look at May through July home sales for the past few years....
So, yes, I think we can be satisfied with the 110 home sales we saw in July 2016 given the slightly larger context.
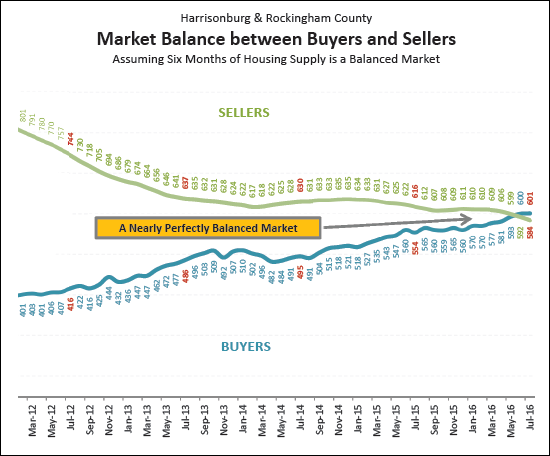
The graph above is somewhat complicated, but very important as to an understanding of our local housing market. The green "SELLERS" trajectory is showing the number of homeowners trying to sell their homes. The blue "BUYERS" trajectory shows the number of buyers closing on the purchase of homes in a six month period. This graph, therefor, is a good indication of overall market balance in our local housing market, as many housing market analysts consider a six month supply of homes for sale to be a sign of a market that is balanced between buyers and sellers. As shown above, after many years, we finally saw these trajectories cross last month. That is to say that there are now more buyers buying in a six month period than there are sellers selling. As such, if we've been approaching a balanced market for the past year, it is now definitely "in balance" -- even if that varies some from price range to price range.
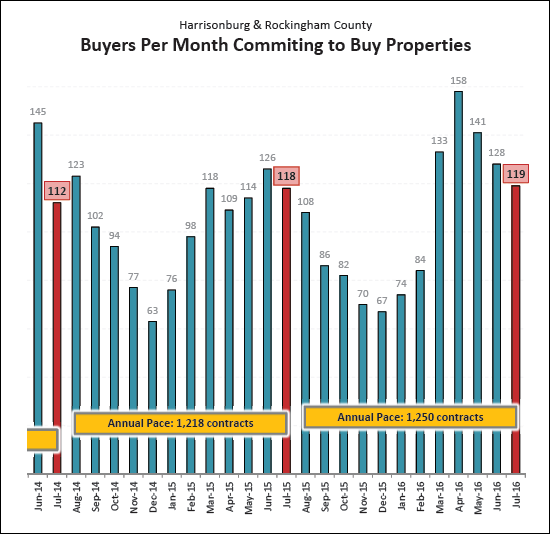
Taking a look at buyer activity in the form of signed contracts, we see that July was another relatively strong month with 119 contracts signed -- as compared to 118 last July. Put in a slightly larger context, we have seen an average of 136 contracts per month over the past five months -- as compared to an average of only 117 contracts per month during the same timeframe in 2015.
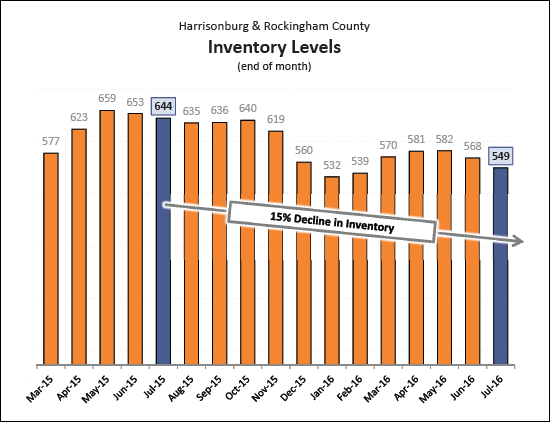
One of the ways that we have achieved the market balance illustrated above is by a reduction in the number of homes for sale. As the graph above indicates, we have seen a 15% decline in inventory levels over the past year. Thus, buyers a year ago had 644 homes to choose from -- and today can only choose from 549 properties. OK, let's cut off my ramblings about our local market there for now. There is a lot more more in my full real estate market report, but I'll let you explore that and read further on your own if you so choose. I'll continue to delve into the latest trends on HarrisonburgHousingToday.com over the next few days, but if you just can't wait, feel free to read the entire report online....
| |
| Newer Posts | Older Posts |
Scott Rogers
Funkhouser Real
Estate Group
540-578-0102
scott@funkhousergroup.com
Licensed in the
Commonwealth of Virginia
Home Search
Housing Market Report
Harrisonburg Townhouses
Walk Through This Home
Investment Properties
Harrisonburg Foreclosures
Property Transfers
New Listings

