| Newer Posts | Older Posts |
Home Sales Steady, Prices Slowly Rising in Harrisonburg, Rockingham County |
|
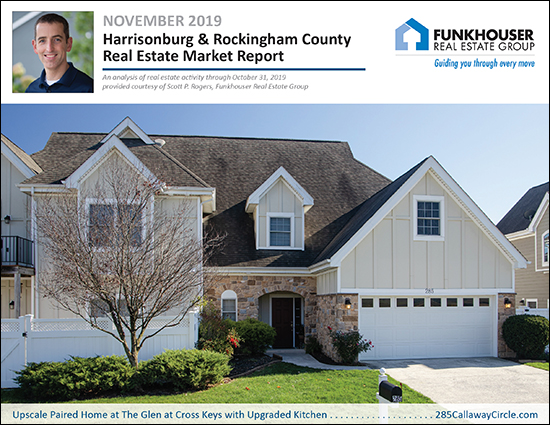 Despite rapidly declining temperatures (15 degrees last night!?) the local housing market is still rather hot! Read on for an overview of the latest market trends in Harrisonburg and Rockingham County, or download a PDF of the full report here. But first, check out this new listing at The Glen at Cross Keys, pictured above, by visiting 285CallawayCircle.com. OK, now, diving into some data... 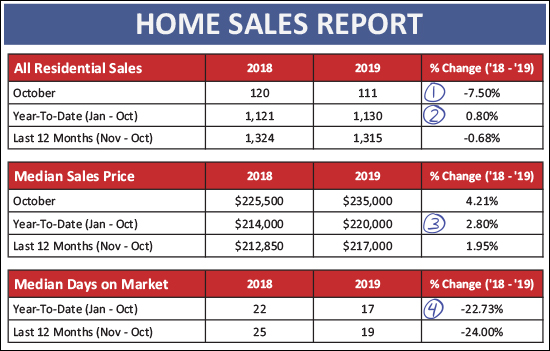 Several things to note above, as we can now look at 10 out of 12 months of 2019...
Now, looking at the detached sales trends vs. attached trends, we see similar but slightly different trends... 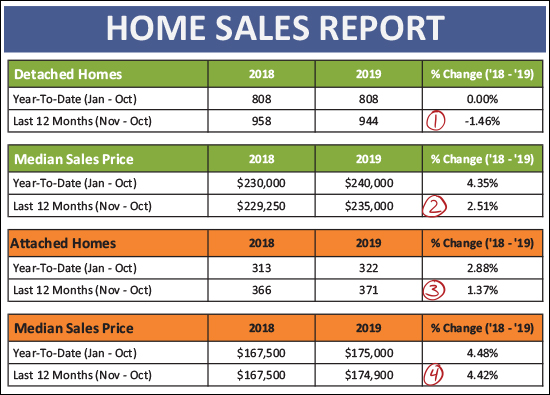 Above, you might note that...
Next, let's pause for a moment to evaluate sales in the City vs. the County... 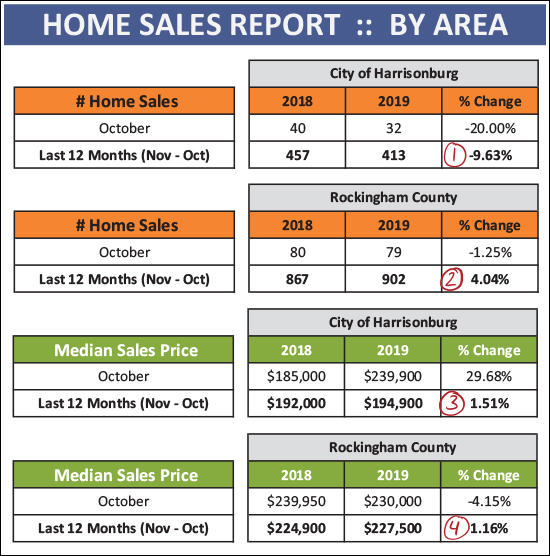 As you'll see above...
Now, for the roller coaster of the month-by-month activity... 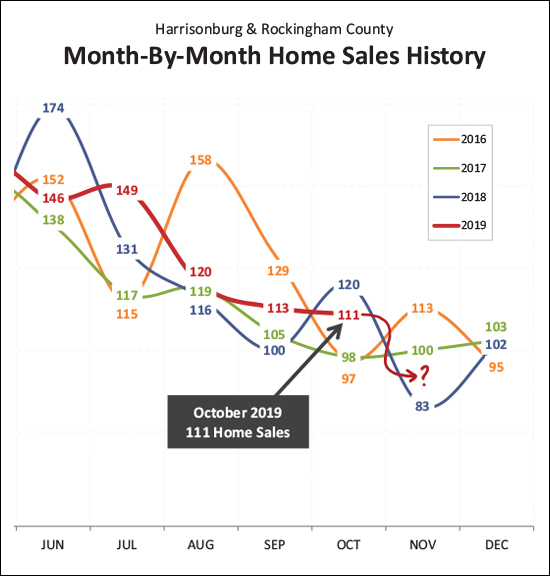 As shown above, October home sales in 2019 were certainly stronger than we saw in 2016 and 2017 -- but not as strong as last year. That said, home sales then slowed down quite a bit (!!) last November, so perhaps we'll see a stronger performance this November? I'm guessing we'll see 90 to 100 home sales in November 2019. 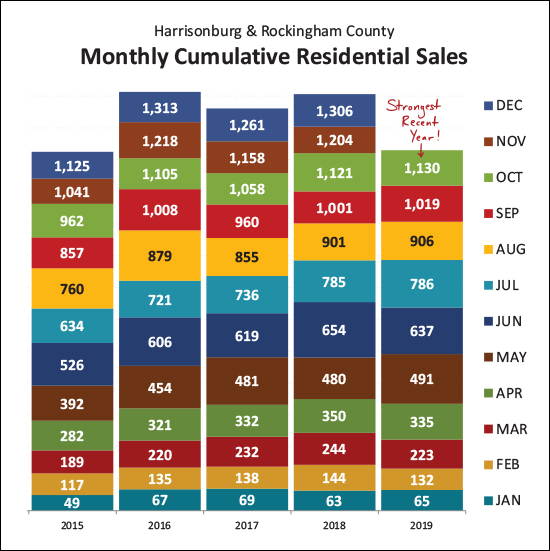 How do these monthly home sales stack up towards annual sales? The graph above breaks it down -- and we're moving at the fastest pace this year (1,130 sales in 10 months) that we've seen anytime in recent years. We seem to be on track to eclipse 1300 home sales again in 2019 - just as we did (barely) last year. 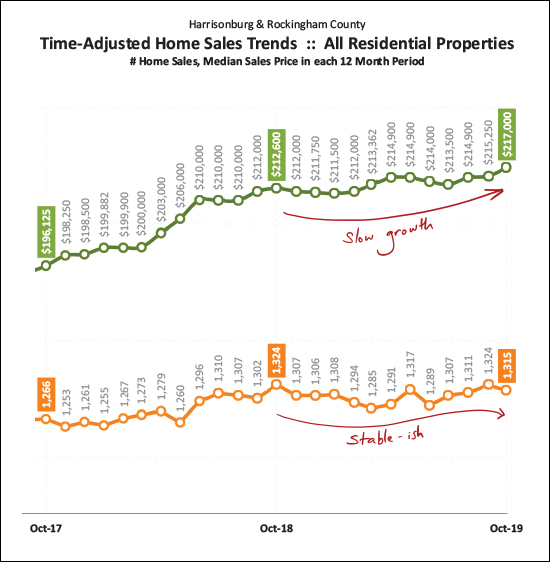 We can often get the best sense of long term trends by looking at a rolling 12 months of data, as shown above. Here we see that growth in the median sales price has been relatively slow over the past year (compared to a faster increase last year) and the pace of homes selling has remained relatively stable over the past year. 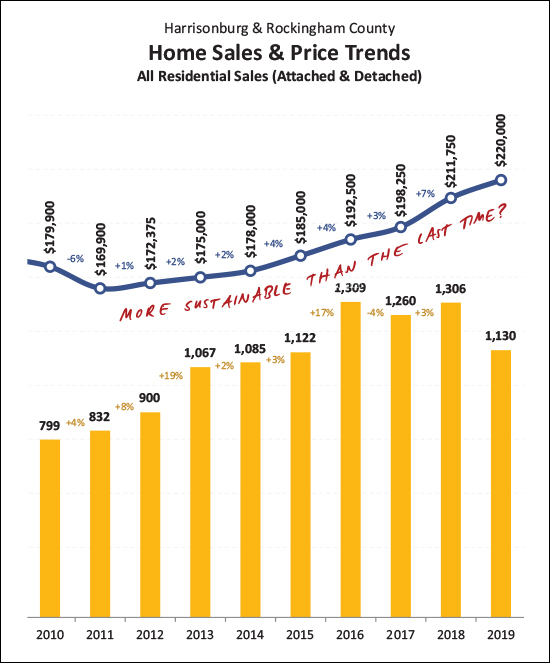 Looking back a few more years, it is clear that median sales prices (and home values) have been increasing steadily for quite a few years now -- ever since 2011 per this data set. But, the increases per year are smaller (1%, 2%, 2%, 4%, 4%, 3%, 7%, 4%) than during the last real estate boom when we had three years of double digit (17%, 14%, 14%) increases in the median sales price. So, perhaps this increase in home prices is more sustainable than the last time we saw steady increases over time. 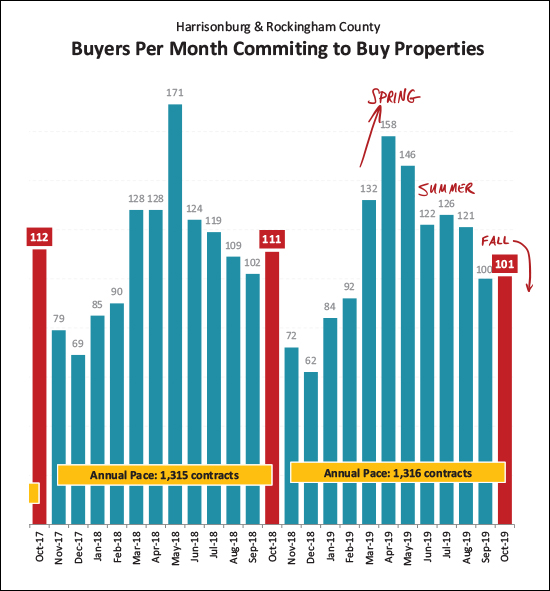 Back to temperature and seasonality - even though the annual pace of buyer activity is up, right now contract activity is starting to decline. The strongest months of buyer activity are typically in the Spring and Summer. We have started to see the usual slow down this Fall and will likely see continued declines in monthly contract activity as we move through November, December and January. 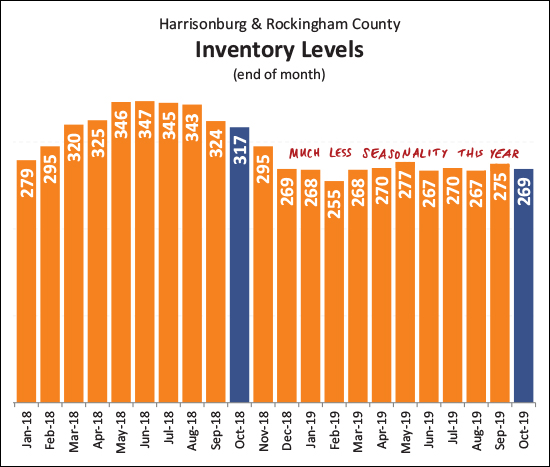 Somewhat curiously, despite the seasonality of buyer activity -- the inventory levels have stayed relatively steady for the past year -- or at least the last 10 months. We did not see the usual increase in inventory levels in the Spring and Summer this year -- perhaps because buyers were poised and ready and snapped up the new listings as soon as they hit the market. Thus, we may not see much of a decline in inventory levels over the next few months either. 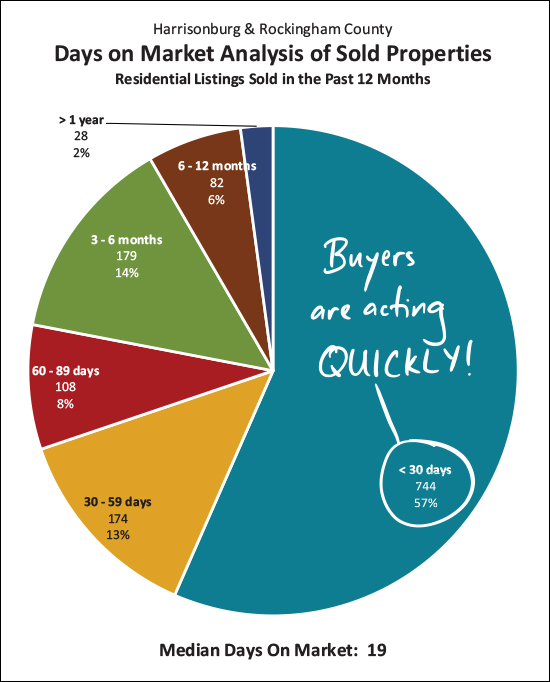 Ah, yes, the buyers DID snap up the listings quickly! In fact, over the past 12 months, 57% of homes that sold were under contract in less than 30 days -- and the median days on market was only 19 days! 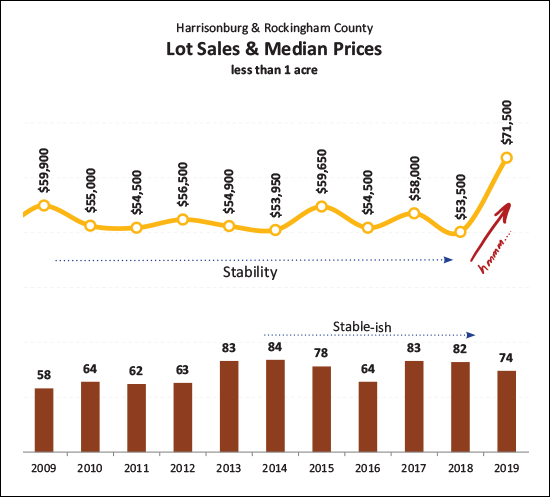 Breaking out of the "house" mold for a moment -- look at lot sales this year It seems we'll likely see a similar number of lots of less than an acre selling this year (around 80) but the median sales price has increased quite a bit over any recent past year!? 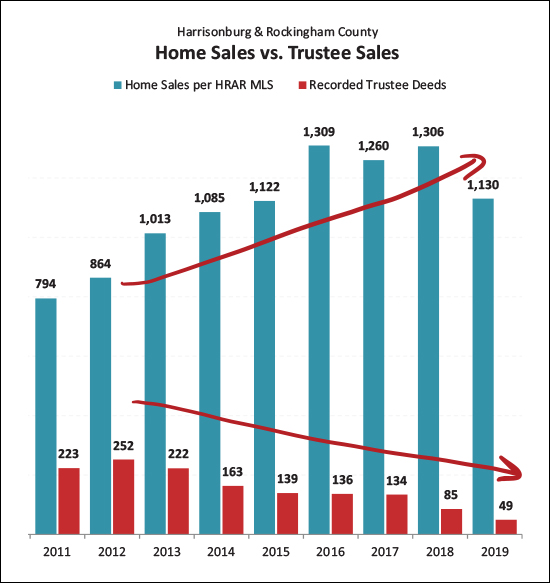 If you're looking for a sign of relative health in the local housing market -- look no further than the declining foreclosure rate in this area. As shown above, we have seen fewer (and fewer) foreclosures over the past eight years as more and more homes have sold. 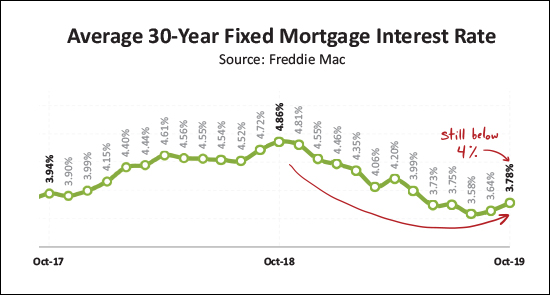 And finally, if you're buying now or soon, you'll likely still be locking in a fixed mortgage interest rate below 4%. The average mortgage rate has risen a bit over the past two months, but we're still seeing absurdly low mortgage interest rates for folks buying principal residences. OK -- that's it for now. Again, you can download a PDF of my full market report here, or feel free to shoot me an email if you have follow up questions. In closing... If you're planning to sell over the Winter -- let's chat sooner than later about timing, preparations for your house, pricing within the current market and more. Call (540-578-0102) or email me and we can set up a time to meet to chat. If you're planning to (or hoping to) buy a home soon, be ready to be patient and then to ACT QUICKLY! :-) Make it a bit easier for yourself by knowing the market, knowing the process, knowing your buying power, and closely monitoring new listings! That's all for now. May we find warmer days ahead! :-) | |
Home Sales, Prices Continue To Rise in Harrisonburg, Rockingham County |
|
 Autumn is here! Leaves are falling. Temperatures are falling. Home sales are not -- and prices are not! So, brew yourself a cup of coffee or tea, and let's take a look at some market trends for our local housing market... But first -- find out more about the new homes (rendering above) being built in McGaheysville by visiting IslandFordEstates.com. Now, onto the data, though you can skip to the full PDF report here. 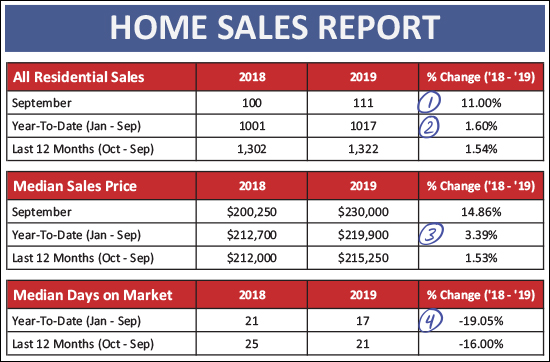 September was another solid month of home sales in Harrisonburg and Rockingham County. As shown above...
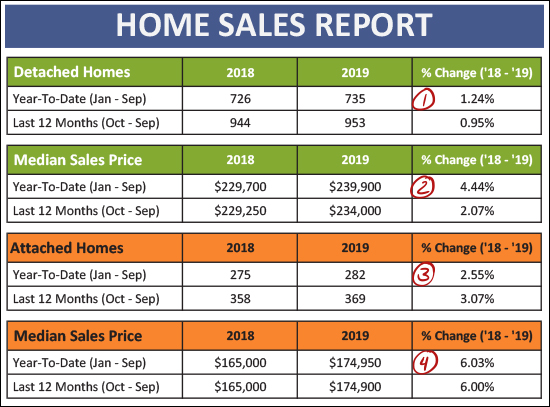 Breaking things down between detached homes (single family homes) and attached homes (duplexes, townhouses, condos) we see some trends that have been consistent throughout the year...
And let's look a bit closer at the month to month trajectory... 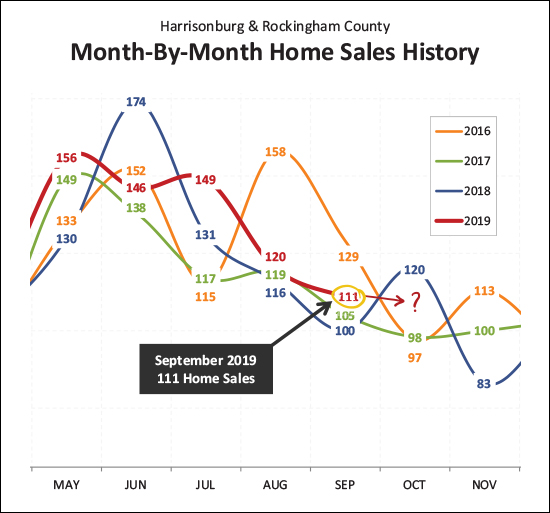 A few things stand out above...
Looking afresh at how this year stacks up to prior years... 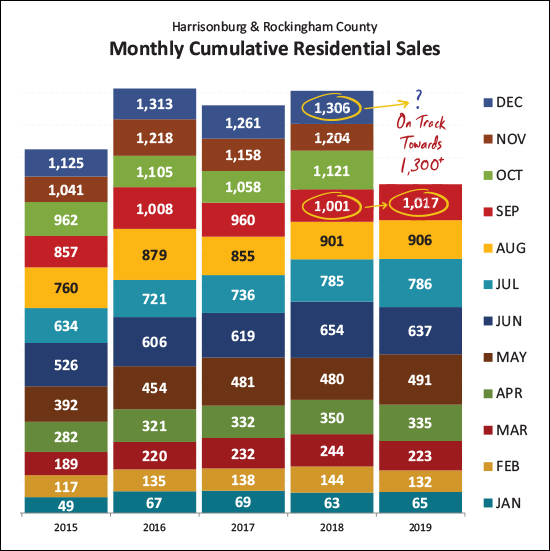 This has been the fastest (though not by a huge amount) start to the year that we've seen in a while. The 1,017 home sales through the first three quarters of the year surpasses sales seen during the same timeframe in each of the prior four years. So, it seems we may see another year of 1,300+ home sales in our area. 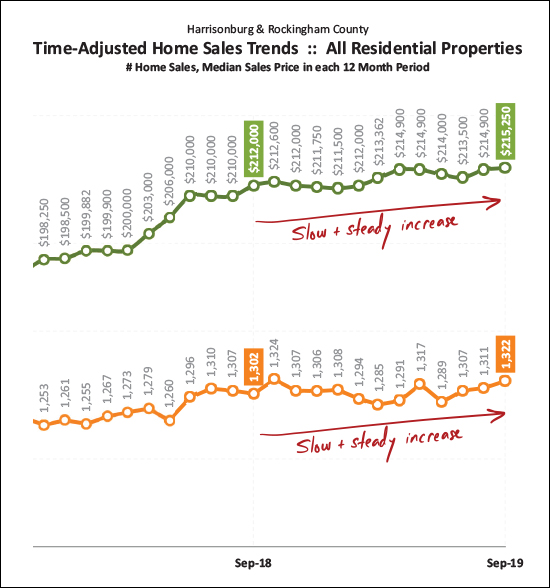 Zooming out -- looking at a rolling twelve months of market data -- we find a slow and steady increase in sales prices over the past year, and a slow and steady increase in the pace of home sales. All indications are that this could / might / should continue on into the remainder of 2019 and potentially 2020. 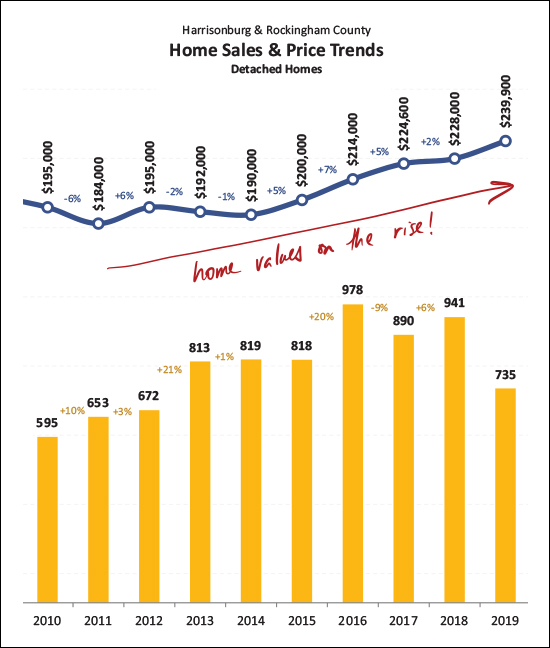 Taking one more look (above) at value trends we see that the median sales price of detached homes was a190K five years ago -- and has risen to $240K today. That's a healthy increase in home values, though with annual increases of 2% to 7%, it doesn't seem that the overall increases are as unsustainable as they were during the 2003-2007 market boom. 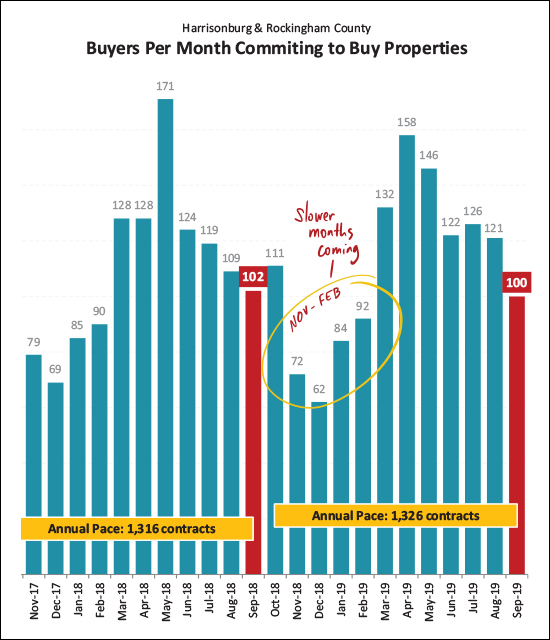 This (October) could be the last strong month of contract activity for a while. Above you'll note that contract signing slowed quite a bit between November and February -- and I expect we'll see something similar this year. The 100 contracts signed in September 2019 was on pace with the 102 seen last September. 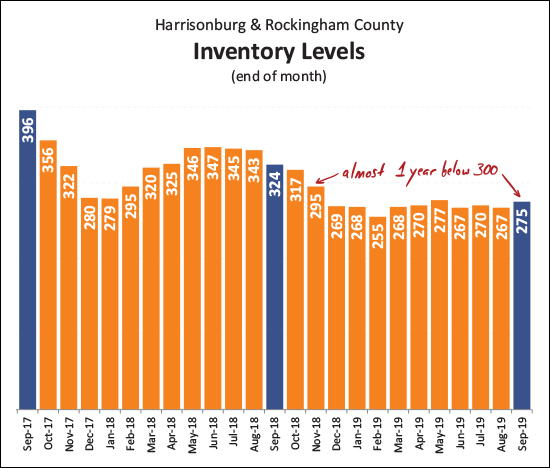 The new norm seems to be fewer than 300 homes on the market at any given time. Over the past 11 months there have always been fewer than 300 homes for sale -- though no fewer than 255. This is a far cry from where inventory levels were a few years ago, but perhaps this is where we'll be staying for a while. Buyers don't have many options at any given time, and yet, we're on track for a record setting year of home sales. 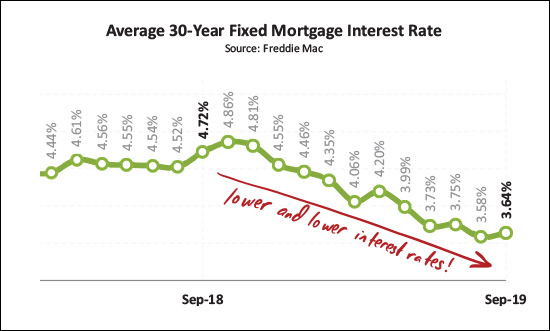 If buyers are sad about declines in inventory levels, they certainly aren't sad about declining interest rates! A year ago, the average 30-year interest rate was 4.72% and now it's down over a full percentage to 3.64%. This certainly makes it an affordable time to lock in a housing payment. A few closing thoughts...
| |
Home Sales Stable, Median Prices Slowly Rising in Harrisonburg, Rockingham County |
|
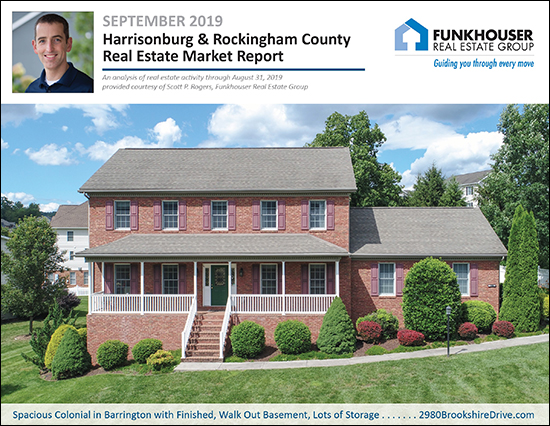 Summer might not officially end for another six days, but today has certainly has been a nice taste of the cool Autumn days to come. That said, even if the temperatures are starting to cool down, home sales are not yet ready to do so in our local market. Before we take a look at the most recent market trends, take a few minutes to check out this spacious Colonial in Barrington that is pictured above by visiting 2980BrookshireDrive.com. Now, then, let's get down to some overall market stats... 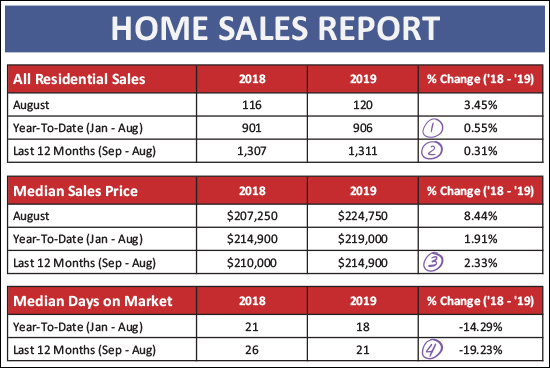 First above, lots (and not much at all) to observe here...
And how about if we break it down between detached homes (almost all purchased by owner occupants) and attached homes (mostly purchased by owner occupants, but also purchased by investors)... 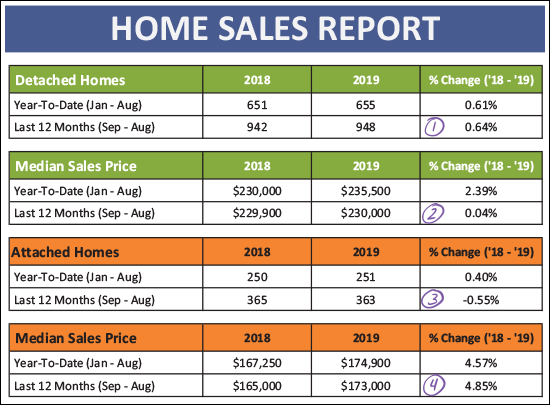 Here's what we're finding...
And now for that pretty visualization of the month to month ebb and flow of home sales... 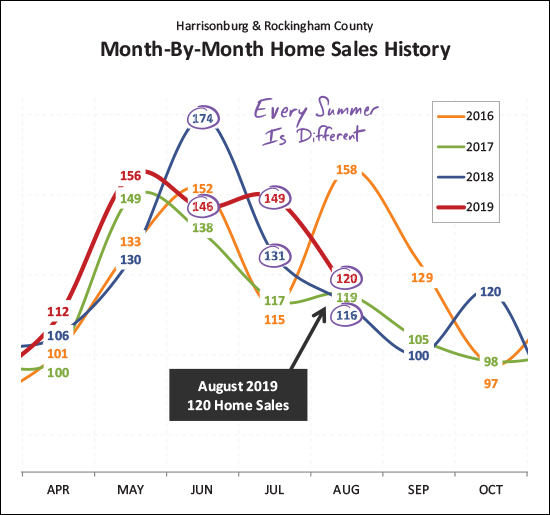 Here (above) we note that every summer is different. Last year (blue line) June was a spectacular month for home sales - with 174 closings - more than seen anytime (ever!) in our local area. This year (the red line) June home sales were mediocre at best. But then, July and August home sales were stronger this summer as compared to last year. Looking ahead to September, I anticipate that we're likely to see around 110 home sales - slightly more than the past two years, but not quite as many as back in 2016. 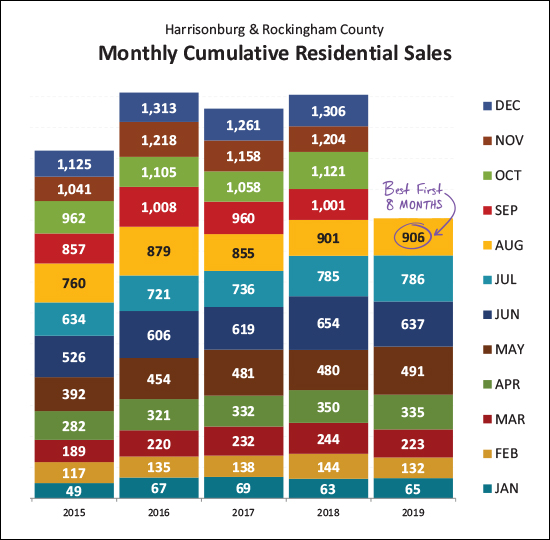 When we pile all of the months on top of each other we can get a clearer view of how the first eight months of this year (Jan-Aug) compares to the first eight months of the past four years. And this is where we find that we have had the best first eight months of anytime in at least the past five years. Given the current trajectory, it seems likely that we'll see at least 1,300 home sales this year. 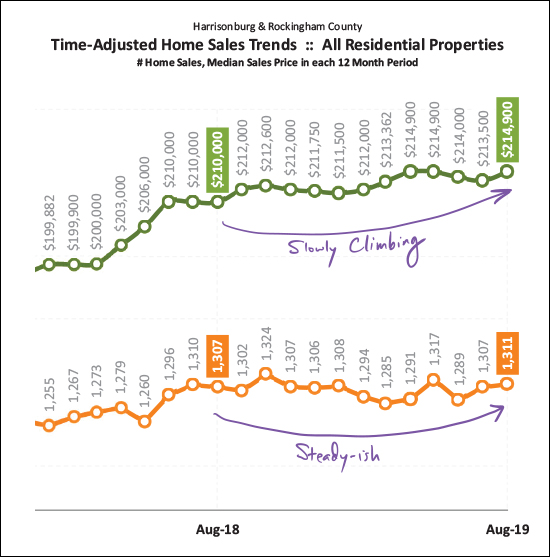 This graph shows us the overall long term trends in local home sales. The green line is the median sales price which has been creeping its way up over the past year. The orange line shows the annual rate of home sales, which has been hovering around 1,300 home sales for the past year. 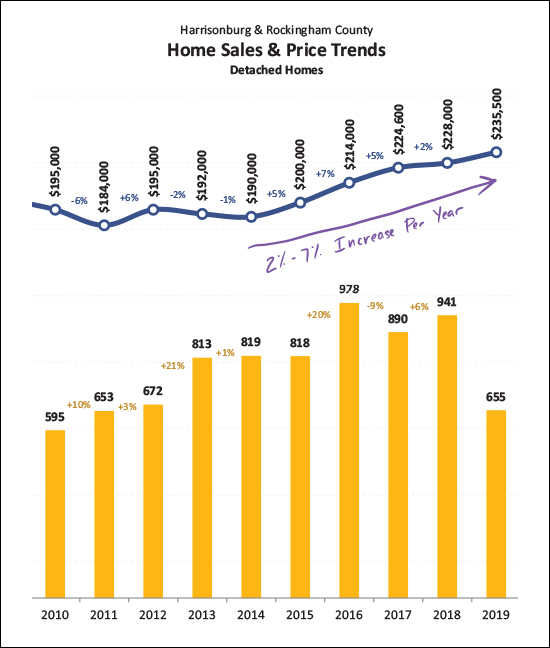 Focusing in just on the detached homes, we see that the median sales price has been increasing anywhere from 2% to 7% per year for each of the past four years. This year we are likely to see another increase in the median sales price somewhere in that range. 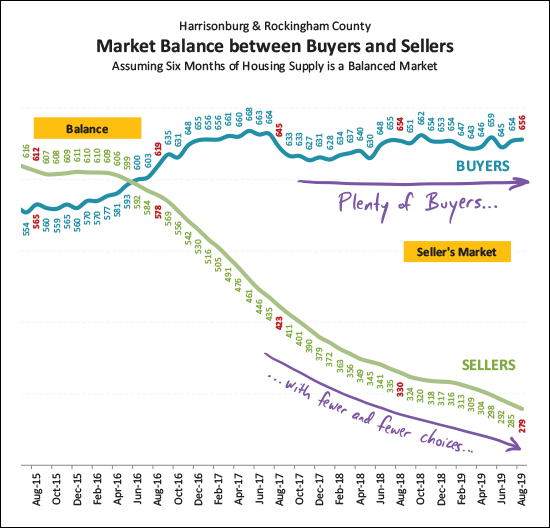 With steady home sales and increasing sales prices, it's a great time to be a seller. But not as great of a time to be a buyer. As shown above, there have been a relatively stable number of home buyers over the past few years, but the number of homes for sale at any given point has been steadily declining for over three years. 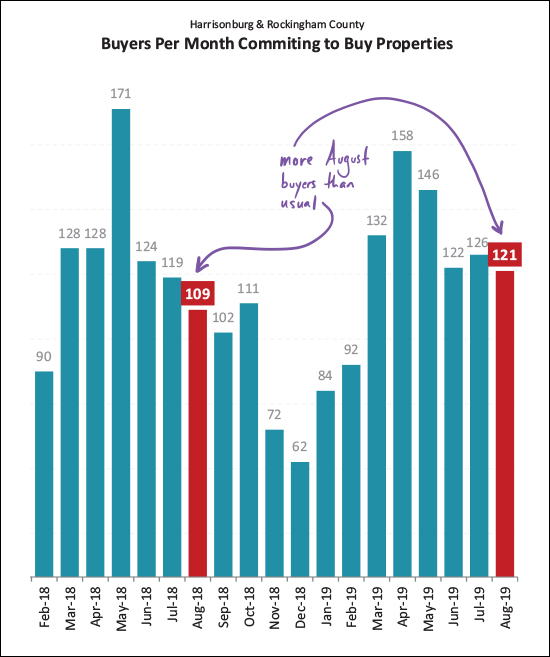 Why do I think we'll see 110 home sales in September? Well, partially because 120 home buyers signed contracts in August. This was a higher rate of contract activity than last August and suggests that sales will continue to be relatively strong as we continue into the Fall. 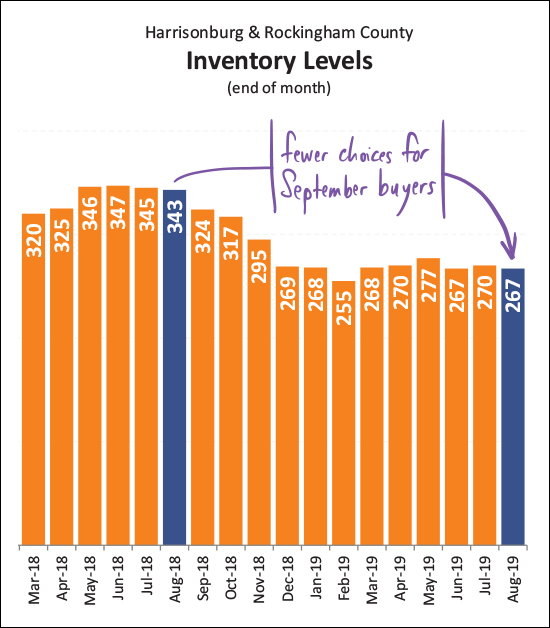 And here (above) are those overall inventory numbers. The number of homes for sale has been declining over the past year. We used to see much more of an increase in available inventory during the Spring months but this past year buyers were contracting on new listings almost as fast as they were being listed, which kept the inventory levels low. 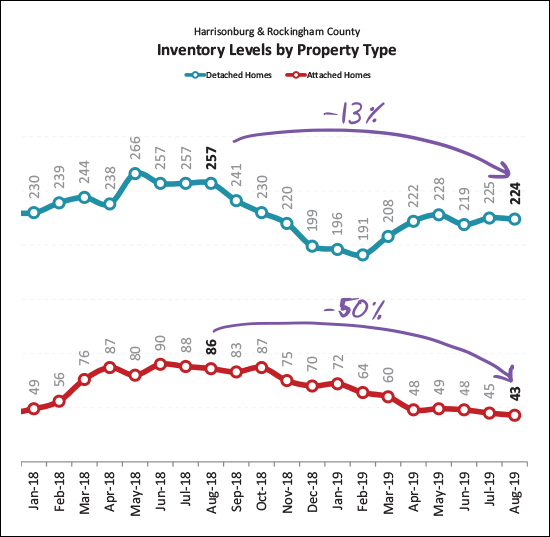 Here's a startling statistic. Inventory levels have declined 13% over the past year when we look just at detached homes -- but when we look just at attached homes (duplexes, townhouses, condos) we find a shocking 50% decline in the number of homes for sale! It is a tough time to be a first time buyer these days! 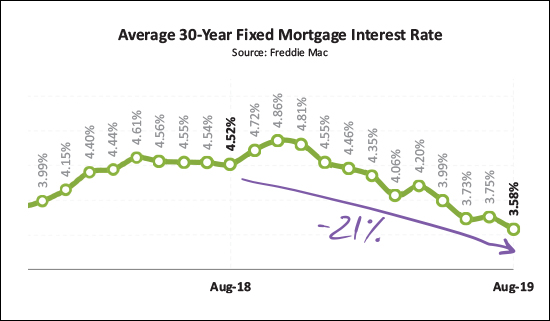 Finally, mortgage interest rates. If there is any consolation for today's home buyer it is that their mortgage interest rate is likely to be lower than anytime in the past year or longer. Interest rates have fallen 21% over the past year -- from 4.52% to 3.58%. A few final notes and thoughts for those that made it this far...
That's all for today. Have a delightful, pleasant, cool evening! | |
Summer Is Fading Away. Home Sales Are Not. |
|
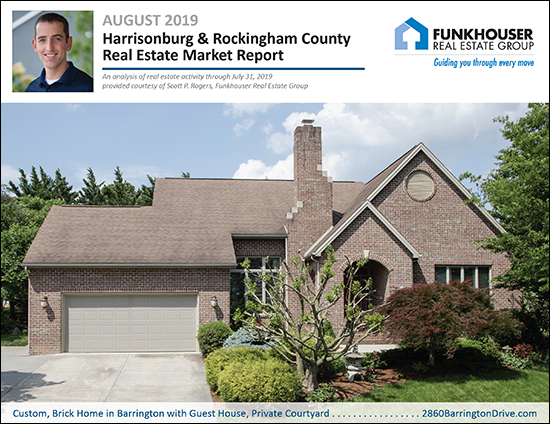 Summer is here! Oh wait, summer is gone!? Once that first week of August hits, it seems it's almost time for school to start again. Where did the summer go!?! While I ponder how another summer flew by so fast, let's take a few minutes to reflect on the state of our local housing market. But first - the beautiful home pictured above is this month's featured home - a spacious upscale home in Barrington with a finished basement, guest house and private courtyard! Check out the details at 2860BarringtonDrive.com. Now, onto the data! Download the full 28-page market report as a PDF, or read on... 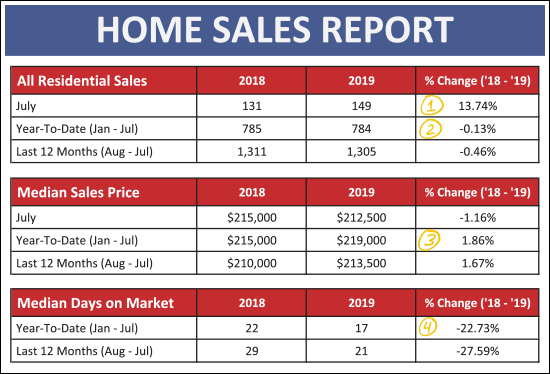 As shown above, July was a strong month for home sales...
Diving slightly deeper, let's see how detached homes compared to attached homes. An "attached home" is a duplex, townhouse or condo... 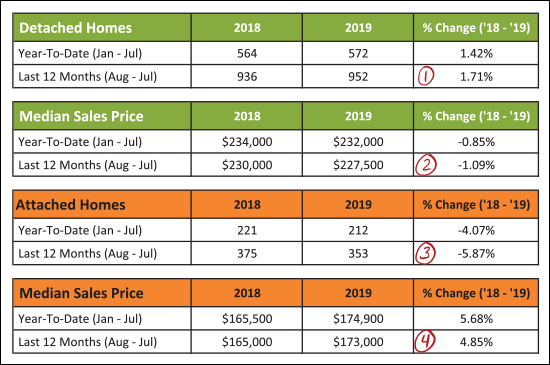 As shown above, there are some differences in these two broad segments of our local market...
And just how did this past July compare to some other months of July? 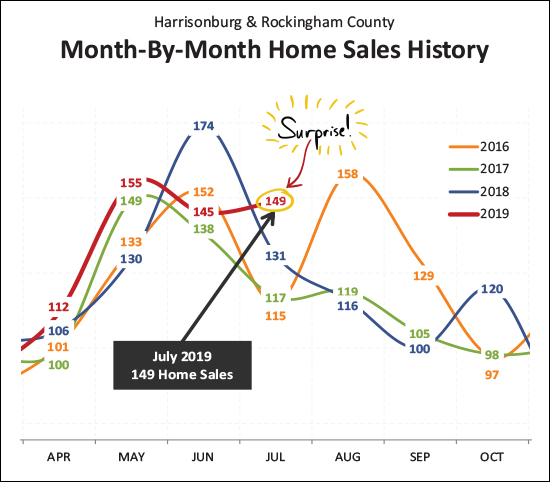 This was a bit of a surprise to me! June home sales were rather slow compared to previous months of June. I didn't anticipate that a slower June would so quickly translate into a faster paced July - but wow! Looking back at the past three years we have seen 115, 117 and 131 homes sales during July. This year it was 149 home sales! An impressive showing for buyers in the local marketplace! And here's how that strong month of July contributed to the overall year... 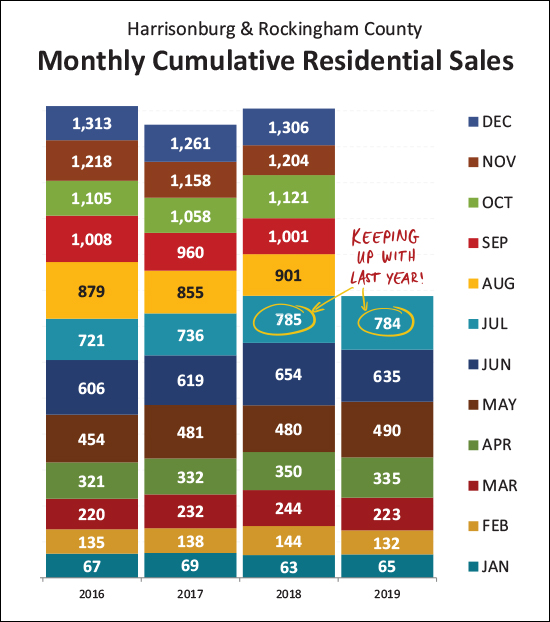 If we were a bit behind as of the end of last month (635 vs. 654) we just about (just about!) caught back up in July -- as there have now been 784 home sales thus far in 2019 compared to 785 last year. it would seem we'll probably make it back to around 1300 home sales this year. And now, let's step back a bit... 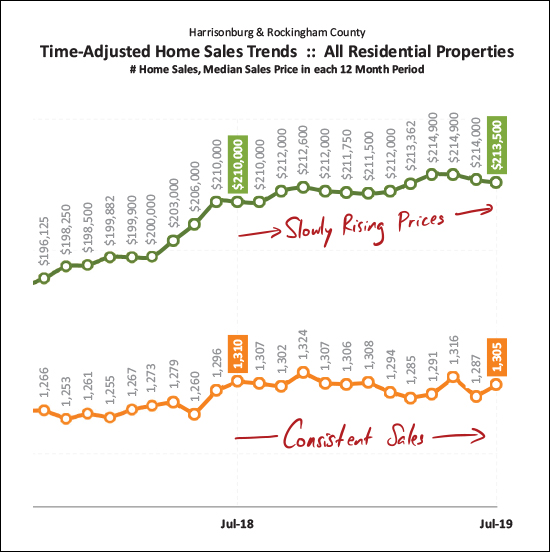 This is the slooooooooowest moving graph ever - it looks at a rolling twelve months of sales data. Here, though, we see that the general trend is a consistent-ish pace of home sales -- and slowly rising prices. And when we look for some overall indicators just for detached homes... 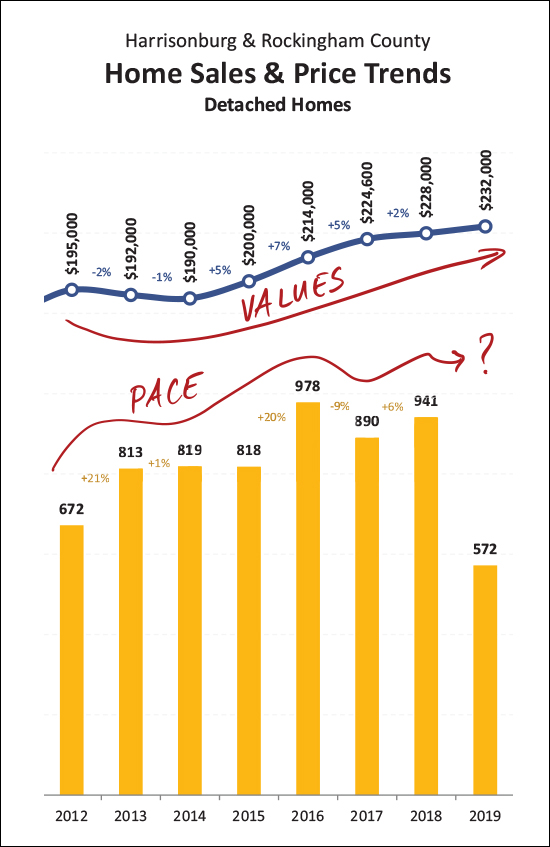 This is where we see (above) that despite some year to year turbulence as to the pace of home sales, we're seeing overall increases in sales prices all the way back to 2014. Some years (2015, 2016, 2017) have been larger increases than others (2018, 2019) but it has followed the same general trend. So, what's next? 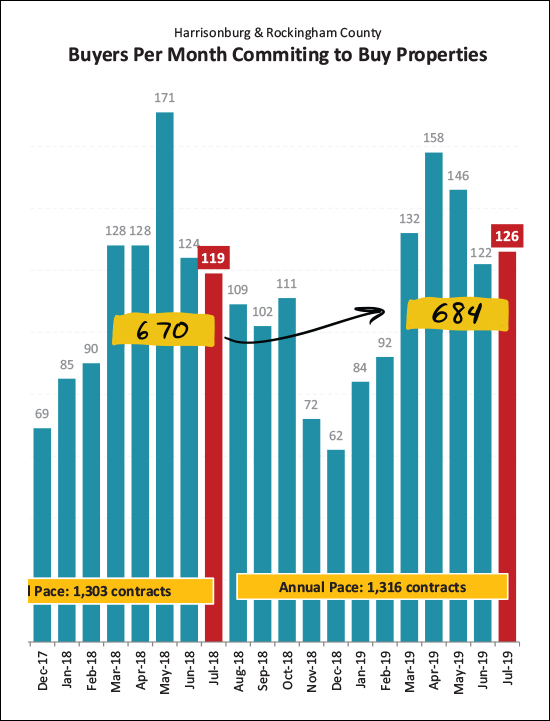 Well -- it would seem we are likely to see another strong month of home sales in August. After all, we saw an uptick (from 119 to 126) in July contracts, and over the past five months there have been 684 contracts signed, as compared to only 670 during the same months last year. How, though, will those contracts come together with such limited inventory? 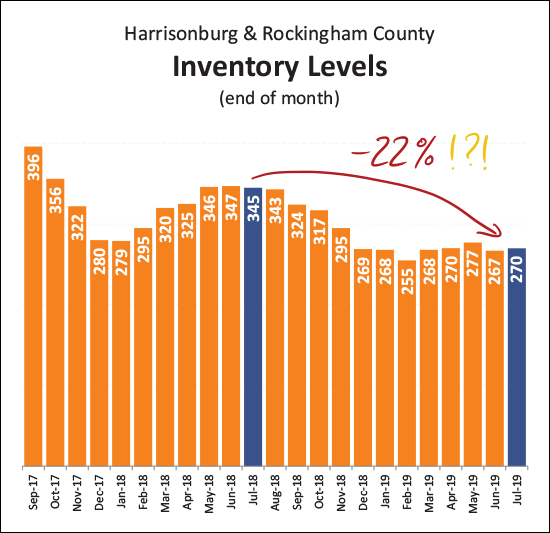 That is, of course, an excellent question! Inventory levels have fallen 22% over the past year. This means today's buyers are finding fewer and fewer options when looking for a home to buy at any given time. That said - a relatively consistent number of homes are selling - so a buyer might just have to be a bit more patient, and then be ready to jump quickly when the right house comes on the market. And one last note about mortgages and financing... 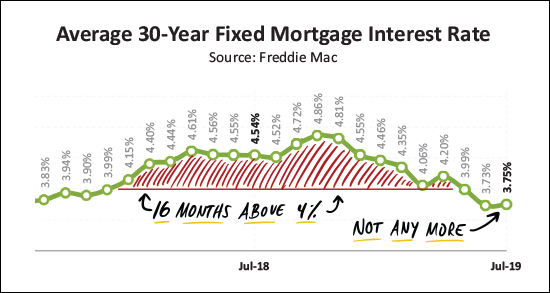 In case you missed it, today's buyers are locking in below 4% on 30 year fixed rate mortgages! We went through 16 months with rates above 4%, and we have now been back below 4% over the past few months. Anyone who locked in at 4.25%, 4.5%, 4.75%, etc., still has a wonderful long-term fixed rate mortgage interest rate -- but 3.something? Wow! I'll wrap it up there for now, with a few closing thoughts...
Until next time, have wonderful remainder of your summer, and a great start to your school year if you or someone you know will be getting back to the classroom this month! | |
Home Sales Slow, Prices Inch Higher In First Half of 2019 |
|
 It's hard to believe, but half the year has already flown past! Let's take a few minutes to review some recent trends in the local housing market -- but first...
Now, starting with some data packed charts before we get to the colorful graphs... 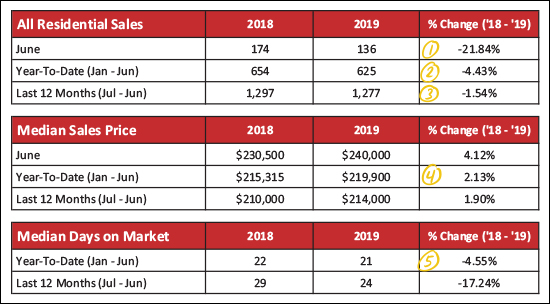 Looking at the market overview above, here's what's popping out to me...
Now, let's see how detached home sales compare to the sale of attached homes. Attached homes are townhouses, duplexes and condos... 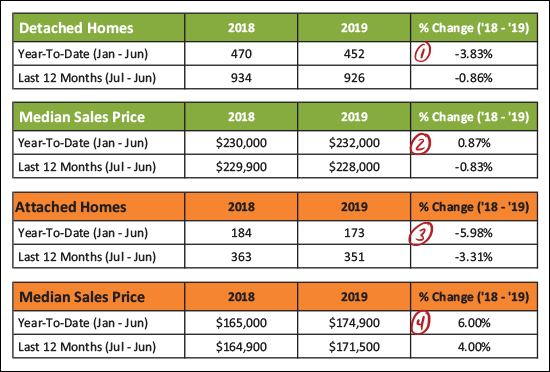 The green chart above is detached home sales, and the orange chart is attached home sales, and here's how things break down...
And now, the pretty graphs... 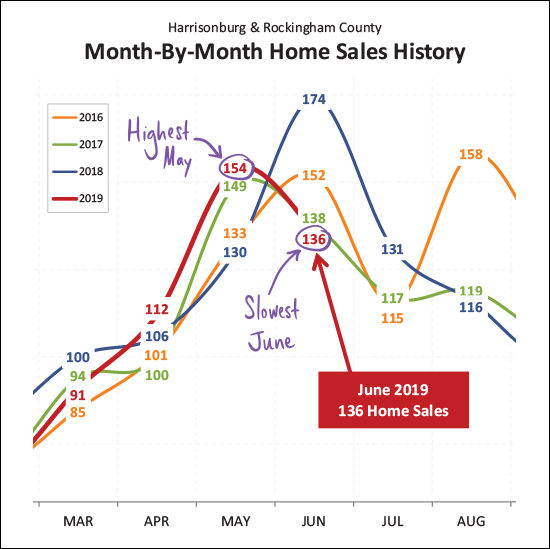 What a roller coaster! As shown above we just experienced the HIGHEST month of May home sales in the past few years, and then the LOWEST month of June home sales in the past few years. So, right, hard to conclude much there -- other than that May and June are some of the busiest months for home sales. Looking ahead, hopefully we'll see a nice mid-range July -- how about 120 or 125 sales? 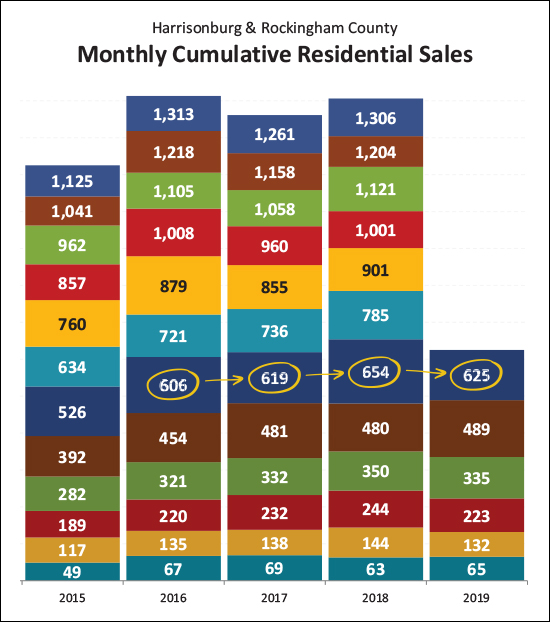 I use the graph above to see how we're doing in the current year as compared to the prior four years. As you can see, the 625 home sales in the first half of this year is about on par (above two, below one) with the past three years when we have ended up with 1250+ home sales. So, if I had to guess, we'll probably see between 1250 and 1300 home sales in total this year. 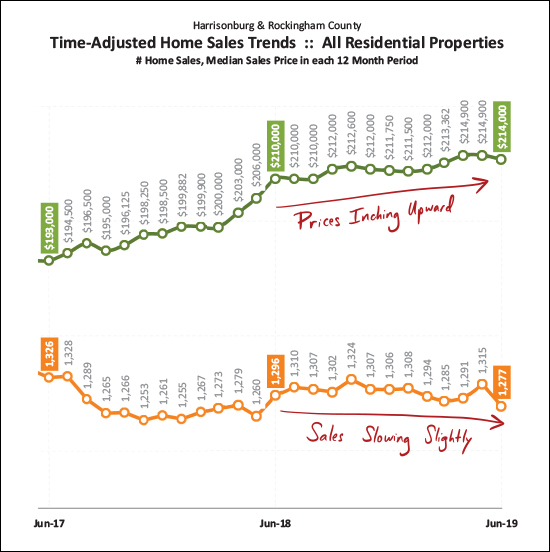 The graph above is the best indicator of overall long term trends. Each data point reflects 12 months of sales data. As you can see, the pace of home sales (orange line) has been declining slightly over the past year -- while the median price of those home sales has been inching upwards to its current level of $214,000. 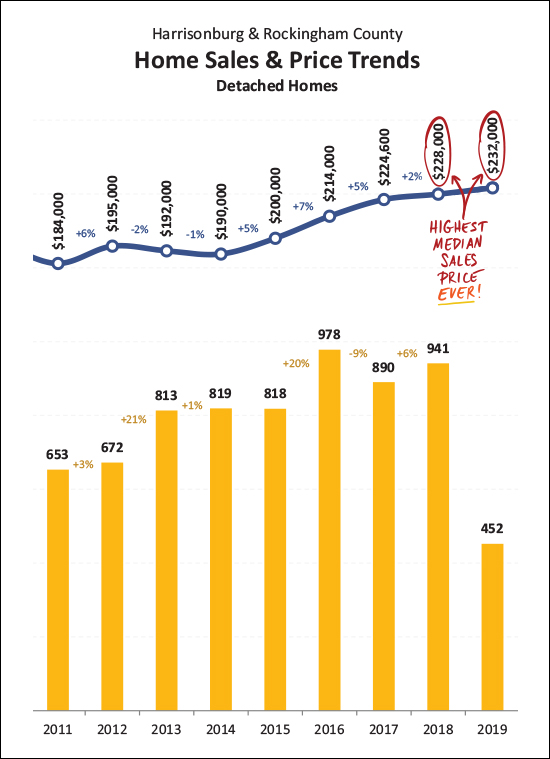 I'm throwing this one (above) in for fun - because I haven't highlighted this fact lately. The median sales price of detached homes is $232,000 thus far in 2019, and was $228,000 in 2018. Both of these median sales prices are/were the highest median sales price we have seen for Harrisonburg and Rockingham County -- ever! We've come by these prices slowly and steadily over the past five years. 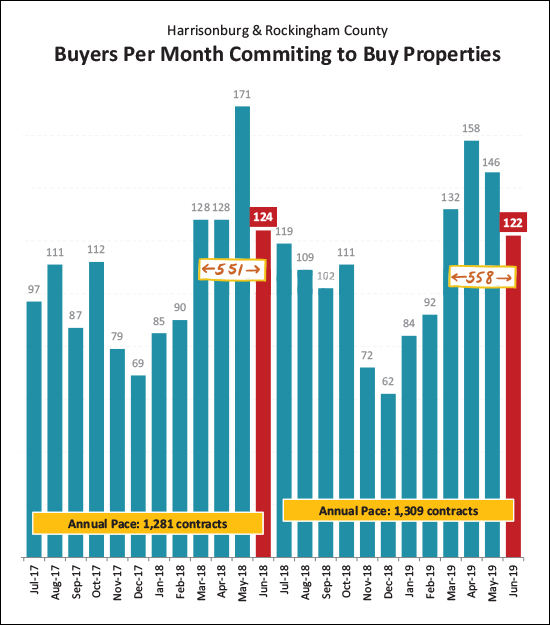 Those new contracts, they keep getting signed! A total of 122 properties went under contract in June 2019 as compared to 124 last June -- and when we look at the March-June timeframe, we find 558 contracts this year and 551 last year. As such, this year's Spring/Summer buyers (and, incidentally, sellers) are certainly keeping pace with last year at this point. 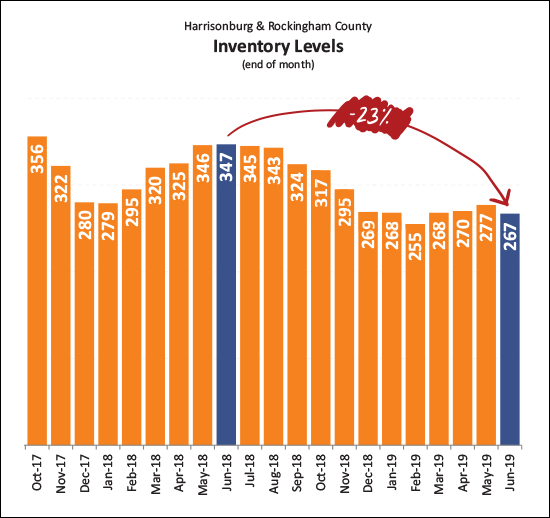 And what are those buyers buying? Well, it seems that they have fewer, and fewer, and fewer choices at any given point in time. As shown above, current inventory levels (267 homes for sale) are 23% lower than they were a year ago -- and just about as low as we saw inventory levels drop over this past Winter!?! Well priced, well prepared, well marketed new listings are going under contract quickly partially because of how few options buyers have these days. 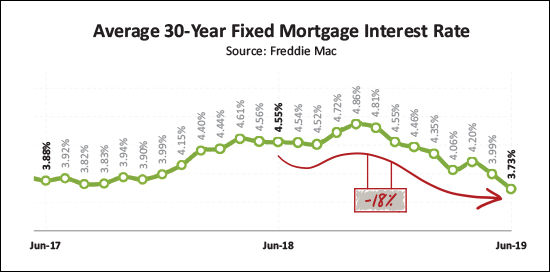 Those buyers who are fortunate enough to secure a contract on one of the few available listings are super fortunate to find astoundingly low mortgage interest rates! Over the past year, the average 30-year fixed mortgage interest rate has fallen 18%, down to its current level of 3.73%. I didn't think we'd see rates below 4% after they soared up to 4.5% a year or so ago - but today's buyers are certainly enjoying locking in some low housing payments given these low rates! Let's pause there, folks. Hopefully that gives you a good general sense of what is happening in our local housing market. And as always, if you have follow up questions about YOUR portion of the local housing market - based on price range, neighborhood, property type, etc. - just let me know! SELLERS -- even though it is a seller's market in just about every price ranges right now, you must still focus on price, condition and marketing. For further reading on buying or selling in this area, check out.... | |
Local Home Sales Stable, Prices Rising in First Five Months of 2019 |
|
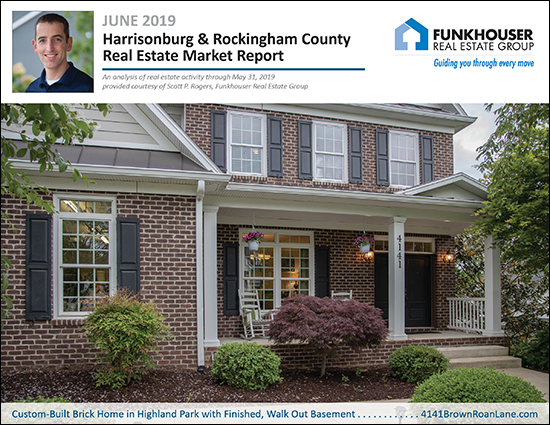 We're nearly halfway through the year and 2019 is shaping up to be a strong year of home sales, very similar to last year. But before we dive into the data, here are a few quick links...
Now, let's see what the data is showing us this month... 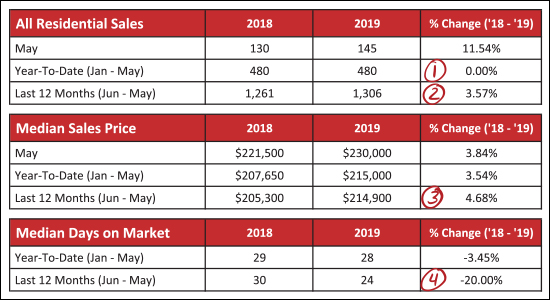 As shown above, we have seen a solid start to the year, now five months in...
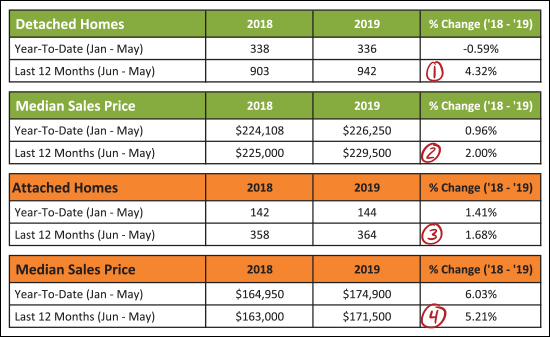 Breaking things down a bit further, as outlined above, we'll start with the green portions of the chart -- which are detached homes...
The orange section above represents attached homes -- including duplexes, townhouses and condominiums, where we find that...
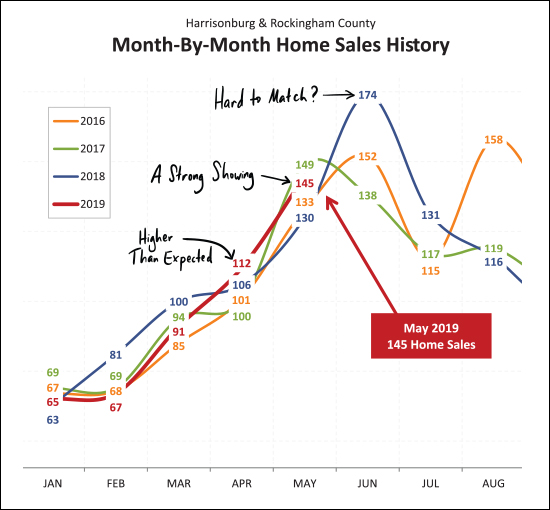 As you look at the graph above, find the dark red line and follow it from month to month from January through May to see how this year compares to previous years. What you'll find is that January, February and March were nothing special -- at all. They were slower or the slowest such months from the past few years. But once we hit April, things started to change -- we saw more home sales in April than any of the past three months of April -- and May home sales were also stronger than two of the past three months of May. So, as noted above -- April was surprisingly high, May was a pretty strong showing, but June, that might be where this year starts to slow down, comparatively. Last June we saw a surprising, historic, 174 home sales in a single month. It seems rather unlikely that we'd see that many home sales this June. 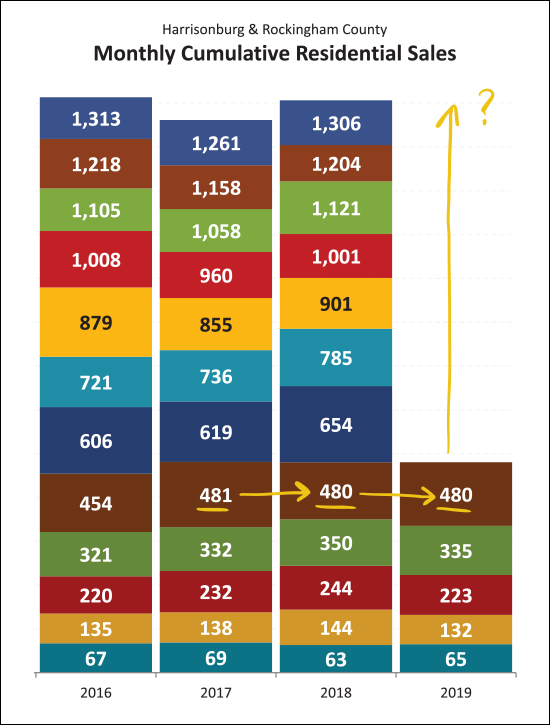 This tall, colorful, graph shows each month of home sales stacked on top of the prior month -- and you'll see that the first five months of this year have tracked pretty consistently with the first five months of each of the past two years. So, it seems reasonable to think we might end up somewhere around 1280 - 1300 home sales for the full year of 2019. Stay tuned as the year continues to develop. 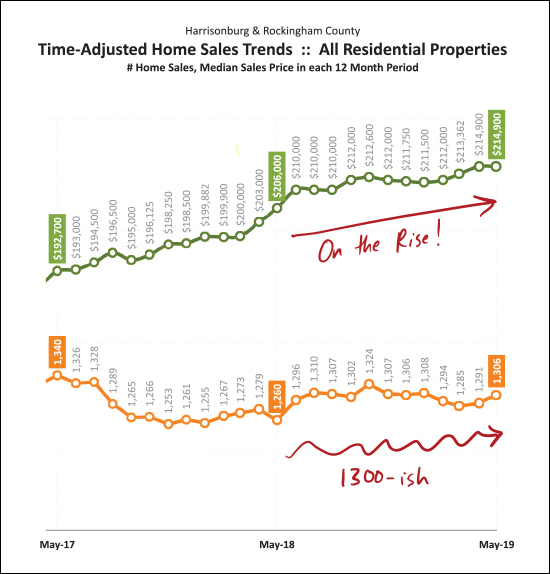 This graph shows looooong term trends -- tracking a rolling twelve months of data when it comes to the quantity of home sales and the median price of those home sales. The highly technical 1300-ish red squiggle at the bottom of the graph represents the meandering annual pace of home sales as shown in orange. We've been somewhere around an annual pace of 1300 home sales for the past 12 months or so -- with the most recent (two month trend) heading us in a positive direction. The top, green, line is showing the long term trend for the median sales price of homes in Harrisonburg and Rockingham County. The median sales price keeps on climbing -- from $193K to $206K to $215K over the past two years. 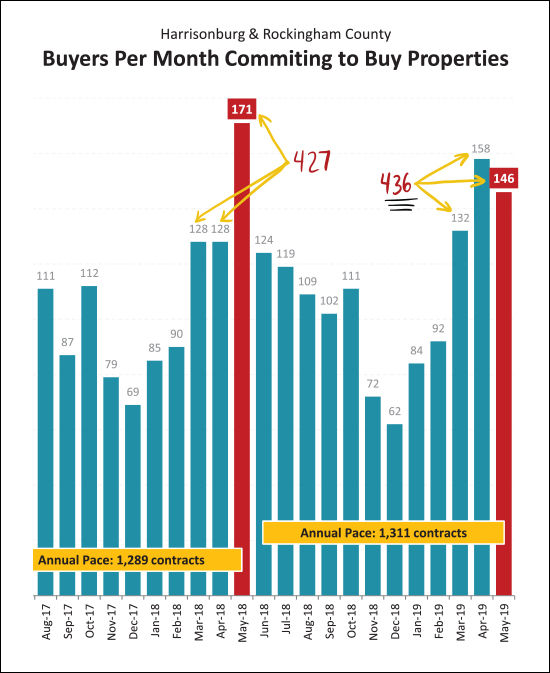 Sometimes looking at a single month of data can throw us off -- getting us overly excited or overly depressed. Last May (2018) we could have been elated about the incredibly strong month of contracts -- though it followed two slower months in March and April. This year we saw strong months of contracts in both April and May -- even though neither reached the 171 contracts seen last May. But in the end, March-May contracts only added up to 427 contracts last year -- and 436 this year -- so, a net increase. 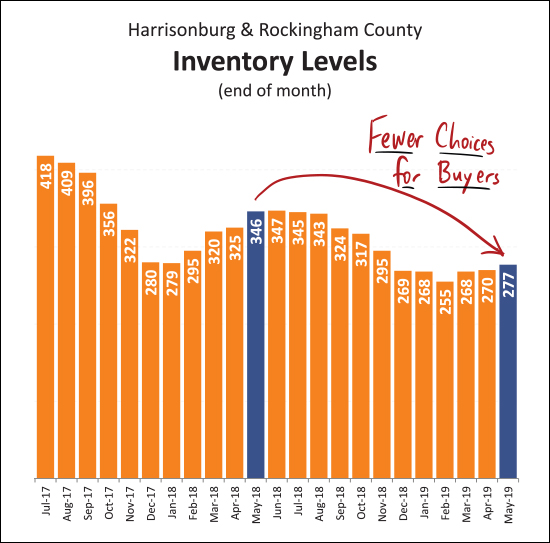 And so, as shown above, the sad story continues -- it is a tough time to be a buyer. Inventory levels might be rising and falling seasonally (rising, slightly, right now) but the overall trend over the past several years has been fewer and fewer homes for sale at any given time. This causes buyers to have fewer choices at any given moment -- and requires that they be able to act quickly and decisively when a house of interest comes on the market. 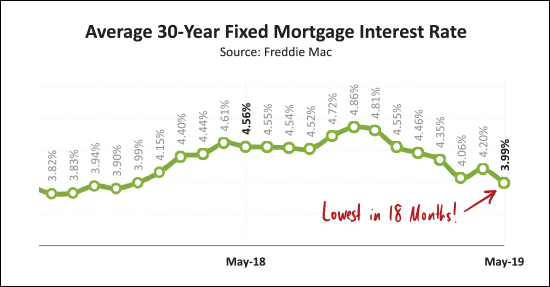 I'm not always convinced that month to month increases or decreases in mortgage interest rates can specifically spur on buyer activity (there has to be a house listed for sale that you actually want to buy) but the lower (and lower, and lower) mortgage interest rates of late certainly don't hurt! We haven't seen mortgage interest rates below 4% in over a year -- and right now many mortgage lenders are quoting rates of 3.875%, 3.95%, etc. An exciting time to lock in a fixed mortgage interest rate! Alright -- we'll wrap it up there for now, though keep in mind that there is a LOT more in my full market report, which you can download as a PDF here. And -- if you're getting ready to buy or sell -- here are some things to keep in mind... SELLERS -- even though it is a seller's market in just about every price ranges right now, you must still focus on price, condition and marketing. For further reading on buying or selling in this area, check out.... | |
Home Sales and Contracts Surge in April 2019 |
|
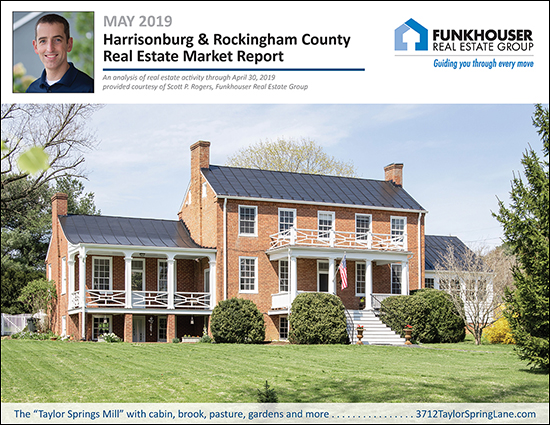 After a somewhat slow start to 2019, the local real estate market has now picked up speed in April! But before we start looking at the data, two quick links for you...
Now, onward! 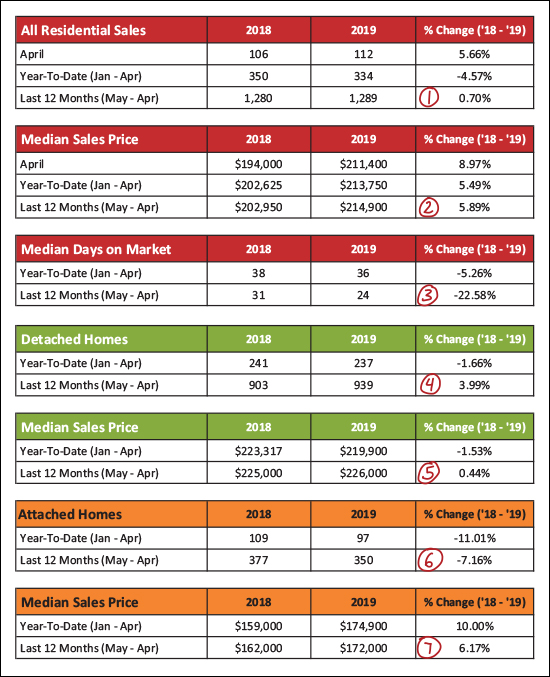 Lots going on above...but here are the high points...
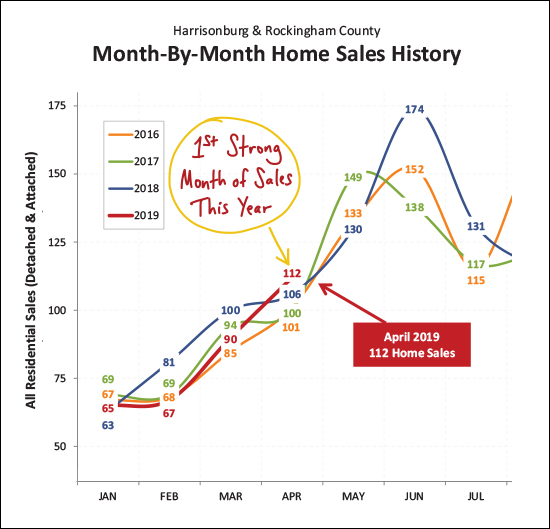 OK - here's what I was talking about earlier. January, February and March sales were simply nothing to write home about. This February was the slowest February out of the past four years. January and March were the 3rd slowest such months from the past four years. But April -- wow! Home sales surged in April, up to 112 home sales -- the best month of April seen in the past four years! 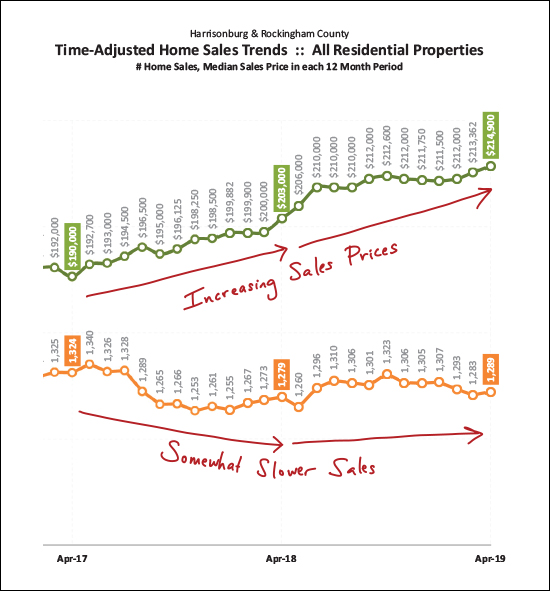 Zooming out from the granular data, this graph looks at long term trends -- the slowly shifting 12-month trend line for the pace and price of home sales. As you can see, sales prices have been increasing despite somewhat slower sales. 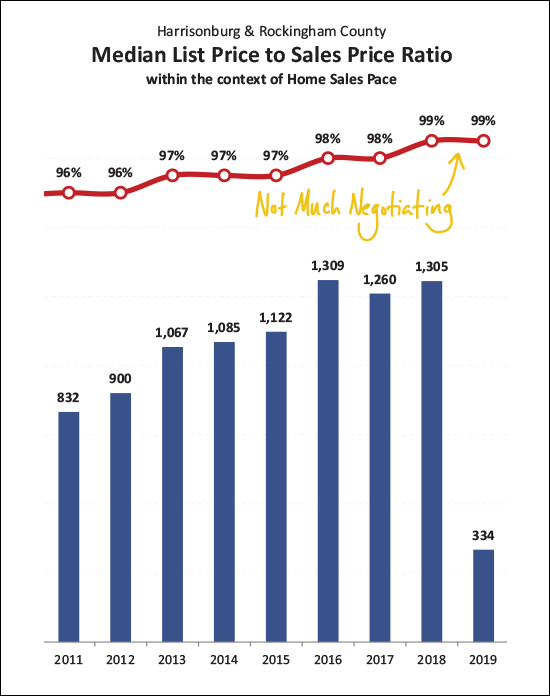 It shouldn't be too much of a surprise that stable sales, rising prices, low inventory levels and low days on market are leading to very little negotiating on price. Homes are selling at a median of 99% of their list price. This means that half of homes are selling for 99% or more of their list price. 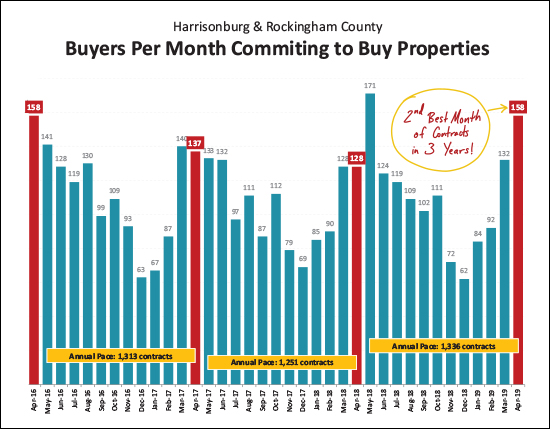 OK - this one was a bit surprising. And I squished all of the data down so far to fit a large context on the graph above that the image is not quite as crystal clear as I'd like it to be. But the message is quite clear - buyers came out in full force in April 2019 -- the 158 contracts signed last month was the second highest month of contracts seen in the past three years! That said - prepare yourself to be at least a bit disappointed next month. I think it's relatively unlikely that we'll be able to see a spike of contract activity all the way up to the showing 171 contracts that were signed last May!? 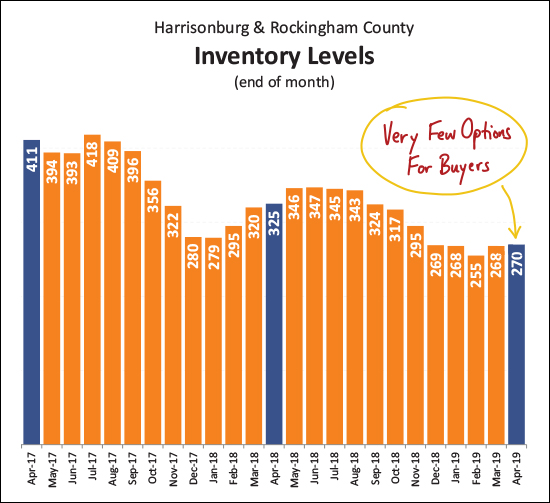 Home buyers like choices, right? Well, right now, they don't have many. In all of Harrisonburg and Rockingham County there are only 270 properties listed for sale. This number has been steadily declining over the past few years -- and the supposedly busy Spring of plenty of listings has not been able to increase these inventory levels -- probably because buyers keep snapping the new listings up as soon as they hit the market. 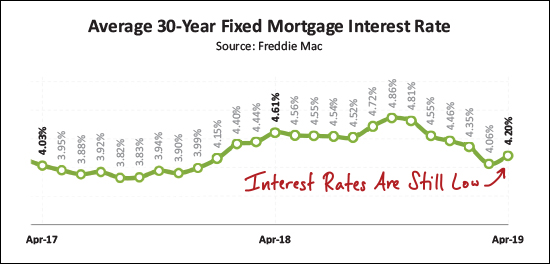 As some welcome news for buyers who are able to find a home to buy - they're able to finance that purchase at a relatively low interest rate! After having risen all the way up to 4.86% (it seemed like 5% was bound to be seen) mortgage interest rates have now dropped all the way back down to the low 4% range. This gives buyers the ability to lock in low monthly housing costs for the long term! OK - we'll cut it off there for now - though there is plenty more that you can scroll through in the PDF of my full market report. My guidance to local soon-to-be home buyers and sellers remains consistent... SELLERS -- even though it is a seller's market in just about every price ranges right now, you must still focus on price, condition and marketing. For further reading on buying or selling in this area, check out.... | |
Sales Slow, Prices Plateau, Contracts Console in First Quarter 2019 |
|
 Just like that - the year is already more than 25% behind us. Looking back over home sales activity during the first quarter we find a mixed bag of market indicators. Before we delve in, two quick links...
Now, on to the data... 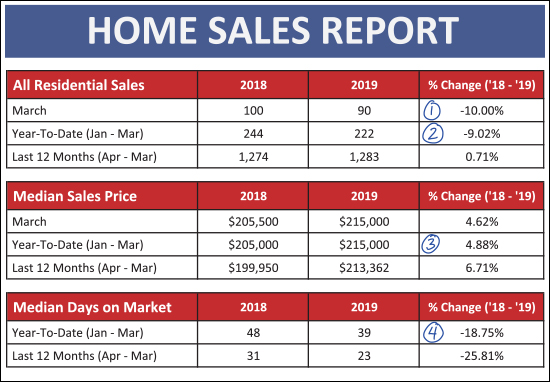 As shown above...
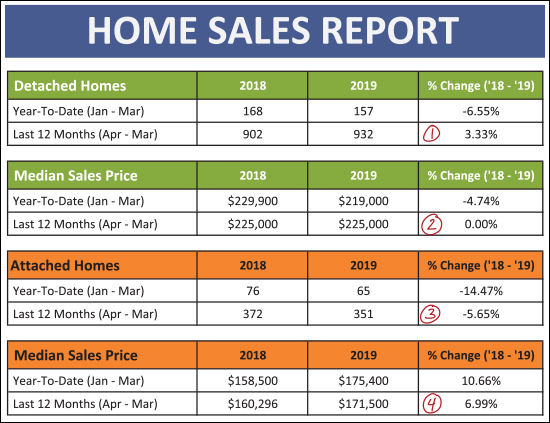 The green rows above are showing sales activity for detached ("single family") properties. The orange rows are for attached properties - which includes duplexes, townhouses and condos.
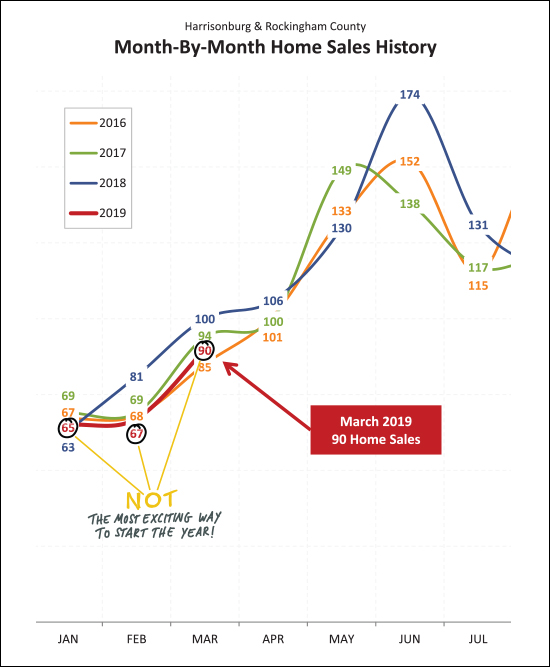 Here (above) is a visual of the not-so-exciting way that this year has begun when we look at monthly home sales compared to the same months in recent years. February home sales were the slowest out of the past four years - and January and March were the second slowest. So - clearly - a slow start to the year - but keep on reading for some news on contract activity. 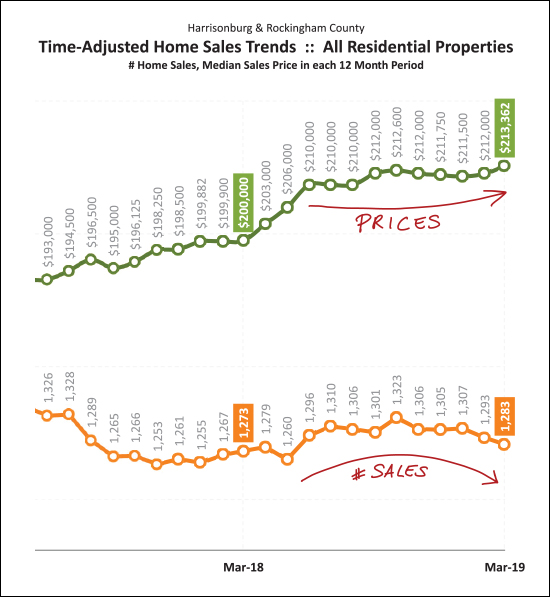 The graph above explores long term (rolling 12 month periods) trends in home sales and prices. Over the past year we have seen sales start to trend slightly downward - while prices have trended slightly upwards. Nothing drastic in either direction, really, but those are the general directions we're seeing the market move. Of note - the rising prices shown above have more to do with a change in the mix of what properties are selling (more higher priced detached homes and fewer lower priced attached homes) more than an actual increase in values. As shown a bit ago (scroll up) the median sales price of detached homes has remained flat over the past year. 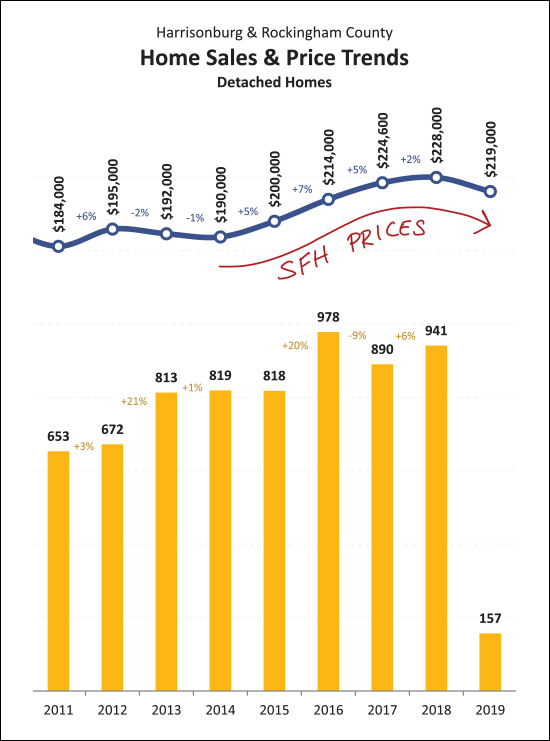 Here's a slightly more depressing view of value trends for detached homes. Over the past few years the increase in sales prices has been decreasing (+7%, +5%, +2%) and with data only from the first quarter of 2019, the median sales price has actually declined. I am guessing that we'll actually end up with a net gain in median sales price once all 2019 data is in the books, but for now, prices are appearing slightly soft when just viewing first quarter data. 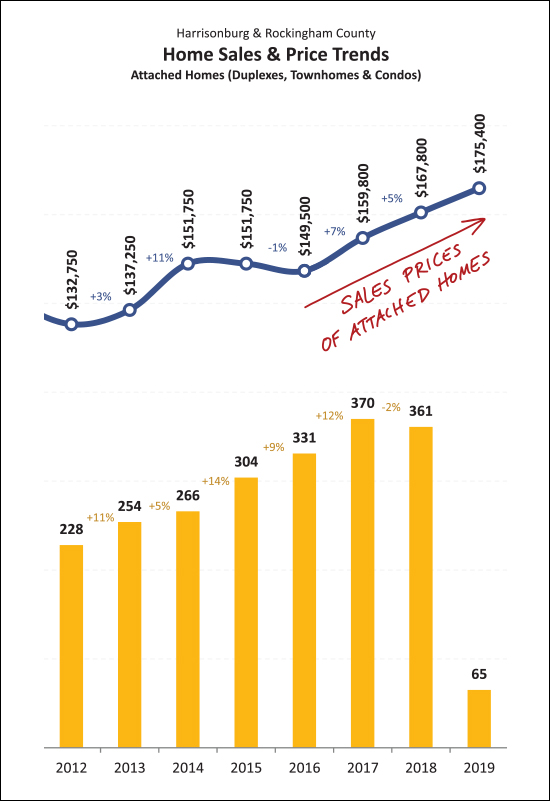 But if you're selling an attached (duplex, townhouse, condo) property - the state of the market is looking promising! As shown above, the prices they just keep on rising. Part of this is likely a result of constrained supply (not enough new townhouses being built) amidst increasing demand. This is keeping sales prices on the rise and that doesn't show signs of stopping in the near term. 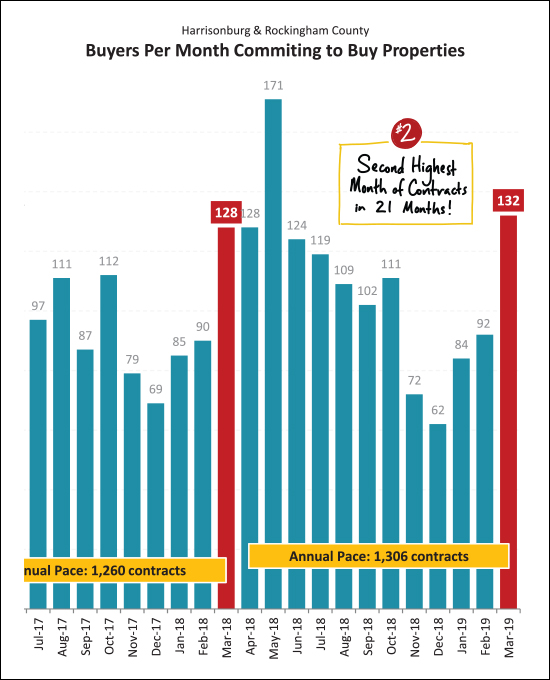 OK - hopefully you read this far - because here is the silver lining of the first quarter of our local housing market. Despite slower sales in the first quarter, contract activity was STRONG in March 2019. In fact -- it was the second strongest month of contract activity in the past 21 months! This should lead to strong months of closed sales in April and May, and hopefully this is just the beginning of a strong Spring and Summer of contracts being signed. 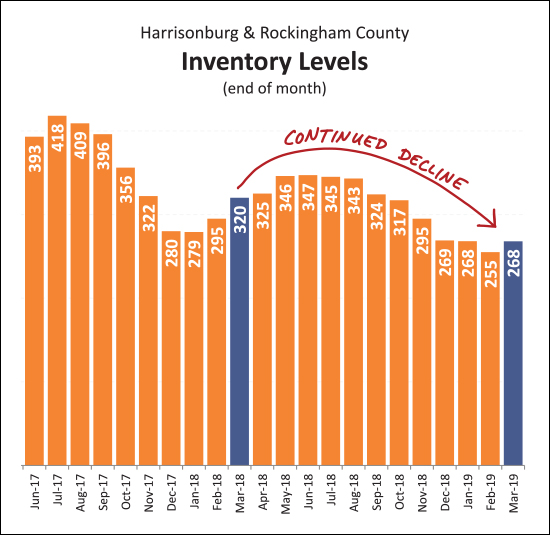 For the past few years I kept saying I didn't think inventory levels could drop any further. Well, they did, they have, and somehow the market keeps on moving. As shown above, despite a monthly increase in inventory levels between the end of February and end of March, we have seen another year-over-year decline in the number of homes on the market. Unless we see a significant growth in new construction in this area, these low inventory levels are likely to remain the norm for the next few years. 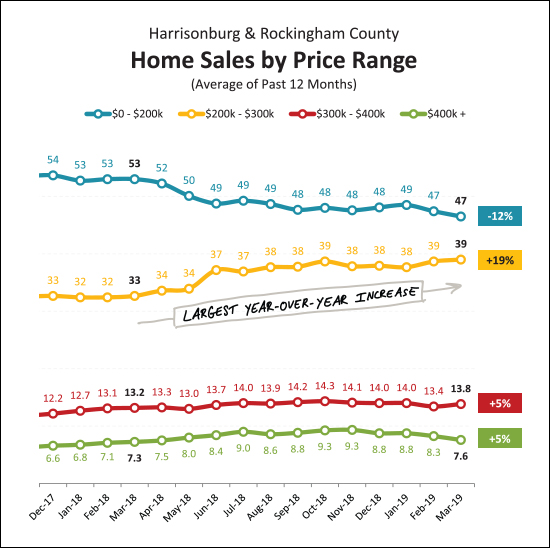 And here's a bit of trivia for you -- the fastest growing price segment of our local housing market is --> the $200K - $300K price range. There has been a 19% increase in sales of homes between $200K and $300K, which is the largest increase of any of the price categories shown above. 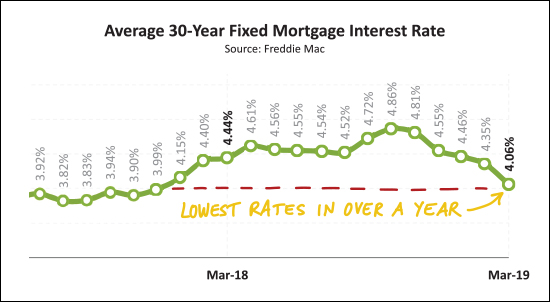 What brought on the strong surge of contract activity in March 2019? Could it be the sudden drop in mortgage interest rates, down to an average of 4.06%? Probably not just that -- it was likely also a surge in new listings combined with anxious buyers who had seen very few options over the winter months. But the low mortgage interest rates likely helped and were an added bonus to anyone making a decision to commit to a home purchase during March 2019. Well, folks, that's a wrap. You read to the end of my overview of our local housing market. You can delve into even more details by downloading a PDF of the full report here. And as always, if you have questions about our local housing market feel free to be in touch. My guidance to local soon-to-be home buyers and sellers remains consistent... SELLERS -- even though it is a seller's market in just about every price ranges right now, you must still focus on price, condition and marketing. For further reading on buying or selling in this area, check out.... | |
Home Sales Slow In February But Contract Activity Increasing |
|
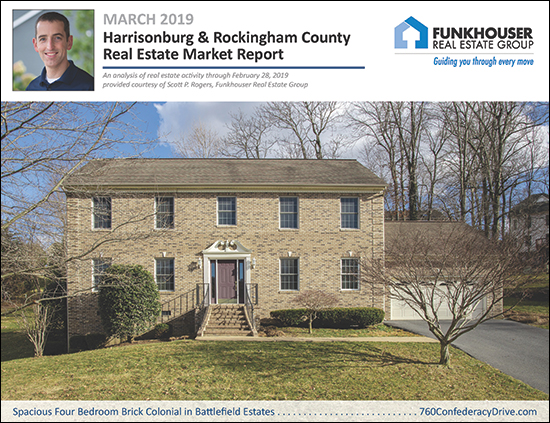 Happy Spring! Yesterday's warm sunny afternoon was a welcome reprieve from our recent frigid temperatures - and it looks like we'll have continued warm-ish (or at least not frozen) days this week as well. And how about that local real estate market? Is it heating up as well? Breaking out of the winter doldrums? Well, maybe not quite - though technically this report only covers real estate activity through the end of February, so maybe we'll have to wait one more month for some more exciting news. But buckle up, and let's flip through the latest local real estate news to catch up on where things have been and where we're likely headed. Oh - but two quick notes, first:
And now, here we go... 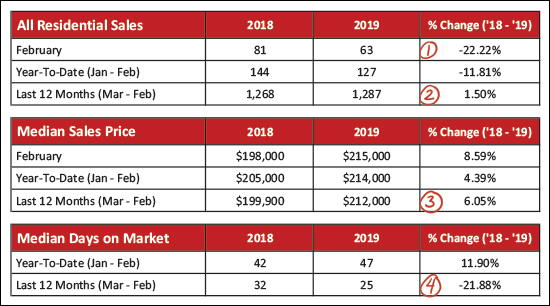 As seen above...
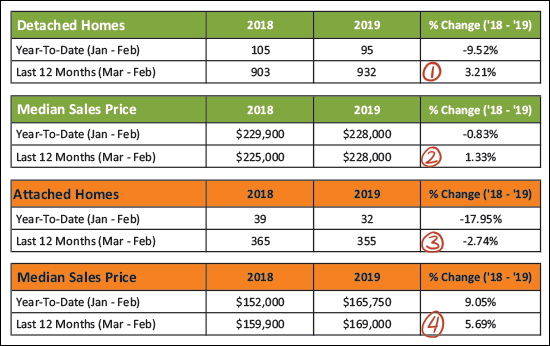 OK - lots going on above - this is where I break things down between detached homes (green) and attached homes (orange) -- where "attached" homes are townhouses, duplexes and condos.
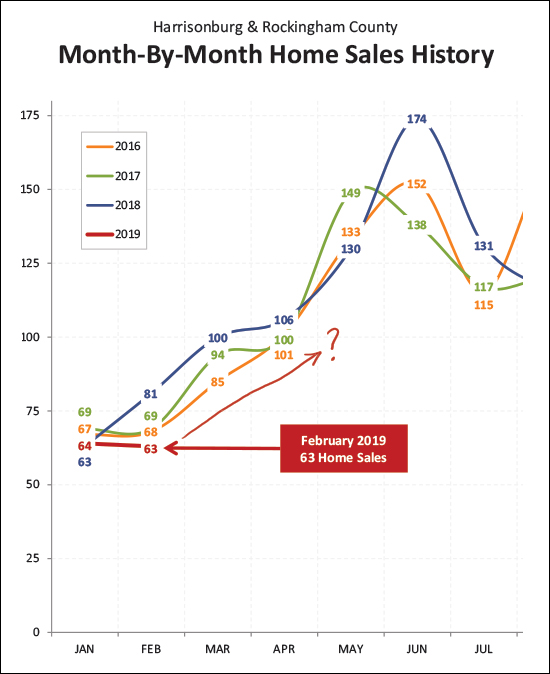 The red line above shows the sales trajectory for 2019 -- January sales (64) were right in the middle of the pack as January goes -- but February sales (63) were much slower (lower) than last year (81) though not too far off of the prior two years (68, 69). So - where in the world do we go from here? Do we see a relatively disappointing March with only 80 home sales (lowest since prior to 2016) or do things bounce back up to 95 or 100 home sales? Time will tell - but thus far the market performance has not been overwhelming in 2019 when it comes to the number of homes that are selling. 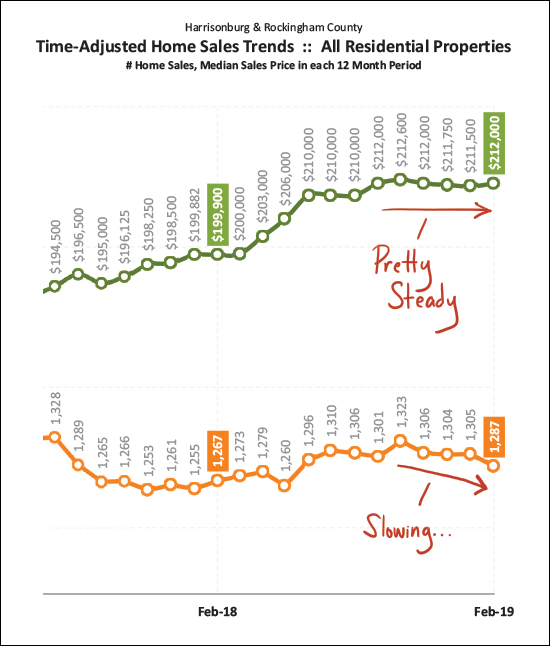 Now, looking beyond the month-to-month trends -- this graph (above) looks at a rolling 12 month timeframe to even out some of the ebbs and flows of market activity. The top (green) line shows that median sales prices have been relatively steady for the past six months -- hovering between $210K and $213K. The bottom (orange) line shows that the annual pace of home sales has actually been slowing in recent months. If home sales keep slowing down, eventually that could have an impact on sales prices, but for now they are holding steady. It is also certainly possible that the slowdown in home sales has more to do with a lack of available inventory than it does with any decrease in buyer interest. 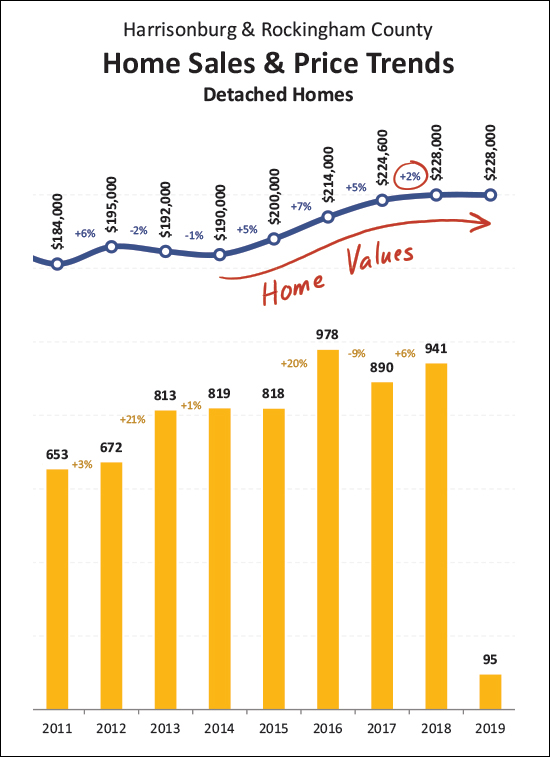 Here (above) is another pretty graph to show the increasing home values in Harrisonburg and Rockingham County over the past few years. Though - curb the boundless enthusiasm for a moment - the annual increase was only 2% in 2018, down from 5%, 7% and 5% the prior three years. So -- 2019 will be a telling year -- will values hold steady, or increase slightly, or decline slightly? Stay tuned -- it's early yet. 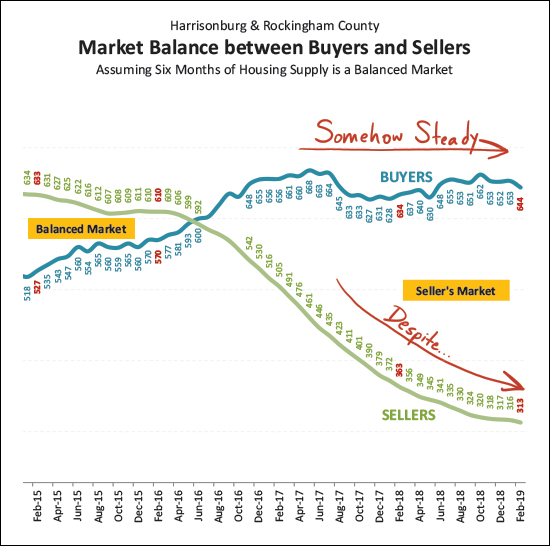 And this (above) might be the missing piece of the puzzle. Buyer activity (blue line) is somehow staying steady-ish (except dipping a bit over the past few months) despite the quickly falling inventory levels (green line) over the past three (four!) years. I've said it recently but I'll say it again - it can be a fun time to be a seller right now - but it's not so fun to be a buyer. You'll be choosing from an ever smaller number of available properties, and potentially competing with ever more buyers. 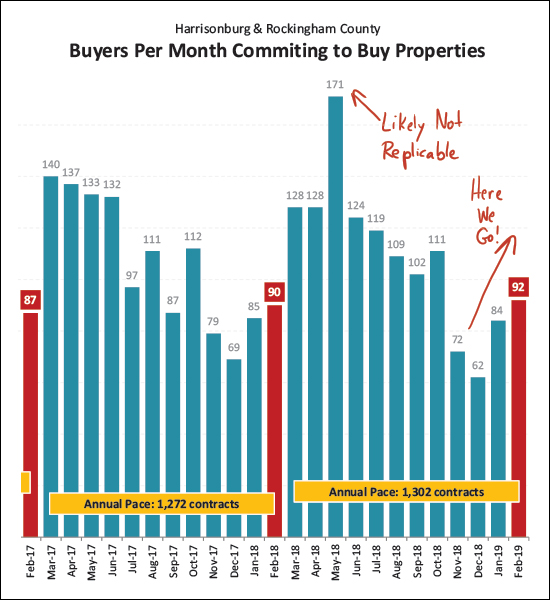 Here's one graph of optimism as it relates to the next few months -- contract activity is on the rise with 92 contracts signed in February 2019, up from 90 last February and 87 the February before that. So - we will likely see a solid month of sales activity in March, and hopefully in April if we have another strong month of contracts in March. But, just to prepare you pretty early here -- I think it is HIGHLY unlikely that we'll see a month with 171 contracts like we saw last May. 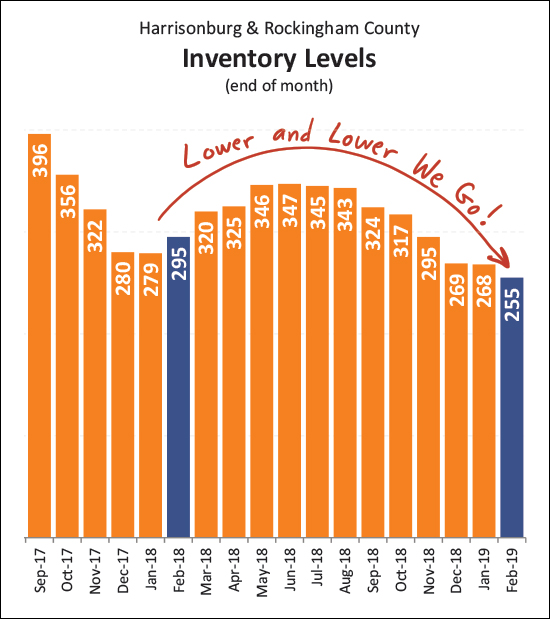 And here is a visualization of those inventory woes I was describing earlier. The number of homes for sale has been creeping ever lower, hitting yet another new low at the end of February with only 255 homes for sale. Hopefully, maybe, possibly, we'll see that start to drift upwards as we get into March, April and May?? 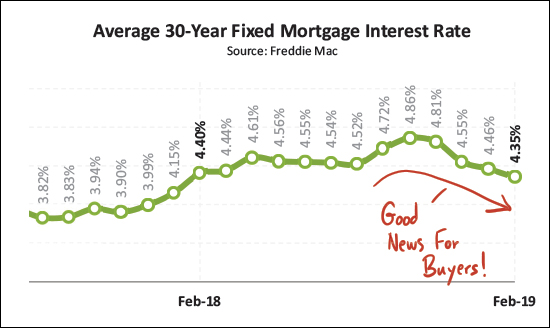 If buyers have anything (anything!?) to be glad about -- it's that their mortgage rate will likely be lower now than it would have been a few months ago. After average rates drifted all the way up to 4.86% -- and seemed to be ready to get back to 5% -- they started floating back down to their current average of 4.35%. If buyer activity increases over the next few months, they'll be enjoying more affordable financing of their home purchase. OK - admittedly - that was a lot. Kudos to any of you who made it all the way to the bottom of this commentary. Many trends stay relatively similar from month to month but it's always good to take a fresh look to give us a context to help make informed real estate decisions moving forward. If you're thinking of buying or selling soon... SELLERS -- even though it is a seller's market in just about every price ranges right now, you must still focus on price, condition and marketing. For further reading on buying or selling in this area, check out.... | |
Local Real Estate Market Holds Steady in January 2019 |
|
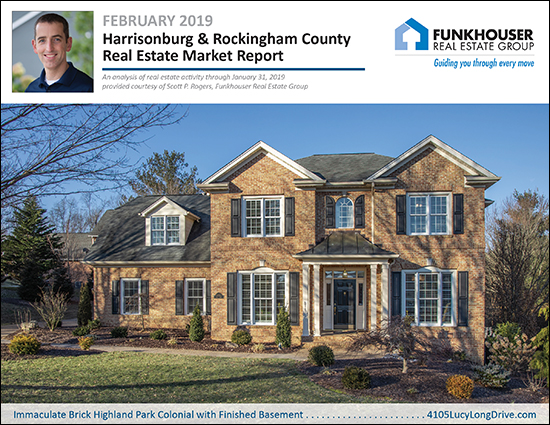 I hope you are finding time to enjoy this one sunny day this week - amidst clouds, rain and snow the rest of the week. Perhaps the bright news in this update on the real estate market will buoy your spirits when the clouds return tomorrow. :-) But before we dive into the data, be sure to check out the home pictured above, an immaculate brick Colonial in Highland Park, by visiting 4105LucyLongDrive.com. Oh, and as per my usual habits, you can skip right to a PDF download of the full market report here, or read on for my color commentary... 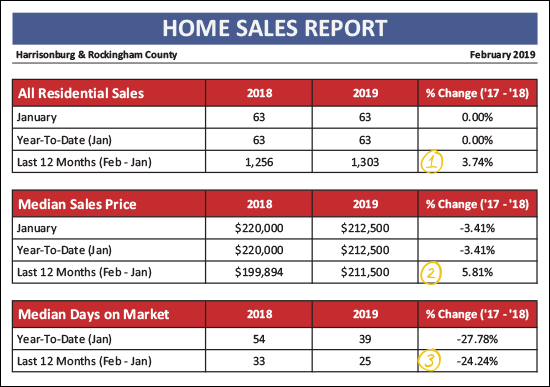 OK - starting off with an evaluation of the market as a whole, the chart above shows us that the exact same number of buyers (63) bought in January 2019 as bought in January 2018. Thus, it was the slowest month of the year - but exactly as slow as things started last year. (1) When we look at a longer timeframe (Feb 2018 - Jan 2019) we see that 1,303 buyers bought homes in Harrisonburg and Rockingham County -- which marks a 3.74% increase in buyer activity as compared to the previous year. (2) The median sales price of the homes that have sold in the past 12 months was $211,500 -- which is 5.81% higher than the median sales price during the prior year. So, perhaps prices are on the rise. Or, perhaps different homes are selling. Read on for more on this. (3) Homes are selling quickly -- QUICKLY! -- with a median "days on market" of 25 days over the past year, a 24% drop from 33 days the prior year. Now, let's break things down between detached homes and attached homes. Attached homes are townhouses, duplexes and condos... 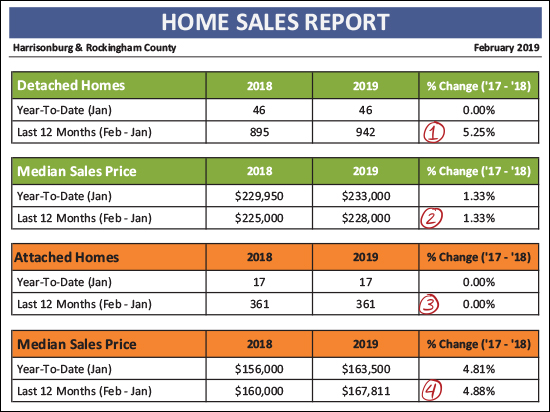 There is a good bit to soak in here, on the chart above, as well. (1) The 942 buyers who bought detached homes over the past 12 months contributed to 5.25% more buyer activity -- for this type of property -- as compared to the previous 12 months. (2) The median sales price of those 942 detached homes was $228,000 -- a whole (not actually that exciting) 1.33% higher than the $225,000 value one year prior. (3) Talk about consistency -- 361 buyers bought attached homes (townhomes, duplexes and condos) in the past 12 months -- exactly the same number as during the previous 12 months. (4) The median sales price of those 361 attached homes was $167,811 -- a full 4.88% higher than the $160,000 value one year prior. 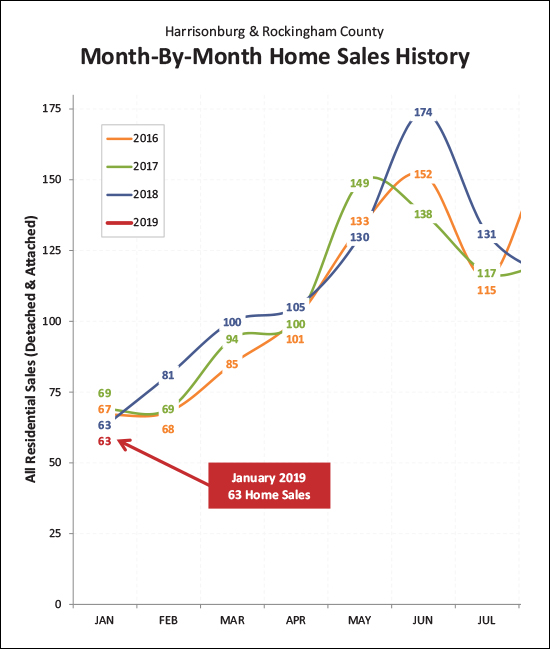 There it is, folks, the start of something great -- maybe? While it's true that January is the slooooowest month of the year for home sales AND this past January was the sloooooowest January seen in the past few years -- it is also true that last year was a near record breaking year of home sales, and we also started out with only 63 home sales in January 2018. So -- stay tuned -- perhaps this will be another vibrant year of sales activity for the local real estate market. 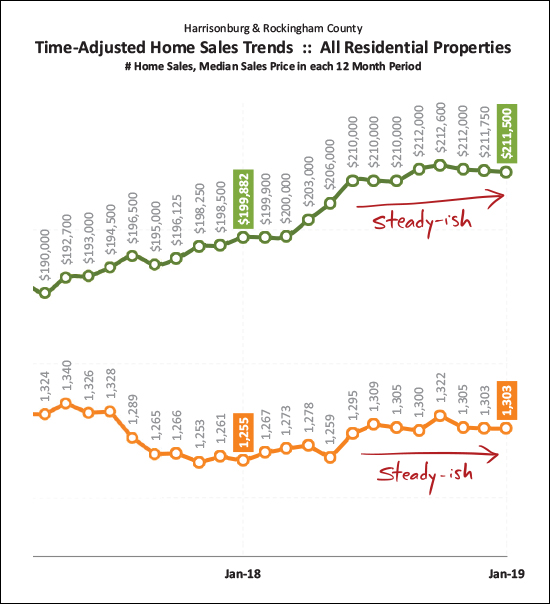 Staying steady - that's all I wish for our real estate market sometimes. The graph above shows a rolling 12 month value for the median sales price and the number of home sales taking place in our local market. You'll note that homes have been selling at a pace of around 1300-ish homes per year for the past six or so months -- and we've been hovering around the $210K-$212K mark for median sales prices. Staying steady-ish isn't too bad. I'd be happy with a 0% - 2% increase in the pace of home sales and a 2% - 3% increase in the price of home sales this year. We'll have to wait a few more months to get a better sense of if that is where we're headed. 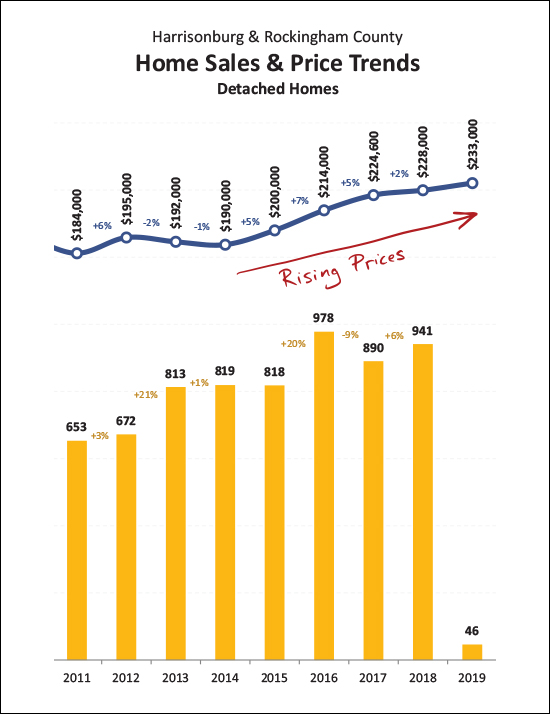 If asked, I think home values have risen by 2% over the past year, and the graph above is why I'm sticking to that number. If you look at all home sales in the area (attached and detached) you'll come up with a higher increase in the median sales price -- but I believe the change in the median sales price of detached homes is the best indicator of trends in market value -- and there was a 2% increase in the median sales price of detached homes between 2017 and 2018. Stay tuned to see how we fare in 2019 as more data keeps coming in. 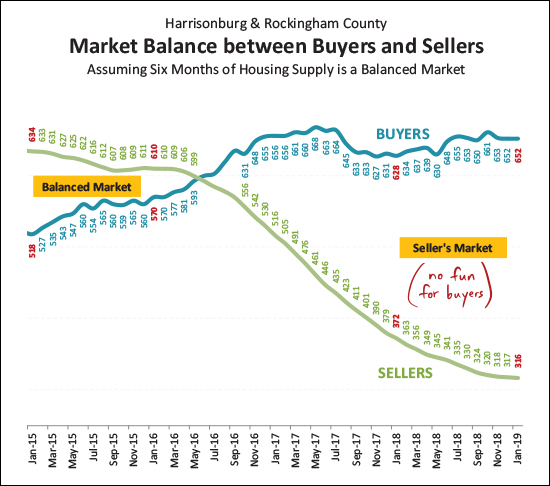 It's a great time to be a seller! As shown above, while the number of buyers in the market has stayed relatively consistent over the past (almost) two years, the number of homes on the market at any given point has continued to decline steadily. As such, this has become more and more of a seller's market. Homes are selling quickly and thus buyers must be ready to pounce on the home of their dreams when it is listed for sale. More on this at the bottom of this note. 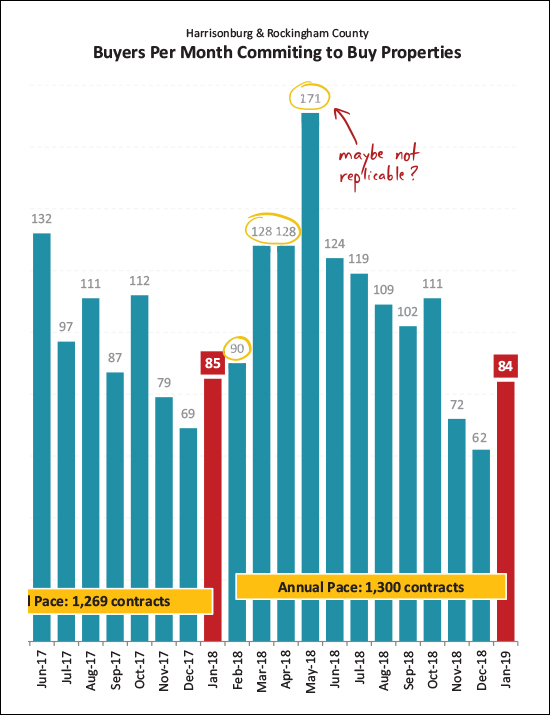 On this graph it might be most interesting to look backwards in order to look forwards. After a predictable mid-80's month of contract activity in January, it seems likely (based on history) that we'll see around that many buyers sign contracts to buy homes in February. But after that, look out! Buyer activity usually starts in earnest in March and April, where you'll see a 45% (ish) increase in buyer activity between Jan/Feb and Mar/Apr. The big question this year would be whether we really will / could have anywhere near as stellar of a month as we had last May for contract activity. Maybe not?? 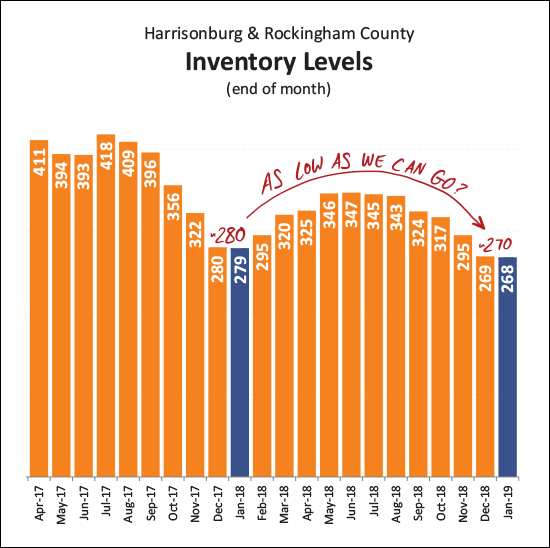 It is quite possible that inventory levels have dropped just about as far as they can possibly go. Over the past year we saw a seasonal rise and fall back to a just-below-300 inventory level as we started out January and February. It seems likely we'll get back up to a 340-350 level in the summer months, but absent a large new construction development starting in the area, it seems unlikely we'll get back up to 400 homes for sale at any given point in 2019. 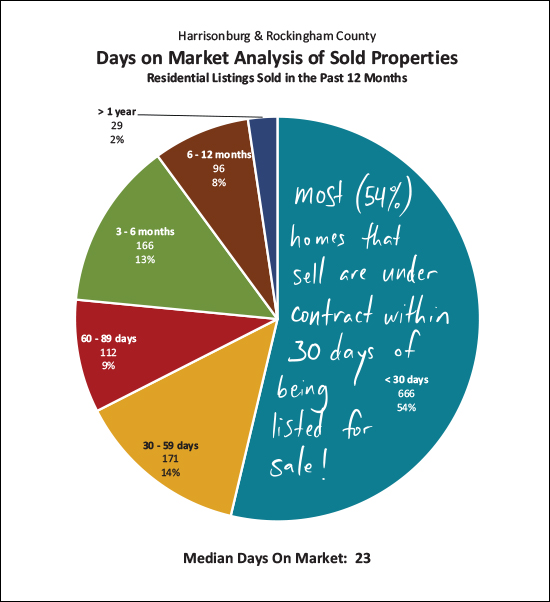 I said it earlier, but I'll repeat it. Homes are selling quickly! OK -- not all homes -- don't get overly distressed if your home is not under contract within 30 days of being listed for sale -- but quite a few (54%) of the homes that do sell are indeed under contract within 30 days of being listed for sale. If your home is not, let's talk about why, and what we might need to do to get it under contract within the next 30 - 60 days. 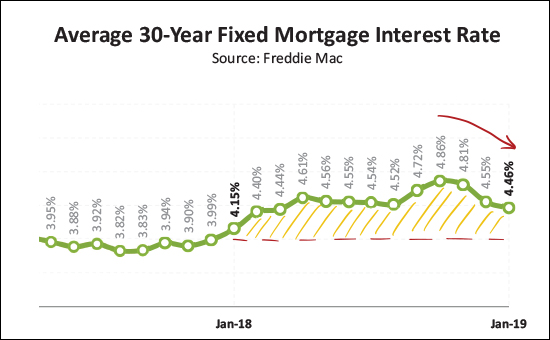 Refreshingly, after staying above 4% all year long in 2018 - and rising as high as 4.86% in October - they finally started to decline again and have continued to do so over the past few months. We're not back (barely) under 4.5% which is a nice relief for buyers in the near term. I'll pause there now, and commend any of you voracious readers of market updates who made it this far. :-) Read even more (!!) in the full PDF here, or feel free to shoot me an email with your thoughts, perspectives or questions on the market. And finally, a few quick links for you if you are thinking of buying or selling soon -- SELLERS -- even though it is a seller's market in just about every price ranges right now, you must still focus on price, condition and marketing. For further reading on buying or selling in this area, check out.... | |
Harrisonburg Year End Housing Market Report Shows Increases in Sales and Prices |
|
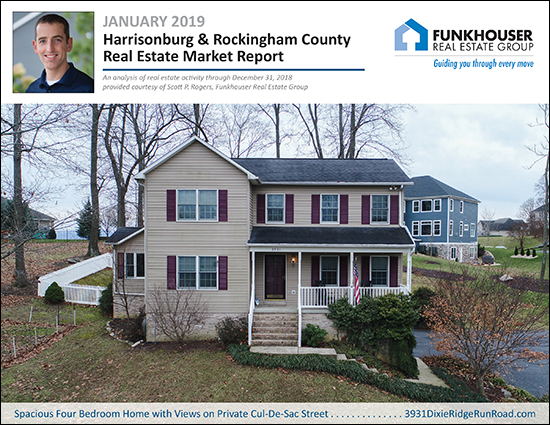 Happy Cold and Snowy January - and Happy New Year! Before we look back at a summary of our local real estate market in 2018, take a few minutes to explore the featured home pictured above, a spacious four bedroom home with views on a private cul-de-sac street at 3931DixieRidgeRunRoad.com. As per the norm, you can find a PDF of my full market report here. And now, let's take a thorough look at the overall performance of our local housing market in 2018... 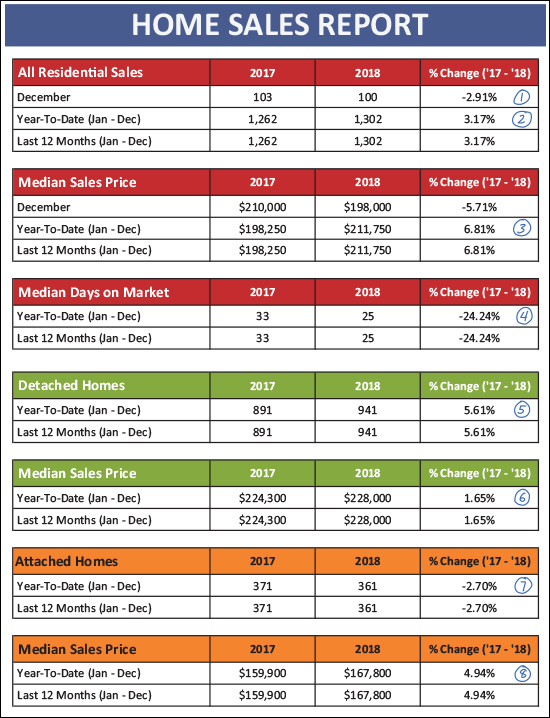 Overall, 2018 was a great year for the local housing market. Here are some key takeaways from December and the full year of 2018...
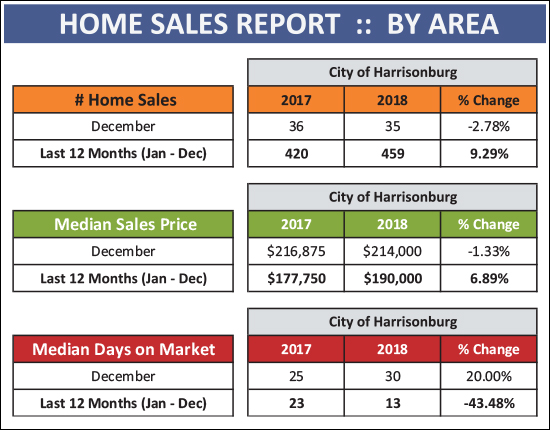 The City of Harrisonburg has been a particularly interesting market over the past year, as detailed above. Home sales increased 9.29% between 2017 and 2018, accompanied by a 6.89% increase in the median sales price (up to $190K) and home sold with a median days on the market of only 13 days! Homes went under contract quickly in the City of Harrisonburg last year -- and that seems likely to continue into 2019 given continued high buyer demand and low inventory levels. 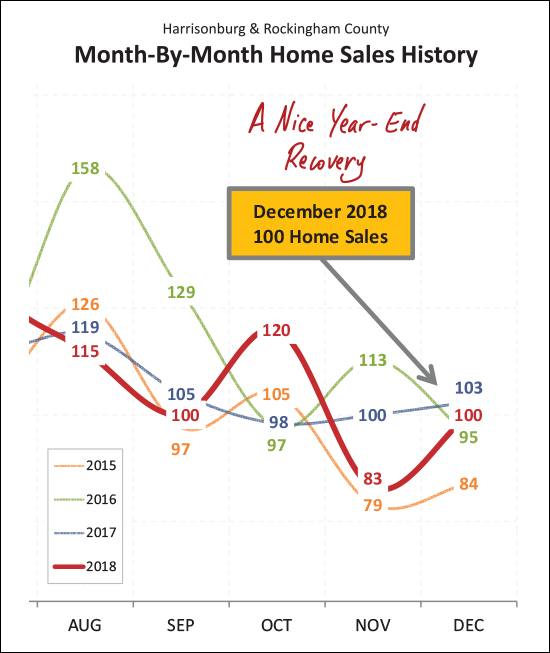 Home sales have bounced back and forth (up and down) over the past few months in Harrisonburg and Rockingham County. August, September and November were low to average as compared to the same month in previous years -- but October was a new high (120) and sales bounced back in December to a high-ish pace which helped round out an overall strong year of sales. 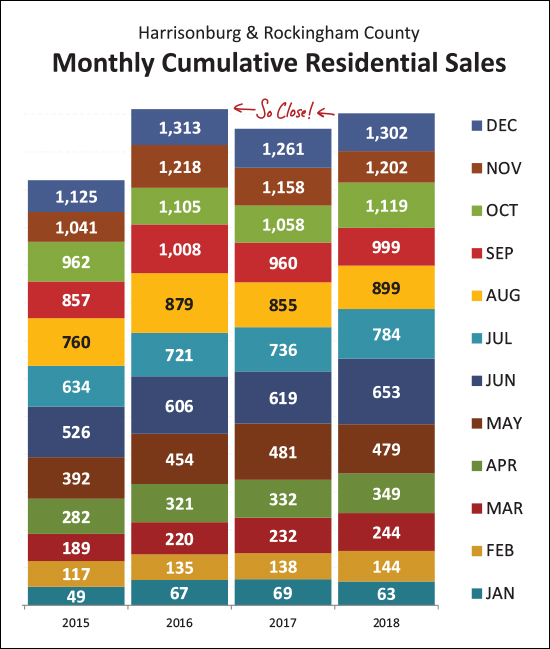 Just another look at the pace of home sales, above, for those (like me) who prefer pretty data visualizations. We came so (so) close to matching the 1,313 sales seen in 2016. And yes, we bounced back from the slight dip we saw in 2017. What, then, might be in store for 2019? Another 1,300+ year of home sales? I think so -- but we shall see! 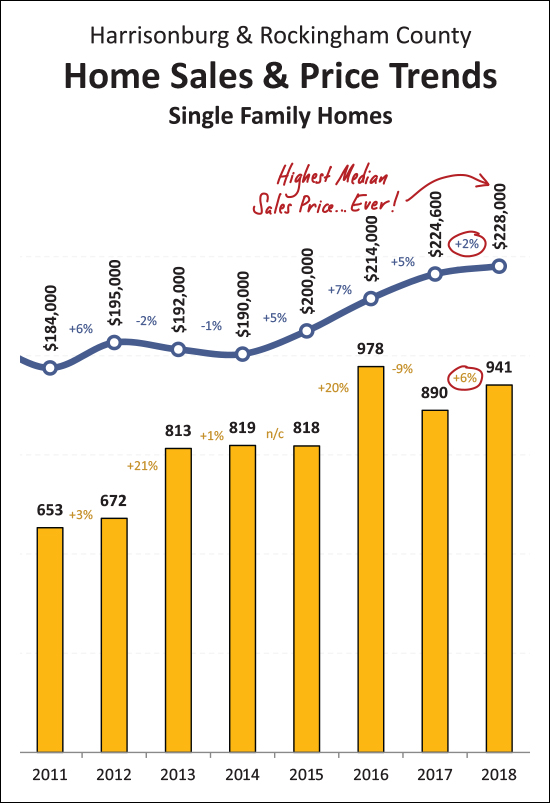 OK - a few IMPORTANT things to note here. Despite the fact that the overall median sales price for residential properties increased 7% in 2018 -- I don't believe home values increased 7%. Much of the 7% increase in the overall median sales price was a result of a larger number of (higher priced) detached homes selling in 2018 (as compared to 2017) and a smaller number of (lower priced) attached homes selling. This graph (above) then becomes important, as it shows the trend for detached homes only -- which is often a better indicator of changes in market value. You'll note that we saw a 6% increase in the pace of detached home sales and a 2% increase in the median value. So -- if you own a detached home in Harrisonburg and Rockingham County, it is likely that the value of that home increased 2% over the past year. Oh -- and I should point out that last year's median sales price of $228,000 for detached homes is THE HIGHEST median sales price we have ever seen on an annual basis in this market. 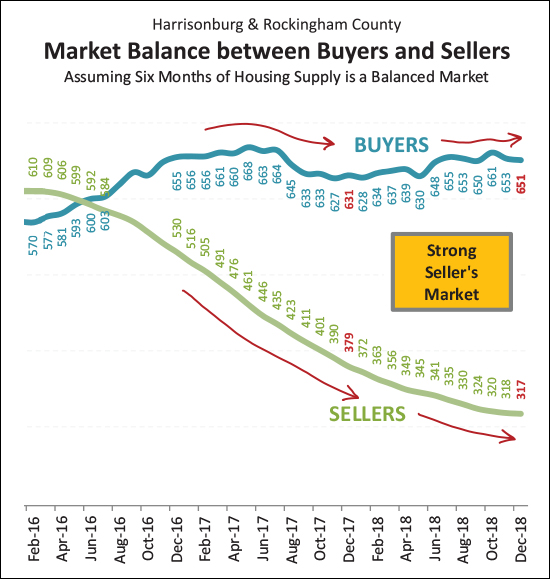 As shown above, we have seen a steady stream of buyers in the market over the past two years -- fluctuating from 620-ish to 660-ish in a six month period. Unfortunately for those buyers, however, they have had an smaller and smaller number of homes from which to choose. The number of sellers in the market -- as measured by inventory levels on a monthly basis -- has steadily decreased over the past two years. These two trends have combined to create an increasingly strong seller's market in Harrisonburg and Rockinhgham County. 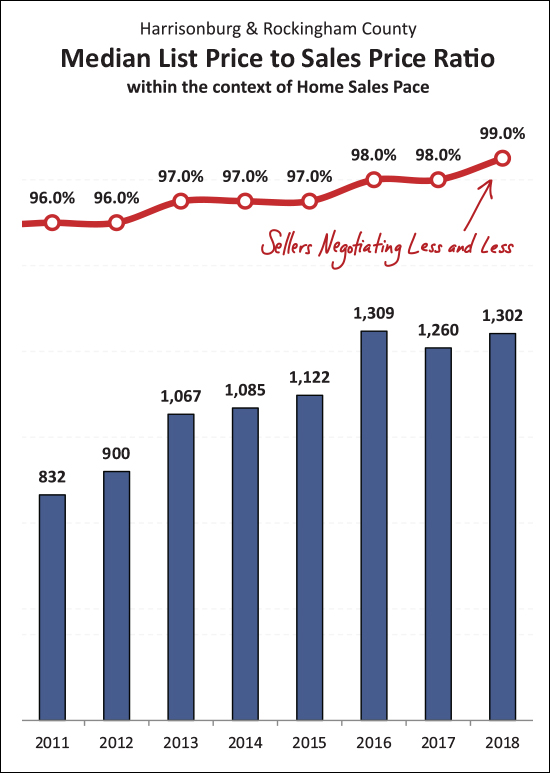 OK - this one is interesting - and I believe it is a sign of a healthy-ish real estate market. As shown via variety of graphs above, home sales are up, inventory is down, days on market is down -- and yet, the median sales price seems to have only increased by 2%. So - the strong seller's market has not (thank goodness!) resulted in irrational, unreasonable, unsustainable increases in sales prices. That said, sellers are negotiating less and less (as shown directly above) from their last list price. I say "last" list price because some sellers don't start with the best list price out of the gate, and have to reduce their list price. But in the end, sellers are negotiating less (around 1%) than they have in any recent year. 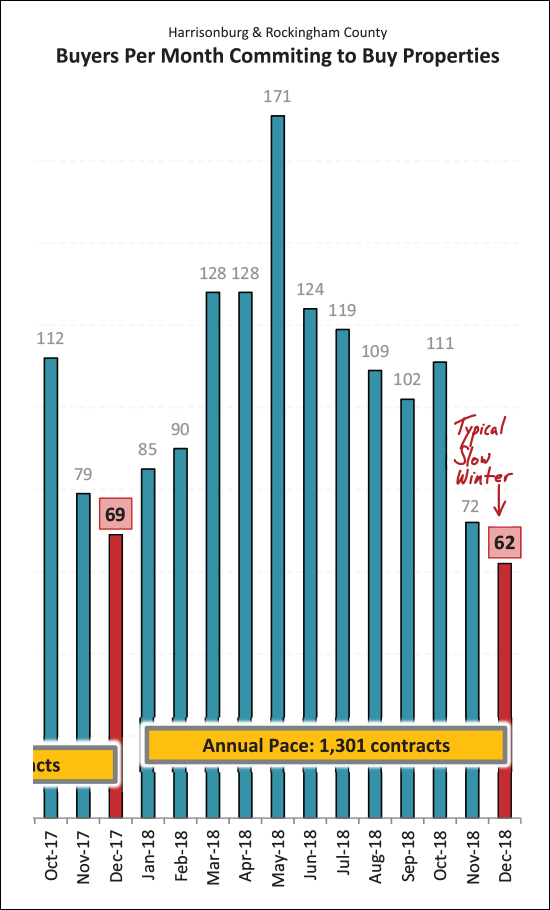 For the purposes of at least a small sneak peak ahead -- we saw only a small number of contracts (62) in December -- which is to be expected in this first month of Winter. We're likely to see a small number of contracts in January and February as well, if past years are any indicator, before home sales (contracts) start to pop again in March. 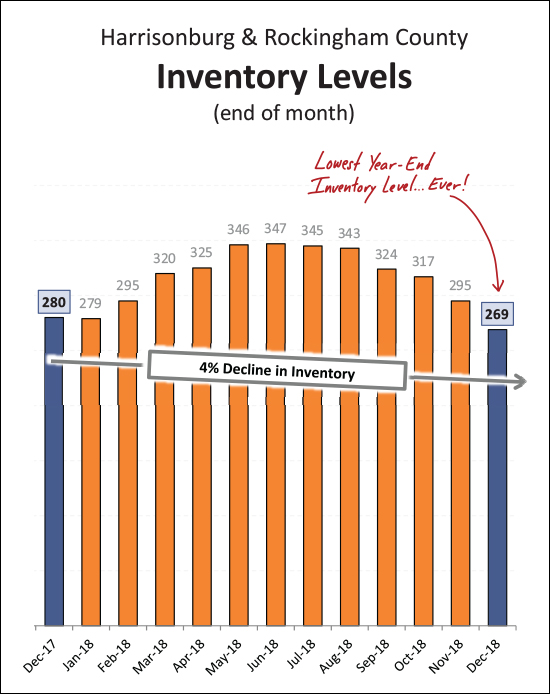 And there (above) are those low inventory levels I was referencing. In fact, the 269 properties currently listed for sale in Harrisonburg and Rockingham County is THE LOWEST inventory level we have ever seen in this area. So -- perhaps the small-ish (4%) year-over-year decline is an indication that we're getting about as low as we possibly can/could/will in this market. 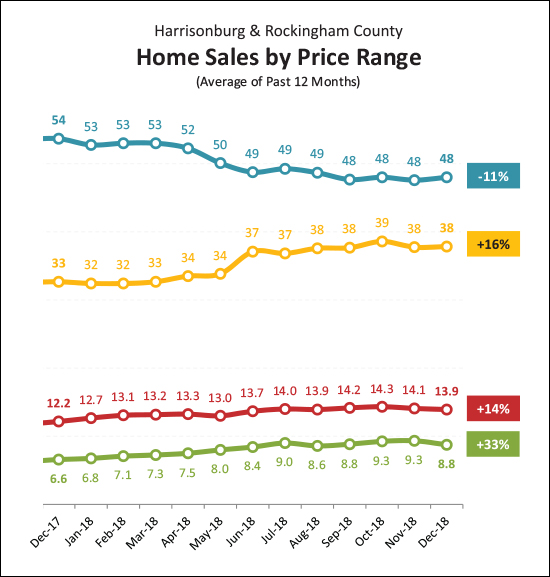 As one might expected, different price ranges are performing differently in our local market. The pace of home sales in the "under $200K" market continues to decline -- likely a result of properties appreciating out of this price range. We saw a sizable increase (+16%, +14%) in the middle market segments of $200K-$300K and $300K-$400K, and the largest increase in the $400K+ price range where home sales have increased 33% over the past year. 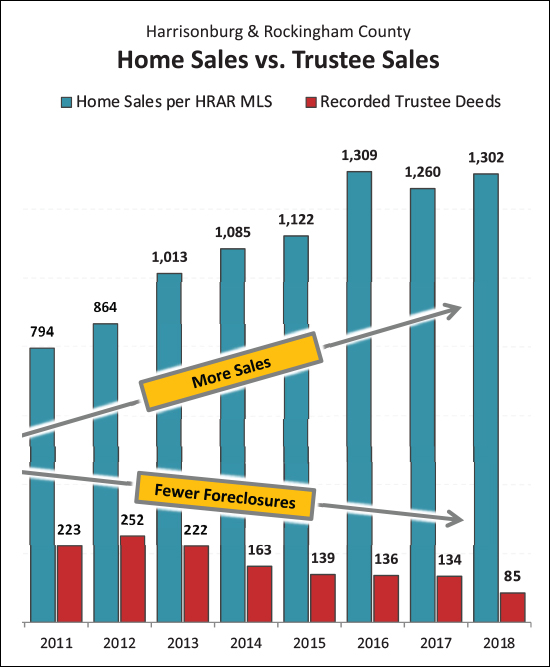 Another sign of health in our local real estate market is the ever declining number of foreclosures taking place. As shown above, there were only 85 foreclosures in Harrisonburg and Rockingham County last year -- a 37% year-over-year decline. 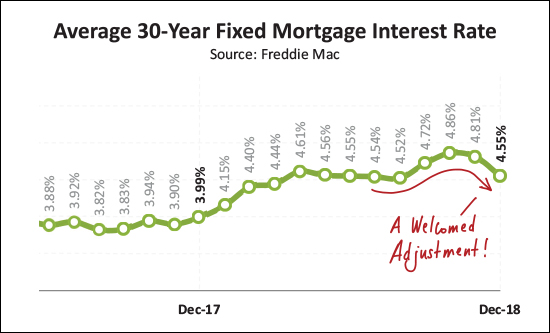 One last note -- we have seen a decline over the past few months in the average mortgage rate, which is exciting for buyers currently signing contracts to buy homes. We spent all of 2018 above 4% and we seemed to be quickly climbing towards 5% between August and October -- but the last few months of the year we saw things turn around and we are back closer to (or even below in some cases) 4.5%. OK - that wraps up my year-end overview of the state of our local housing market. I went into a bit more detail than usual this month -- though there is still PLENTY more in my full market report. You can download a PDF of the entire report here. And finally, a few quick links for you if you are thinking of buying or selling soon -- SELLERS -- even though it is a seller's market in just about every price ranges right now, you must still focus on price, condition and marketing. For further reading on buying or selling in this area, check out.... | |
Despite Slower November, Home Sales Still Stronger Than Last Year |
|
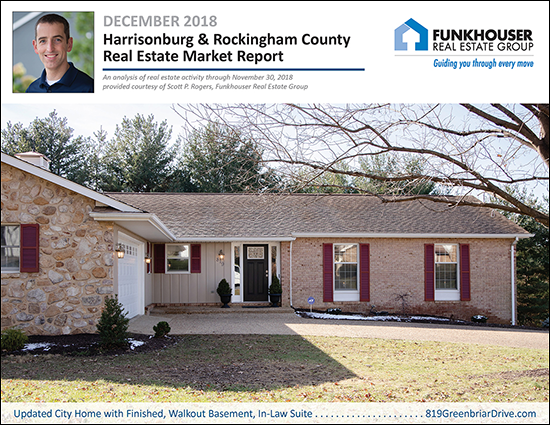 Before we dive into this month's market report, check out this featured home by visiting 819GreenbriarDrive.com. Now, on to our local real estate market -- I just published my most recent monthly market report, and as usual, you can read on for an overview, download the full report as a PDF or tune in to my monthly video overview of our local housing market... VIDEO OVERVIEW: Click here to watch (and listen) to my overview of the market. Now, let's take a look at some the trends we're currently seeing in our local housing market... 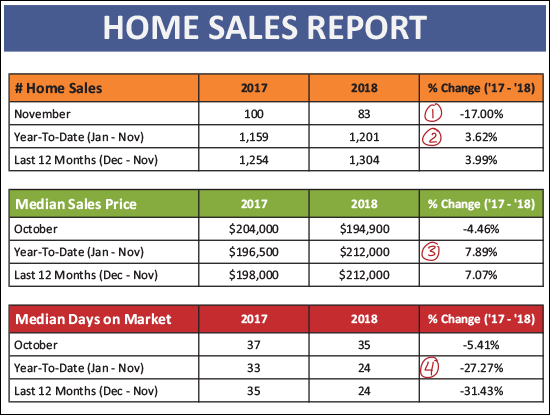 As we can see above...
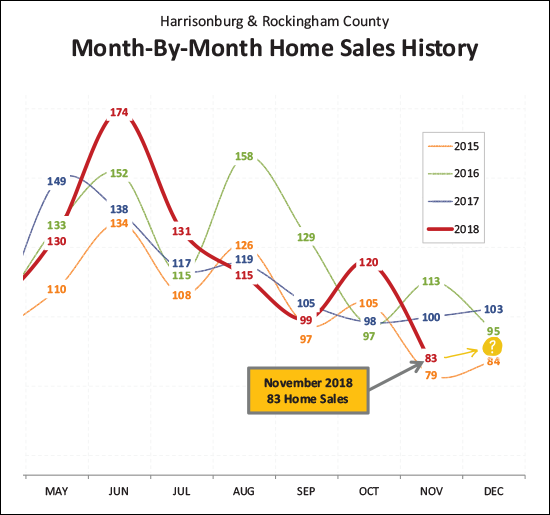 This has been a bit of an odd year, as shown above. We have seen quite a few months of new "highs" for monthly home sales. They aren't all shown above, but you can see that June, July and October were the highest such months in the past several years. But then you have months such as November -- where we fell to one of the lower such months of sales in recent years. So -- what about December? I'll guess we'll end up around 90 or so home sales -- maybe 95 -- or even 100? 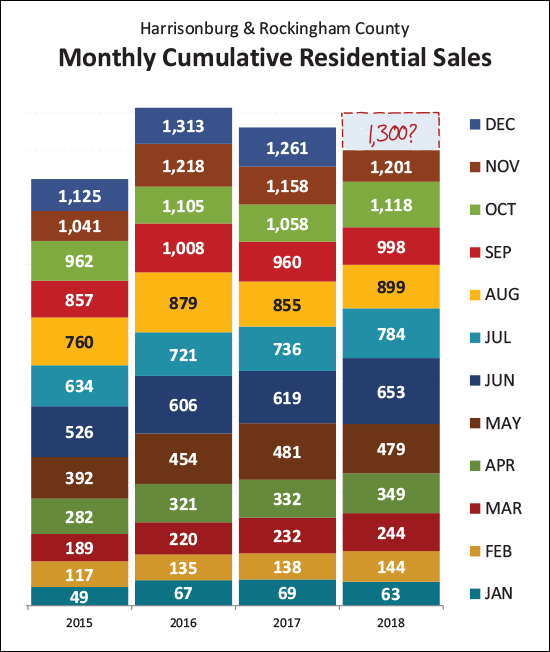 This graph shows each month of home sales stacked upon the previous months -- and you can see that we're beating every recent year except 2016 when you look at home sales through November -- shown in a light brown color. It seems almost certain that we'll beat the 1,261 total we saw last year -- but will we get up to 1300 home sales this year? We'd need 99 home sales in December! 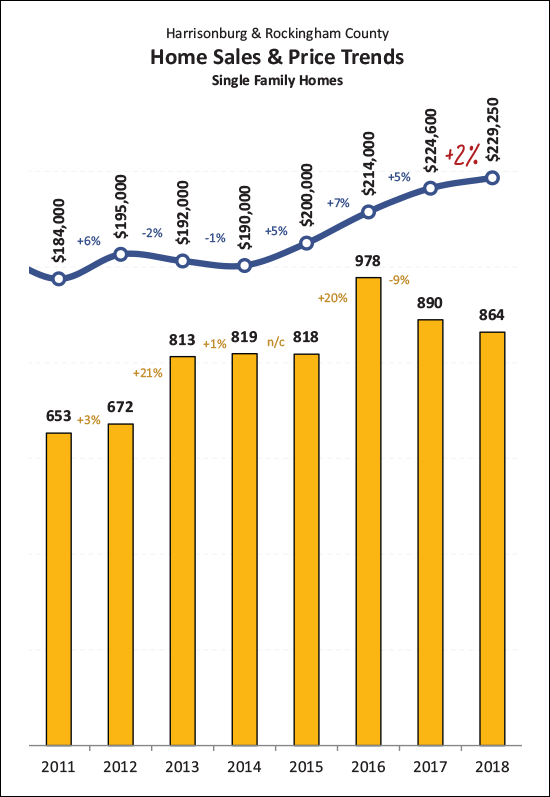 As I have mentioned in a few recent market reports -- the 7% (or so) increase that we're seeing in the median sales price for all residential sales might not mean that homes are selling for 7% more than they were last year. That 7% rise seems to be more a result of a greater number of (higher priced) single family homes selling in 2018 as compared to how many sold in 2017. Read more about this phenomenon here. That said, the graph above might give us a better idea of value trends -- where we see that the median sales price of single family homes has increased 2% over the past year. 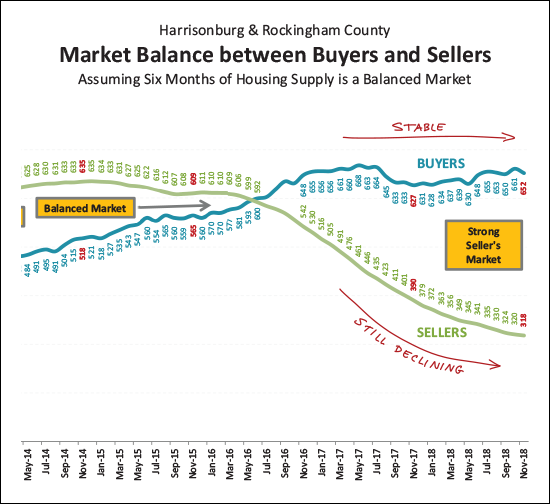 It's a good time to be a seller right not -- and not as exciting of a time to be a buyer. As shown above, the supply of buyers is steady -- with right around 650 buyers buying in a six month period. But at the same time, the number of sellers (and their homes) in the marketplace keeps on declining -- giving those buyers fewer and fewer options from which to choose. 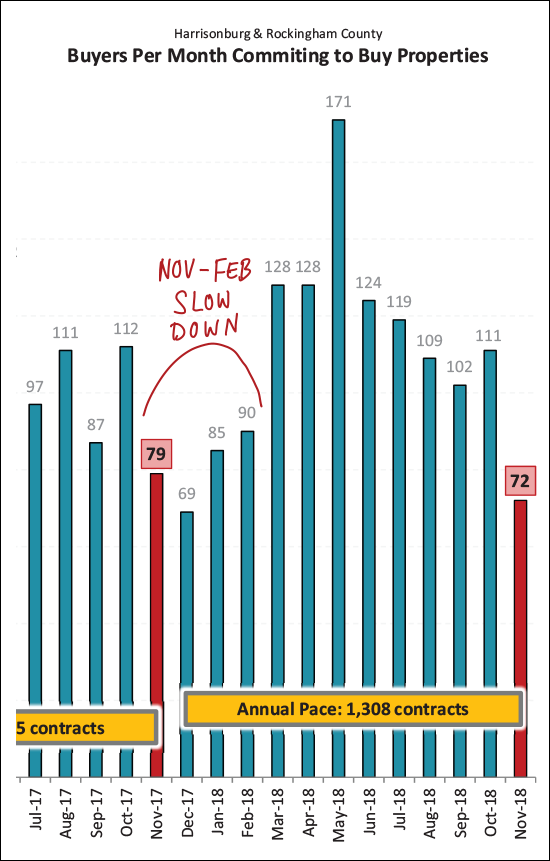 Hmmm -- 99 home sales in December might not be completely realistic after all. As shown above, only 72 buyers (and sellers) signed contracts in November 2018. This, combined with some lingering October contracts, means we're probably more likely to see 80 - 90 home sales in December. And -- for you current or near future sellers out there -- buyer activity is likely to stay a bit lower over the next few months. A strong surge of buyers is likely to return in March. 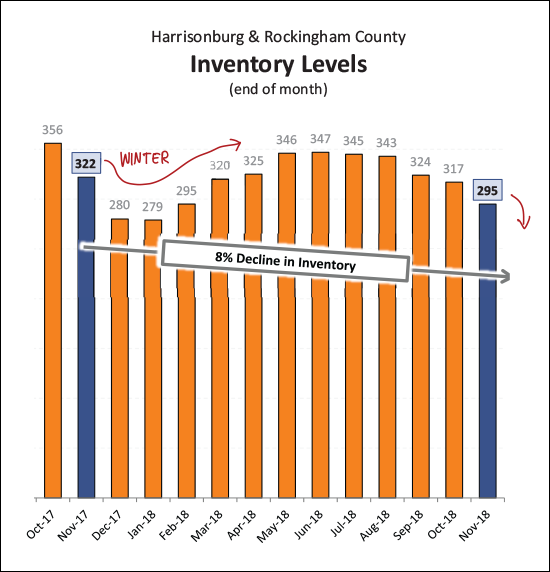 Well -- we dropped below 300 homes for sale again this month -- and we're likely to dip a bit lower as we move through December, January and February. Last year it took until March to rise above 300 homes for sale. So -- if buyers don't want to buy in the Winter, it seems that sellers also might not want to sell. 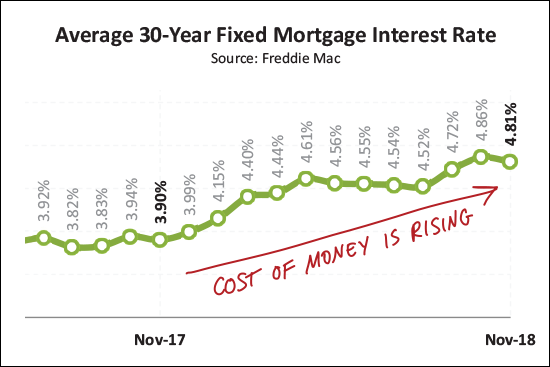 Unless you're paying cash -- it will cost you more (in your monthly housing payment) to buy a house now as compared to a year ago. The average mortgage interest rate on a 30 year mortgage has risen almost an entire percentage point (from 3.90% to 4.81%) over the past year. It ticked down slightly in November -- and hopefully we'll (somehow?!) stay below 5% as we roll into the new year. I'll pause there, for now. As usual, you can download the full report as a PDF, or tune in to my monthly video overview of our local housing market And a few tips for anyone thinking of buying or selling soon -- SELLERS -- even though it is a seller's market in many price ranges right now, you must still focus on price, condition and marketing. For further reading on buying or selling in this area, check out.... | |
Home Sales Rise Yet Again In October 2018 |
|
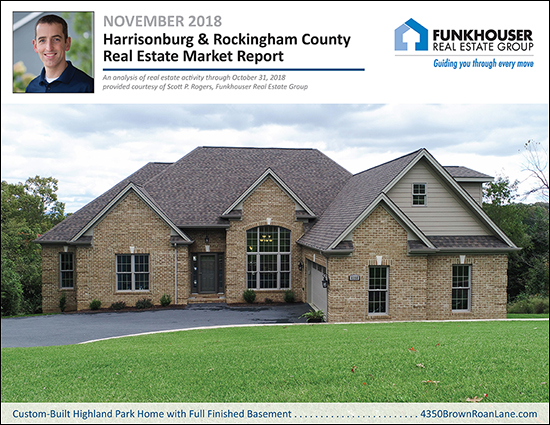 Before we dive into this month's market report, check out this featured home in Highland Park by visiting 4350BrownRoanLane.com. Now, on to our local real estate market -- I just published my most recent monthly market report, and as usual, you can read on for an overview, download the full report as a PDF or tune in to my monthly video overview of our local housing market... VIDEO OVERVIEW: Click here to watch (and listen) to my overview of the market. Now, let's take a look at some the trends we're currently seeing in our local housing market... 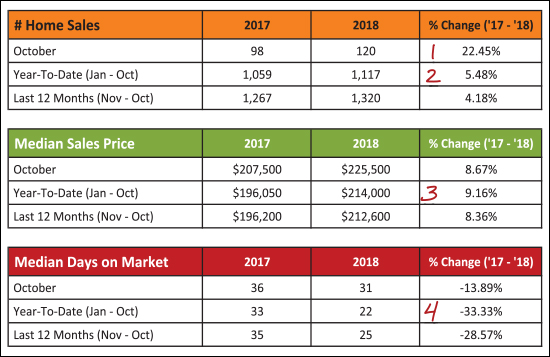 As shown above --
Now let's look at the monthly home sales visually... 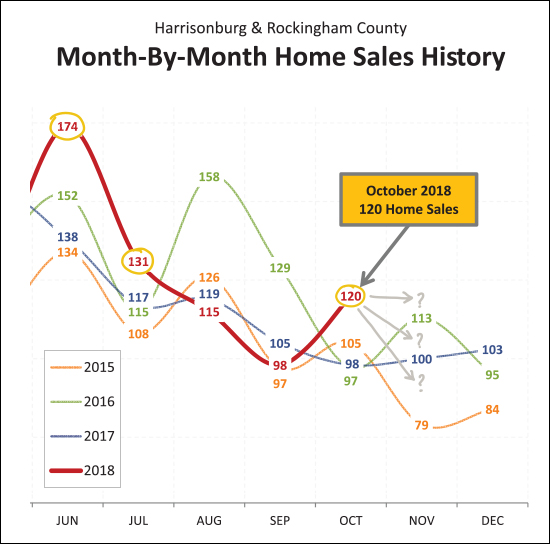 This past June and July were stellar months of home sales -- with the highest sales level seen in the past three years. Then, sales fell in August and September, and it was seeming that rising interest rates might have finally started to affect buyer behavior. But then, October. We saw a sharp increase in home sales in October -- the strongest month of October home sales in the past several years. So -- where do we go from here? Will we have the best November of late? Or will we slip back into the middle of the pack? Regardless of how November goes, it seems 2018 will be a strong year... 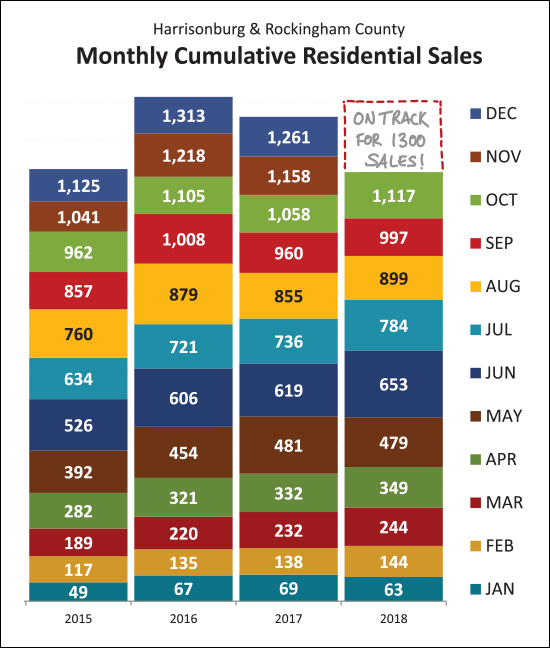 We've seen 1,117 home sales in the first ten months of 2018 -- this is the strongest first ten months of the year seen anytime in the past six years, not all of which are shown above. It seems, thus, that we're likely to get back up to a 1300/year pace of homes selling in Harrisonburg and Rockingham County. Can it happen? What is your prediction? 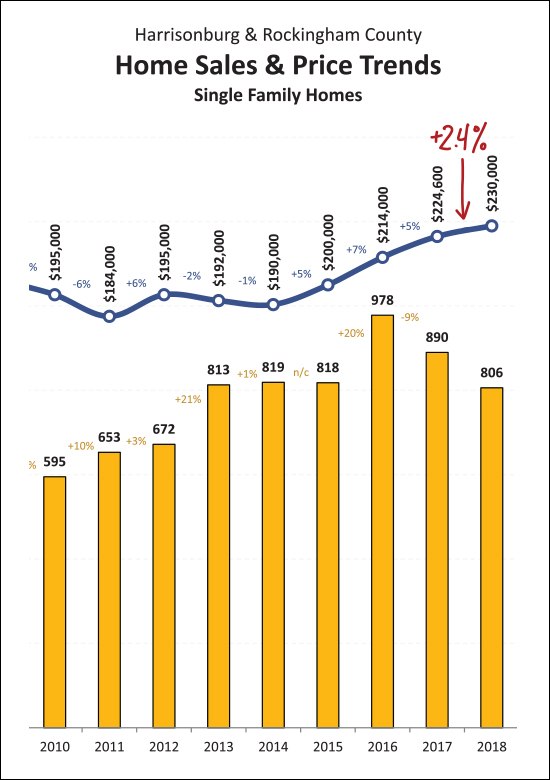 As mentioned earlier, even though the market-wide median sales price has increased 9% in 2018 -- that is not an indication that home values are up 9%. There are more single family homes selling this year than last, which is affecting the overall median sales price. The graph above, then, is a reasonable substitute for understanding value trends in our local market. When we look only at single family homes (not duplexes, townhouses or condos) we see that the median sales price has increased 2.4% over the past year. This seems much more sustainable than a 9% increase. 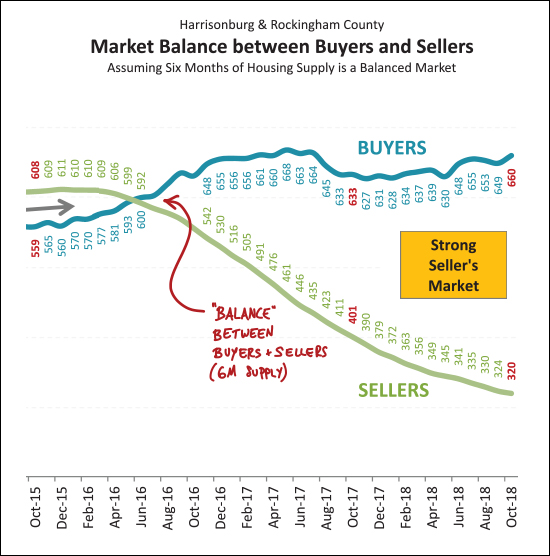 In some ways, it is surprising that home values aren't increasing more than they are. We have been in an increasingly strong seller's market for the past two years -- with more and more buyers fighting over fewer and fewer seller's homes on the market at any given point. Certainly, "enough" sellers are selling -- as the total number of closed sales is increasing -- but strong buyer activity is keeping overall listing inventory down at most times of the year. 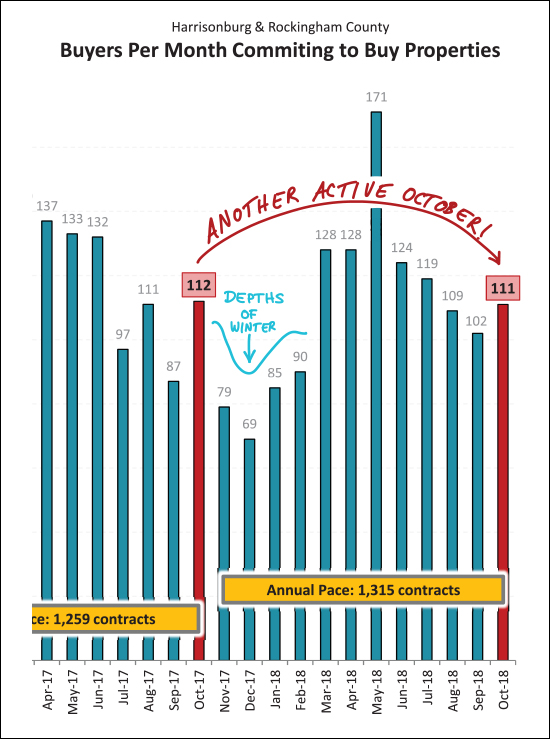 Why do I think we'll finish out the year with 1300 or so home sales? Partly because of the strong month of contract activity seen in October. A total of 111 contracts were signed in October, most of which should turn into closed sales by the end of the year. As a side note, winter is coming. Contract activity is likely to slow over the next four months. 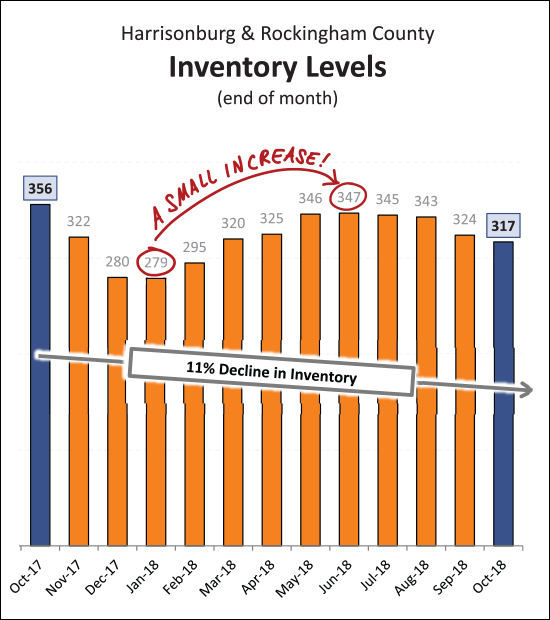 And there are those inventory levels -- low and getting lower. We've seen an 11% decline in the number of homes on the market over the past year -- and inventory levels didn't rise all that much during the Spring / Summer markets this year. So, basically, as fast as sellers are listing their homes, buyers are snapping them right up -- in most price ranges, in most locations, etc., etc. 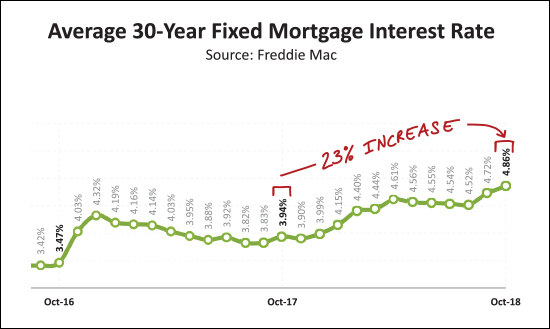 And finally -- mortgage interest rates. Most folks don't pay with cash -- they finance part of their home's purchase price -- and it is getting more expensive to do so these days. We have seen a 23% increase (from 3.94% to 4.86%) in the average 30 year fixed mortgage interest rate over the past year. This means that today's buyers are paying more per month than they would have last year, for the same home, even before we start calculating how that sales price would have increased over the past year. I'll pause there, for now. As usual, you can download the full report as a PDF, or tune in to my monthly video overview of our local housing market And a few tips for anyone thinking of buying or selling soon -- SELLERS -- even though it is a seller's market in many price ranges right now, you must still focus on price, condition and marketing. For further reading on buying or selling in this area, check out.... | |
Home Sales Slow Slightly in September But Prices Still On The Rise |
|
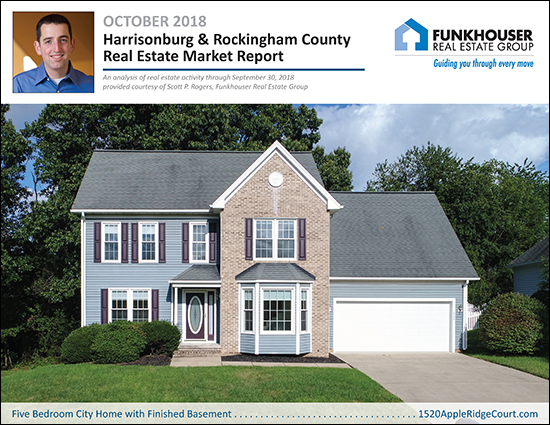 Before we dive into this month's market report, check out this featured home in Stone Spring Village by visiting 1520AppleRidgeCourt.com. Now, on to our local real estate market -- I just published my most recent monthly market report, and as usual, you can read on for an overview, download the full report as a PDF or tune in to my monthly video overview of our local housing market... VIDEO OVERVIEW: Click here to watch (and listen) to my overview of the market. Now, let's take a look at some the trends we're currently seeing in our local housing market... 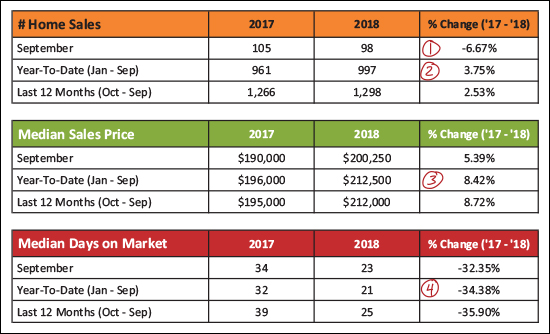 As shown above...
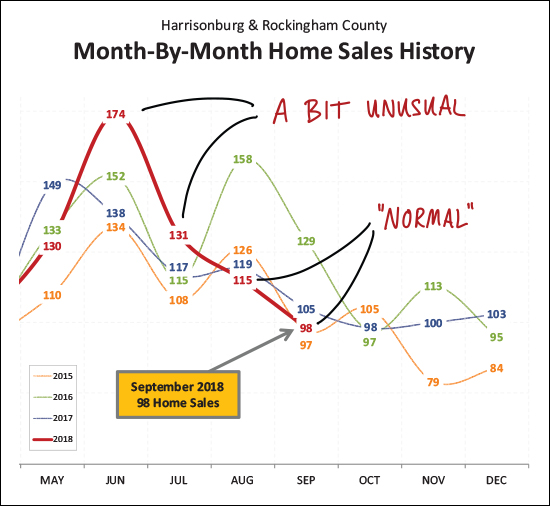 Looking backwards a bit -- the crazy months of sales we saw in June and July of this year were a bit unusual -- way out of the norm. The slower months of sales seen in August and September were much more "normal" -- even if a bit slower than usual. 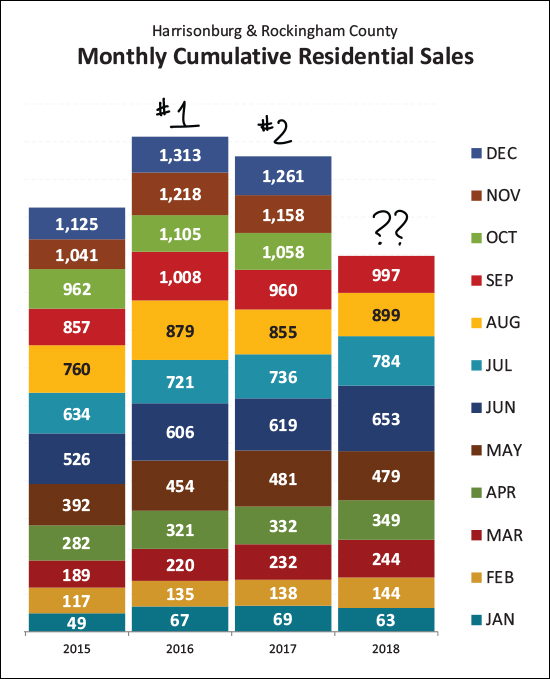 Two years ago was a rock star of a year of real estate sales. After only 1,125 home sales in 2015 -- the local market saw a huge increase to 1,313 home sales in 2016. And then -- 2017 -- darn, we slipped a bit. It's hard to say at this point where 2018 will fit into the mix. I am guessing we'll beat last year's 1,261 home sales -- but probably won't make it all the way up to 2016 levels. 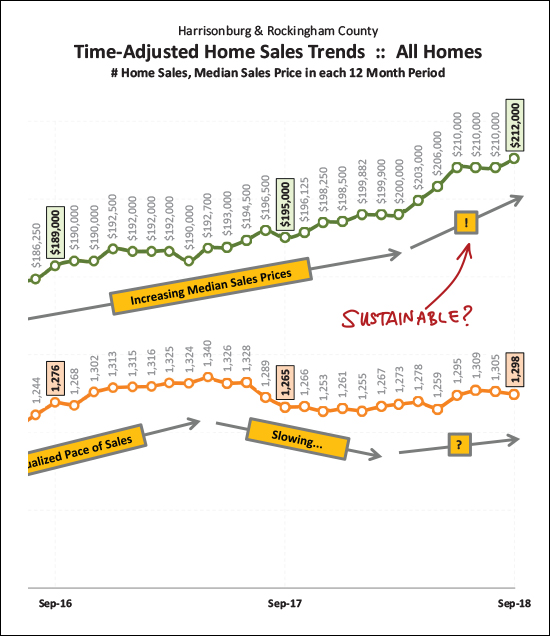 So -- as shown above with a green line -- sales prices have sort of been escalating a bit lately. Less than a year ago we had just cleared a $200K median sales price -- and now we're way up to $212K. Hmmm -- doesn't seem sustainable. What gives? Read on. 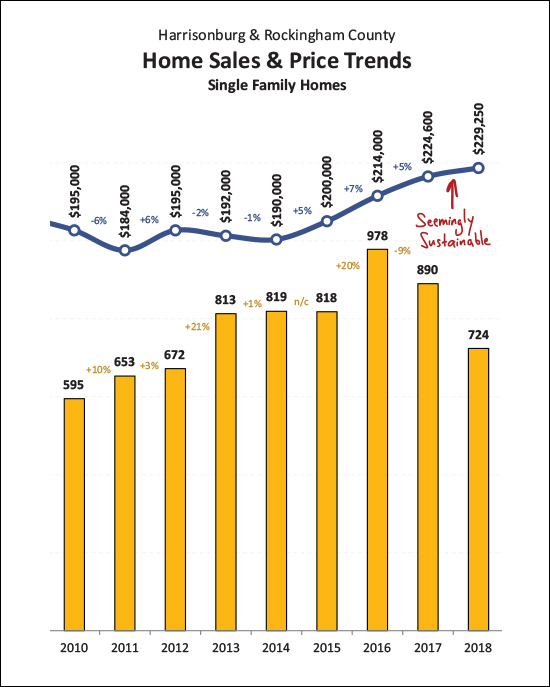 If we dial it back a bit and just look at single family homes (not duplexes, condos, townhouses -- all of which are prime real estate investor targets) we see a much (!!) more modest increase in the median sales price. An increase from $225K to $229K over a one year period seems to be a much more reasonable increase in the local median sales price -- and one that seems like it could be sustainable. This calms my nerves a bit after having seen that sharp rise in the overall median sales price. 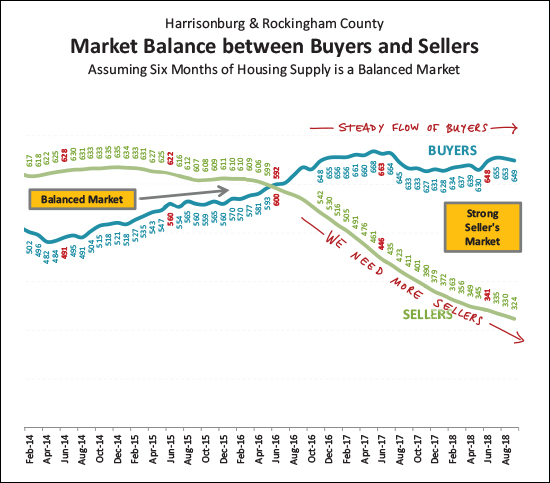 So -- how's the market, you might ask? Pretty balanced? Not at all! There are a steady flow of buyers in the local market -- and an ever smaller group of sellers. We desperately need some new sellers in the market -- preferably who aren't also buying -- which often will mean we need to see some new construction. 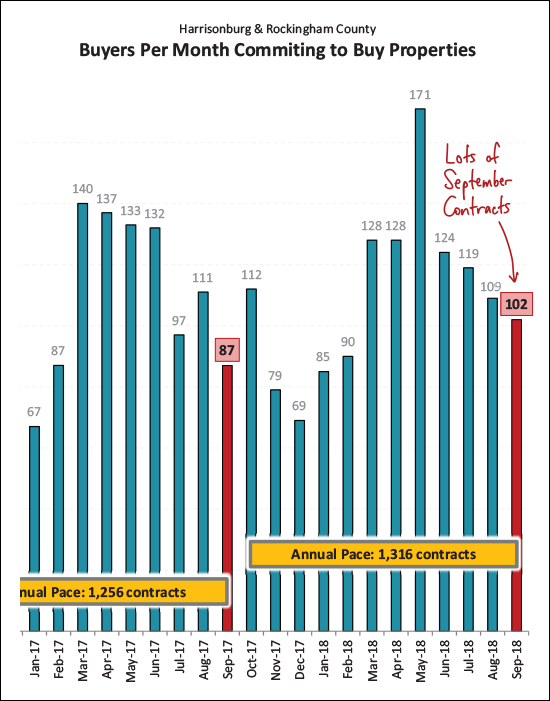 Looking ahead, we might see a bit of a pop in October home sales after all! September contracts were strong -- and markedly higher than last September. In fact, contracts over the past year (1316) were a good bit higher than the previous 12 months (1256). October sales figures might look better than expected! 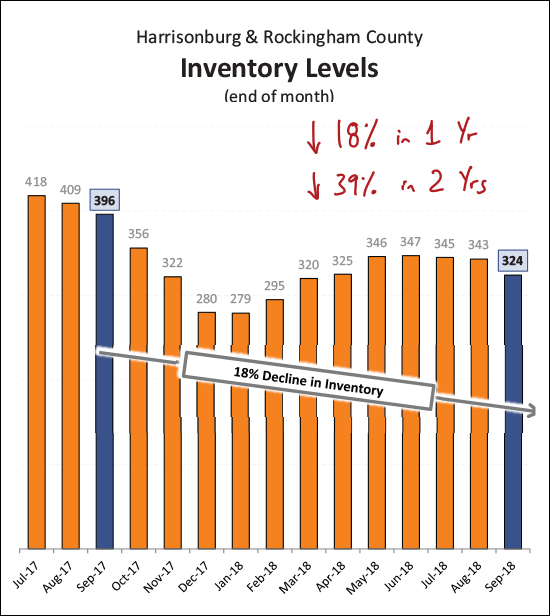 And here is that inventory issue - visualized slightly differently. Today's buyers have 18% fewer choices as compared to a year ago -- and 39% fewer choices as compared to two years ago! What is a buyer to do these days? I'll pause there, for now. As usual, you can download the full report as a PDF, or tune in to my monthly video overview of our local housing market And a few tips for anyone thinking of buying or selling soon -- SELLERS -- even though it is a seller's market in many price ranges right now, you must still focus on price, condition and marketing. For further reading on buying or selling in this area, check out.... | |
Local Housing Market Cools, Slightly, in August 2018 |
|
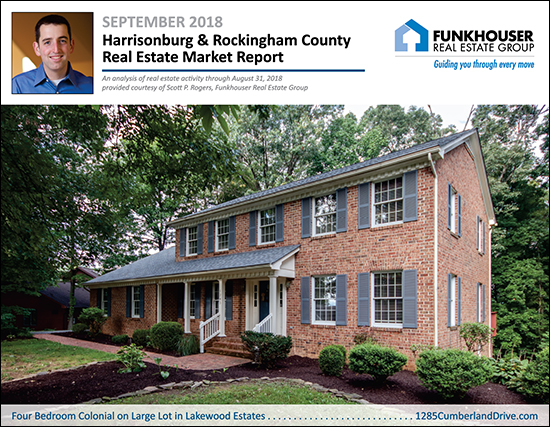 First, learn more about this new listing in Lakewood Estates by visiting 1285CumberlandDrive.com. Now, on to our local real estate market -- I just published my most recent monthly market report, and as usual, you can read on for an overview, download the full report as a PDF or tune in to my monthly video overview of our local housing market... Now, let's take a look at some the trends we're currently seeing in our local housing market... 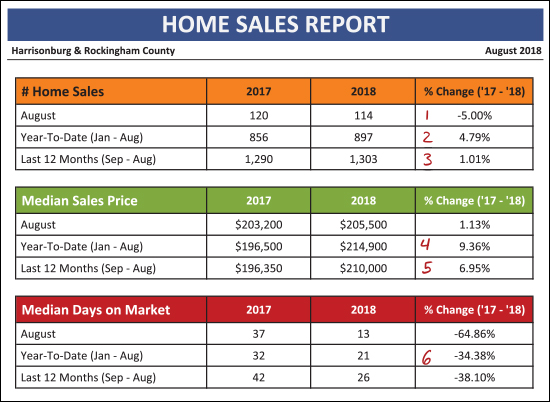 As shown above...
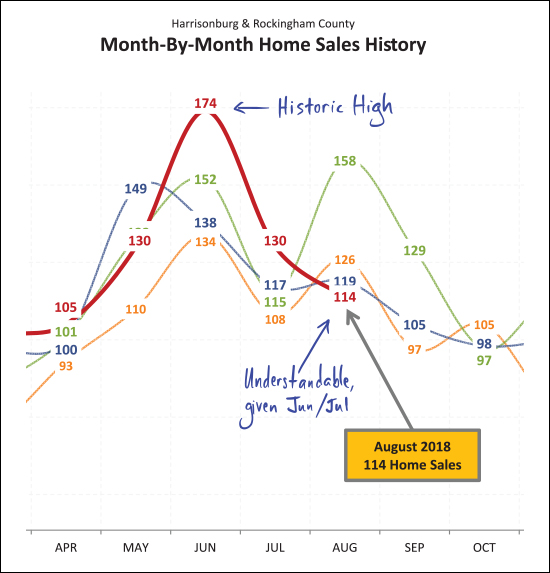 After an extraordinarily robust month of sales in June (174 -- third highest month ever) home sales slowed a bit in July, but remained (at 130) higher than in any recent July. It should be no surprise then that home sales cooled (even if temperatures did not) in August. Perhaps many summer buyers bought earlier in the summer this year than last. In the chart above, orange = 2015, green = 2016, blue = 2017 and red = 2018. So... Jun + Jul + Aug in 2016 = 425 summer buyers Jun + Jul + Aug in 2017 = 374 summer buyers Jun + Jul + Aug in 2018 = 418 summer buyers 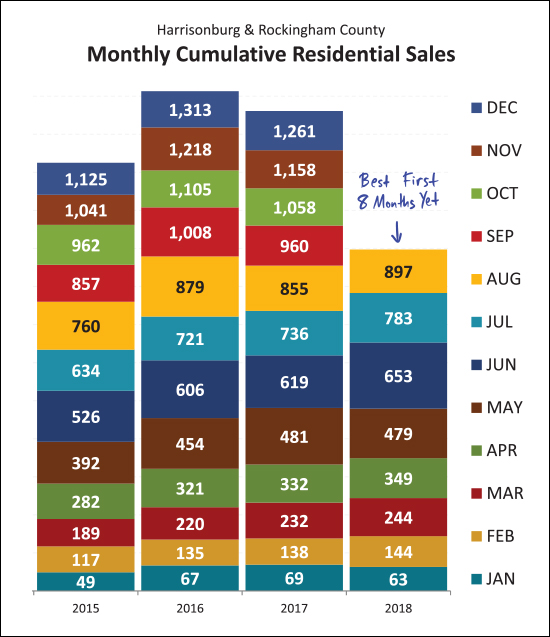 We have seen 897 home sales in the first eight months of the year -- this is more home sales than we've seen in any recent first eight months of the year. At this point, we seem poised to see another 1300+ year of home sales -- which we have only seen one other time in the past decade. 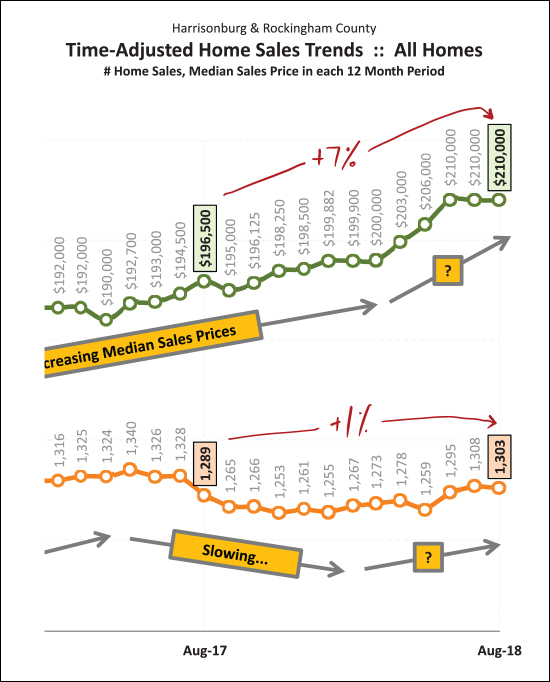 Looking at a rolling 12 month data window -- we see that there has been a net 1% increase in the pace of home sales per year (up to 1303/year) and a 7% increase in the median sales price (up to $210K) over the past year. The median sales price escalated quickly from $200K to $210K this Spring but now has stayed put at $210K for the past few months. 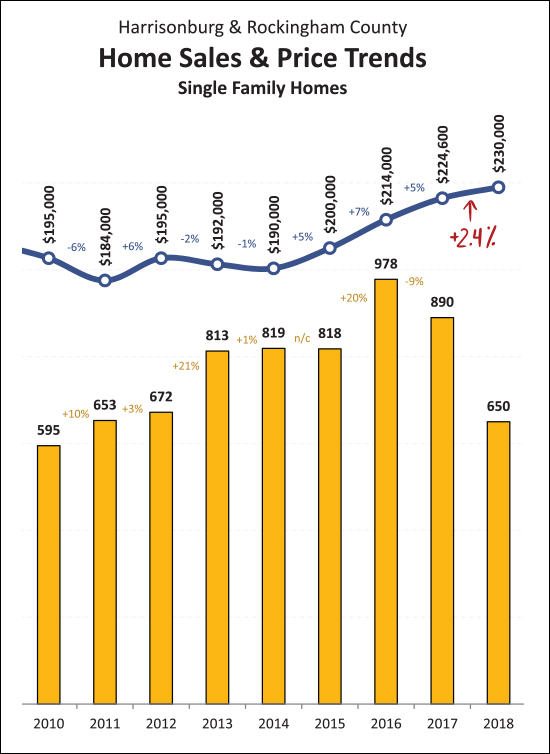 I have never been happier to see such a modest increase in prices as I am to see the 2.4% increase in the median sales price of single family home as shown above. The 7% increase in median sales prices shown on the prior graph reflects not just increases in home values but perhaps a shift in which homes are selling. By looking at only single family homes (excluding duplexes, townhouses and condos) we can (sometimes) get a better sense of actual changes in home values. Here we see that single family home sales prices have increased only 2.4% over the past year. 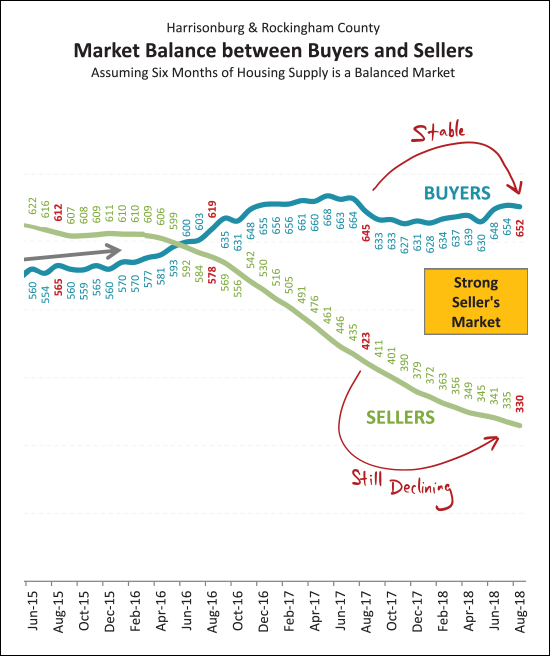 The balance (or imbalance) between buyers and sellers doesn't show any signs of shifting any time soon. After multiple years of increasing buyer activity we are now seeing a relatively stable number of buyers in the market -- around 650 every six months. But at the same time, inventory levels continue to decline -- making it an even stronger seller's market -- with the usual disclaimers of "in most areas, in most price ranges, for most property types, etc." 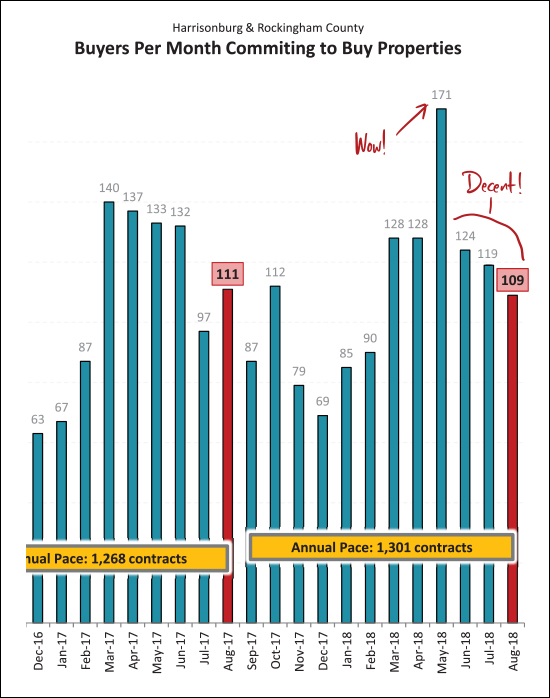 The huge month of sales in June 2018 was foretold by the enormous month of contracts in May 2018. Since that time, we've seen relatively normal months of contract activity. The 109 contracts signed in August 2018 is pretty much in line with the 111 contracts we saw last year. Looking forward, we're likely to see a dip in contract activity in September, possibly a spike in October, before much lower contract numbers between November and February. 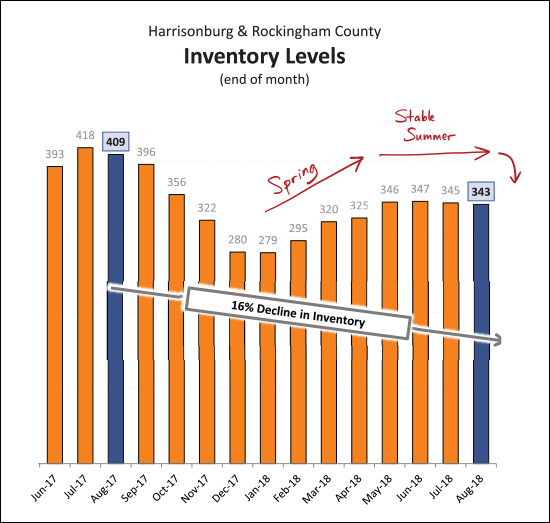 If you thought inventory levels have been low recently, you haven't seen anything yet. After a 16% year over year decline, we're about to head into the Fall and Winter where we inevitably see fewer homes on the market. It seems likely we'll dip below the 300 homes for sale mark again as we did last December and January. An increase in new construction is likely the only thing that can break this drought of listing inventory. 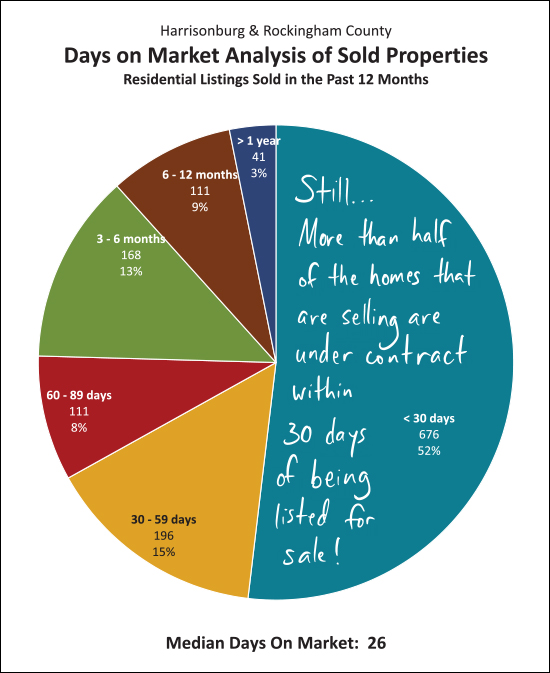 This is absolutely no consolation at all to any home seller who has had their home on the market for 2, 3, 4, 6 or 10 months -- but for sellers about to put their homes on the market, you have a decent chance of selling your home quickly -- again, depending on price point, location, features, finishes, condition, marketing, etc. But, as shown above, slightly more than half of the homes that sold in the past year were under contract within 30 days of being listed for sale. 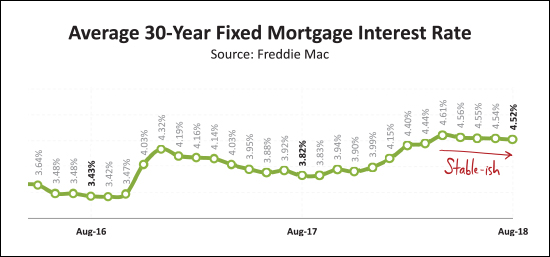 Yes -- interest rates have risen over the past year -- by about 0.75%, which we shouldn't minimize. That said, at 4.5% -- which seems to be where we are hovering for the moment -- this doesn't seem to be drastically changing buyer behavior or housing affordability. OK -- I'll stop there for now. Again, you can download the full report as a PDF, or tune in to my monthly video overview of our local housing market And a few tips for anyone thinking of buying or selling soon -- SELLERS -- even though it is a seller's market in many price ranges right now, you must still focus on price, condition and marketing. For further reading on buying or selling in this area, check out.... | |
Local Home Sales and Prices Surge in July |
|
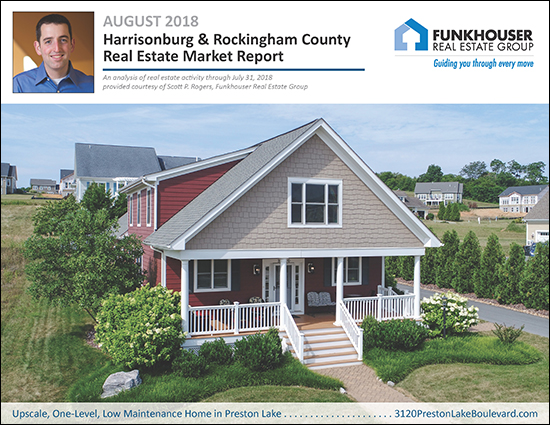 First, learn more about this fantastic home (my dad's house), via a 3D Walk Through and more by visiting 3120PrestonLakeBoulevard.com. Now, back to our local real estate market -- I just published my most recent monthly market report, and as usual, you can read on for an overview, download the full report as a PDF, read the entire report with commentary online, or tune in to my monthly video overview of our local housing market... Now, let's take a look at some the trends we're currently seeing in our local housing market... 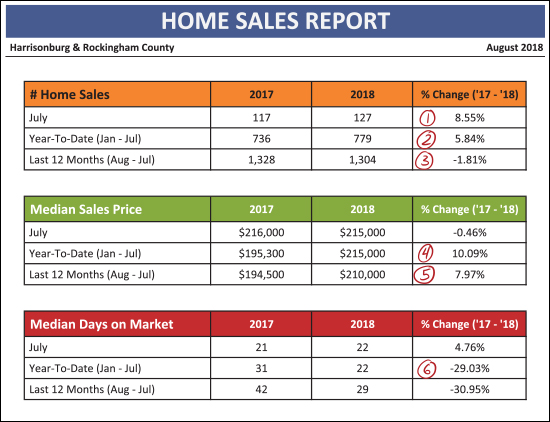 As shown above, it has been an exciting month -- and year -- in our real estate market...
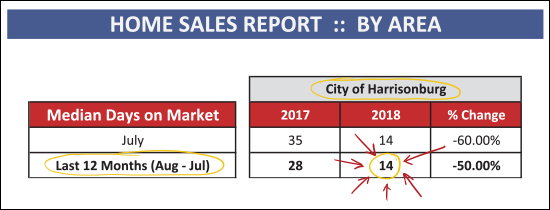 OK -- this one is a random snippet. Above you will find a STARTLING statistic about the housing market in the City of Harrisonburg -- not including Rockingham County. When we look at all homes that sold in the past 12 months, in the City, half of them were under contract within 14 days of being listed for sale! Wow! 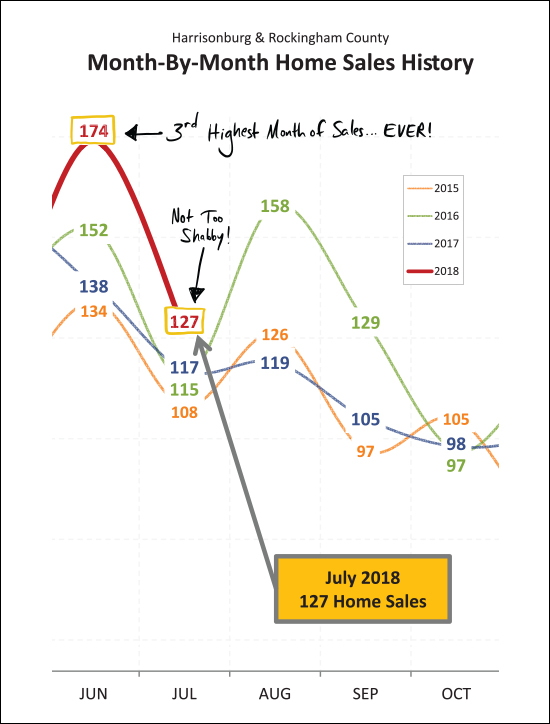 Back to the big picture -- June 2018 home sales (all 174 of them) was the third highest month of home sales we have ever seen in our local market -- topped only by two summer months back in 2005 and 2006. I thought we'd see home sales drop off in July, as a result, but we had the best month of July sales in recent years -- with 127 home sales! Next month I'm not expecting we'll pop back up to August 2016 levels -- we're more likely to be in the 120 - 130 range for sales in August. 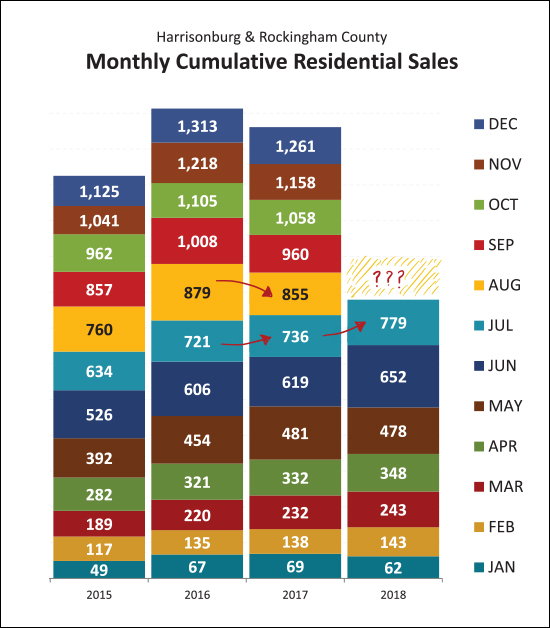 August, oh August, that magical month. Last year at this time (end of July) we had seem more home sales (in 2017) than during that same timeframe the prior year (2016). And then, August. After August passed, 2017 never caught back up -- and ended up being a slower year than 2016 when all sales were accounted for. So -- what will happen this August? Will we keep on pace with 2017? Or even with 2016? Will we fall behind again? Stay tuned. 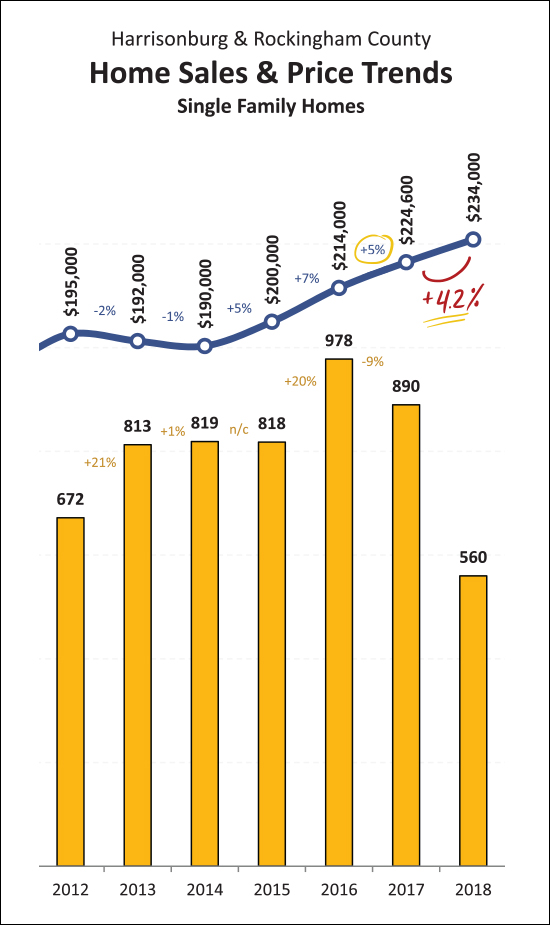 When I see the YTD market-wide median increasing by 10%, I get a bit worried -- wondering if these are sustainable increases. Then, however, when I look at single family home sales alone, I am (at least a bit) reassured. You'll note that thus far the median sales price has increased only 4.2% between 2017 and 2018. This is much more in line with (or close to) long-term historical averages, and makes me think that the strong seller's market might not be leading to unsustainable price increases. Why, might you ask, is the single family detached market a better indicator of changes in market value? Mainly because it is not as easily affected by the number of investors engaging in our market. When the market gets hot we often see lots of investors buying properties -- often townhouses or other attached dwellings -- which can affect price trends. Most single family home purchases are made by folks who actually intend to live in the properties. 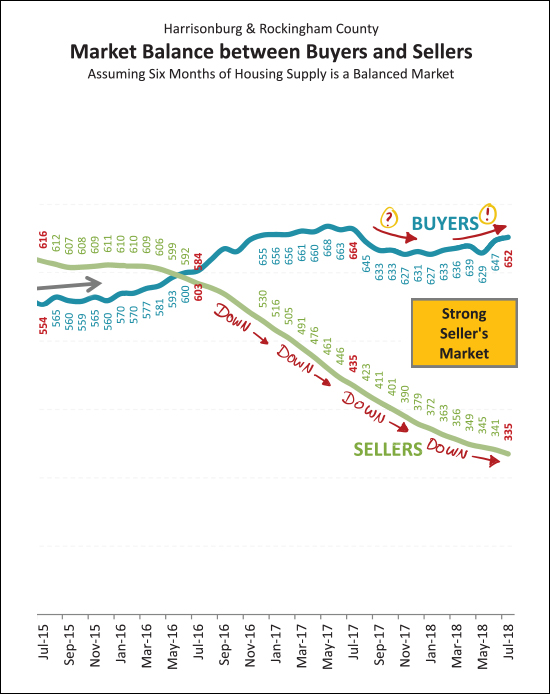 Which would you rather do, buy or sell in the current market? The answer should be "sell" -- given the strong seller's market we're currently experiencing. A few things to note above -- first, there are still plenty more buyers in the market than there are sellers. Second, the number of sellers in the market continues to decline (and decline, and decline). Third, after a brief slow down in buyer activity, the pace seems to be increasing again. 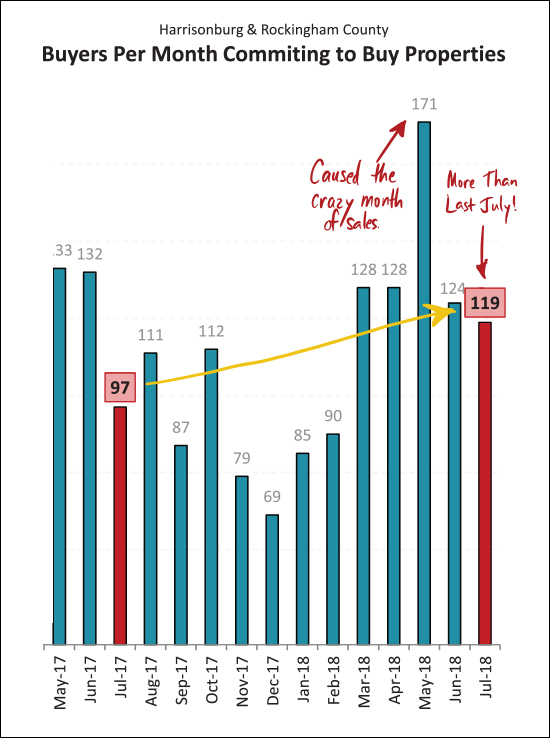 What comes next for our local market? Looking at contract activity (above) we can see the pop in May 2018 that lead to a wild month of June sales. Looking, then, at July -- we actually see a sizable increase from last July -- so maybe we'll have a stronger than expected month of sales in August after all!? 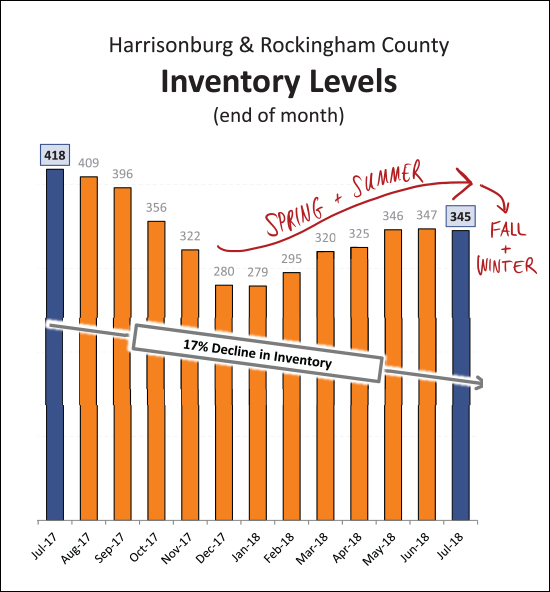 If you're buying soon, you might have already passed the time in our local market cycle when you would have the most options from which to choose. That's not to say that plenty of new listings won't be coming on the market in the next 30 / 60 / 90 days -- they will -- but inventory levels have likely peaked and will start to decline as we (eventually) head into Fall and Winter. 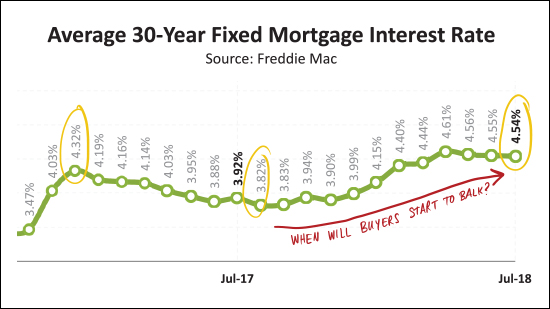 Lastly, how about those interest rates? We were actually close to 4.5% about 20 months ago -- but then dropped below 4% again. Now, over the past year, we have seen steady increases to where we are currently hovering around 4.5%. I have not seen this playing a major role in whether buyers are willing and able to buy -- but I do wonder if buyer activity (or interest or capability) would start to be affected if the interest rates rose to 5% or 5.5%. OK -- I'll stop there for now. Again, you can download the full report as a PDF, read the entire report with commentary online, or tune in to my monthly video overview of our local housing market One last note for anyone thinking of buying or selling soon -- SELLERS -- even though it is a seller's market in many price ranges right now, you must still focus on price, condition and marketing. For further reading on buying or selling in this area, check out.... | |
Local Home Sales, and Prices, Soar in June 2018 |
|
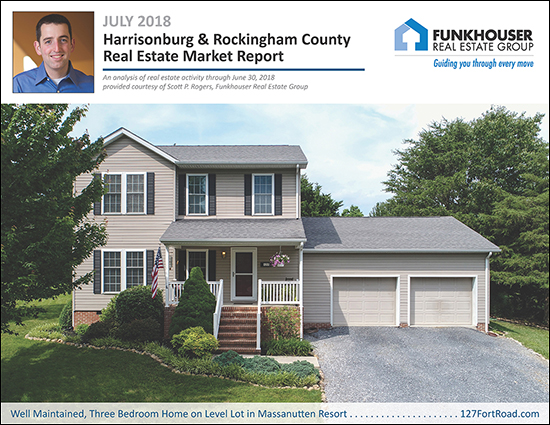 Learn more about this fantastic home in Massanutten Resort: 127FortRoad.com. I just published my most recent monthly market report, and as usual, you can read on for an overview, download the full report as a PDF, read the entire report with commentary online, or tune in to my monthly video overview of our local housing market... OK -- now, let's take a look at some of the overall market indicators this month... 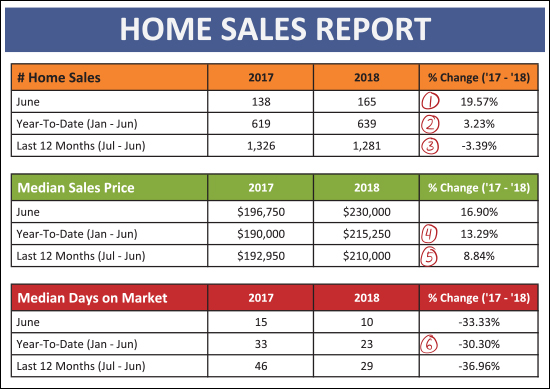 As shown above...
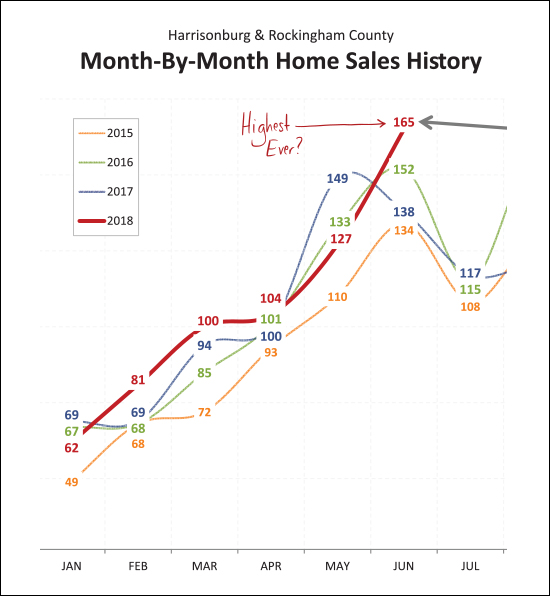 Wow! Just wow! The 165 sales seen in June 2018 is the highest seen any time in the past several years -- in fact -- it is the most sales in a single month any time in the past 10 years! I actually have data back to 2003, and the only times that we have seen more than 165 home sales in a single month have been: June 2004 (174), June 2005 (173), July 2005 (166), August 2005 (183) and June 2006 (192). 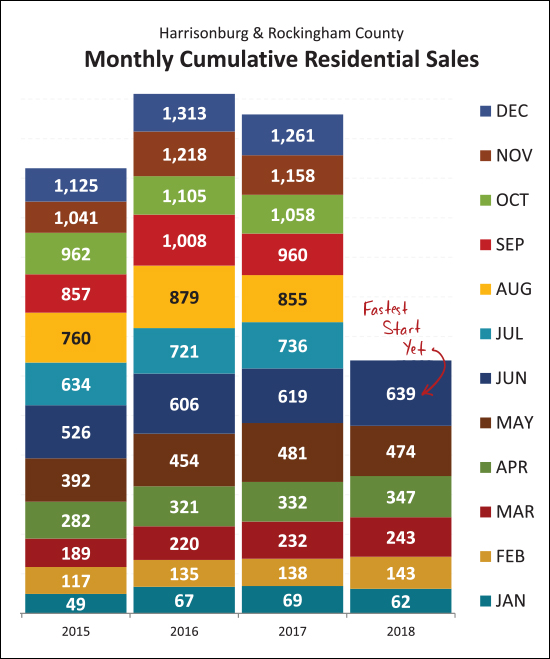 Needless to say, this is the fastest start to the year we have seen anytime in recent history. As shown above, the 639 home sales in the first half of 2018 exceeds the number seen in the first half of the past three years. Looking back further, the only times we saw more home sales in the first half of the year were in 2004 (706), 2005 (764) and 2006 (759). 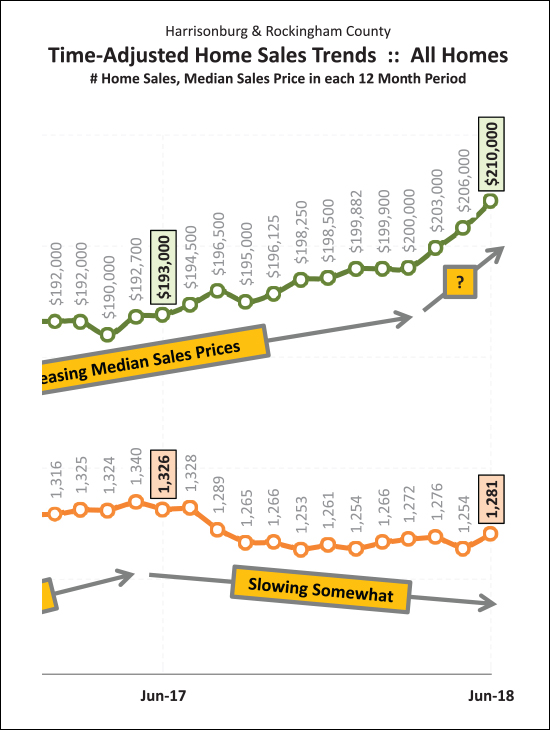 As shown above, despite slowing sales over the past year-ish, median sales prices have been slowly rising -- and over the past three months have started escalating quickly -- from $200K to $210K between March 2018 and June 2018. So -- record numbers of sales, quickly rising prices -- hmmm -- something about this seems familiar. Should we be worried? Maybe, or maybe not... 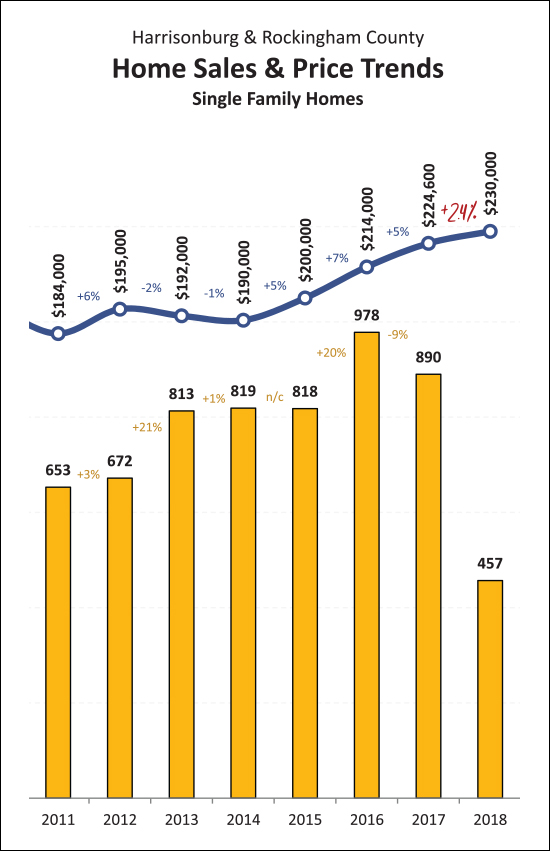 The figures shown in all prior charts and graphs has been for all residential sales -- including detached homes, duplexes, townhouses and condominiums. The graph immediately above focuses only on Single Family (detached) Homes and this can often give us the truest indicator of market trends. Perhaps it is (or could be) some comfort, then, that the median sales price of these detached homes has only risen 2.4% over the past year. This may mean that the rapid increases in prices we are seeing has more to do with what is selling (property type, price range) and/or is being skewed by non-owner occupied home sales/purchases. 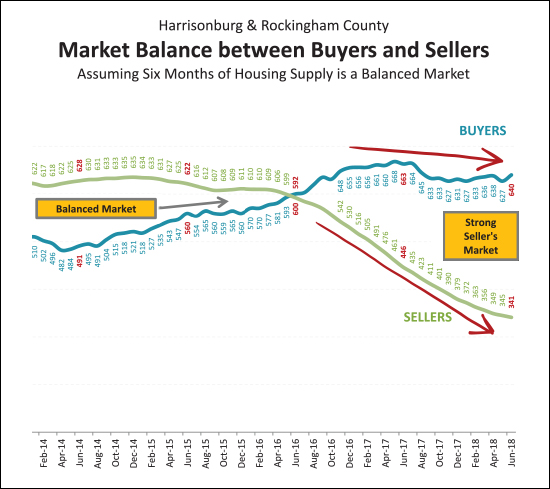 It is also important to note that while the number of home sales has been dropping slowly (3% decline comparing past 12 months to prior 12 months) part of that may be due to a change in market balance. It is a strong seller's market now, as there are a roughly equivalent number of buyers in the market as compared to a year ago -- with a drastically lower number of sellers in the market. 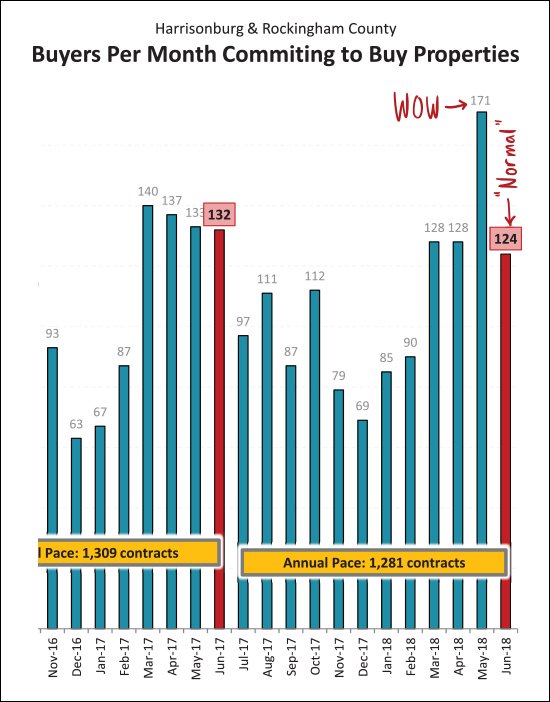 And here, folks, is the reason why we saw so many home sales this month -- it was a result of the crazy number of contracts signed last month. Last month's 171 contracts was the highest number I have seen anytime since I have been tracking these figures. Thus, slightly slower contracts in June is to be expected -- and we are likely to still see a strong month of sales in July based on some May contracts rolling over into July closings. 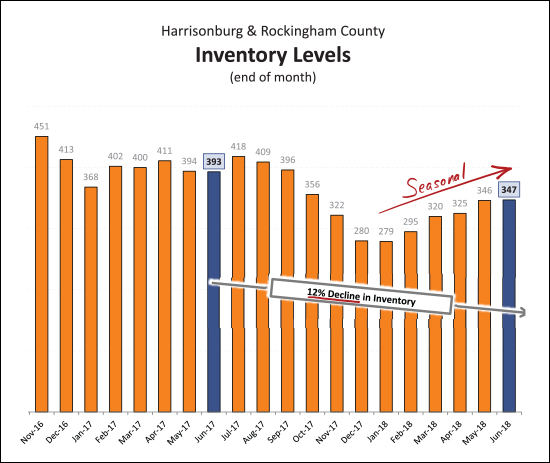 And here it is again -- declining inventory levels. While inventory levels have seen a seasonal increase over the past six months, there has been a net year-over-year decline of 12% in the number of homes on the market. Fewer homes for sale, with a roughly equivalent number of home buyers, has lead to a strong seller's market -- and a frustrating time for many buyers! 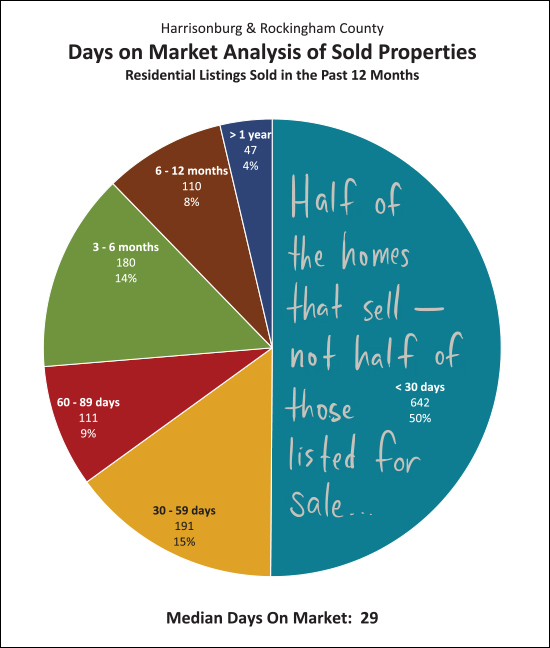 Perhaps because there are so many buyers fighting over each listing, homes are selling more quickly. Half of the homes that have sold in the past year have been under contract within 30 days of having been listed for sale. Again, this is not half of all properties that are listed going under contract in 30 days -- just half of those that actually do sell. 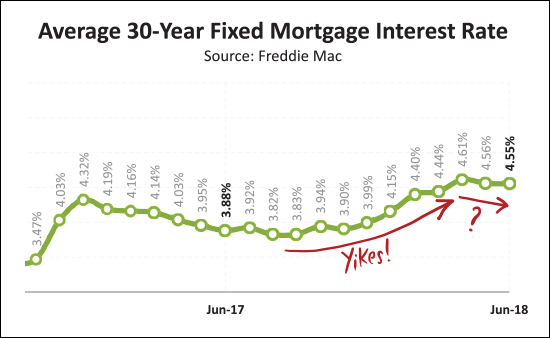 As shown above, mortgage interest rates have been increasing over the past year -- almost an entire percentage point. This has not seemed to have made a drastic difference in the pace of buyer activity (yet) and it has been nice to see these edge downward somewhat over the past few months. OK -- I'll stop there for now. Again, you can download the full report as a PDF, read the entire report with commentary online, or tune in to my monthly video overview of our local housing market One last note for anyone thinking of buying or selling soon -- SELLERS -- even though it is a seller's market in many price ranges right now, you must still focus on price, condition and marketing. For further reading on buying or selling in this area, check out.... | |
Home Sales Slow, Prices Pop, Contracts Climb |
|
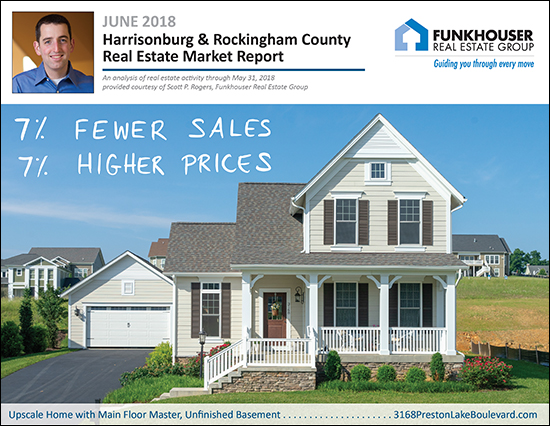 Find out about this beautiful home at Preston Lake: 3168PrestonLakeBoulevard.com. I just published my most recent monthly market report, and as usual, you can read on for an overview, download the full report as a PDF, read the entire report with commentary online, or tune in to my monthly video overview of our local housing market... OK -- now, let's take a look at some of the basic market indicators this month... 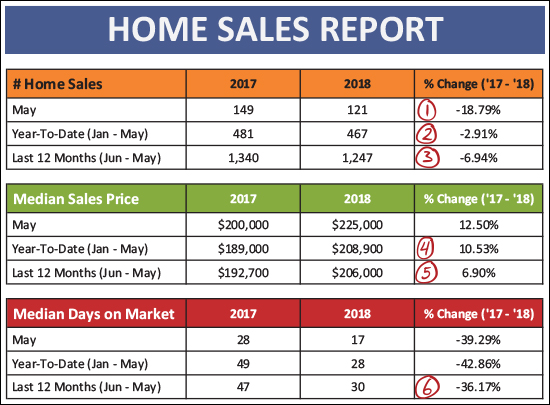 Plenty of statistics of interest above, including...
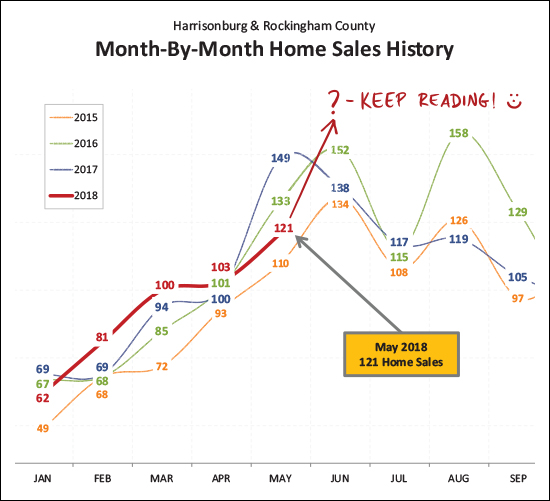 So, as seen above, May sales were slower than (I) expected. After the best February, March and April in recent memory -- home sales in May 2018 fell below both May 2017 and May 2016. What gives? Well, perhaps, it is just some month-to-month variation between years. Keep reading to find out why all is not lost when it comes to late-Spring and early-Summer home sales. :-) 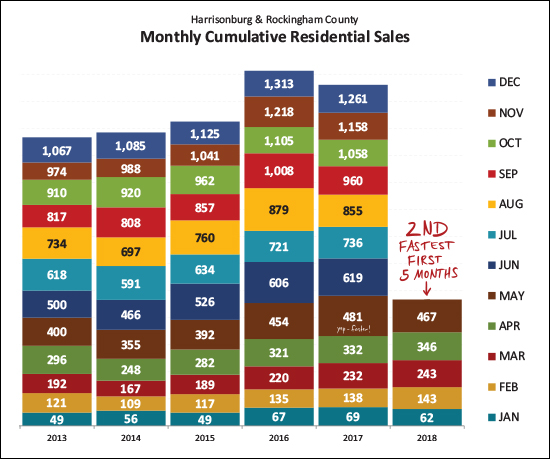 Looking at a slightly longer timeframe, the pace of home sales in the first five months of this year is only lagging slightly behind where we were last year -- and thus putting us in second place for the pace of home sales in Harrisonburg and Rockingham County. 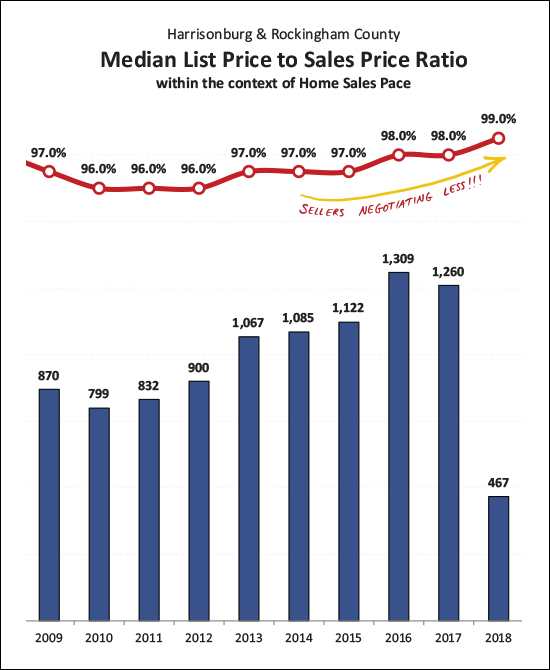 Have you heard it's a seller's market? There are fewer and fewer sellers (keep reading for details) and this has buyers fighting over properties in some price ranges (and locations) -- which has resulted in sellers needing to negotiate a bit less on their price than in years past. The median ratio between the sales price and list price is now 99%, as compared to 97% - 98% over the past five years. 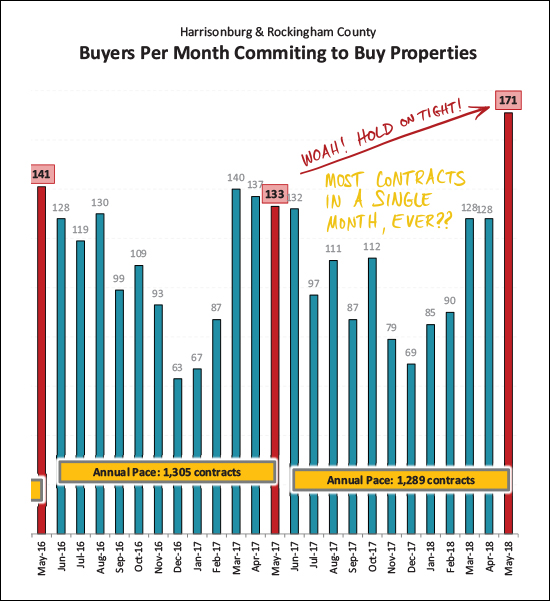 Yep -- this is the crazy one! Last May we saw 133 homes go under contract -- this May there were 171!?! I'll have to check my historical archives to be sure, but I think this may be the MOST contracts we have EVER seen in a single month EVER. Wow. So -- even if we were despairing that home sales were slowing in May -- perhaps we can excitedly look forward to June (and July) when these May contracts start turning into closed sales. Again -- wow! 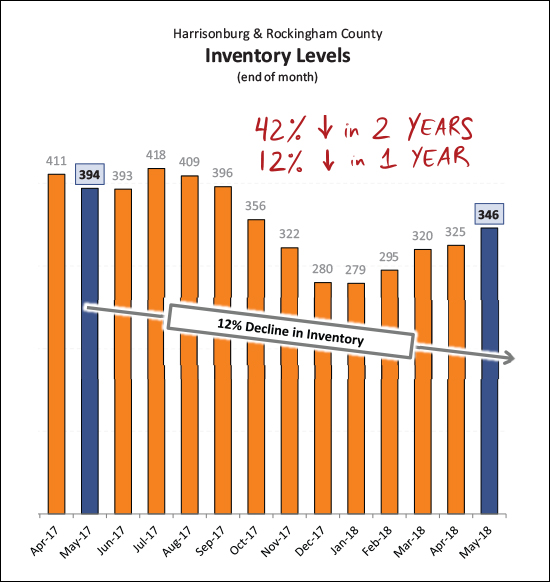 And yes, as mentioned above, inventory levels are falling -- fewer and fewer homes are on the market available to a buyer on any given day. We have seen a 42% decline in inventory levels over the past two years -- and a 12% decline in the past 12 months. The decline is slowing -- which might mean this inventory level can only go so low -- but this is what is causing so much frustration for buyers -- and oftentimes, so much delight for sellers! :-) 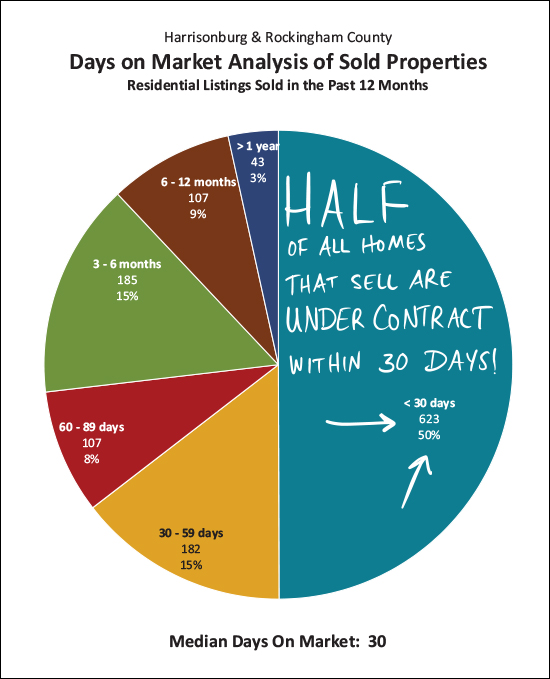 Faster and faster and faster, oh my! Indeed, homes are selling even more quickly now than they were a year ago. Half of the homes that sold in the past year were under contract within 30 days of hitting the market. If you are a buyer -- be ready to act FAST! 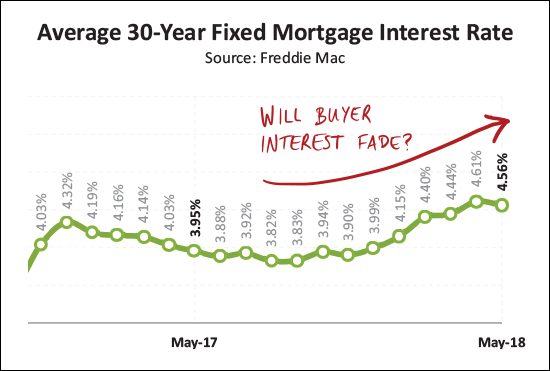 And finally, interest rates are on the rise. :-/ It costs more to finance a home purchase now than it did a year ago. I commented to a client today that today's interest rates are still ridiculously low compared to any longer-term historical perspective, but he was quick (and wise) to point out that this fact doesn't necessarily matter much for today's buyers. Why are they going to appreciate that today's interest rates are lower than they have been for most of the past 20 years -- all they care about is that they are going to be paying more to finance their home purchase now than if they had bought six months of a year ago. OK -- I'll stop there for now. Again, you can download the full report as a PDF, read the entire report with commentary online, or keep reading my blog in the coming days for further commentary. One last note for anyone thinking of buying or selling soon -- SELLERS -- even though it is a seller's market in many price ranges right now, you must still focus on price, condition and marketing. For further reading on buying or selling in this area, check out.... | |
Home Prices Edge Upward As Demand Exceeds Supply |
|
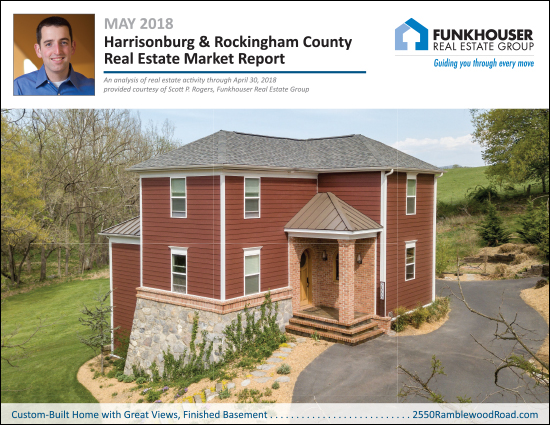 Find out about this newly listed custom home: 2550RamblewoodRoad.com. I just published my most recent monthly market report, and as usual, you can read on for an overview, download the full report as a PDF, read the entire report with commentary online, or tune in to my monthly video overview of our local housing market... Now, let's dive into some of the latest data from our local real estate market.... 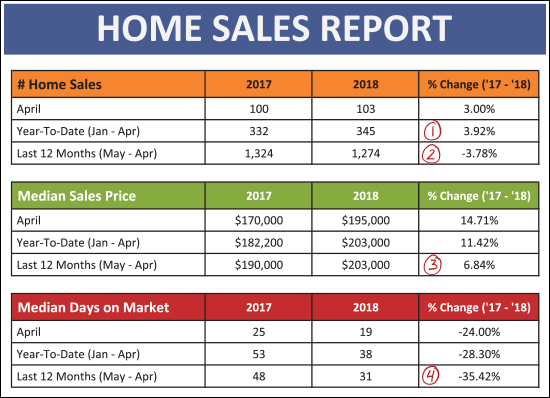 As shown above, it's been an interesting start to the year...
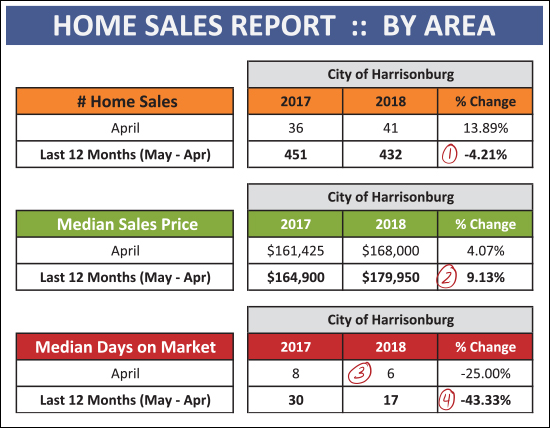 Shining a spotlight, briefly, on the City of Harrisonburg alone (not the County) we find...
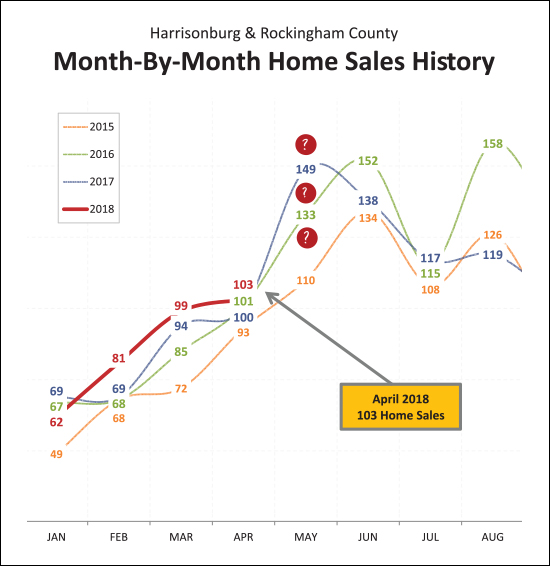 January 2018 was a tad slow -- but then February, March and April easily outpaced the same months last year. Wow! So -- where will we go in May? Could we really see a 50% increase (from April to May) as we saw last April (100) to May (149) or will the increase be a bit more tame? 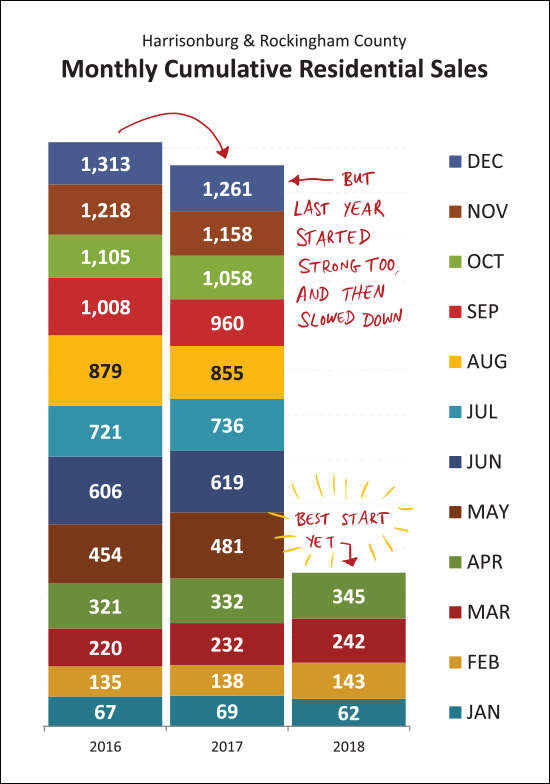 Lest we get toooo overjoyed about the fantastical pace of home sales in the first four months of this year -- I will point out that the last four months of last year also looked QUITE promising, before sales slowed down during the rest of the year to actually show a net decline in the number of home sales in 2017 as compared to 2016. So -- get excited -- slowly? Cautiously? 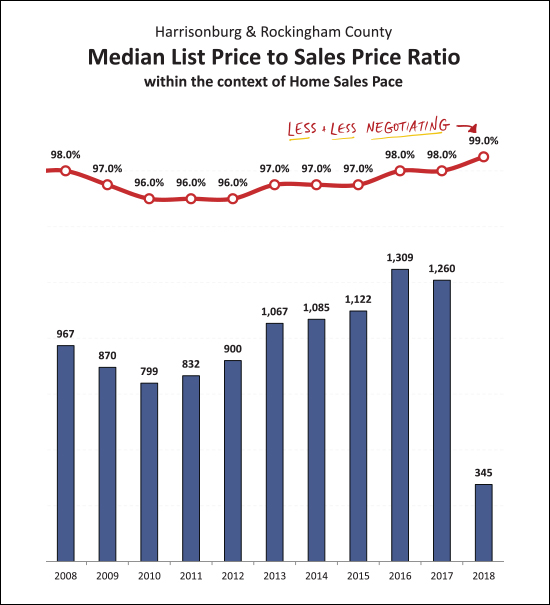 Sellers seem to be able to hold firm on their price a bit more this year than -- oh, I don't know -- any of the past 10 years!? Yes, that is true. Sellers negotiated anywhere between 2% and 4% off of their last list price over the past 10 years -- but so far in 2018, they have only negotiated 1% off of their last list price! 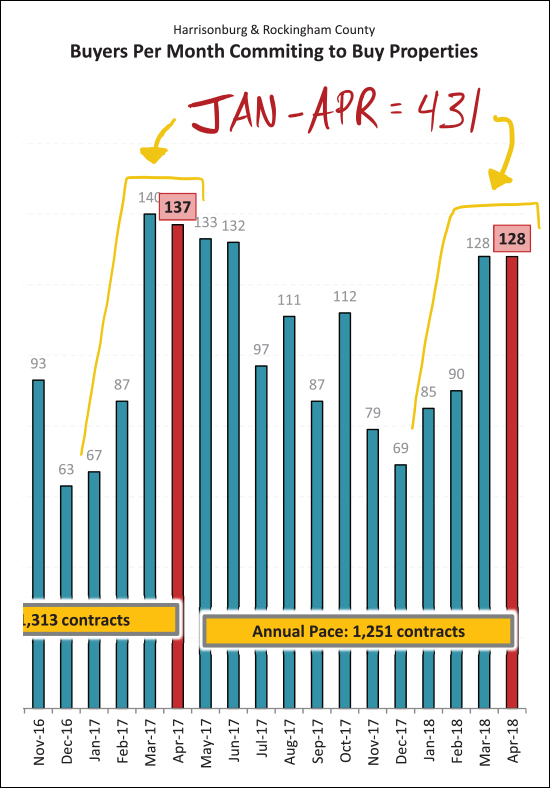 What comes next, you might ask? Well -- we generally look at the pace of contracts to have an idea of what home sales might look like in the coming month or two. So -- what do we see now? Well, curiously, this January through April 431 properties went under contract -- and -- last January through April 431 properties went under contract. So -- yes -- it seems possible that the HOT months of home sales in May and June might be seen again this year. 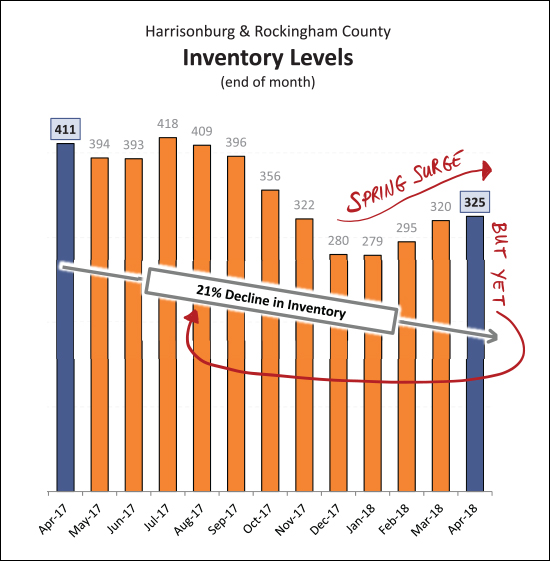 One of the reasons why there has been an overall decline in home sales (when looking at the past 12 moths compared to the previous 12 months) is because of declining inventory levels. There are currently 21% fewer homes on the market as compared to one year ago -- EVEN THOUGH we have seen a mini Spring surge in listings over the past few months. 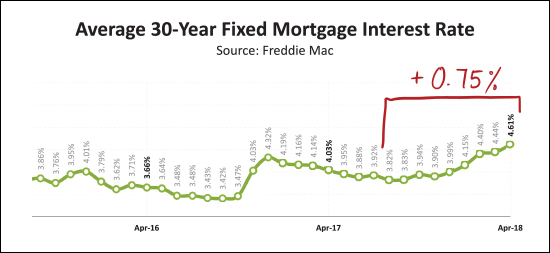 And finally -- those interest rates. They seem to be on the rise, woah, quite a bit! We have seen interest rates rise three quarters of one percent over the past nine-ish months. What's next? Will we push past 4.61% and start approaching 5%? Some say so. I don't think we will, but I have been wrong plenty of times over the past 5+ years about trends in mortgage interest rates. OK -- I'll stop there for now. Again, you can download the full report as a PDF, read the entire report with commentary online, or keep reading my blog in the coming days for further commentary. AND -- if you're thinking of buying or selling soon --- SELLERS -- even though it is a seller's market in many price ranges right now, you must still focus on price, condition and marketing. For further reading on buying or selling in this area, check out.... | |
Home Sales and Prices Rising, Time on Market Falling |
|
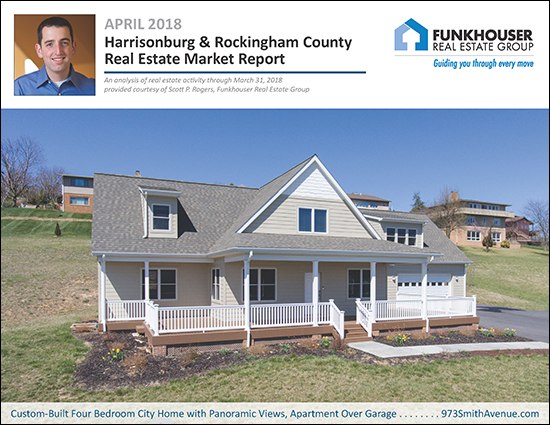 Find out about this newly listed custom-built home with amazing views: 973SmithAvenue.com. I just published my most recent monthly market report, and as usual, you can read on for an overview, download the full report as a PDF, read the entire report with commentary online, or tune in to my monthly video overview of our local housing market...  Now, let's dive into some of the latest data from our local real estate market.... 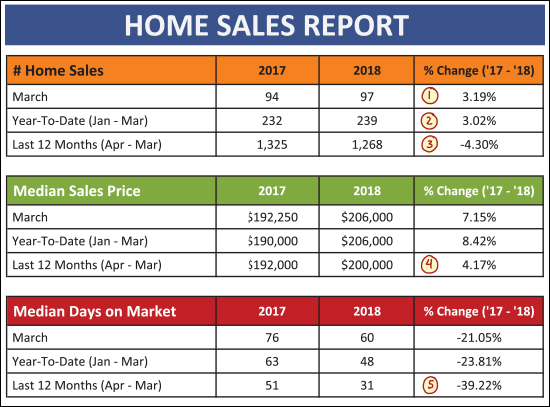 As shown above, most market indicators are quite positive....
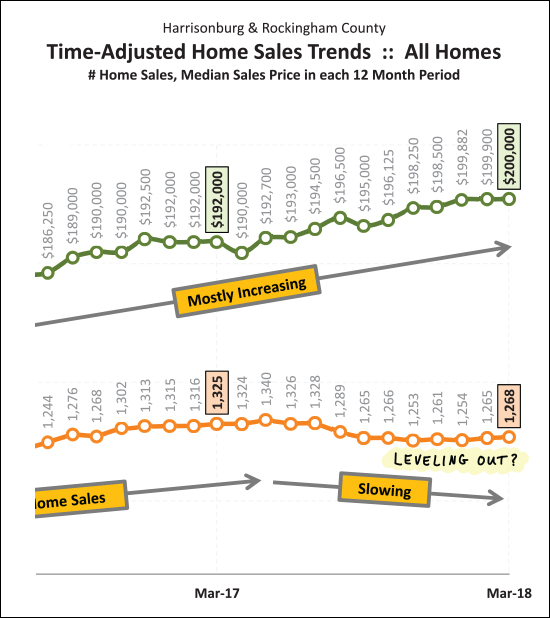 Two important items to note above....
One last tidbit....
As shown above -- contract activity declined slightly in March 2018 -- but -- wait for it -- year-to-date (Jan-Mar) contract activity is still 3% higher than last year. So -- perhaps we will still have a reasonably strong month of closed sales in April and May after all. OK -- I'll stop there for now. Again, you can download the full report as a PDF, read the entire report with commentary online, or keep reading my blog in the coming days for further commentary. AND -- if you're thinking of buying or selling soon --- SELLERS -- even though it is a seller's market in many price ranges right now, you must still focus on price, condition and marketing. For further reading on buying or selling in this area, check out.... Enjoy this cold-again, hot-again month of April! | |
| Newer Posts | Older Posts |
Scott Rogers
Funkhouser Real
Estate Group
540-578-0102
scott@funkhousergroup.com
Licensed in the
Commonwealth of Virginia
Home Search
Housing Market Report
Harrisonburg Townhouses
Walk Through This Home
Investment Properties
Harrisonburg Foreclosures
Property Transfers
New Listings

