| Newer Posts | Older Posts |
Home Sales and Prices Still Rising Despite Declining Contract Activity |
|
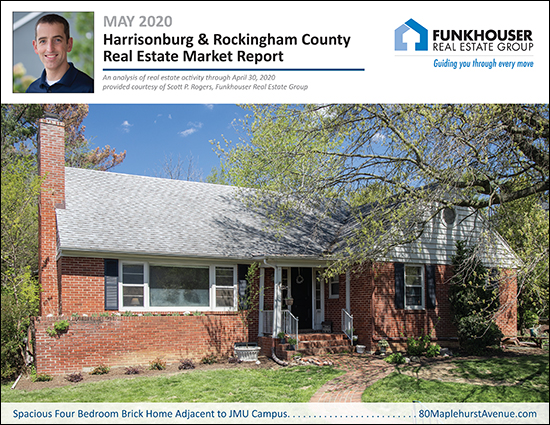 I just published my monthly market report, which you can download as a PDF here, or read on for the highlights of what is happening these days in our local housing market. But first, check out the details of the house shown above, located adjacent to the JMU campus, by visiting 80MaplehurstAvenue.com. Now, let's dive into the housing data and see what we can learn about the latest trends in the Harrisonburg real estate market... 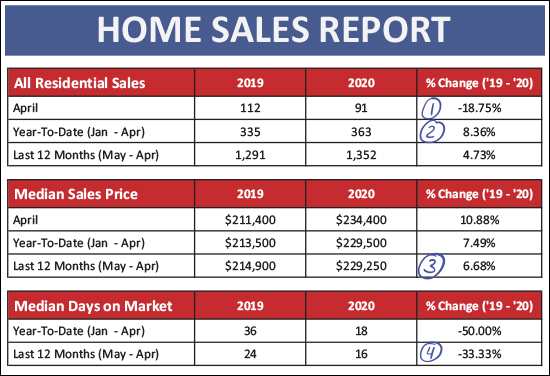 As you can see above, the pace of home sales dropped off a good bit in April 2020 (see #1) as there were only 91 closed sales as compared to 112 last April. This is not altogether surprising, as we had seen contract activity starting to decline slightly in March. The year-to-date pace of sales (see #2) is actually still quite a bit higher (8.36%) this year as compared to last year. There was a surge of home sales in January 2020 which has kept us ahead of last year when it comes to year-to-date sales despite slower sales in April. The median sales price is still on the rise (see #3) over the past year -- having risen from $214,900 a year ago to $229,250 at the end of April. Homes are selling faster and faster and faster (see #4) with a 33% decline over the past year in the median days on market. And now, let's look at how sales have bounced all over the place thus far in 2020... 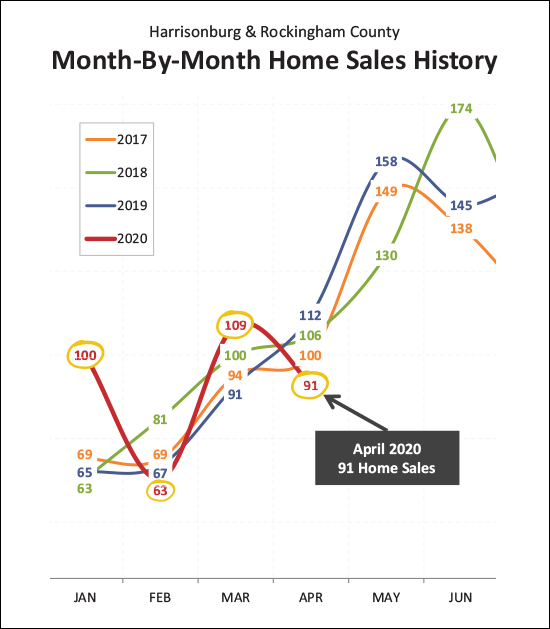 If you're feeling dizzy in 2020 trying to keep track of how the housing market is doing, you're not alone...
So, yeah - the net effect is still an increase between 2019 and 2020 - but that might shift when we include May home sales. We are likely to see fewer than 130 home sales in May based on contract activity in April. Only time will tell whether these short term interruptions of long term trends will impact those long term trends, as shown below... 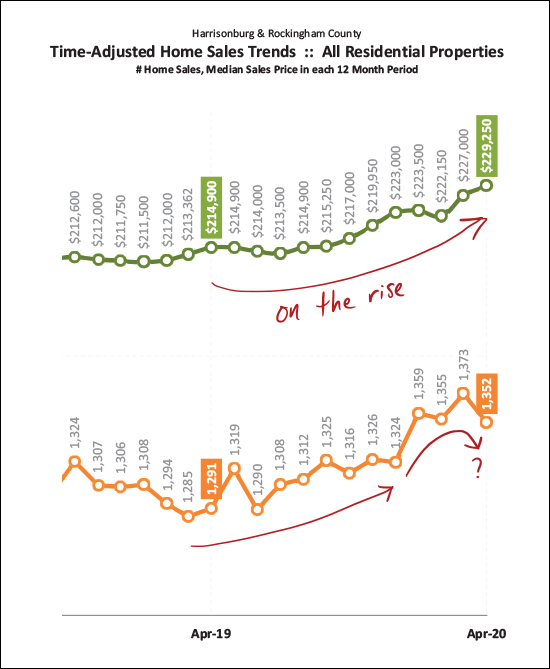 As you can see (in green) the median sales price has been steadily rising over the past year (quite a bit longer actually) to the current median sales price of $229,250. So far, we're not seeing any indications that we'll see a flattening or decline in market values in this area. Over the past year, we have seen an increase (even if choppy) in the pace of home sales, but that dropped a bit in April 2020, and might drop a bit more in May 2020. I think this is mostly related to fewer sellers being willing to sell which is resulting in fewer buyers being able to buy. It's also helpful to look at values over time just for single family homes, as the townhouse/condo market often includes investors which doesn't show owner occupant buying activity as clearly... 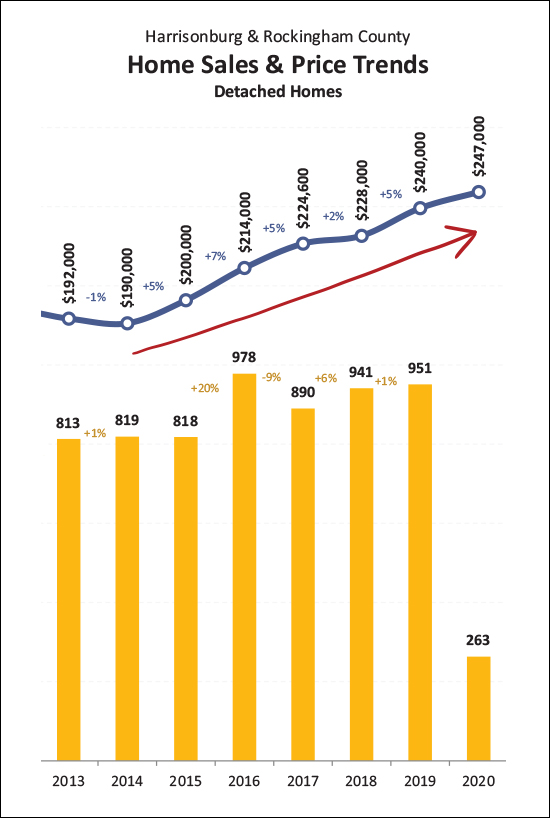 The figures above are showing the median sales price of detached homes over the past six plus years. The median sales price has risen between 2% and 7% for each of the past five years, and seems to be ready to increase again in 2020, perhaps by around 3%. Part of the reason that prices are going up is because we're seeing steady buyer demand amidst fewer and fewer options of homes for sale at any given moment... 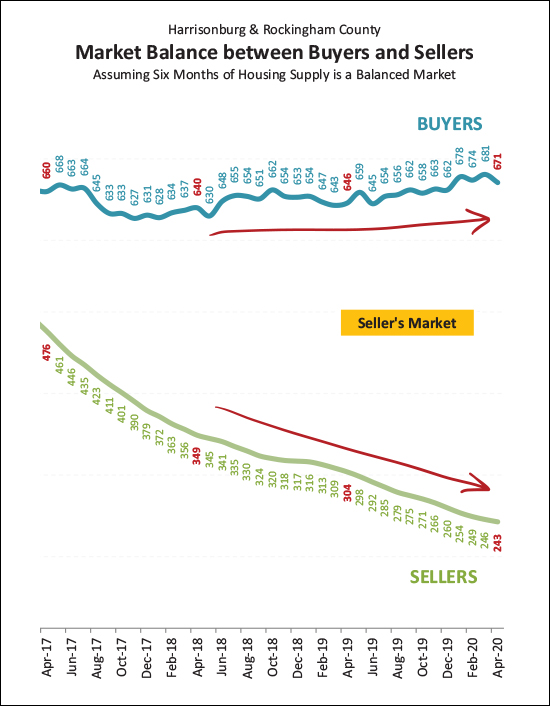 Above, we're looking at the number of buyers buying in a six month period -- which has been relatively steady over the past few years -- as compared to the number of homes on the market at any given time. The buyers are consistently ready to buy -- but they're fighting over fewer and fewer homes for sale. All that has made this an increasingly strong seller's market over the past few years. That said, buyer activity has faded a big over the past two months... 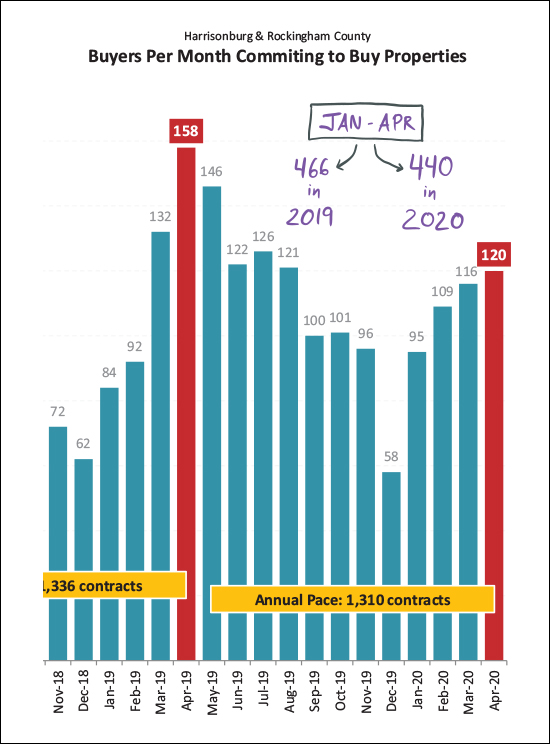 Last year, April was the strongest month of buyer activity for the entire year -- this year, not so much. We've seen an increase each month this year in the number of buyers buying -- but it has only resulted in a total of 440 contracts, as compared to a slightly higher pace of 466 contracts last year. So, slightly fewer buyers have contracted to buy in 2020, which will eventually result in a slower year-to-date sales figure, though that hasn't shown up yet. And why are fewer buyers buying, you might ask? I think the largest factor is fewer sellers being willing to sell... 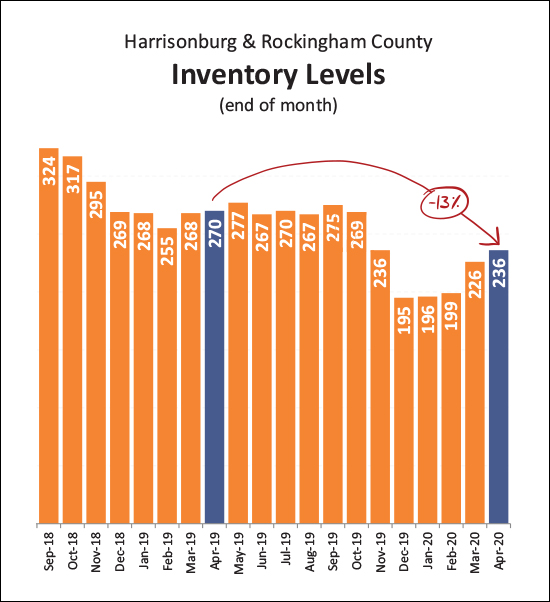 As shown above, we have seen a 13% decline in the number of homes for sale over the past year. Last year, the number of homes for sale rose to around 270 homes and stayed around that number between March and October. This year, it is not clear that we'll see inventory levels get that high. Those buyers that are able to buy, though, are financing their home purchase at a historically low mortgage interest rate... 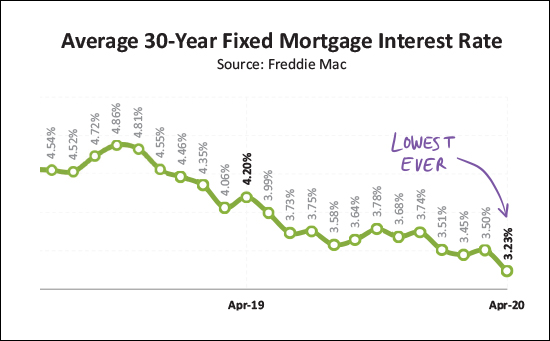 The mortgage interest rate at the end of April was 3.23%, which is the lowest on record -- ever. If you are buying in today's market, and are able to secure a contract on a house in this low inventory environment, you are certain to be pleased with your mortgage interest rate. OK, well, I'll leave it at that for now. You can review all of the trends and graphs by downloading a PDF of my market report here, or follow my blog at HarrisonburgHousingToday.com where I'll continue to monitor trends in our local market. In summary, the local housing market continues to see more homes selling, faster, at higher prices - but a small slow down in seller (and thus buyer) activity over the past two months will likely start to translate into slightly slower pace of sales, even if prices are not affected. Until next month, stay healthy, stay sane, and be in touch if I can be of any help to you or your family - with real estate or otherwise. | |
Home Buying Activity Continues To Slowly Slow, But Low Inventory Likely A Contributing Factor |
|
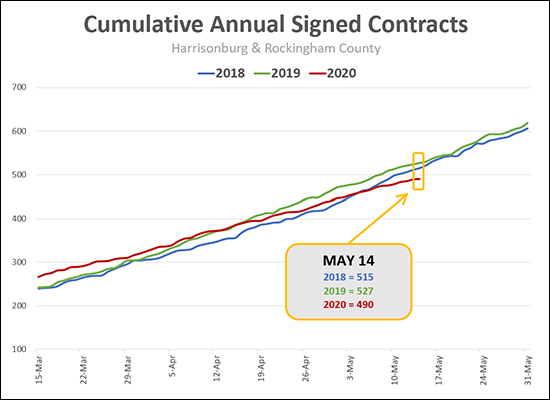 The pace of buyers signing contracts to purchase homes continues to slowly slow in 2020 -- with year-to-date contract activity in 2020 now 7% lower than during the same timeframe in 2019. A few contextual notes...
| |
Home Buyer Activity Still Slowing, Slowly, in 2020 |
|
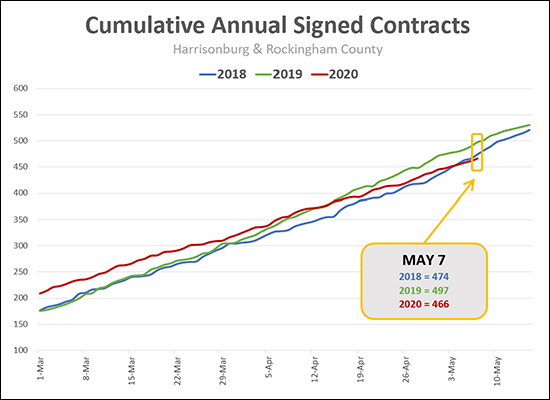 Are home buyers contracting to buy homes as quickly as we would have expected them to be in 2020? No. Has the pace of home buying activity dropped drastically given the current public health situation? No. As shown above, home buyer activity (this year is the red line) continues to trail off a bit as compared to the past two years.
The timing of contracts is different every year, so if we average out the past two years we see a pace of 485 contracts through May 7th. Thus, this year's pace of buying activity is only 4% slower than the average of the past two years. So... Is COVID-19 affecting the pace of home buying (and selling) activity in our local market? Yes. Is it still relatively likely that this year's total number of home sales will be within 5% - 10% of last year? Yes. Stay tuned for further analysis as we progress through this unusual time. | |
More Home Buyers Purchase In The County Than The City |
|
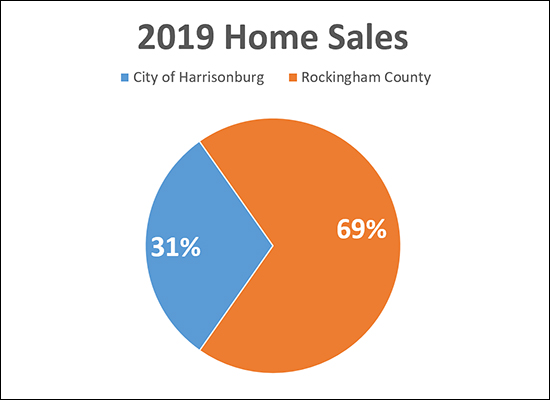 Each year, right around twice as many home buyers purchase homes in Rockingham County as compared to in the City of Harrisonburg. That said, the home buyers in the City are much more densely situated -- since the City is comprised of only 17.42 square miles -- while the County spans 849.09 square miles! As a random aside, Rockingham County is the third largest county in Virginia! Not necessarily, as there are more than THREE as many homes for sale in the County as compared to the City. 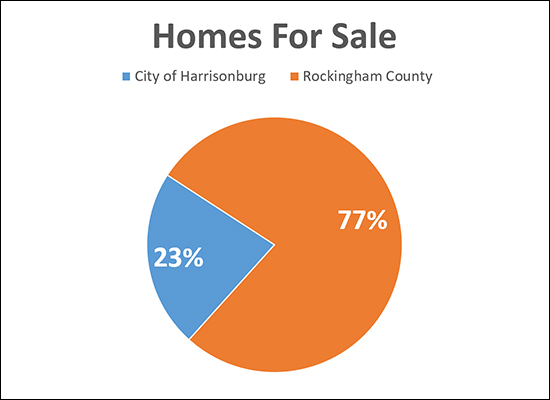 Where will you purchase your next home? In the City or the County? Why? Based on the lot size, privacy, school district, age, property type? | |
Always Look At The Larger Context When Considering House Price As A Buyer Or Seller |
|
 THE BUYER'S STATED PERSPECTIVE I know that your house is listed for $400K, but this one other home a few streets over sold for $350K last month, and it was a larger, so I'm not paying any more than $350K for your home. THE LARGER CONTEXT Just a few items...
Furthermore, aside from all of these differences in the two houses --- the other ($350K) house is not available any longer --- and there aren't three other houses just like it that the buyer can decide to buy. In this case, by focusing on this one not-actually-that-similar sale, the buyer has put themselves in a situation where they might miss out on purchasing a great home because of how they are viewing the market based on one comparable sale. THE SELLER'S STATED PERSPECTIVE I am confident that I can sell my house for $350K. After all, my friend owned a very similar house and he just sold it in a week, with multiple offers, for $360K! THE LARGER CONTEXT Just a few items...
Again, by focusing on this one not-actually-that-similar sale, the seller has put themselves in a situation where they might miss out on selling their home because of how they are viewing the market based on one comparable sale. The Main Takeaway As a buyer or as a seller -- don't focus on just one comparable sale when deciding on a reasonable price to pay or to ask -- look for the larger context! | |
Contract Activity Slows In April 2020 But Perhaps Mostly Because April 2019 Was A Wild Month? |
|
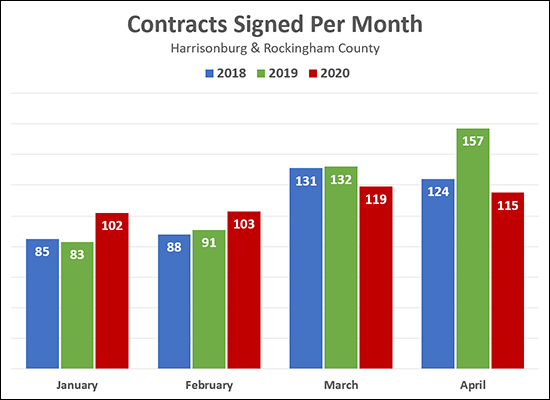 Contract activity declined 27% in April 2020 -- there were 157 contracts signed last April, and only 115 signed this April. Perhaps this is not surprising given the impact of COVID-19 -- or -- perhaps April 2019 was just a crazy month of contract activity and is not a great month to use for a comparison. When comparing April 2020 (115 contracts) to April 2018 (124 contracts) there was only a 7% decline in contract activity last month. Only time will tell whether this (fewer contracts) is a lasting trend -- but below you'll see how the year has shaped up thus far... 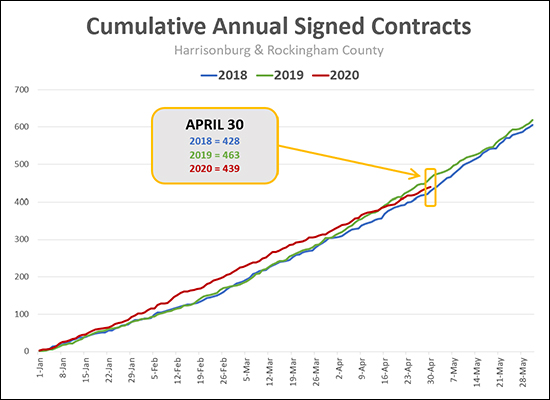 As you can see, the 439 contracts thus far in 2020 is 5% lower than in 2019, but 3% higher than in 2018. So, let's keep on moving along and see what May will reveal! | |
Sold Price Per Square Foot On The Rise In 2020 |
|
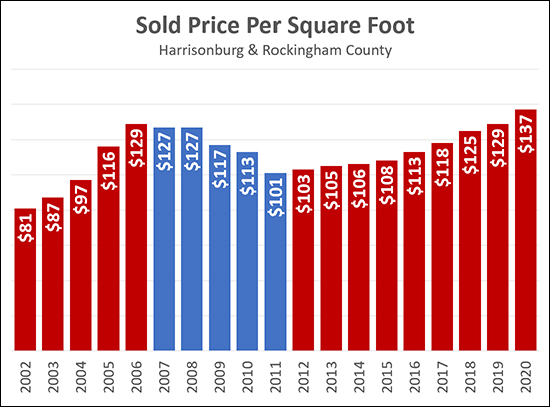 In addition to watching how the median sales price changes over time, it can be quite insightful to see how the median price per square foot of sold homes changes over time. The graph above tracks the median price per square foot of single family homes (not townhouses, duplexes or condos) in Harrisonburg and Rockingham County over the past 19 years. Price per square foot fell 22% between 2006 and 2011 as the market cooled back off. Since that time, however, we have seen a slow and steady increase in this metric -- from $101/SF in 2011 to $129/SF last year -- which marks a 28% increase over the past eight years. I wouldn't necessarily expect that we would see drastic increases in this metric in the next few years, but an increasing number of buyers (more demand) and significantly fewer sellers (less supply) does make you wonder if we will start to see more rapid increases in sales prices, and thus in price per square foot. Thus far in 2020, we are seeing a 6% increase in the sold price per square foot in Harrisonburg and Rockingham County! ALSO OF NOTE -- this metric is most helpful in understanding value trends over time -- not in calculating the value of one particular property. This median price per square foot is the mid point of many very different homes -- new homes, old homes, homes with garages, homes without garages, homes with basements, homes without basements, homes with acreage, homes on small lots, etc. A median price per square foot can be more helpful in understanding the potential value (or value range) of a single property if we pull that median value based on a smaller data set of more properties more similar to the single property. | |
YTD Home Buying Activity Slows Slightly in 2020 |
|
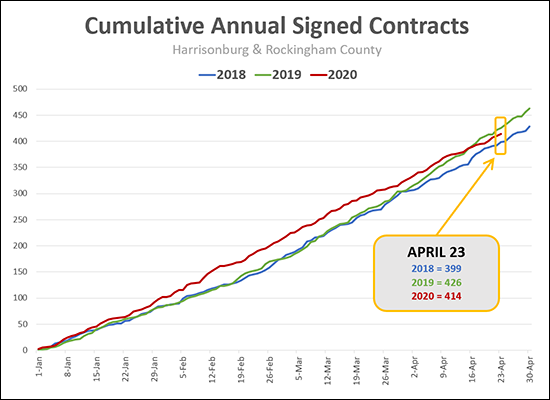 This is my first weekly check-in with contract activity where we're seeing a slight decline in contract activity in 2020 as compared to 2019. The data...
So, slightly fewer buyers have contracted on homes this year (to date) as compared to last year (to date). Is it significant? No, at least not at this point. There has been a 2.8% decline in buyer activity in 2020 -- which is a relatively small decline given how much of our daily lives has temporarily changed due to COVID-19. Happy Friday, and I'll check in on this metric again about a week from now. | |
Despite Everything Going On, We Are Still Seeing Slightly, Barely, More Home Buyers in 2020 |
|
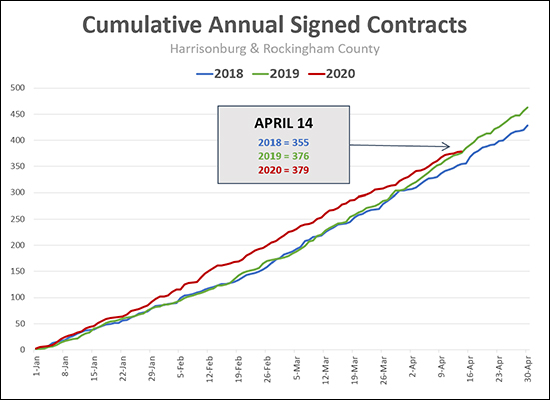 We're now about a month into dealing with the impact of COVID-19 on our lives, society, work, employment, finances, and yes, housing market. As shown above, despite everything that is going on, there have still been more buyers signing contracts thus far in 2020 (379 of them) than we saw either of the past two years (376, 355). That said, the gap is shrinking, and it seems likely that cumulative buyer activity in 2020 might (?) fall behind 2019 at some point in the next few weeks. I'll continue to track this data from week to week to see how COVID-19 is or is not impacting the amount of home buying activity we are seeing in our current market. The same two notes apply from last week...
If you have questions about how all of this relates to your plans for potentially buying or selling a home, feel free to reach out by sending me an email - scott@hhtdy.com. | |
Harrisonburg Area Housing Market Still Strong Through End Of March 2020 |
|
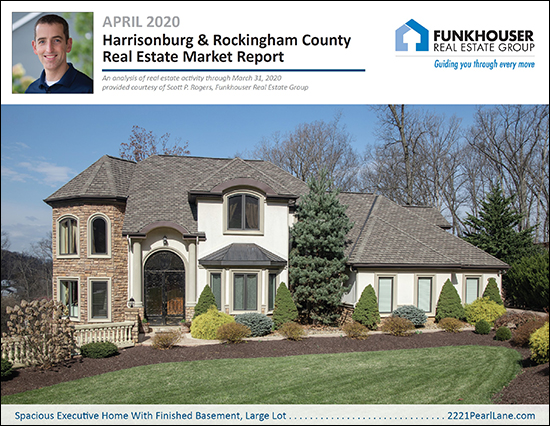 I'm working from home today, as is the norm for many of us these days. I hope that you and your family are in good health and good spirits as we travel through these unprecedented times. Before we get going, here are two articles I wrote a few weeks ago that are still quite applicable given the current scenario with COVID-19... What follows is an update on our local (Harrisonburg and Rockingham County) real estate market as measured by home sales data through the end of March 2020. Overall, you'll see that almost all indicators are still quite positive in our local market. If we are going to see an impact of COVID-19 on our local housing market, we might first see signs of that another month or two from now. Before we dive in, take a few minutes to learn more about this month's featured home - an upscale home in the Blue Stone Hills area - by visiting 2221PearlLane.com. Also, for those that like to cut to the chase, here's a PDF of my entire market report. Now, onto some data, and what we might conclude that it means... 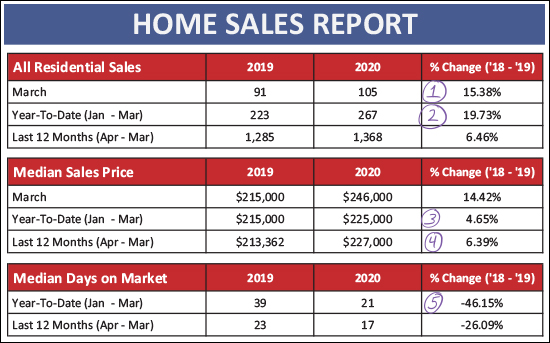 As shown above...
So, we have been seeing a relatively strong and robust market through the end of March! It gets even more interesting when examined visually... 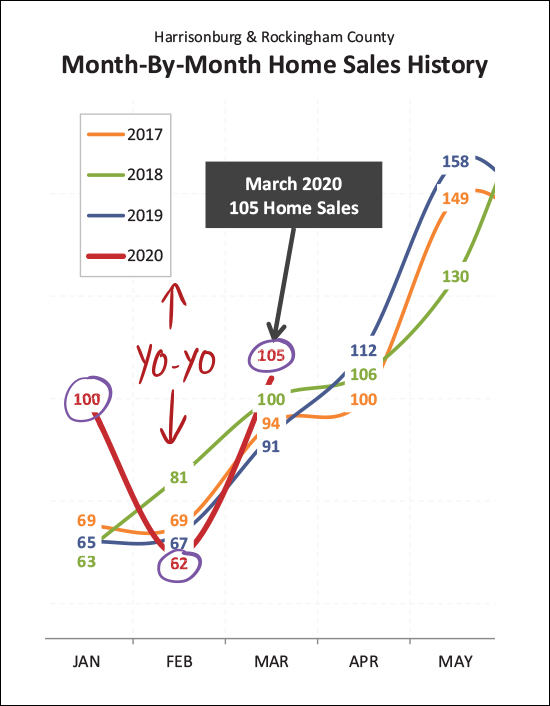 This year has certainly been quite a yo-yo when it comes to sales per month. We saw a record breaking number of sales in January (higher than the prior three months of January) and then a depressingly low number of sales in February (lower than the prior three months of February) and then things bounced right back up again in March to the highest month of March sales seen in the last few years. I suppose it's not totally unreasonable to think we could see another yo-yo move in April if home sales dip back down somewhat due to COVID-19. Read on a bit more for data on contract activity in March. 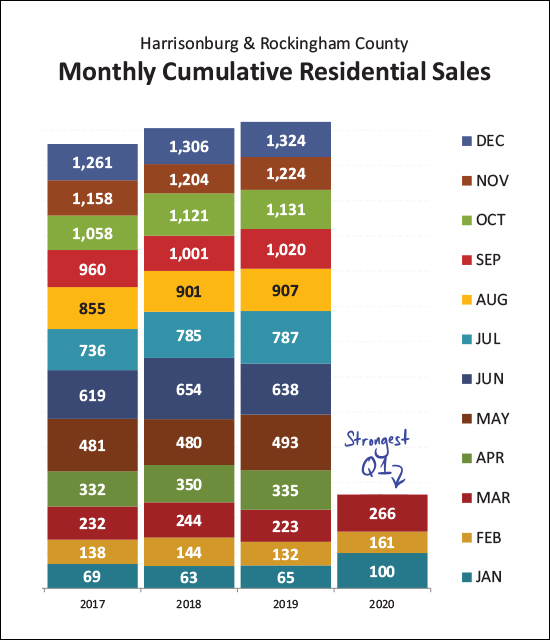 Looking at the data visually, again, you'll note that we saw the strongest first quarter of home sales in quite a few years in 2020. If this trend continues we would likely see 1,350+ home sales this year. 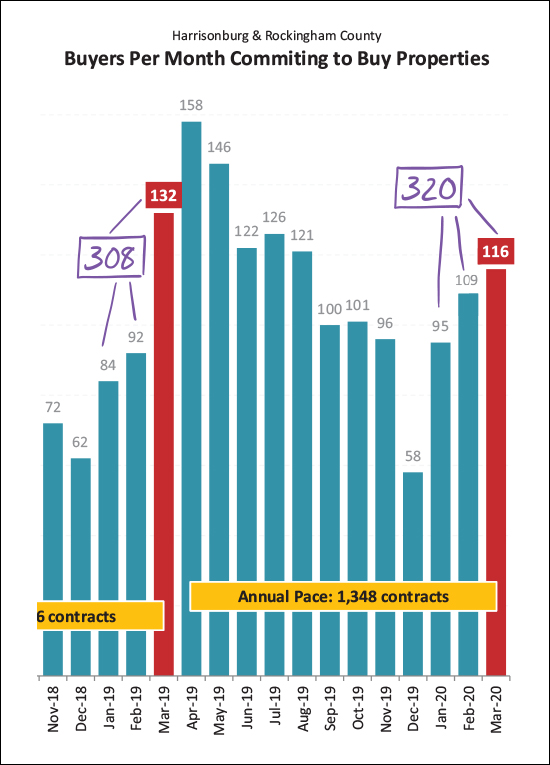 Looking now at contract data (above) you'll note that there were only 116 contracts signed in March 2020 - which is a drop off from the 132 contracts signed last March. However, when looking at the entire first quarter (Jan-Mar) this year's buyers have been a group of 320, while only 308 buyers showed up last year during the same timeframe. Last year, April was the strongest month of buyer activity -- as measured by when buyers are signing contracts -- and it will be interesting to see if that proves to be true this year. 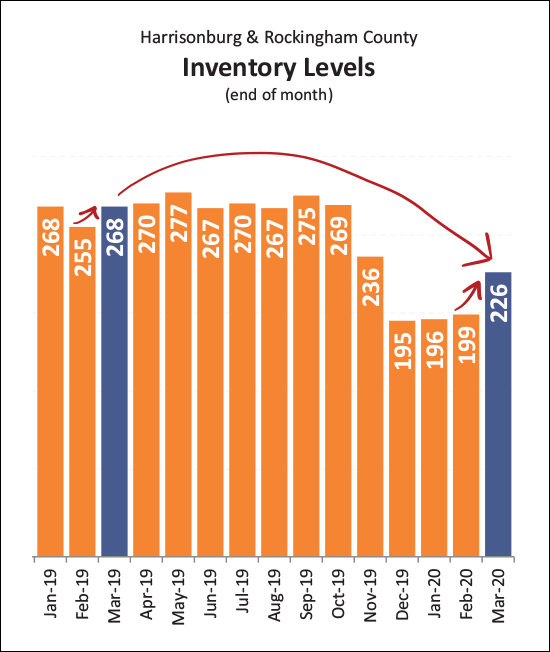 Changes in housing inventory (the number of homes on the market for sale) were somewhat predictable over the past month. We usually see inventory levels starting to climb in March (we did this year) but we also saw an overall year-over-year decline in inventory levels, as we have been seeing for the past few years. This will be another good indicator to watch in the coming months to see how the number of homes on the market is affected by COVID-19. 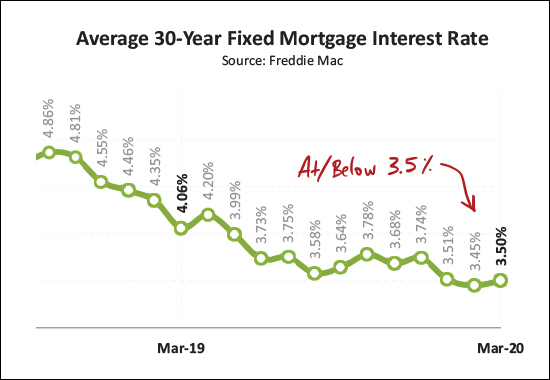 If you're buying a home right now -- or refinancing your mortgage -- you are likely quite pleased with some super-low interest rates. The current average rate for a 30 year fixed rate mortgage (on a purchase, not a re-fi) is 3.5%. This creates an extraordinary opportunity for today's buyers to lock in their housing costs at a low level as it relates to the interest they are paying on their mortgage. 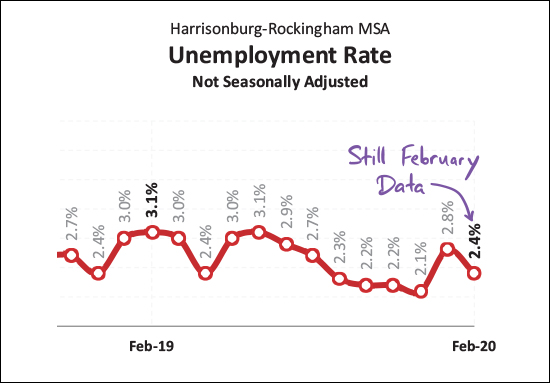 Any changes to this chart above will be telling in the coming months. We only have unemployment data through February right now, and at that point, things were looking great! This could change quite a bit moving forward. That is all of the graphs I'll throw at you today. In conclusion, through the end of March, our local housing market was continuing to move right along at a steady clip. Plenty of sellers are still listing their homes for sale. Plenty of buyers are still contracting to buy homes. Here are a few other articles that I have written over the past few weeks that explore some of the nuances of our market... As we continue through this unprecedented time, I'll continue to monitor where we are and contemplate where we might be headed, and I'll share them with you in my monthly market reports. Until next month, I hope you and your family remain healthy, and if you have questions about how current market dynamics might impact your plans for potentially buying or selling a home this year, feel free to reach out by sending me an email - scott@hhtdy.com. | |
2020 Home Buying Activity Might Be Starting To Slow Slightly But Still Ahead of 2018, 2019 |
|
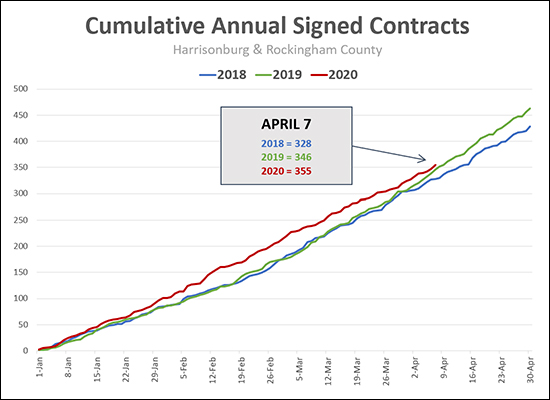 While out for a run earlier this week, listening to a podcast about the news and current events related to COVID-19, one of the people on the podcast made a comment that resonated with me. He said that whenever someone asks him how he thinks COVID-19 is going to affect ____ (fill in the blank with whatever you'd like) he starts by asking them how long they think COVID-19 will still be impacting our daily lives. The same likely holds true as it relates to the local housing market. How will COVID-19 affect home prices (or the pace of home sales) in Harrisonburg and Rockingham County? Well, it likely depends on how long you think COVID-19 will continue to impact our daily lives. Consider these three scenarios from a timeline perspective...
These three different timelines would likely result in very different impacts on our local housing market. But since none of us really know how the future timeline is going to play out, we can't accurately predict if or how the local housing market will be impacted by COVID-19. What we can do, however, is look backwards to see what impact we can observe as time passes. All that to say -- the graph multiple paragraphs above where you're reading now shows the cumulative number of buyers who signed contracts during the first four months of this year as compared to 2018 and 2019. As you'll note, this year started off much stronger than 2018 and 2019 - but over the past few weeks, cumulative buyer activity has been slowing back down slightly, now approaching the 2019 trajectory. Don't read that as all bad news, though, as thus far in 2020 we have still seen more buyers sign contracts than during the same timeframe in 2019, despite COVID-19. And two possibly necessary notes to make sure you understand this data:
As we continue through this unprecedented time, I'll continue to monitor where we are and contemplate where we might be headed, and I'll share it with you here. If you have questions about how all of this relates to your plans for potentially buying or selling a home, feel free to reach out by sending me an email - scott@hhtdy.com. | |
How Is Coronavirus Affecting How Many Buyers Are Buying Homes In Harrisonburg, Rockingham County? |
|
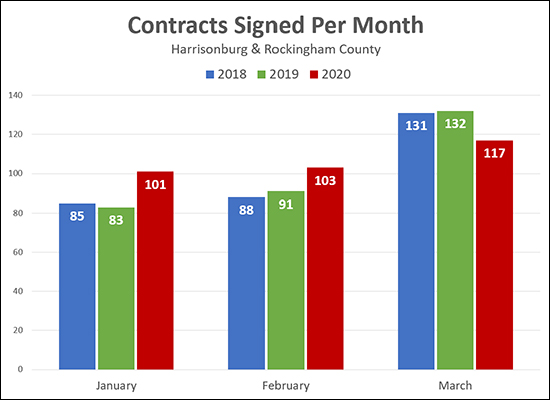 Is Coronavirus slowing down home buyers in Harrisonburg and Rockingham County? It seems it may be, somewhat, but it's probably too early to make any definitive conclusions. Based on the graph above...
Here's another graph that shows looks at the cumulative number of home buyers who signed contracts through the entire year in 2018 and 2019, and thus far in 2020... 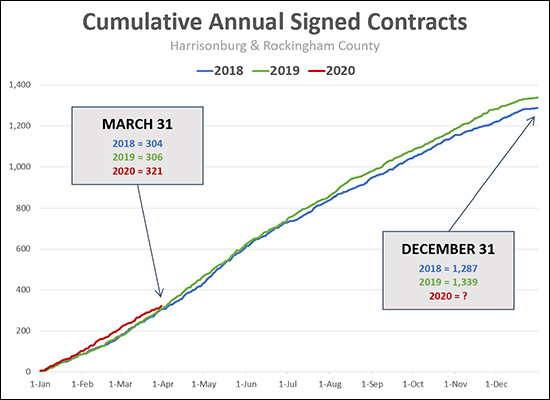 Above, you'll note that 2020 is still ahead of 2018 and 2019 when looking at the sum of January through March -- but that 2020 is drifting back downward towards 2018 and 2019. And, plenty disclaimers...
Anyhoo - lots of data, lots of possible conclusions, lots of caveats, and lots to continue to monitor over time. If you're thinking of buying or selling this Spring, let's chat about what makes sense from a timing perspective given continually changing market dynamics. | |
Harrisonburg Area Home Sales Remain Strong in 2020 Despite Slower February |
|
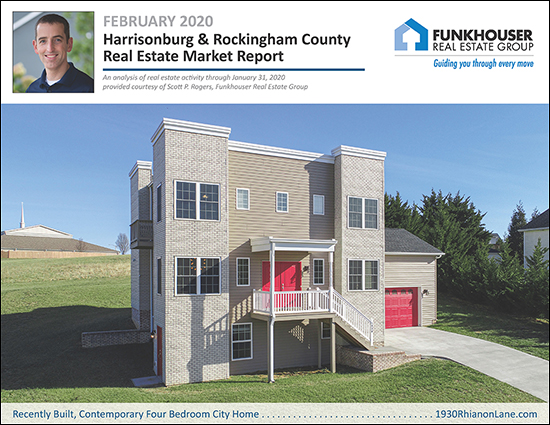
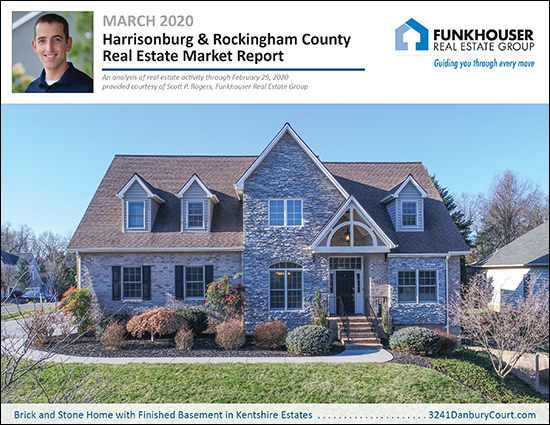 This month's featured home (shown above) is located in Kentshire Estates and you can find out much more about it out by visiting 3241DanburyCourt.com. OK. Now. Let's set the stage... Home sales slowed and prices fell in February 2020. Ahhh! Is the sky falling? Before you lump this news in with the rise of the coronavirus and the decline of the stock market -- remember two things...
So, there we go. Read on to better understand both short and long term trends in our local housing market -- but don't let a few less-than-exciting short term trends make you think our local housing market is (necessarily) experiencing anything as dramatic as what you're hearing about in the (health and economic) news of the week. Moving out from my drawn out intro -- here's the PDF of the entire report -- and let's dive in... 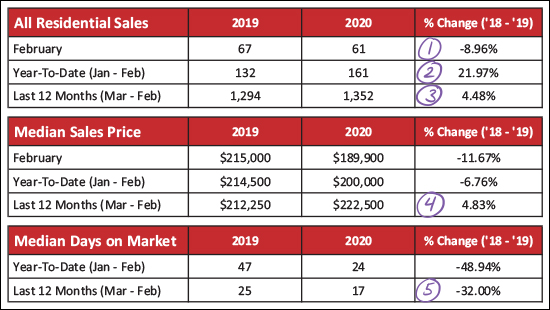 Lots to see and think about above...
This next graph could - again - scare you, given the sort of crazy news we're hearing about all day long this week... 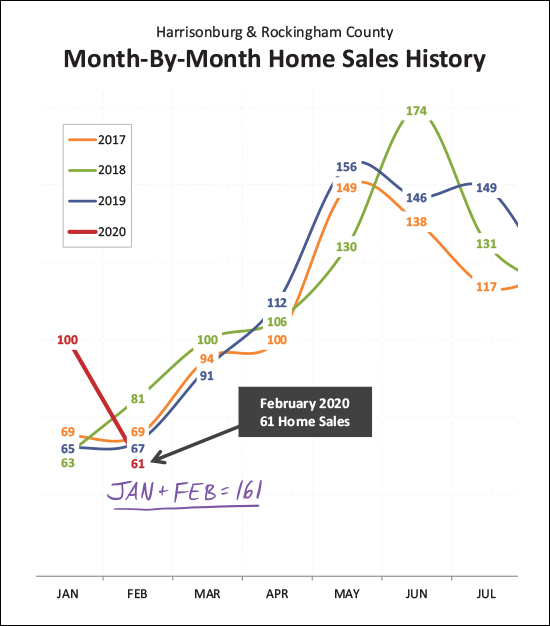 January 2020 was the strongest January we've ever seen -- and it was followed by one of the slower months of February in recent years. Again, should we panic? That red line is going nearly straight down! Here's my take on it -- any given month can be abnormally strong and any given month can be abnormally weak -- perhaps January was overly strong and February was overly weak. I come to this conclusion by looking at January and February sales combined, and am noting that the 161 sales in these two combined months is much higher than the same two months during the previous three years. So -- this isn't a message of "don't worry about that slow, slow February - everything is going to be just fine - trust me" -- it's more of a message of "the market still seems to be quite strong despite a slightly odd (slow) February." And now, we might be done with the nail biting portions of this monthly update on our local housing market, because most of the remainder of these graphs focus on the big picture and the long term trends... 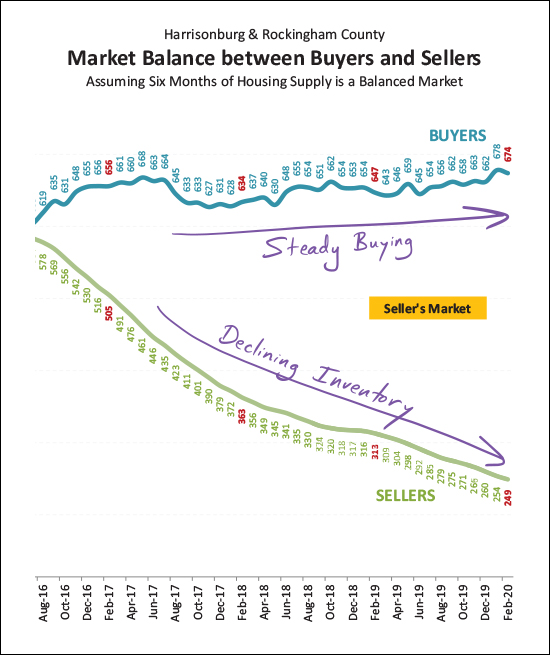 As shown above, buyers have been steadily buying homes at a slightly (just slightly) faster pace for each of the past few years -- but they have been choosing from a smaller and smaller pool of homes for sale at any given time. This has created a strong "seller's market" where many homes are seeing a flurry of showings when they first come on the market and sometimes are seeing multiple offers. 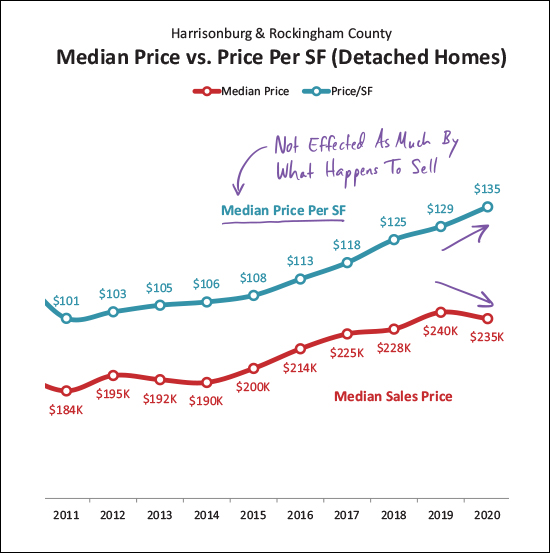 I don't usually include the graph above in this monthly re-cap, but I thought it was helpful this month. The median sales price has declined slightly between 2019 and 2020 (looking only at January and February 2020, of course) but you will note that the median price per square foot has increased during that same timeframe. This is a good indicator that the downward shift in sales prices is likely a change in what is happening to sell, more so than a change in home values. If more smaller homes are selling thus far in 2020 (as compared to all of 2019) then the median sales price would decline while the median price per square foot increases. 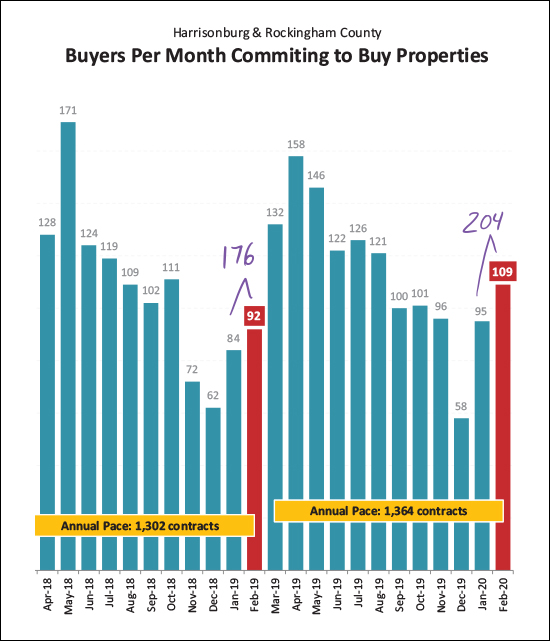 Another important distinction to make when thinking about short term market trends -- changes in the pace of closed sales are not a good measure of current buyer behavior, they just show how many buyers were (or were not) signing contracts 30 to 60 days ago. So, the fact that there have been 204 contracts signed this January and February -- compared to only 176 last January and February -- is likely a good indicator that we will see (closed) home sales bounce back up again in March and April. 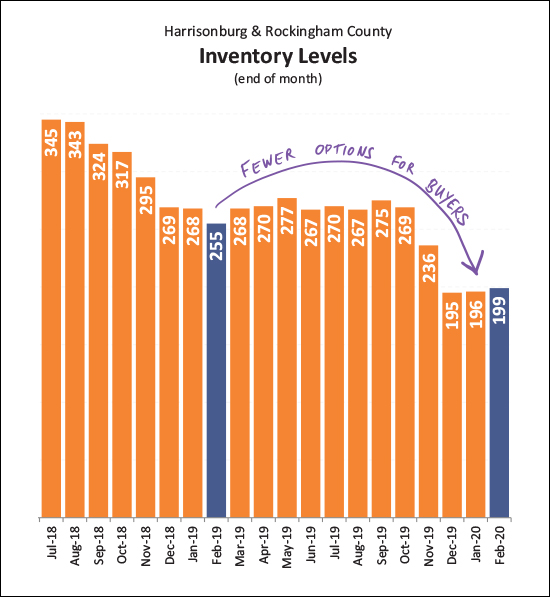 One of the main story lines of the past few years has been fewer and fewer choices for buyers in the market -- and this has continued into 2020. The number of homes on the market at any given time continues to fall -- and has now been (slightly) below 200 for three months in a row. This makes it a thrilling time to sell (many showings, sometimes multiple offers) but makes it a nerve-racking, frustrating time to (try to) buy a home. 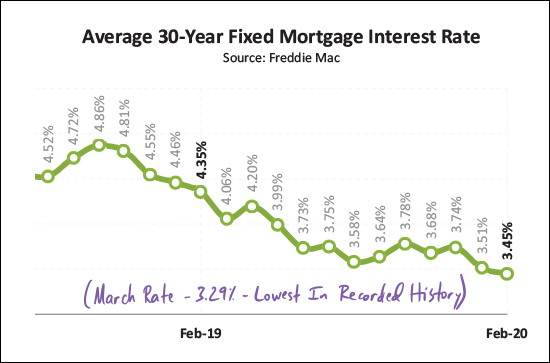 OK -- if there is one trend in this report that is definitely and 100%, completely, and fully related to the coronavirus, this (above) is the one. The Federal Reserve cut its benchmark interest rate by half a percentage on March 3 to try to combat any adverse economic effects of the coronavirus. That March 3rd rate cut isn't shown above, since my graph only goes through the end of February, but it caused the already low average rate of 3.45% to dip even lower, down to the current level of 3.29%, which is the lowest average mortgage rate that we have ever seen for a 30 year fixed rate mortgage. OK, alright, we made our way through the data for the month. There is much more, of course, in the full PDF of my market report. As we continue to learn more about the coronavirus I hope that you and your family and friends remain well. I don't expect that we'll see drastic ramifications of the coronavirus on our local real estate market because I believe people will still need housing, and people will still have jobs - but we will all have to closely monitor how things develop from here. My advice from last month still applies... If you're planning to sell your home in 2020 -- let's chat SOON about the best timing for doing so, what you should do to prepare your home for the market, and of course, we'll want to start by analyzing your segment of the market. As always -- shoot me an email if you have follow up questions or if you want to chat about your plans to buy or sell. | |
Highest Pace Of Home Sales In Almost 13 Years |
|
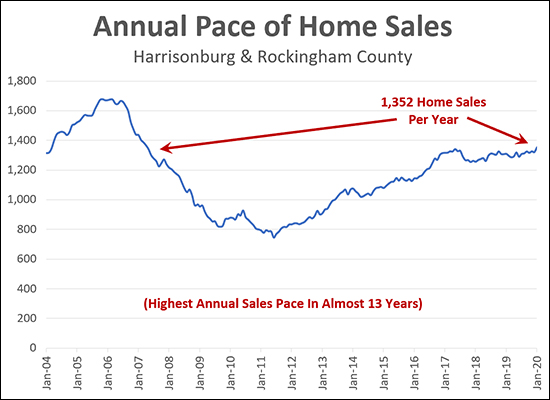 One more bit of context for you to digest as we start off the week -- at the end of January 2020 we hit an annual pace of 1,352 home sales in Harrisonburg and Rockingham County. That is the highest number of sales in a year that we have seen in almost 13 years! We have to go way back to 2007 to find a higher annual pace of home sales. For additional insights into the current (red hot) local housing market, feel free to check out my full market report and commentary here. | |
Just How Unusual Was The Pace of Home Sales In January 2020? |
|
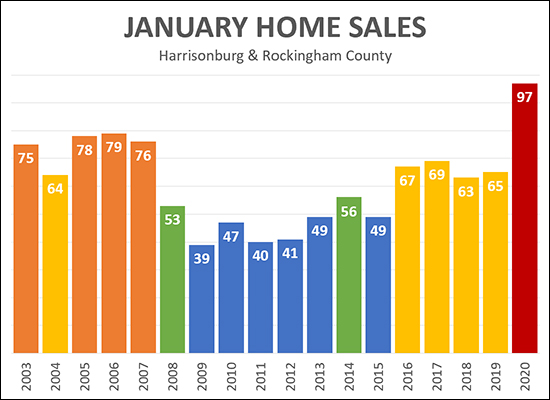 Particularly unusual, I'd say. Looking back 17 years, the highest number of home sales we had ever seen in January was 79 home sales -- but this January (last month) there were 97 home sales! What a month! Stay tuned to see if we'll have another high octane month of sales in February. In the meantime, feel free to check out my full market report and commentary here. | |
Home Sales Soar To Surprising New Heights in January 2020 |
|
 Time seems to be passing quickly these days, perhaps because my two kids are growing up faster than I can believe - age 15 (also known as "almost driving") and 11 (but 12 next month!). In the vein of time passing quickly, I was surprised to realize this week that the year is essentially 1/8th of the way over now!? How does the time slip by so quickly? Well, if you blinked, and missed January - you missed a LOT of home sales in Harrisonburg and Rockingham County. We'll get to that soon (keep reading) but first I'll point you to a few quick links... OK - now back to the business at hand - breaking down the latest trends in our local housing market. First, some of the basics... 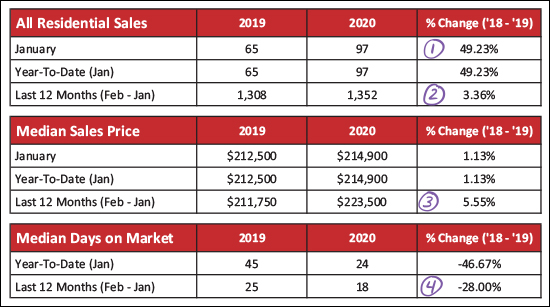 As shown above...
If we then dive into detached (single family homes) and attached (townhouses, duplexes and condos) we find relatively similar trends... 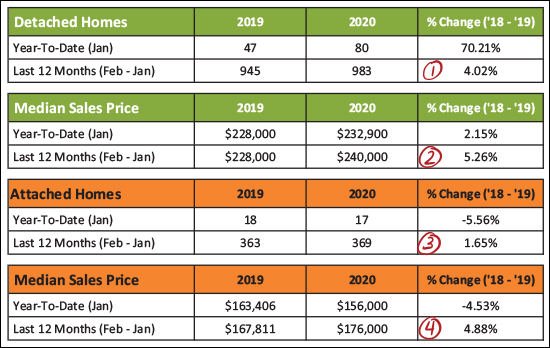 In the breakdown above, you might note that...
And now, the visual of what we'll call a crazy January... 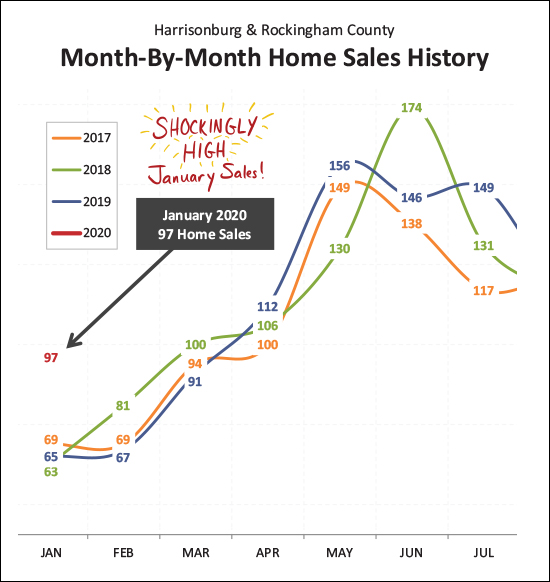 If there was one thing it seemed we could count on, it was that we'd see between 60 and 70 home sales in January. That's what we've seen for the past three years - and looking back even further (2010-2016) we find even lower months of January sales - 47, 40, 41, 49, 56, 49, 67. But not this year. This year started off with a BANG with a shockingly high 97 home sales in Harrisonburg and Rockingham County. Could this be an anomaly? Will February sales be miserably slow, bringing a January/February average to more normal levels? Maybe. Will every other month this year fall back in line with normal historical trends? Maybe. Or -- will this year be unlike any prior with much higher sales than expected, all year long? Maybe. Stay tuned to see how things shape up after this blockbuster month of sales in January. And look what this crazy January contributed towards... 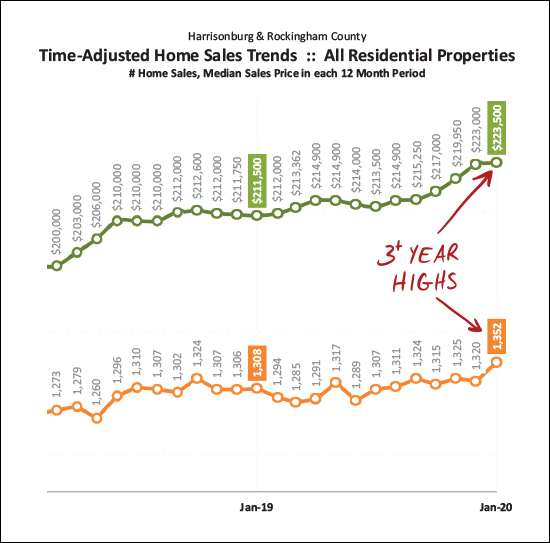 The data above looks at 12 months of data at a time - month after month - to see long term trends. These long term trends have now pushed us to the point of having 3+ year highs in both categories shown - the pace of sales and the price of sales. The median sales price of $223,500 is higher than it has been in many more than three years. Likewise, the annual pace of 1,352 home sales is higher than it has been in over three years. So, it's a wild time right now in the local housing market with steady growth in sales prices and stable but strong numbers of home sales. Circling back to the prior question - will home sales taper off in February? 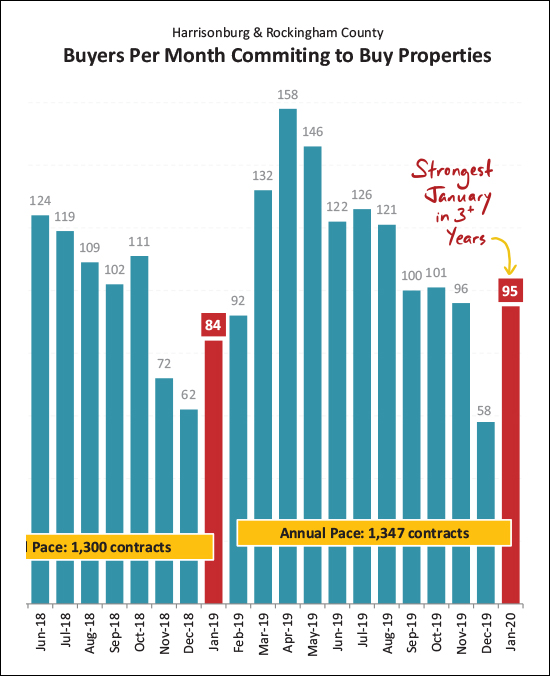 I'm going to lean towards "no" -- given that 95 contracts were signed in January -- many of which will result in February home sales. As an aside - I have been tracking "under contract" data since 2008 -- and there has never been a January with quite so many contracts signed as we saw this January. So, maybe February will be a relatively strong month for home sales as well? And these increases, while one major metric keeps decreasing... 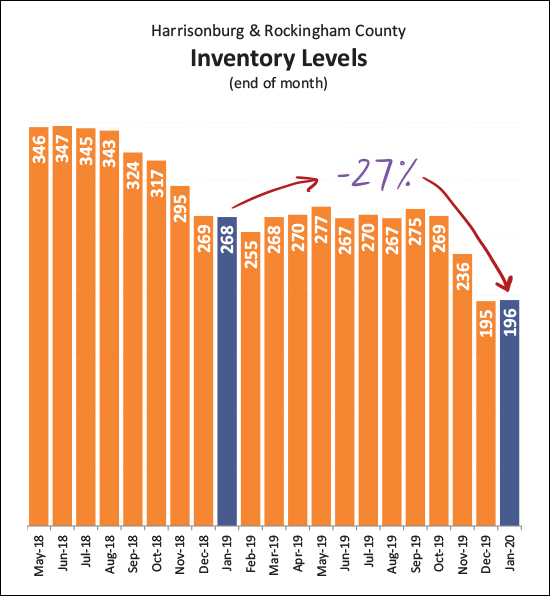 Indeed, despite increasing sales, the number of homes on the market at any given time keeps declining. We've seen a 27% year-over-year decline in the number of active listings on the market. So, how do more homes sell if fewer homes are on the market? It seems that plenty of homes are coming on the market for buyers to buy - but because buyers are contracting to buy them so quickly these new listing aren't staying on the market long enough to allow inventory levels to see an effective increase. Speaking of buyers contracting to buy homes quickly... 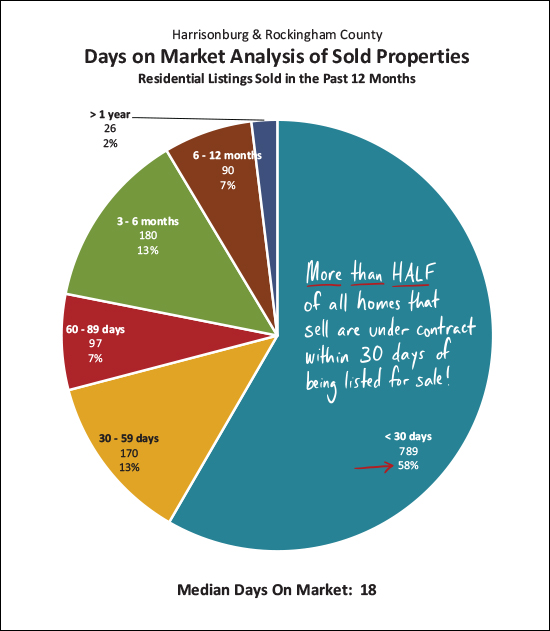 More than half (58%) of homes that have sold in the past year were under contract within 30 days of being listed for sale. Homes are, indeed, selling quickly. The median "days on market" currently stands at 18 days. A nice time to be a home seller if you're hoping not to have a prolonged period of time having buyers coming to view your house. Depending on your home's price, condition, layout, location, it may very well go under contract quickly! And today's buyers are paying lower mortgage interest rates than we've seen in a while... 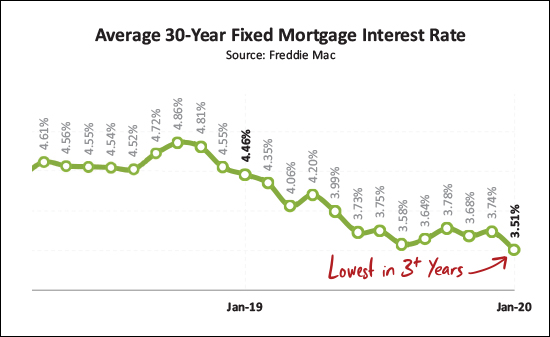 The average mortgage interest rate on a 30 year mortgage has now dropped to 3.51% - the lowest rate seen in over three years. Buyers who are currently buying a home are fixing in lower monthly payments than they would have seen with any recent mortgage interest rate - though that is offset somewhat by the increases in median sales prices over the past few years. OK - that's it for now - I'll be diving into a few more market dynamics in the coming days. But until then... If you're planning to sell your home in 2020 -- let's chat SOON about the best timing for doing so, what you should do to prepare your home for the market, and of course, we'll want to start by analyzing your segment of the market. If you're planning to buy a home in 2020 -- get ready to compete with lots of other buyers in a low inventory housing market. To assist you, sign up to get alerts of new listings, talk to a lender to get pre-approved, and let's get ready to make a mad dash to see new listings as soon as they come on the market! As always -- shoot me an email if you have follow up questions or if you want to chat about your plans to buy or sell. | |
City Townhouses Are Selling QUICKLY! |
|
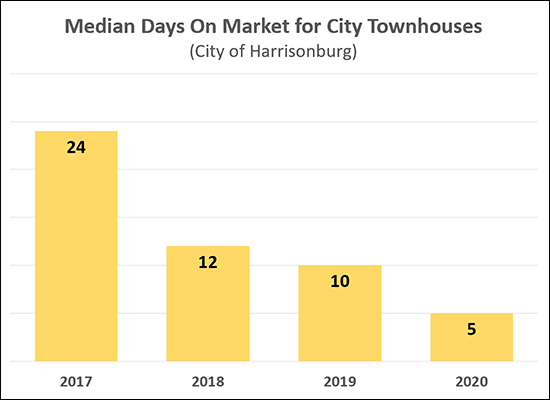 Townhouses in the City of Harrisonburg are selling QUICKLY! The "Days On Market" referenced above is the number of days between when a property is listed for sale and when it goes under contract. Just three years ago, the median days on market was 24 days - which means that half of the townhouses that sold went under contract in fewer than 24 days, and half took longer than 24 days. But now, the median days on market has dropped down to just FIVE days in 2020. Oftentimes, sellers of townhouses who want to buy a single family home are worried that they won't be able to sell their townhouse quickly enough to then make an offer on the house they want to purchase - this should be at least somewhat less of a concern now given the speed at which townhouses are going under contract! | |
Home Sales Rise In County, Fall In City |
|
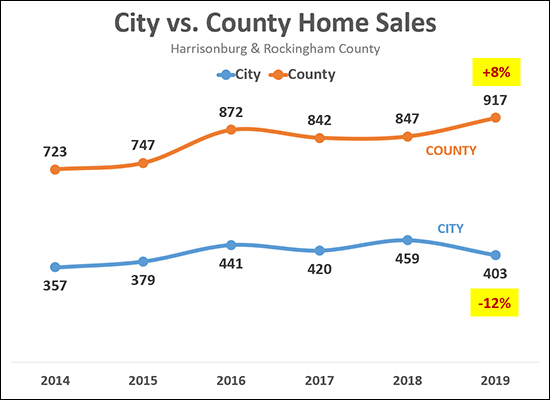 Home sales rose 8% in Rockingham County last year -- from 847 sales in 2018 up to 917 sales in 2019. This is the highest number of home sales we have seen in Rockingham County in at least the past six years. But in the City, it was a different story. Home sales declined 12% in the City of Harrisonburg in 2019, from 459 sales in 2018 down to only 403 sales in 2019. This is higher than some recent years, but the lowest number of homes ales in the past four years. A few more notes...
There are any number of factors that affect whether buyers end up buying in the City or County, including what type of property they are seeking, how much land they desires, school systems, employer locations, and much more. | |
Monthly Housing Cost for Median Priced Home Climbs Further in 2019 |
|
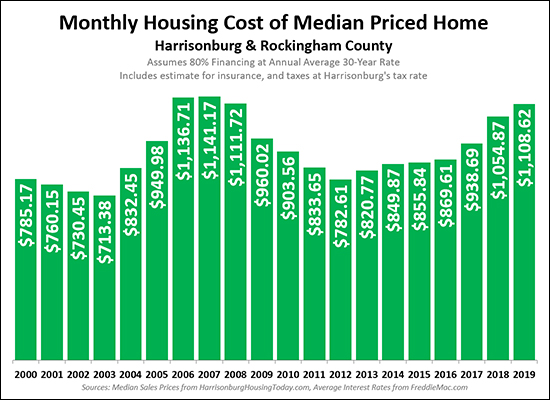 As should come as no surprise, the monthly cost of housing is increasing -- and has been increasing more quickly over the past several years (2018, 2019) as compared to many prior years. The graph above devises a monthly cost of housing using the median sales price of homes sold in Harrisonburg and Rockingham County and the mortgage interest rate at the time. The payments above assume that a buyer finances 80% of the purchase price at the prevailing rate -- and these housing costs include an estimate of real estate taxes and homeowners insurance. Of interest -- this monthly cost...
Over the next few years, it seems likely we will see a continuation of this trend, as sales prices and mortgage interest rates are both likely to continue to increase. | |
Lower Priced Market Segments See Largest Swings In Housing Inventory |
|
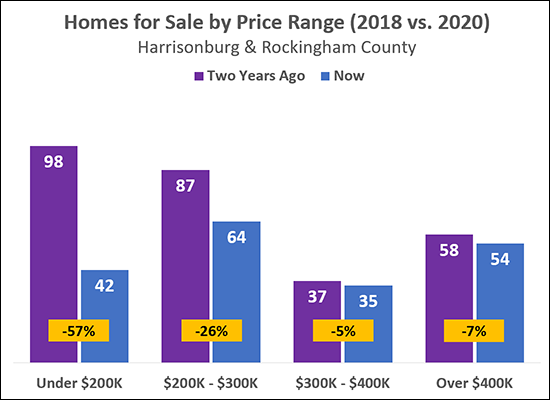 Not all price ranges are created equally, it seems. The hardest hit price range, perhaps unsurprisingly, is the under $200K price range -- where we have seen a 57% decline in the number of homes for sale over the past two years. Of note -- part of the problem here is increasing home values -- which prices some homes out of the "under $200K" price range. Regardless, though, buyers looking to stay under $200K for their home purchase are having an ever more difficult time doing so. The $200K - $300K market also had a sizable (26%) decline in the number of homes actively listed for sale as compared to two years ago. Both the $300K - $400K and the $400K+ price ranges only saw slight (-5%, -7%) declines in inventory levels - so not a marked difference from where inventory levels were two years ago.. | |
| Newer Posts | Older Posts |
Scott Rogers
Funkhouser Real
Estate Group
540-578-0102
scott@funkhousergroup.com
Licensed in the
Commonwealth of Virginia
Home Search
Housing Market Report
Harrisonburg Townhouses
Walk Through This Home
Investment Properties
Harrisonburg Foreclosures
Property Transfers
New Listings

