| Newer Posts | Older Posts |
Fall Is Not The Worst Season For Selling Your Home |
|
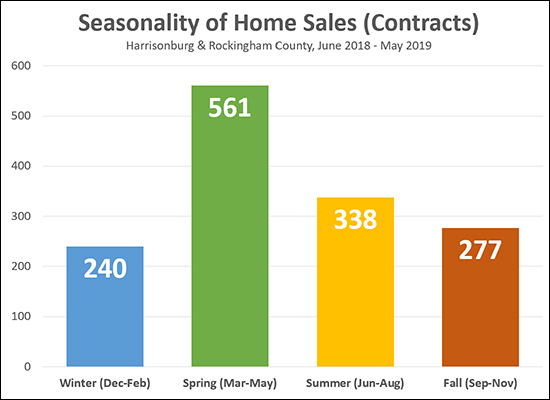 As is likely no surprise -- the busiest time for home sales (contracts) is SPRING -- by far! There is then a relatively large drop off from Spring to Summer. Somewhat surprisingly, it is not an enormous decline between Summer and Fall. So -- Fall is not the worst season for selling your home, but it is far from the best. Of note, the data above reflects the timeframe during which properties went UNDER CONTRACT -- not when they closed. Plenty of the Summer contracts turned into Fall closings -- but the 277 figure is a reflection of how many buyers made buying decisions (signed contracts) between September and November of last year. So....if you want to sell your home (and close on it) in 2019, you should be thinking about getting it on the market sooner rather than later. Fall is definitely a better time to sell than Winter! | |
Summer Is Fading Away. Home Sales Are Not. |
|
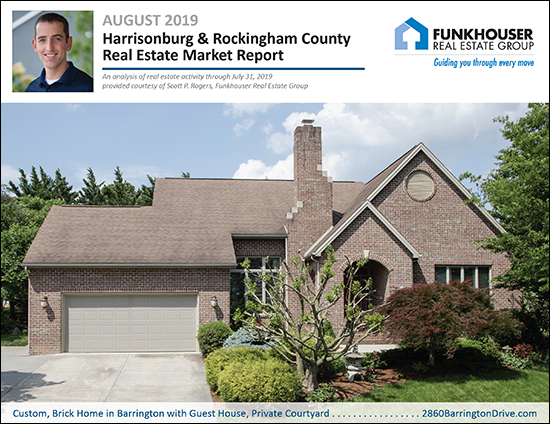 Summer is here! Oh wait, summer is gone!? Once that first week of August hits, it seems it's almost time for school to start again. Where did the summer go!?! While I ponder how another summer flew by so fast, let's take a few minutes to reflect on the state of our local housing market. But first - the beautiful home pictured above is this month's featured home - a spacious upscale home in Barrington with a finished basement, guest house and private courtyard! Check out the details at 2860BarringtonDrive.com. Now, onto the data! Download the full 28-page market report as a PDF, or read on... 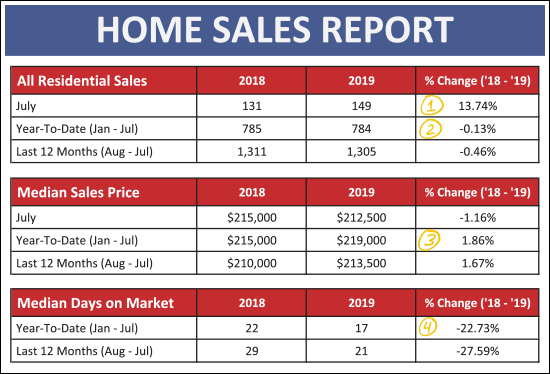 As shown above, July was a strong month for home sales...
Diving slightly deeper, let's see how detached homes compared to attached homes. An "attached home" is a duplex, townhouse or condo... 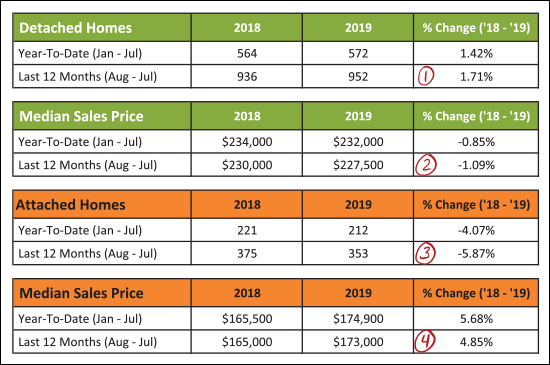 As shown above, there are some differences in these two broad segments of our local market...
And just how did this past July compare to some other months of July? 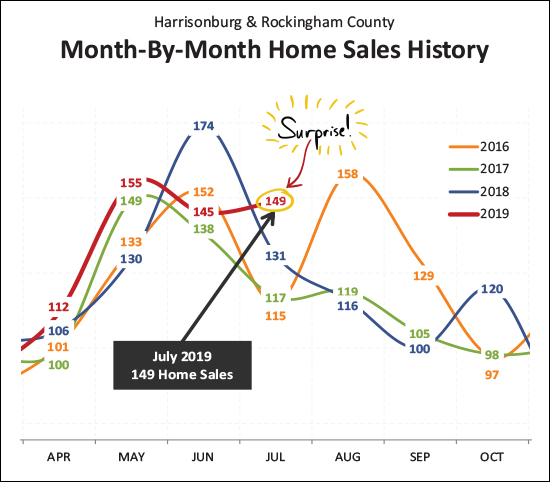 This was a bit of a surprise to me! June home sales were rather slow compared to previous months of June. I didn't anticipate that a slower June would so quickly translate into a faster paced July - but wow! Looking back at the past three years we have seen 115, 117 and 131 homes sales during July. This year it was 149 home sales! An impressive showing for buyers in the local marketplace! And here's how that strong month of July contributed to the overall year... 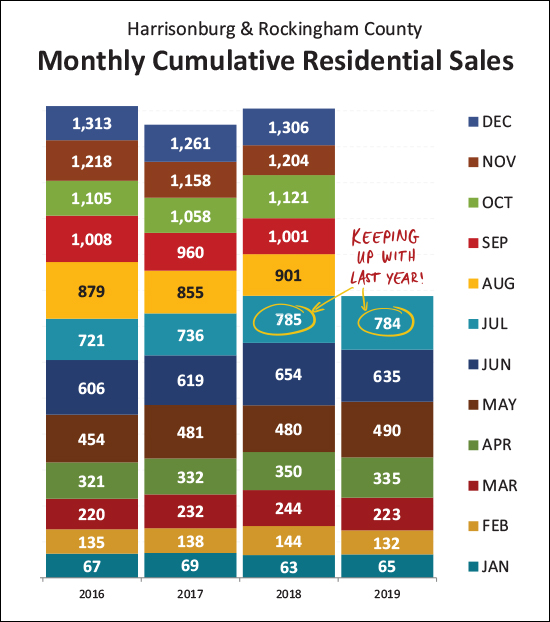 If we were a bit behind as of the end of last month (635 vs. 654) we just about (just about!) caught back up in July -- as there have now been 784 home sales thus far in 2019 compared to 785 last year. it would seem we'll probably make it back to around 1300 home sales this year. And now, let's step back a bit... 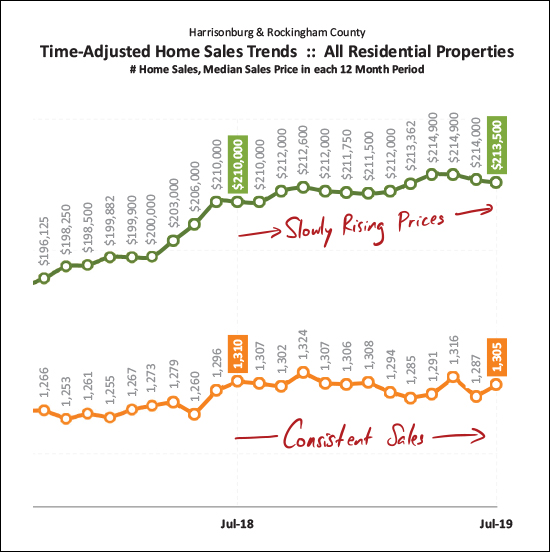 This is the slooooooooowest moving graph ever - it looks at a rolling twelve months of sales data. Here, though, we see that the general trend is a consistent-ish pace of home sales -- and slowly rising prices. And when we look for some overall indicators just for detached homes... 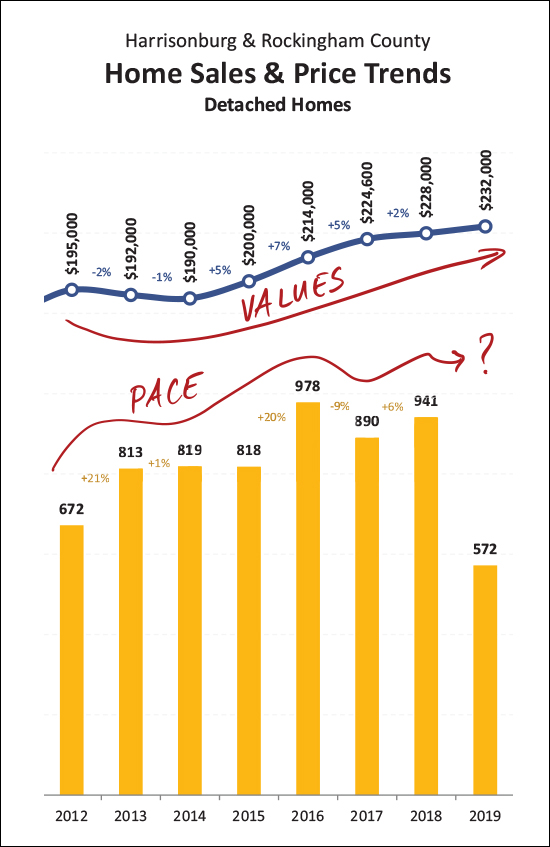 This is where we see (above) that despite some year to year turbulence as to the pace of home sales, we're seeing overall increases in sales prices all the way back to 2014. Some years (2015, 2016, 2017) have been larger increases than others (2018, 2019) but it has followed the same general trend. So, what's next? 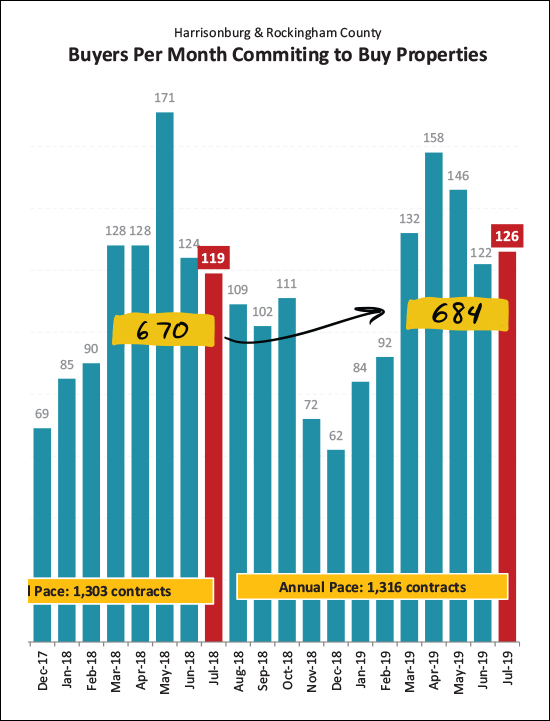 Well -- it would seem we are likely to see another strong month of home sales in August. After all, we saw an uptick (from 119 to 126) in July contracts, and over the past five months there have been 684 contracts signed, as compared to only 670 during the same months last year. How, though, will those contracts come together with such limited inventory? 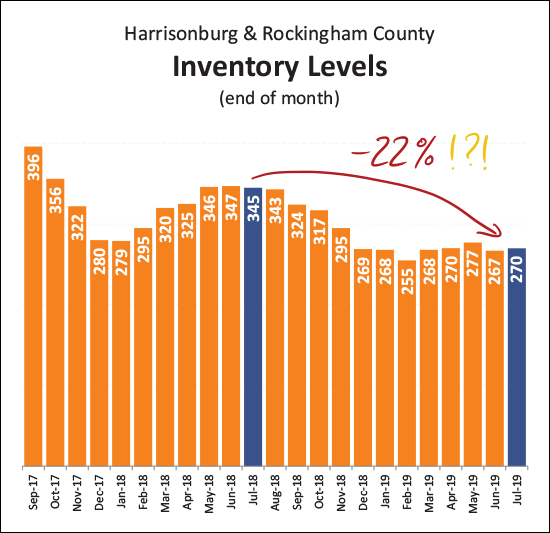 That is, of course, an excellent question! Inventory levels have fallen 22% over the past year. This means today's buyers are finding fewer and fewer options when looking for a home to buy at any given time. That said - a relatively consistent number of homes are selling - so a buyer might just have to be a bit more patient, and then be ready to jump quickly when the right house comes on the market. And one last note about mortgages and financing... 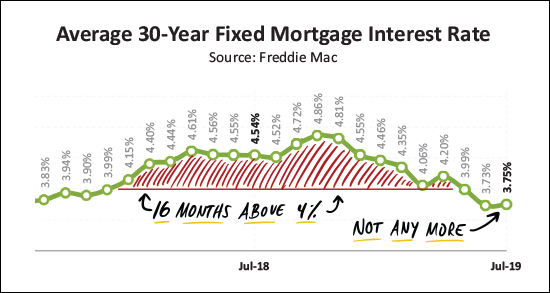 In case you missed it, today's buyers are locking in below 4% on 30 year fixed rate mortgages! We went through 16 months with rates above 4%, and we have now been back below 4% over the past few months. Anyone who locked in at 4.25%, 4.5%, 4.75%, etc., still has a wonderful long-term fixed rate mortgage interest rate -- but 3.something? Wow! I'll wrap it up there for now, with a few closing thoughts...
Until next time, have wonderful remainder of your summer, and a great start to your school year if you or someone you know will be getting back to the classroom this month! | |
Median Price Per Square Foot Rising Again In 2019 |
|
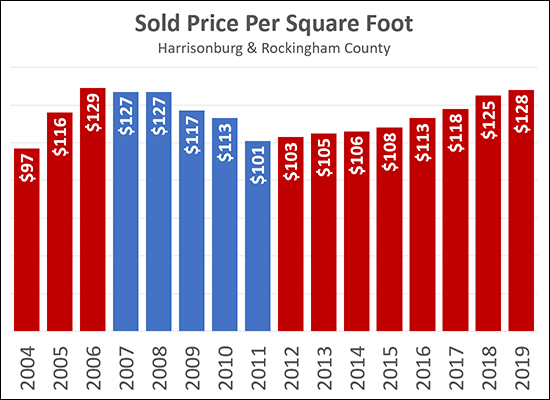 In addition to watching how the median sales price changes over time, it can be quite insightful to see how the median price per square foot of sold homes changes over time. The graph above tracks the median price per square foot of single family homes (not townhouses, duplexes or condos) in Harrisonburg and Rockingham County over the past 15 years.
Price per square foot fell 22% between 2006 and 2011 as the market cooled back off. Since that time, however, we have seen a slow and steady increase in this metric -- from $101/SF in 2011 to $125/SF last year -- which marks a 24% increase over the past seven years. I do not expect that we will see any drastic increases in this metric in the next few years, though an increasing number of buyers (more demand) and significantly fewer sellers (less supply) does make you wonder if we will start to see more rapid increases in sales prices, and thus in price per square foot. ALSO OF NOTE -- this metric is most helpful in understanding value trends over time -- not in calculating the value of one particular property. This median price per square foot is the mid point of many very different homes -- new homes, old homes, homes with garages, homes without garages, homes with basements, homes without basements, homes with acreage, homes on small lots, etc. A median price per square foot can be more helpful in understanding the potential value (or value range) of a single property if we pull that median value based on a smaller data set of more properties more similar to the single property. | |
Home Sales Slow, Prices Inch Higher In First Half of 2019 |
|
 It's hard to believe, but half the year has already flown past! Let's take a few minutes to review some recent trends in the local housing market -- but first...
Now, starting with some data packed charts before we get to the colorful graphs... 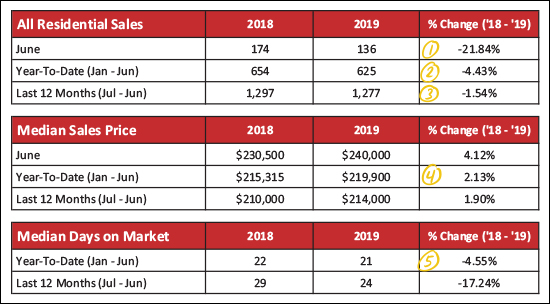 Looking at the market overview above, here's what's popping out to me...
Now, let's see how detached home sales compare to the sale of attached homes. Attached homes are townhouses, duplexes and condos... 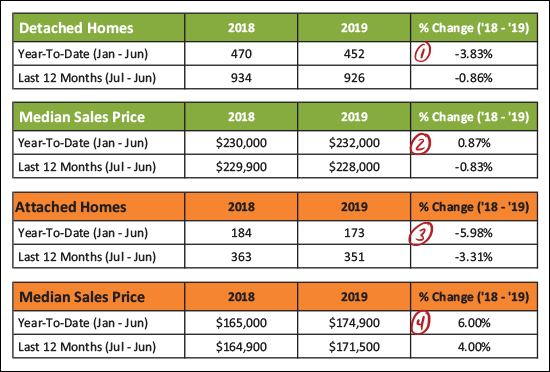 The green chart above is detached home sales, and the orange chart is attached home sales, and here's how things break down...
And now, the pretty graphs... 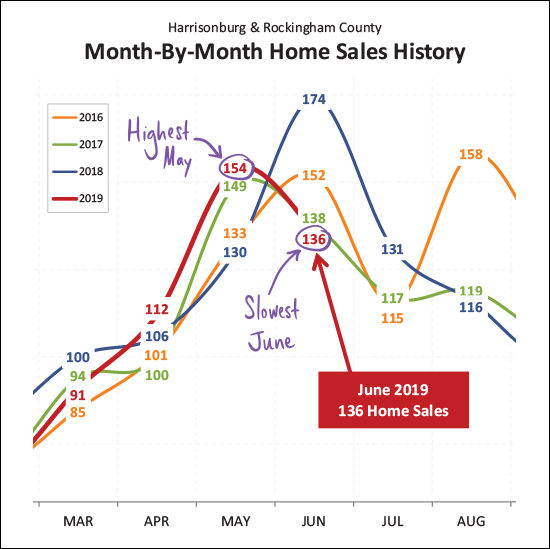 What a roller coaster! As shown above we just experienced the HIGHEST month of May home sales in the past few years, and then the LOWEST month of June home sales in the past few years. So, right, hard to conclude much there -- other than that May and June are some of the busiest months for home sales. Looking ahead, hopefully we'll see a nice mid-range July -- how about 120 or 125 sales? 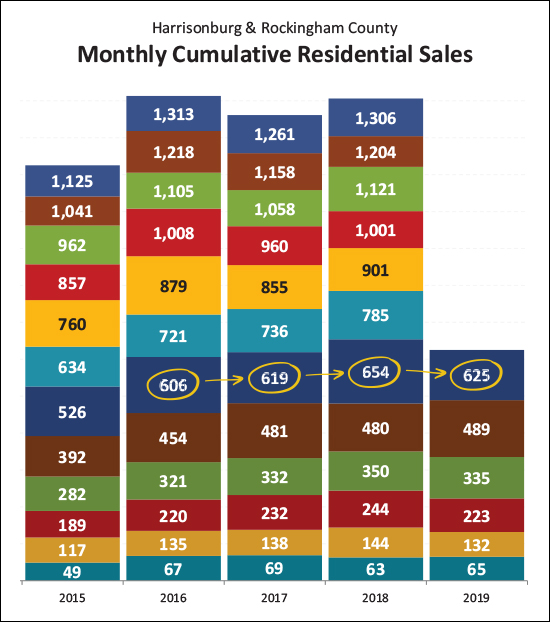 I use the graph above to see how we're doing in the current year as compared to the prior four years. As you can see, the 625 home sales in the first half of this year is about on par (above two, below one) with the past three years when we have ended up with 1250+ home sales. So, if I had to guess, we'll probably see between 1250 and 1300 home sales in total this year. 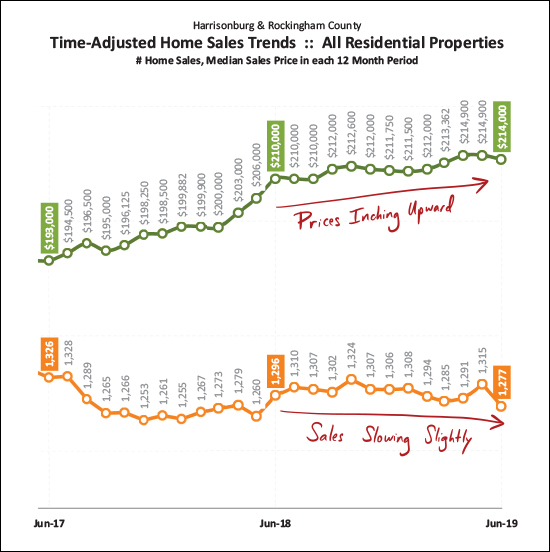 The graph above is the best indicator of overall long term trends. Each data point reflects 12 months of sales data. As you can see, the pace of home sales (orange line) has been declining slightly over the past year -- while the median price of those home sales has been inching upwards to its current level of $214,000. 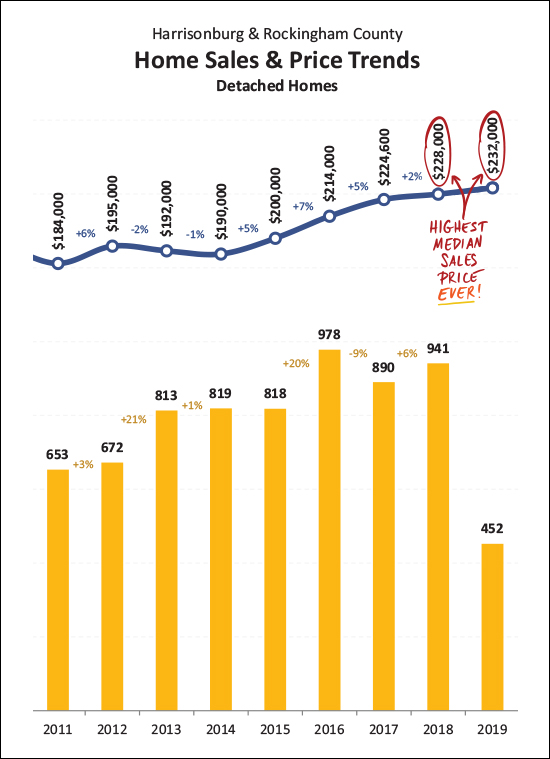 I'm throwing this one (above) in for fun - because I haven't highlighted this fact lately. The median sales price of detached homes is $232,000 thus far in 2019, and was $228,000 in 2018. Both of these median sales prices are/were the highest median sales price we have seen for Harrisonburg and Rockingham County -- ever! We've come by these prices slowly and steadily over the past five years. 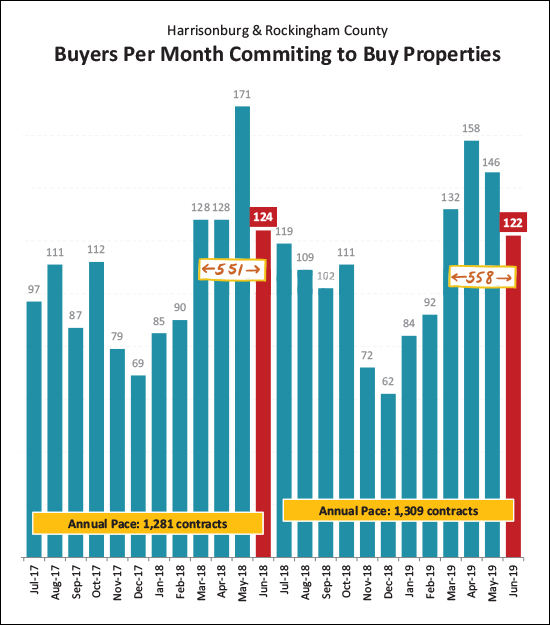 Those new contracts, they keep getting signed! A total of 122 properties went under contract in June 2019 as compared to 124 last June -- and when we look at the March-June timeframe, we find 558 contracts this year and 551 last year. As such, this year's Spring/Summer buyers (and, incidentally, sellers) are certainly keeping pace with last year at this point. 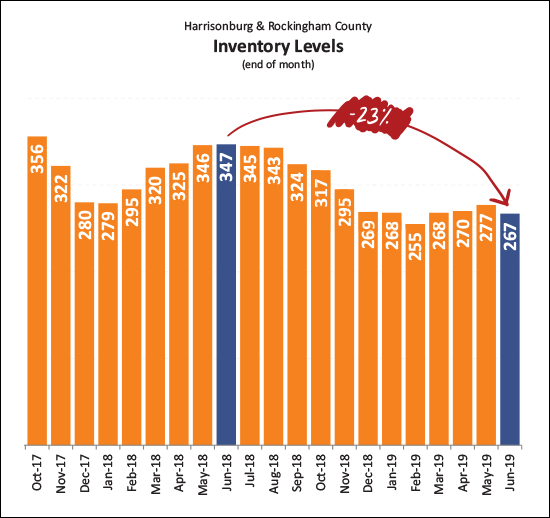 And what are those buyers buying? Well, it seems that they have fewer, and fewer, and fewer choices at any given point in time. As shown above, current inventory levels (267 homes for sale) are 23% lower than they were a year ago -- and just about as low as we saw inventory levels drop over this past Winter!?! Well priced, well prepared, well marketed new listings are going under contract quickly partially because of how few options buyers have these days. 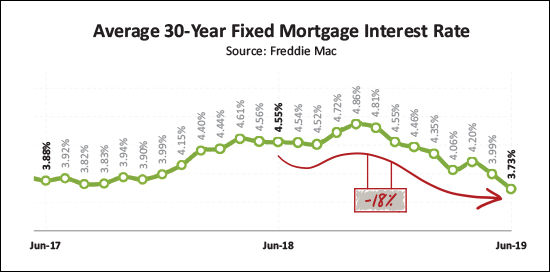 Those buyers who are fortunate enough to secure a contract on one of the few available listings are super fortunate to find astoundingly low mortgage interest rates! Over the past year, the average 30-year fixed mortgage interest rate has fallen 18%, down to its current level of 3.73%. I didn't think we'd see rates below 4% after they soared up to 4.5% a year or so ago - but today's buyers are certainly enjoying locking in some low housing payments given these low rates! Let's pause there, folks. Hopefully that gives you a good general sense of what is happening in our local housing market. And as always, if you have follow up questions about YOUR portion of the local housing market - based on price range, neighborhood, property type, etc. - just let me know! SELLERS -- even though it is a seller's market in just about every price ranges right now, you must still focus on price, condition and marketing. For further reading on buying or selling in this area, check out.... | |
All Square Footage Is Not Created Equally |
|
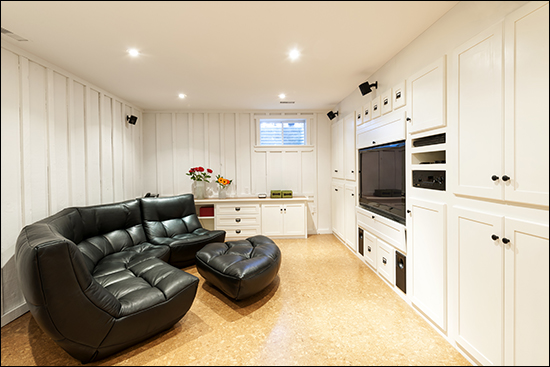 So -- if your neighbor's 2400 SF, circa 2000, 4 BR, 2 BA home just sold for $300K... Then it's probably reasonable to think that your 2400 SF, circa 2000, 4 BR, 2 BA home will also sell for $300K, right? After all, you have made the same updates (systems and cosmetic) over time -- and you're on the same street!
Well, maybe -- but maybe not! Consider the possibility that....
These two homes will not be seen as having an equivalent value -- not by potential purchasers and not by an appraiser. Above grade square footage has a higher value attached to it -- both specifically by appraisers, and generally by purchasers. Even if all of the other factors (condition, age, location, bedrooms, bathrooms) are the same between two houses, if one has a significant portion of the square footage in the basement then it will be seen as less valuable than the home that has all of its square footage above grade. | |
City Home Buyers Have Fewer and Fewer Choices (at any given time) |
|
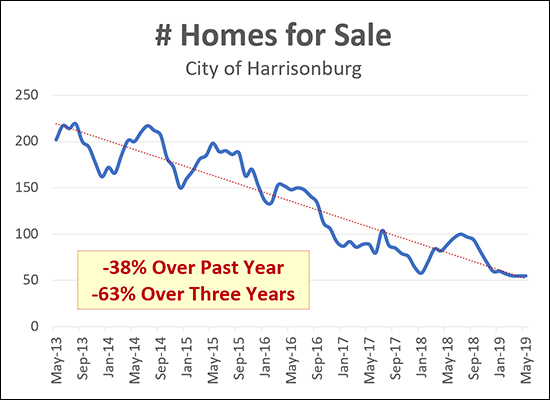 If you are a home buyers (or would-be home buyer) in the City of Harrisonburg, it can be a frustrating time to try to find that "right home" given the extremely low inventory levels. With only 53 homes currently on the market (and only 33 of those being detached homes) you might be waiting longer than you'd like to find a home that can work for you. This is a recent phenomenon, however, as the current inventory levels are 38% lower than a year ago and 63% lower than three years ago. Sadly, I don't think we're likely to see a significant increase in City housing inventory levels unless we (unexpectedly) see new homes starting to be built in the City. So, as a City home buyer -- be prepared to be patient, and then act quickly when the right house comes on the market! Read more about our local housing market in my monthly market report. | |
March thru May Contracts Strong, Again, in 2019 |
|
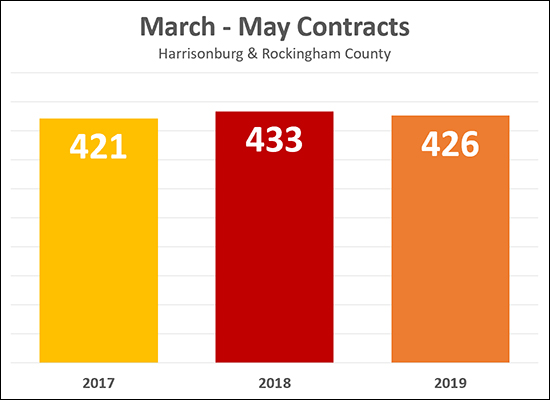 March, April and May are always VERY busy months of buyers (and sellers) signing contracts. This year was no exception. As you may recall from last year we had a record-breaking month of contracts in May -- with 171 contracts signed -- the highest number of contracts ever having been signed in any month, ever, in Harrisonburg and Rockingham County. And this May was certainly a bit slower -- with 143 contracts compared to last May's 171. But this April we saw an astonishing 158 contracts -- compared to last April's 128 contracts. So -- in the end, we came up just short of last year when looking at March through May contracts -- with 426 contracts signed compared to 433 last year. Despite low inventory levels, this year is shaping up to be just about as active of a year as last year for our local real estate market. | |
Will All 264 Currently Listed Homes Be Appealing To You? |
|
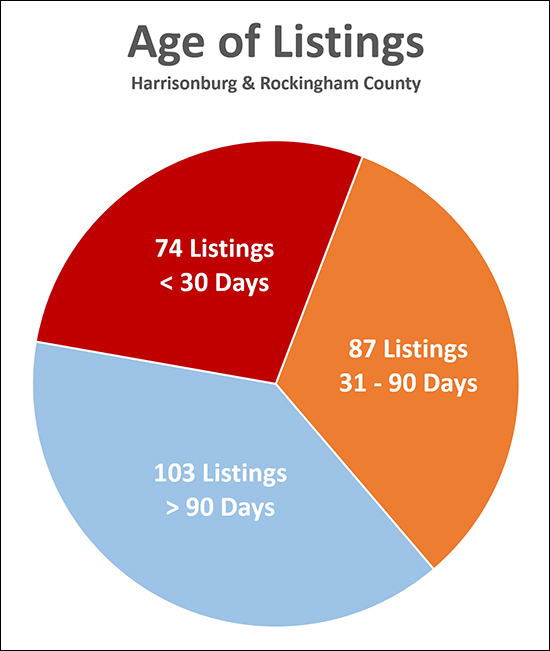 If you are entering the market to buy a home, the number of homes you will have to choose from will vary widely based on what you are looking for in a new home. Some buyers have a very narrow scope and find themselves on a prolonged hunt for what seems to be an elusive or mythical home. Some buyers find plenty of options, evaluate quite a few, make a decision and move forward with an offer. However -- keep in mind that as you consider the 264-ish homes currently on the market for sale, that some of them have been on the market for 3 months, 6 months, 9 months or even longer. The freshest of fresh listings are those that have come on in the past 30 days -- which (this time of year) is less than 100 of the 264-ish homes currently listed for sale. Depending on your time frame for buying, and the narrowness of your scope, sometimes it makes sense to quickly evaluate the current options -- and then to wait and see what new and exciting listings will be coming on the market in coming days and weeks. Steps to get started include talking to a lender to get a sense of your target price range, and then chatting with me (in person, by email, by phone) so that I can also be keeping an eye out for suitable properties for you. Learn more about the home buying process at...  Keep up with new listings at ... | |
Second Highest Month of Contracts In Three Years |
|
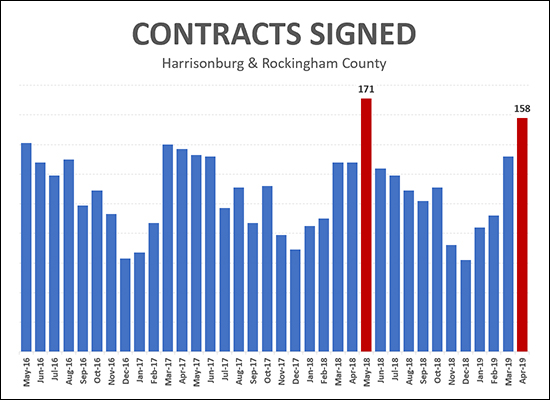 April 2019 was a busy month for buyers (and sellers) with 158 contracts being signed for the sale of homes in Harrisonburg and Rockingham County. This is the second highest monthly rate of contract signing seen anytime in the past three years! It was topped only by last May when 171 contracts were signed. This is bound to lead to strong months of closed sales in May and June. Find out more about our local real estate market by reading my most recent monthly market report. | |
Highest Month of April Home Sales in 10 Years |
|
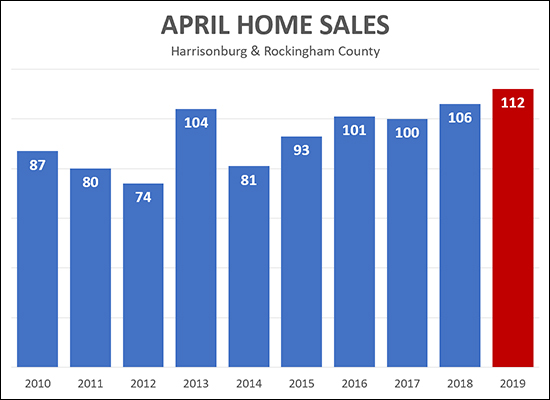 It's been a while -- more than 10 years -- since we've seen so many home sales in a month of April. As shown above, the 112 sales seen in April was higher than any month of April all the way back through 2010. There were a few years (2006-2008) where we saw more sales than that -- which was during the real estate boom when median sales prices were (unrealistically) increasing by more than 10% per year. Find out more about our local real estate market by reading my most recent monthly market report. | |
Home Sales and Contracts Surge in April 2019 |
|
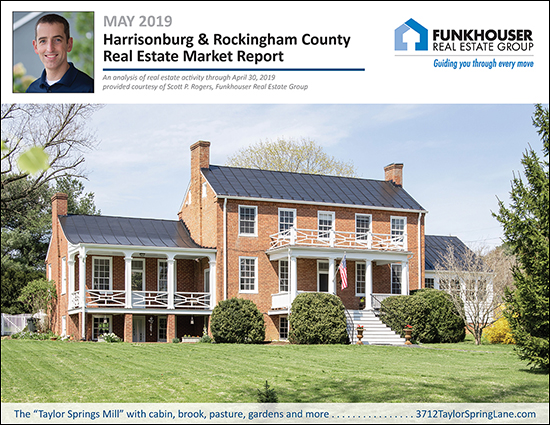 After a somewhat slow start to 2019, the local real estate market has now picked up speed in April! But before we start looking at the data, two quick links for you...
Now, onward! 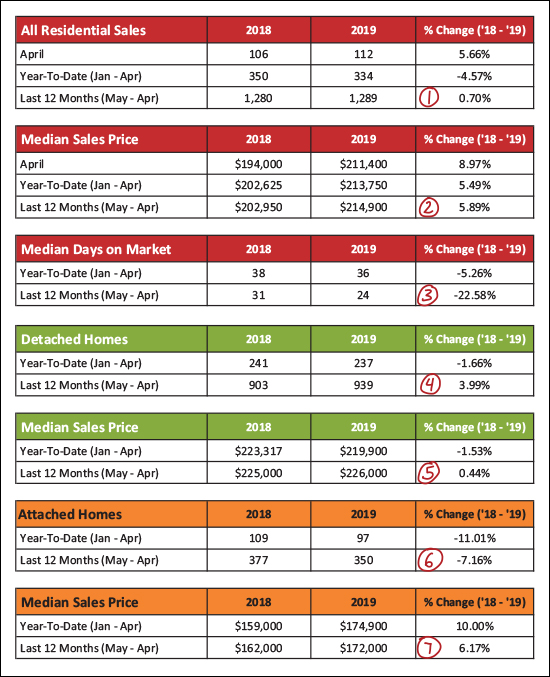 Lots going on above...but here are the high points...
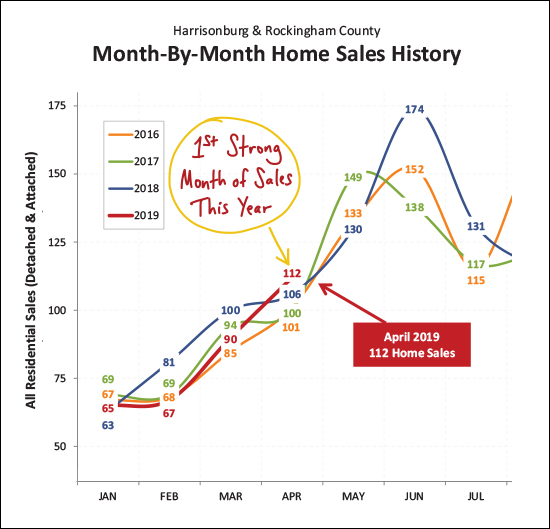 OK - here's what I was talking about earlier. January, February and March sales were simply nothing to write home about. This February was the slowest February out of the past four years. January and March were the 3rd slowest such months from the past four years. But April -- wow! Home sales surged in April, up to 112 home sales -- the best month of April seen in the past four years! 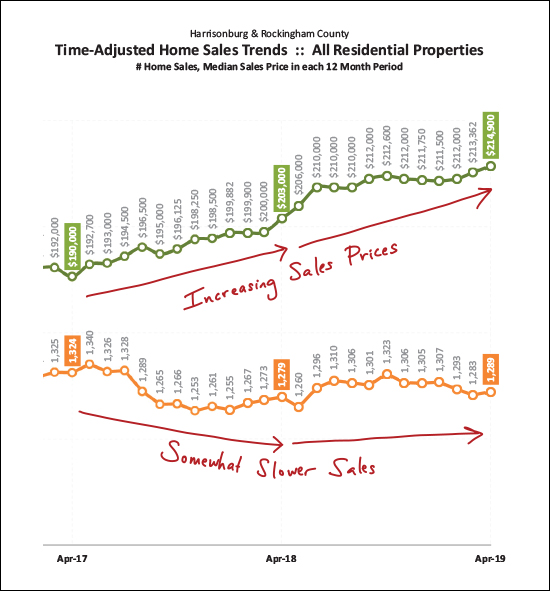 Zooming out from the granular data, this graph looks at long term trends -- the slowly shifting 12-month trend line for the pace and price of home sales. As you can see, sales prices have been increasing despite somewhat slower sales. 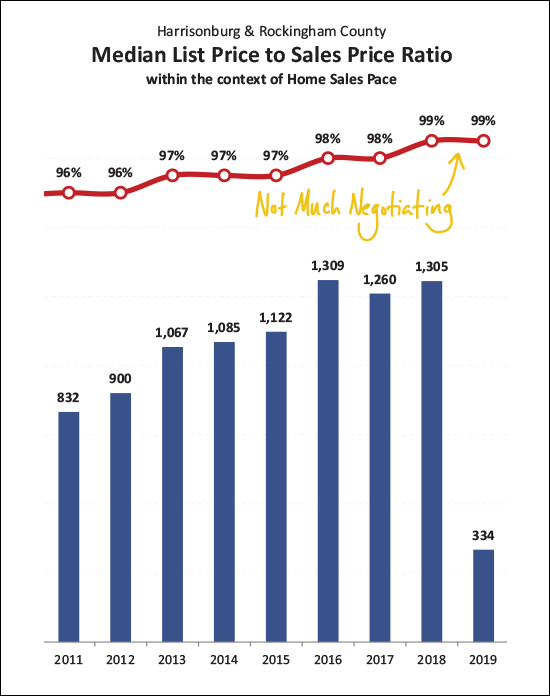 It shouldn't be too much of a surprise that stable sales, rising prices, low inventory levels and low days on market are leading to very little negotiating on price. Homes are selling at a median of 99% of their list price. This means that half of homes are selling for 99% or more of their list price. 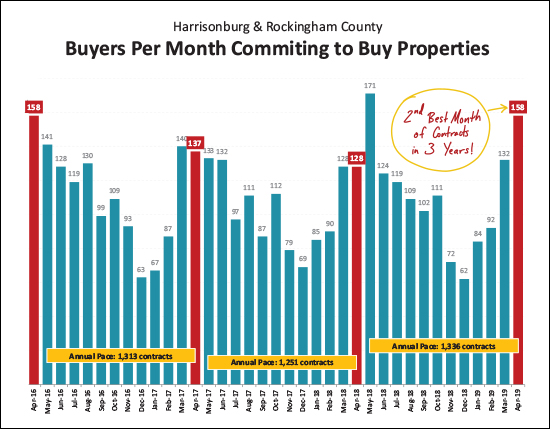 OK - this one was a bit surprising. And I squished all of the data down so far to fit a large context on the graph above that the image is not quite as crystal clear as I'd like it to be. But the message is quite clear - buyers came out in full force in April 2019 -- the 158 contracts signed last month was the second highest month of contracts seen in the past three years! That said - prepare yourself to be at least a bit disappointed next month. I think it's relatively unlikely that we'll be able to see a spike of contract activity all the way up to the showing 171 contracts that were signed last May!? 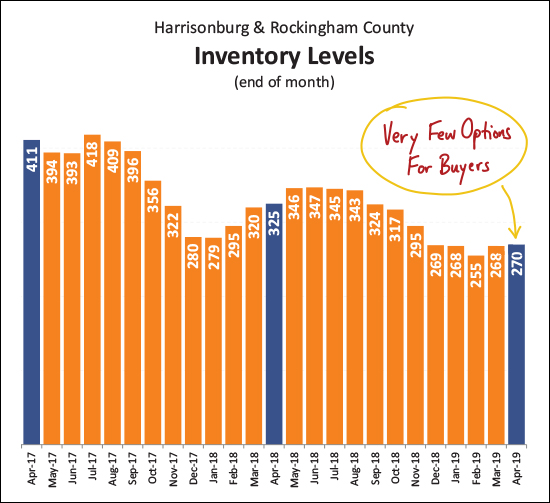 Home buyers like choices, right? Well, right now, they don't have many. In all of Harrisonburg and Rockingham County there are only 270 properties listed for sale. This number has been steadily declining over the past few years -- and the supposedly busy Spring of plenty of listings has not been able to increase these inventory levels -- probably because buyers keep snapping the new listings up as soon as they hit the market. 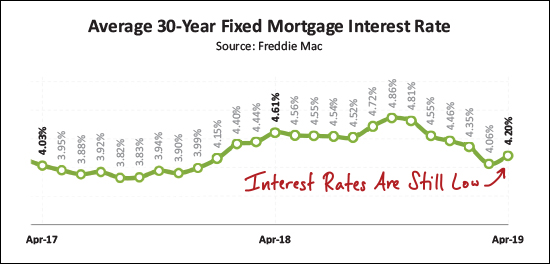 As some welcome news for buyers who are able to find a home to buy - they're able to finance that purchase at a relatively low interest rate! After having risen all the way up to 4.86% (it seemed like 5% was bound to be seen) mortgage interest rates have now dropped all the way back down to the low 4% range. This gives buyers the ability to lock in low monthly housing costs for the long term! OK - we'll cut it off there for now - though there is plenty more that you can scroll through in the PDF of my full market report. My guidance to local soon-to-be home buyers and sellers remains consistent... SELLERS -- even though it is a seller's market in just about every price ranges right now, you must still focus on price, condition and marketing. For further reading on buying or selling in this area, check out.... | |
Sales Slow, Prices Plateau, Contracts Console in First Quarter 2019 |
|
 Just like that - the year is already more than 25% behind us. Looking back over home sales activity during the first quarter we find a mixed bag of market indicators. Before we delve in, two quick links...
Now, on to the data... 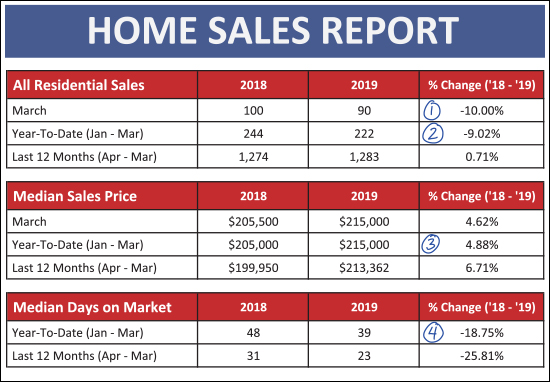 As shown above...
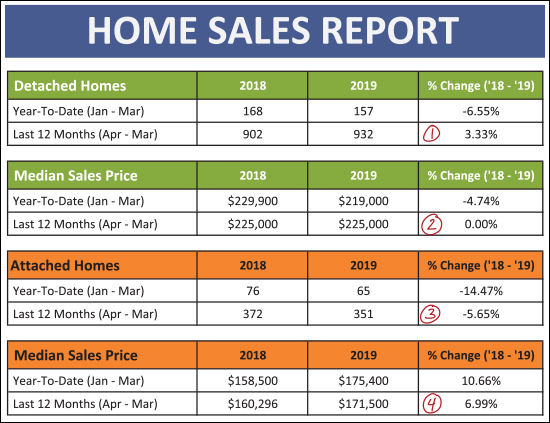 The green rows above are showing sales activity for detached ("single family") properties. The orange rows are for attached properties - which includes duplexes, townhouses and condos.
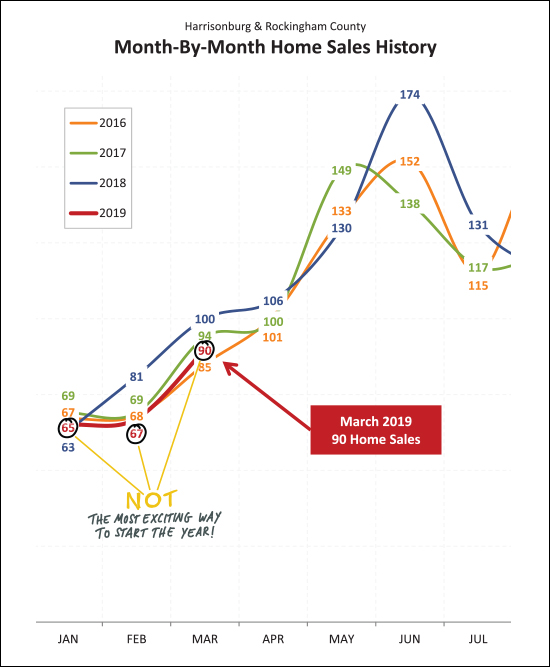 Here (above) is a visual of the not-so-exciting way that this year has begun when we look at monthly home sales compared to the same months in recent years. February home sales were the slowest out of the past four years - and January and March were the second slowest. So - clearly - a slow start to the year - but keep on reading for some news on contract activity. 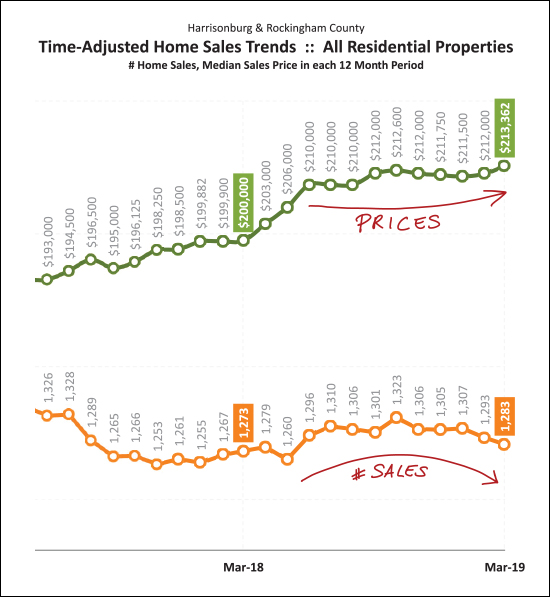 The graph above explores long term (rolling 12 month periods) trends in home sales and prices. Over the past year we have seen sales start to trend slightly downward - while prices have trended slightly upwards. Nothing drastic in either direction, really, but those are the general directions we're seeing the market move. Of note - the rising prices shown above have more to do with a change in the mix of what properties are selling (more higher priced detached homes and fewer lower priced attached homes) more than an actual increase in values. As shown a bit ago (scroll up) the median sales price of detached homes has remained flat over the past year. 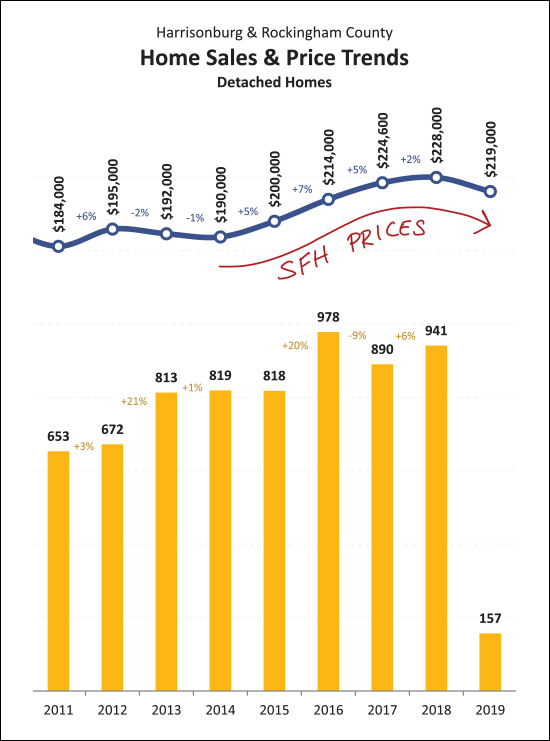 Here's a slightly more depressing view of value trends for detached homes. Over the past few years the increase in sales prices has been decreasing (+7%, +5%, +2%) and with data only from the first quarter of 2019, the median sales price has actually declined. I am guessing that we'll actually end up with a net gain in median sales price once all 2019 data is in the books, but for now, prices are appearing slightly soft when just viewing first quarter data. 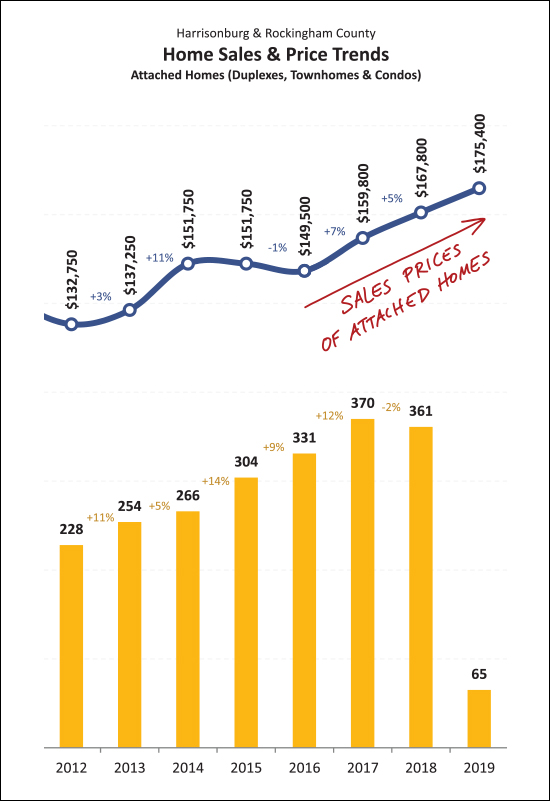 But if you're selling an attached (duplex, townhouse, condo) property - the state of the market is looking promising! As shown above, the prices they just keep on rising. Part of this is likely a result of constrained supply (not enough new townhouses being built) amidst increasing demand. This is keeping sales prices on the rise and that doesn't show signs of stopping in the near term. 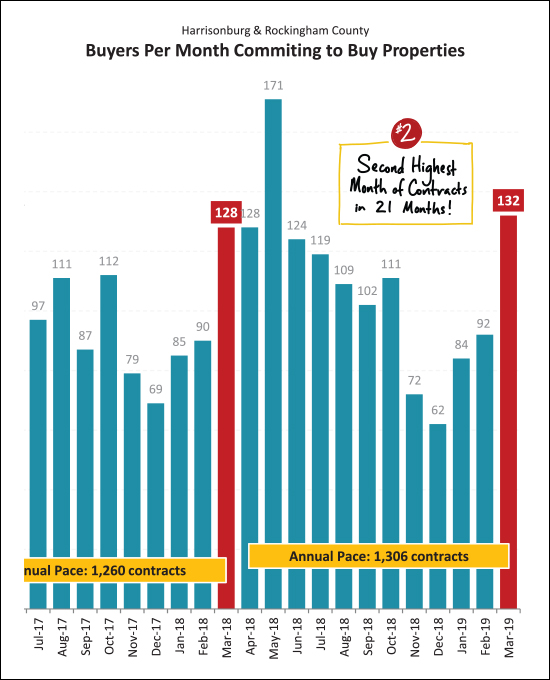 OK - hopefully you read this far - because here is the silver lining of the first quarter of our local housing market. Despite slower sales in the first quarter, contract activity was STRONG in March 2019. In fact -- it was the second strongest month of contract activity in the past 21 months! This should lead to strong months of closed sales in April and May, and hopefully this is just the beginning of a strong Spring and Summer of contracts being signed. 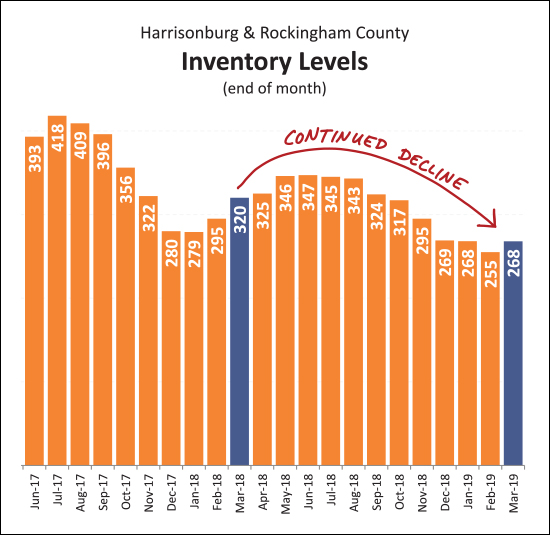 For the past few years I kept saying I didn't think inventory levels could drop any further. Well, they did, they have, and somehow the market keeps on moving. As shown above, despite a monthly increase in inventory levels between the end of February and end of March, we have seen another year-over-year decline in the number of homes on the market. Unless we see a significant growth in new construction in this area, these low inventory levels are likely to remain the norm for the next few years. 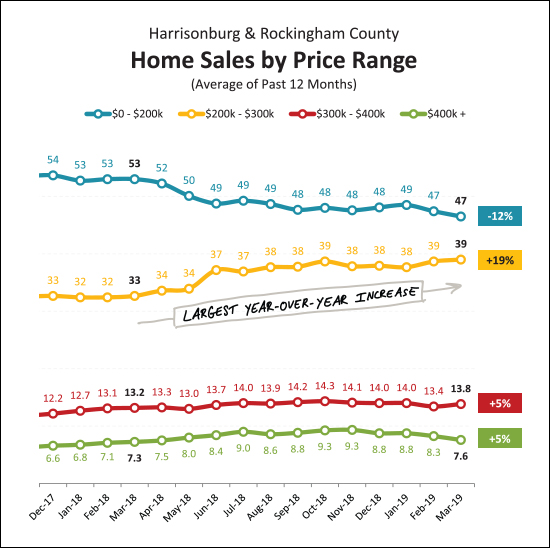 And here's a bit of trivia for you -- the fastest growing price segment of our local housing market is --> the $200K - $300K price range. There has been a 19% increase in sales of homes between $200K and $300K, which is the largest increase of any of the price categories shown above. 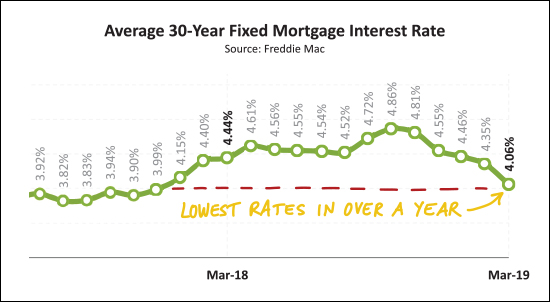 What brought on the strong surge of contract activity in March 2019? Could it be the sudden drop in mortgage interest rates, down to an average of 4.06%? Probably not just that -- it was likely also a surge in new listings combined with anxious buyers who had seen very few options over the winter months. But the low mortgage interest rates likely helped and were an added bonus to anyone making a decision to commit to a home purchase during March 2019. Well, folks, that's a wrap. You read to the end of my overview of our local housing market. You can delve into even more details by downloading a PDF of the full report here. And as always, if you have questions about our local housing market feel free to be in touch. My guidance to local soon-to-be home buyers and sellers remains consistent... SELLERS -- even though it is a seller's market in just about every price ranges right now, you must still focus on price, condition and marketing. For further reading on buying or selling in this area, check out.... | |
Home Buyers Were Busy In March 2019 |
|
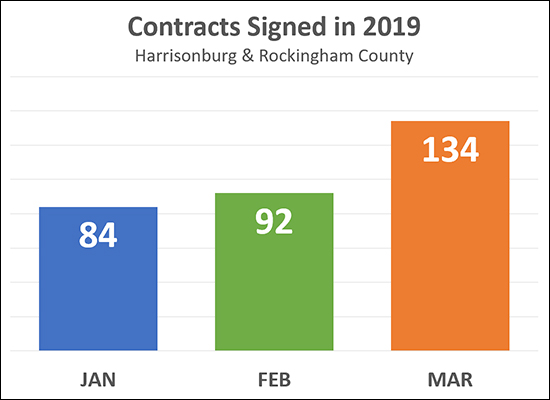 I'll publish my full monthly market report later this week, but wow, home buyers were busy in March! After the usual slow start to the year with 84 contracts in January and 92 in February, things started to pop in March -- with a sharp uptick to 134 contracts. For some context: JANUARY: This Year = 84 contracts Last Year = 85 contracts FEBRUARY: This Year = 92 contracts Last Year = 90 contracts MARCH: This Year = 134 contracts Last Year = 128 contracts So -- thus far it seems that this may be another robust year of home sales in Harrisonburg and Rockingham County. | |
What To Do When Recent Comparable Sales Prices, Tax Assessments, Zestimates and Competing List Prices Vary SIGNIFICANTLY |
|
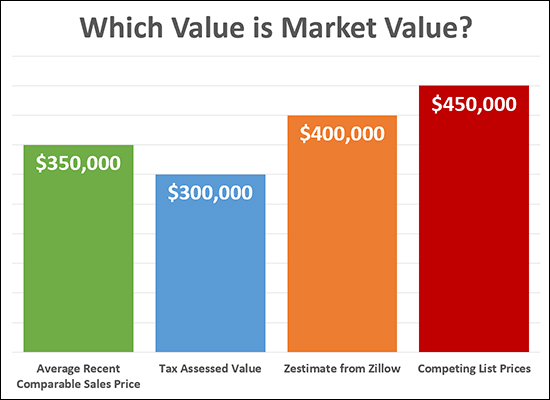 Which one of the values above is the "market value" of the imaginary home in question? The answer is -- the GREEN bar -- a home's value is most often determined by how much other buyers have recently paid for similar properties. A would-be buyer might WANT the home's value to be the "tax assessed value" -- but that might be quite a bit lower than the recent sales prices -- so a home's tax assessed value is not necessarily the home's market value. A would-be seller might WANT the home's value to be the "Zestimate" from Zillow -- but that might (often, usually) vary quite a bit from a home's market value -- so a home's Zestimate is not necessarily the home's market value. A would-be seller might REALLY WANT the home's value to be the same as the list price on competing properties currently for sale -- but those listings might sit on the market forever with unreasonably high list prices -- so the list price of competing listings is not necessarily the home's market value. Now, this scenario would be much easier... 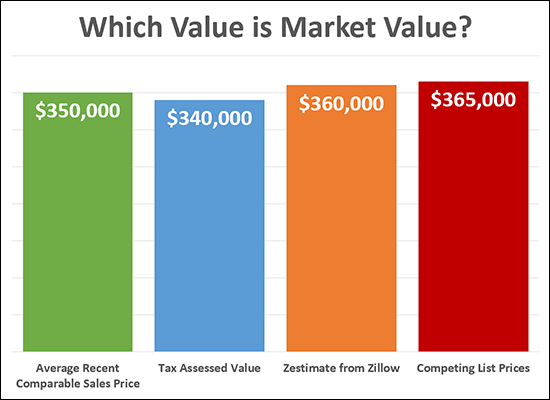 As you can see here, there isn't too much of a difference between the different values -- so it matters a bit less which of the value perspectives we use when estimating a likely sales price and planning for a potential list price. But in the case where there is quite a bit of separation in these different value perspectives -- stay focused on what other buyers have recently paid for similar properties -- this alone is your best guide as to what you can/should expect the next buyer to be willing to pay for your house. | |
When Will We Start To See a Surge of Spring Buyers? |
|
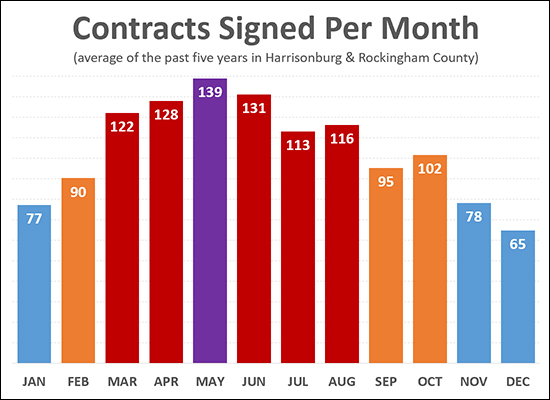 When will we see buyers? A short answer -- now, or very, very soon! The graph above shows the average number of buyers per month over the past five years. As you can see, above, buying activity starts creeping up as soon as February, but really starts to pop in March (this month!) and then keeps on increasing in April before a typical peak in May. Read more about recent market trends in the most recent version of my monthly housing market report, found online....  | |
Home Sales Slow In February But Contract Activity Increasing |
|
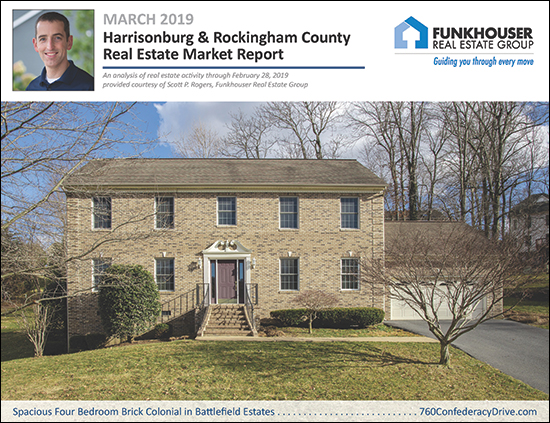 Happy Spring! Yesterday's warm sunny afternoon was a welcome reprieve from our recent frigid temperatures - and it looks like we'll have continued warm-ish (or at least not frozen) days this week as well. And how about that local real estate market? Is it heating up as well? Breaking out of the winter doldrums? Well, maybe not quite - though technically this report only covers real estate activity through the end of February, so maybe we'll have to wait one more month for some more exciting news. But buckle up, and let's flip through the latest local real estate news to catch up on where things have been and where we're likely headed. Oh - but two quick notes, first:
And now, here we go... 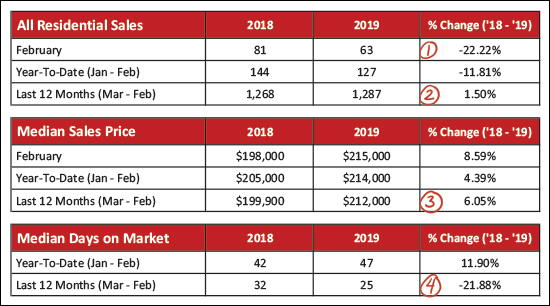 As seen above...
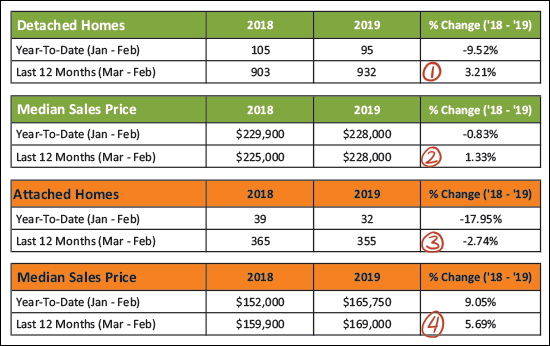 OK - lots going on above - this is where I break things down between detached homes (green) and attached homes (orange) -- where "attached" homes are townhouses, duplexes and condos.
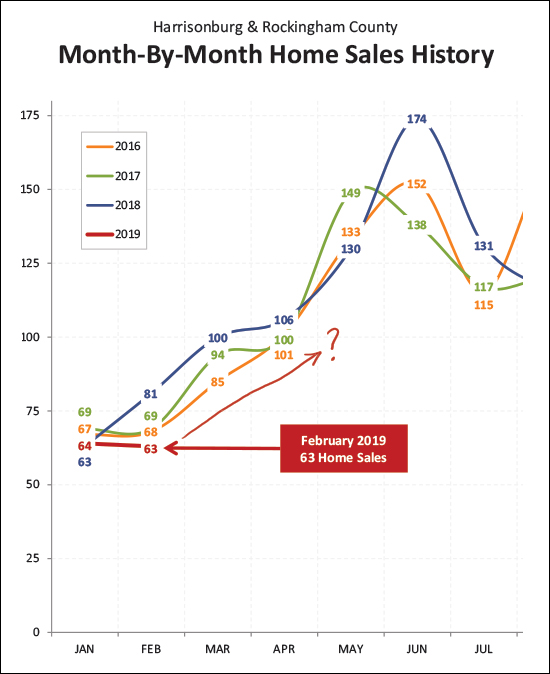 The red line above shows the sales trajectory for 2019 -- January sales (64) were right in the middle of the pack as January goes -- but February sales (63) were much slower (lower) than last year (81) though not too far off of the prior two years (68, 69). So - where in the world do we go from here? Do we see a relatively disappointing March with only 80 home sales (lowest since prior to 2016) or do things bounce back up to 95 or 100 home sales? Time will tell - but thus far the market performance has not been overwhelming in 2019 when it comes to the number of homes that are selling. 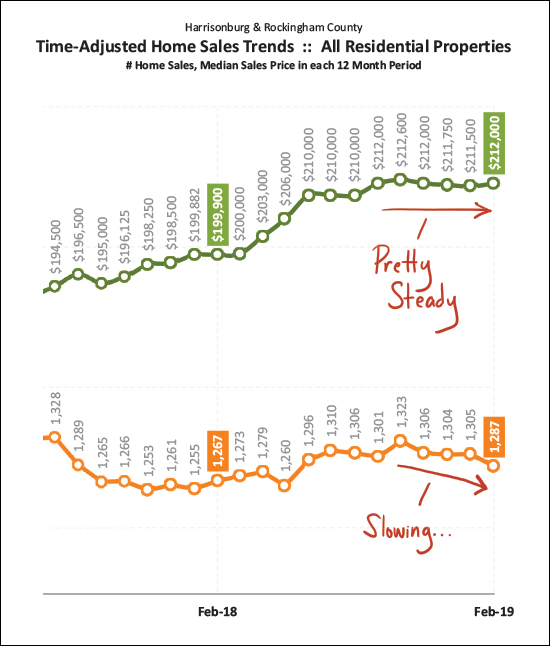 Now, looking beyond the month-to-month trends -- this graph (above) looks at a rolling 12 month timeframe to even out some of the ebbs and flows of market activity. The top (green) line shows that median sales prices have been relatively steady for the past six months -- hovering between $210K and $213K. The bottom (orange) line shows that the annual pace of home sales has actually been slowing in recent months. If home sales keep slowing down, eventually that could have an impact on sales prices, but for now they are holding steady. It is also certainly possible that the slowdown in home sales has more to do with a lack of available inventory than it does with any decrease in buyer interest. 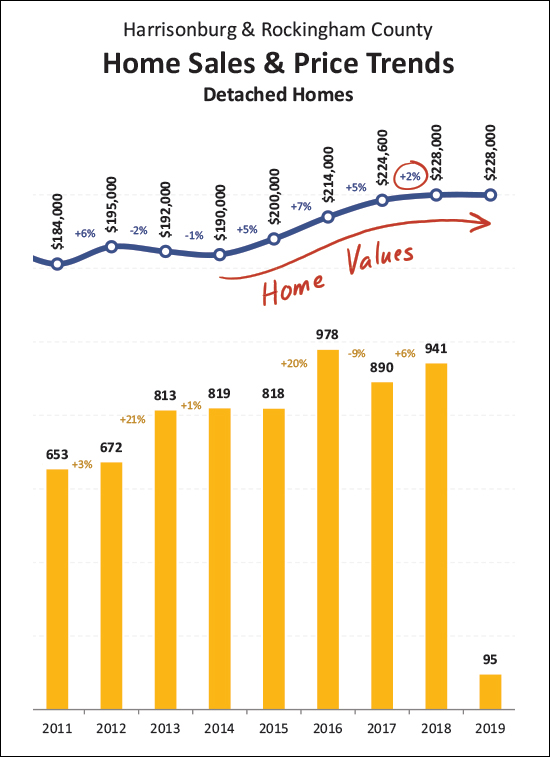 Here (above) is another pretty graph to show the increasing home values in Harrisonburg and Rockingham County over the past few years. Though - curb the boundless enthusiasm for a moment - the annual increase was only 2% in 2018, down from 5%, 7% and 5% the prior three years. So -- 2019 will be a telling year -- will values hold steady, or increase slightly, or decline slightly? Stay tuned -- it's early yet. 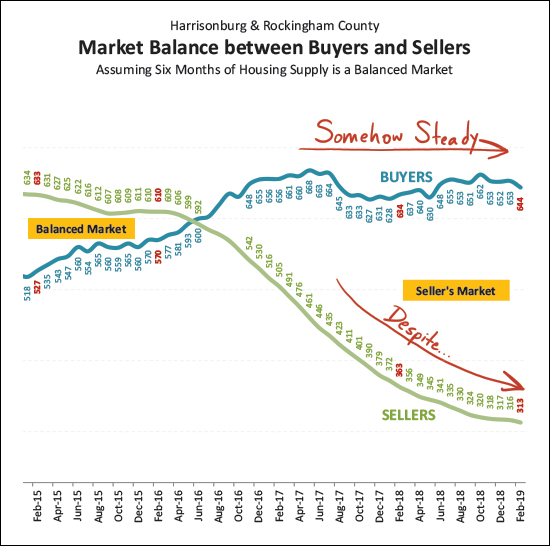 And this (above) might be the missing piece of the puzzle. Buyer activity (blue line) is somehow staying steady-ish (except dipping a bit over the past few months) despite the quickly falling inventory levels (green line) over the past three (four!) years. I've said it recently but I'll say it again - it can be a fun time to be a seller right now - but it's not so fun to be a buyer. You'll be choosing from an ever smaller number of available properties, and potentially competing with ever more buyers. 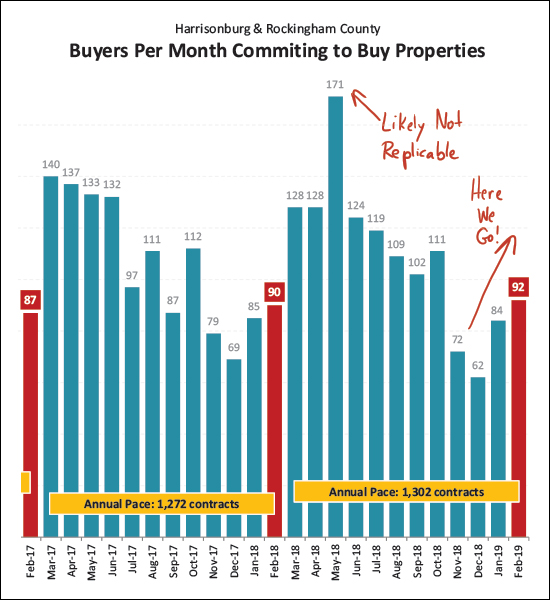 Here's one graph of optimism as it relates to the next few months -- contract activity is on the rise with 92 contracts signed in February 2019, up from 90 last February and 87 the February before that. So - we will likely see a solid month of sales activity in March, and hopefully in April if we have another strong month of contracts in March. But, just to prepare you pretty early here -- I think it is HIGHLY unlikely that we'll see a month with 171 contracts like we saw last May. 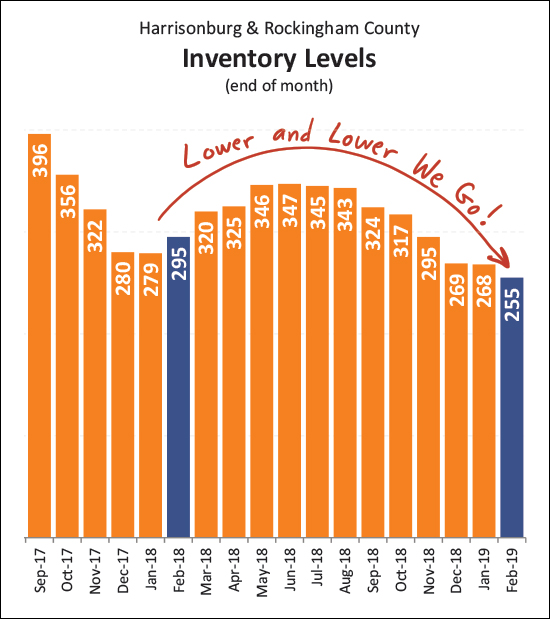 And here is a visualization of those inventory woes I was describing earlier. The number of homes for sale has been creeping ever lower, hitting yet another new low at the end of February with only 255 homes for sale. Hopefully, maybe, possibly, we'll see that start to drift upwards as we get into March, April and May?? 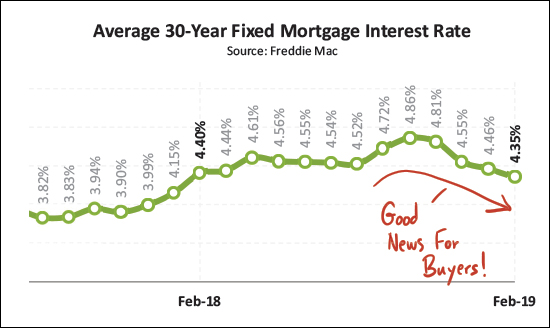 If buyers have anything (anything!?) to be glad about -- it's that their mortgage rate will likely be lower now than it would have been a few months ago. After average rates drifted all the way up to 4.86% -- and seemed to be ready to get back to 5% -- they started floating back down to their current average of 4.35%. If buyer activity increases over the next few months, they'll be enjoying more affordable financing of their home purchase. OK - admittedly - that was a lot. Kudos to any of you who made it all the way to the bottom of this commentary. Many trends stay relatively similar from month to month but it's always good to take a fresh look to give us a context to help make informed real estate decisions moving forward. If you're thinking of buying or selling soon... SELLERS -- even though it is a seller's market in just about every price ranges right now, you must still focus on price, condition and marketing. For further reading on buying or selling in this area, check out.... | |
Are Home Sellers Waiting For Warmer Weather? |
|
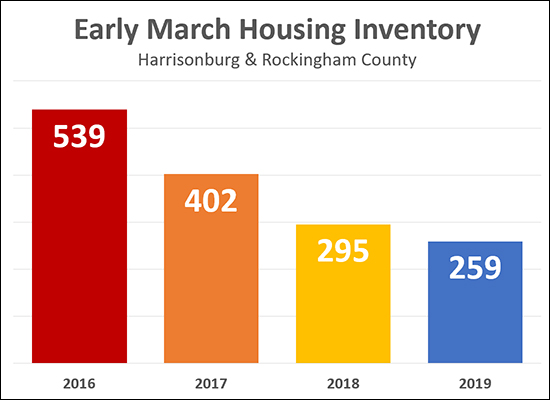 OK, I know it's not Spring yet, but it's March! We're supposed to start seeing many more new listings coming on the market - finally - for all of the buyers who have been patiently waiting for more inventory from which to choose. But, it's just not happening yet this year. Or at least not at scale. Maybe it's the snow (despite a lack of accumulation) or maybe the frigid temperatures (looks like a cold week ahead) but whatever the cause, we're seeing much lower early March inventory levels as compared to the past few years. So, maybe mid-March? Maybe April? When will we finally see an increase in listing inventory? It hasn't happened yet! Sellers who are thinking of selling in April - maybe March is your month? Get ahead of the game -- avoid the competition! | |
Local Real Estate Market Holds Steady in January 2019 |
|
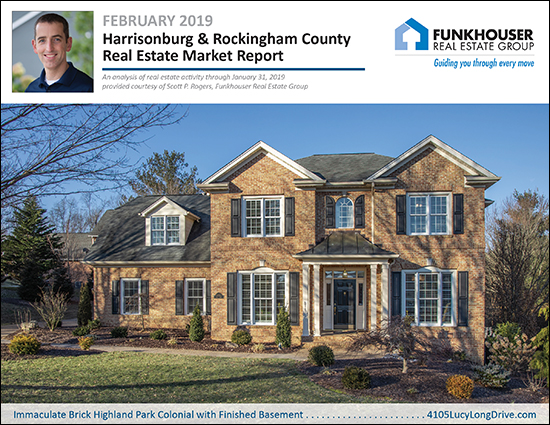 I hope you are finding time to enjoy this one sunny day this week - amidst clouds, rain and snow the rest of the week. Perhaps the bright news in this update on the real estate market will buoy your spirits when the clouds return tomorrow. :-) But before we dive into the data, be sure to check out the home pictured above, an immaculate brick Colonial in Highland Park, by visiting 4105LucyLongDrive.com. Oh, and as per my usual habits, you can skip right to a PDF download of the full market report here, or read on for my color commentary... 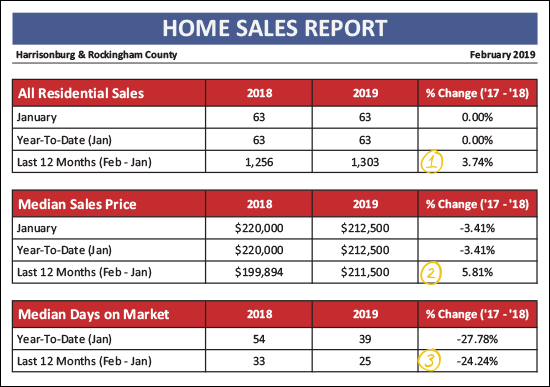 OK - starting off with an evaluation of the market as a whole, the chart above shows us that the exact same number of buyers (63) bought in January 2019 as bought in January 2018. Thus, it was the slowest month of the year - but exactly as slow as things started last year. (1) When we look at a longer timeframe (Feb 2018 - Jan 2019) we see that 1,303 buyers bought homes in Harrisonburg and Rockingham County -- which marks a 3.74% increase in buyer activity as compared to the previous year. (2) The median sales price of the homes that have sold in the past 12 months was $211,500 -- which is 5.81% higher than the median sales price during the prior year. So, perhaps prices are on the rise. Or, perhaps different homes are selling. Read on for more on this. (3) Homes are selling quickly -- QUICKLY! -- with a median "days on market" of 25 days over the past year, a 24% drop from 33 days the prior year. Now, let's break things down between detached homes and attached homes. Attached homes are townhouses, duplexes and condos... 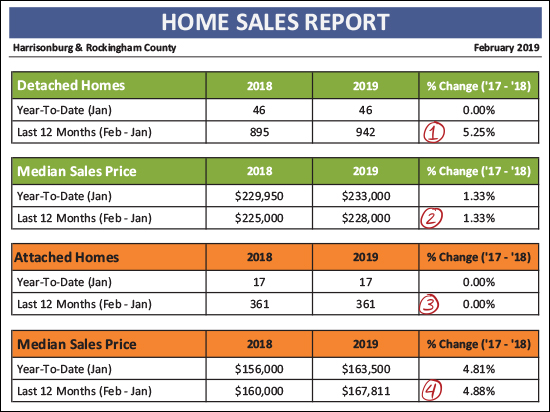 There is a good bit to soak in here, on the chart above, as well. (1) The 942 buyers who bought detached homes over the past 12 months contributed to 5.25% more buyer activity -- for this type of property -- as compared to the previous 12 months. (2) The median sales price of those 942 detached homes was $228,000 -- a whole (not actually that exciting) 1.33% higher than the $225,000 value one year prior. (3) Talk about consistency -- 361 buyers bought attached homes (townhomes, duplexes and condos) in the past 12 months -- exactly the same number as during the previous 12 months. (4) The median sales price of those 361 attached homes was $167,811 -- a full 4.88% higher than the $160,000 value one year prior. 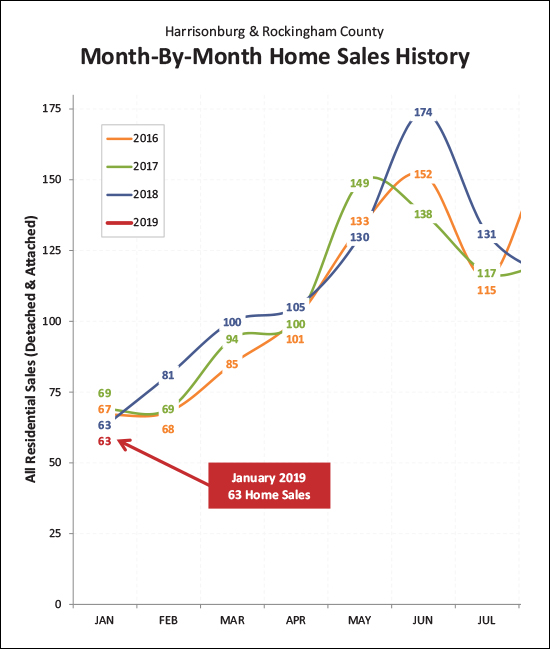 There it is, folks, the start of something great -- maybe? While it's true that January is the slooooowest month of the year for home sales AND this past January was the sloooooowest January seen in the past few years -- it is also true that last year was a near record breaking year of home sales, and we also started out with only 63 home sales in January 2018. So -- stay tuned -- perhaps this will be another vibrant year of sales activity for the local real estate market. 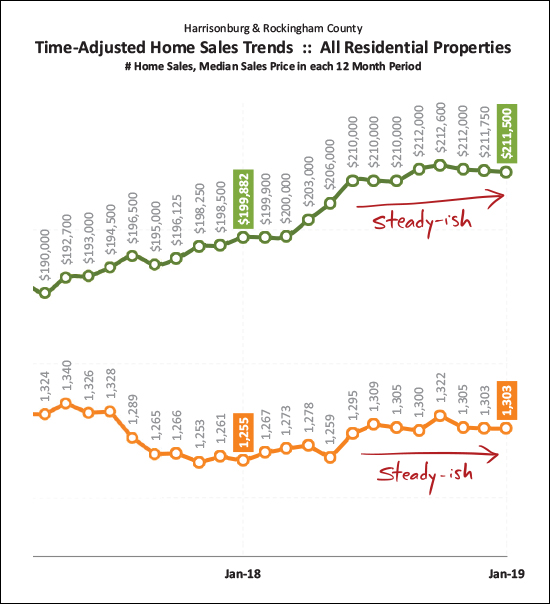 Staying steady - that's all I wish for our real estate market sometimes. The graph above shows a rolling 12 month value for the median sales price and the number of home sales taking place in our local market. You'll note that homes have been selling at a pace of around 1300-ish homes per year for the past six or so months -- and we've been hovering around the $210K-$212K mark for median sales prices. Staying steady-ish isn't too bad. I'd be happy with a 0% - 2% increase in the pace of home sales and a 2% - 3% increase in the price of home sales this year. We'll have to wait a few more months to get a better sense of if that is where we're headed. 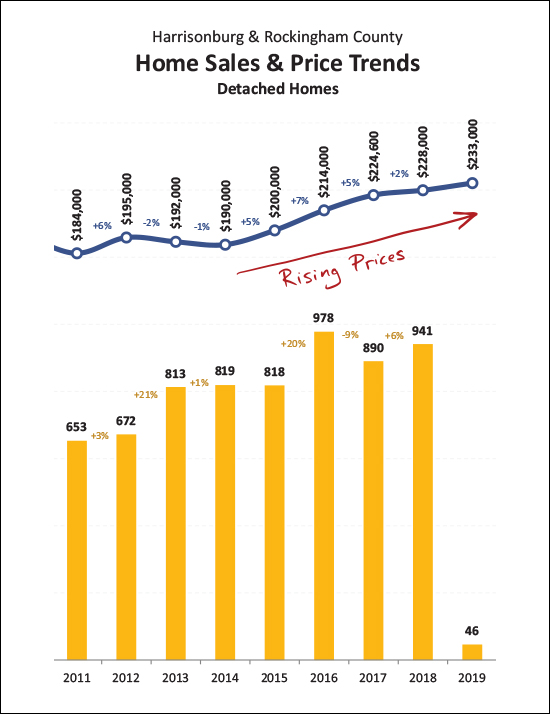 If asked, I think home values have risen by 2% over the past year, and the graph above is why I'm sticking to that number. If you look at all home sales in the area (attached and detached) you'll come up with a higher increase in the median sales price -- but I believe the change in the median sales price of detached homes is the best indicator of trends in market value -- and there was a 2% increase in the median sales price of detached homes between 2017 and 2018. Stay tuned to see how we fare in 2019 as more data keeps coming in. 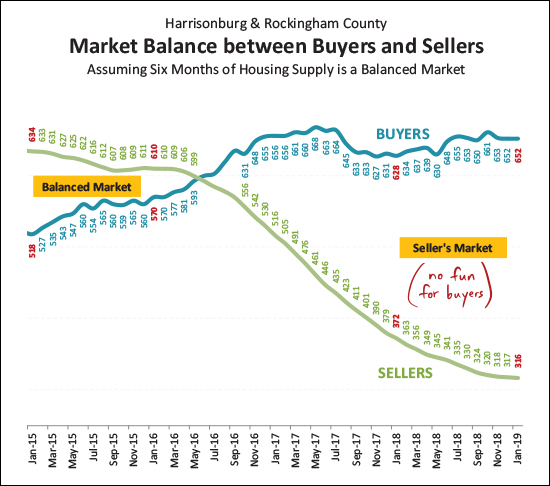 It's a great time to be a seller! As shown above, while the number of buyers in the market has stayed relatively consistent over the past (almost) two years, the number of homes on the market at any given point has continued to decline steadily. As such, this has become more and more of a seller's market. Homes are selling quickly and thus buyers must be ready to pounce on the home of their dreams when it is listed for sale. More on this at the bottom of this note. 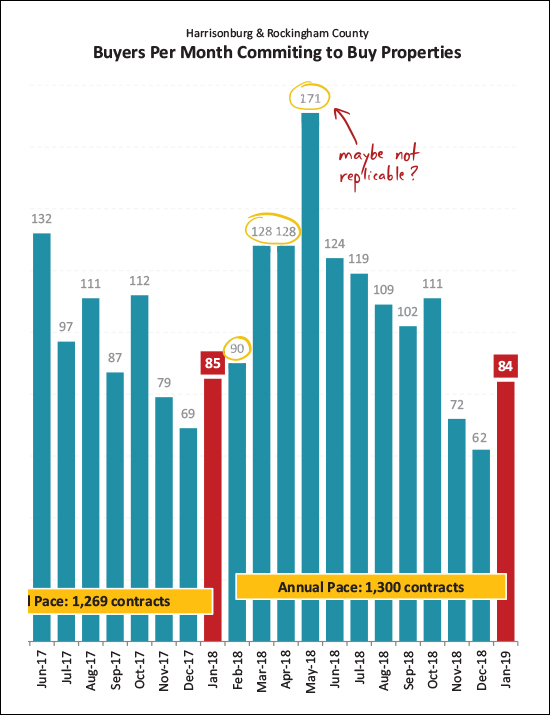 On this graph it might be most interesting to look backwards in order to look forwards. After a predictable mid-80's month of contract activity in January, it seems likely (based on history) that we'll see around that many buyers sign contracts to buy homes in February. But after that, look out! Buyer activity usually starts in earnest in March and April, where you'll see a 45% (ish) increase in buyer activity between Jan/Feb and Mar/Apr. The big question this year would be whether we really will / could have anywhere near as stellar of a month as we had last May for contract activity. Maybe not?? 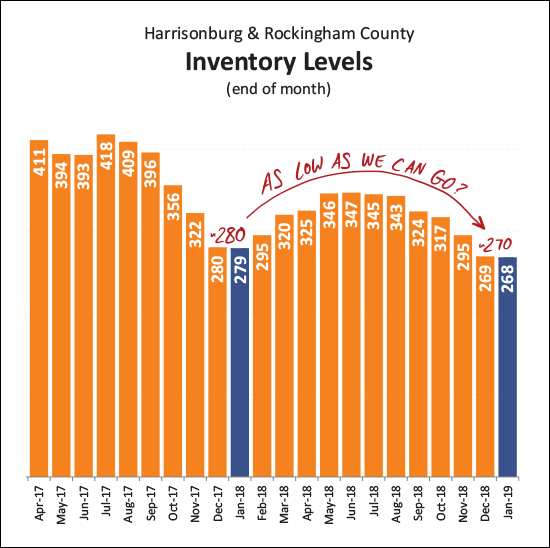 It is quite possible that inventory levels have dropped just about as far as they can possibly go. Over the past year we saw a seasonal rise and fall back to a just-below-300 inventory level as we started out January and February. It seems likely we'll get back up to a 340-350 level in the summer months, but absent a large new construction development starting in the area, it seems unlikely we'll get back up to 400 homes for sale at any given point in 2019. 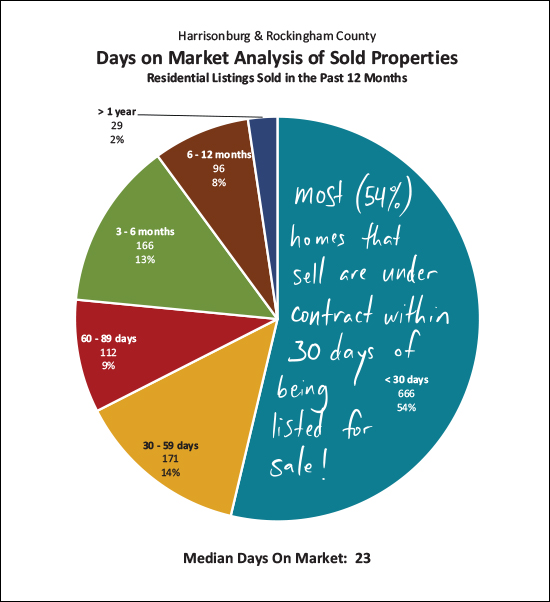 I said it earlier, but I'll repeat it. Homes are selling quickly! OK -- not all homes -- don't get overly distressed if your home is not under contract within 30 days of being listed for sale -- but quite a few (54%) of the homes that do sell are indeed under contract within 30 days of being listed for sale. If your home is not, let's talk about why, and what we might need to do to get it under contract within the next 30 - 60 days. 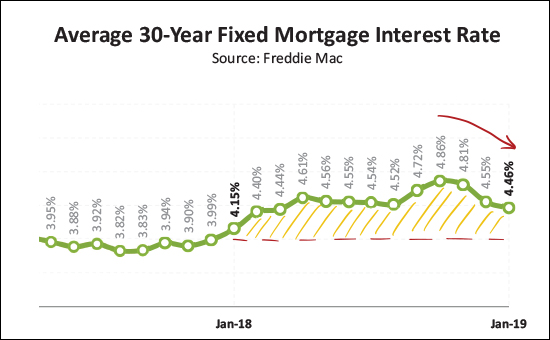 Refreshingly, after staying above 4% all year long in 2018 - and rising as high as 4.86% in October - they finally started to decline again and have continued to do so over the past few months. We're not back (barely) under 4.5% which is a nice relief for buyers in the near term. I'll pause there now, and commend any of you voracious readers of market updates who made it this far. :-) Read even more (!!) in the full PDF here, or feel free to shoot me an email with your thoughts, perspectives or questions on the market. And finally, a few quick links for you if you are thinking of buying or selling soon -- SELLERS -- even though it is a seller's market in just about every price ranges right now, you must still focus on price, condition and marketing. For further reading on buying or selling in this area, check out.... | |
Will Single Family Home Sales Ever Return to 2016 Peak? |
|
 I actually asked the same question last year. Thus far, the answer is still -- NO -- detached homes might not (??) ever (??) return to their 2016 peak. Actually, I don't completely hold to that conclusion, but read on for a moment. After three years straight (2013, 2014, 2015) of seeing a *very *consistent number of detached homes in the City and County (813-819) there was a 20% increase in 2016 to 978 home sales! But then, in 2017 -- sales of detached homes fell 10% to 884 sales. This could have partially been an inventory issue -- with fewer and fewer homes available for buyers to purchase -- but I have recently concluded that home sales can remain stable even with declining inventory levels. So -- getting back to it -- will we return to that 2016 peak of 978 detached home sales? Or will we beat it and hit 1,000 detached home sales at some point soon? We did see a few years of those sales levels in 2004 (1024 sales) and 2005 (1025) but that was amidst the real estate BOOM. I'm going to say that YES we can expect to get back up to those 2016 levels -- and even beyond that -- but it might take another year or two AND we probably need some new detached homes to be built. If that is even possible. As always, let me know what you think! Are you more optimistic (or pessimistic) than I am about detached home sales? | |
What Would It Take For New Construction (For Sale) Housing To Be Built, At Scale, In or Around Harrisonburg |
|
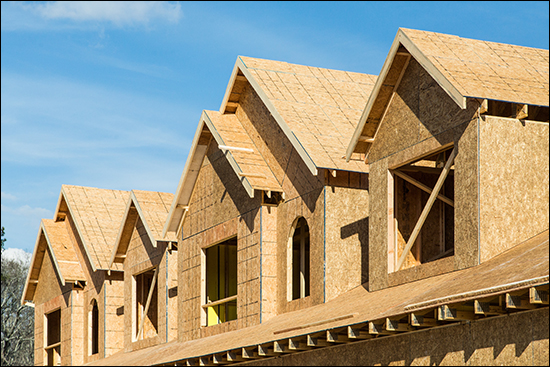 As you may have heard -- the market is hot -- sales are stead, inventory levels are declining and homes are selling more and more quickly. Perhaps, just perhaps, we need some new homes to be built to add to the supply side of the equation? So -- after all that -- what would it take for us to see more new construction (for sale) housing in and around Harrisonburg? 1. More highly motivated sellers of development land. 2. Fewer student housing, rental housing and mixed use developers. You see, there are parcels of land for sale in and around Harrisonburg right now -- or parcels of land that could be purchased where a builder could build homes and buyers could buy those homes and everyone would live happily ever after. But -- most sellers of development land aren't overly motivated to sell quickly AND they are convinced that their land should be valued as if it is being sold to a student housing, rental housing or mixed use developer. And, so long as there are student housing, rental housing or mixed use developers willing to buy land at a high price/acre AND/OR as long as owners of development land are willing to hold out for that high price/acre -- then land is not likely to be sold to developers or builders at a price/acre that would allow them to build homes for buyers to buy. I think it is important that our local housing stock increase over the next five years with more options for buyers (especially first -- or second -- time buyers) to make Harrisonburg their home. But right now, we seem to be at a bit of a stalemate -- sellers of development land don't want to sell their land at prices that would allow a builder/developer to build homes for sale -- and builders/developers don't want to pay (can't pay) overly high prices/acre and still deliver a product to the market at a price that a buyer would be able to afford. | |
| Newer Posts | Older Posts |
Scott Rogers
Funkhouser Real
Estate Group
540-578-0102
scott@funkhousergroup.com
Licensed in the
Commonwealth of Virginia
Home Search
Housing Market Report
Harrisonburg Townhouses
Walk Through This Home
Investment Properties
Harrisonburg Foreclosures
Property Transfers
New Listings


