Market
| Newer Posts | Older Posts |
We Will Likely Have More Clarity On The Pulse Of The Local Housing Market By April |
|
 Home sales have been slower in November, December and January. This is somewhat normal from a historical perspective - winter months are normally slower. They haven't been slower during the COVID housing boom, but this winter is certainly slower than the past two winters. Mortgage interest rates have been shifting down a bit in recent weeks but they are still quite a bit higher than they have been over most of the past five years. These higher interest rates (combined with higher home prices) are pricing some would be home buyers out of the market. So, where is our local housing market headed in 2023? Some would say that the number of home sales will decline, prices will level out or decline somewhat, homes will not sell as quickly, and inventory levels will climb. Some say that there will only be a slight decline in the number of home sales, that prices will keep climbing, that homes will still sell very quickly and that inventory levels will not meaningfully climb. Which reality will we see play out in 2023? Both are likely possible... but we are likely to have any indications in one direction or the other until April as we head into the spring real estate market. | |
Home Sales Slowed Considerably In Late 2022 But Home Prices Kept On Rising |
|
 Happy Thursday afternoon, friends! And... Happy New Year! It's hard to believe the New Year is upon us. Actually.. we're already more than halfway through January at this point. What a whirlwind. I hope you had a delightful finish to 2022. I capped off the year with a slightly warmer than anticipated New Years Eve Glow Run, another fantastic community running event put on by VA Momentum. Below is a photo just prior to the start of the race... after which it became progressively darker and our glow bracelets and necklaces were lighting up the hilly course at Heritage Oaks Golf Course...  Two other items of business before we get into the real estate data... First, take a few minutes to check out my featured home of the month... 3078 Preston Lake Blvd... This beautiful cottage home with a finished basement is located in the Preston Lake community with a clubhouse, pool, walking paths and playground, all just minutes from Sentara RMH, JMU, Merck and Coors! You can check out the house here or walk through it here. Finally, each month I offer a giveaway, of sorts, for readers of this market report, highlighting some of my favorite places, things or events in Harrisonburg. Recent highlights have included Grilled Cheese Mania, Walkabout Outfitter and Bella Gelato. And this month... This month it's back to music... I'm giving away a pair of tickets to see The Steel Wheels and Sierra Hull at JMU's Wilson Hall on February 11th! Read all about the event, and the artists, here - and if you're interested in a pair of free tickets, enter to win them here. :-) Now, onward to the latest data on our local housing market! First, how many homes have been selling lately... 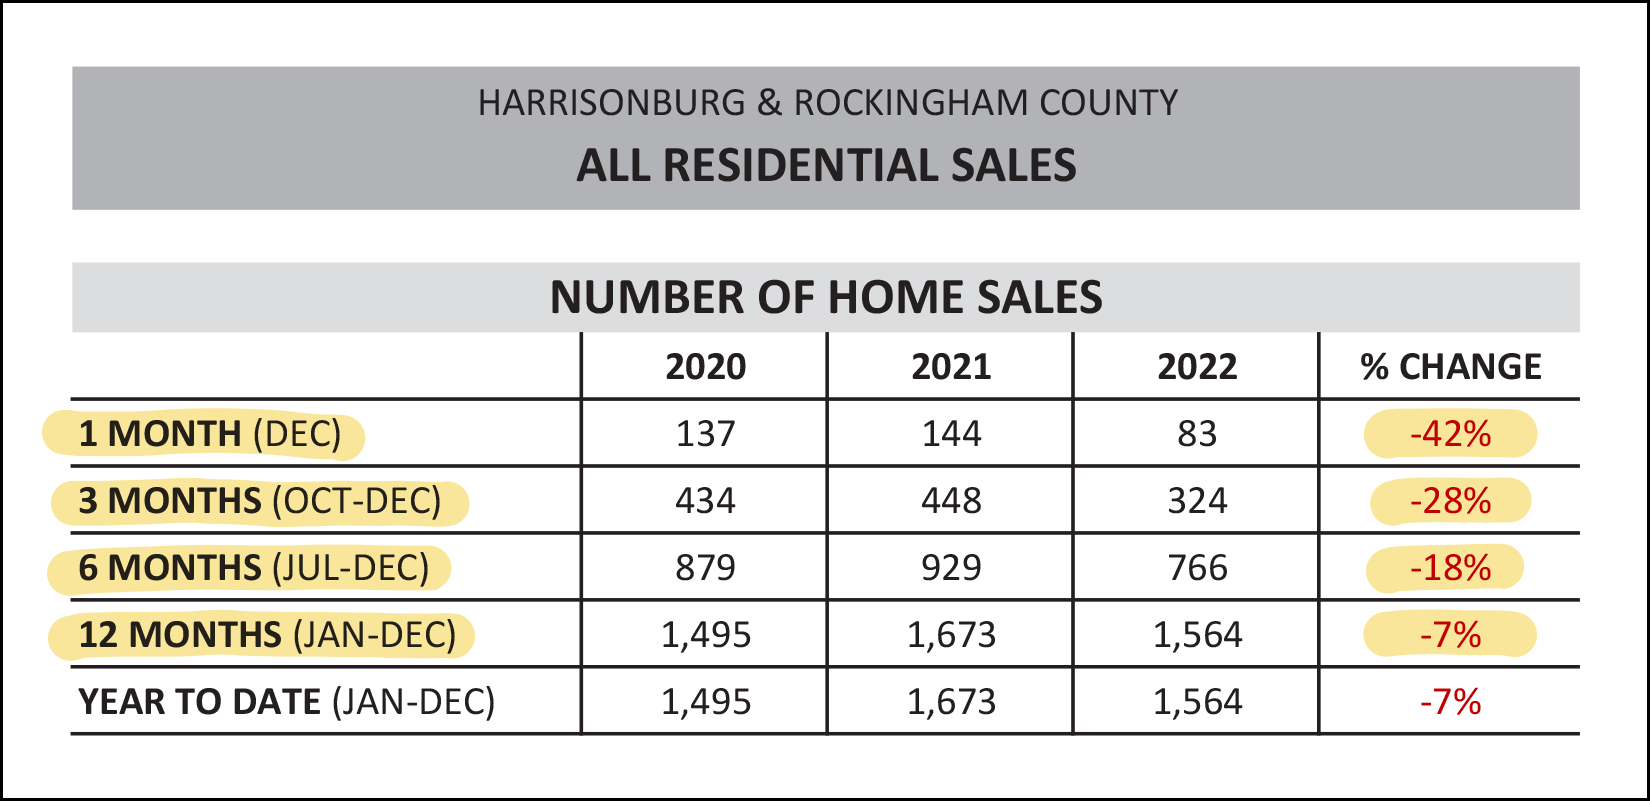 There's a lot to note in the graph above, and some of these numbers informed the headline for this article... [1] There were only 83 home sales in December 2022... compared to 144 in December 2021. That's a rather surprising 42% decline in home sales for the month of December. [2] When we pile in a few more months (October and November) we see that there were 28% fewer home sales in the fourth quarter of 2022 than in the fourth quarter of 2021. [3] Finally, when looking at the full year of 2022... there were 7% fewer home sales than in 2021. After several years of rapidly increasing numbers of home sales, it seems that higher mortgage interest rates finally slowed down buyer activity... though not very significantly until the very end of 2022. But yet, despite slowing sales, home prices did what!? 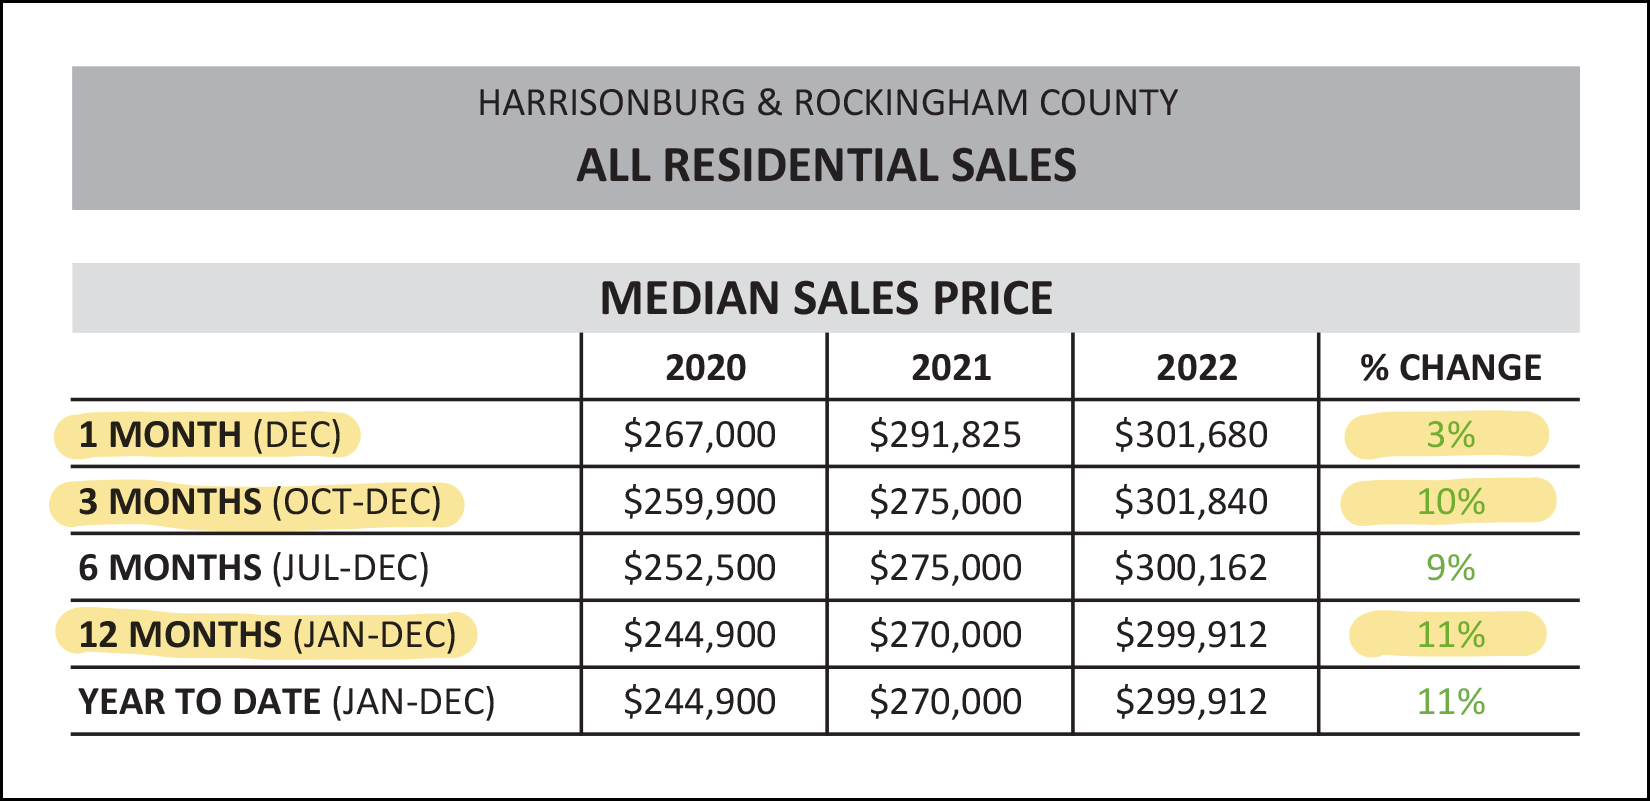 Home prices... kept on rising! [1] Starting from the bottom of the chart (above) this time we see that there was an 11% increase in the median sales price when comparing all of 2021 to all of 2022. That's a rather significant increase in the median sales price and it follows on after two preceding years of 10% increases in the median sales price. Needless to say, homes have become quite a bit more expensive over the past several years. [2] The median sales price in December 2022 was 3% higher than in December 2021. This could be an indication that we'll start to see a slow down in the rate at which home prices are increasing... or, as is more likely, it may be lower than the longer term trend (+11%) because it is a smaller data set of only the homes that sold in a single month. So... was it just December when we were seeing slowing home sales? 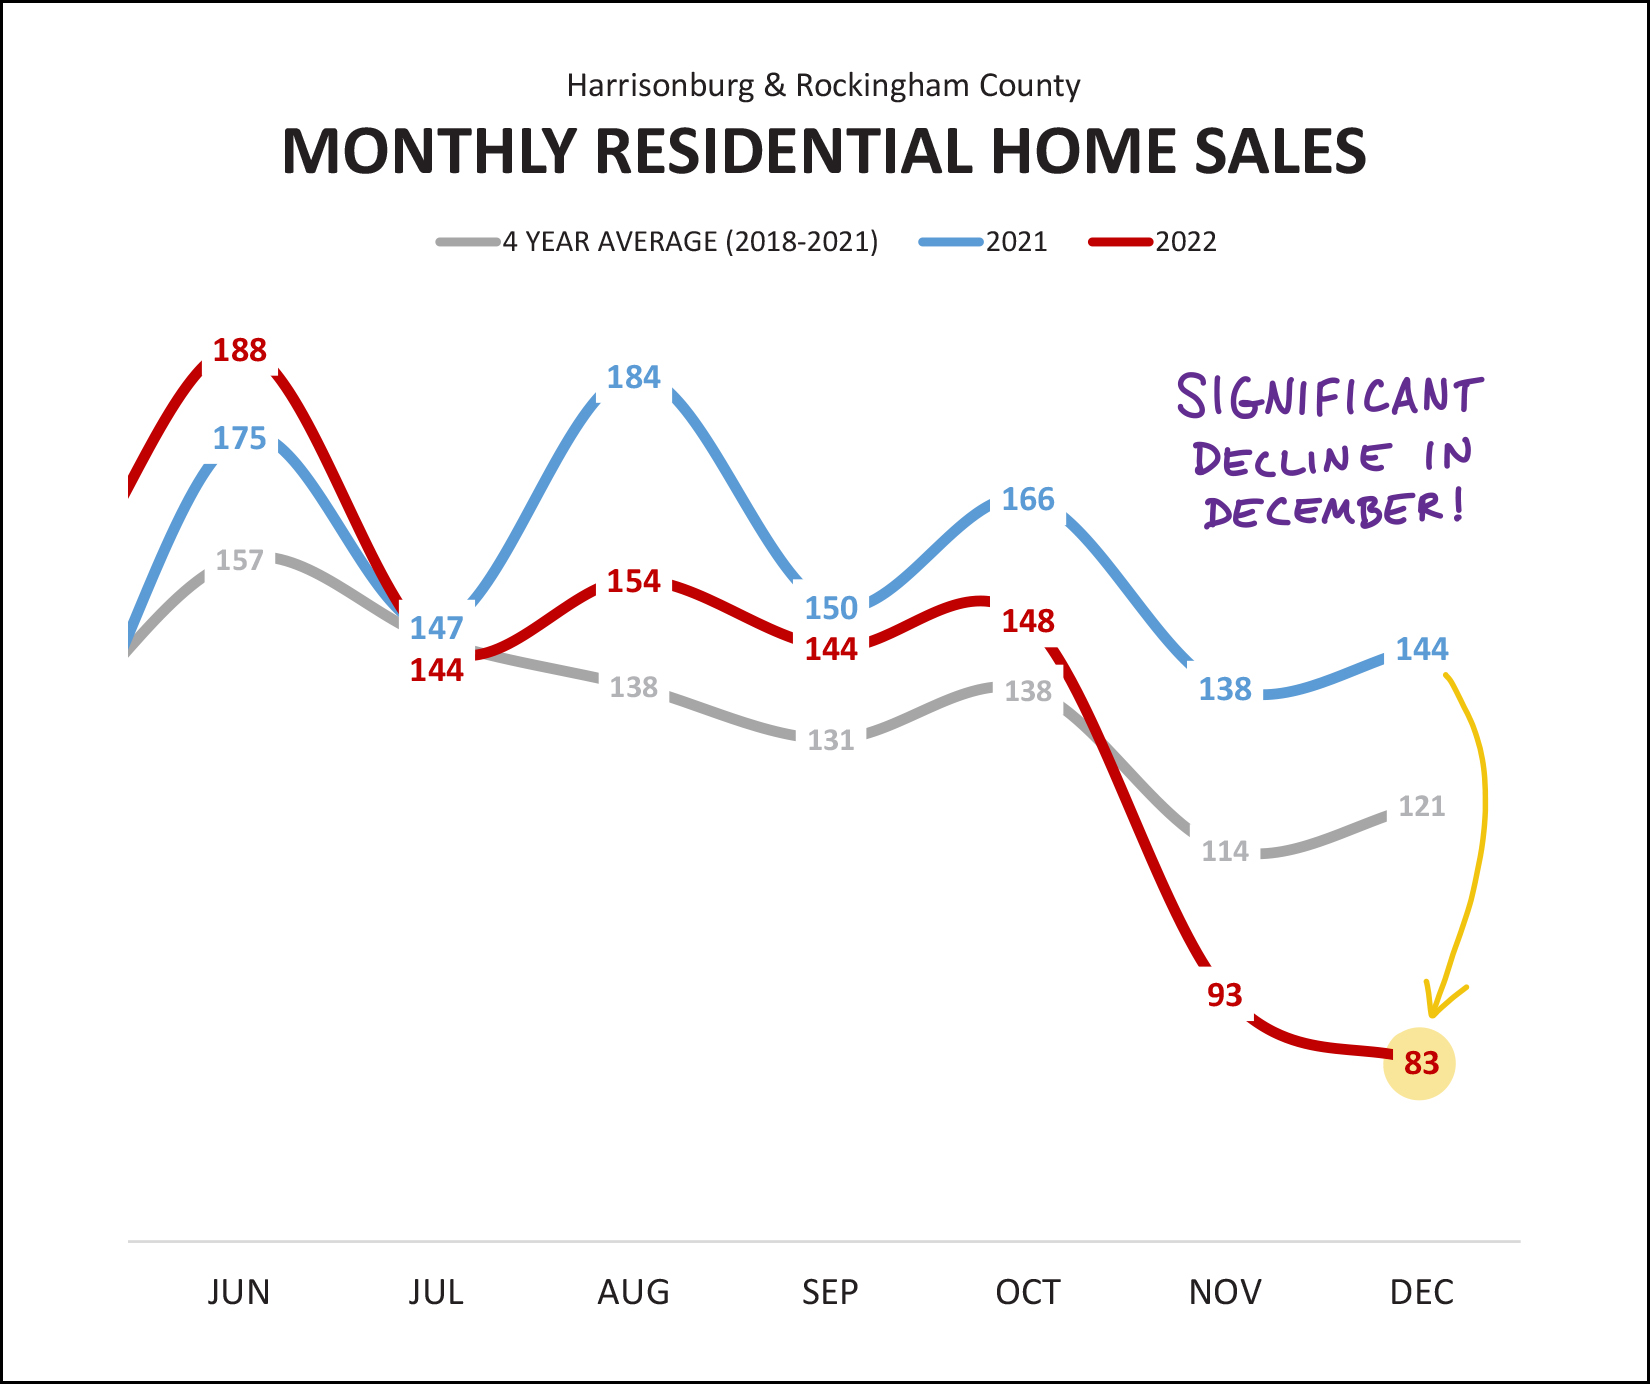 The decline in home sales was certainly significant in December... but if you track that red line (2022) back to November and compare it to the blue line (2021) you'll see that the slow down started before December rolled around. The graph above (and many of the graphs in this month's report) are in a slightly different format than in past months. I spent some time going through to revamp my monthly market analysis process to hopefully make the resulting graphs and analysis even more helpful and pertinent for all of us as we see how 2023 unfolds. As such, the graph above is showing the current (just finished) year of 2022 with a red line -- and the previous year of 2021 with a blue line -- and the grey line is showing a longer term trend calculated by averaging 2018 through 2021. Next up, let's look at monthly cumulative home sales... 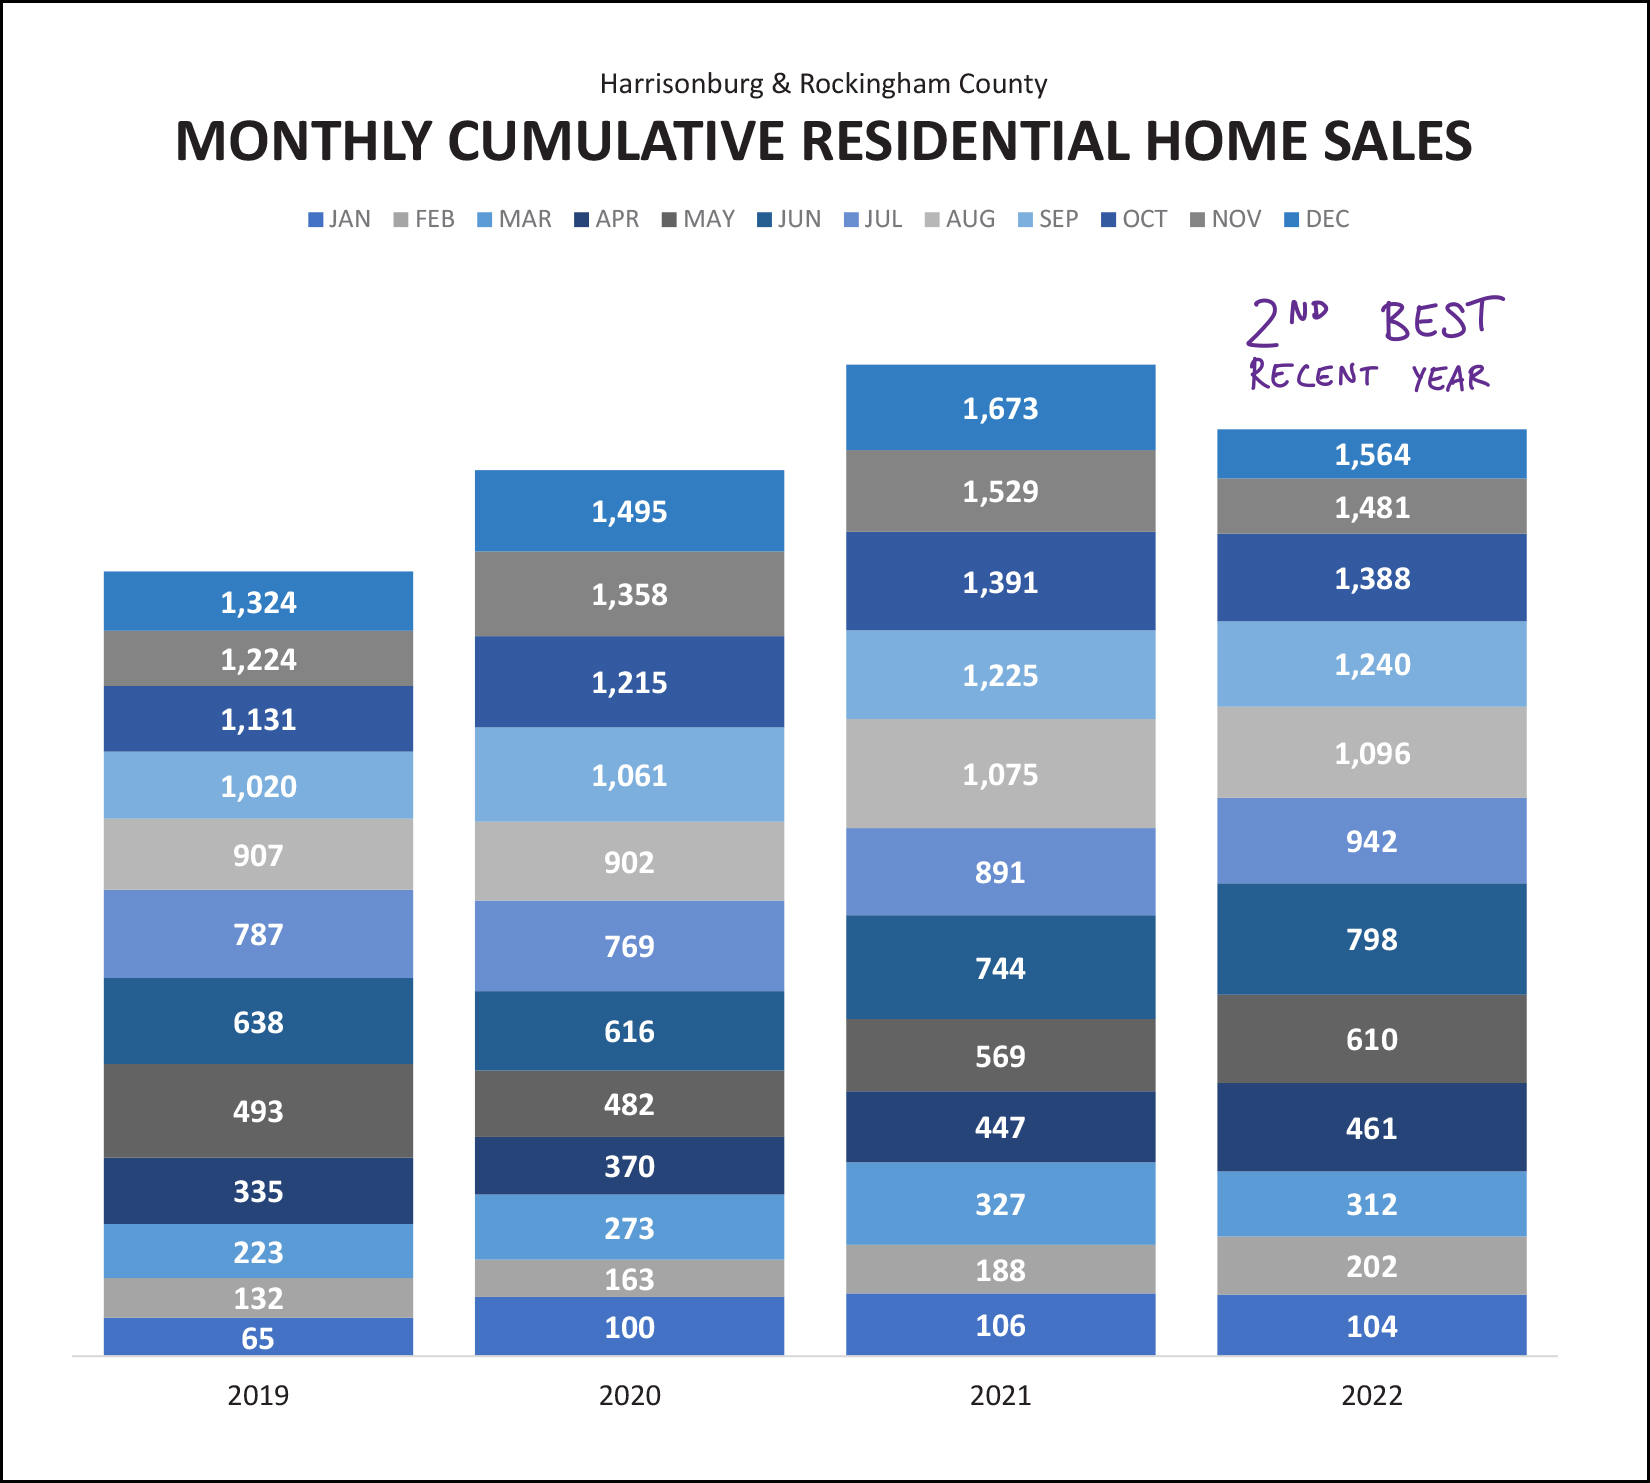 The graph above provides another illustration of the fact that 2022 was keeping pace with 2021 all the way through the end of October... and then November and December fell short. This resulted in the second strongest recent year of home sales in Harrisonburg and Rockingham County. Indeed... there were 7% fewer home sales in 2022 than in 2021... but there were well more than in 2019 and 2020! Next, let's look at general long term trends over the past few years... 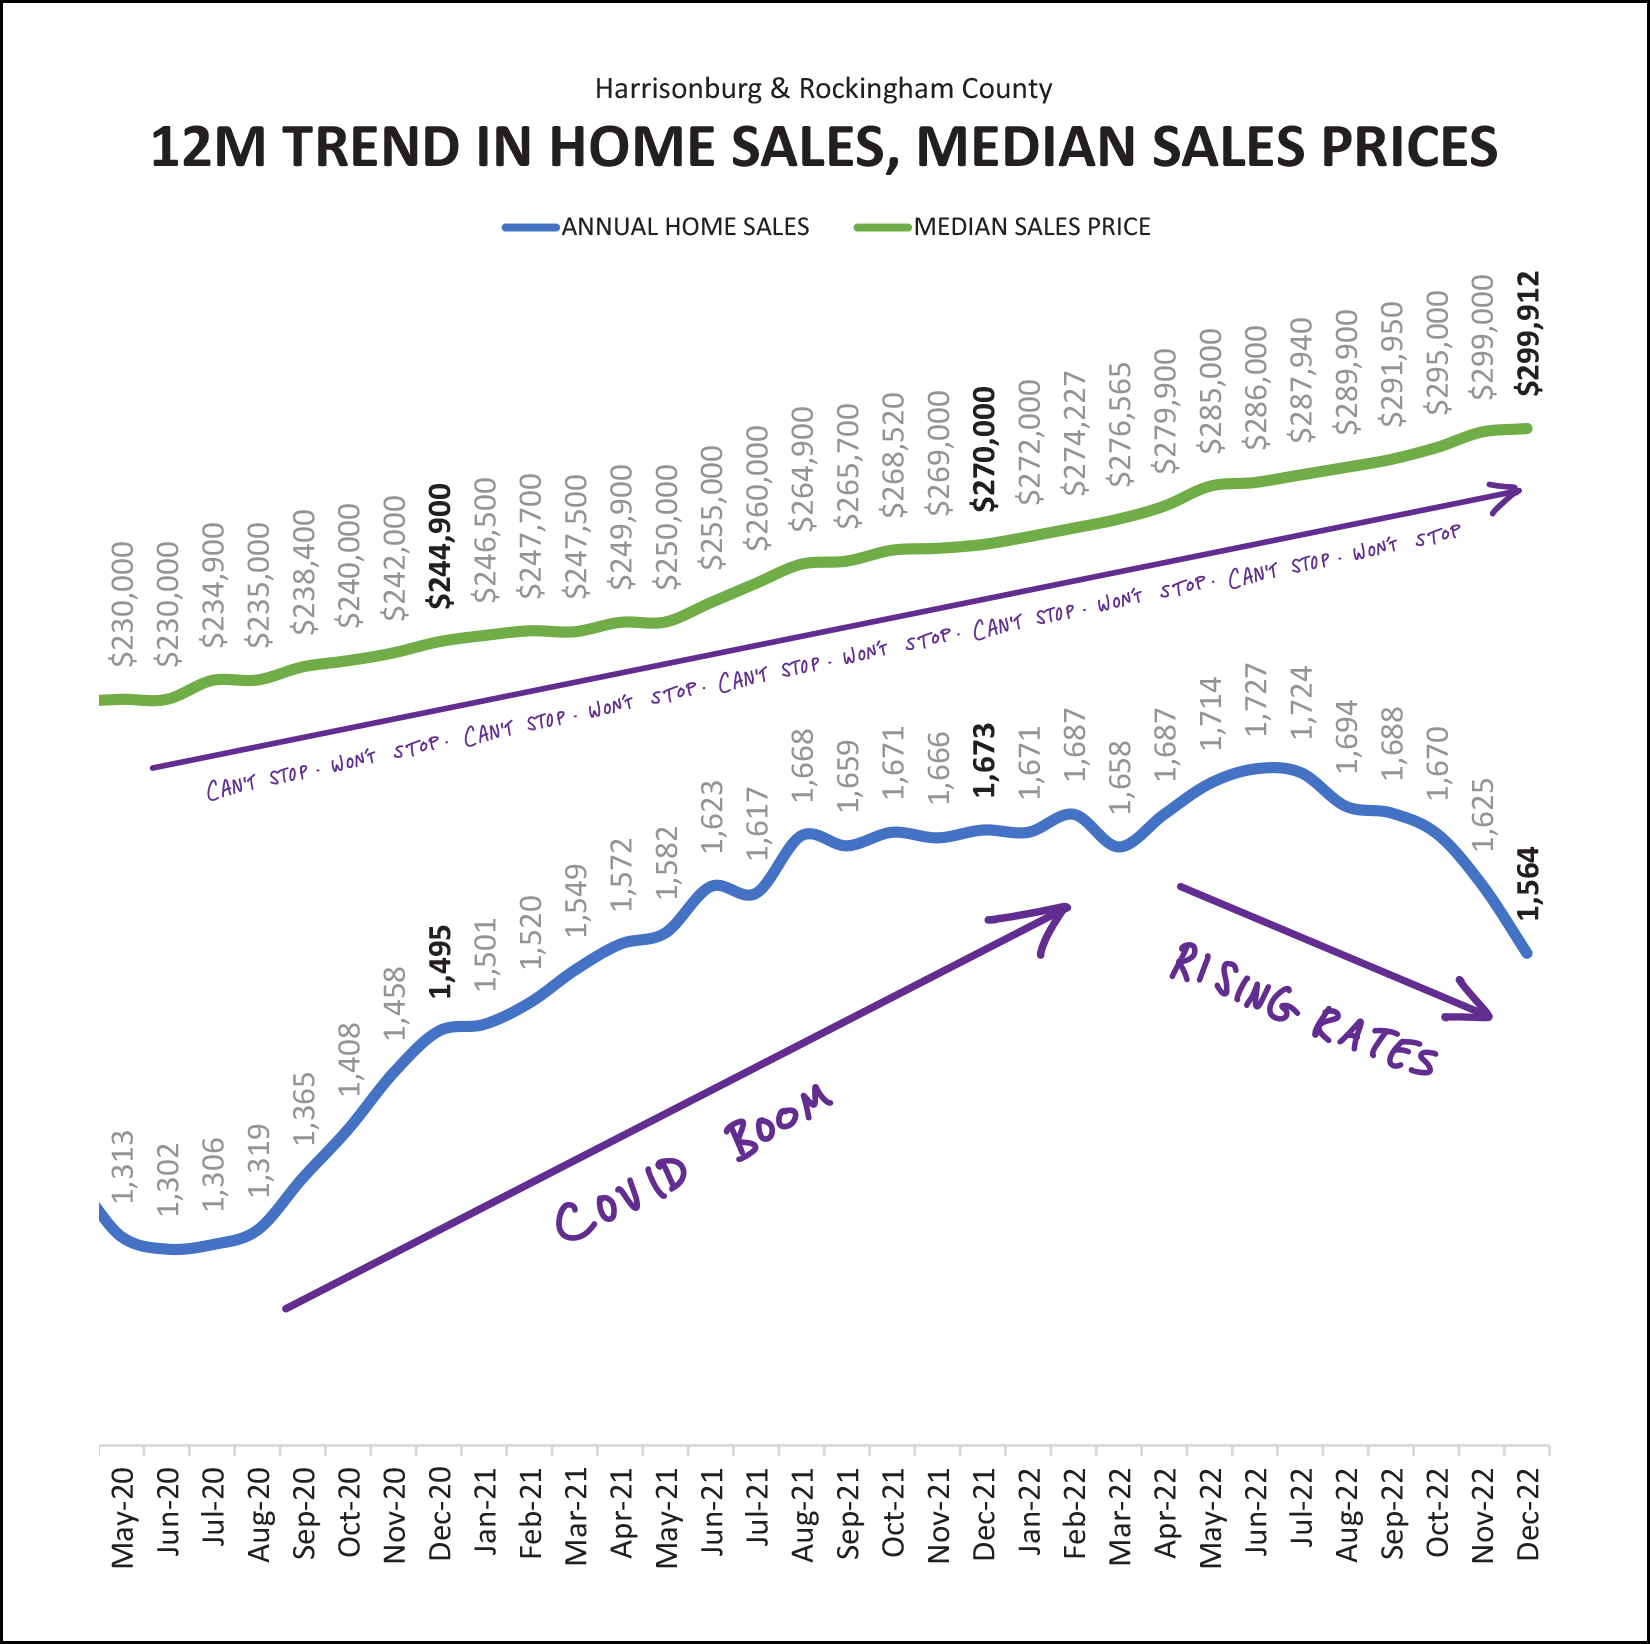 The top green line is showing the median sales price of all homes selling in Harrisonburg and Rockingham County... measured monthly by looking at the median of the previous 12 months. In tiny letters underneath someone (ok, me) wrote "can't stop, won't stop, can't stop, won't stop" -- but, I should definitely, definitely clarify that -- yes -- the median sales price could stop increasing. It didn't do so anytime in the past three (plus) years as illustrated above, but as they say, past performance is not a guarantee of future results. The bottom blue line (above) is a monthly check-in on the annual pace of home sales. During Covid the annual rate of home sales in our area shot up from around 1,300 sales per year all the way up to 1,700 sales per year... but as mortgage interest rates rose during 2022, eventually the annual pace of home sales started to decline again. Where did we finish out 2022, you might ask, within the context of the past few years? 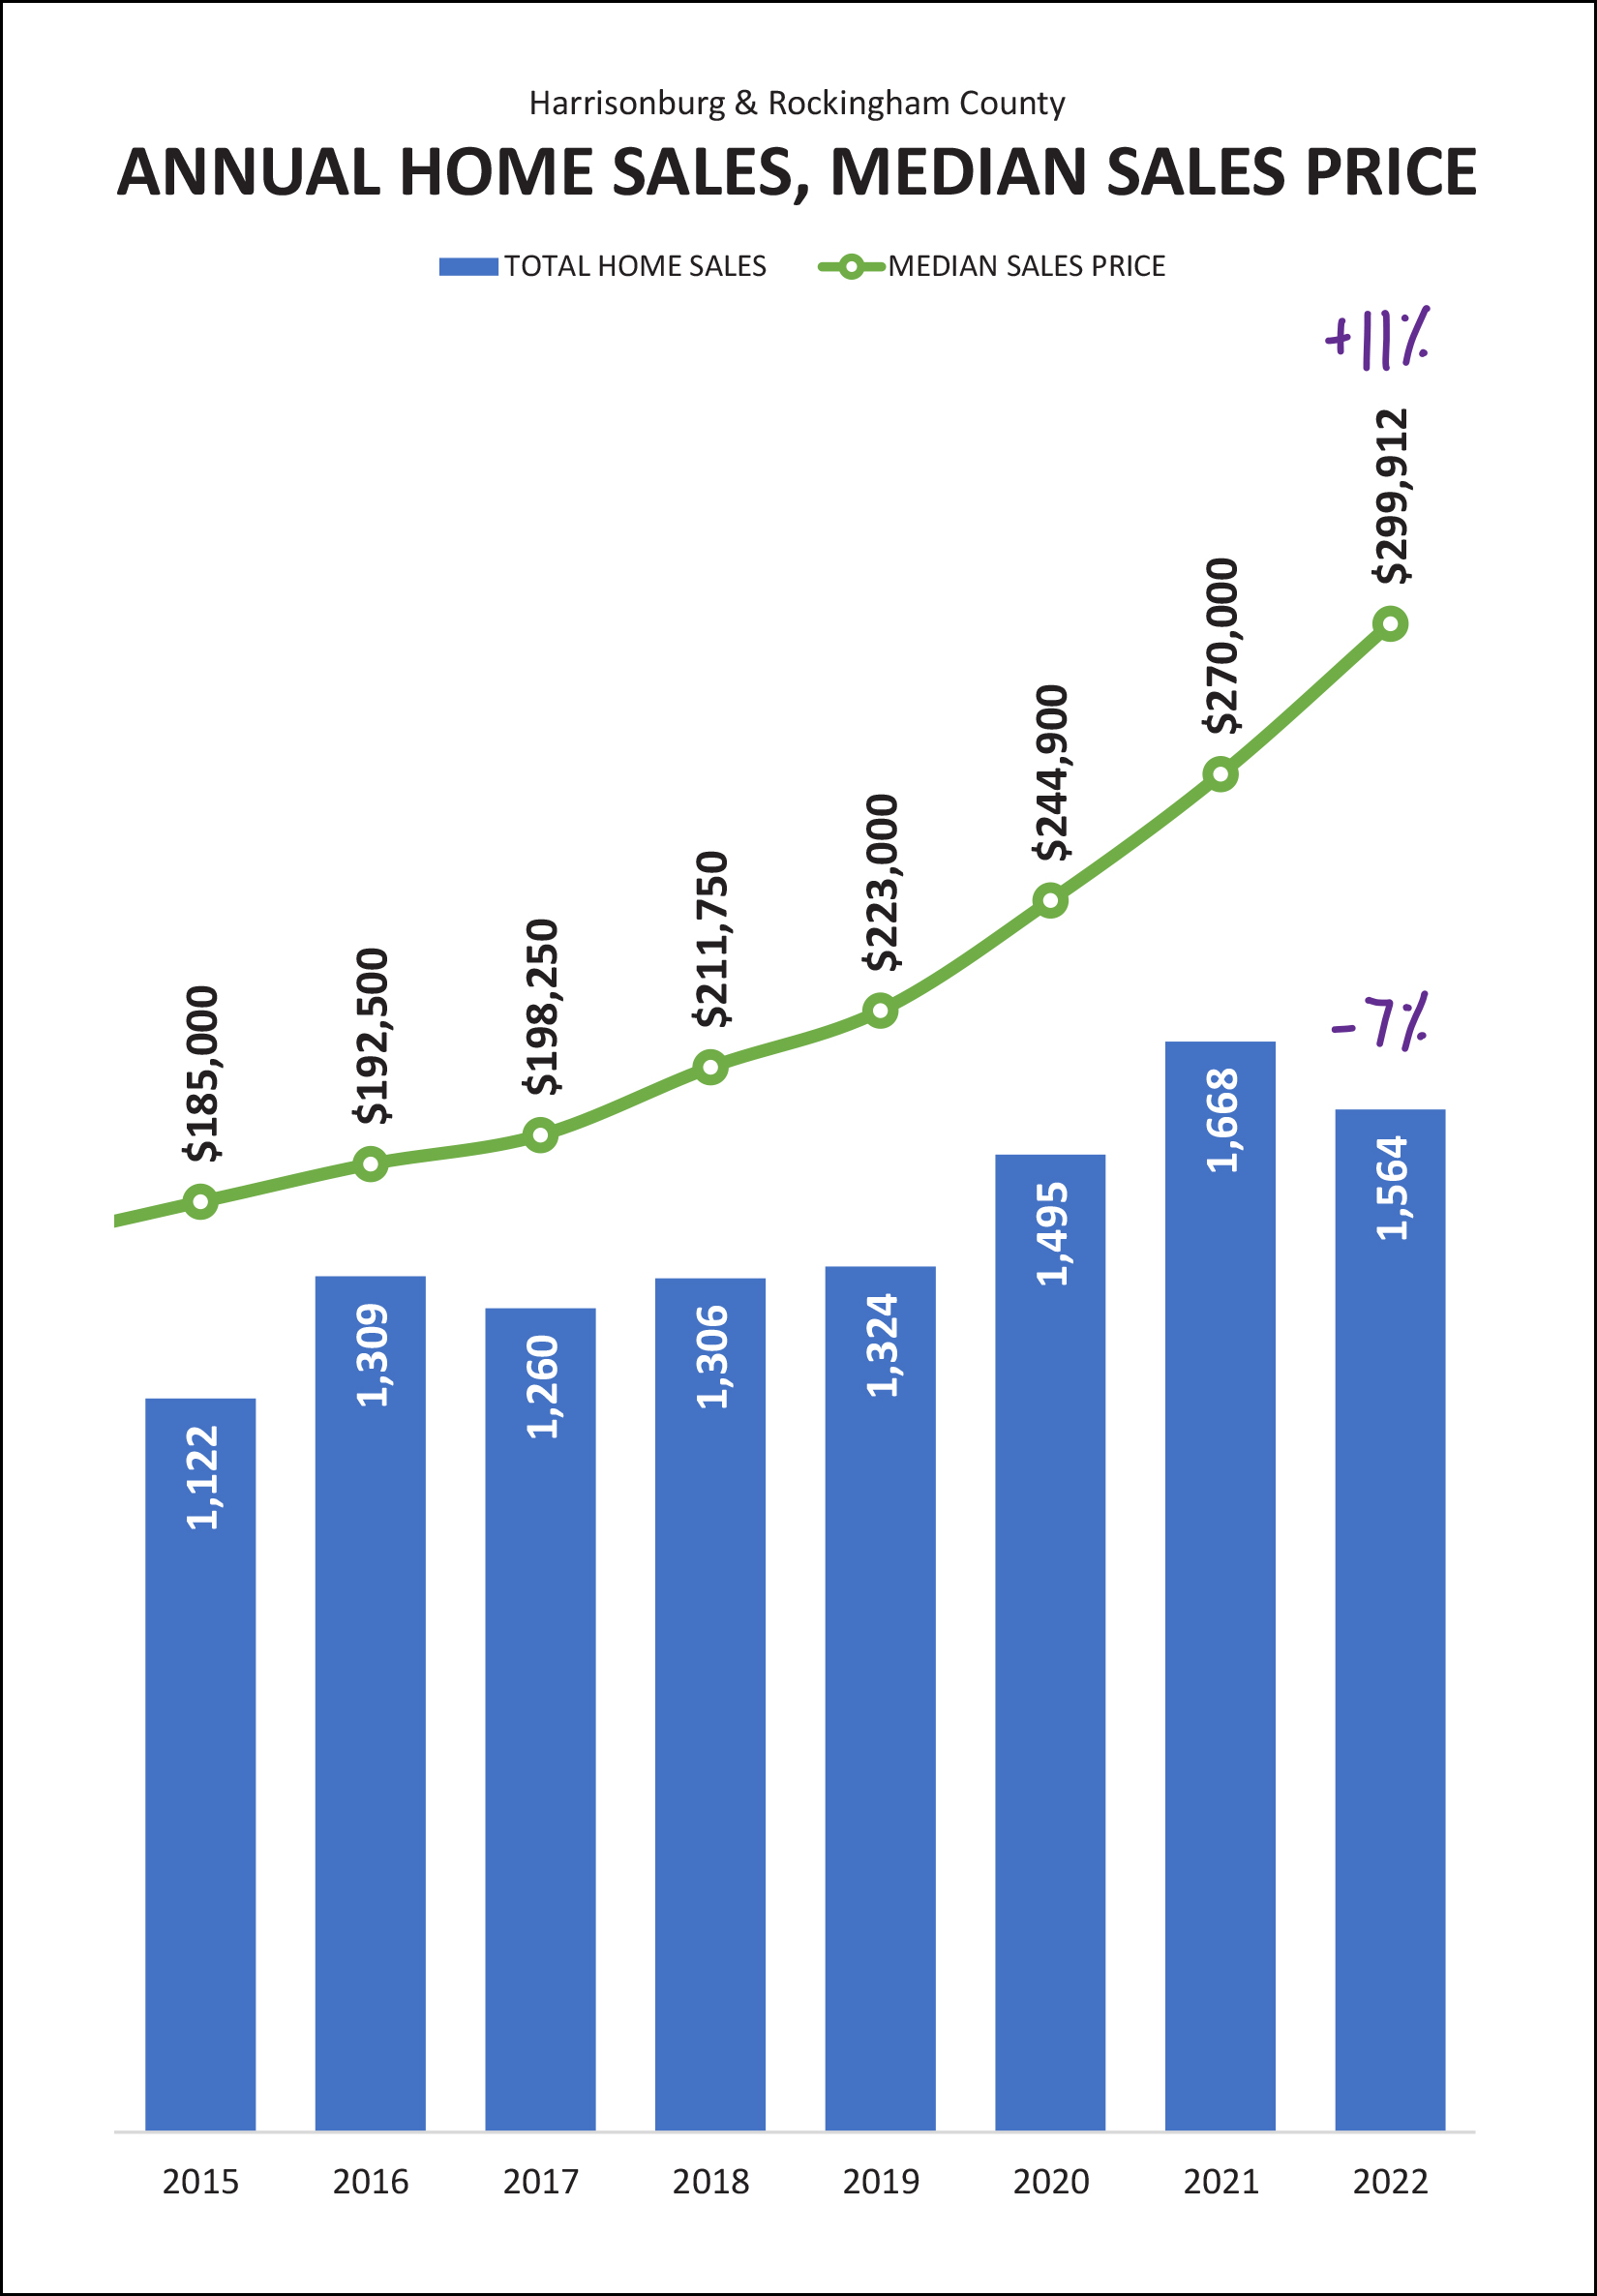 We ended up seeing 7% fewer home sales in 2022 than in 2021 -- though there were 5% more home sales in 2022 than in 2020. So, again, this past year was the second best year of home sales in recent times. You can see again here (in the graph above) that the median sales price has been aggressively climbing for multiple years. Five years ago (in 2017) the median sales price was $198,250... and it closed out 2022 just shy of $300K with a median of $299,912. This marks an 11% increase in the median sales price in 2022 after a 10% increase in both 2020 and 2021. Wow! This next one might surprise you. It surprised me, at least for a moment... 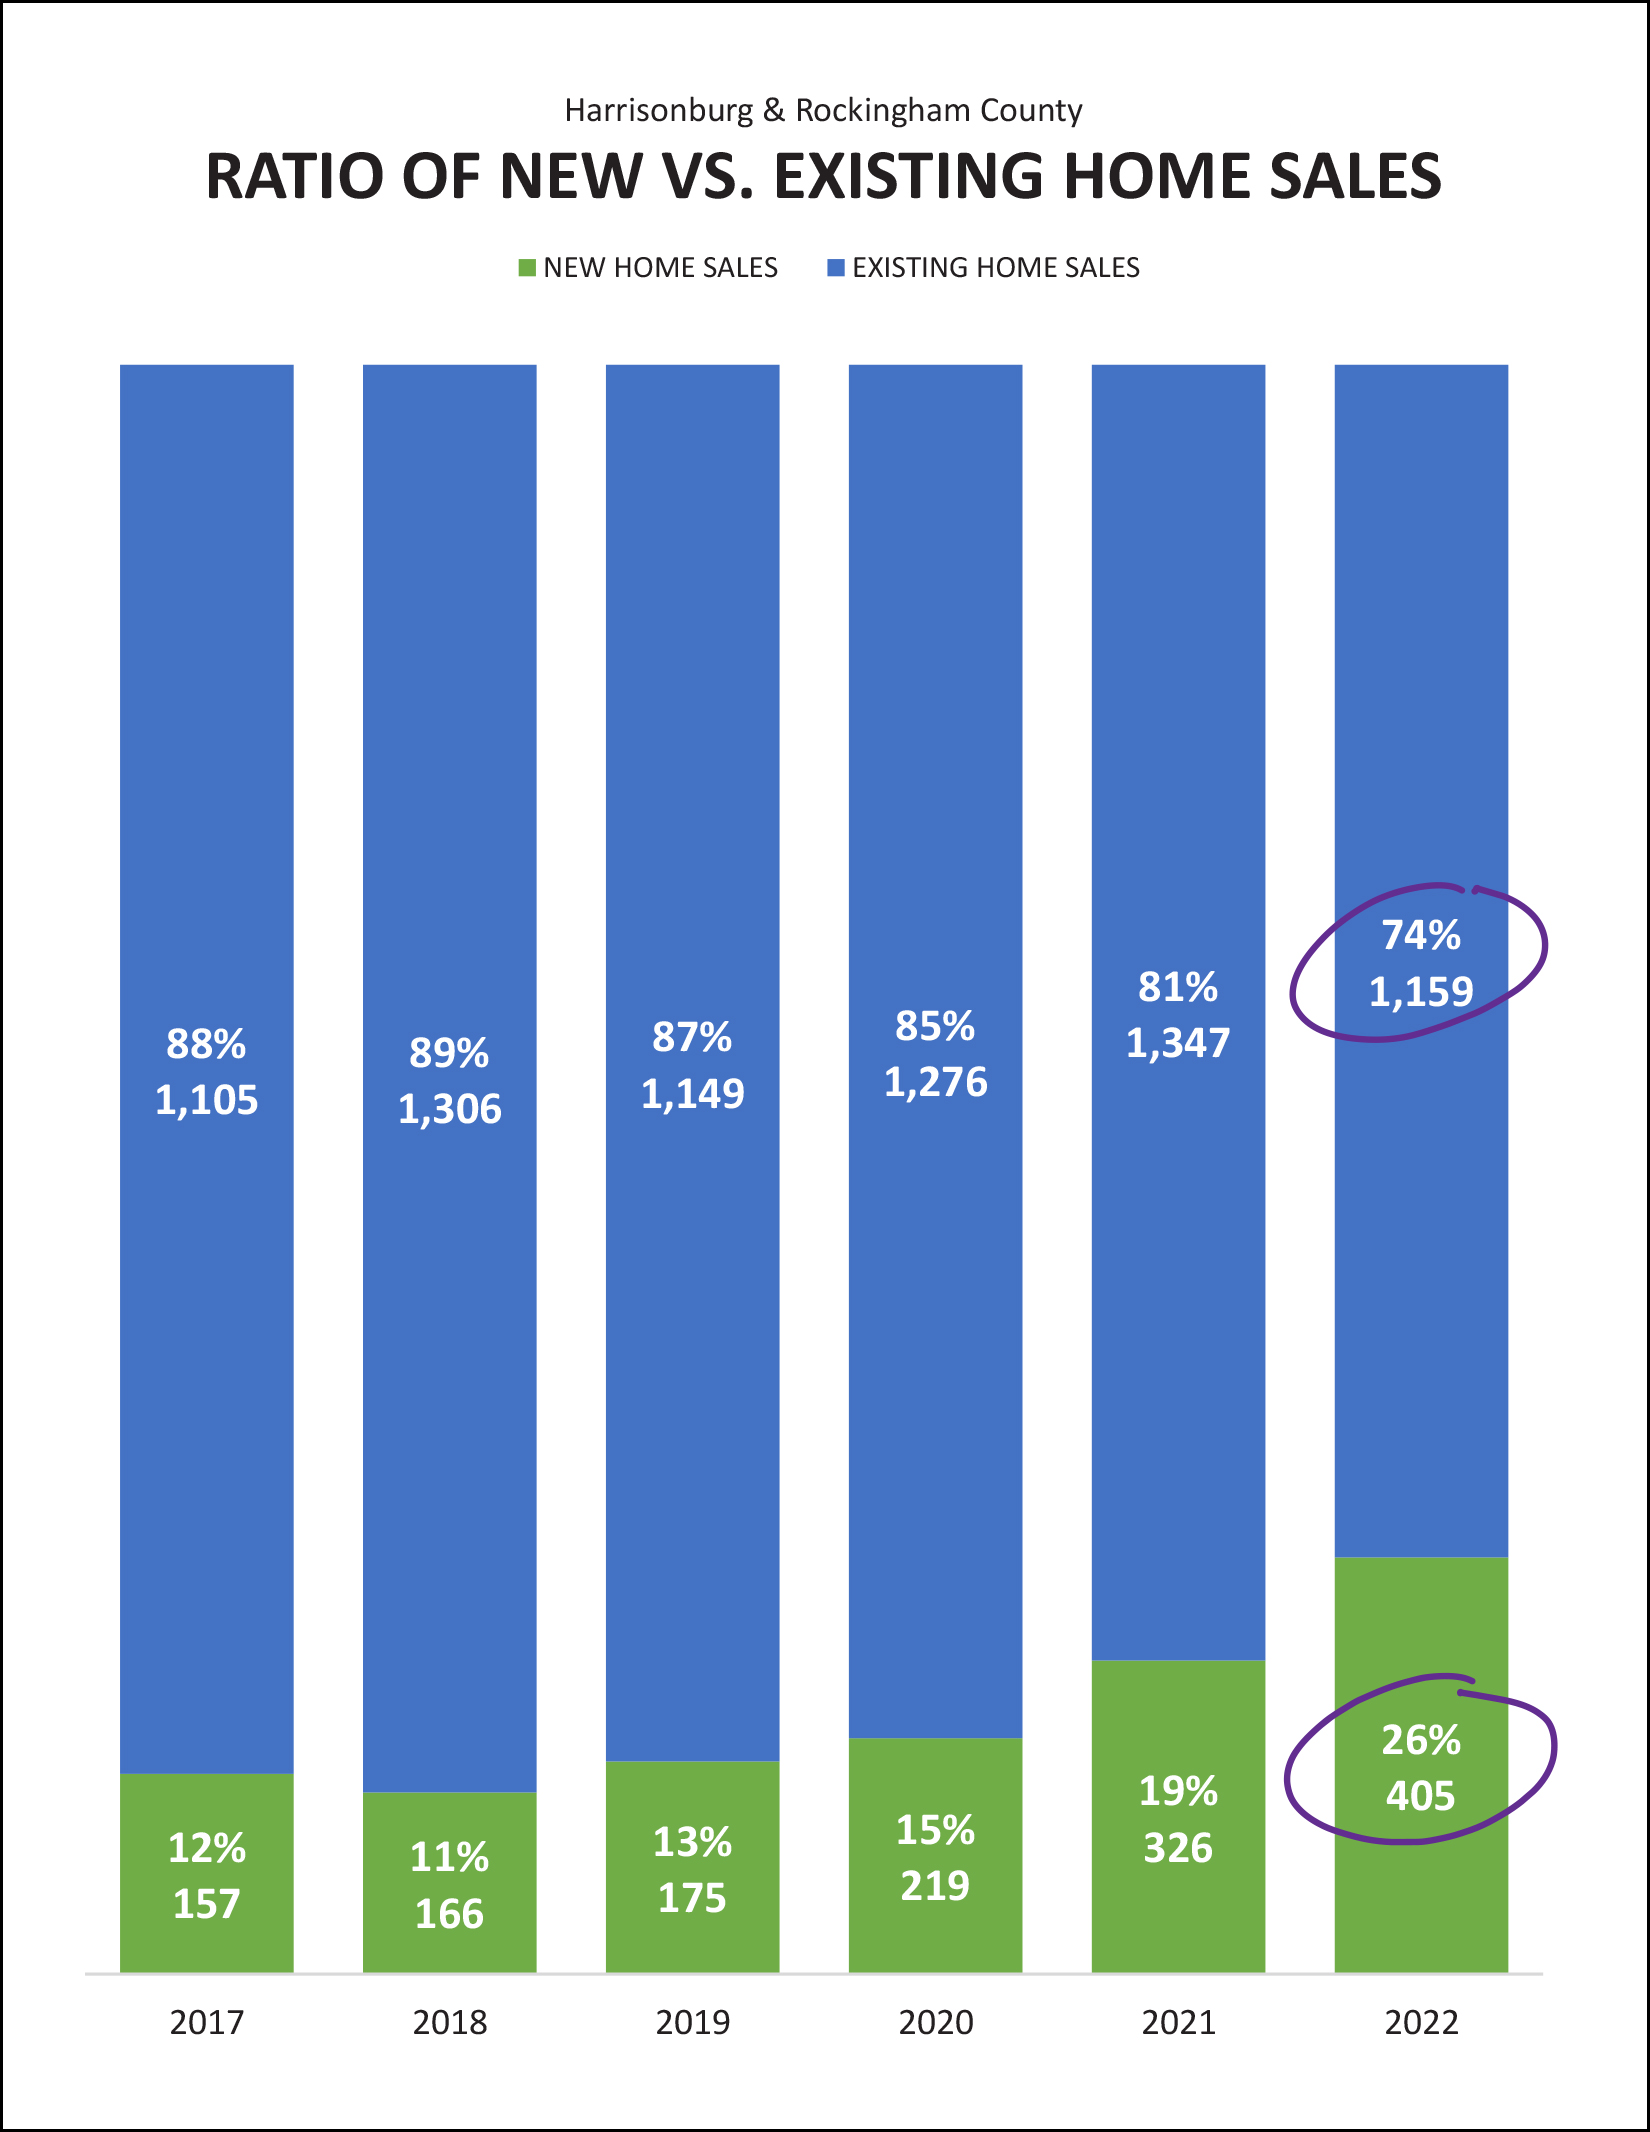 The 7% decline in home sales in 2021 was actually a much larger decline if we focus in on resale homes. There was actually a 14% decline in resale homes during 2022! We only ended up seeing a 7% decline in overall market activity because of the sale of new homes. We saw a 24% increase in new home sales in 2022. As a result (and as circled above) the balance between new home sales and existing home sales continues to shift with over a quarter of all home sales (26%) being new homes in 2022. I think there is a decent chance this ratio will be similar in 2023, or that we might see even more new home sales as plenty of homeowners will sit tight and enjoy their super low mortgage interest rate rather than selling their home. What comes next, I wonder... 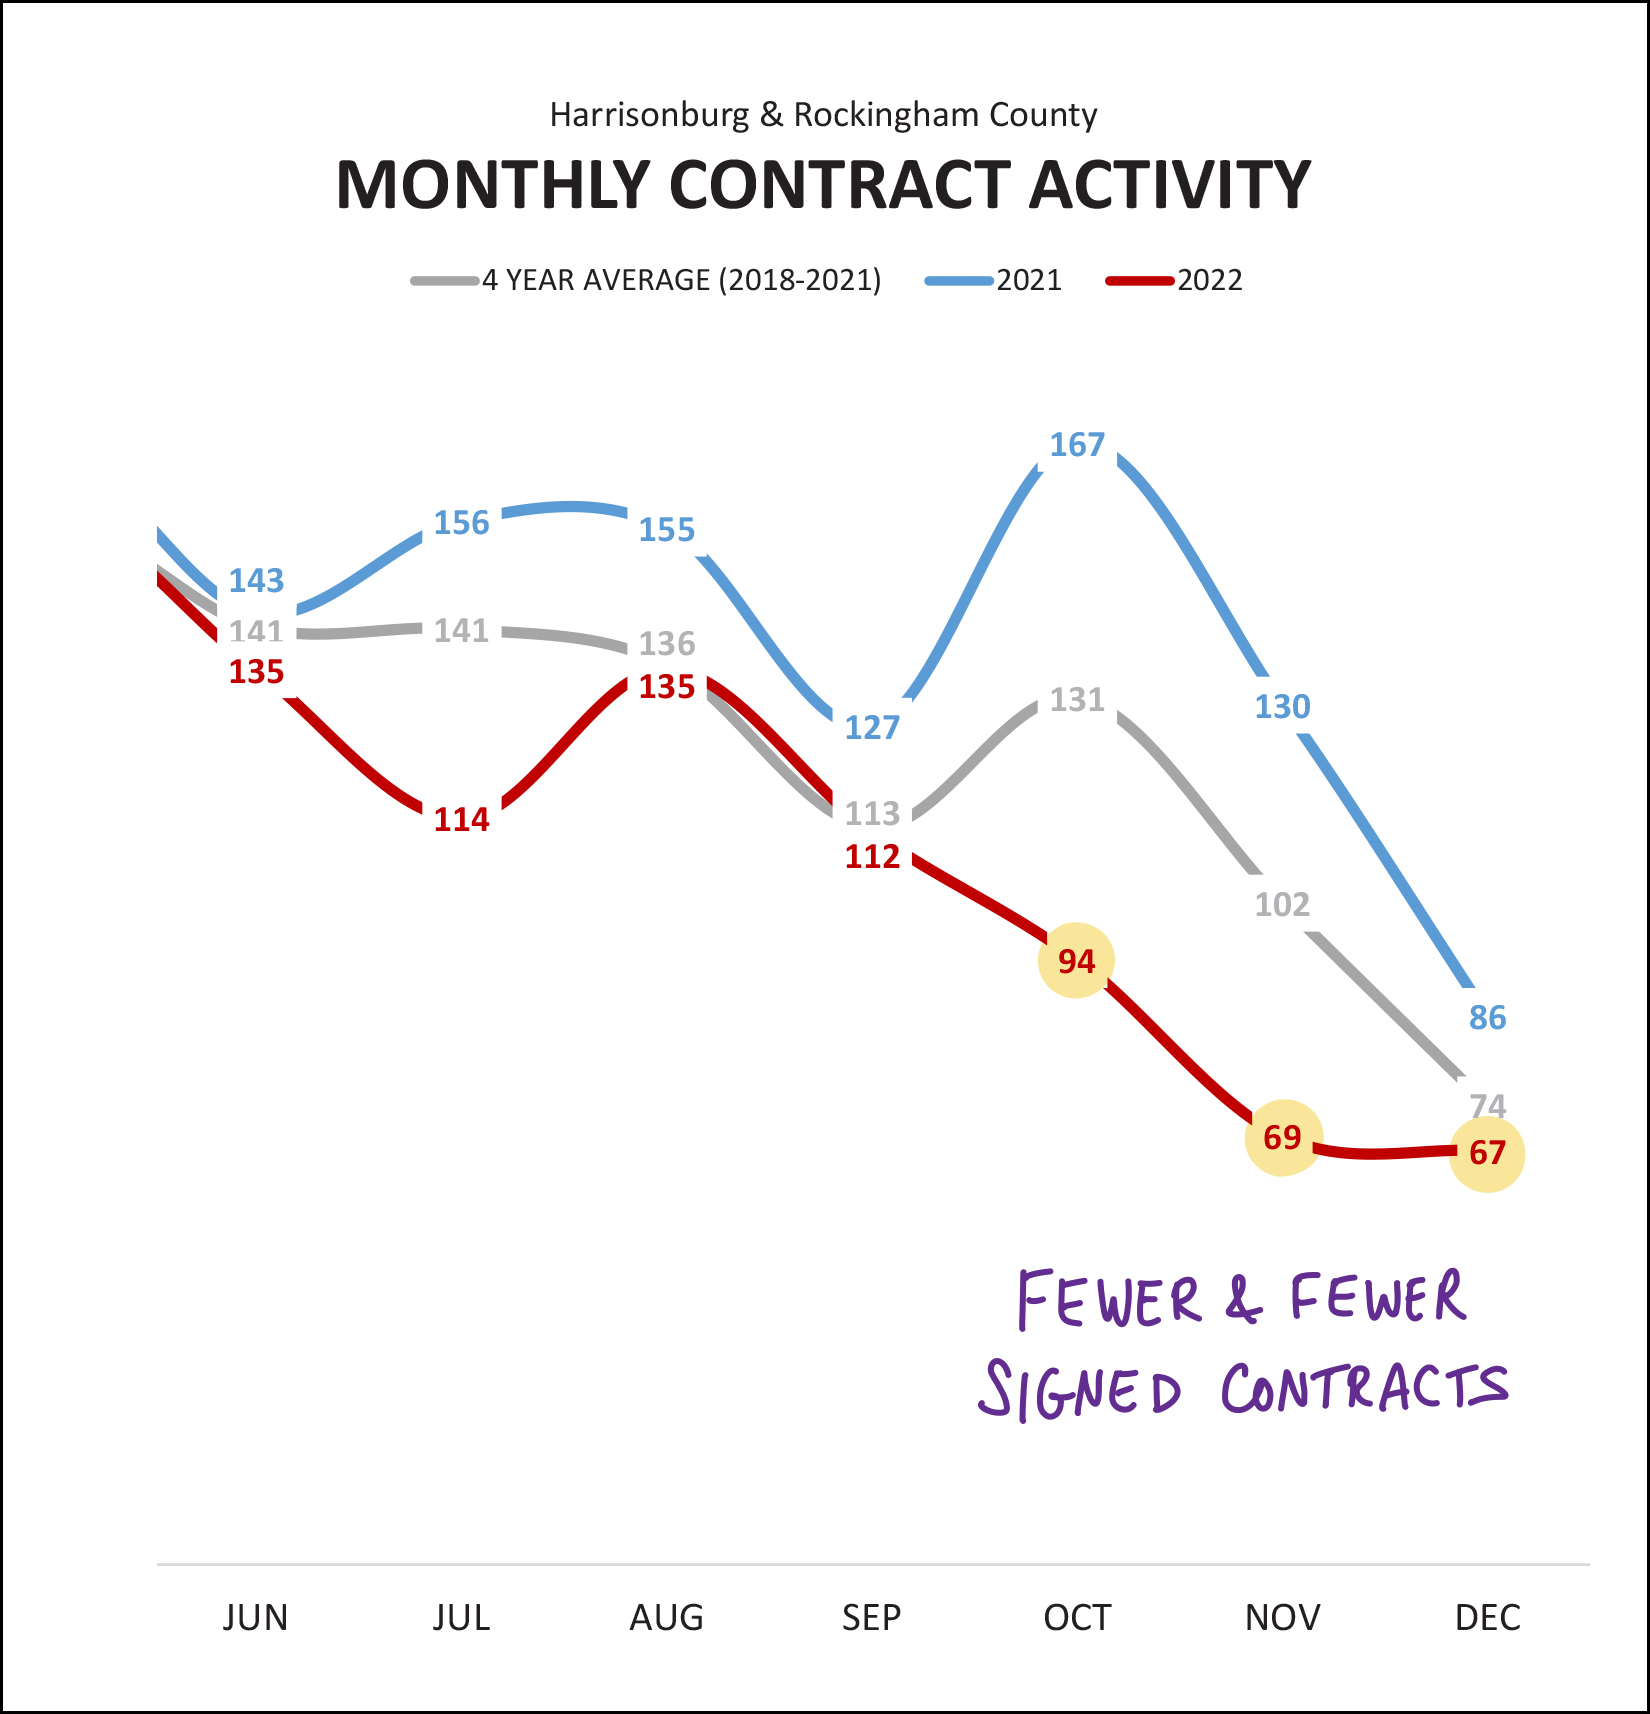 The graph above tracks how many contracts are signed (by buyers and sellers) each month... and here you can see that the slow down actually started halfway through 2022. Each month of contract activity in the second half of 2022 (red line above) was lower than the corresponding month in the second half of 2021 (blue line above) though the gap became much more pronounced in the last three months of the year. Interestingly, if we look at the typical November to December trend in contract activity per the grey line (four year average) we see that it is typical to see about 74 contracts in December... and December 2022 was only slightly below that with 67 contracts. Here's a new graph that provides a bit more insight into how many contracts are out there waiting to get to closing... 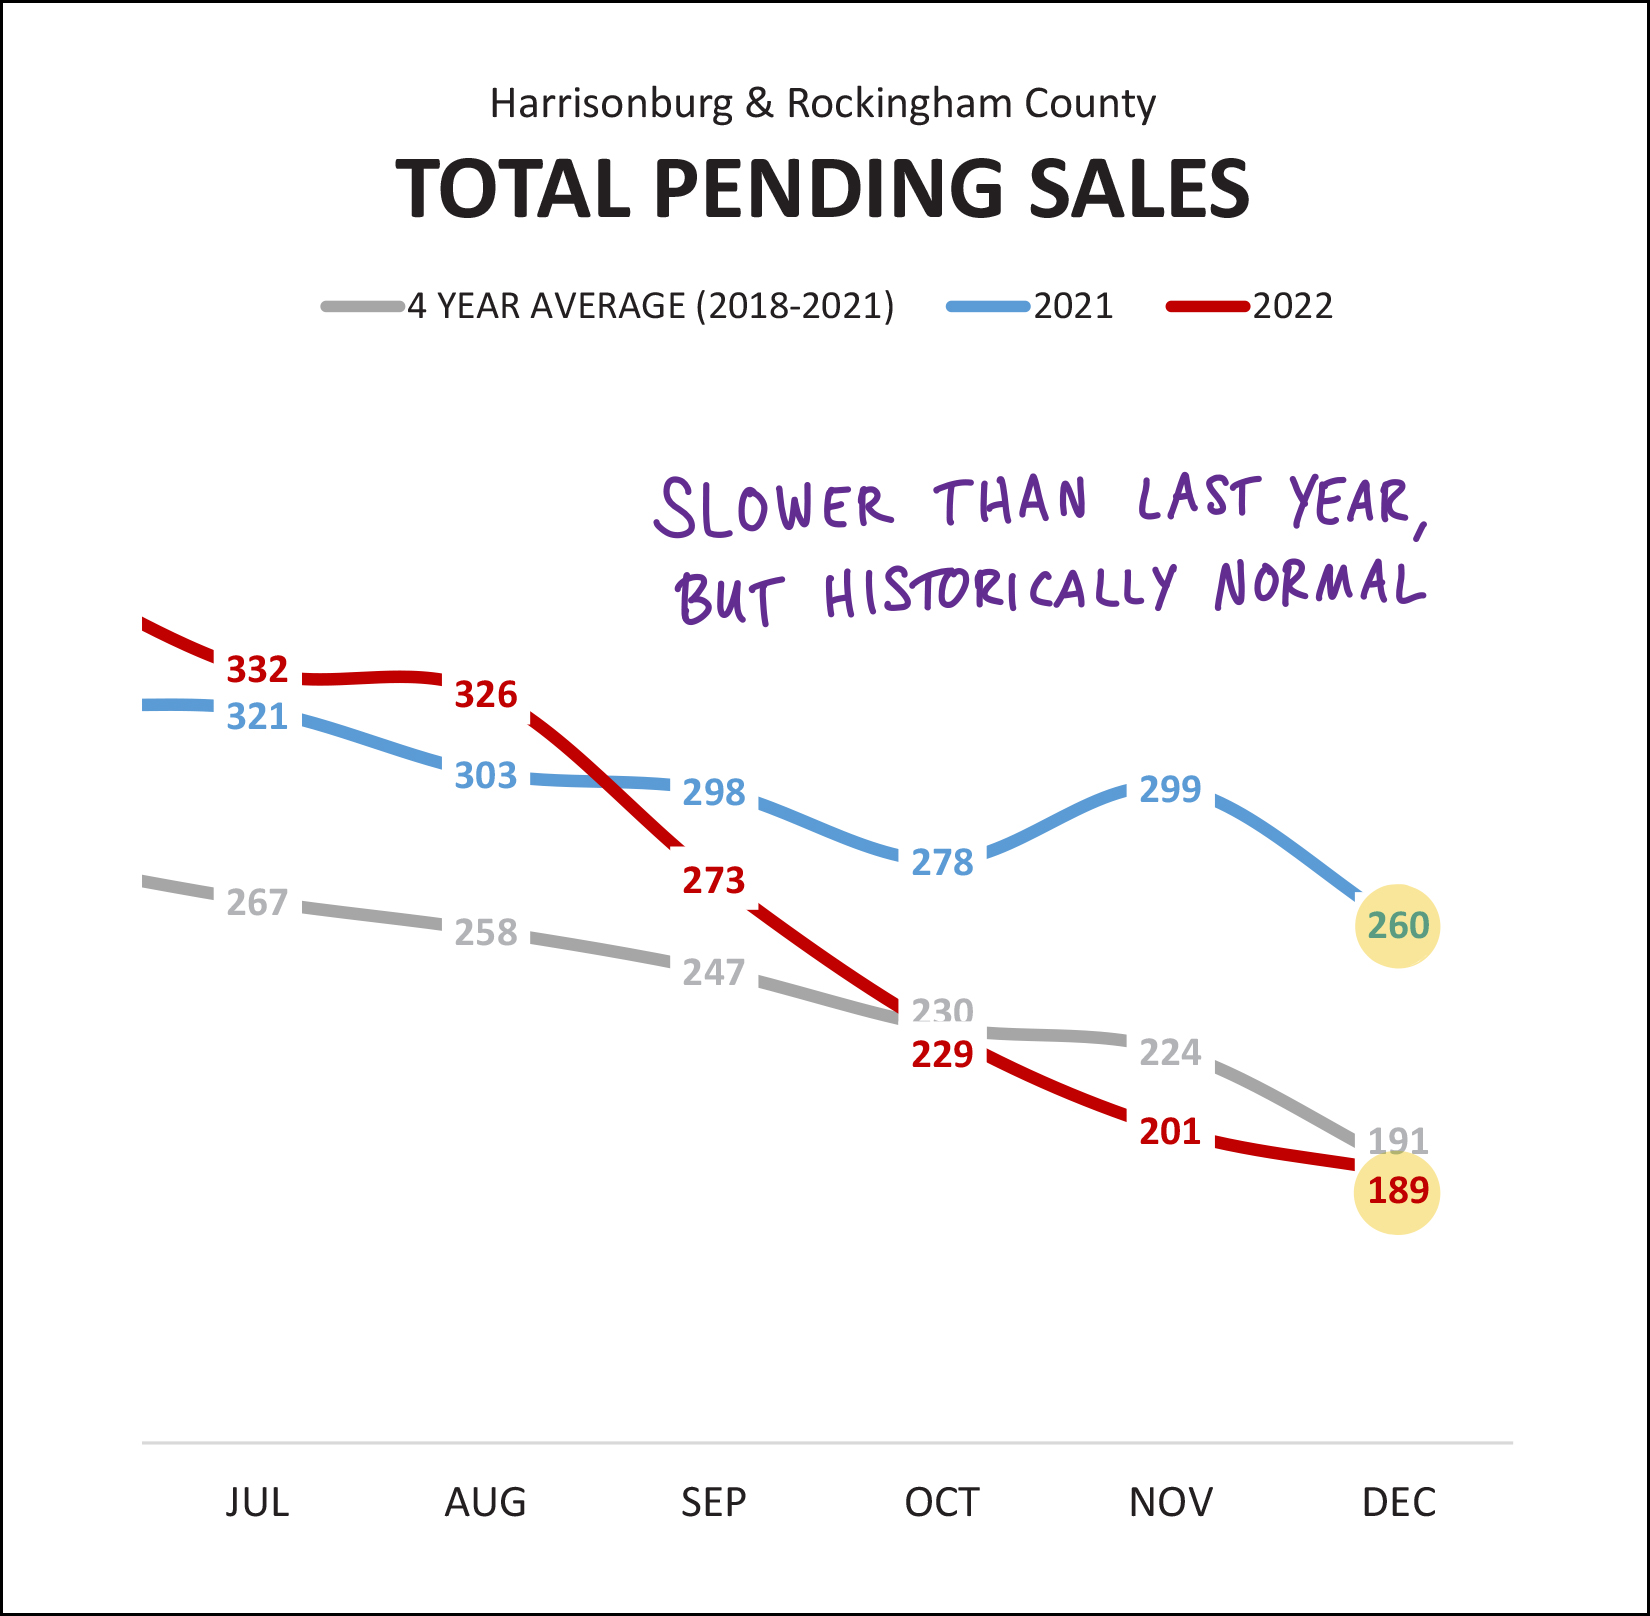 The graph above shows the number of properties that are pending (under contract) at the end of any given month. If you look at the second half of 2021 (blue line) you can see there were anywhere from 260 to 321 contracts pending from month to month. As we moved our way through 2022 the number of pending sales sank lower and lower... below that previous low of 260 all the way down to 189 pending sales at the end of the year. This graph (and the prior graph) would indicate that we will likely see a relatively slow month of closed sales in January and February. But again, looking a bit further back for context... the 189 pending sales at the end of 2022 is... just a smidgen below where we might have otherwise expected to be in a month of December. The anomaly here, it would seem, was the end of 2021 when things were still bonkers in the local real estate market due to super low mortgage interest rates among other factors. And how about those inventory levels -- they must be moving up given slower sales, right? 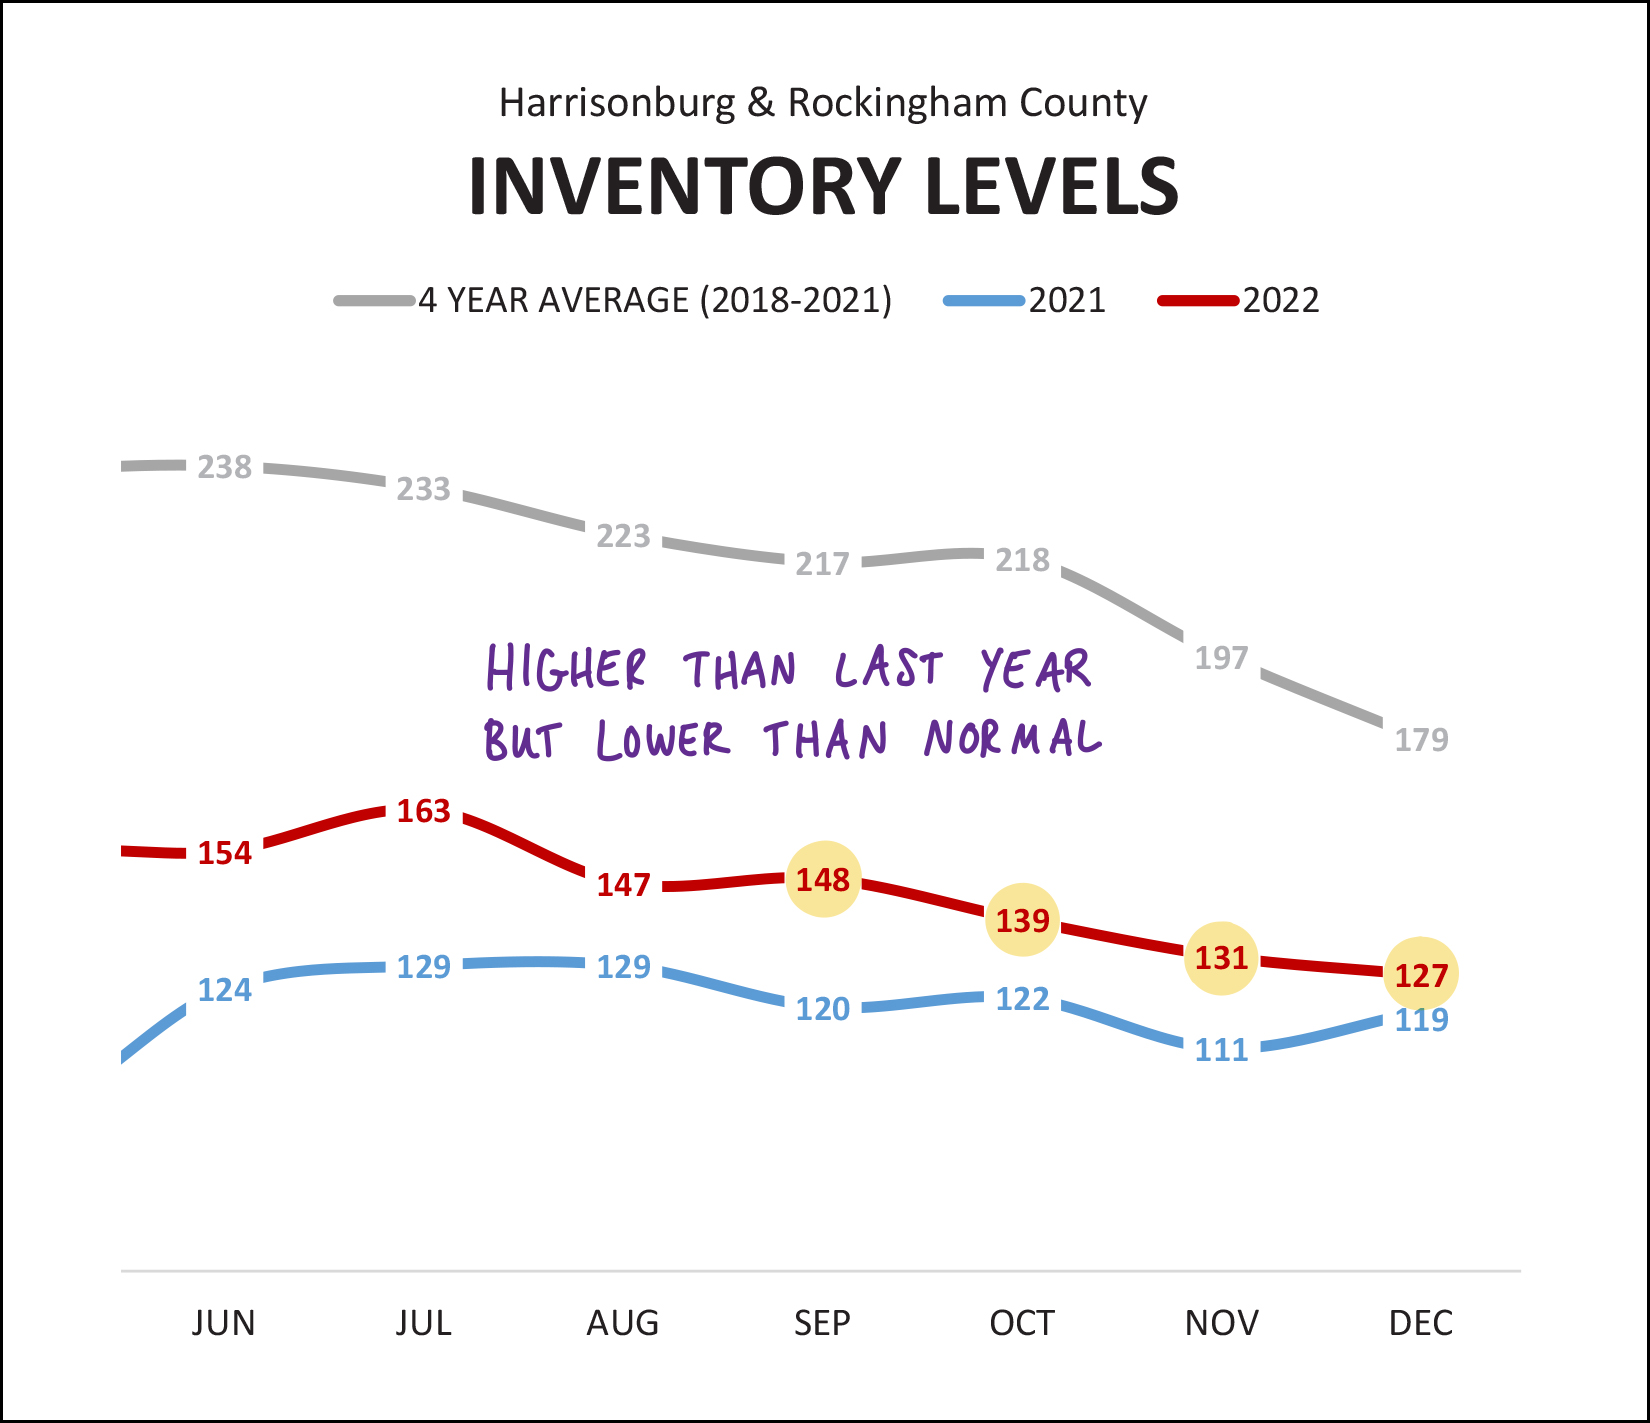 Well... maybe not. We closed out the year with 127 homes on the market in Harrisonburg and Rockingham County. Yes... this is a higher inventory level than one year prior when there were only 119 homes on the market... but it's not that much higher. Furthermore, even though the inventory levels in 2022 (red line above) were higher than in 2021 (blue line) they were still well below (!!!) the average of 2018 through 2021. These are still times over very low inventory... much to any home buyer's dismay. Oh, and how quickly are homes selling now? Slower, probably, right? 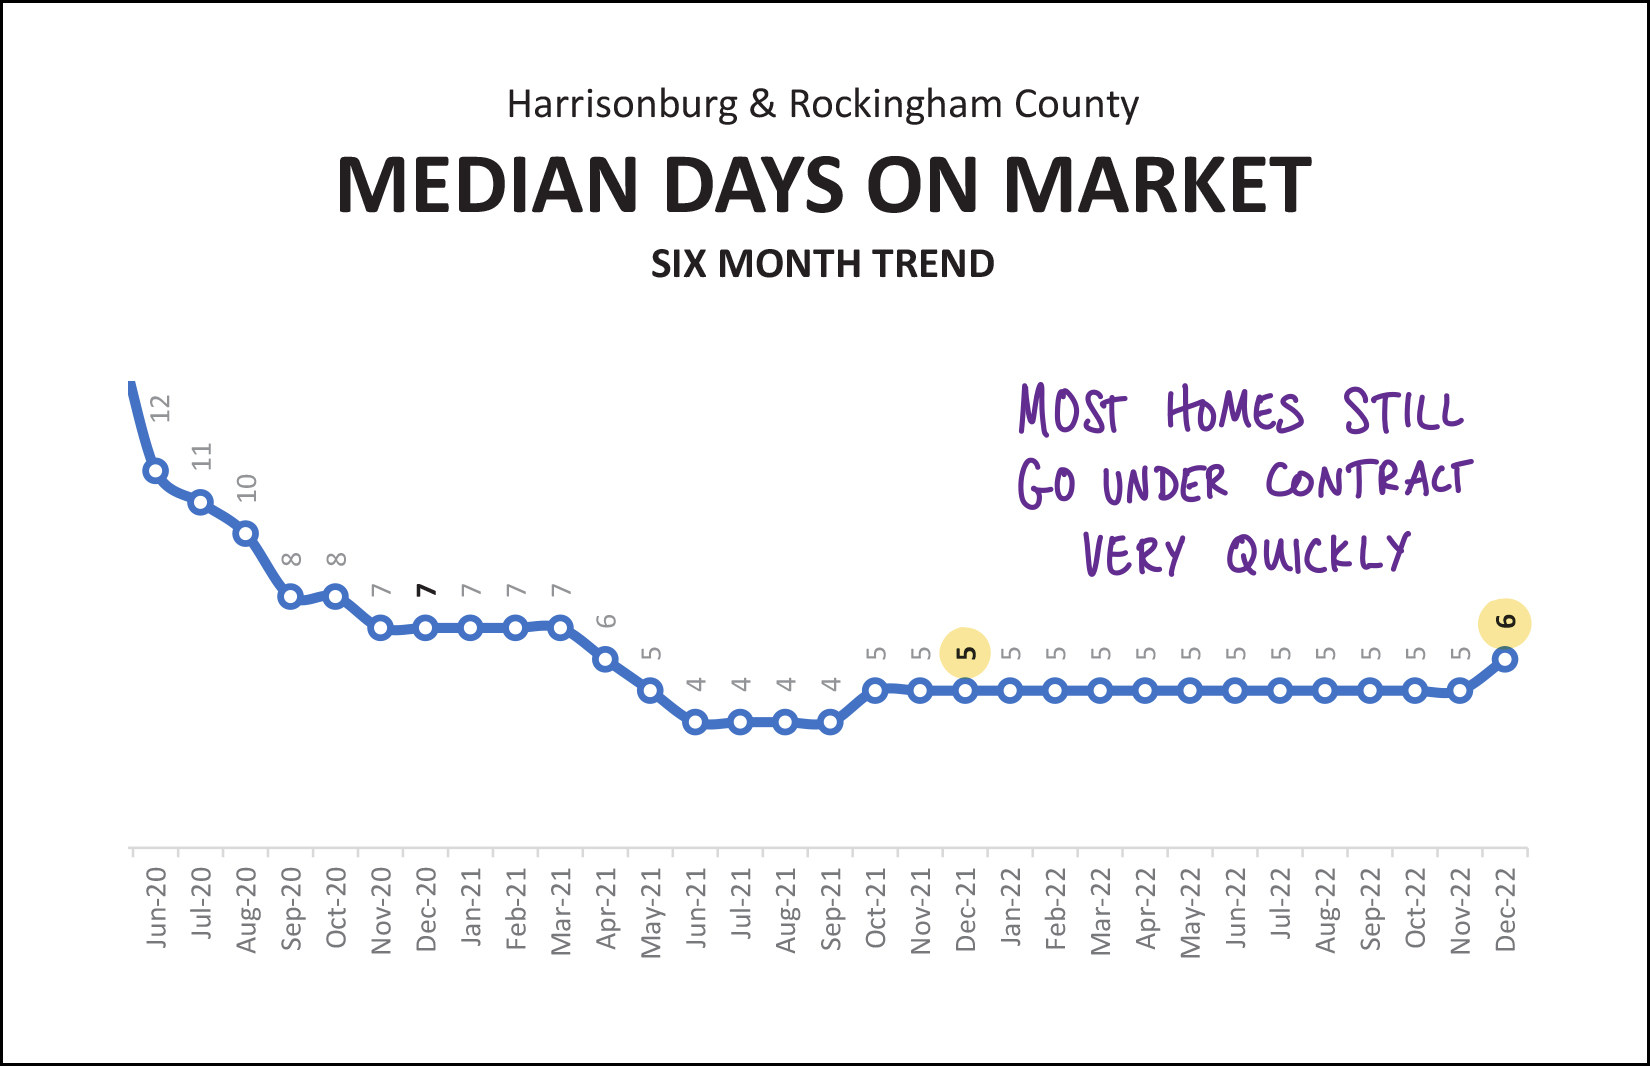 Not so much. The graph above shows the median days on market -- how quickly properties go under contract after being listed for sale -- within a six month timeframe. For over a year this metric stayed right at five days... so as to say that half of homes were under contract within five days and half took longer than five days. That has risen to... six days now. Clearly, not a significant shift, but perhaps we will see it shift further as we move forward. Of note, the median days on market two years ago was seven days... but that was after dropping steadily from double digits the summer prior. Interest rates, interest rates, all you talk about is interest rates... 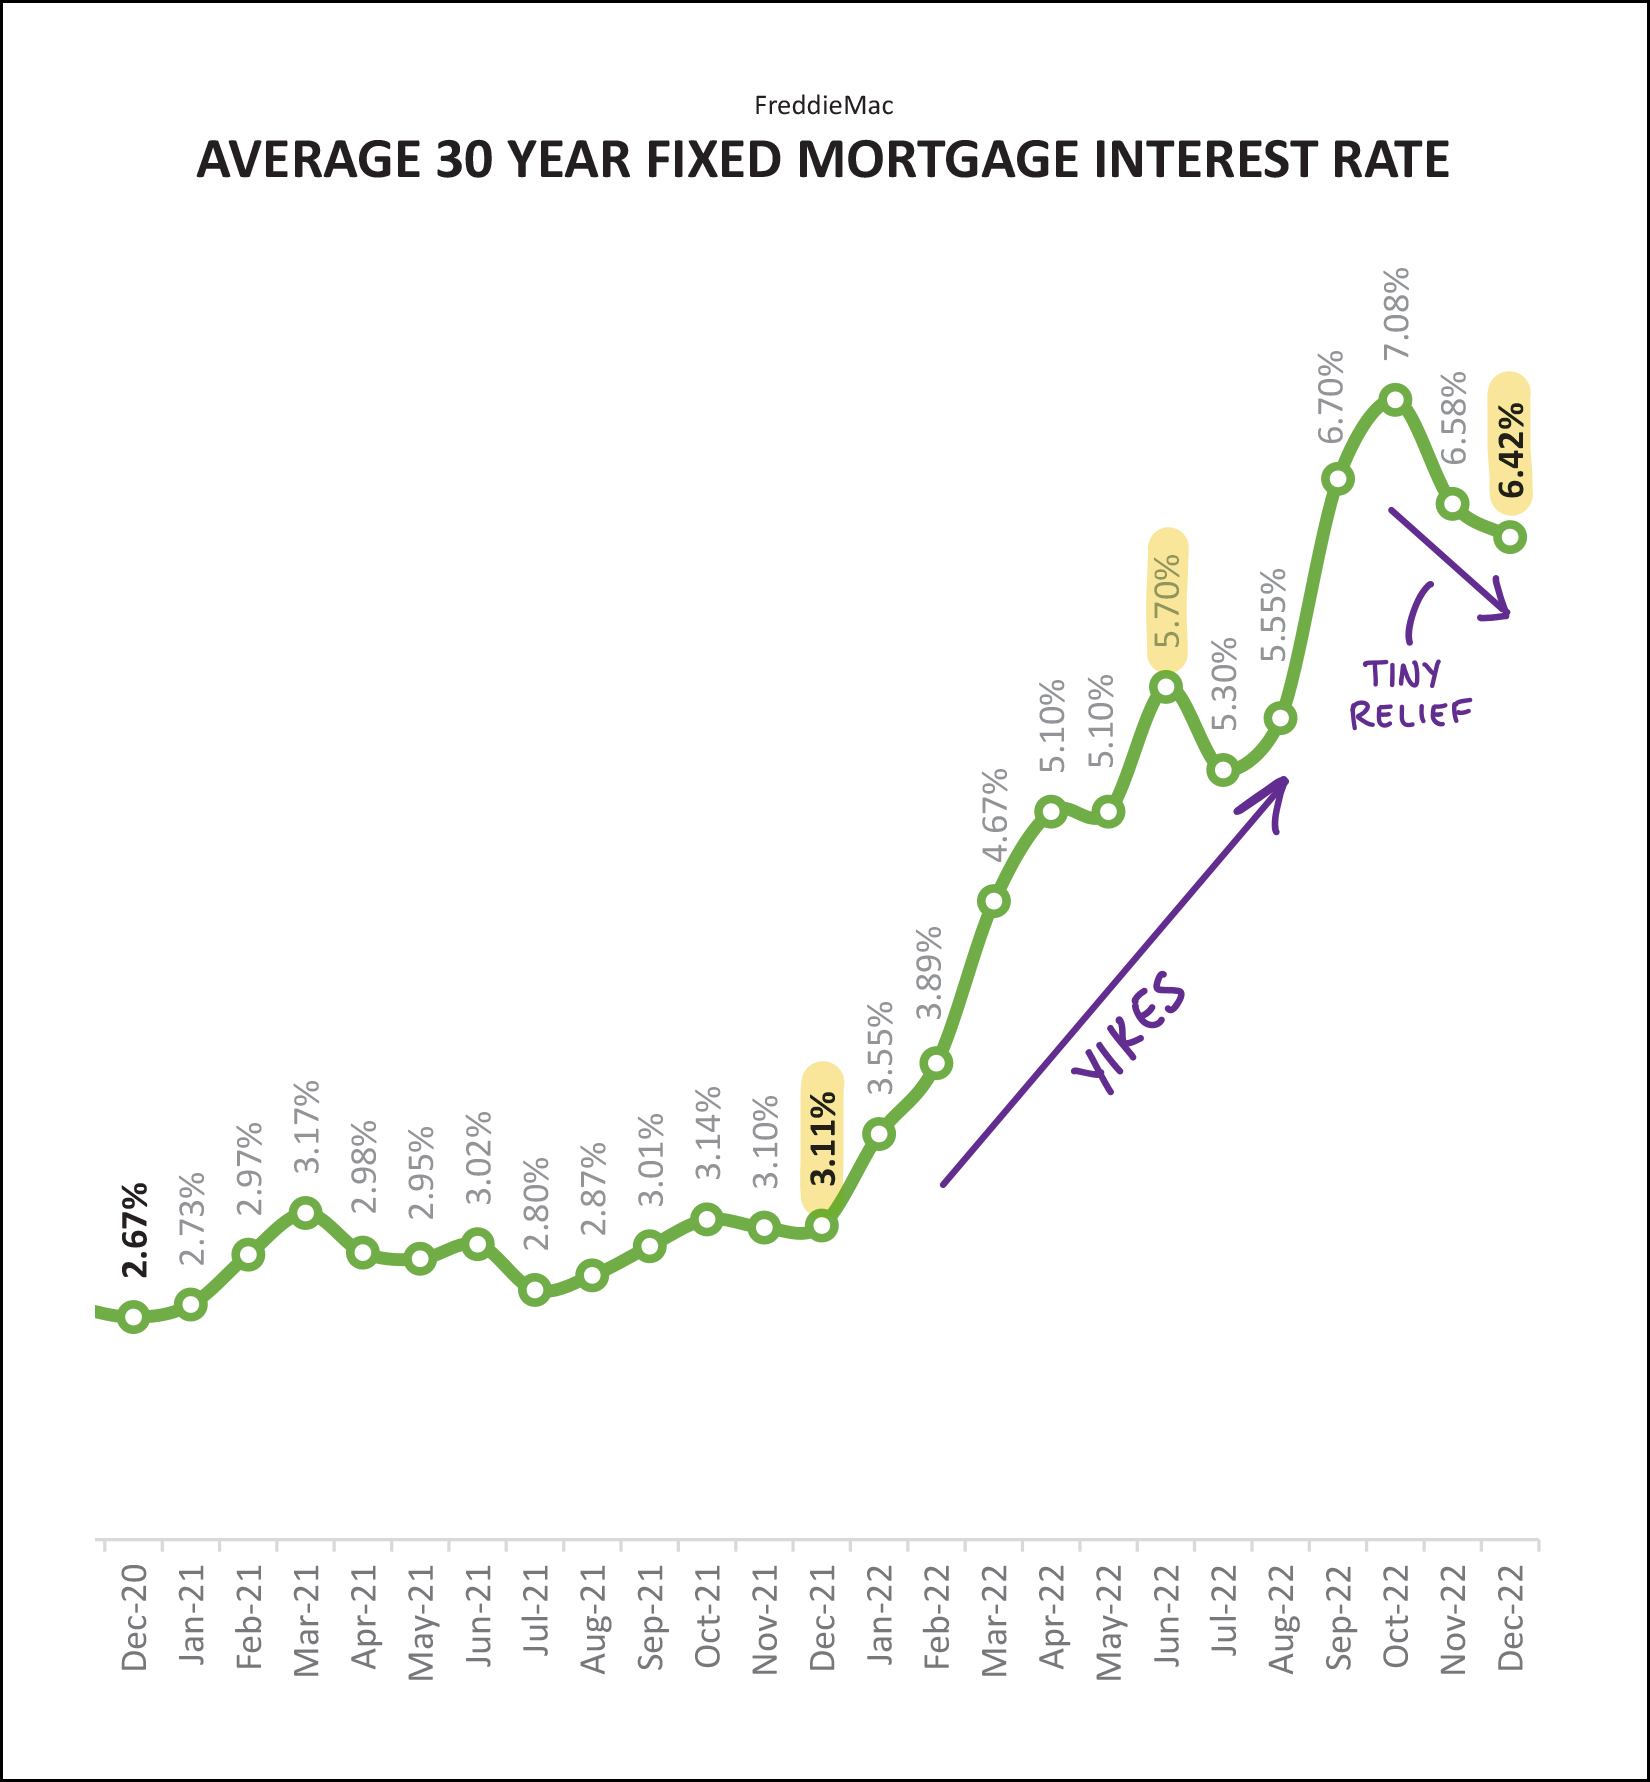 Well, yes, that's true. I have talked a lot about mortgage interest rates this month (and over the past year) because they have been rising, quickly. A year ago (as shown above) the average mortgage interest rate (on a 30 year fixed rate mortgage) was only 3.11%. We closed out 2022 with an average of 6.42%. Thankfully, these rates have continued to decline a bit further in the first few weeks of 2023... but the cost of financing a home purchase is still MUCH higher now than it was a year ago. And yes... these higher mortgage interest rates directly contributed to the slow down in home sales in the second half of 2022. Well folks, that's all for today. I hope the analysis above provides you with a bit more insight into all that has transpired in our local housing market in 2022... and a few thoughts as to where things might be headed in 2023. If you are thinking about selling or buying a home in 2023, I would be happy to assist you with that process. Yes, I spend a good bit of time analyzing our local housing market to educate our local community -- but the majority of my time is spent helping individual home sellers and home buyers. Feel free to reach out to start that conversation by emailing me or texting or calling me at 540-578-0102. I'll provide another update in about a month -- looking back at the first full month of 2023. Until then, I hope you and your family stay healthy and enjoy (???) the constant fluctuations between winter and spring temperatures we seem to be experiencing this year. ;-) Happy New Year! P.S. You can review a few more charts and graphs with further analysis of our local housing market through the close of December 2022 here. | |
We Are Starting 2023 With Fewer Homes On The Market For Sale Than Anytime In The Past Decade |
|
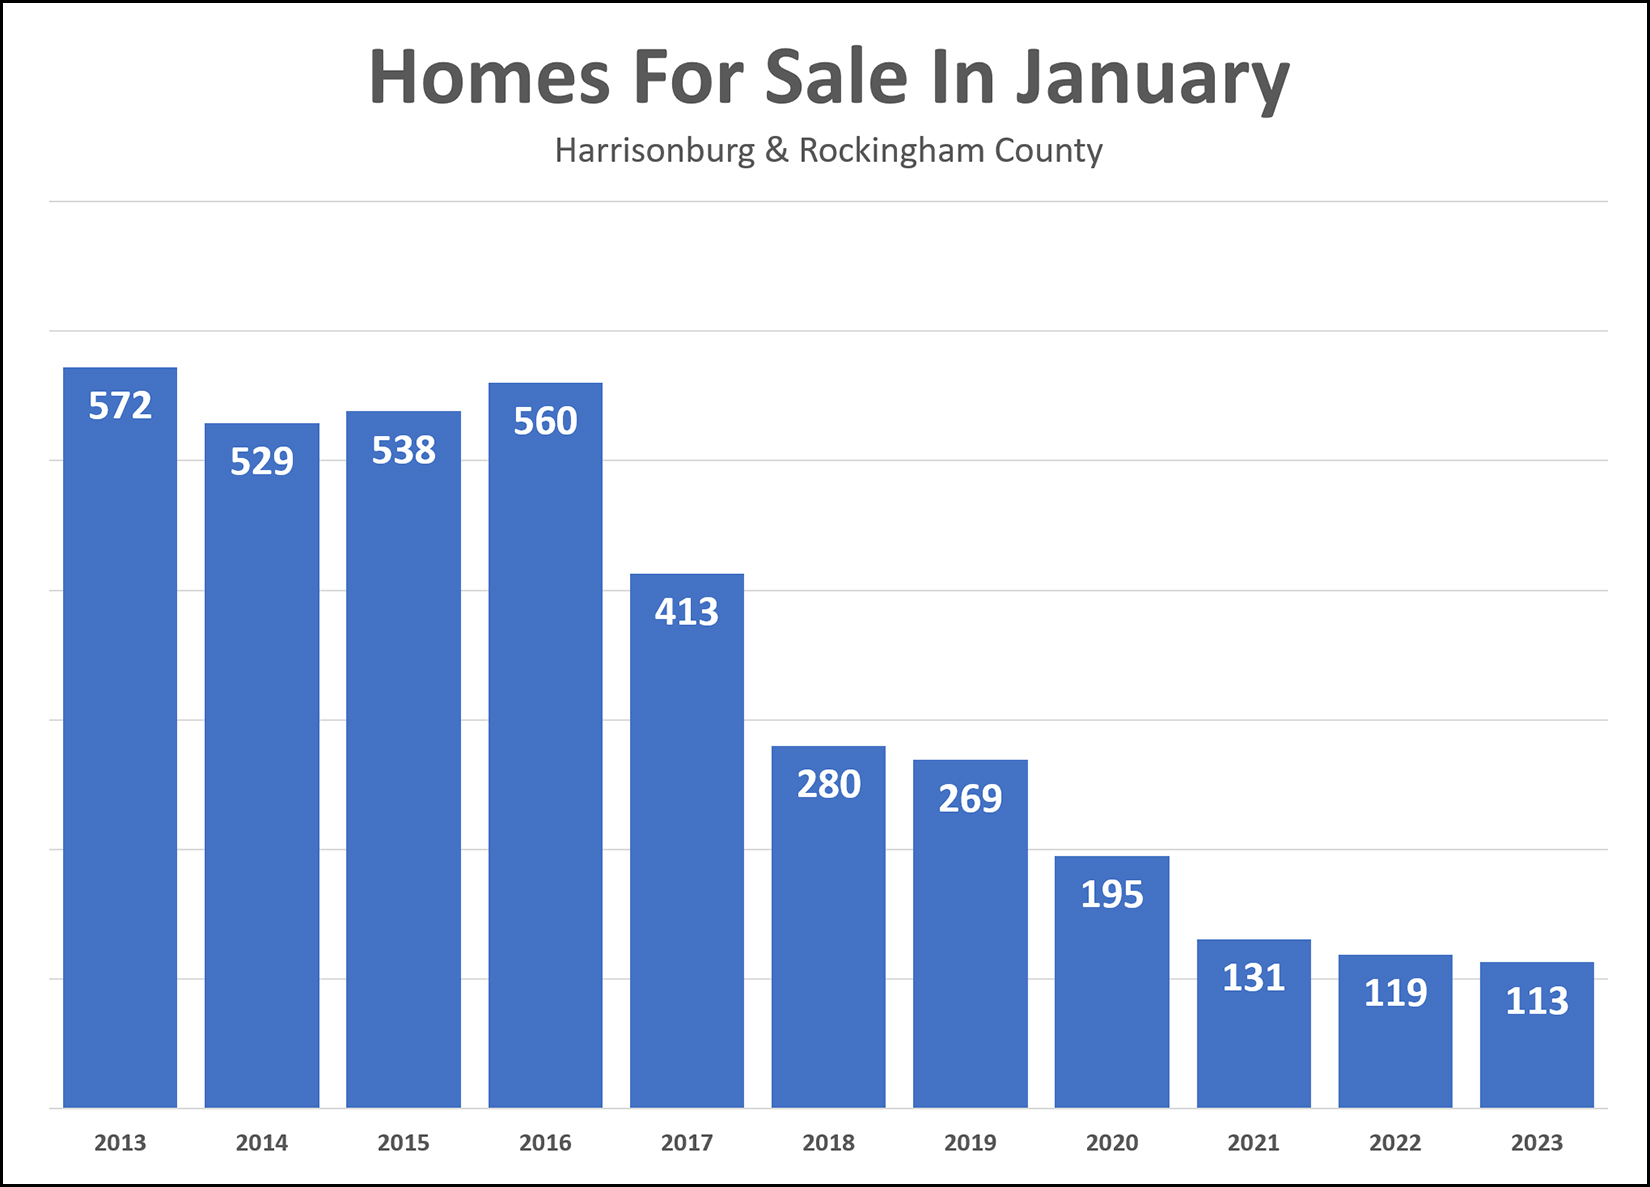 Yet another reason why it seems relatively unlikely that we will see home prices start to decline in this area... One main factor that could cause downward pressure on home prices would be if inventory levels were starting to meaningfully rise. If more sellers wanted to sell homes than there were buyers to buy them... then we might see prices level out or decline. But... as shown above... we're starting 2023 with fewer homes on the market for sale than anytime in the past decade. So... there's that. Will we see meaningful increases in the number of homes available for sale at any given time during 2023? Buyers sure hope so... but it is not yet clear whether that will actually happen this year! | |
Seasonality Might Be Back In Our Local Housing Market |
|
 Pre-COVID there were better times of year and worse times of year to list your house for sale in Harrisonburg and Rockingham County. The busiest buying seasons were spring and summer with fall close behind that... but winter was not always the best time to put your house on the market because there weren't as many buyers in the market to buy. For the past few years, however, it really didn't matter when you put your house on the market. The levels of home buyer interest were so high during late 2020, all of 2021 and early 2022 that you could literally list your home at any given time (holiday, not holiday, weekday, weekend, spring, summer, fall, winter) and it would still sell very quickly with very favorable terms. But now, perhaps seasonality is back in our local housing market. It seems that buying activity is a bit lower and slower right now which seems relatively likely to be at least partly due to the fact that we're in the middle of that stereotypically slower winter season. So... if there aren't as many home sales this winter as we saw during the winters of 2020 and 2021... perhaps we shouldn't be surprised. The real indicator of where this market is headed, therefore, might not show up until we can see what market activity looks like in the spring. | |
What Would It Take For Home Prices To Decline In Harrisonburg And Rockingham County? |
|
 I've chatted with several homeowners in the past few weeks who have wondered whether home prices will start to decline in Harrisonburg and Rockingham County in 2023 as a result of slower home sales and higher interest rates. It is certainly possible that home prices will decline in 2023, but here's what I think we would have to see first... [1] Sustained "high" mortgage interest rates. We would likely need to see mortgage interest rates stay above 6% or above 7%. I put "high" in quotes because current mortgage interest rates are simultaneously the highest we've seen in about 15 years, and also are lower than the rates for the 30 years before that. Regardless of the context one chooses, I believe we would need mortgage interest rates to stay above 6% in order to see prices decline in this area. [2] We would need to see buying activity continue to decline. There were fewer home sales in 2022 than in 2021, but only by 7%.... and 2021 will perhaps be seen as an anomaly after we get a few more years down the road. I think we'd need to see about a 20% decline (or more) in buying activity (home sales) in order to see prices meaningfully decline. [3] This one is the most important... we would likely need to see a meaningful increase in supply (inventory levels) in order to see home prices start to decline. So long as there are about the same number of buyers and sellers in the market (or more buyers than sellers in some price ranges) then there won't be much downward pressure on prices. If we get to the point where inventory levels are increasing and there are more sellers than buyers in the market then some sellers will likely start competing on price to attract buyers, which could cause prices to decline. So... will home prices decline in Harrisonburg and Rockingham County? It is certainly possible, but I don't think we can say that it is likely at this point. By April 1st, if we're still seeing high interest rates, if we see a much lower number of home sales compared to last year, and if we see inventory levels starting to climb, then maybe we will see prices flatten out or decline... but we're not seeing it yet. | |
Fewer Resale Home Sales Likely Was And Will Continue To Be A Supply Side Issue |
|
 Existing home sales declined 15% in 2022 in Harrisonburg and Rockingham County... 2021 Existing Home Sales = 1,364 2022 Existing Home Sales = 1,165 That said, overall home sales only declined 7% because new home sales increased 28% in 2022... 2021 New Home Sales = 309 2022 New Home Sales = 397 Why did existing home sales decline 15% in 2022? I don't think it was a shortage of demand. If there was a limited amount of demand for existing homes then we would see inventory levels of existing homes for sale increase. We did not see that increase in an inventory in 2022. As such, it seems reasonable to conclude that the decline in existing home sales in 2022 was a supply side issue... there were (perhaps, approximately) 15% fewer sellers willing to sell their existing homes in 2022 as compared to in 2021. Looking ahead, it seems relatively likely that this trend and supply side issue will continue. I think it is likely that we will see another decline in 2023 in the number of existing homes selling in Harrisonburg and Rockingham County... and I think it will still be a supply side issue... there are likely to be somewhat fewer home sellers willing to sell their existing homes in 2023. | |
Was Contract Activity Slower Than Expected In November And December 2022? |
|
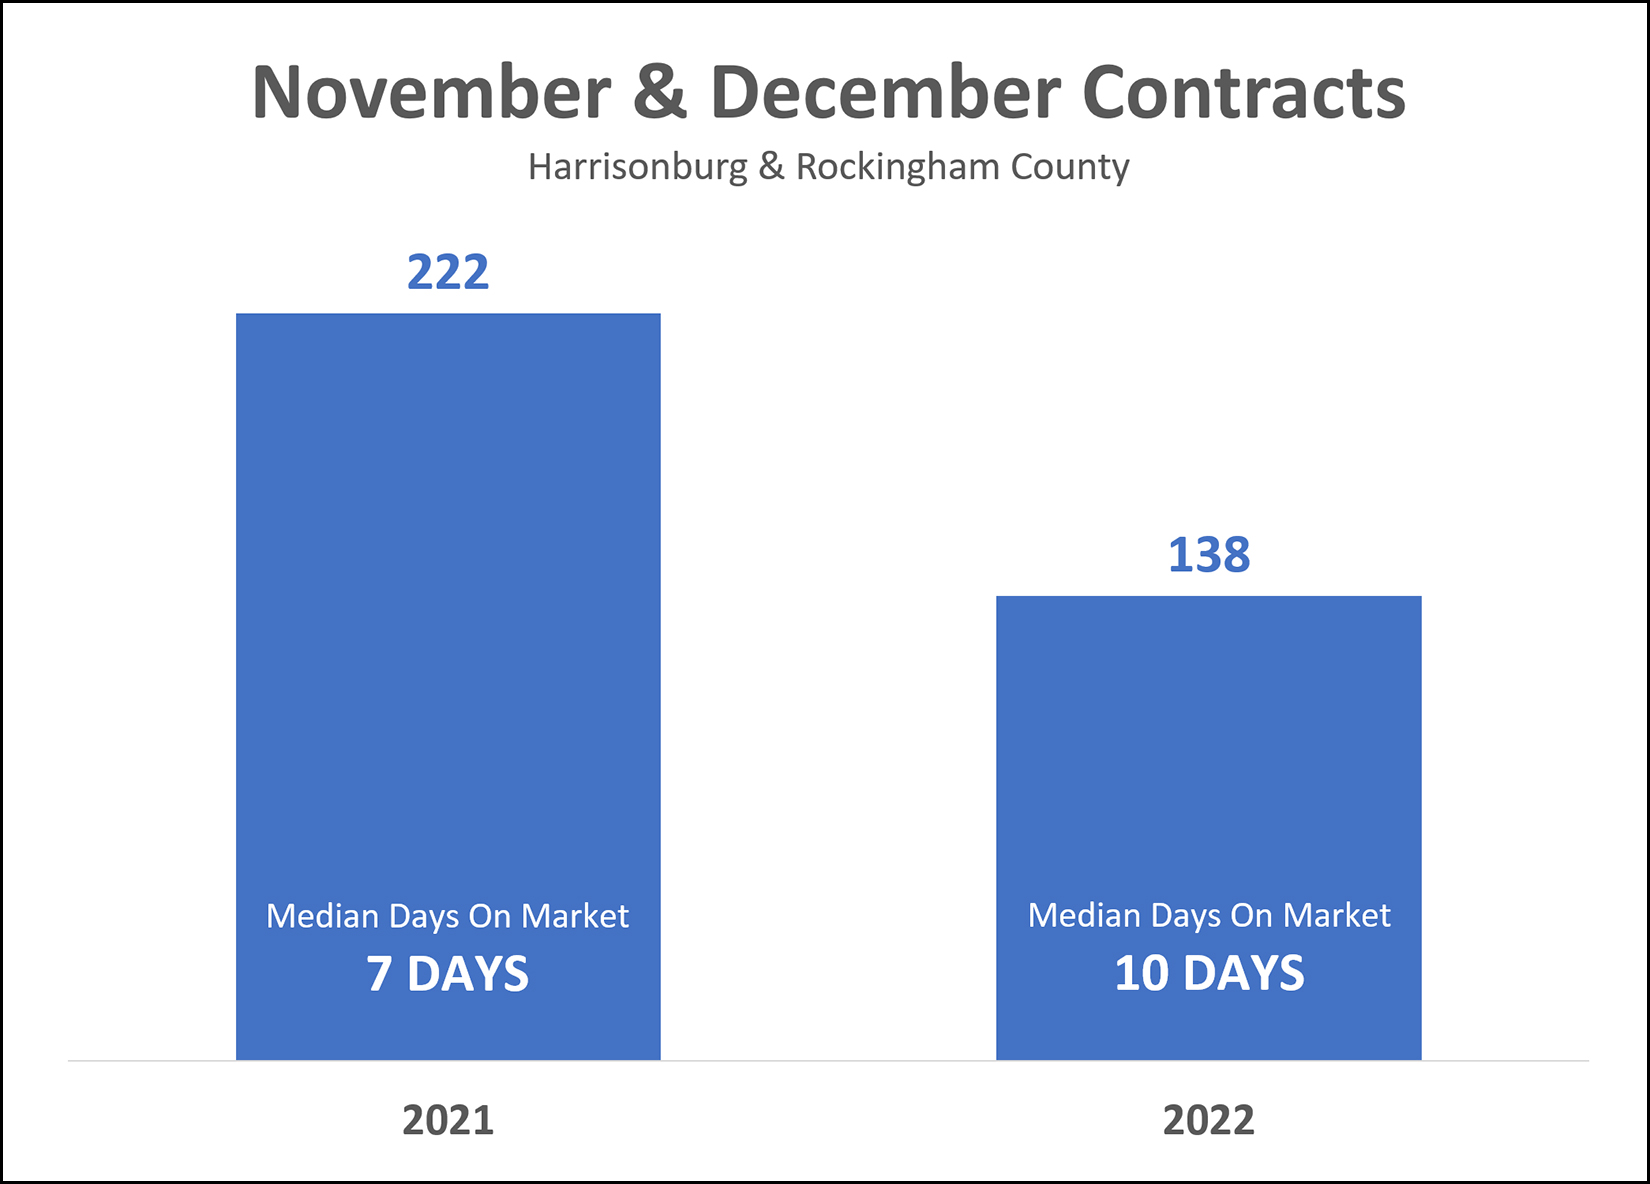 Were this past November and December (2022) a bit slower than expected when it came to contract activity? Did fewer buyers (and sellers) sign contracts to buy (and sell) homes during the last two months of 2022? I suppose whether contract activity was "slower than expected" depends on what you expected. If you were expecting the same amount of contract activity as we saw in those same months in 2021 then yes, contract activity was definitely slower than expected. As shown above, 222 contracts were signed in November and December of 2021... but only 138 were signed in those same two months in 2022. Quite a bit slower! And they went under contract... slightly (+/-) slower as well. The median "days on market" in the last two months of 2021 was seven days... and that figure rose to a median of 10 days when looking at the last two months of 2022. The super, really important, disclaimer here is that after having risen throughout all of 2022 from about 3% up to about 6%, mortgage interest rates peaked just above 7% in... November. Stay tuned to see how things unfold in January and February of 2023! | |
Existing Home Sales Declined 15% Last Year In Harrisonburg and Rockingham County |
|
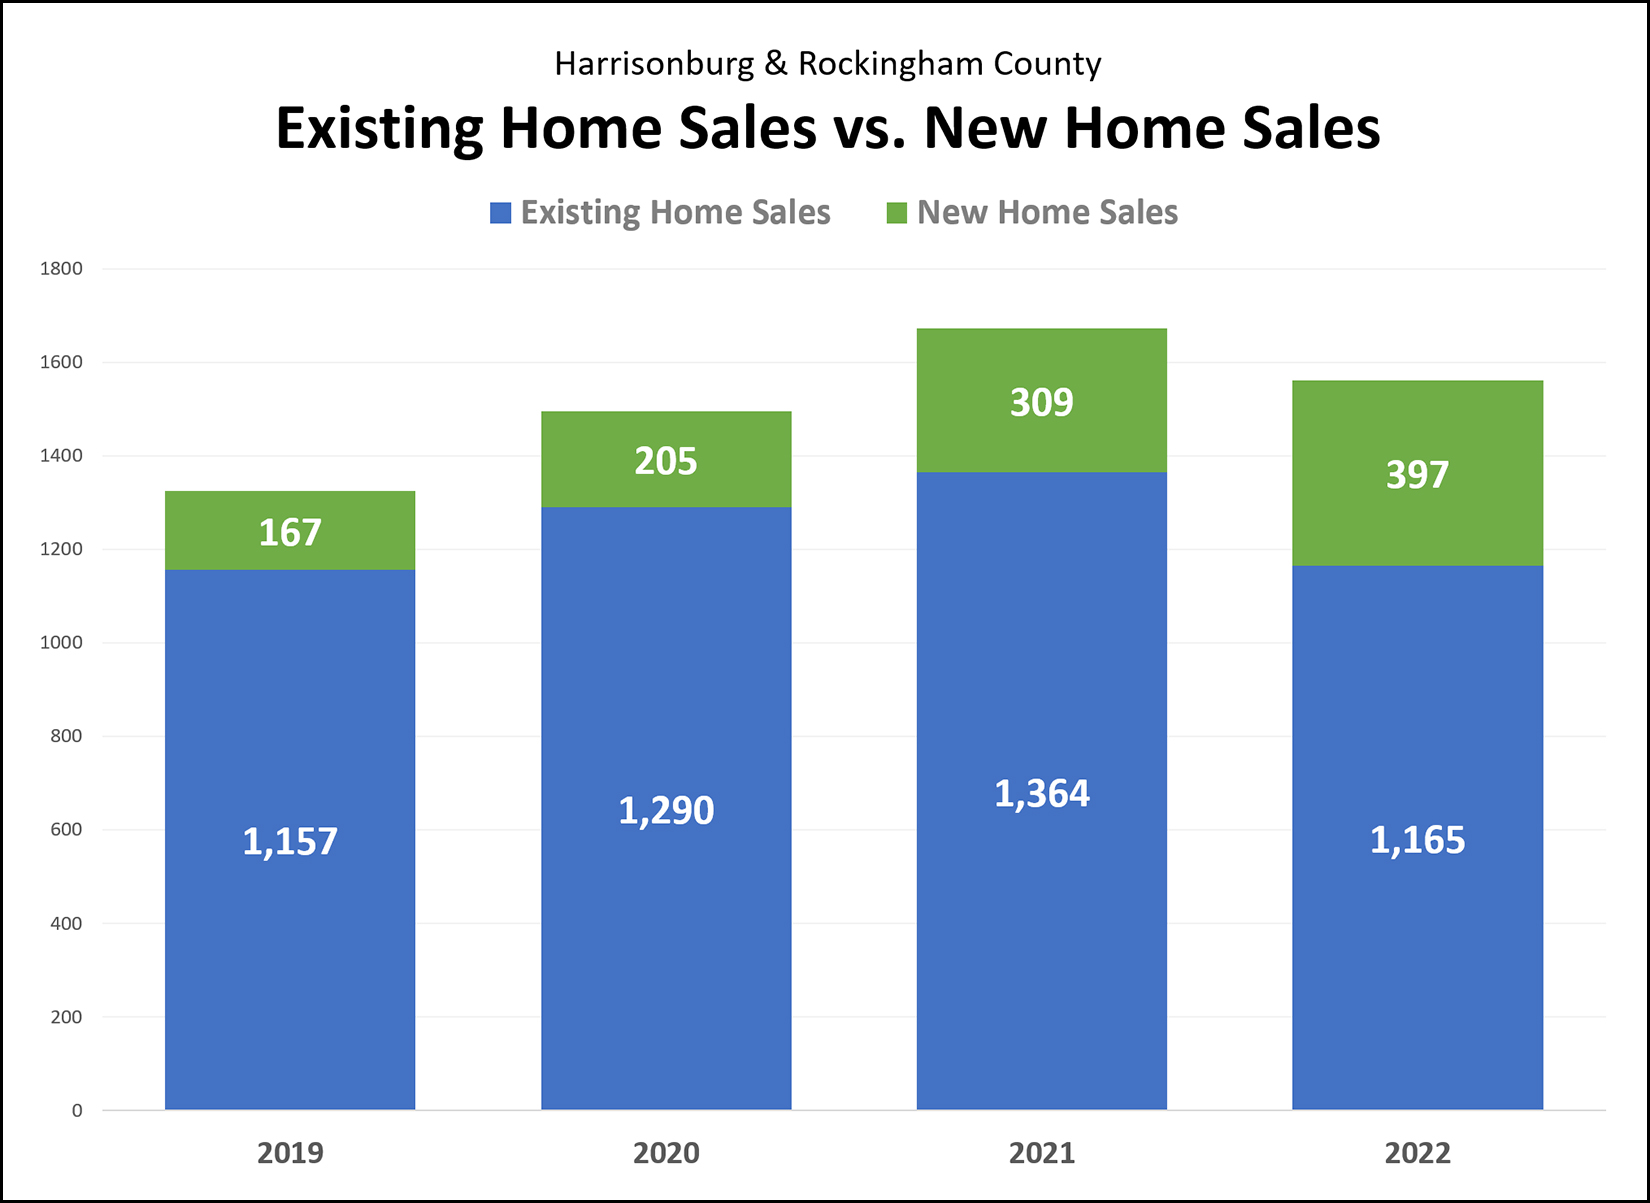 Above you can see the breakdown of sales of existing homes (blue bars) and the sales of new homes (green bars) over the past few years. While home sales declined 7% between 2021 and 2022... Existing Home Sales declined 15% in 2022... and... New Home Sales increased 28% in 2022! So, if you were hoping to buy a home last year... but you weren't interested in the particular sizes, styles or locations of the new home communities being developed in our area... and you felt like you had fewer options than you would have hoped... ...you were right... 15% fewer homeowners sold their (existing) homes in 2022 as compared to in 2021. | |
My Predictions for the 2023 Real Estate Market in Harrisonburg and Rockingham County |
|
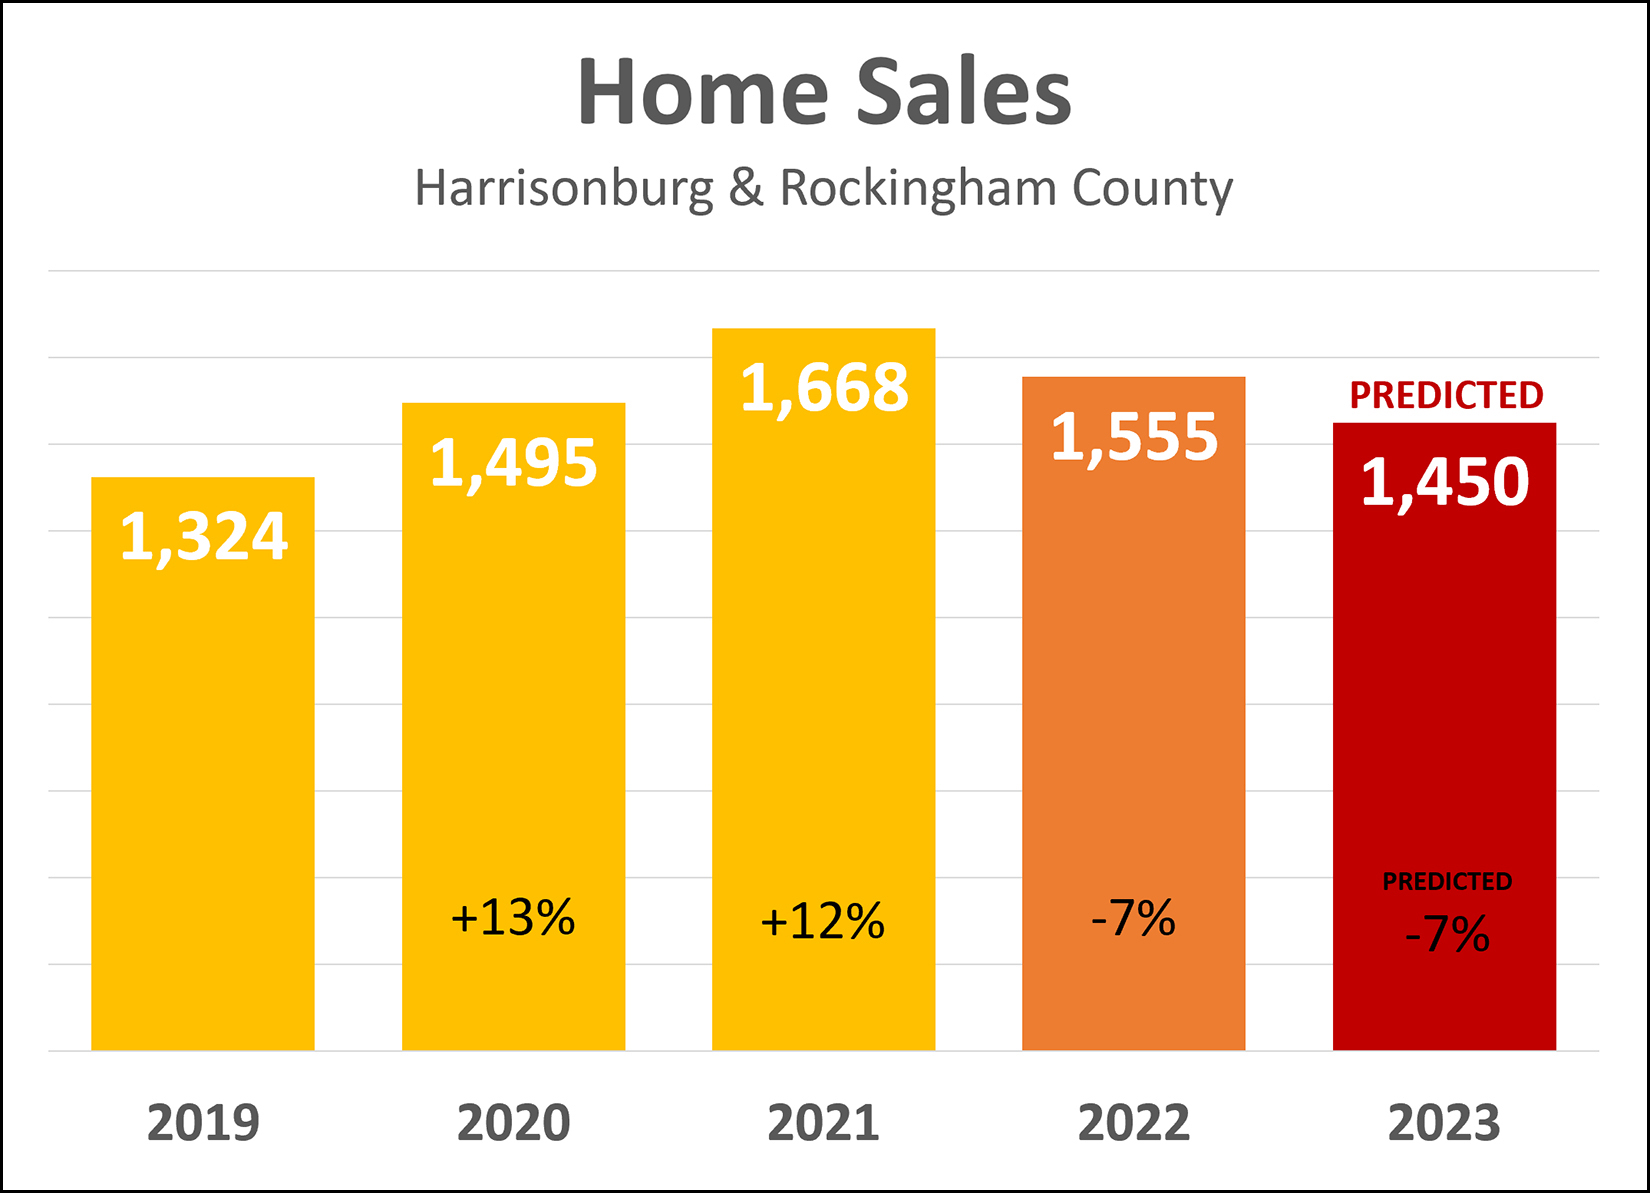 After several years of an ever increasing number of homes selling in Harrisonburg and Rockingham County, we saw a slowdown in 2022. There were 7% fewer home sales last year (2022) than the previous year (2021). One of the main reasons for this decline in the number of home selling is the increase in mortgage interest rates during 2022. The average 30-year mortgage interest rate was just above 3% at the start of 2022... and just above 6% at the end of 2022. Understandably, some would be home buyers were a bit less interested in or a bit less capable of buying with that magnitude of a change in mortgage interest rates. Looking ahead to 2023, I believe we'll see yet another decline in the number of homes selling in Harrisonburg and Rockingham County... for a few reasons... [1] I don't think we are going to see significant declines in mortgage interest rates in 2023. Perhaps they get back down to 5.5% or maybe 5.25% but I don't think we'll see them get down to (or below) 5% in 2023. With continued high(er) mortgage interest rates, I don't think we're going to see a big influx of buyers back in the market to buy who stopped looking in the second half of 2022 when rates rose. [2] I think there will be far fewer "elective" home sales and purchases. Over the past few years it was so easy to sell one's home quickly (with multiple offers, at an amazing price) and this lead to plenty of homeowners electing to upgrade to a new house. Sell easily, quickly, at a great price and buy with a super low interest rate... easy... let's do it! Now, homes won't necessarily quite as quickly and the mortgage interest rate on a purchase would be much higher... so I don't think as many buyers will sell and then buy unless they really want or really need to sell and buy. [3] Fewer home buyers upgrading (selling and buying) means fewer existing homeowners selling... which will also limit the number of homes that buyers could buy... because of the limited number of sellers selling. All that to say... I think we're going to see even fewer home sales in 2023 than we did in 2022. As per the graph above, I'm predicting another 7% decline in the number of homes selling in Harrisonburg and Rockingham County in 2023... which would take us back to a bit less active of a market than in 2019... though quite a bit more active than in 2018. And how about those sales prices... of the number of homes selling declines, will we see home prices start to decline? 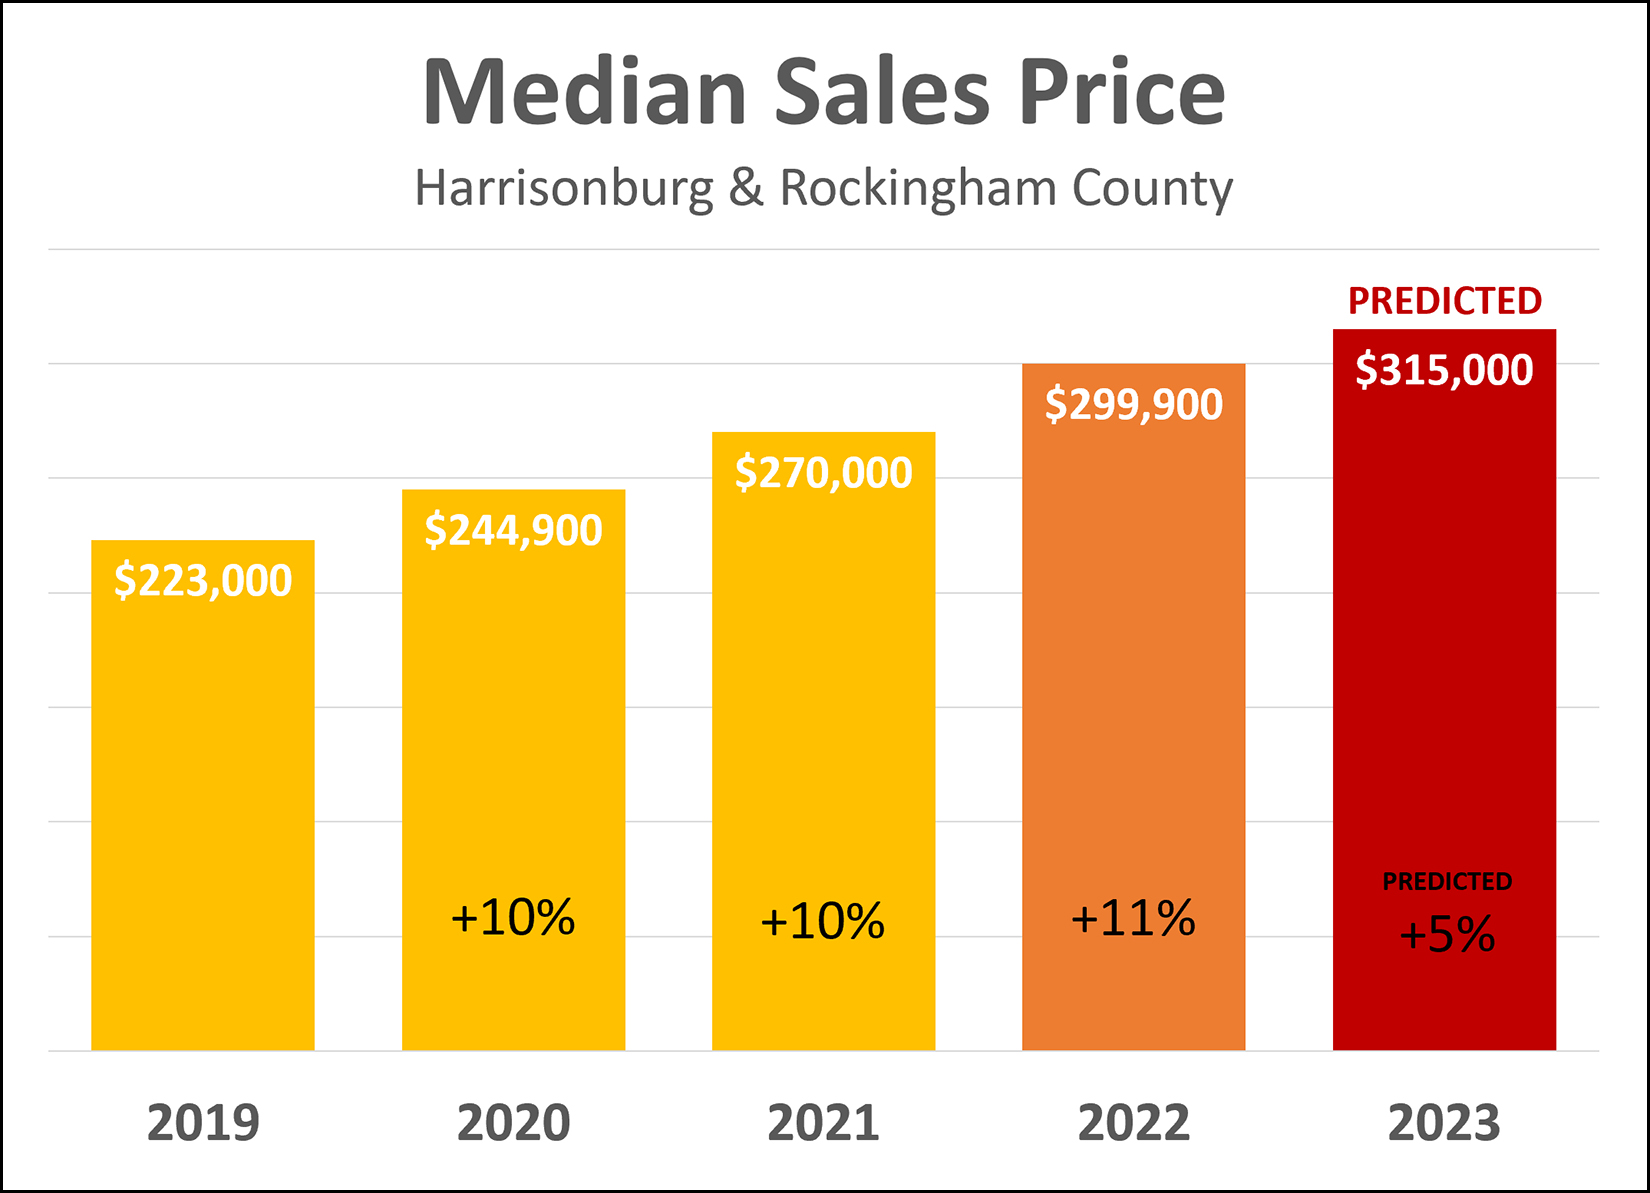 After three years in a row (2020, 2021, 2022) of double digit growth in the median sales price... I am predicting that we will see a smaller increase in that median sales price in 2023... but yes, still an increase. Here are a few of the reasons why I think we will see an increase in home prices in 2023... [1] To the extent that the price of everything keeps going up (inflation) it seems likely that home prices will continue to rise. Inflation doesn't seem to be cooling off anytime soon (yikes, no fun, not a fan) which would make it even more surprising if we saw home prices start to decline. [2] The decline in home sales in 2022 -- and the predicted decline in 2023 -- have been a result in lower levels of buyer interest, but despite that, inventory levels have not meaningfully increased. Slightly fewer buyers are buying, but because slightly fewer sellers are selling, inventory levels have remained consistently low, which does not provide any downward pressure on home prices. [3] The Harrisonburg area continues to be a popular place to live, work, relocate, retire... and this continued interest in this growing area seems likely to keep home prices rising. All that is to say, I think we'll see an increase in home prices over the next year... but not as large as we have seen for the past three years. I am predicting a 5% increase in the median sales price over then next year. So... I'm predicting fewer home sales and a continued increase in sales prices... how could I be wrong? How could I be wrong? Plenty of ways. ;-) 1. We could see an even sharper drop in the number of homes selling if mortgage interest rates go even higher or if inflation gets even more out of control or if we enter into a full blown recession or if there are other major economic and job market changes in 2023. 2. We could end up seeing an increase in home sales if mortgage interest rates start to decline significantly, or if there is major employment growth in the area resulting in ever more would be residents seeking to buy a home. 3. We could end up seeing another 10% (or higher) increase in the median sales price if buyer demand continues to outpace seller supply. We're still in that territory now... but I think that price growth is going to soften a bit in 2023. But yes, prices really could rise another 10% or more in 2023. 4. We could see a decline in the median sales price if mortgage interest rates keep rising and if home buyer activity falls significantly and if inventory levels start rising. There you have it folks... my predictions for local housing market in 2023. What are your predictions? Where is our local market headed next? | |
Looking Back At My Predictions For The 2022 Harrisonburg Real Estate Market |
|
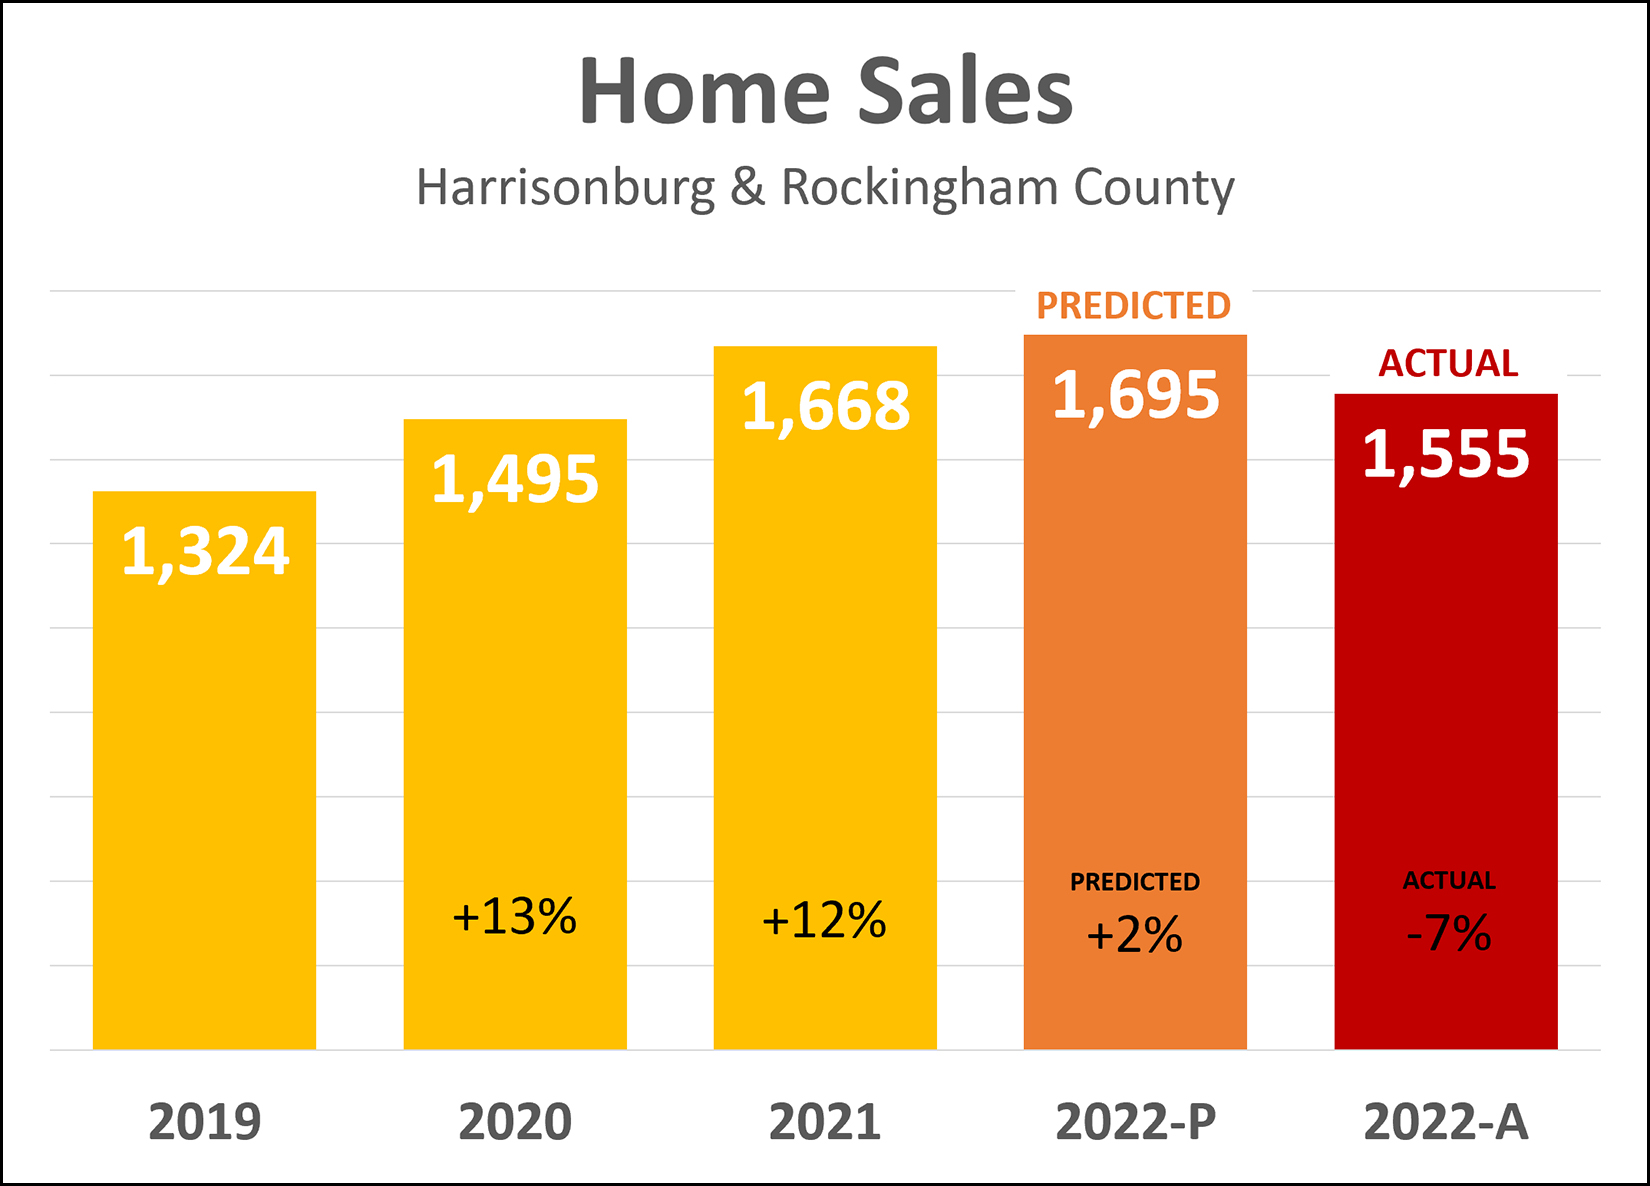 Within the first week of 2022 I made two predictions for the 2022 Harrisonburg and Rockingham County real estate market related to how many home sales we would see, and what changes we would see in the median sales price in our market. As shown above, I was predicting a 2% increase in the number of home sales in our market... from 1,668 sales up to 1,695 sales. But... higher mortgage interest rates intervened, cooling buyer demand, leading to a 7% decline in home sales... from 1,668 sales down to 1,555 sales. And how about those prices... 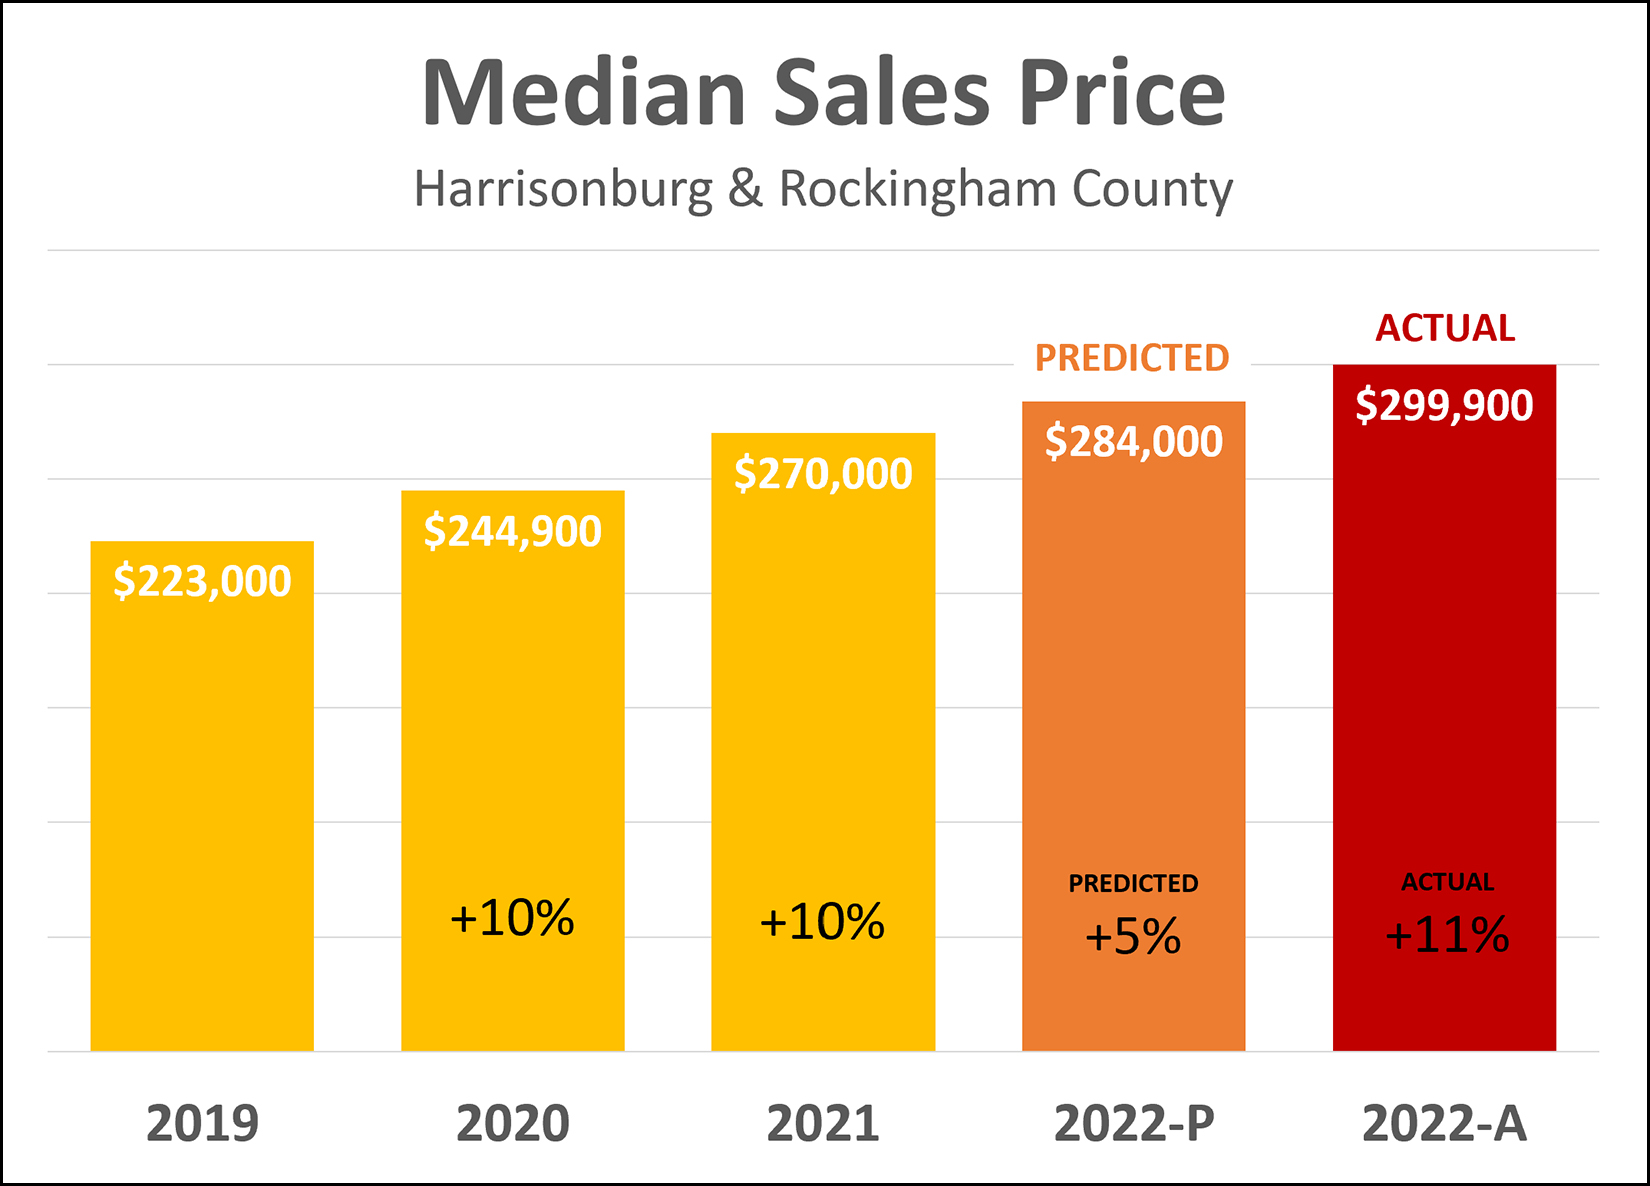 As you can see above, I was predicting that after two years (!!) of 10% increase in the median sales price that we would only see a 5% increase in the median sales price last year... which would have been an increase from $270,000 to $284,000. But, in actuality, high levels of buyer demand throughout most of the year lead to an increase in the median sales price that was much larger than I had predicted. The median sales price in our local market increased 11% in 2022, from $270,000 up to $299,900! Stay tuned later this week for my predictions for the local housing market in 2023. | |
Median Sales Price In A Larger (Longer) Context |
|
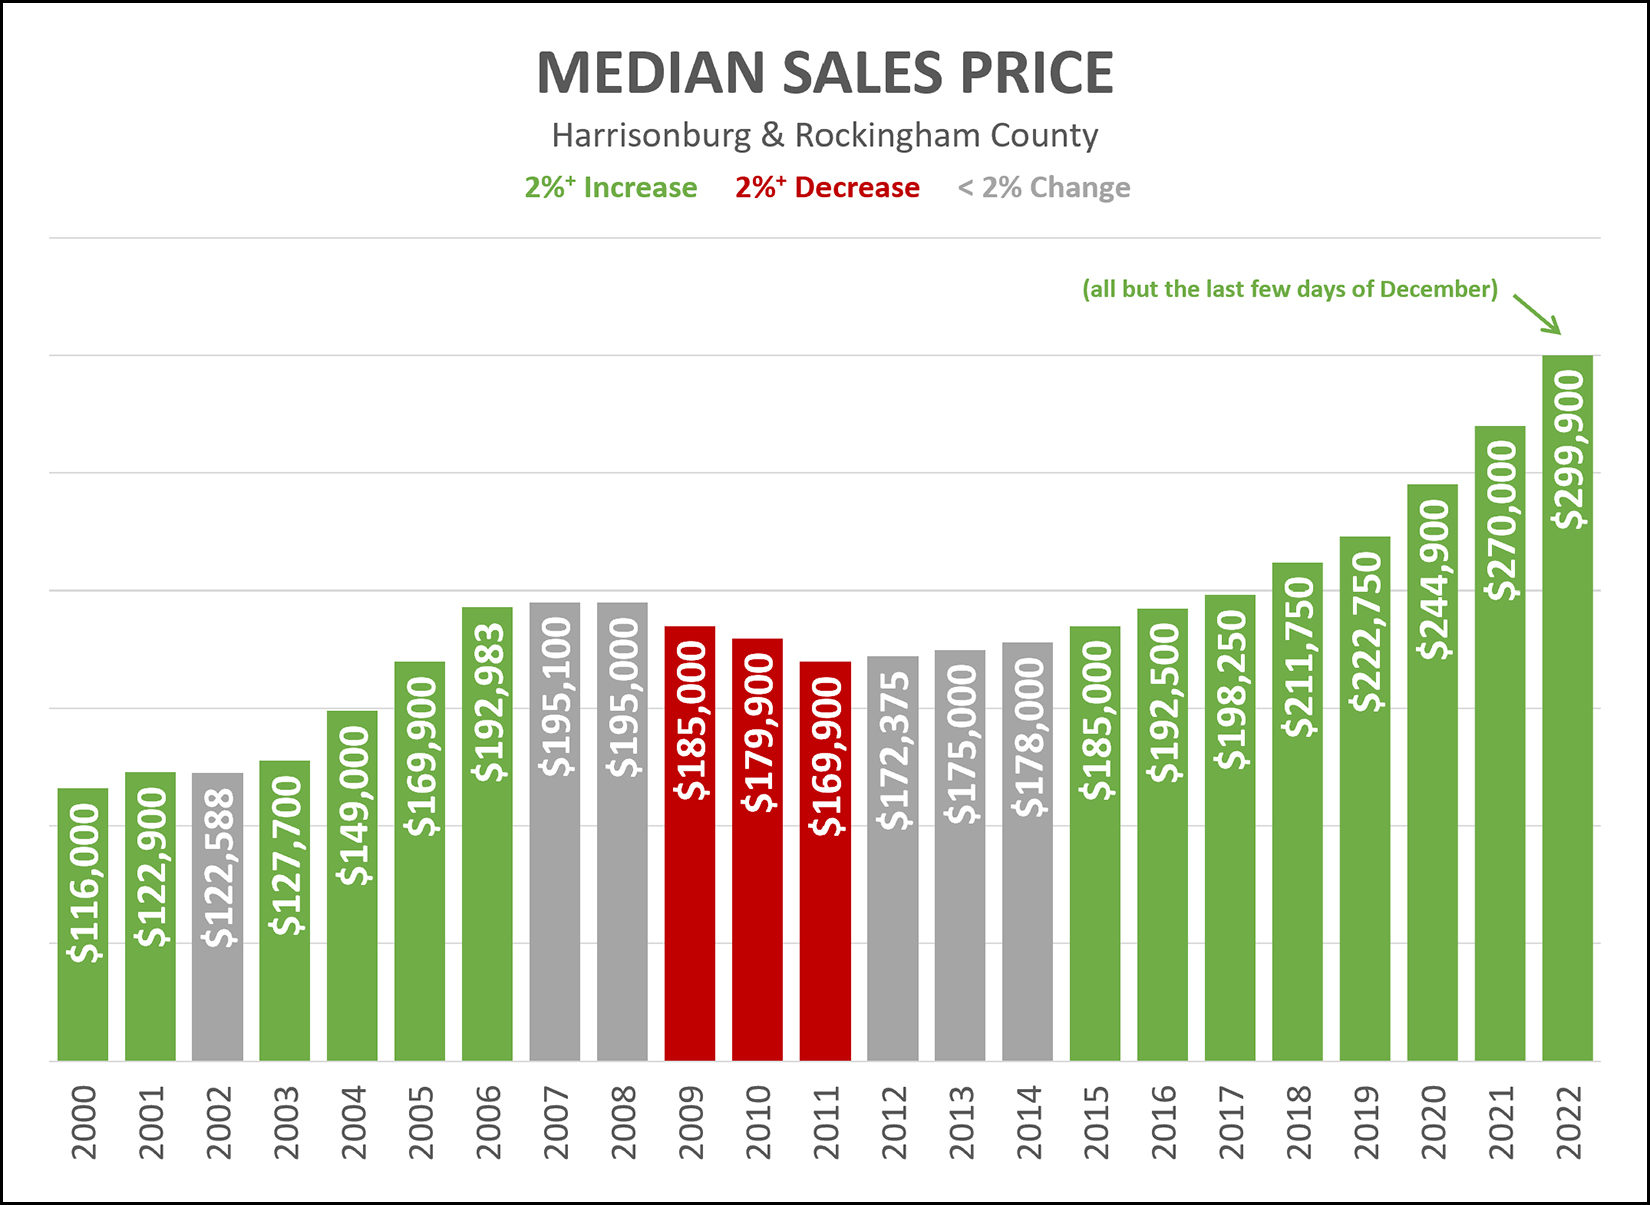 We have seen three distinct periods of changes in the median sales price in the Harrisonburg and Rockingham real estate market... 2000 - 2006 = Growth 2007 - 2014 = Minor, Slow, Correction 2015 - 2022 = Growth What's on everyone's mind now is... what comes next! Will we see prices continue to rise in 2023? Will they level out? Will they decline a bit? I have no answers. ;-) I'll make some guesses next week. | |
Annual Home Sales In A Larger (Longer) Context |
|
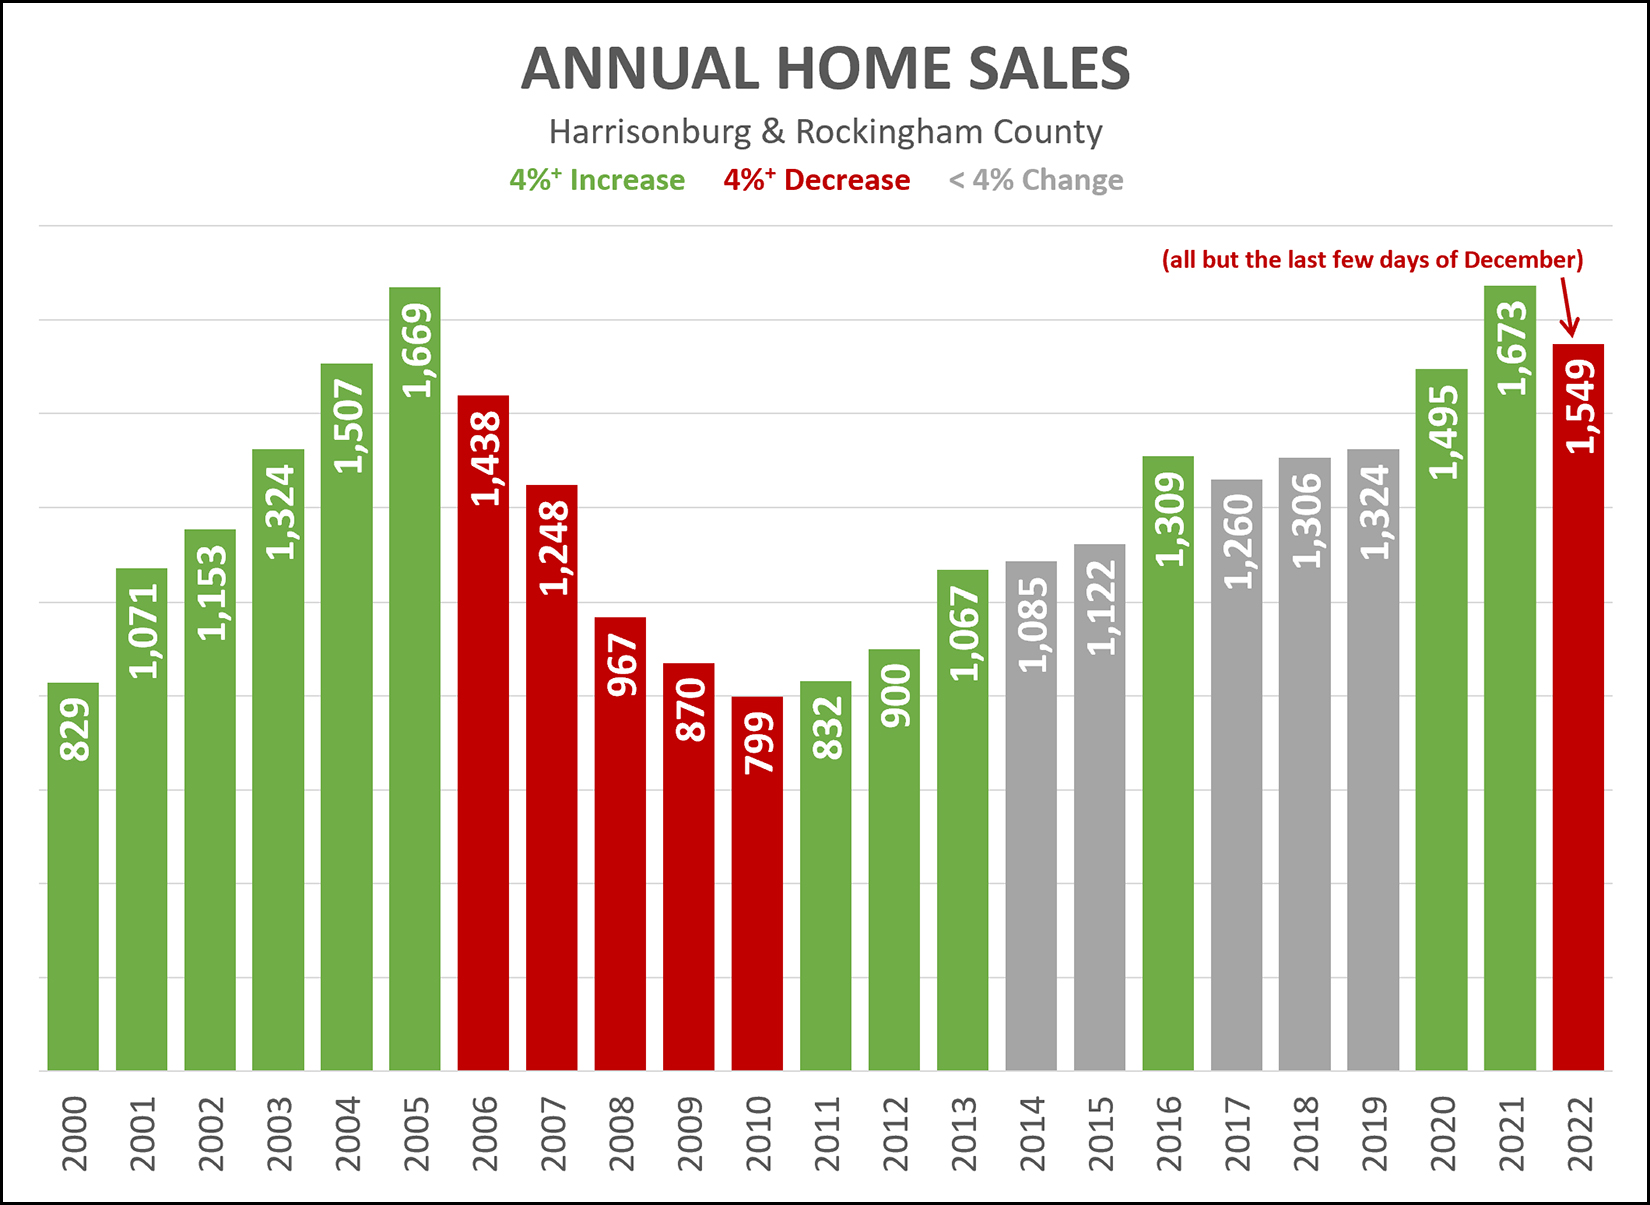 Even after the last few home sales of 2022 are tabulated, we'll see a net decline in the number of homes selling in 2022 as compared to 2021. In the graph above I have each year color coded as follows... GREEN = 4% or greater increase in # home sales RED = 4% or greater decrease in # home sales GREY = less than a 4% change in # home sales Thus, as you can see, we've seen an increase in the pace of home sales in the local market, or less than a 4% change in the pace of home sales, every year since 2000 except for in 2006, 2007, 2008, 2009 and 2010... and now, 2022. It's hard to say at this point what 2023 will look like, but it seems reasonable to think we may see another (+4%) decline in the numbers of homes selling in Harrisonburg and Rockingham County. | |
Even With A Slower Second Half Of 2022, It Will Have Been The Third Strongest Year Of Sales, Ever |
|
 Mortgage interest rates rose considerably in the second half of 2022 -- actually, even as early as mid-April they had already surpassed 5%. These higher rates eventually (months later) lead to a slowdown in the number of homes selling in 2022. Yet, despite this slowdown, 2022 will close out as the second strongest year of home sales in Harrisonburg and Rockingham County, ever. Thus far in 2022 we have seen 1,548 home sales in Harrisonburg and Rockingham County as reported in the HRAR MLS. Last year, in all of 2021, there were 1,668 home sales. As such, yes, we aren't breaking any records this year. But, prior to 2021, there was never a year with more than 1,500 home sales in a single year. The closest (which was quite close) was 2020 with 1,495 home sales. So, was 2022 a much slower, much weaker year of home sales in this area? Not really. It was slightly slower than last year... but stronger than every other year before that, ever. NOTE: After having awarded 2022 with the beautiful second place ribbon above I then looked back even further beyond the past decade and found that there WAS one other year with more home sales than 2022... way back in 2005. So, 2022 will really end up being the third strongest year of home sales, ever. | |
Home Sales Slow In November 2022, But Prices Keep On Rising |
|
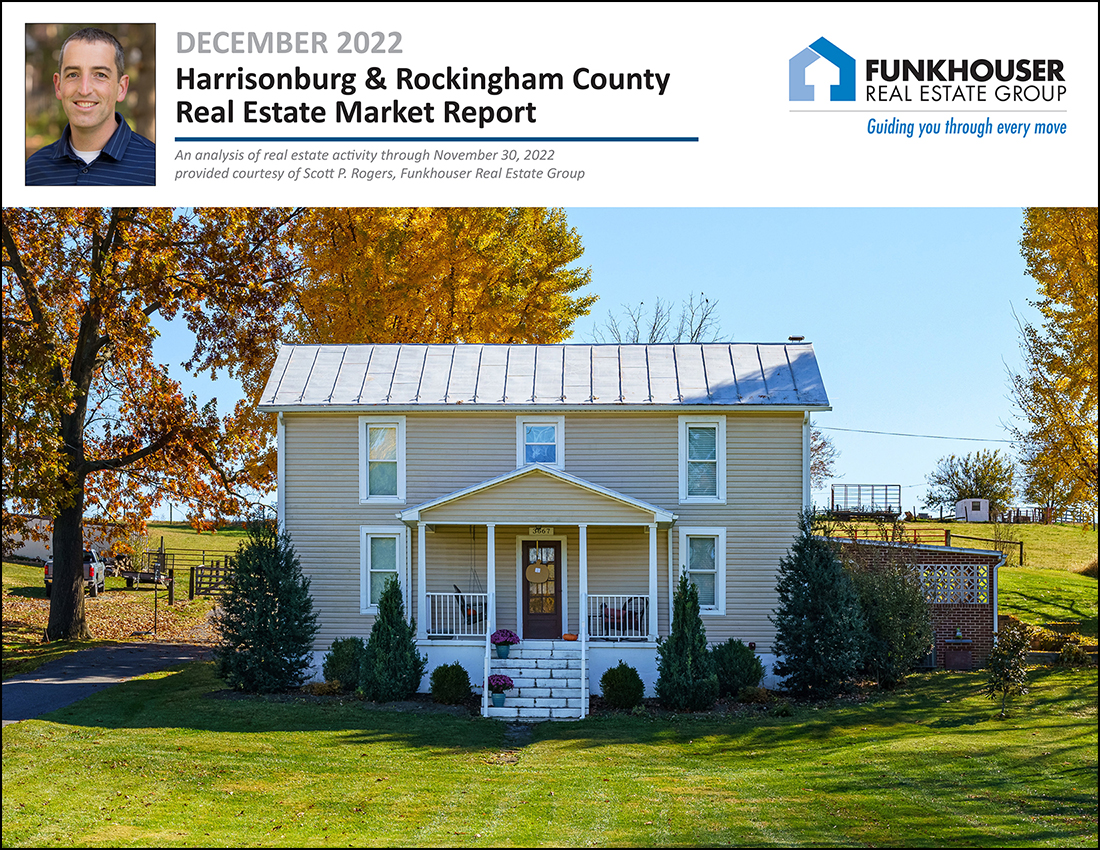 Happy Tuesday morning, friends! Winter is upon us. The holidays are upon us. I hope you have been enjoying the variety of Christmas light displays in and around Harrisonburg. Shaena and I, with several other family members, greatly enjoyed visiting the "Winter Wander" light display at the Boar's Head Resort in Charlottesville a few nights ago. Next time maybe we'll have to dine there or stay over as it was quite lovely! Check out the lights at Winter Wander yourself between now and January 7th...  Before we move onto the real estate data we're all waiting for, each month I offer a giveaway, of sorts, for readers of this market report, highlighting some of my favorite places (or things) in Harrisonburg. Recent highlights have included Walkabout Outfitter, Bella Gelato and the JMU Forbes Center. This month, I encourage you to go check out Grilled Cheese Mania on Main Street in Harrisonburg. If you find me at GCM, you'll likely find me enjoying the Triple Lindy with a side of Miss Tess' Tomato Mac. :-) Click here to enter to win a $50 gift certificate to Grilled Cheese Mania! Finally, take a few minutes to check out this month's featured home... a spacious, remodeled farmhouse on an acre in the Turner Ashby district with some excellent outdoor amenities located at 3667 Dry Hollow Road! Now, let's take a look at the latest data in our local real estate market... 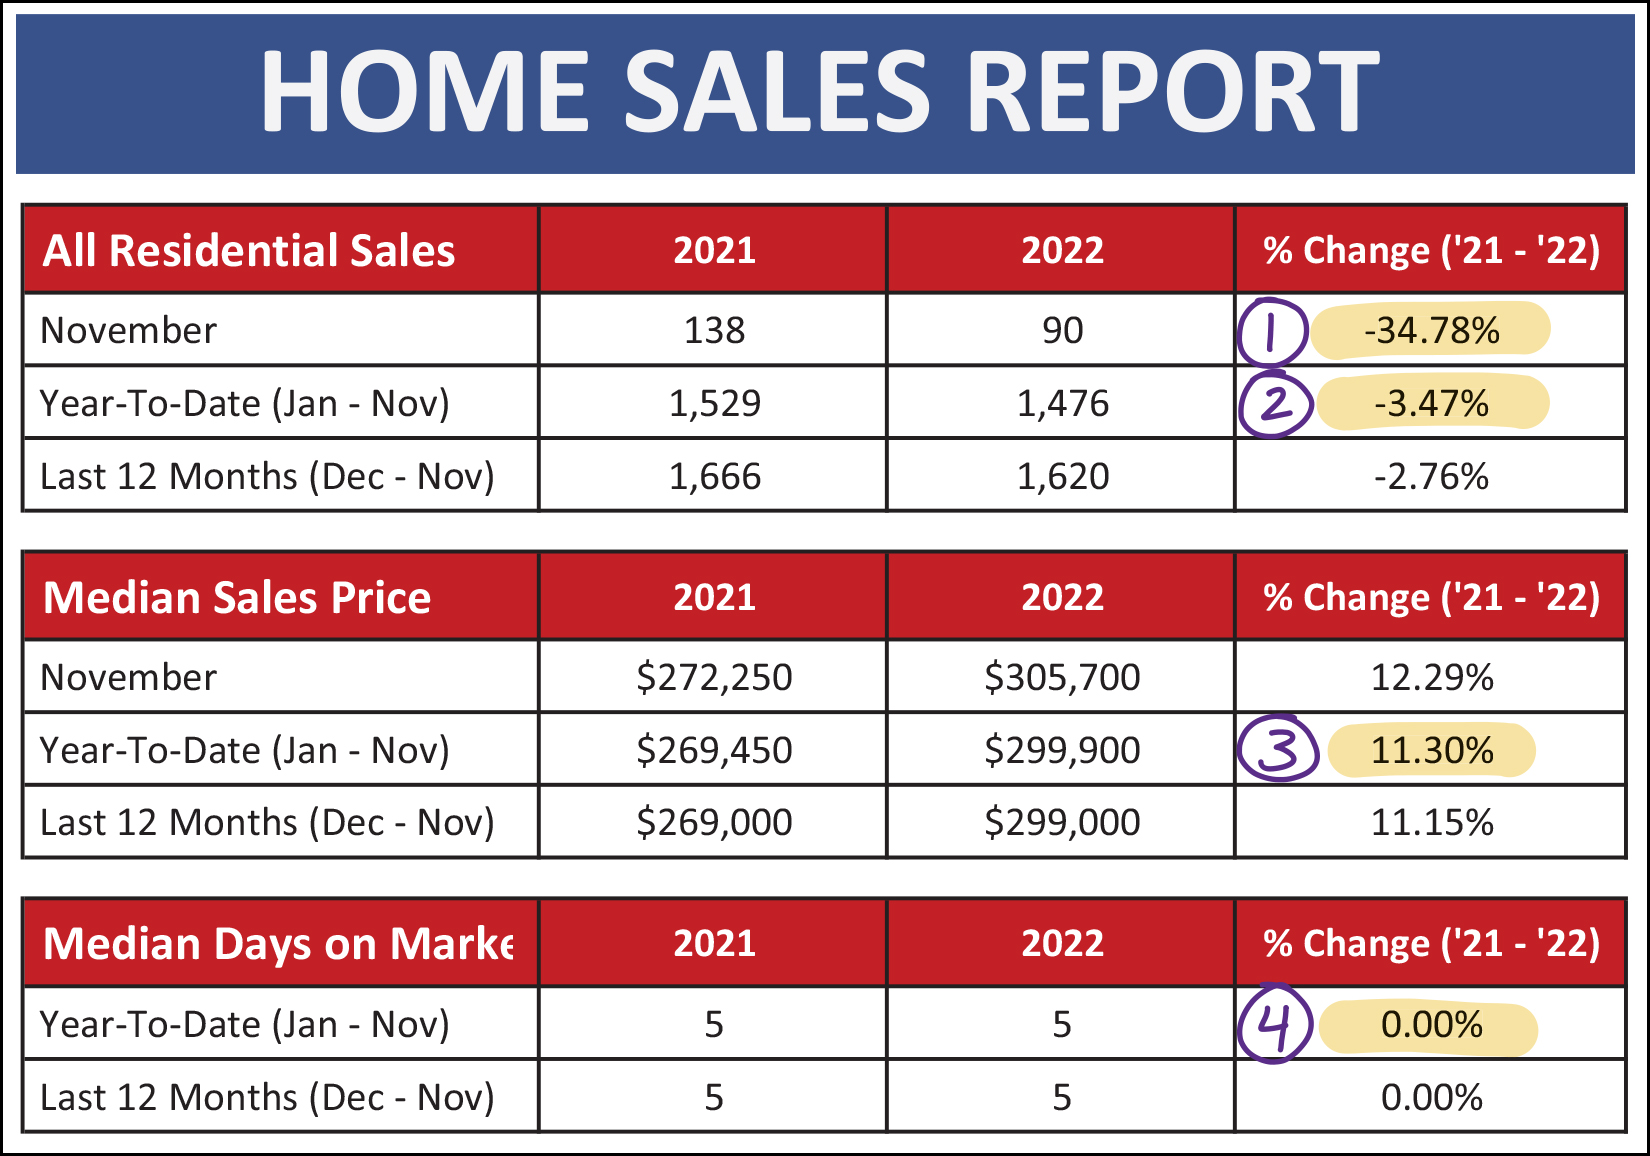 Let's drive right into a few of the main metrics of our local housing market outlined above... [1] Home sales slowed considerably this November compared to last November... declining 35% from 138 sales to 90 sales. You'll see a clearer (and more startling) visual of that shortly. [2] This significant decline in the number of home sales in November 2022 resulted in an overall 3.5% decline in 2022 home sales as compared to 2021 home sales when viewing the first 11 months of the year. [3] But yet... the median sales price in our area keeps on rising, up 11.3% from a year ago to $299,900 when looking at the first 11 months of 2022. [4] Furthermore, homes are (as a whole) still selling just as quickly... with a consistent median of five days on the market thus far in 2022, which matches the speed of home sales a year ago. Now, that startling visual of the November 2022 dip in home sales... 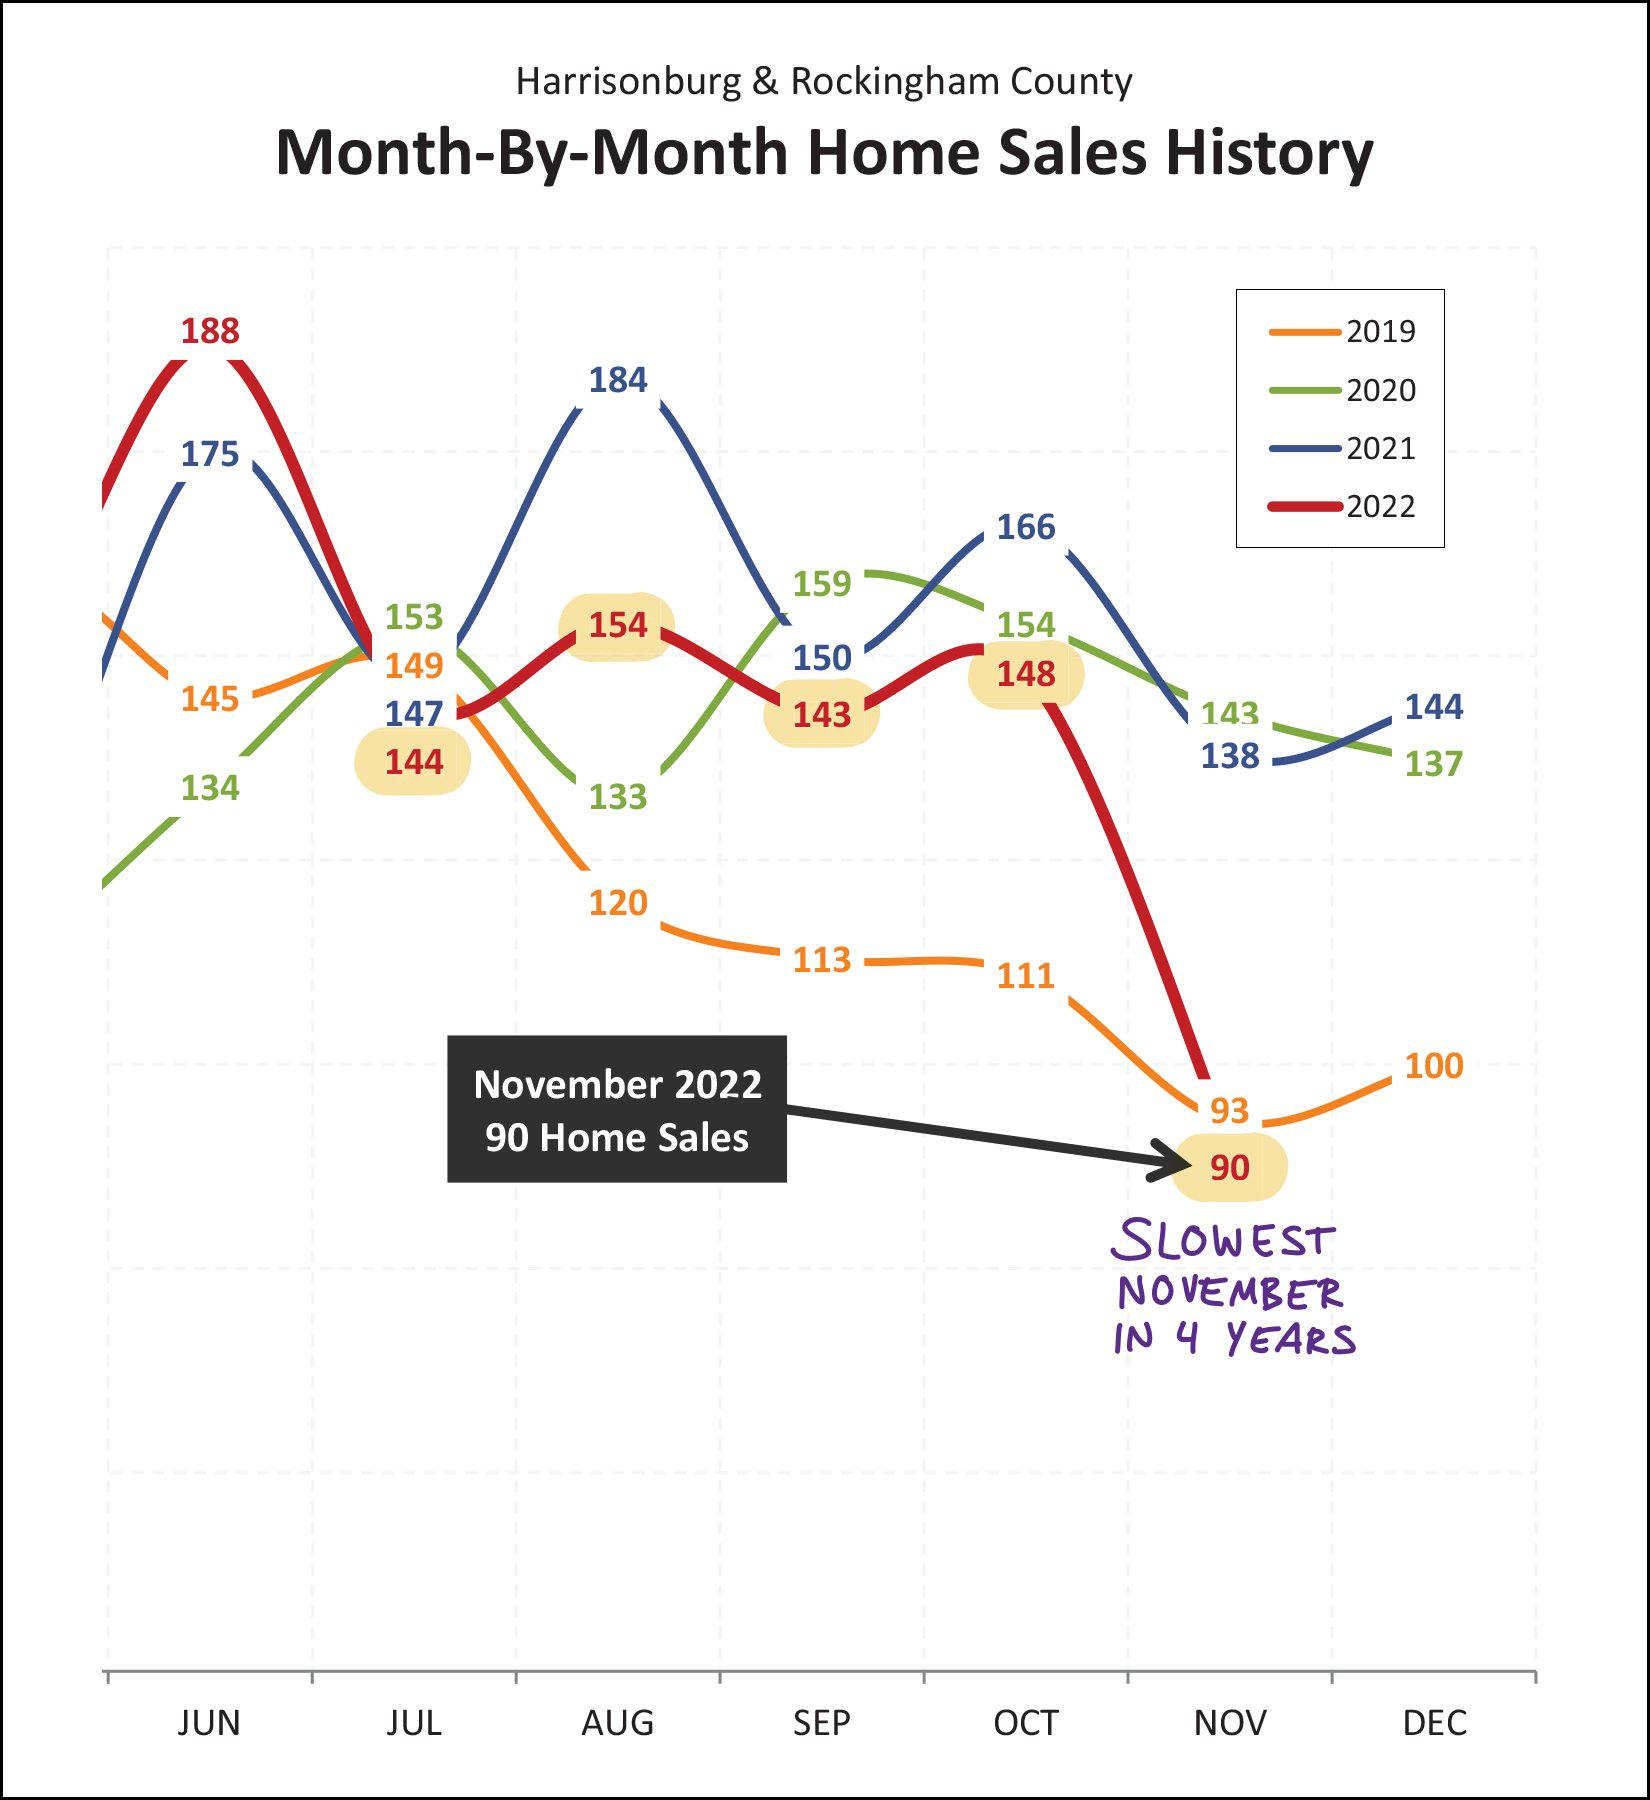 Lots to note regarding the graph above... [1] We saw slower (fewer) home sales in each of the four months leading up to November. This was not altogether surprising, as mortgage interest rates have been steadily rising throughout 2022. [2] Home sales really (!!!) slowed down in November 2022... dipping down to 90 home sales as compared to 138 in the same month last year. [3] The 90 home sales this November is not actually that different than the 93 seen back in November 2019. [4] The past two years (2020 and 2021) may very well be anomalies given that they were during the Covid induced overheating of the local real estate market. If we look at the five Novembers prior to 2020 (thus, 2015-2019) we'll find an average of 94 home sales in November. So... home sales dropped significantly in November 2022. That's somewhat surprising, as it finishes off a long, multi-year, run of a super exuberant local housing market. It's also not that surprising, given rising mortgage interest rates, and given what usually happens in November if we're not in Covid times. As we'll see below, the temporary (crazy) boom in home sales brought on by Covid and super low mortgage interest rates may be coming to an end... 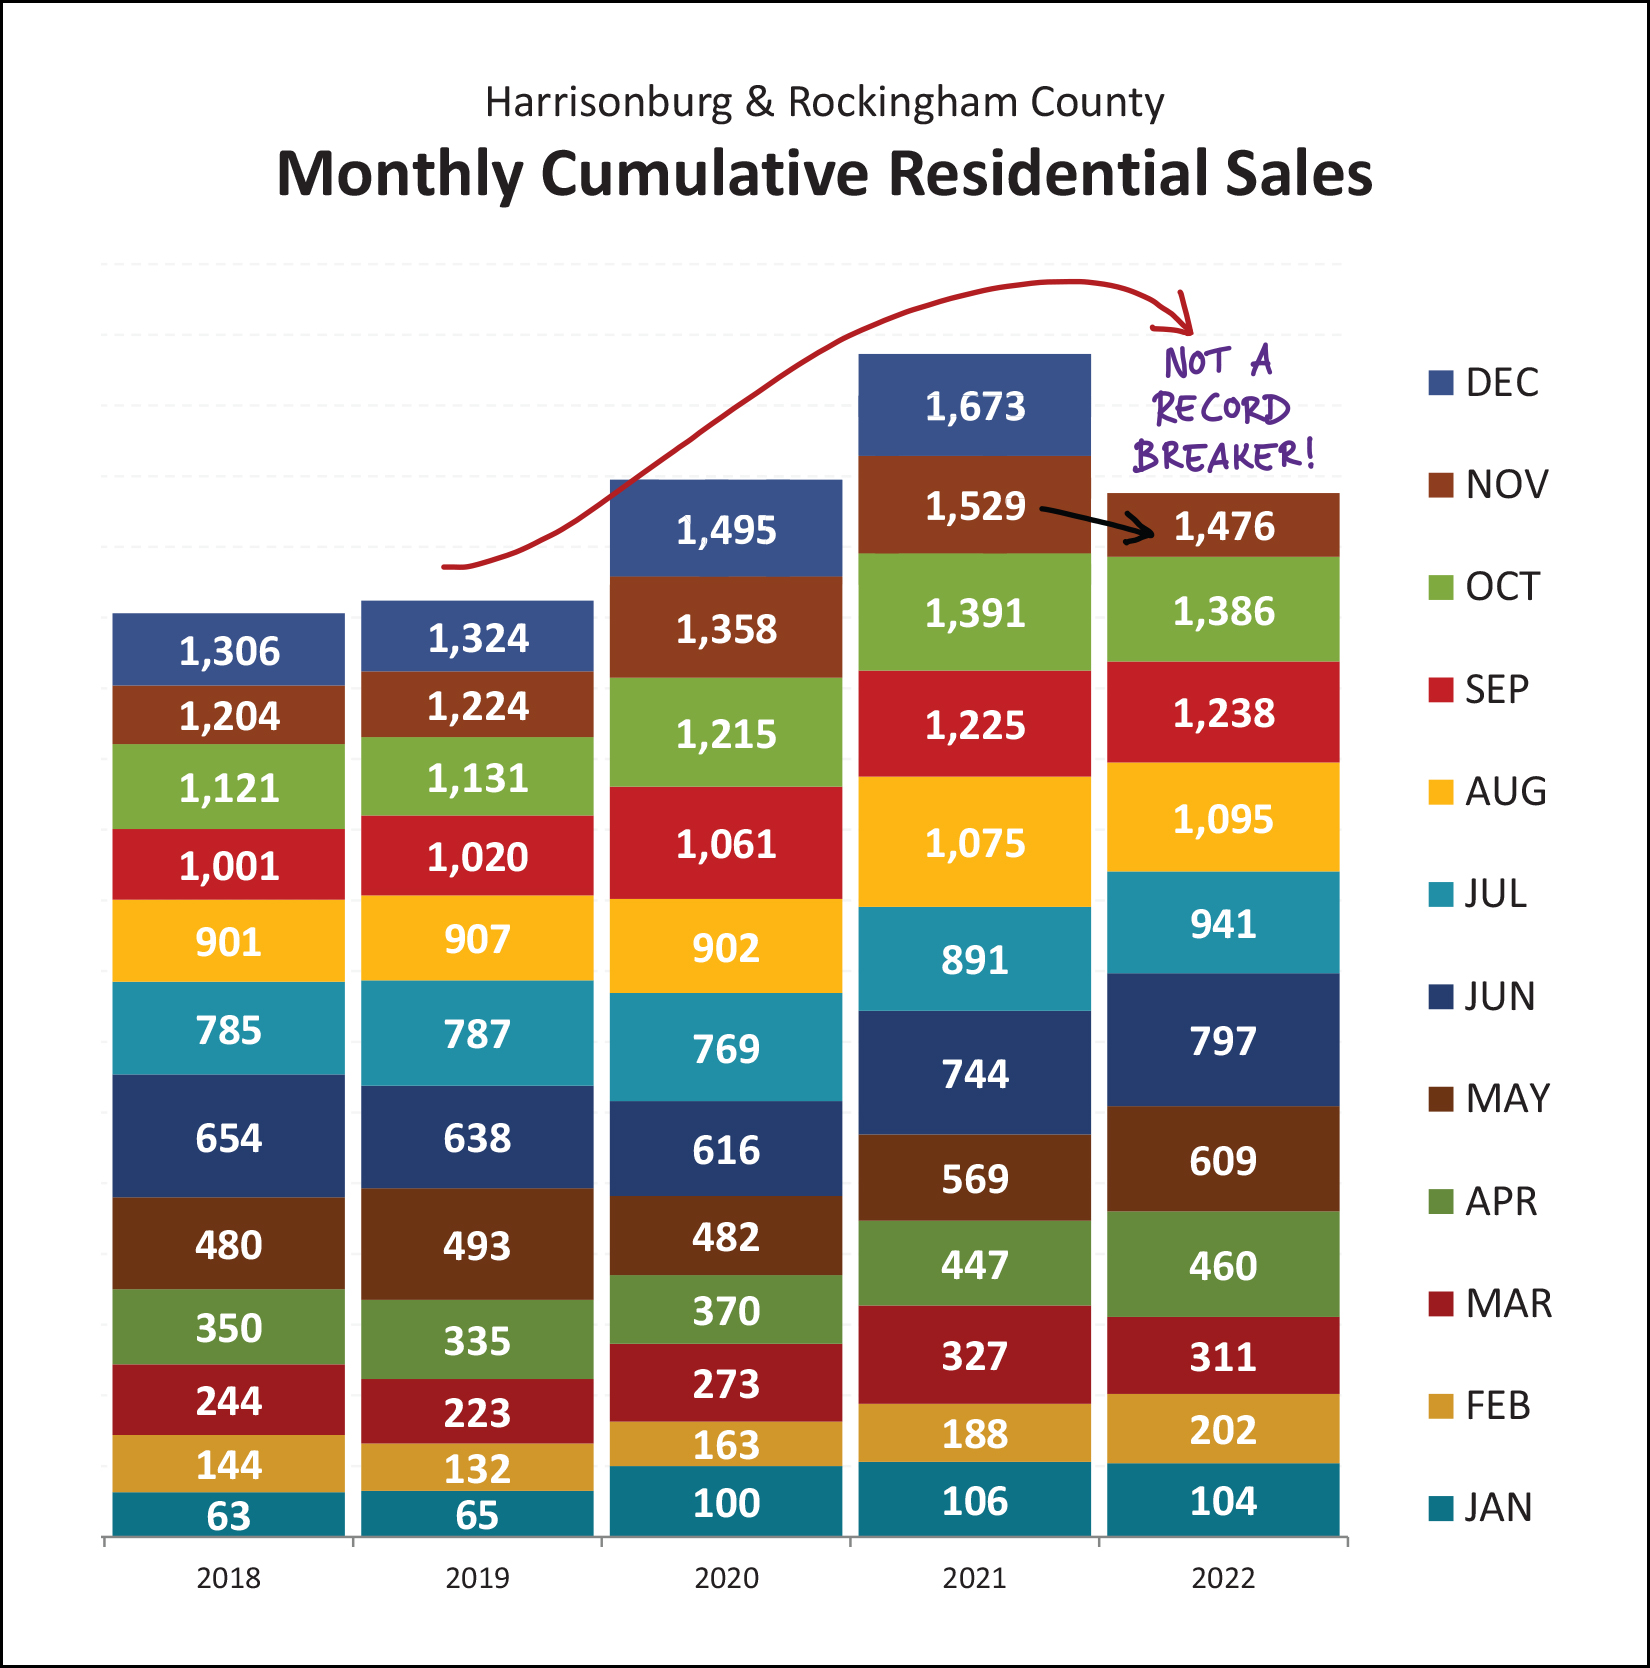 Prior to Covid (2020-2021) we had been seeing a relatively consistent 1300-ish home sales per year. Then, the market went crazy during 2020 and 2021 and home sales approached 1500 sales in a year, and then almost reached 1700 sales in a year. That string of two record breaking years in a row... won't continue in 2022. All the way up through September 2022, it was seeming that we'd have yet another record breaking year this year. But 2022 fell slightly behind in October, and even further behind in November. Looking ahead, it seems likely that 2022 will end up being the second strongest year of home sales ever in Harrisonburg and Rockingham County... just behind 2021. Looking at things from a slightly longer term perspective, we can see yet again how the local real estate market is slowing a bit after having peaked in 2021/2022... 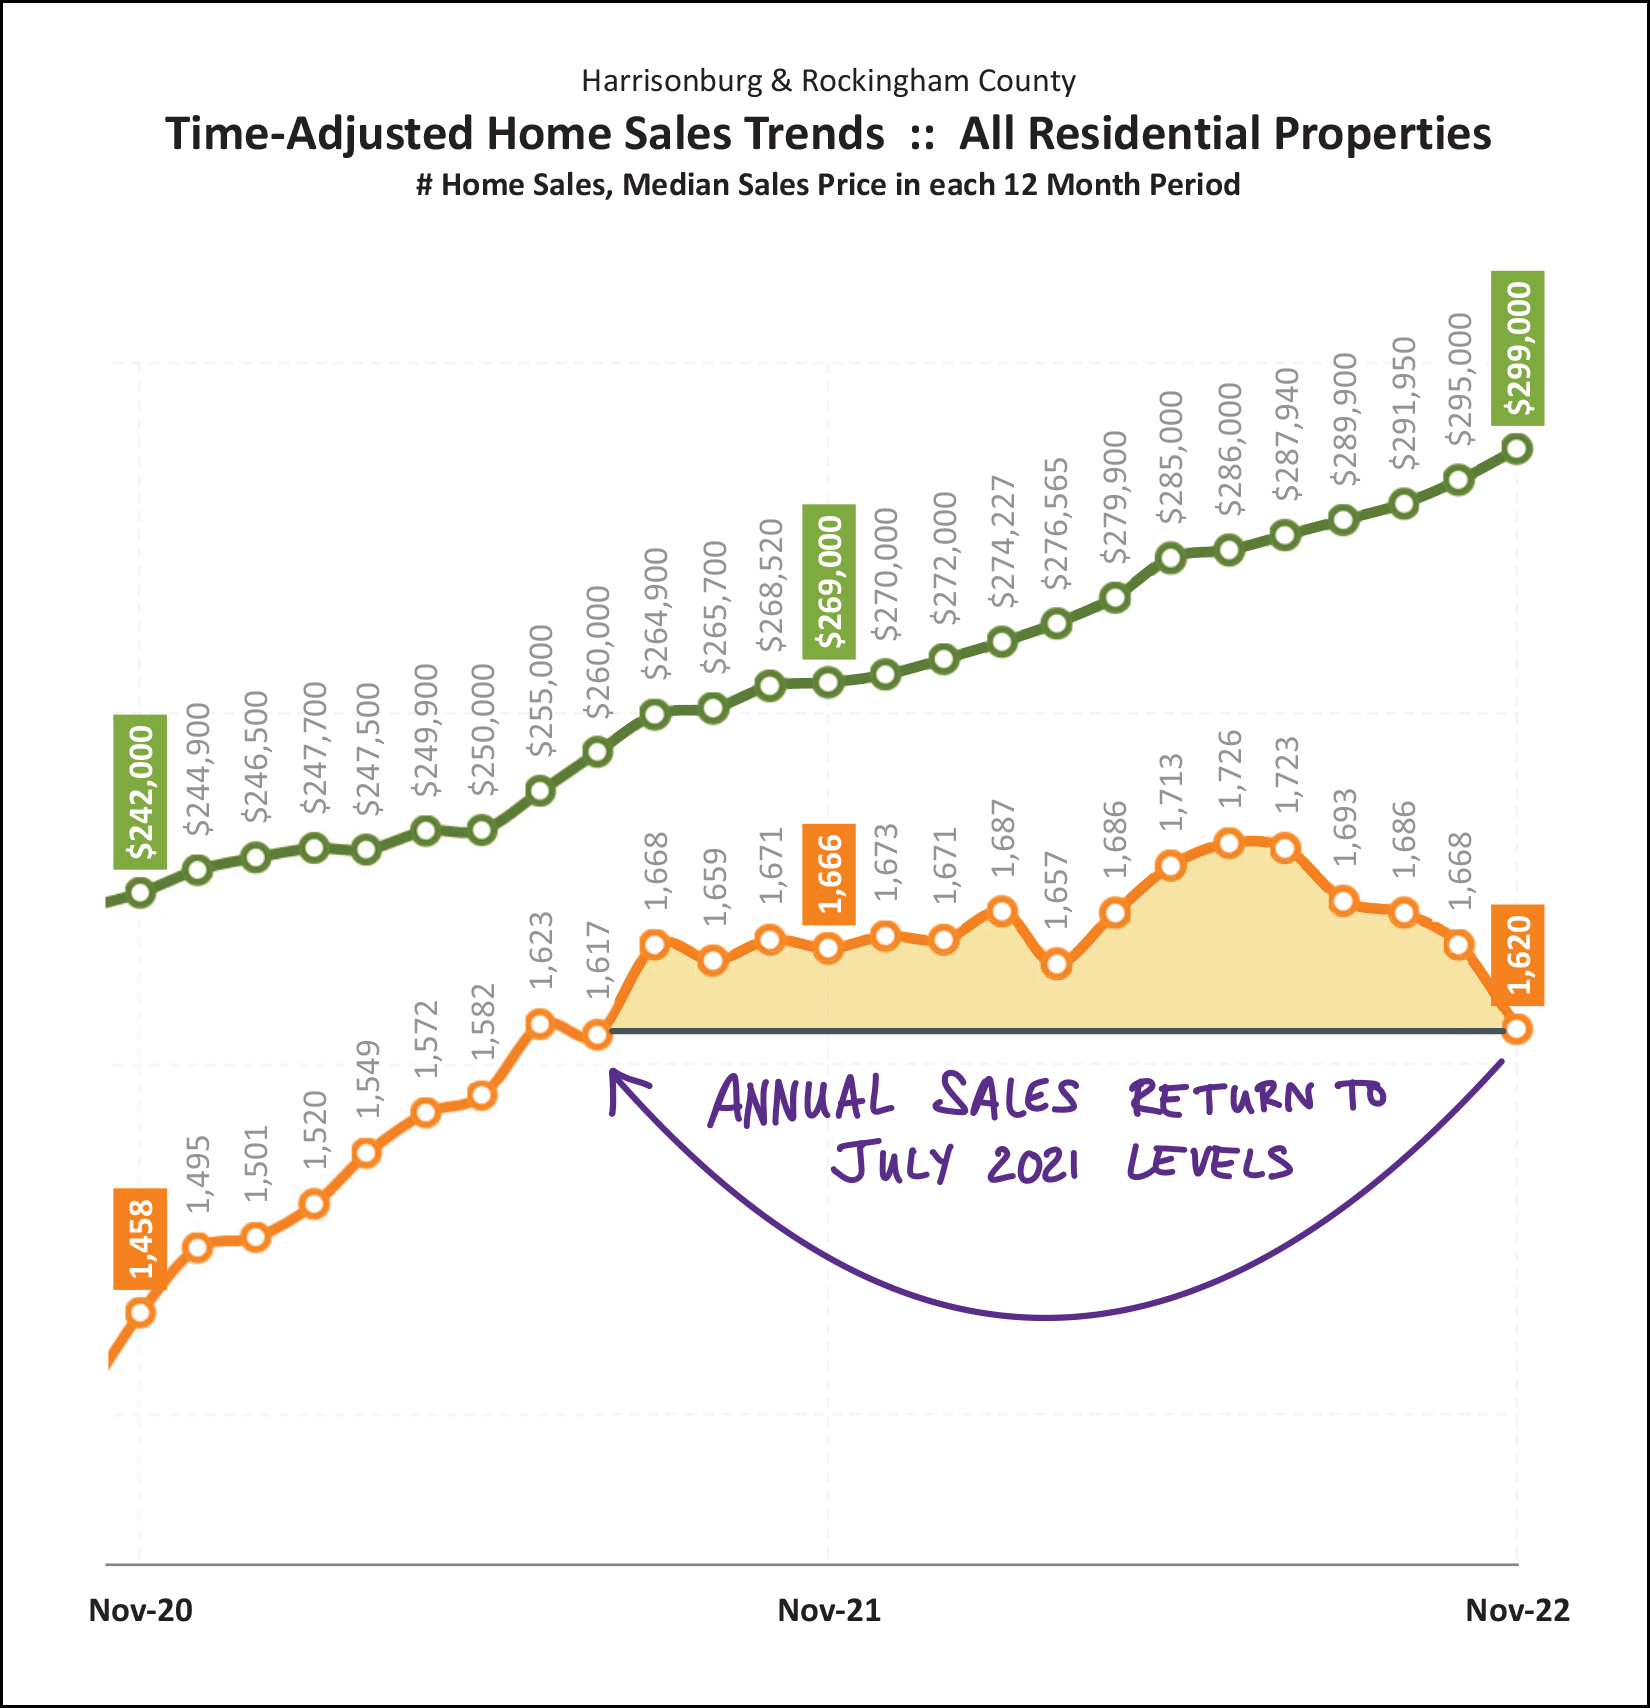 A year and a half ago (ish) we were seeing home sales at an annual pace of 1,617 sales per year... back in July 2021... which included sales from August 2020 through July 2021. Now, we're seeing home sales at an annual pace of 1,620 sales per year... which includes sales from December 2021 through November 2022. So, the market has retreated a bit... with fewer sales per year now than we've seen for the past year and a half-ish. This was highly predictable given rather dramatic increases in mortgage interest rates. It is somewhat surprising, however, that the decline in annual sales has been as small as it has been given how much mortgage interest rates have increased. The pace of annual sales peaked at 1,726 sales... and we have only seen a 6% decline from that peak... to 1,620 sales per year. Now, then, given that home sales are slowing, we're almost certainly seeing inventory levels rising, right? 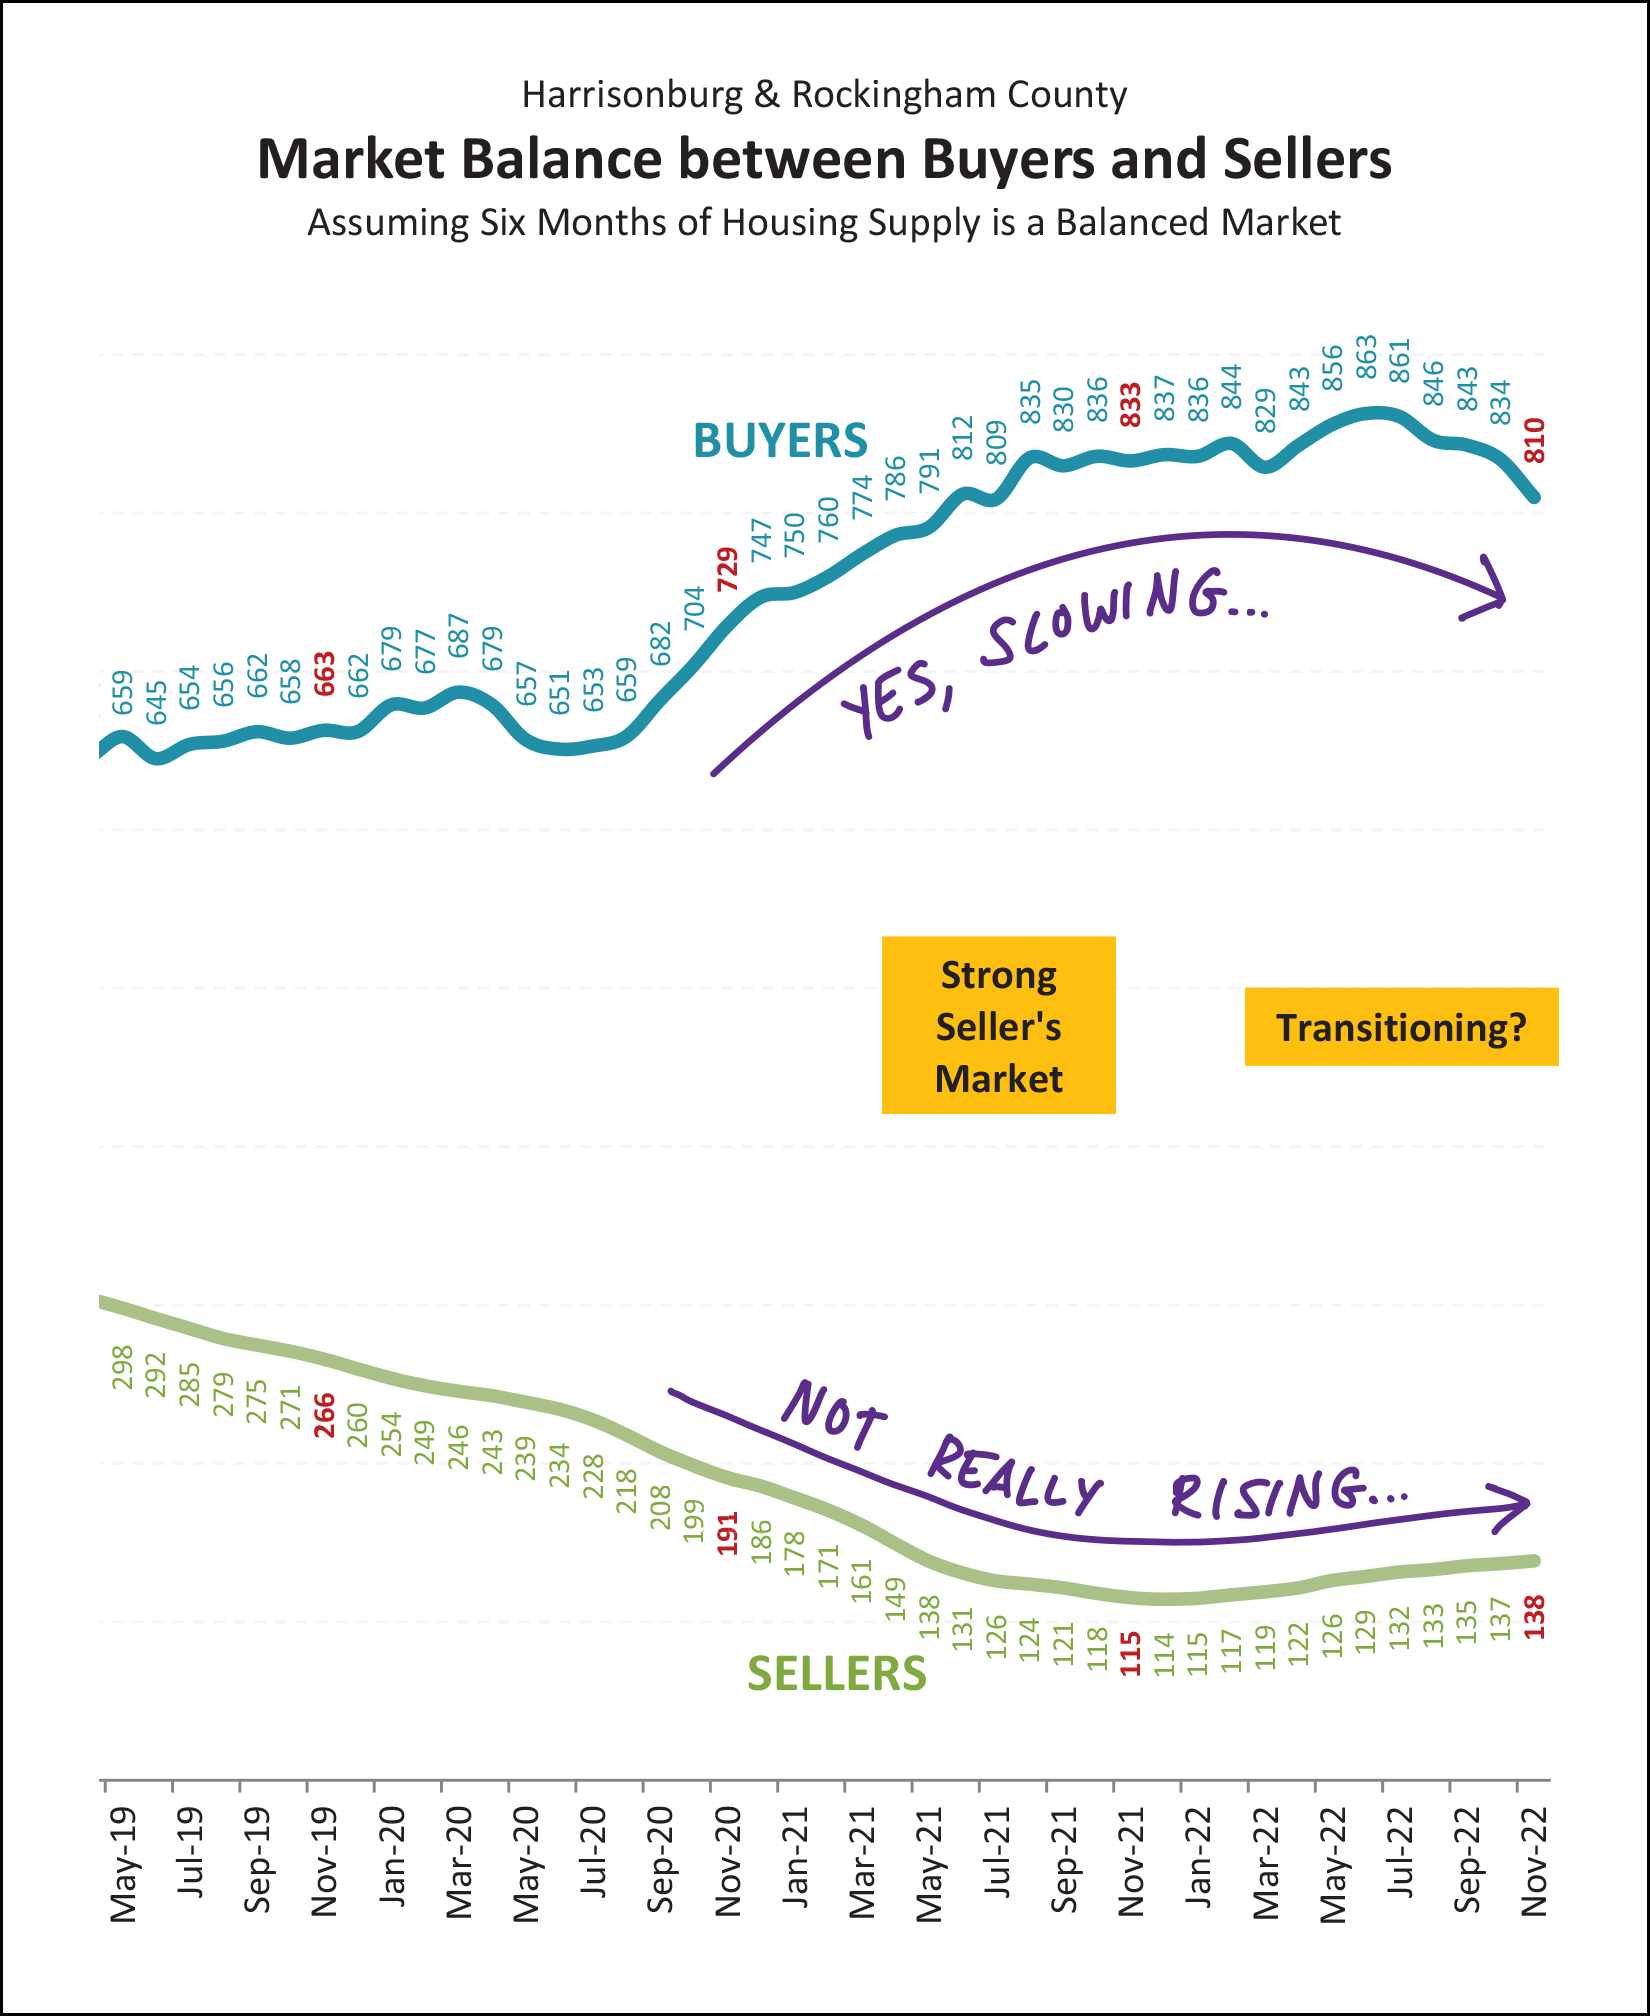 I'll make this point a few more times as we continue through these graphs, but here's your first visual showing that even if the market is starting to transition a bit, it's not doing it very rapidly. Yes, home sales are slowing. The graph above shows how many buyers are buying in a six month timeframe. We have seen a decline over the past year from 833 buyers buying every six months down to 810 buyers buying. So, yes, the pace of buyers committing to buy is certainly slowing. But... we're not seeing as much of an increase in sellers selling (inventory levels) as we might otherwise expect. We've seen an increase over the past year from 115 homes for sale up to 138 homes for sale, but that's still a notable net decline in inventory from two years ago and three years ago. So, is it a slightly less strong seller's market now? Yes. Is it still a strong seller's market now? Yes. Now, looking at contract activity for a moment, to predict where things might be headed from here... 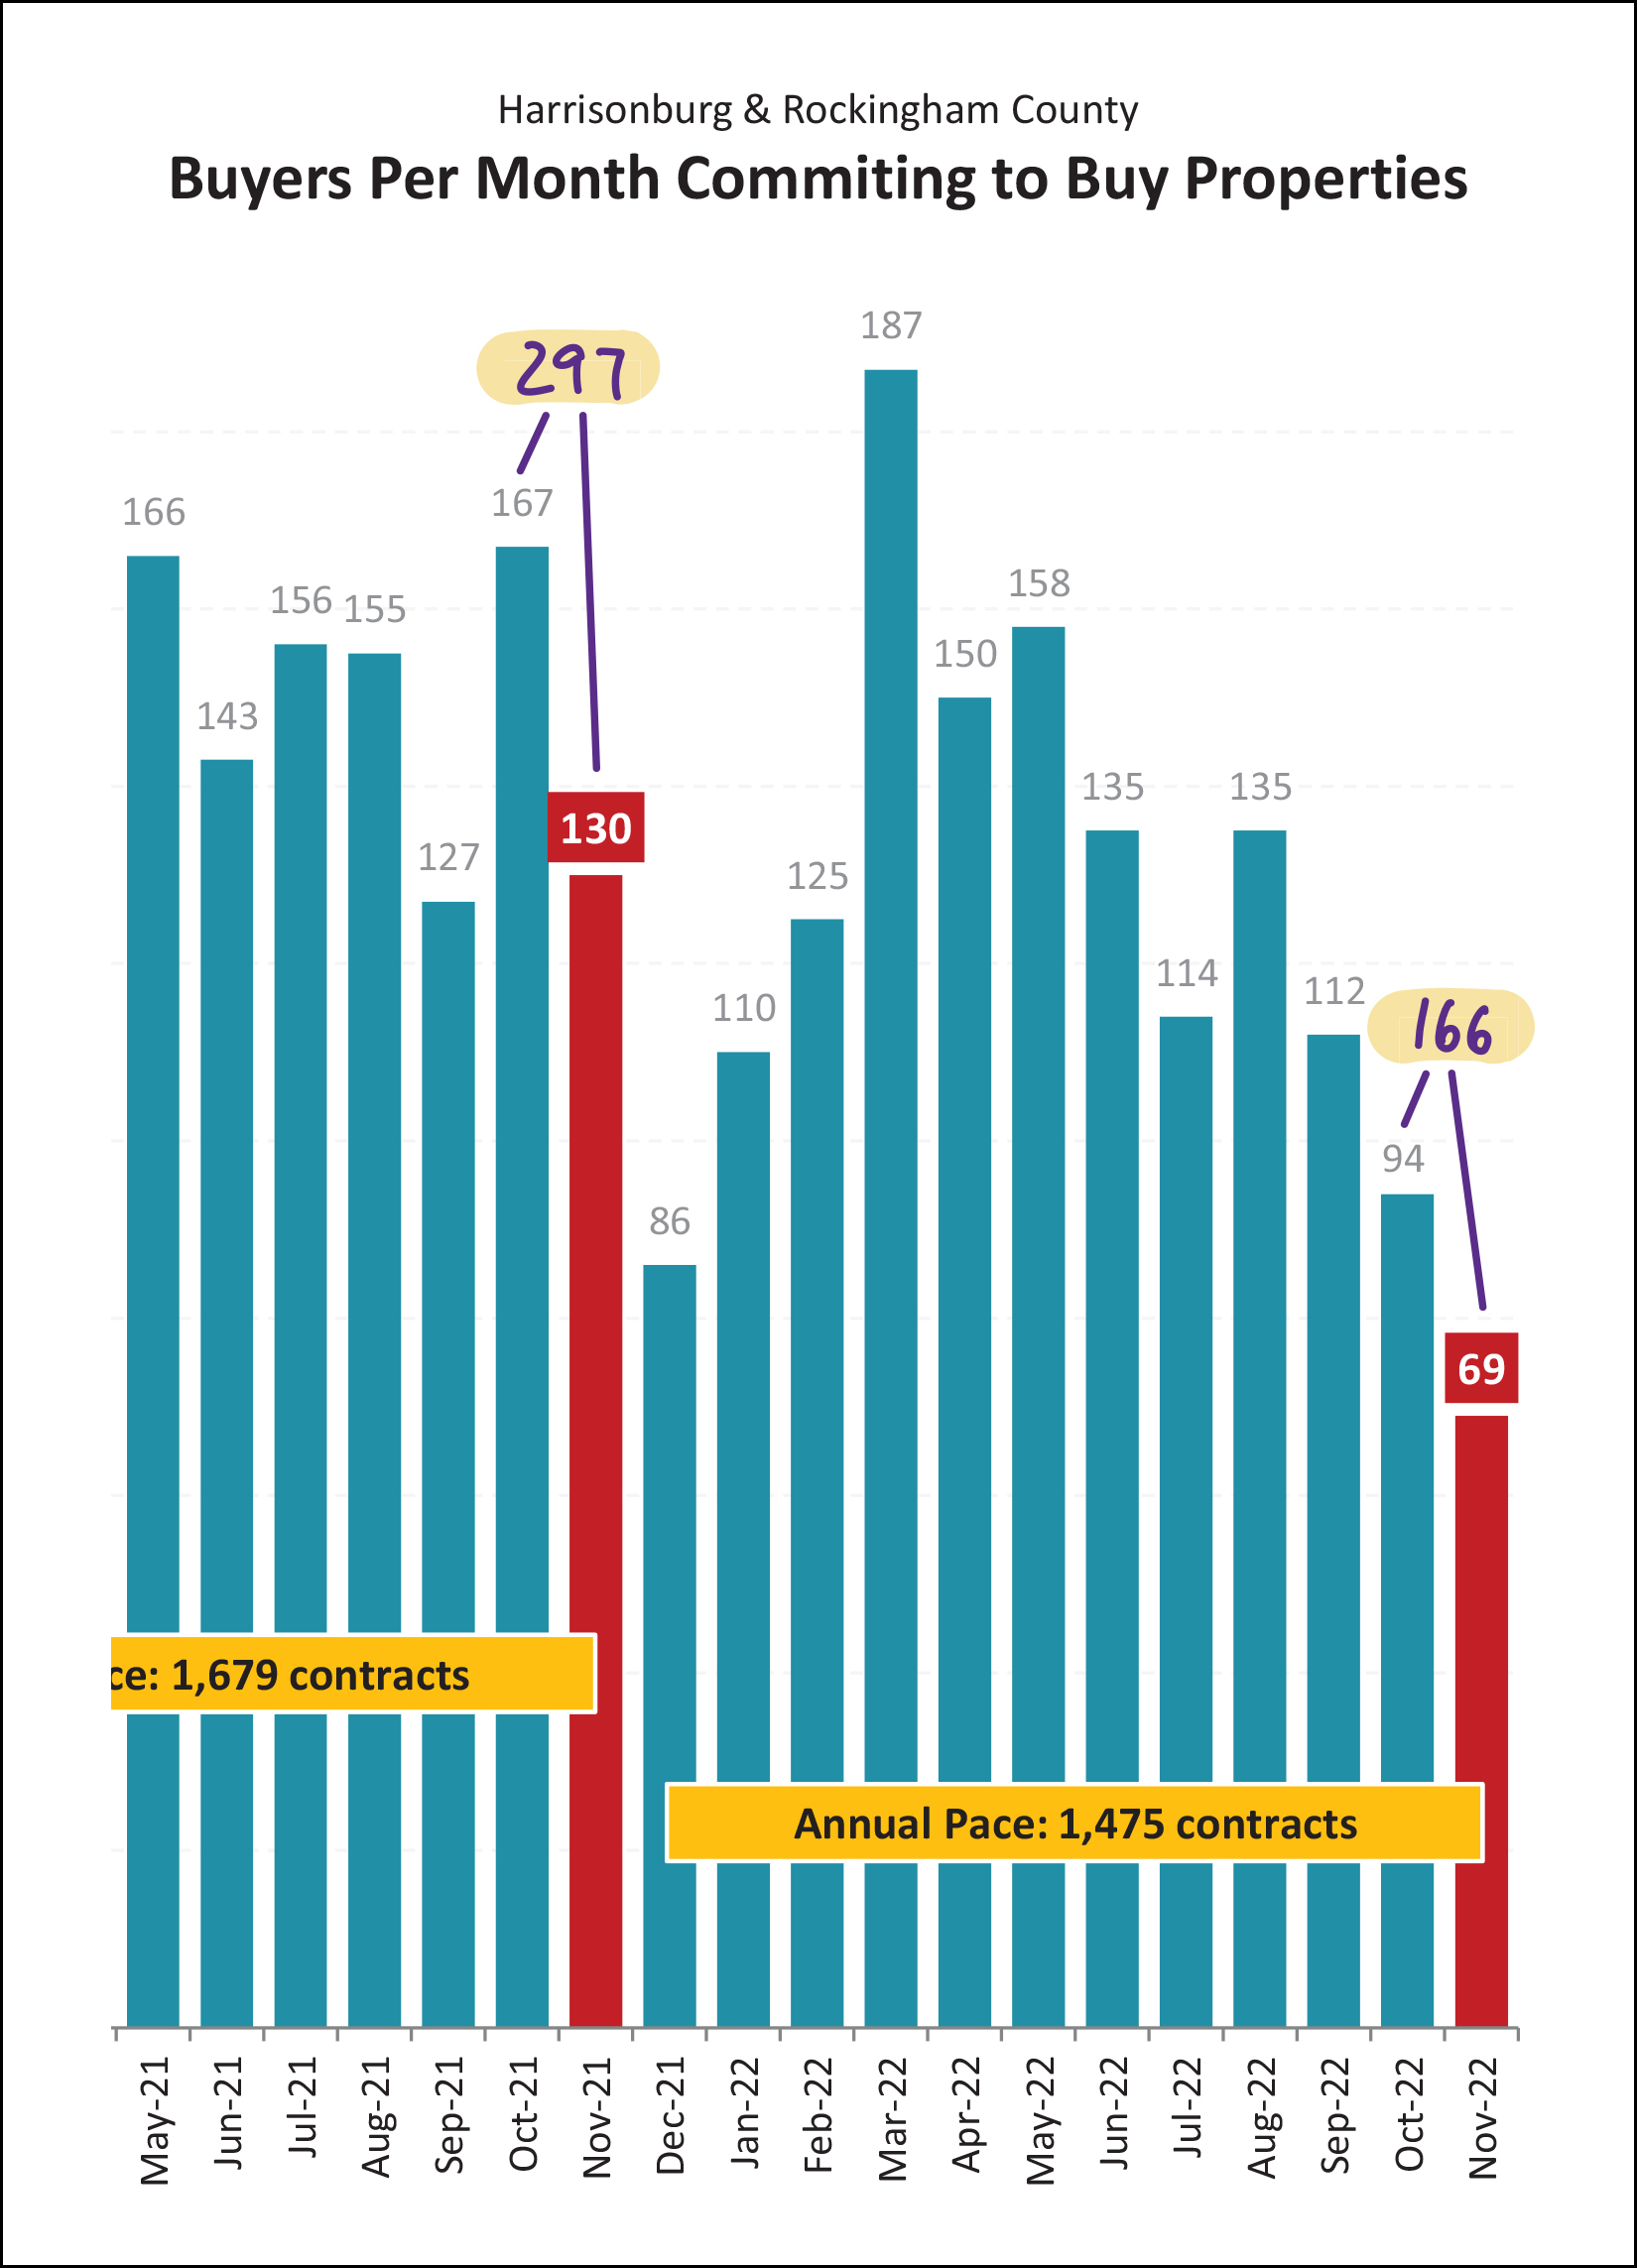 As becomes evident with my handwritten note on the graph above... contract activity this October and November was MUCH slower than last October and November! After a combined total of 297 contracts being signed during that two month period last year... we have seen only 166 contracts signed this October and November, which is a 44% decline! Again, first, not a total surprise. Buyers are a bit less excited to sign contracts to buy homes with interest rates of 6% to 7% (this Oct/Nov) as compared to when interest rates are 2.5% to 3.5% (last Oct/Nov). Second, these lower contract numbers have started to result in lower sales numbers and that is likely to roll into December sales and January sales. Finally, it's important to remember that past two winters (2020, 2021) were a bit abnormal given Covid (lots of buyers wanting to buy a house) and super low interest rates (lots of buyers qualifying to buy a house) and this winter we seem to be returning to what was previously a typical seasonal trend of fewer contracts and sales during winter months. Now, then, back to inventory... certainly it must be rising, given fewer closed sales and fewer contracts being signed, right? 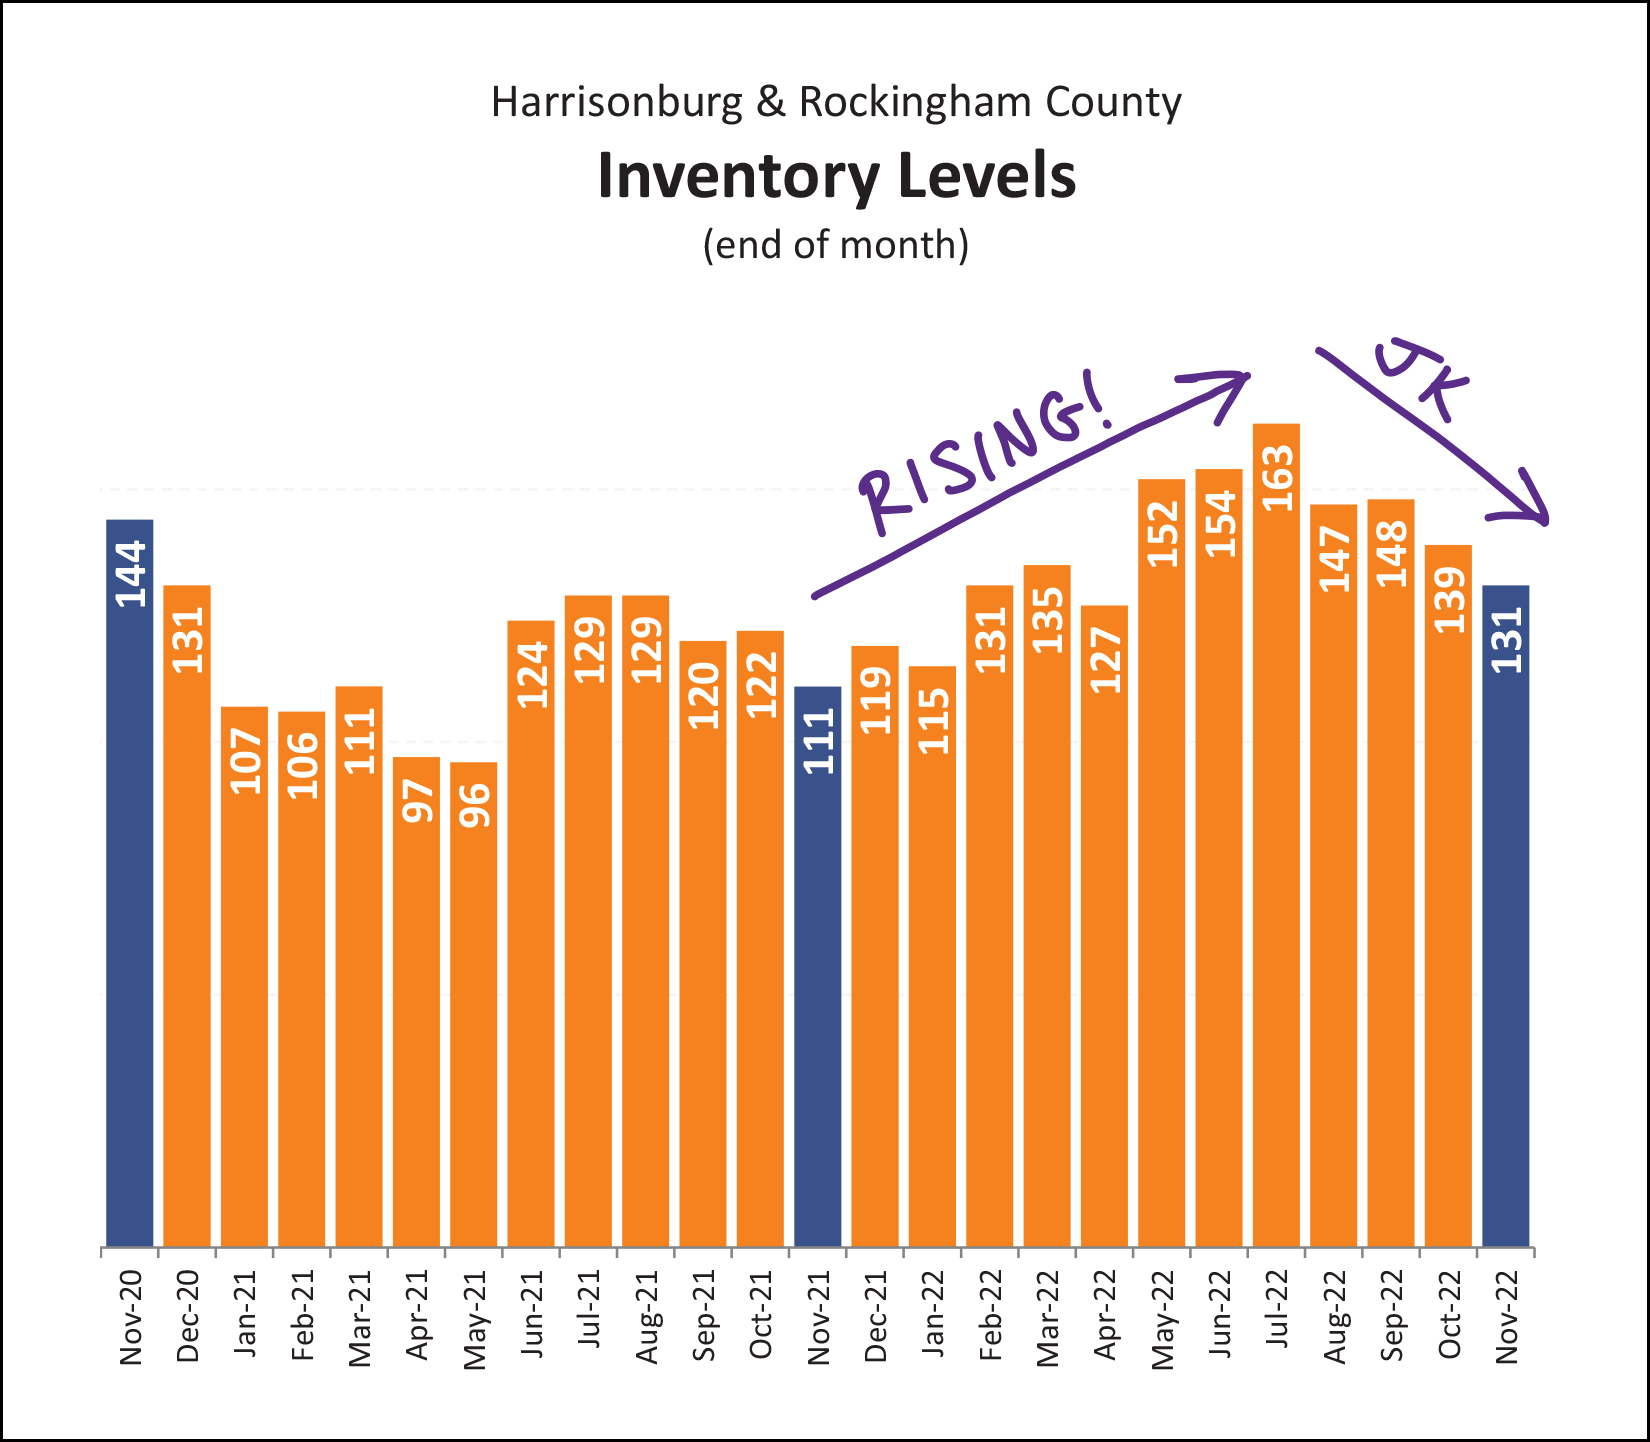 And... nope! Inventory levels rose through much of 2022... but have now been declining for the past four months... as is relatively normal for the fall into winter timeframe. Furthermore, inventory levels are still lower now than they were two years ago. This coming spring will be interesting, depending on how mortgage interest rates look at that time. It's typical to see lower inventory levels in the winter, and that makes the lower contract numbers less consequential. Lots of folks choose to sell in the spring and summer, and if we have lower contract numbers at that time, then we could see inventory levels starting to measurably increase. Driving this point home one more time... 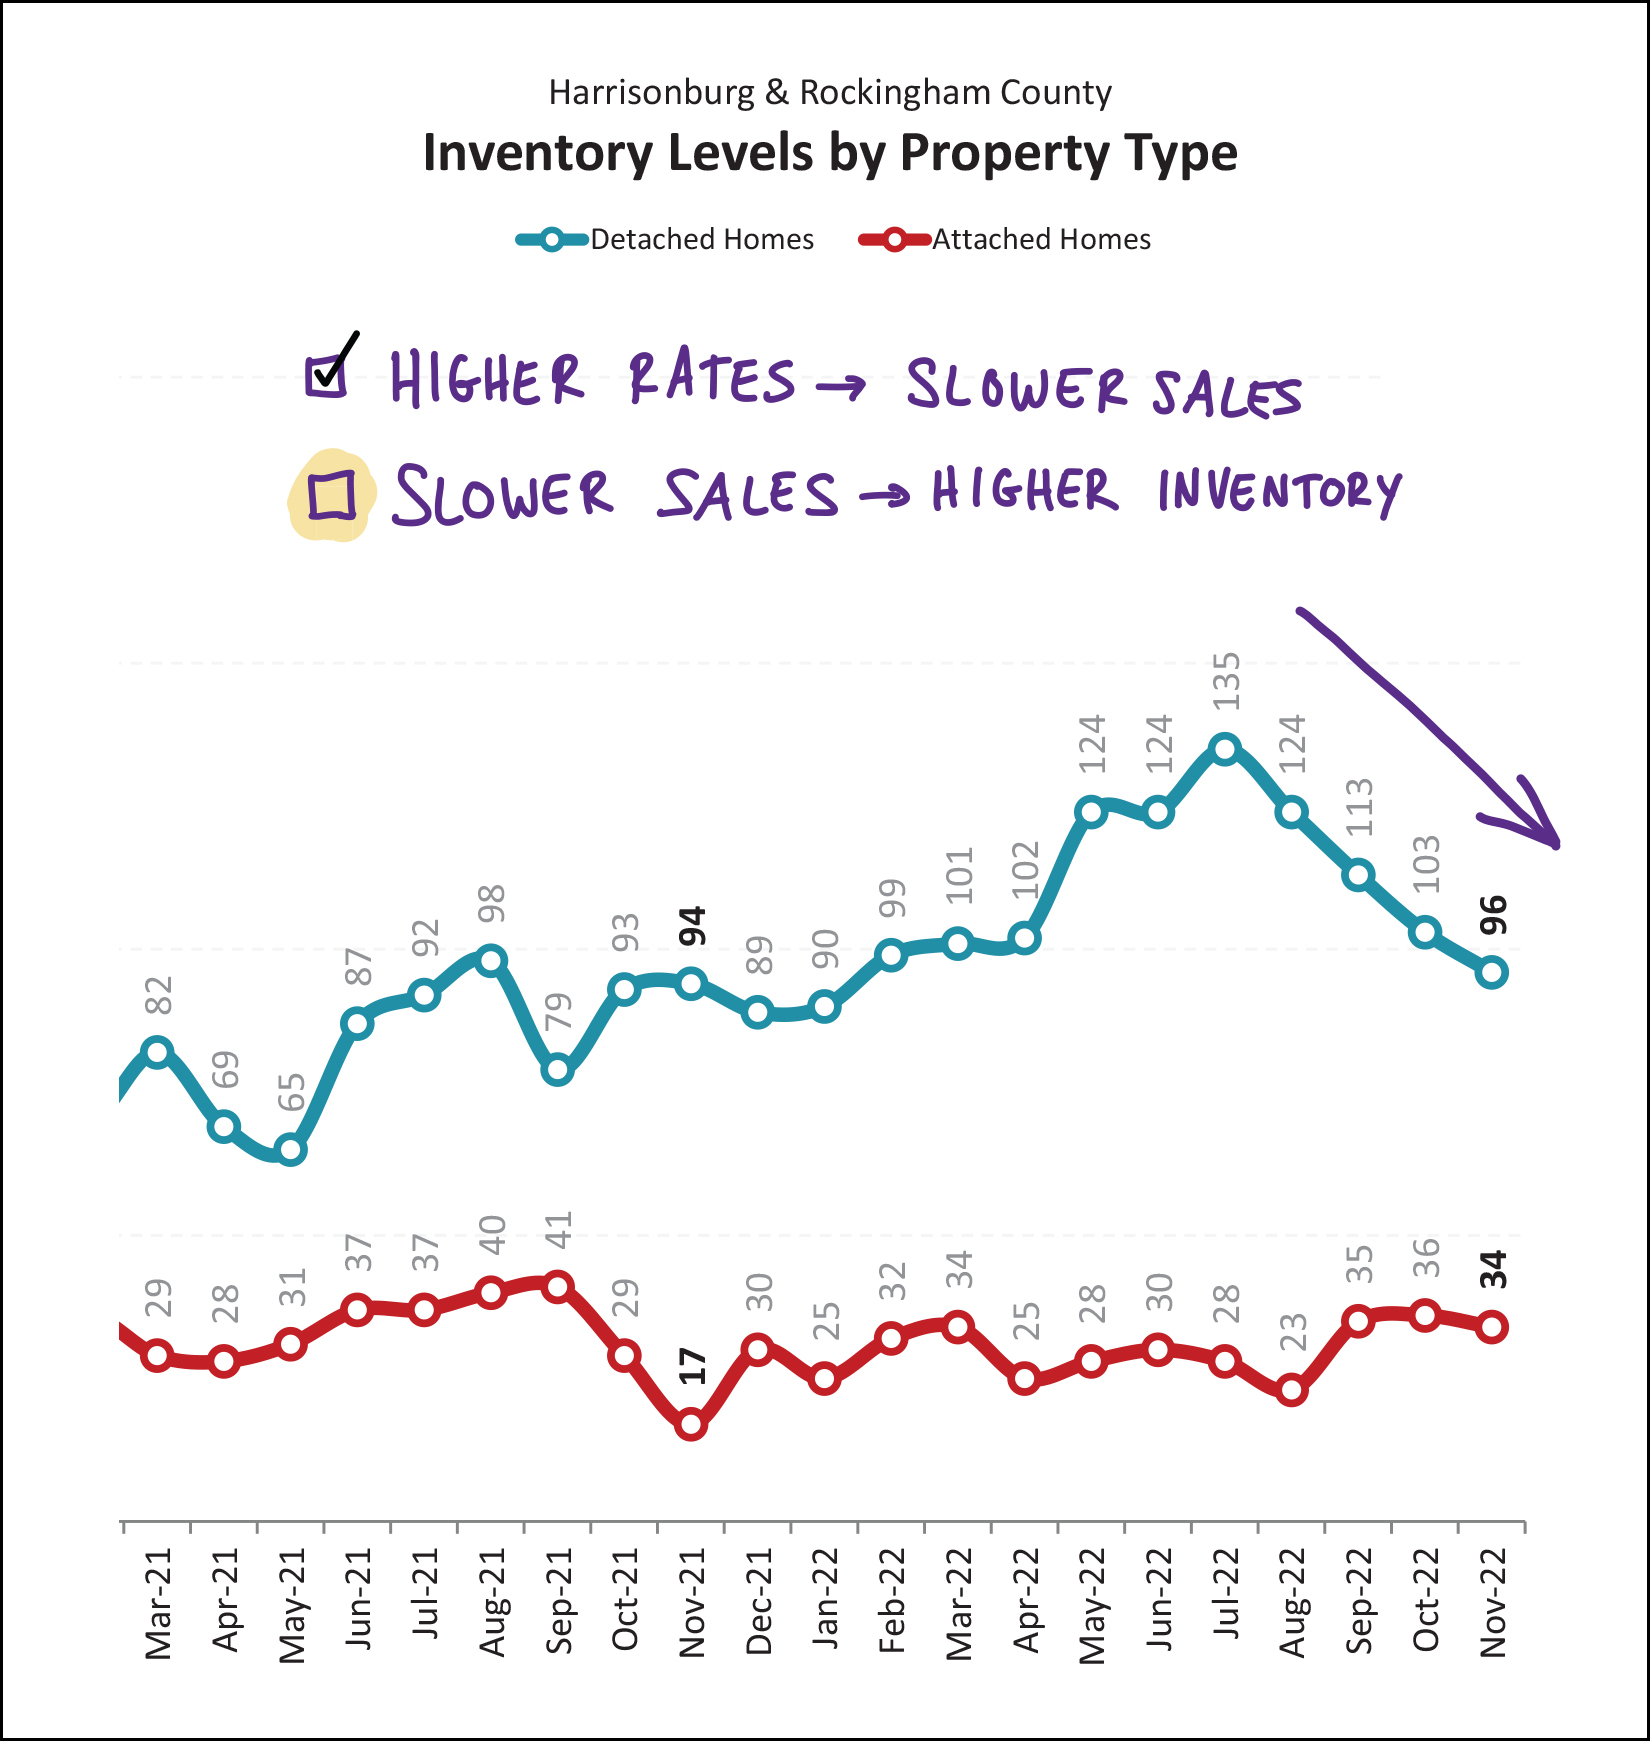 The graph above shows inventory levels by property type. Inventory levels of attached homes (townhomes, duplexes, condos) have stayed relatively consistently between 25 and 40 over the past year and a half. Inventory levels of detached homes were rising between June 2021 and June 2022... but then have declined for the past four months. So, as my notes point out... higher mortgage interest rates did indeed lead to slower sales... but slower sales are not necessarily leading to higher inventory levels. Come spring, we may have new insights as to a potential new trajectory of the market if more sellers want to sell and this lower number of buyers are willing to buy. This next graph has become a bit more complex since I last referenced it... 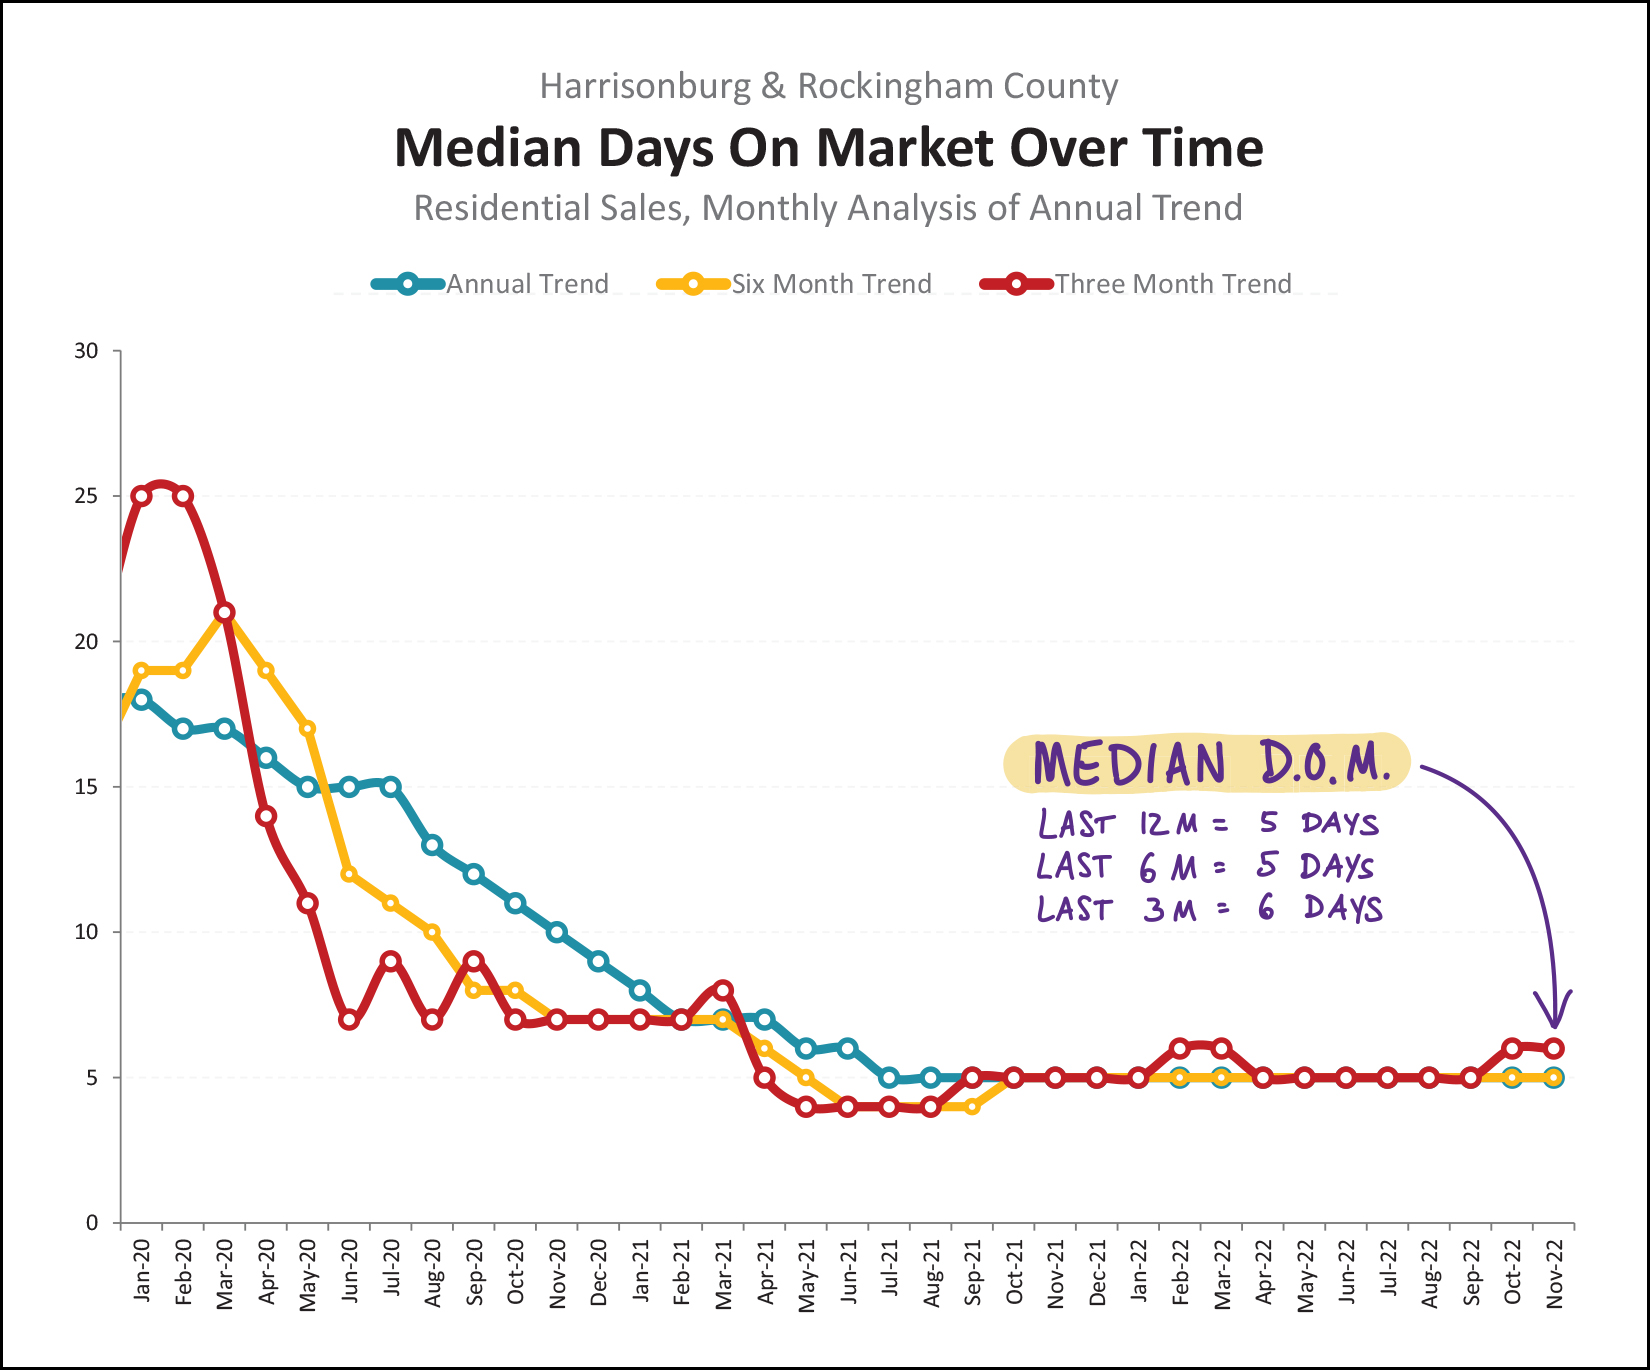 First, conceptually, the timeframe in which homes are going under contract (days on market) is often an excellent indicator of the tone of the local market. As such, for some time I have been tracking the "median days on market" for homes that are selling in Harrisonburg and Rockingham County. The annual median days on market (blue line above) fell to five days (!) back in July 2021 and has remained at that level ever since. As the market has started to feel like it might be transitioning, or as we have though that maybe the market would have to be transitioning, several of you insightful and intelligent readers have asked if this "median days on market" trend looks different if we weren't looking at an entire year of data at a time. Basically asking the question... well, if the median days on market is five days over the past year... certainly it must be (might be?) higher if we looked only at the last few months, right? The new lines on this graph above address this inquiry. The gold/yellow line evaluates median days on market in a six month timeframe... and the red line shows this same metric in a three month timeframe. All that to say... even if we narrow our scope all the way down to the past three months... the median days on market has only risen to... six days instead of five. Half (or more) of the homes that have sold in the past three months were under contract within six days of being listed for sale. If (when?) the market transitions further, we will likely start to see this metric (median days on market) start to trend higher... but we're not seeing it yet. One of the main market impacting factors that I mentioned multiple times throughout this report is the change in mortgage interest rates over the past year... 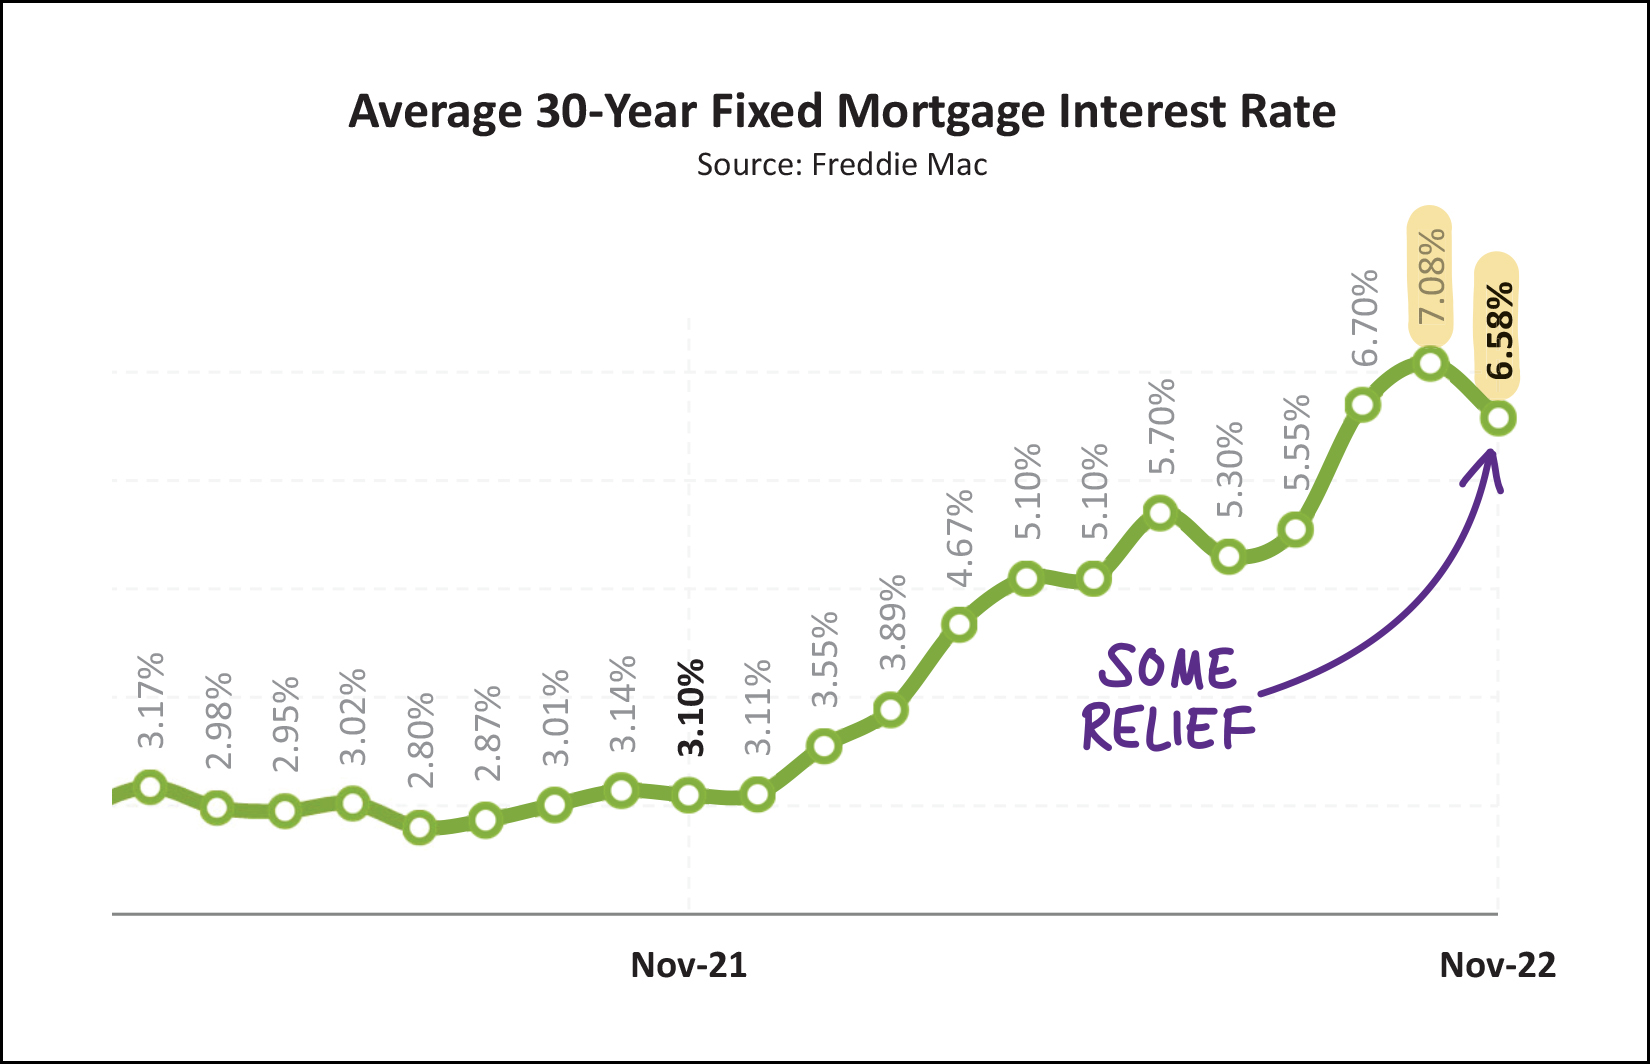 A year ago buyers enjoyed mortgage interest rates right around 3%. Today... rates are twice as high... with an average rate of 6.58% for a 30 year fixed mortgage interest rate as of the end of November. Rates have actually trended down a bit further since that time... with a current average of 6.33% that is not yet shown on the graph above. Will significantly higher mortgage interest rates cause some buyers to not be able to buy? Yes. Will significantly higher mortgage interest rates cause some buyers to not want to buy? Yes. Will significantly higher mortgage interest rates cause a significant (10% or more?) decline in the number of buyers buying homes in our local housing market? Thus far, it seems not. And there you have it... the latest trends in our local housing market as we roll into the last two(ish) weeks of 2022. [1] We're starting to see fewer home sales... though the "fewer" is compared to a "higher" time that we might later conclude was well outside the norm for our local market. [2] We're still seeing higher and higher sales prices in our local market despite (non-cash) buyers financing their home purchase at some of the highest mortgage interest rates we've seen in over 10 years. [3] Despite slightly less buyer activity, inventory levels are remaining stable and may be starting to return to historical seasonal trends of fewer homes on the market in the winter and inventory levels rising again in the spring and summer. As we near the end of 2022, some of you may be considering the sale of your home (or the purchase of a new one) in 2023. If so, we should start chatting sooner rather than later about how all of these market trends potentially impact your plans and the timing of those plans. Feel free to reach out to start that conversation by emailing me or texting or calling me at 540-578-0102. I'll provide another update after the first of the year. Until then, I hope you enjoy the remainder of what is one of my favorite months of the year. December includes Shaena's and my anniversary, Shaena's birthday, and Christmas! Celebrations all month long. ;-) I hope you have an enjoyable, peaceful, fulfilling remainder of 2022 -- and that you find opportunities to spend time with the people you love during this holiday season! | |
Comparison Shopping (For Homes) Is Difficult In A Low Inventory Market |
|
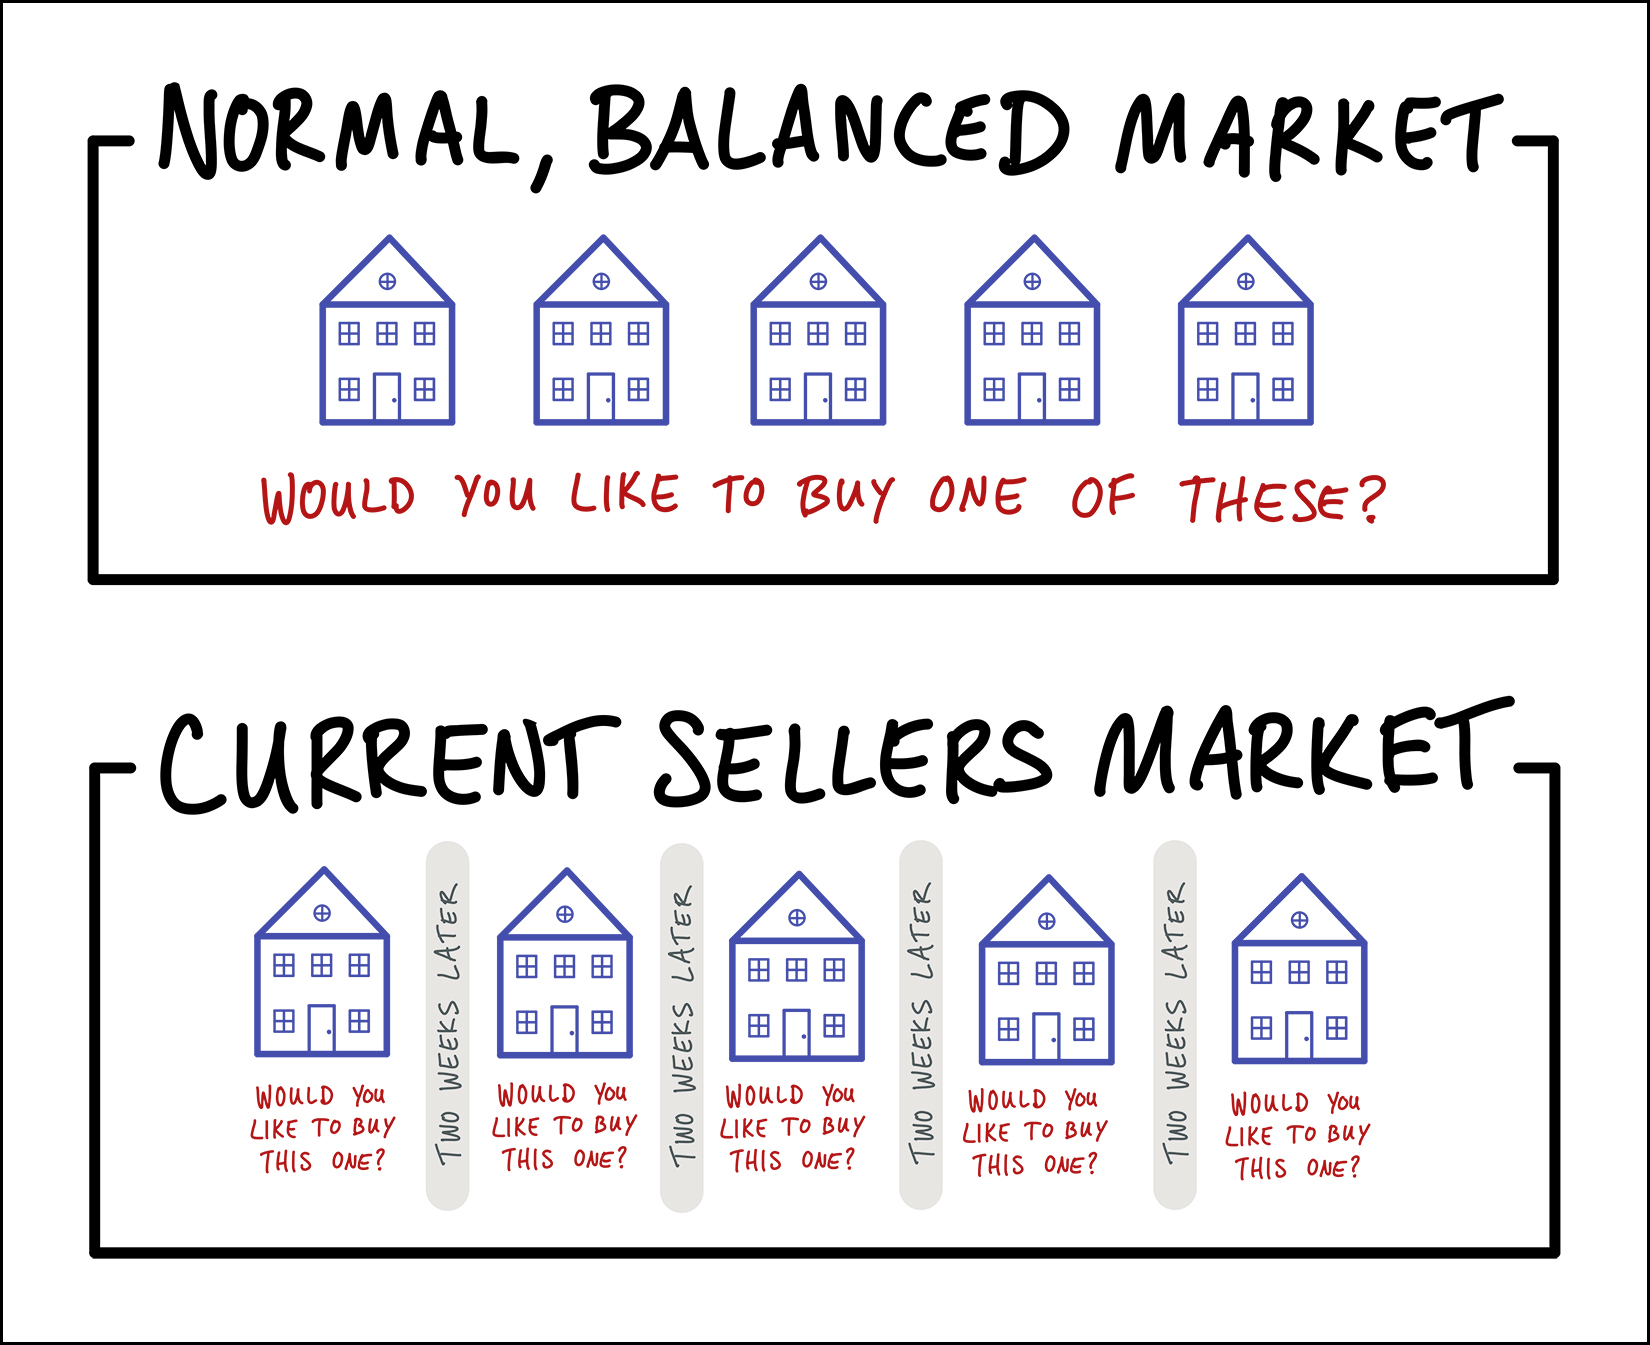 If you were going to buy a ____, it would probably be nice to look at multiple options, compare them, and then decide which one to buy, right? That is often possible with buying a home, whenever we have a balanced market (or a buyer's market) when buyers can find multiple houses on the market at any given time that might work for them. A buyer would then go view multiple houses, compare them, and decide if they want to make an offer on one of the available homes. These days (and for the past few years) we have been in a strong sellers market, with very low inventory levels. The same number of houses have typically been available for a buyer to consider... but they are often evaluating them one at a time, every few weeks... instead of all at once. Sorta like this...
Basically, home buyers have had to make a decision about whether to buy a house... one house a time... without the ability to compare multiple options that are available at the same time. That may eventually change, in some or most price ranges, if we start to see inventory levels increase over time. Until then, it can be a challenge to be a thoughtful and intentional comparison shopper when trying to buy a home! | |
High Buyer Demand Keeps Prices Rising Despite High Interest Rates, But What If... |
|
 Between 2019 and 2021 we saw very high levels of buyer demand... and very low mortgage interest rates... which lead to higher and higher sales prices. In 2022 we saw continued high levels of buyer demand... combined with much higher mortgage interest rates... and yet, prices kept rising. Perhaps we'll never need to know the answer to my "what if" above... since buy demand might remain quite high in the Harrisonburg and Rockingham County area for years to come... But what if.... buyer demand declined... and mortgage interest rates remained high... would prices remain high? Or would prices level out? Or would prices start to decline? Again, so long as buyer demand remains high, we may never need to know the answer to this hypothetical question... but feel free to let me know what your guess is as to how our local market would respond... | |
Current Housing Market Trends In Four Lines, Two Curves |
|
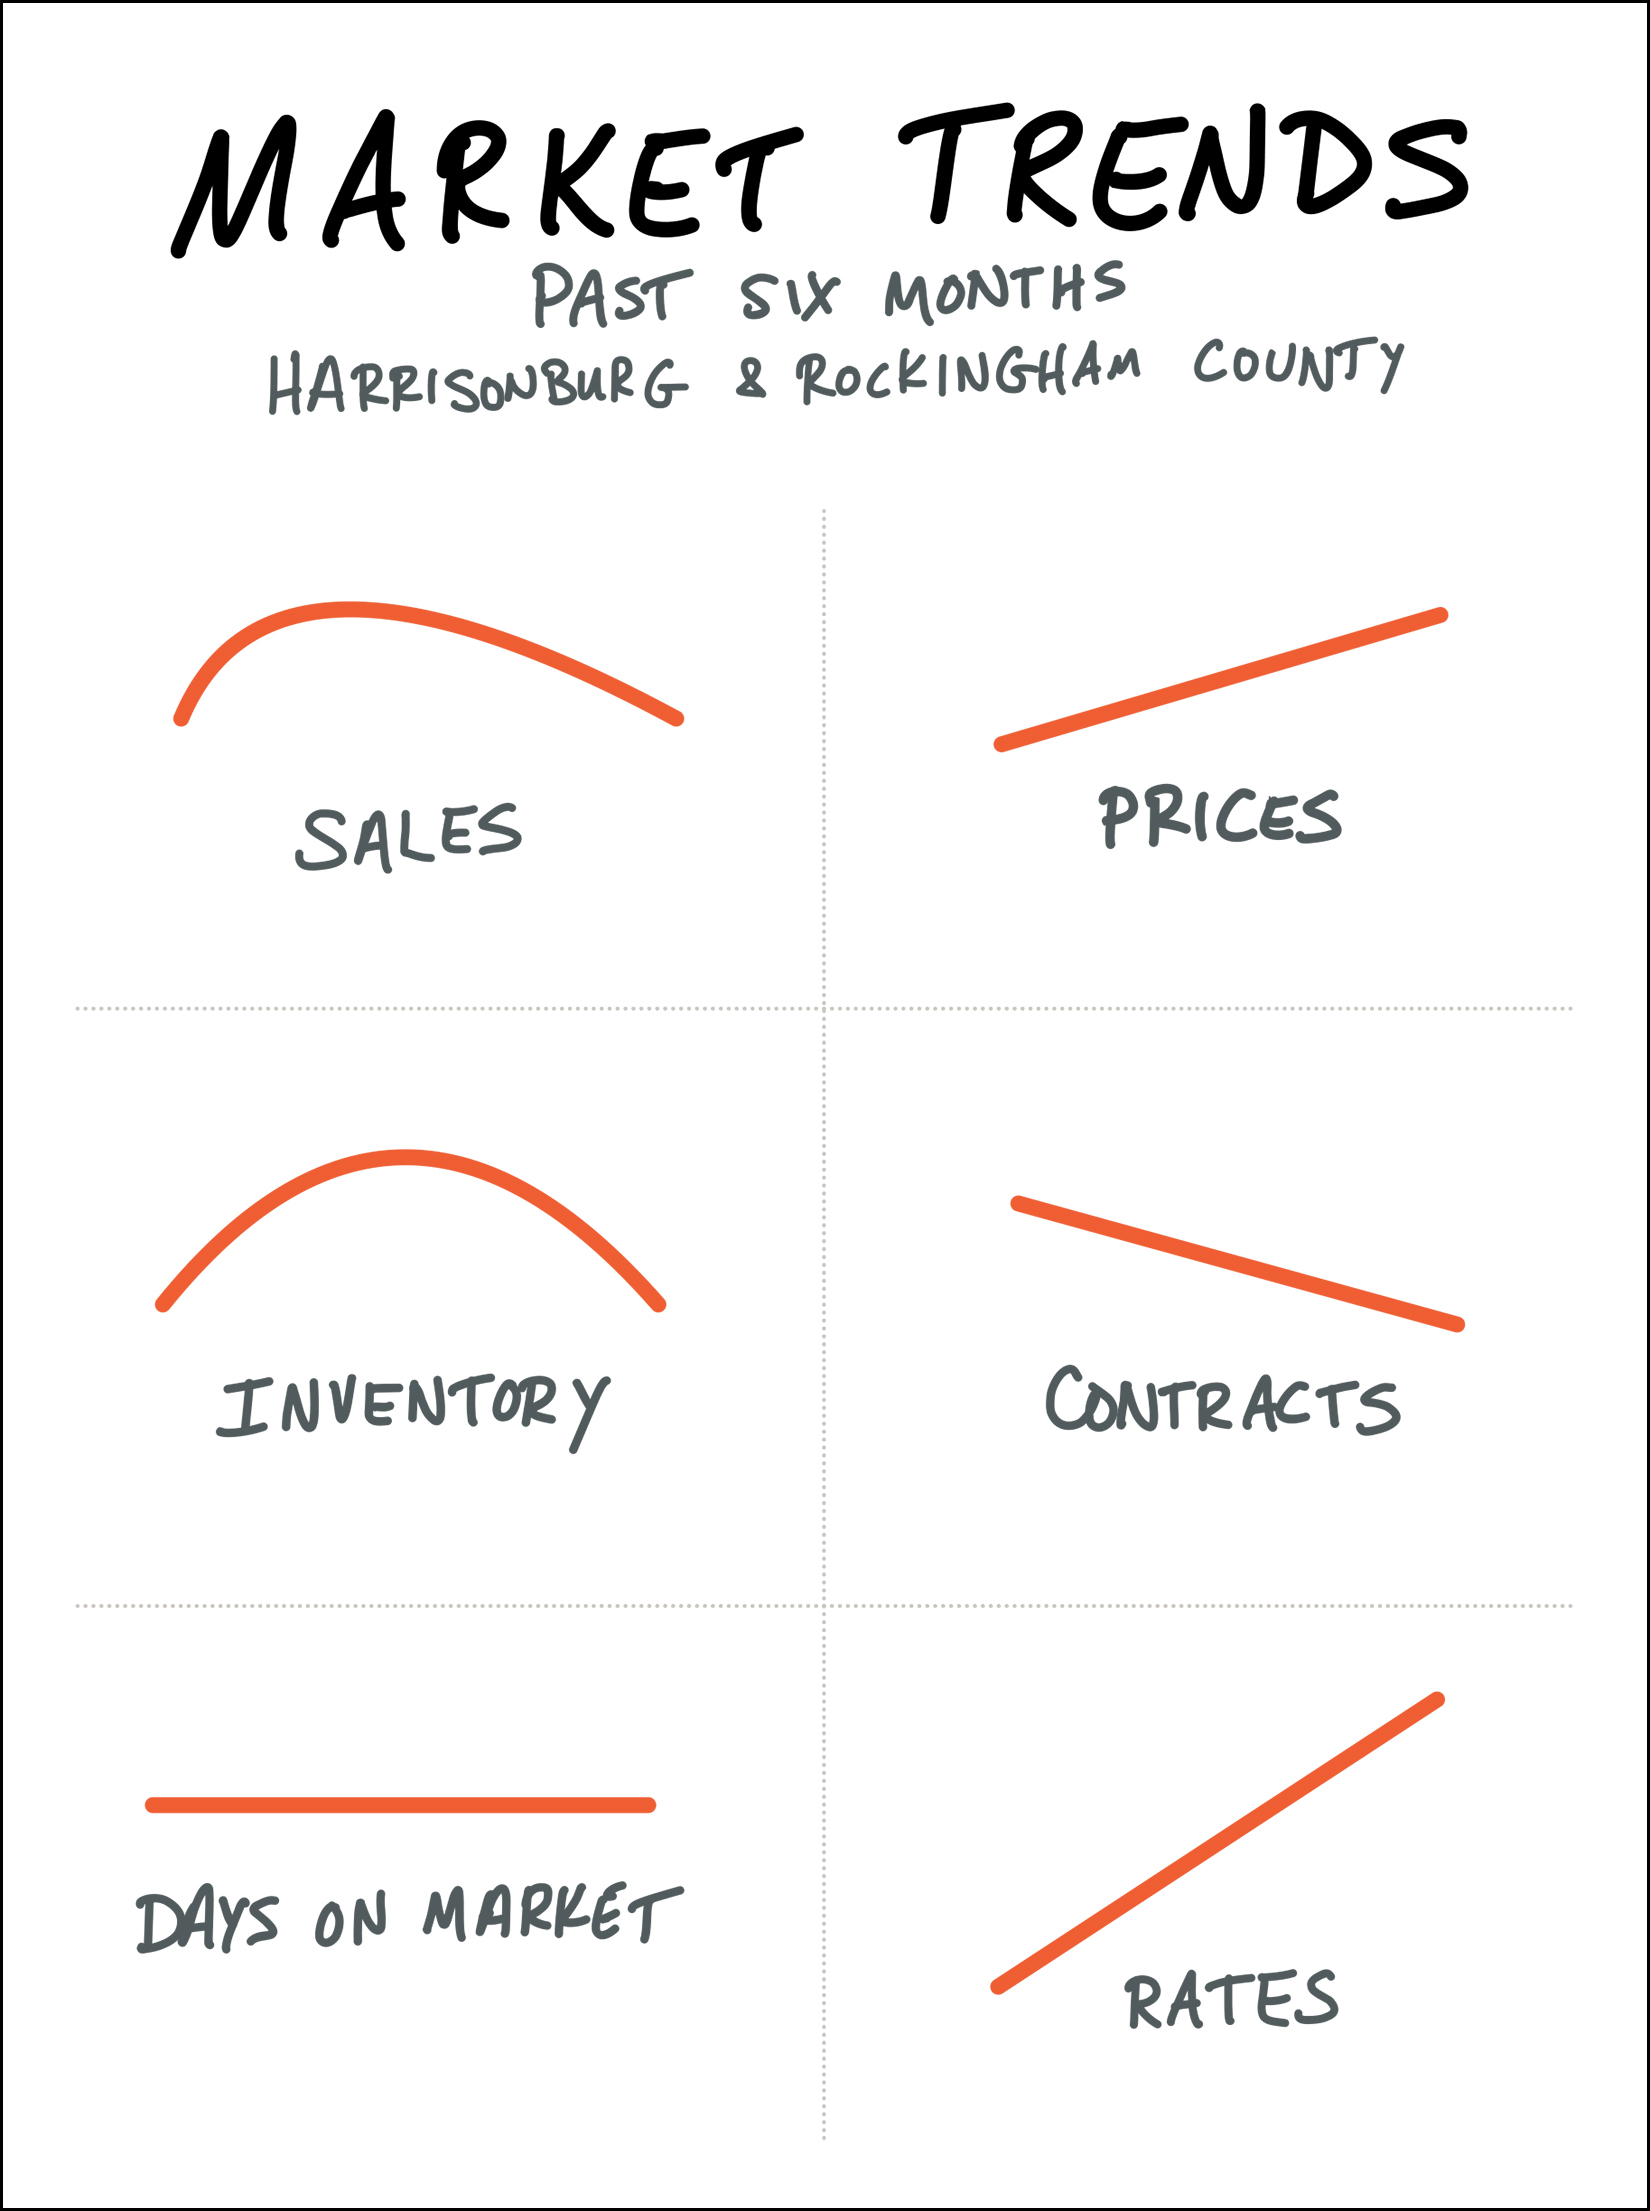 I sent out a long and detailed market report yesterday with lots of data, charts and graphs. You can find it here. But maybe you don't want to read something that long. ;-) For those that don't, enjoy a comprehensive(ish) understanding of the market described above with four lines and two curves. SALES - we have started to see fewer sales over the past four months PRICES - the median sales price keeps on rising INVENTORY - after starting to see some increases we are now seeing what is likely a seasonal decline in the number of homes for sale CONTRACTS - we have seen multiple months of declining contract activity DAYS ON MARKET - homes are still selling fast... very fast RATES - mortgage interest rates keep on rising Sure, this leaves out some of the nuance in yesterday's report, but it should give you a good enough primer to understand the basic market dynamics at play right now in the Harrisonburg and Rockingham County real estate market. Questions? Thoughts? Observations? Email me: scott@hhtdy.com | |
Slightly Fewer Homes Are Selling At Ever Higher Prices |
|
 Happy Monday morning, friends! What a delightfully warm fall we had this year! I hope you have taken advantage of the beautiful weather and explored some of the many outdoor adventures the Shenandoah Valley offers us. Late last month, Shaena and I, with several other family members, enjoyed a 30 mile bike ride on the Greenbrier River Trail in West Virginia and took in many beautiful sights along the way. I highly recommend it as a day trip!  Before we get to latest happenings in our local real estate market, each month I offer a giveaway, of sorts, for readers of this market report, highlighting some of my favorite places (or things) in Harrisonburg. Recent highlights have included Bella Gelato, the JMU Forbes Center and the Harrisonburg Half Marathon. This month, I encourage you to go check out Walkabout Outfitter in downtown Harrisonburg where you will find plenty of awesome gear and apparel for your next outdoor adventure! As a bonus, click here to enter to win a $50 gift certificate to Walkabout Outfitter! Also, take a few minutes to check out this month's featured home... a spacious, five bedroom home in Highland Park located at 3658 Traveler Road! Now, then, let's dig into the data. I'll preface it by saying that the trends you might read regarding significant changes in housing markets across the country don't necessarily seem to be showing up in our local housing market at this time. Read on to see what that means from the latest available data... 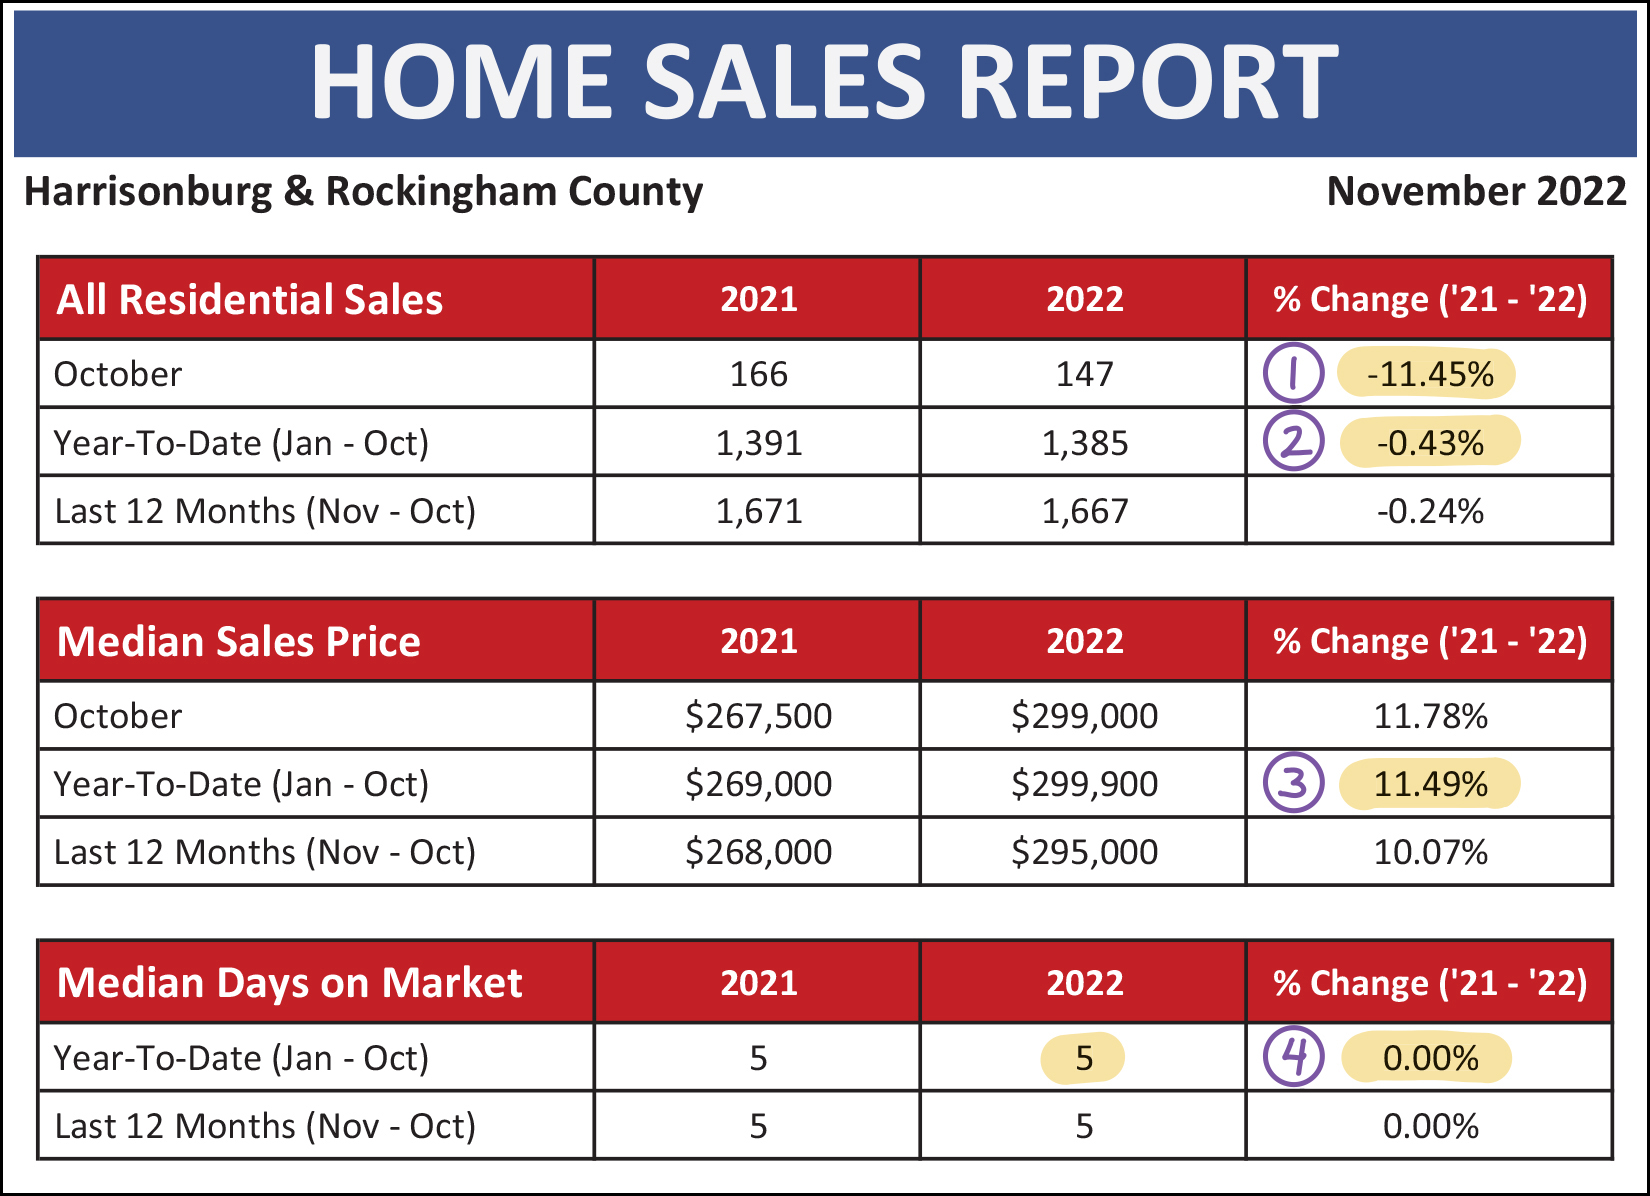 A few things stand out to me as I look at the latest overall numbers in our local housing market above... [1] We saw fewer home sales in October of this year (147) compared to last year (166) which marked an 11% decline in monthly sales activity. [2] This decline in October sales piles onto January through September sales to show a tiny decline in home sales (-0.43%) when looking at the first ten months of this year compared to the first ten months of last year. [3] Homes are still selling for quite a bit more now than they were last year. The median sales price of homes sold thus far in 2022 has been $299,900 -- up 11.5% from last year when the median sales price was $269,000. [4] Homes are still selling (as a whole) just as fast now as they were last year. The current median days on market is five days... just as it was a year ago at this time. This means that half (or more) of homes that sell are under contract within five days of being listed for sale. So... a slower than expected October, but otherwise still quite a strong year of home sales activity. That theme will continue as we work our way through the rest of the data, with only a few exceptions. It is interesting to note the slight difference in performance of detached single family homes compared to attached homes, which includes duplexes, townhouses and condos... 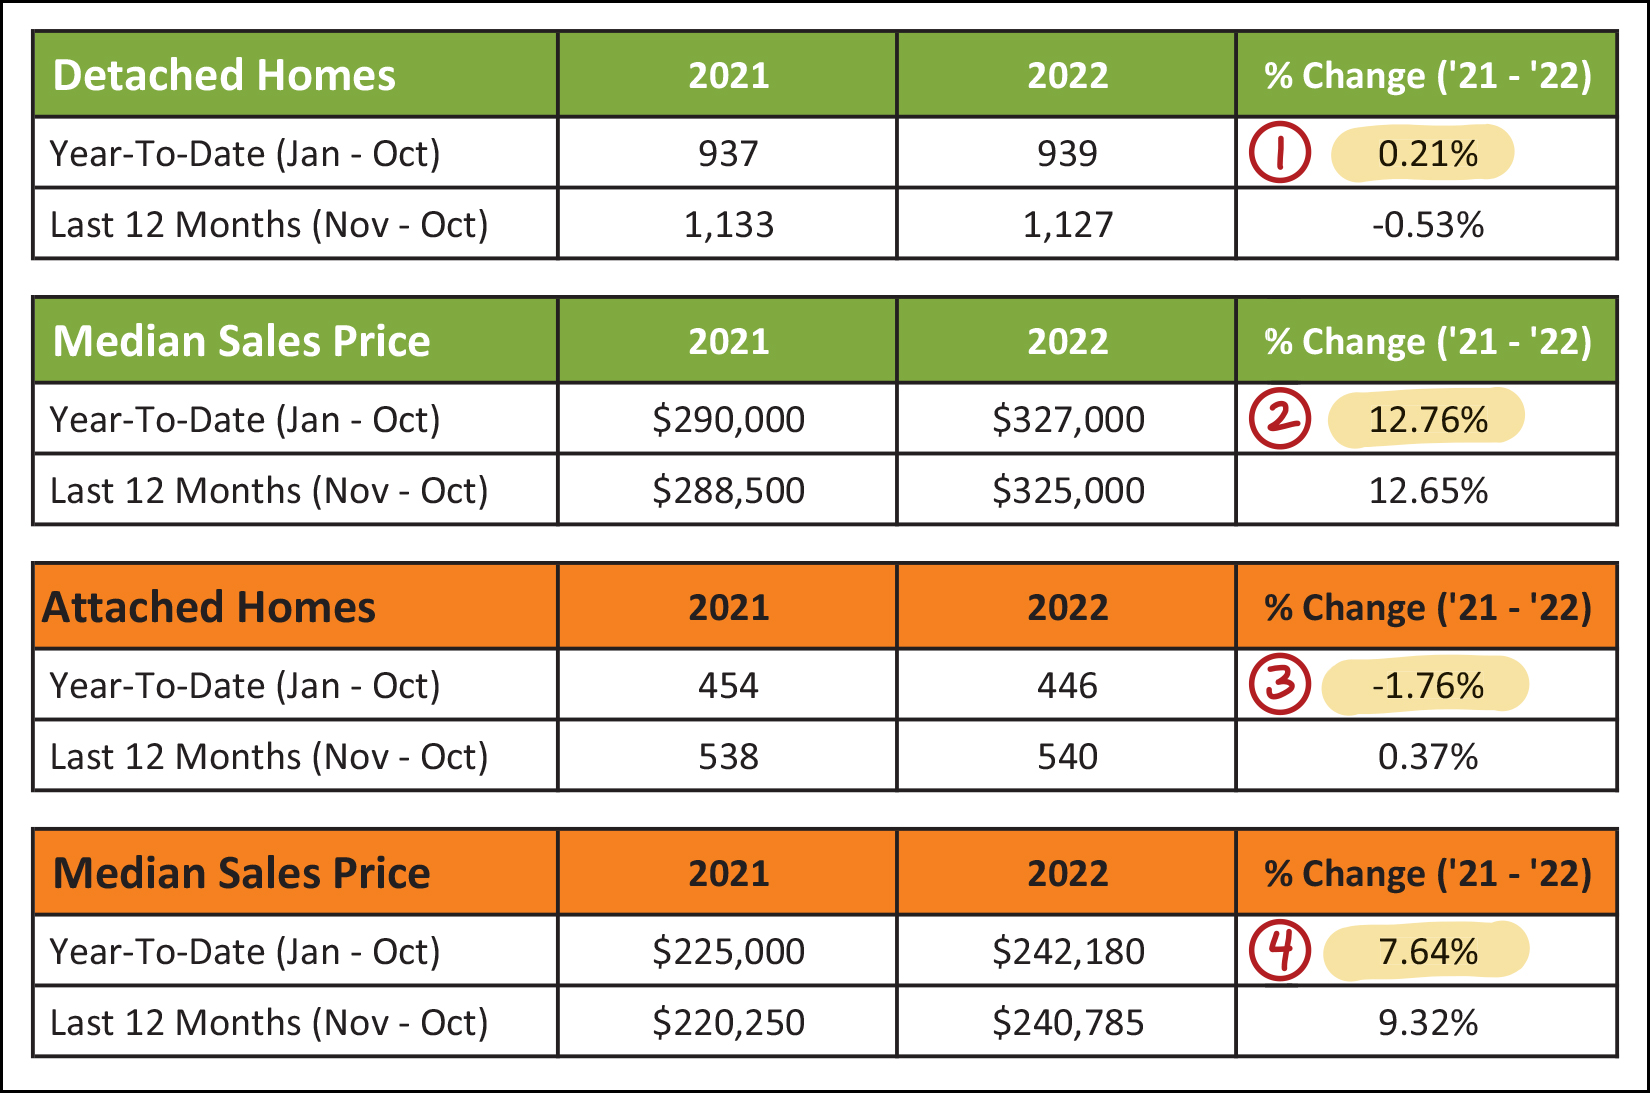 [1&2] Detached single family home sales are shown in the first two green tables above and you'll note that there were just about the same number of sales this year (939) as last year (937) and that the median sales price has increased 13% over the past year. [3&4] In contrast, we have seen a slightly decline (-2%) in attached home sales over the past year and the increase in the median sales price (+8%) is slightly lower than that of single family homes. So, the "detached" portion of our local housing market has outperformed the "attached" portion of the market, but not significantly. Looking at the last few months graphically, it seems the lower month of home sales in October was actually... the fourth month in a row of fewer sales... 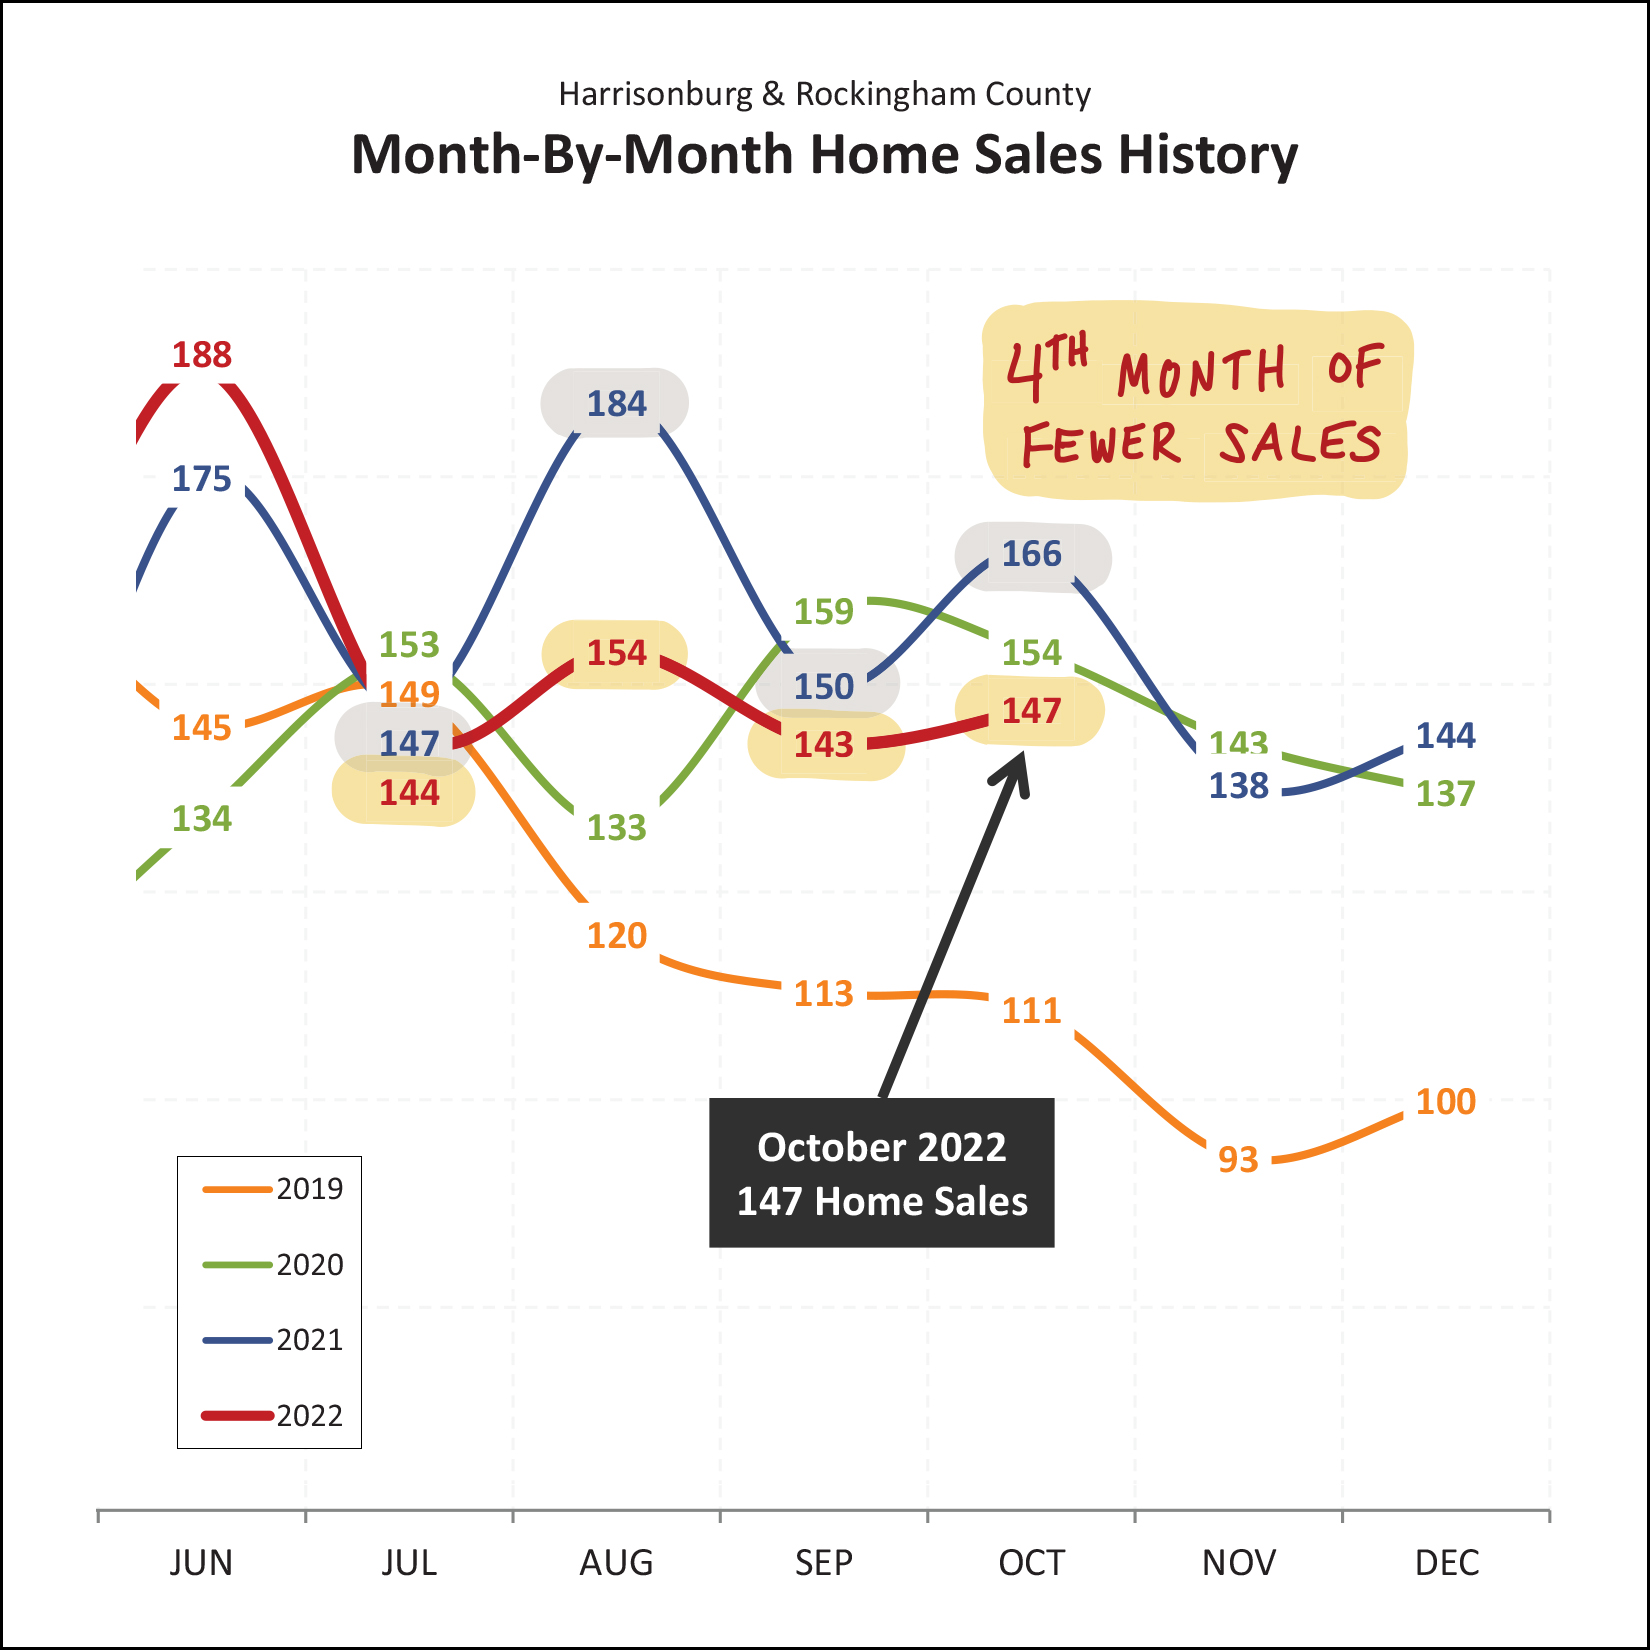 During each of the past four months (Jul, Aug, Sep, Oct) we have seen fewer home sales this year than during the same month last year. Looking ahead, it seems very likely that we will see fewer home sales in November and December as well, especially once we consider the number of contracts signed (or not signed) in October. Read on for more on that... Here, then, for the first month in quite a few years, I am reporting that the pace of home sales (the number selling) is declining... ever so slightly... 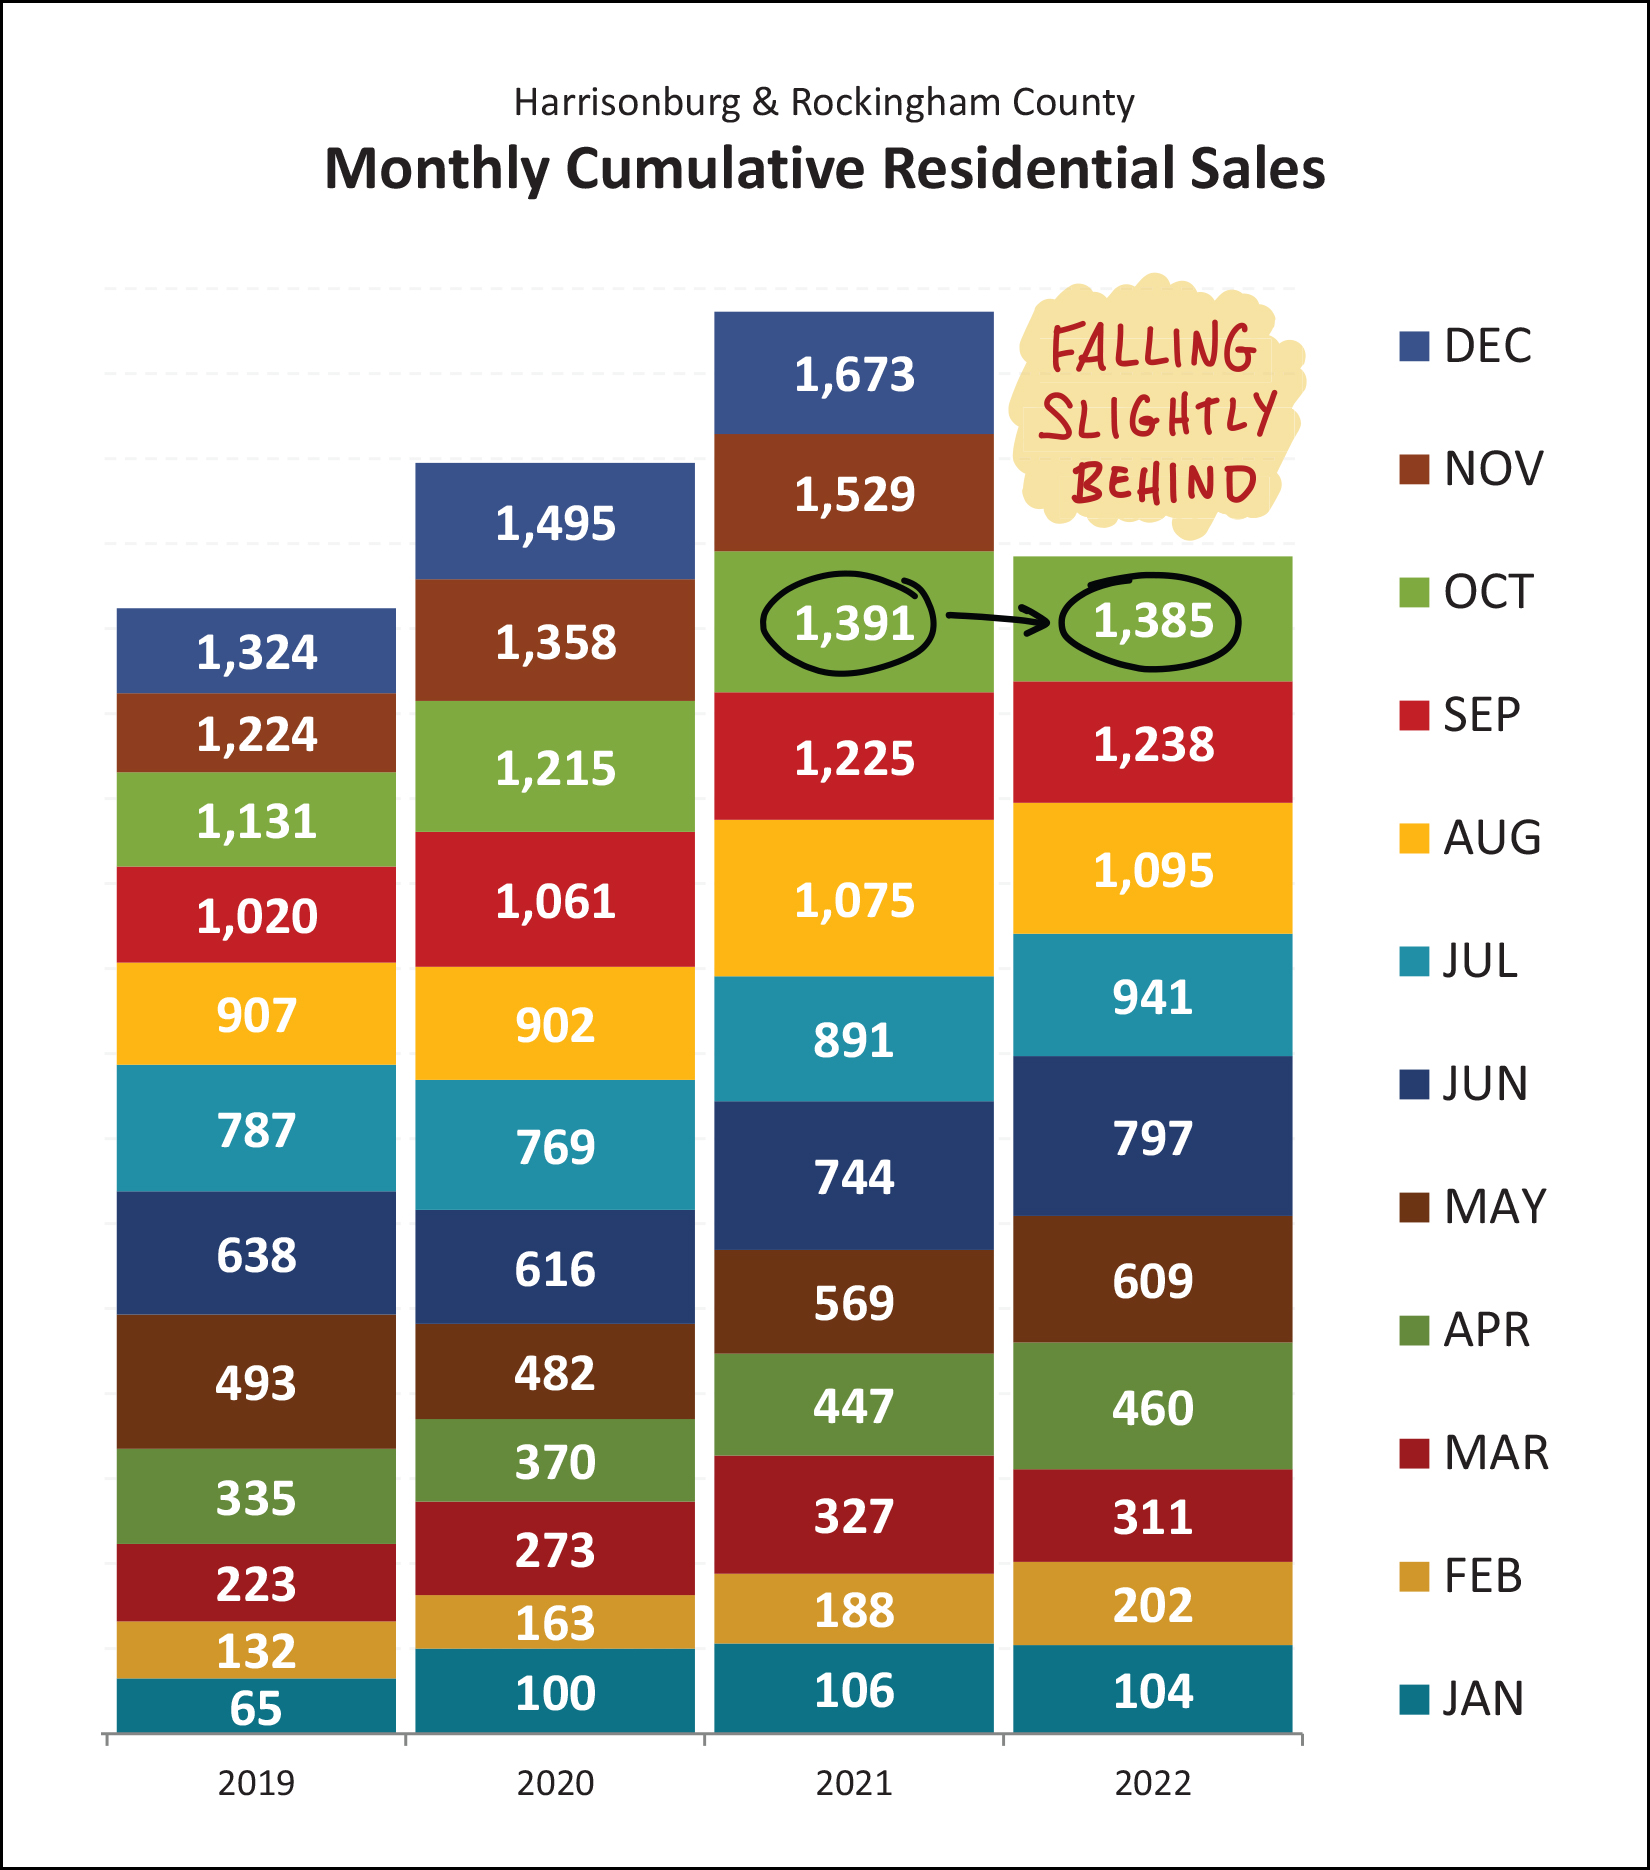 Don't get me wrong, it's been exciting to report each and every month for the past few years that there have been more, and more, and more home sales. But perhaps this rapid increase in the number of homes selling could not go on forever. This year and last are now relatively even when looking at the first ten months of the year, but 2022 is falling slightly behind. At this point, I am predicting that we'll see 2022 fall a bit further behind as we finish out the year. But despite fewer sales, prices are... 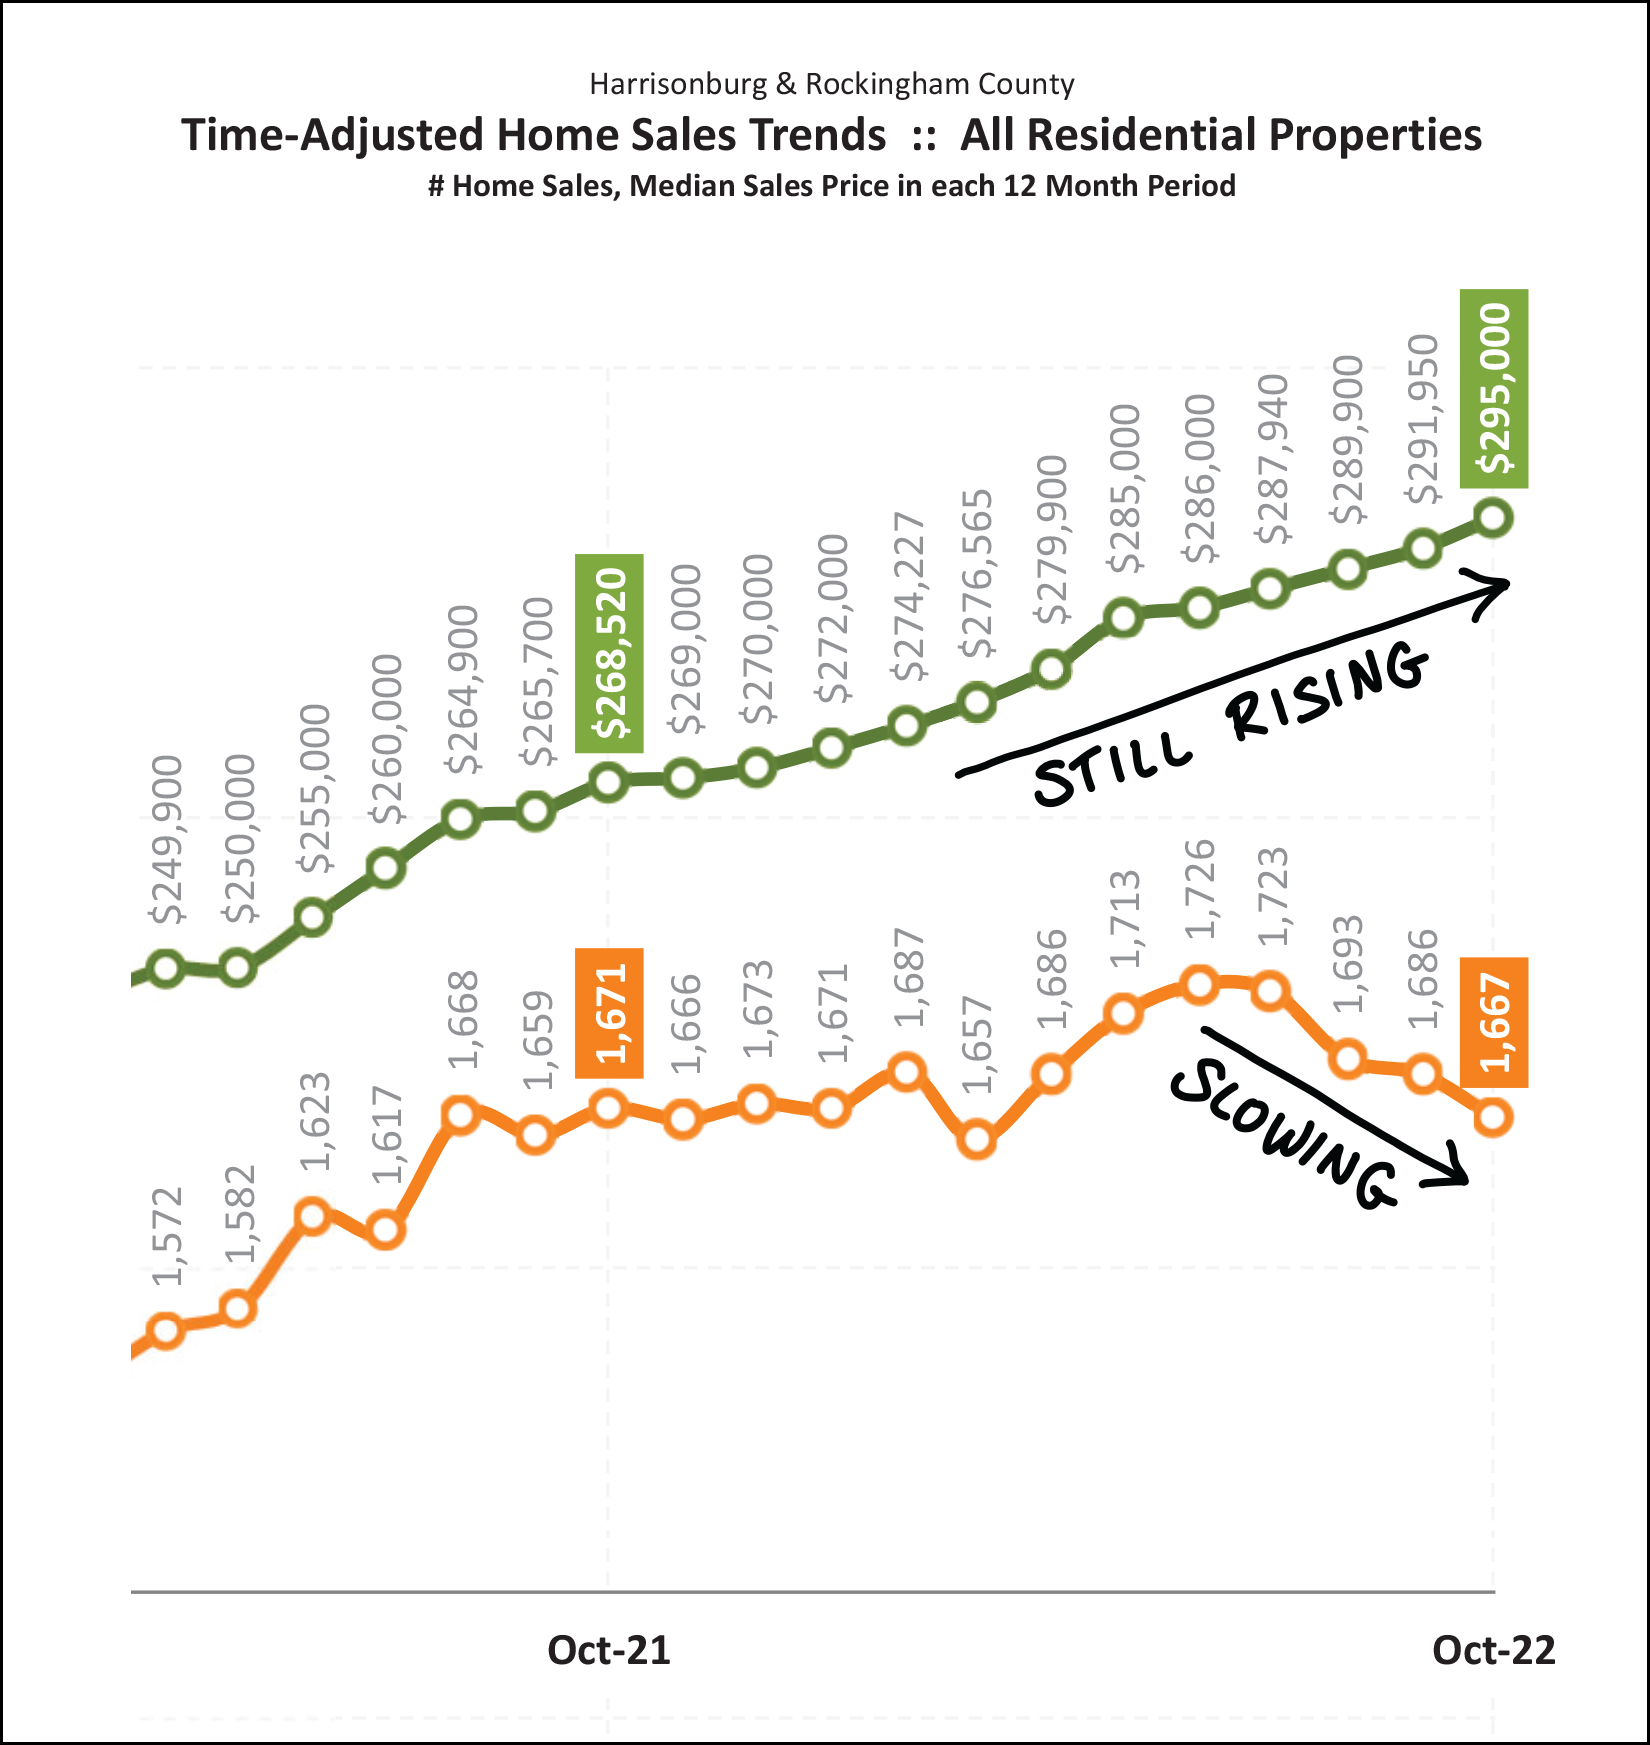 Yes, indeed, home prices are still rising. The orange line above shows the number of homes selling in a year's time. The last four months of declines in the annual pace of sales is a result of those four months of fewer sales shown in the previous graph. We have now seen a decline from a peak of 1,726 sales per year down to 1,667 sales per year. But despite fewer sales... home prices keep on climbing! The median sales price of homes sold in Harrisonburg and Rockingham County over the past year has now risen to $295,000. As one of my past clients once pointed out... most homeowners don't care how many homes are selling... they care about the prices of those homes that are selling. So, from an overall market perspective, things are still looking rather bright in the local housing market as prices seem to still be on the rise, even if we are seeing slightly fewer home sales. Another trend that is interwoven into this equation is housing inventory... how many homes are on the market for sale at any given point... 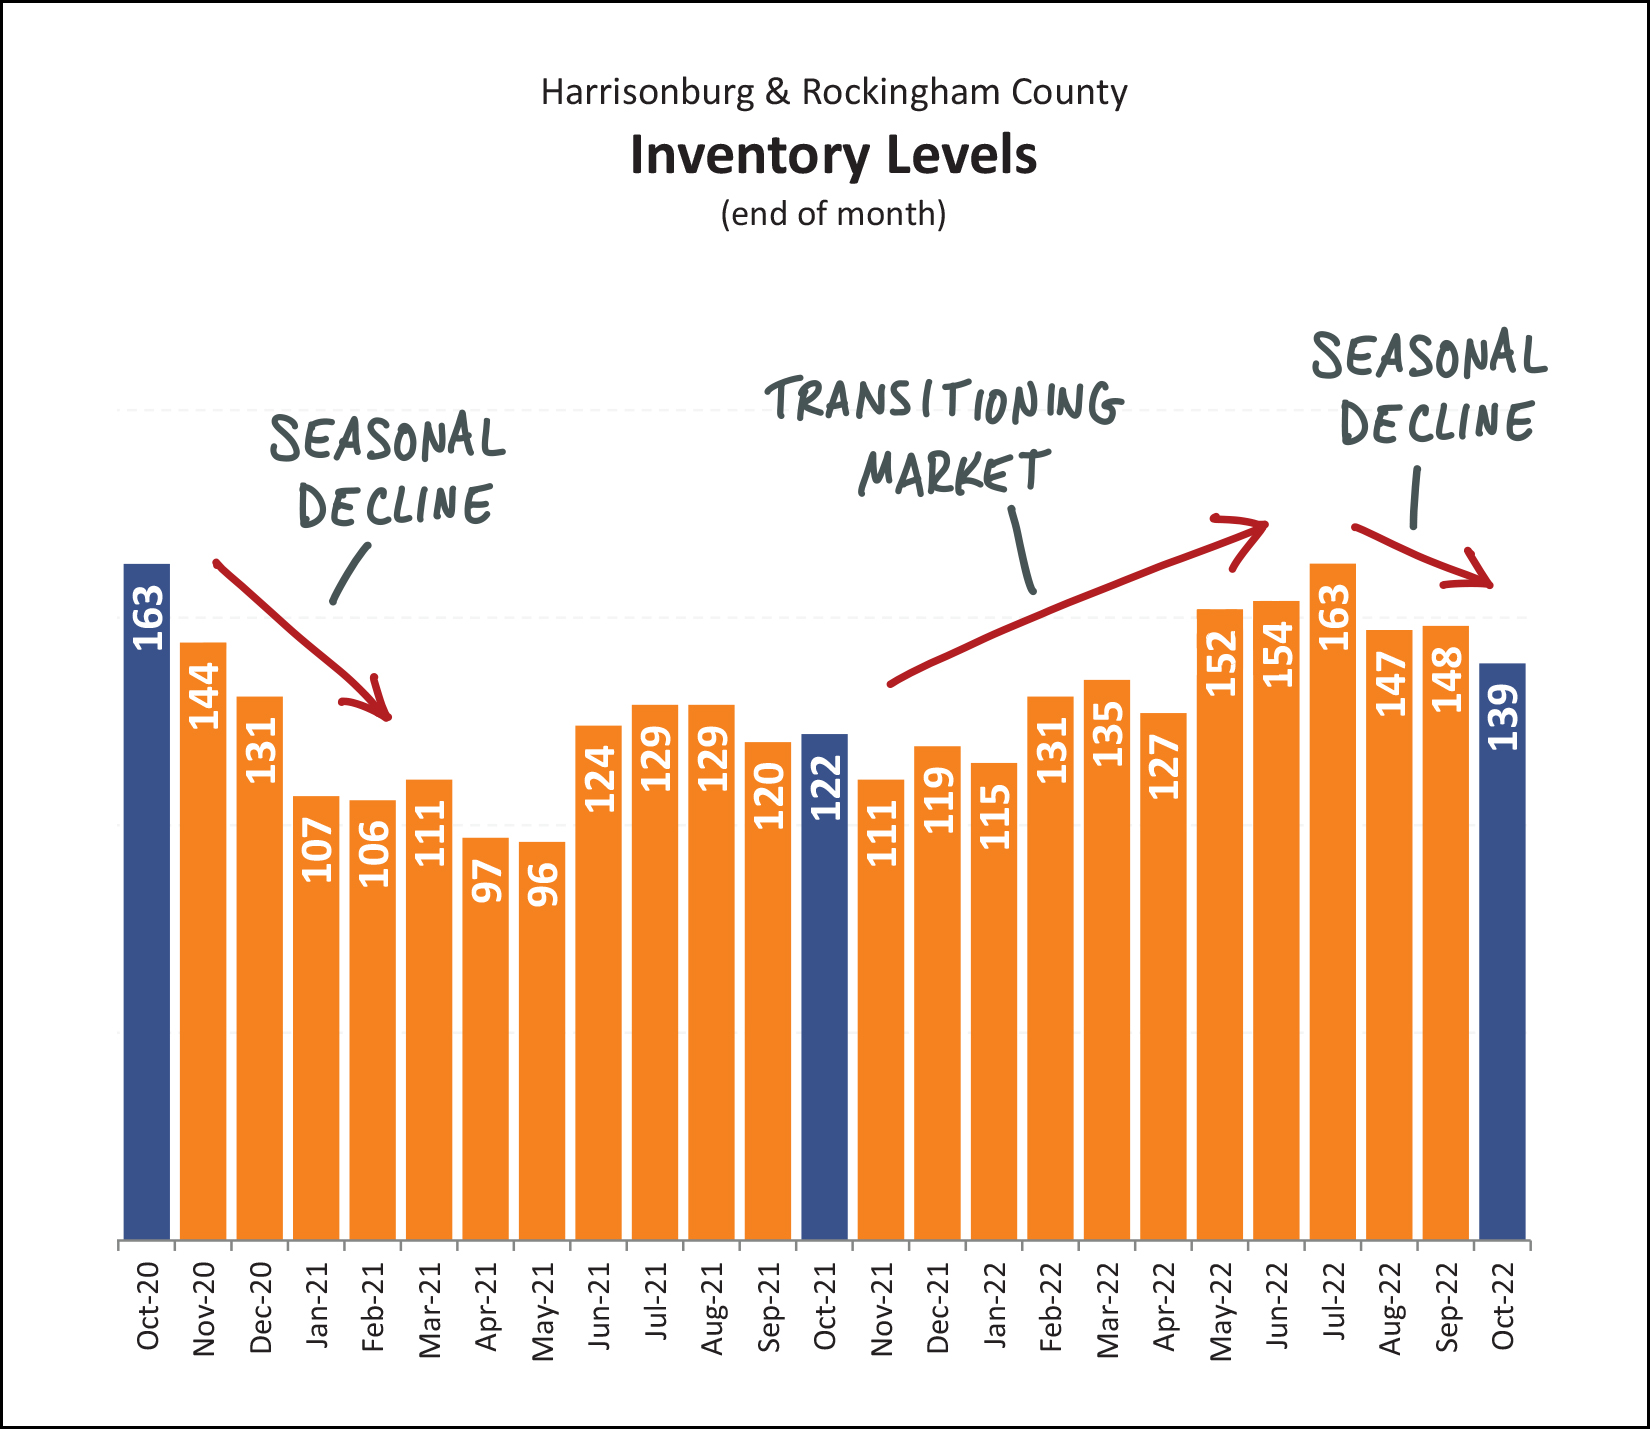 Over the past several years we have seen extremely low inventory levels at any given point in time. Plenty of homes have been listed for sale, but they have gone under contract very quickly given very strong buyer demand in almost all price ranges and locations. During much of 2022 we started to see an increase in the number of homes listed for sale...rising to 163 homes for sale in July... compared to only 129 the previous July. So, yes, the market seems to be transitioning a bit... perhaps we won't see super low inventory levels forever. But despite signs of a slowly transitioning market during the spring and summer of 2022, we are now seeing a normal seasonal decline in inventory levels as we work our way into the fall. The place where the rubber meets the road is when we combine buyer activity (demand) and housing inventory (supply) to see what balance does or does not exist in the market... 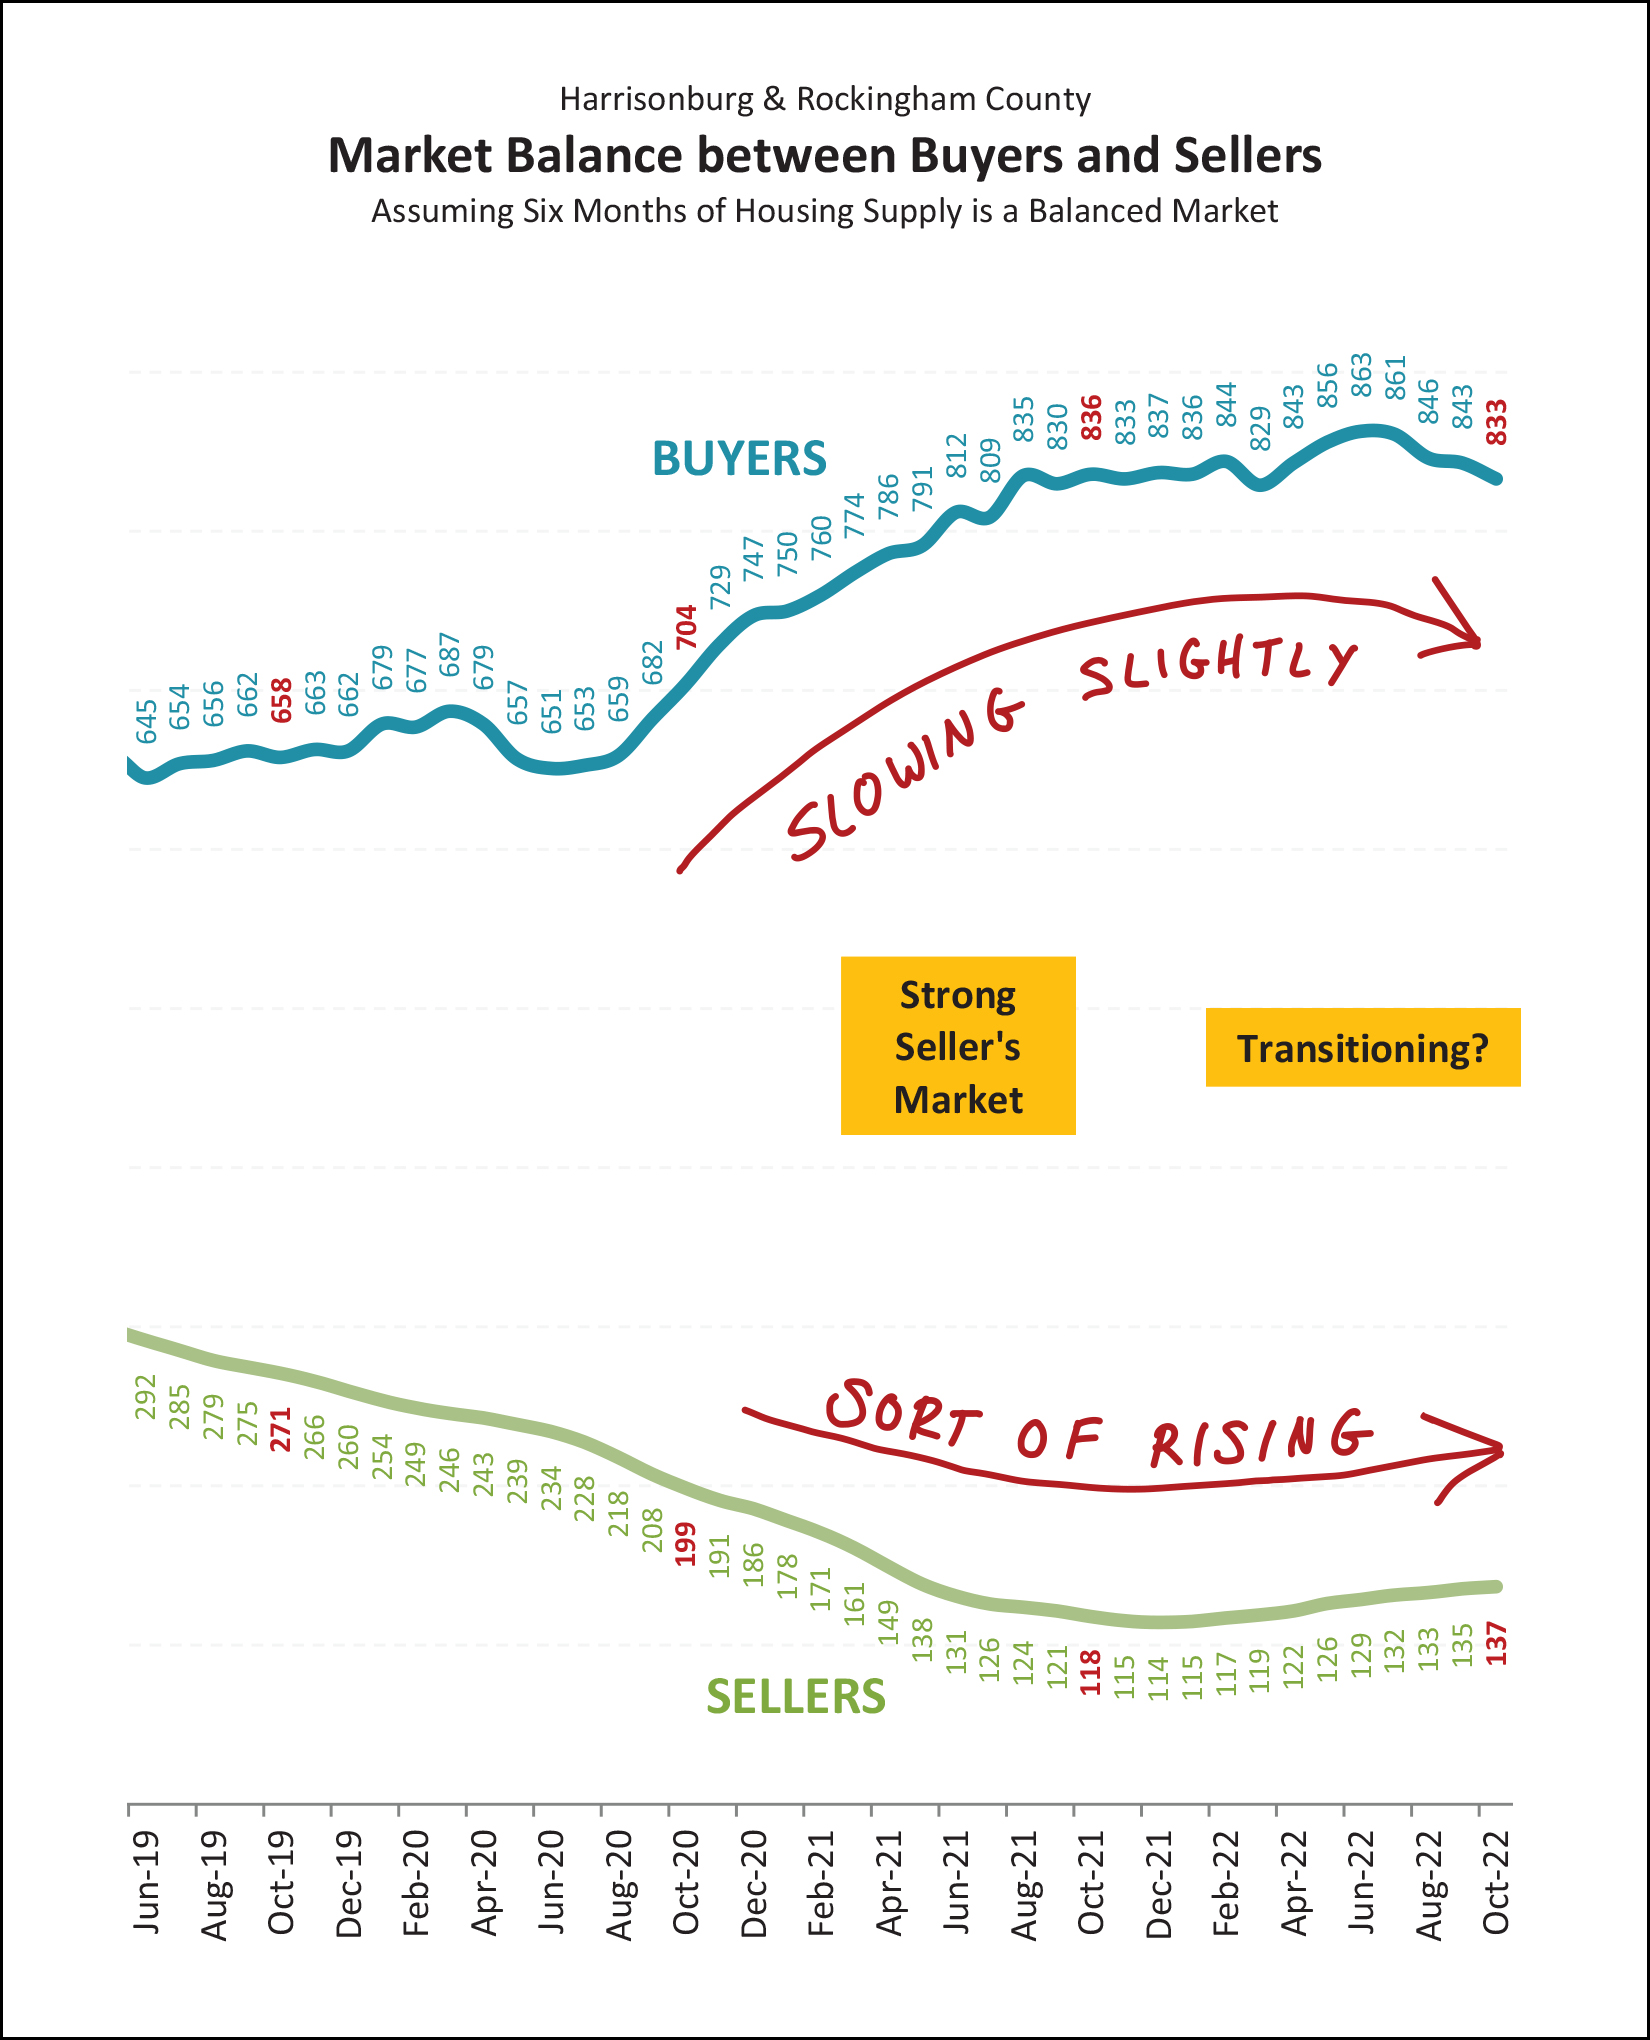 As shown above, we may be starting to see a slight, modest, tiny transition in the balance of the market. We are starting to see buying activity slow... slightly. We are also starting to see inventory levels rise... slightly. Do keep in mind, though, that this is likely a transition from an extremely strong seller's market to a very strong seller's market. There is still very strong demand in the market for most properties at most price points and in most locations. To get anywhere close to being a balanced market we would need to see much more significant declines in buyers who want to buy homes and much more significant increases in sellers who want to sell homes. I'm realizing now that my preceding paragraph might now seem like it was leading up to this next graph. Digest the next graph... don't fall off of your chair... and then keep reading below... 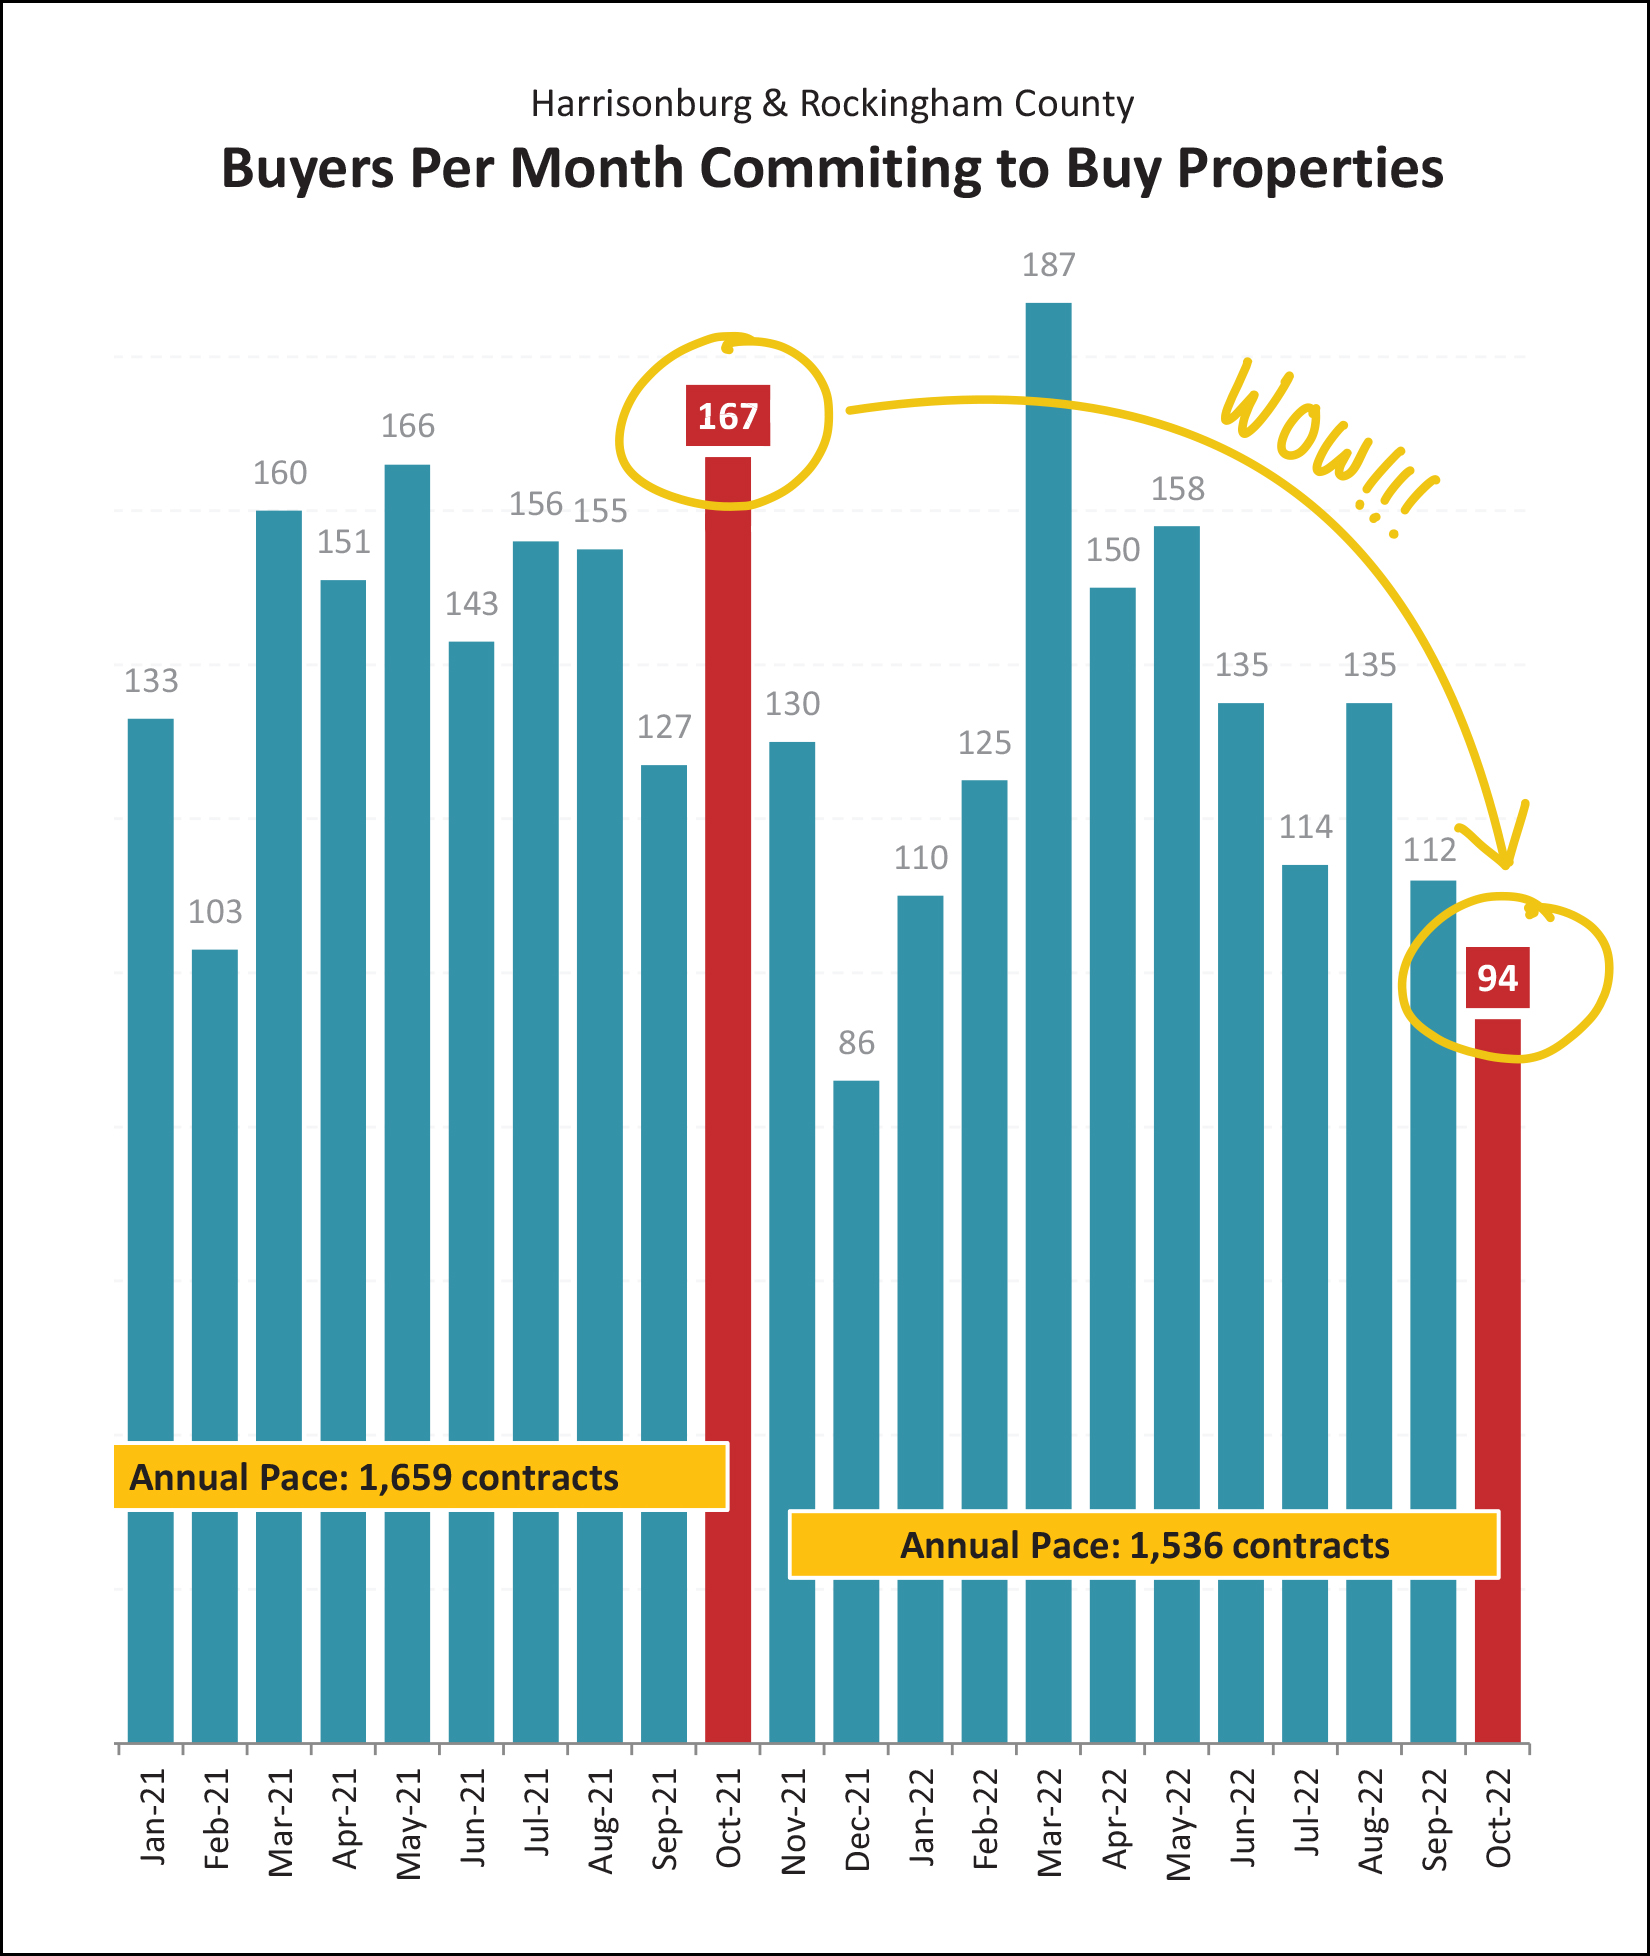 Somewhat surprising, right? There was a significant, large, drastic, huge decline in contracts being signed this October as compared to last October. Why? What happened? Does this mean the market is turning on a dime? Is buyer demand dropping off a cliff overnight? I'd point out a few things... [1] Mortgage interest rates did jump up again, significantly, in September and October - which likely played at least some role in slowing down buyer enthusiasm. Which, side note, was the intended effect -- or at least an understood side effect -- of the interest rate hikes. [2] If we're surprised by the low number of contracts signed this October we should probably be equally (or even more) surprised by the ridiculously high number of contracts signed last October. Last October was the peak of contract signing in all of 2021, which is odd -- that doesn't usually happen in October. All that is to say, the number of contracts signed in October (94) leads me to believe that we will see slightly slower months of home sales in November and December, but it does not cause me to conclude that the market changed drastically sometime in October. Clearly, though, only time will prove me right, wrong, mostly right or mostly wrong. ;-) So... with this big (but perhaps temporary) decline in contracts being signed... and with the slight decline in homes selling... it's probably safe to say that homes are not going under contract as quickly, right? 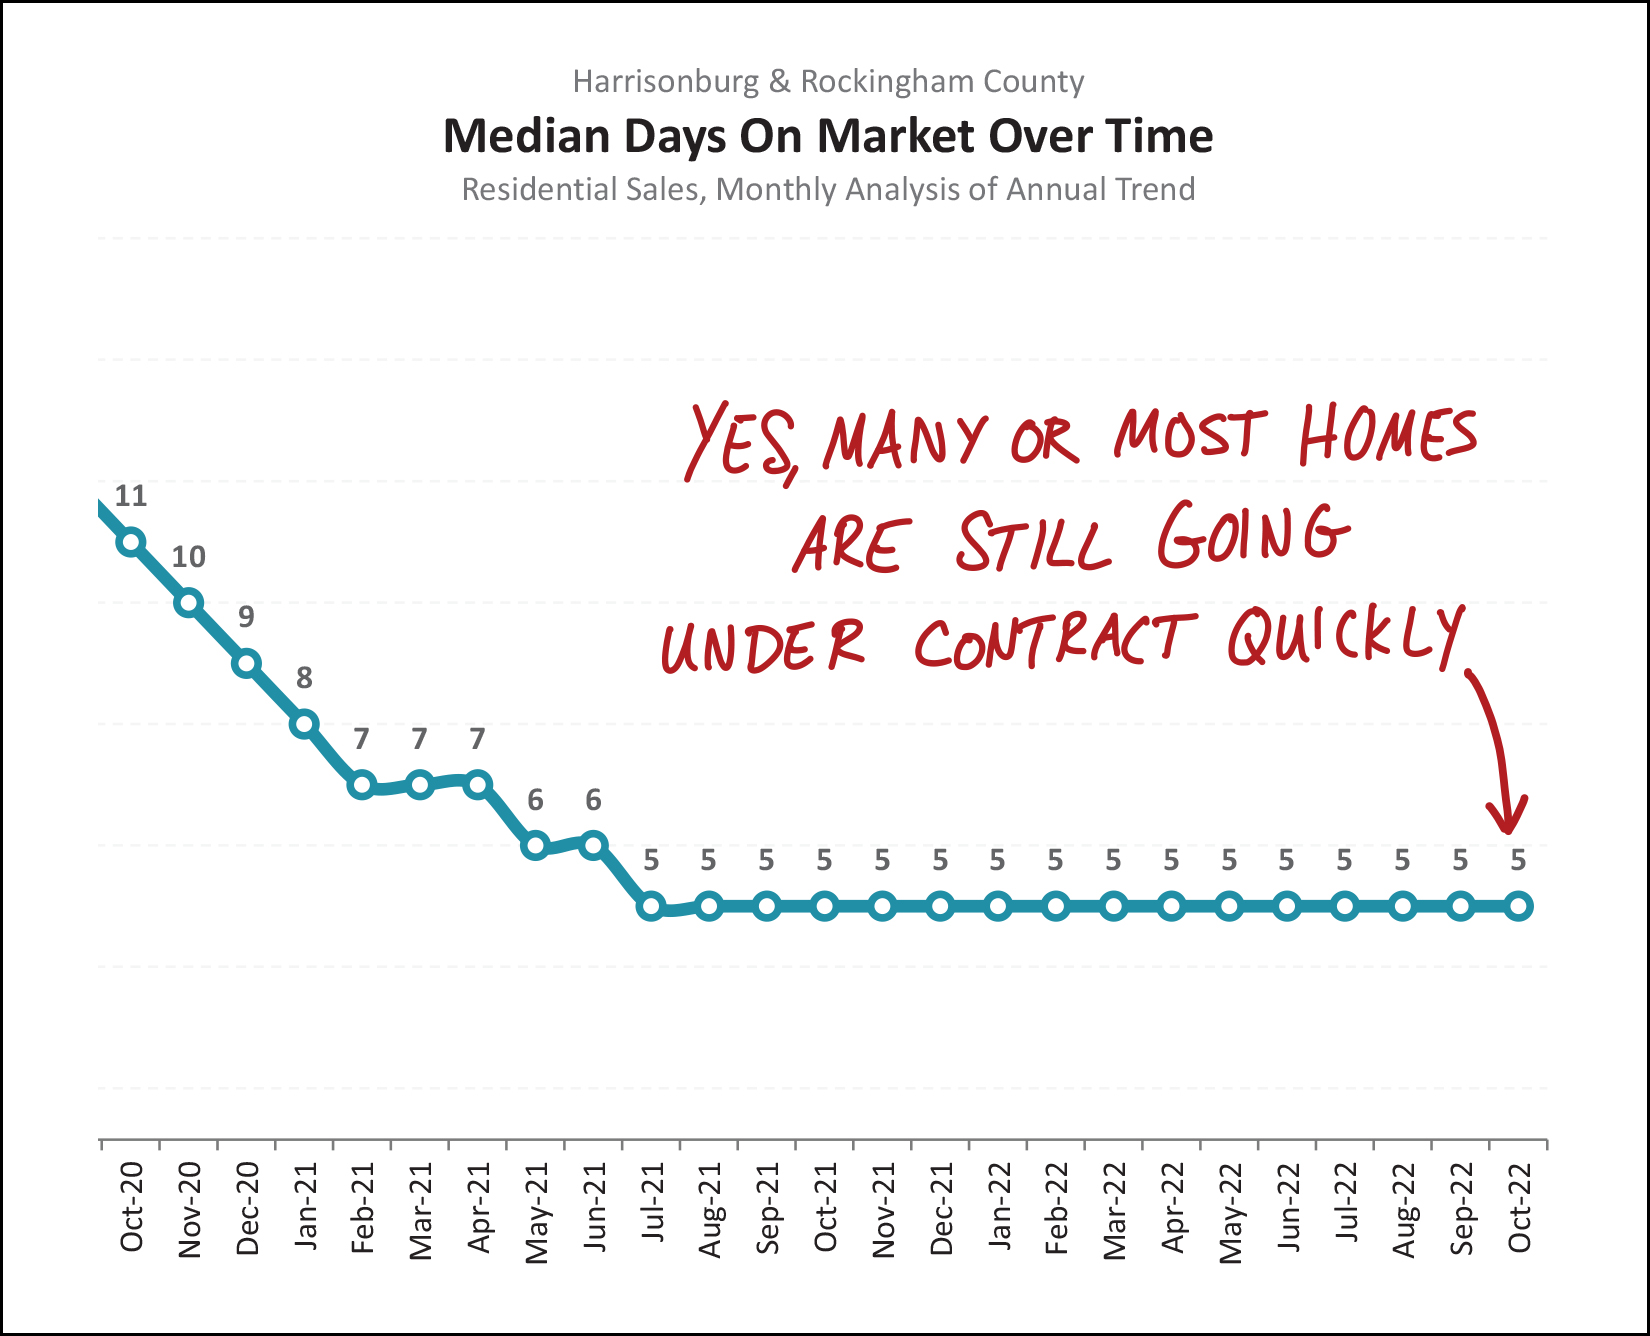 Ummmmm... nope! The "median days on market" metric continues to hover at five days on the market. Homes are still going under contract very quickly. To be clear, this data point above is looking at home sales over the past 12 months to arrive at this "five days" metric. You might then wonder if we would start to see higher "days on market" results if we looked only at the past six months, or three months or one month. Let's take a look... Median Days On Market Past 12 Months = 5 days Past 6 Months = 5 days Past 3 Months = 6 days Past Month = 6 days So, yes, it's taking... one extra day for homes to go under contract. ;-) Now, for our monthly opportunity to point the finger of blame... 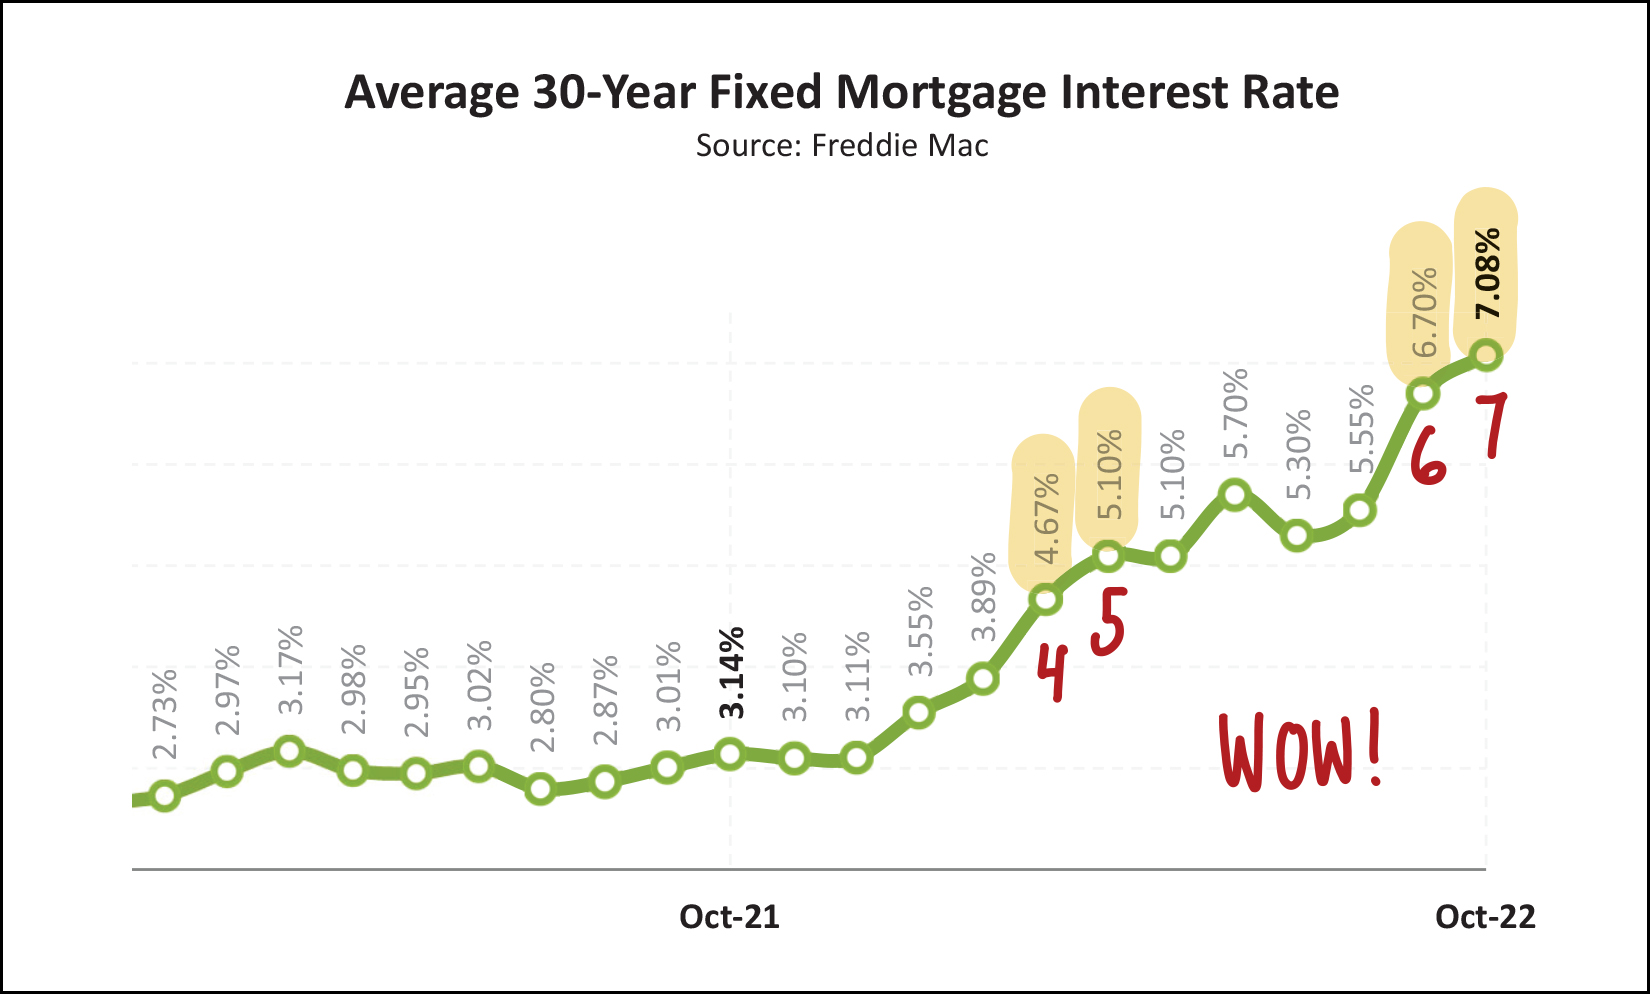 Why oh why are home sales slowing down? Why is contract activity slowing down? What in the world could be causing these changes? ;-) Well, could it be higher mortgage interest rates? We started the year with interest rates below 4% and then proceeded to fly past 4%, 5%, 6% and now 7%. Home buyers will keep on buying as prices rise 10% (or more) per year when mortgage interest rates are between 2% and 4%... but when mortgage interest rates get to 6% or 7% that can start to impact buyer decision making... either because they can no longer afford the monthly mortgage payment... or because they don't want the higher monthly mortgage payment associated with current mortgage interest rates. Just as a bit of context (that is sure to make me sound old) back when Shaena and I bought our first home (a townhouse in Beacon Hill in 2003) our mortgage interest rate was... 6.25%. So, these mortgage interest rates of 6% or 7% aren't absolutely crazy from a long-term context, but after experiencing abnormally low mortgage interest rates for years, and years, and years... a 6% or 7% rate certainly sounds and feels high! Now then, where does all of this leave us? Lots of homes are still selling... rather quickly... at higher prices than ever before... but buyer activity is slowing a bit... at least partially related to high mortgage interest rates. Thus, my advice is as follows, depending on where you fit into our local market... SELLERS - Consider selling sooner rather than later in case mortgage interest rates keep climbing, or in case prices start to level out. BUYERS - Consult with an experienced lender to understand your best mortgage options to make sure you are buying at a reasonable and comfortable price point. HOMEOWNERS - Enjoy your (likely) low mortgage interest rate, and your still-increasing home value. If you're considering buying or selling yet this year... or in early 2023... let's chat sooner rather than later to formulate a game plan. The first step? Email me or text/call me at 540-578-0102. I'll provide another market update next month, but between now and then I hope you have a wonderful Thanksgiving and that you are able to let those dear to you know how thankful you are that they are a part of your life. Happy Thanksgiving! | |
10% Of A Big Number Is... A Big Number! |
|
 Between 2020 and 2021, the median sales price of a detached home in Harrisonburg and Rockingham County increased by over ten percent! Between 2021 and 2022, the median sales price of a detached home in Harrisonburg and Rockingham County increased by over ten percent! I've told you about these back to back years of double digit increases enough times that you might not be surprised when you read the statements above. But, sometimes when we translate it into actual numbers, it can be surprising. Let's say a property was worth $460K two years ago. Based on the changes (+10%) in the overall market, that property may very well have been worth $506K last year. Based on the changes (10%) in the overall market, that property may very well be worth $556K today. Gasp! A house that was worth $460K two years ago is now potentially worth almost $560K today? An increase of nearly $100,000 in just two years!?! Indeed, these double digit increases in value can end up being very large increases in dollars when we start at a very high price point. | |
Fewer Than 10% Of Buyers Spend Less Than $200K On Single Family Homes In Harrisonburg, Rockingham County |
|
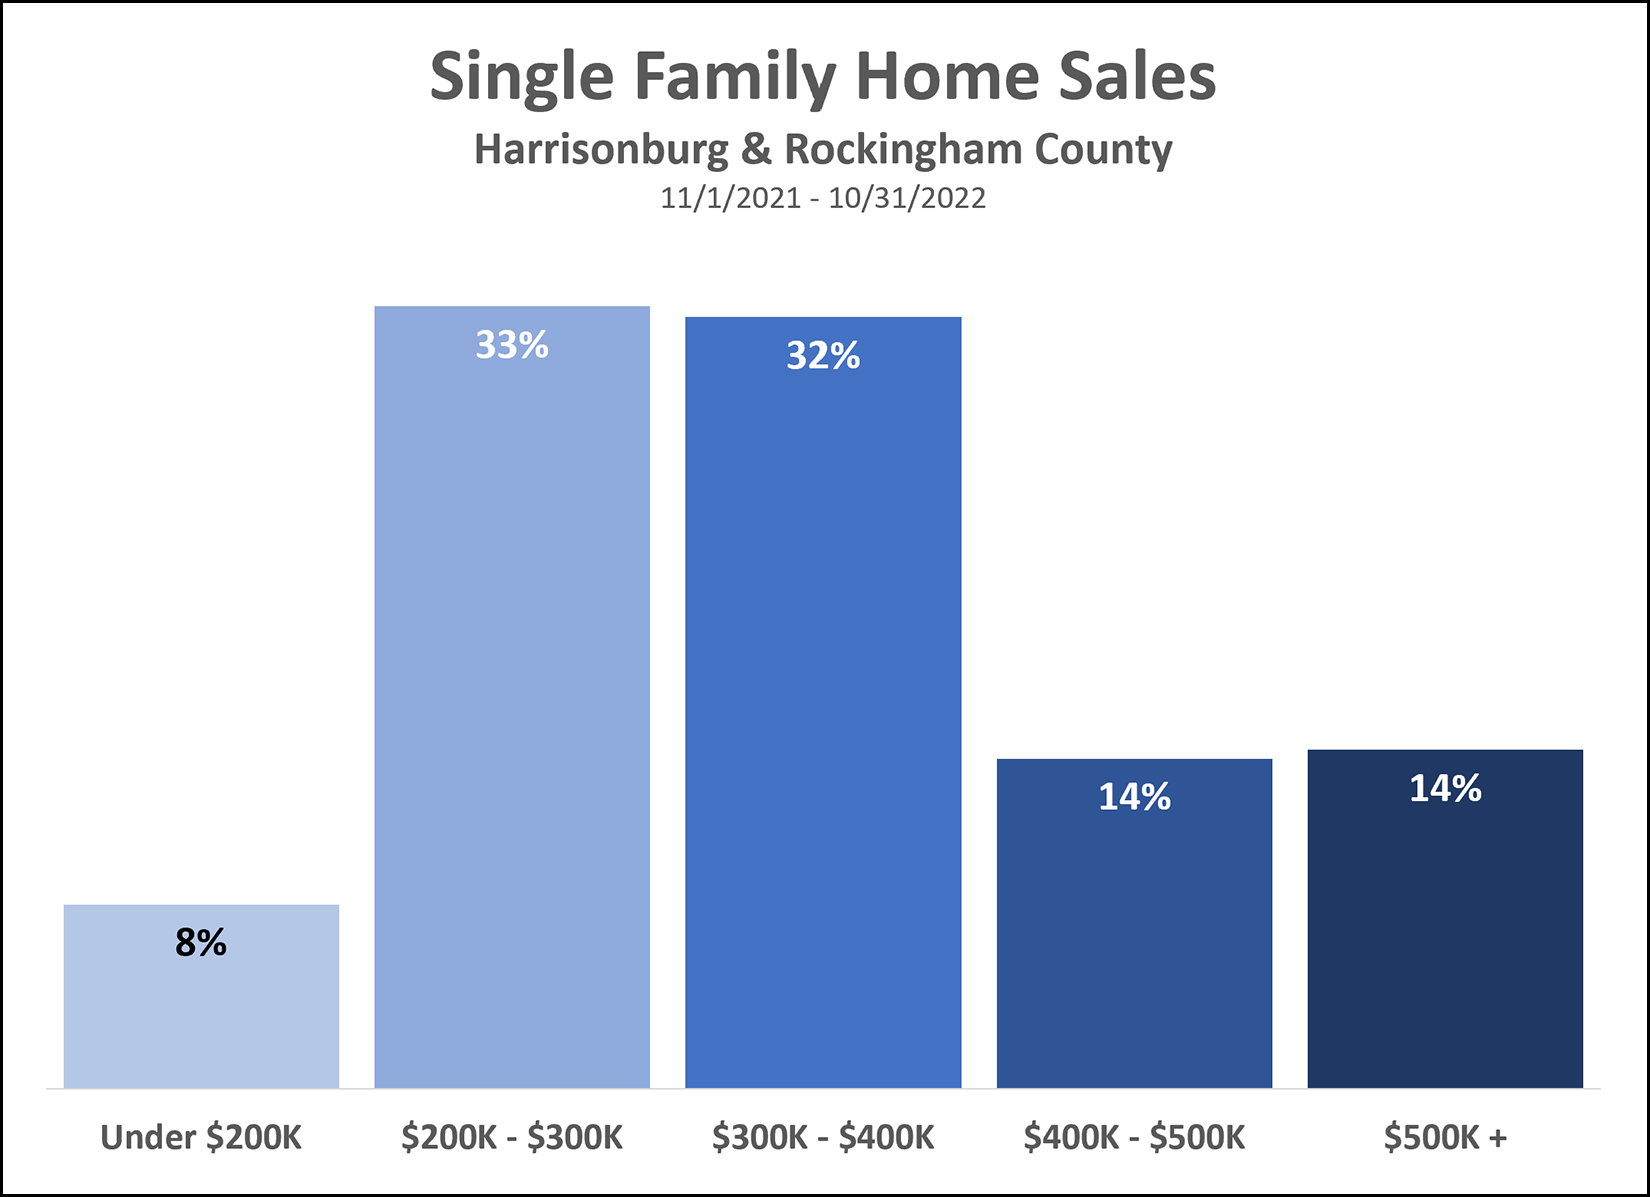 If you're hoping to buy a single family home for less than $200,000 in Harrisonburg or Rockingham County, you might find it challenging to do so. Only 8% of the single family homes sold in the past 12 months have sold for less than $200,000. Getting straight to the numbers... Total Detached Home Sales = 1,123 Detached Home Sales Under $200K = 86 | |
| Newer Posts | Older Posts |
Scott Rogers
Funkhouser Real
Estate Group
540-578-0102
scott@funkhousergroup.com
Licensed in the
Commonwealth of Virginia
Home Search
Housing Market Report
Harrisonburg Townhouses
Walk Through This Home
Investment Properties
Harrisonburg Foreclosures
Property Transfers
New Listings


