Market
| Newer Posts | Older Posts |
Where Do Home Prices Go From Here? |
|
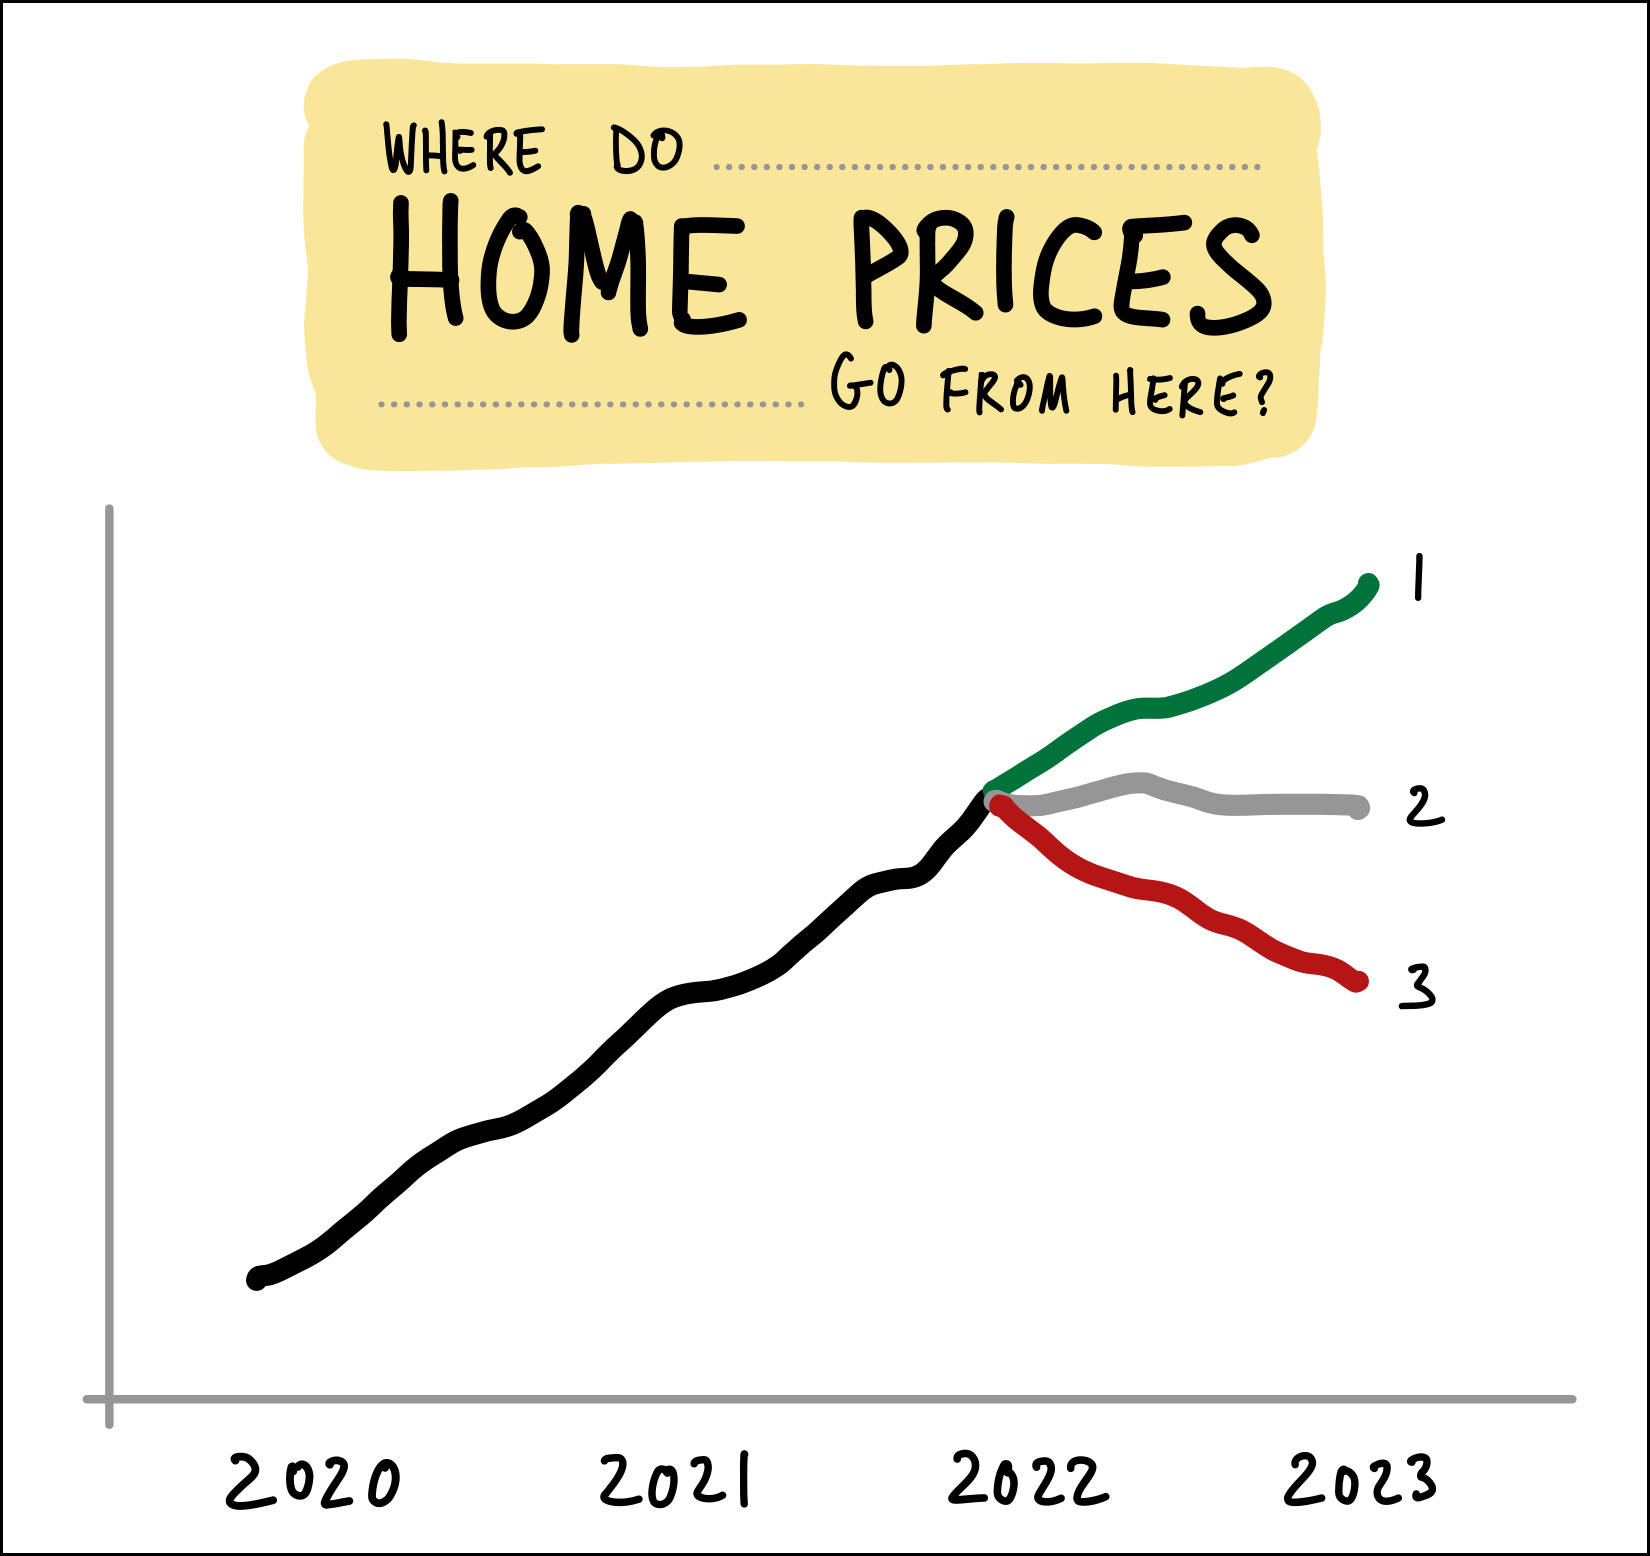 This is a question very much on the mind of potential home buyers and potential home sellers in the local real estate market in late 2022... Where DO home prices go from here? As per the illustration above, do we see... 1. Home prices keep in rising, perhaps another 10% in 2023. 2. Home prices plateau in 2023, with similar prices as in 2022. 3. Home prices correct, drop, droop, decline by 10% in 2023. It's hard to imagine won't keep increasing (scenario one) given that they have through the first nine months of 2022 even in the context of quickly rising mortgage interest rates. But yet at the same time, it's hard to imagine that prices won't level out or decline some given those quickly rising mortgage interest rates. I can be convinced by those that I talk to (buyers, sellers, agents, bankers, appraisers) that prices will keep on rising in Harrisonburg and Rockingham County... and I can be convinced by those same folks (or a different set of them) that home prices will flatten out or decline slightly in 2023. So, I have absolutely zero answers as to what we should expect in 2023, but interestingly, even if home prices dropped by 10% in 2023... that would take us ALLLLL the way back to 2021 sales prices. ;-) | |
October 2022 Contract Activity Has Dropped Significantly, Sort Of |
|
 Has the local real estate market slowed down? Oh yes, quite a bit! How so? Last October 156 homes went under contract in the first 27 days of the month... and this year only 81 homes have gone under contract in that time frame. Wow. Quite a bit slower! Indeed. -- So, yes, contract activity this month is much lower than it was last year during October... but as the graph above reveals, there may be more to the story. First of all, the orange and green bars represent 2020 and 2021 and I think we'll eventually look back and conclude that they were abnormal years, with buying activity super-charge by a worldwide pandemic, as unexpected as that was. So, the bright orange and bright green bars that tower above the rest of the months on the chart might be outliers. Looking for a moment, then, just at the blue bars... This August (2022) we saw a 13% increase in August contracts compared to August 2019. This September (2022) we saw a 10% increase in September contracts compared to September 2019. And...in October... we are dragging ever so slightly behind October 2019, but things aren't looking overly different from where things were three years ago, just before Covid. -- So... is this October slower than last October when it comes to contracts being signed? Yes, absolutely! Much slower! Is this October slower than the last pre-Covid October we have seen in this market? It's slower, but just barely. Is the pace of home buying slowing down in Harrisonburg and Rockingham County? Yes, it seems so... but by how much depends on whether we compare the present times to Covid times or pre-Covid times. | |
Contract Activity Seems To Be Slowing Down (Quite A Bit) In October 2022 |
|
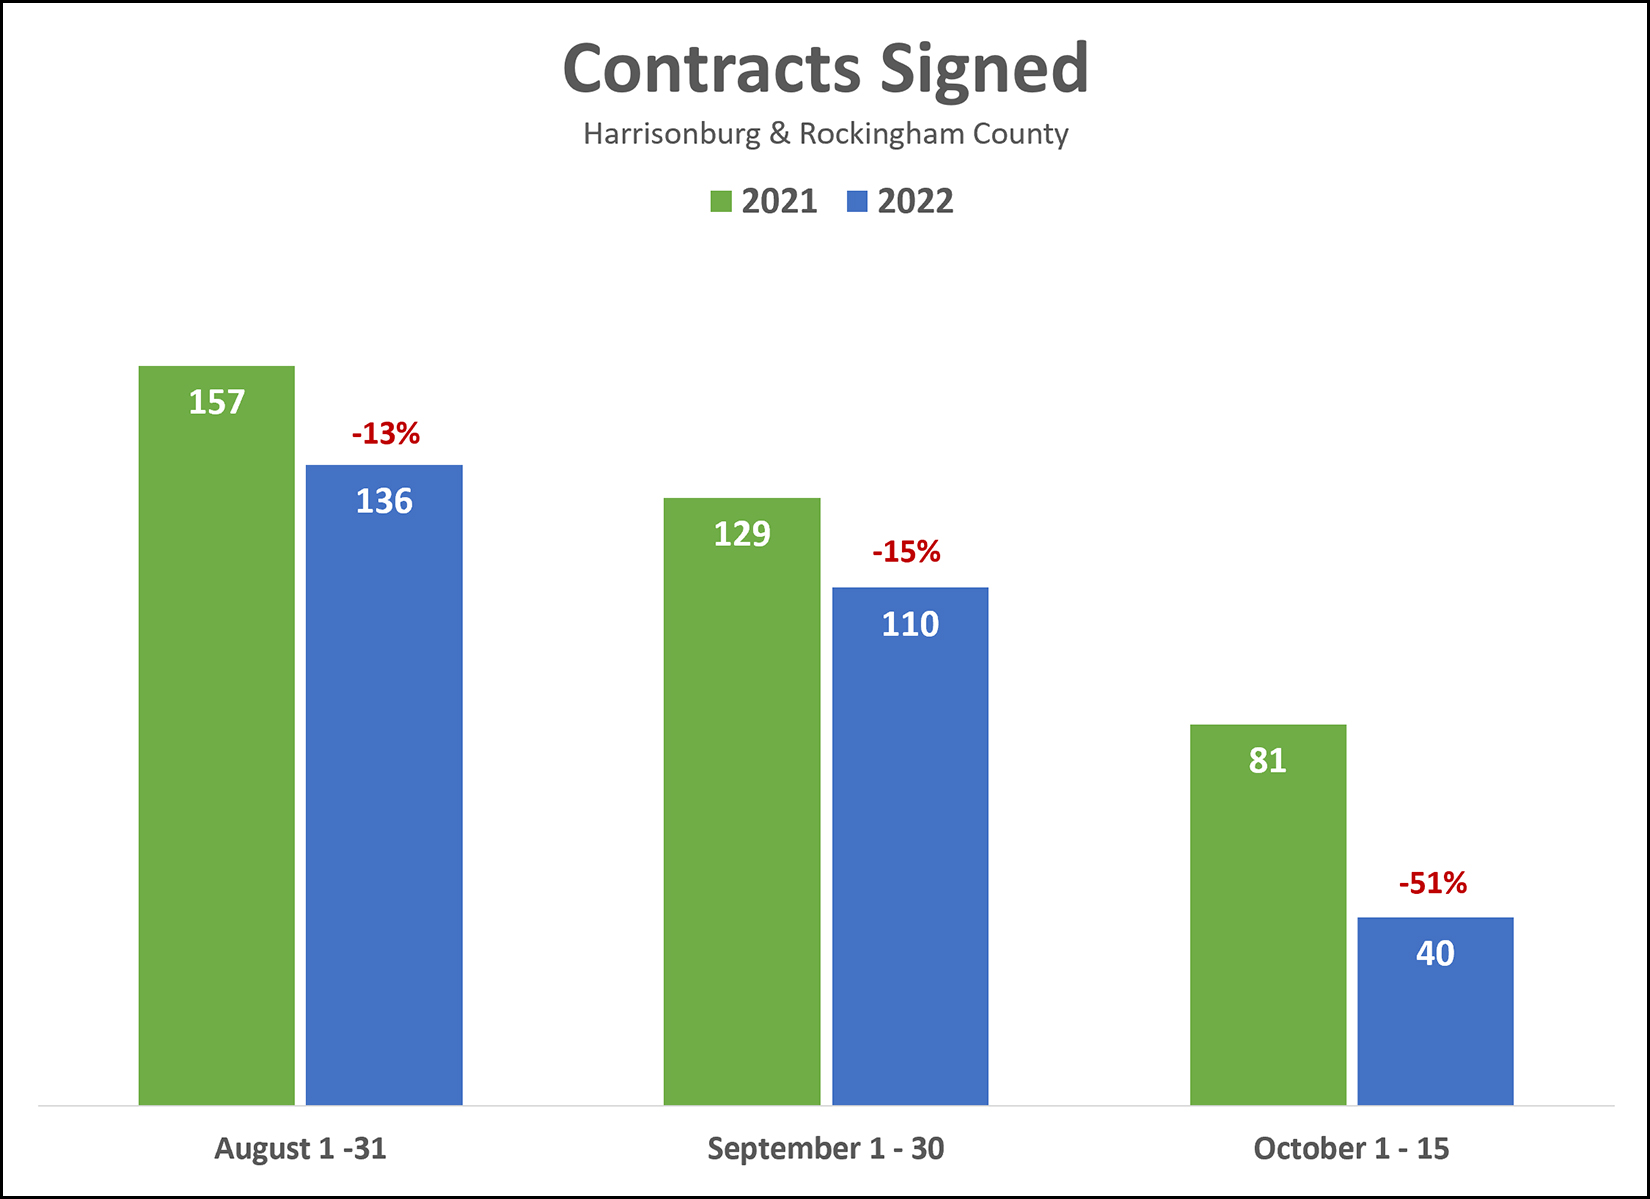 It's best not to get your face too close to the data. The closer we look at the data, at a smaller and smaller data set, the more likely we can find ourselves concluding one thing when another is actually true. So, as you ponder the meaning of the graph above, keep in mind that the last set of data (October 1 - 15) is a rather small set of data... from just two weeks in our local market... so it may or may not be indicative of an overall trend. But... with that length disclaimer having been thrown out there... After seeing modest declines in contract activity in August (-13%) and September (-15%) it seems that contract activity might be REALLY slowing down (-51%) in October. Last October, in the first half of the month, a total of 81 contracts were signed for buyers to buy and sellers to sell houses in Harrisonburg and Rockingham County. This year in those same 15 days, only 40 contracts have been signed. It's hard to say if this significant decline in contract activity will continue as we move through October and into November, but if things were slowing down slightly in August and September, they seem to be slowing down more quickly in October. | |
Harrisonburg Area Home Sales Slowing Slightly But Prices Keep Rising |
|
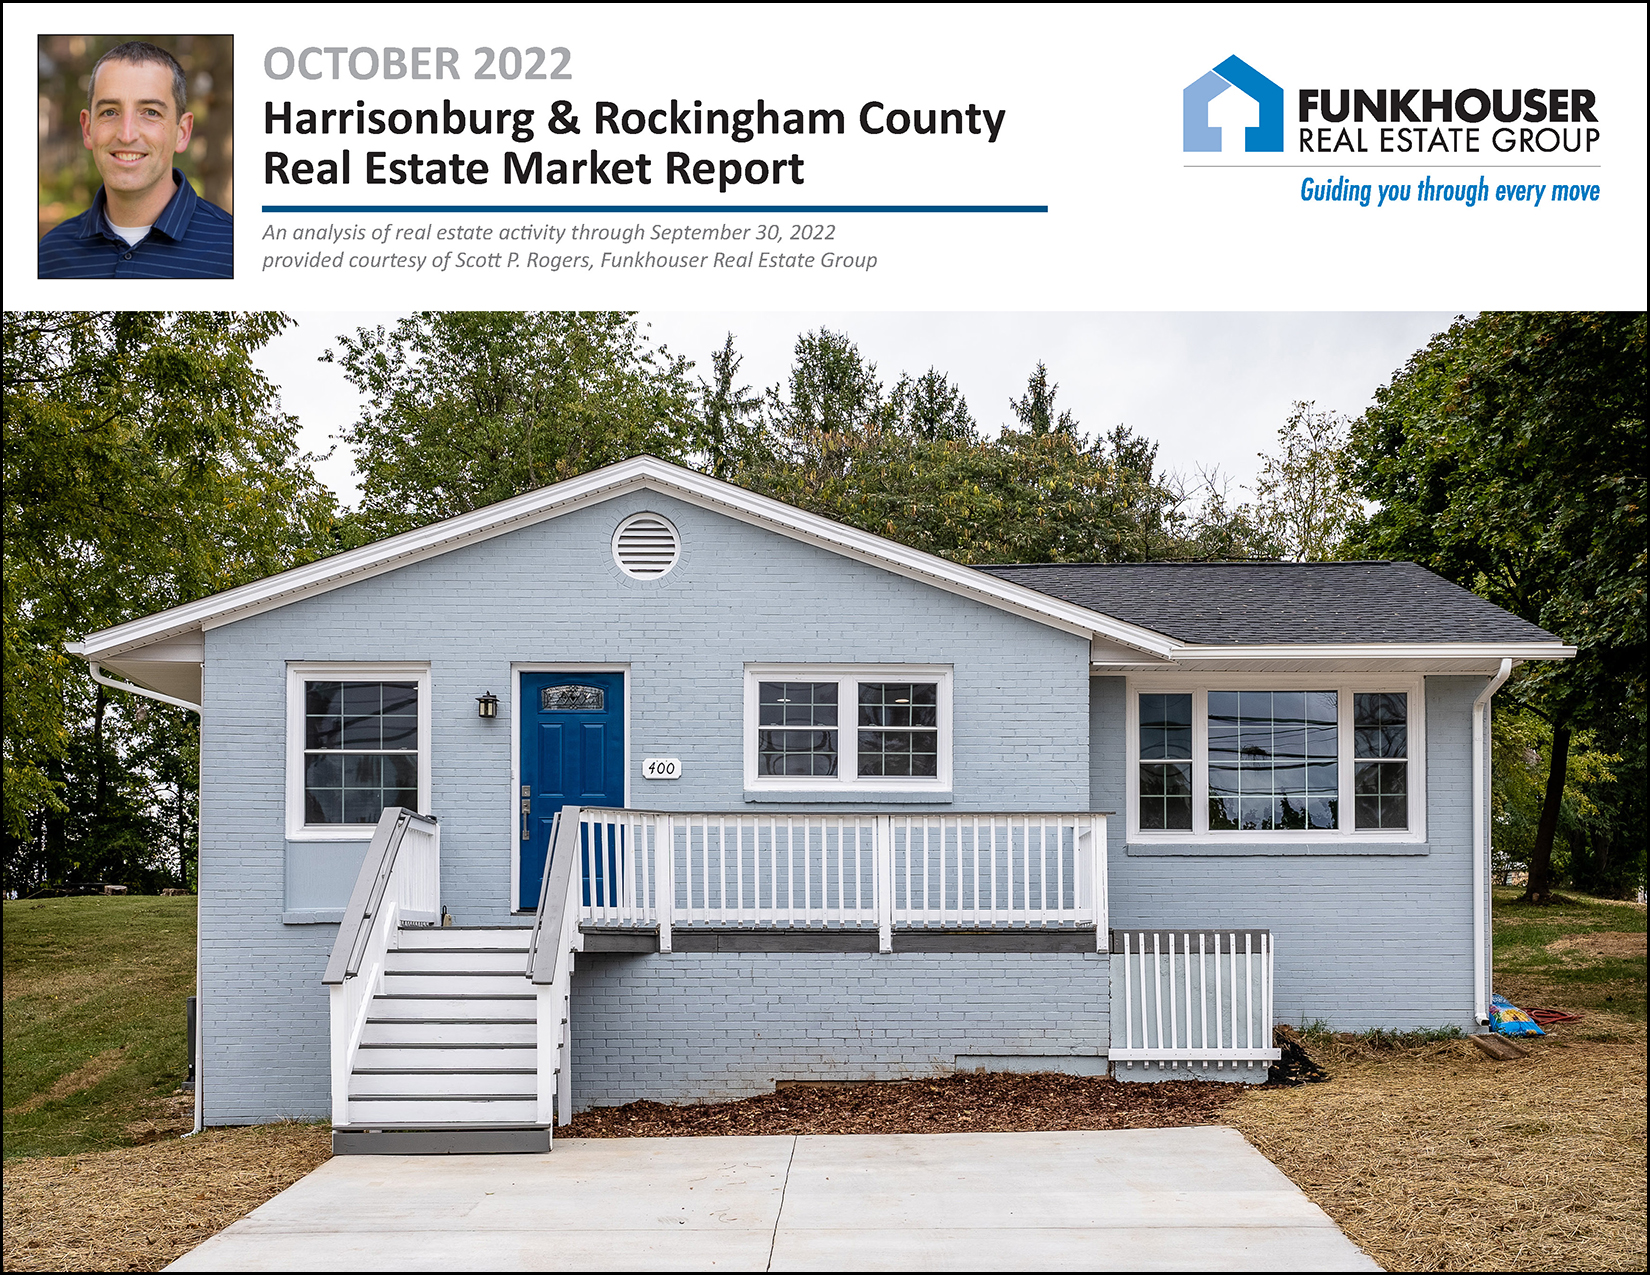 Happy Thursday afternoon, friends! Fall is upon us... with cool mornings and evenings, but often still reaching pleasant afternoon temperatures... and beautiful colors on trees throughout the Valley! Fall is my favorite season for the reasons above, and because it's volleyball season. My daughter plays JV volleyball and I coach middle school volleyball, both of which bring a lot of fun, excitement and joy to my life each fall. I hope that your fall, likewise, is full of fun, excitement and joy! Before we get to real estate... Each month I offer a giveaway, of sorts, for readers of this market report, highlighting some of my favorite places (or things) in Harrisonburg. Recent highlights have included Black Sheep Coffee and the Harrisonburg Half Marathon and the JMU Forbes Center. I'm bouncing back to another of my favorite spots to grab a cup of coffee... Bella Gelato, located on West Water Street in downtown Harrisonburg where you can enjoy delicious gelato that is made by hand on site, plus a pastry case of baked goods, and an espresso and coffee bar where you'll often find me ordering a caramel latte. Interested in checking out Bella Gelato? Click here to enter to win a $50 gift card to Bella Gelato! ...and this month's featured home is... The beautifully renovated home on the cover of this month's market report is located on the corner of Franklin Street and Myers Avenue, just a short walk from the many restaurants and shopping destinations in downtown Harrisonburg... such as Bella Gelato. ;-) Check out 400 Franklin Street here. ...and now, the real estate market update... First, before we get to the numbers, let's start with the big picture...it feels like the local housing market is changing or transitioning in some ways. Mortgage interest rates have increased drastically over the past six months and that seems to be impacting the amount of buyer activity and enthusiasm in our local market. Most sellers are experiencing fewer showings and fewer offers in the first week or two of their homes being on the market. But yet, we are still seeing relative stability in the number of homes selling in this area, combined with continued increases in the prices for which homes are selling. 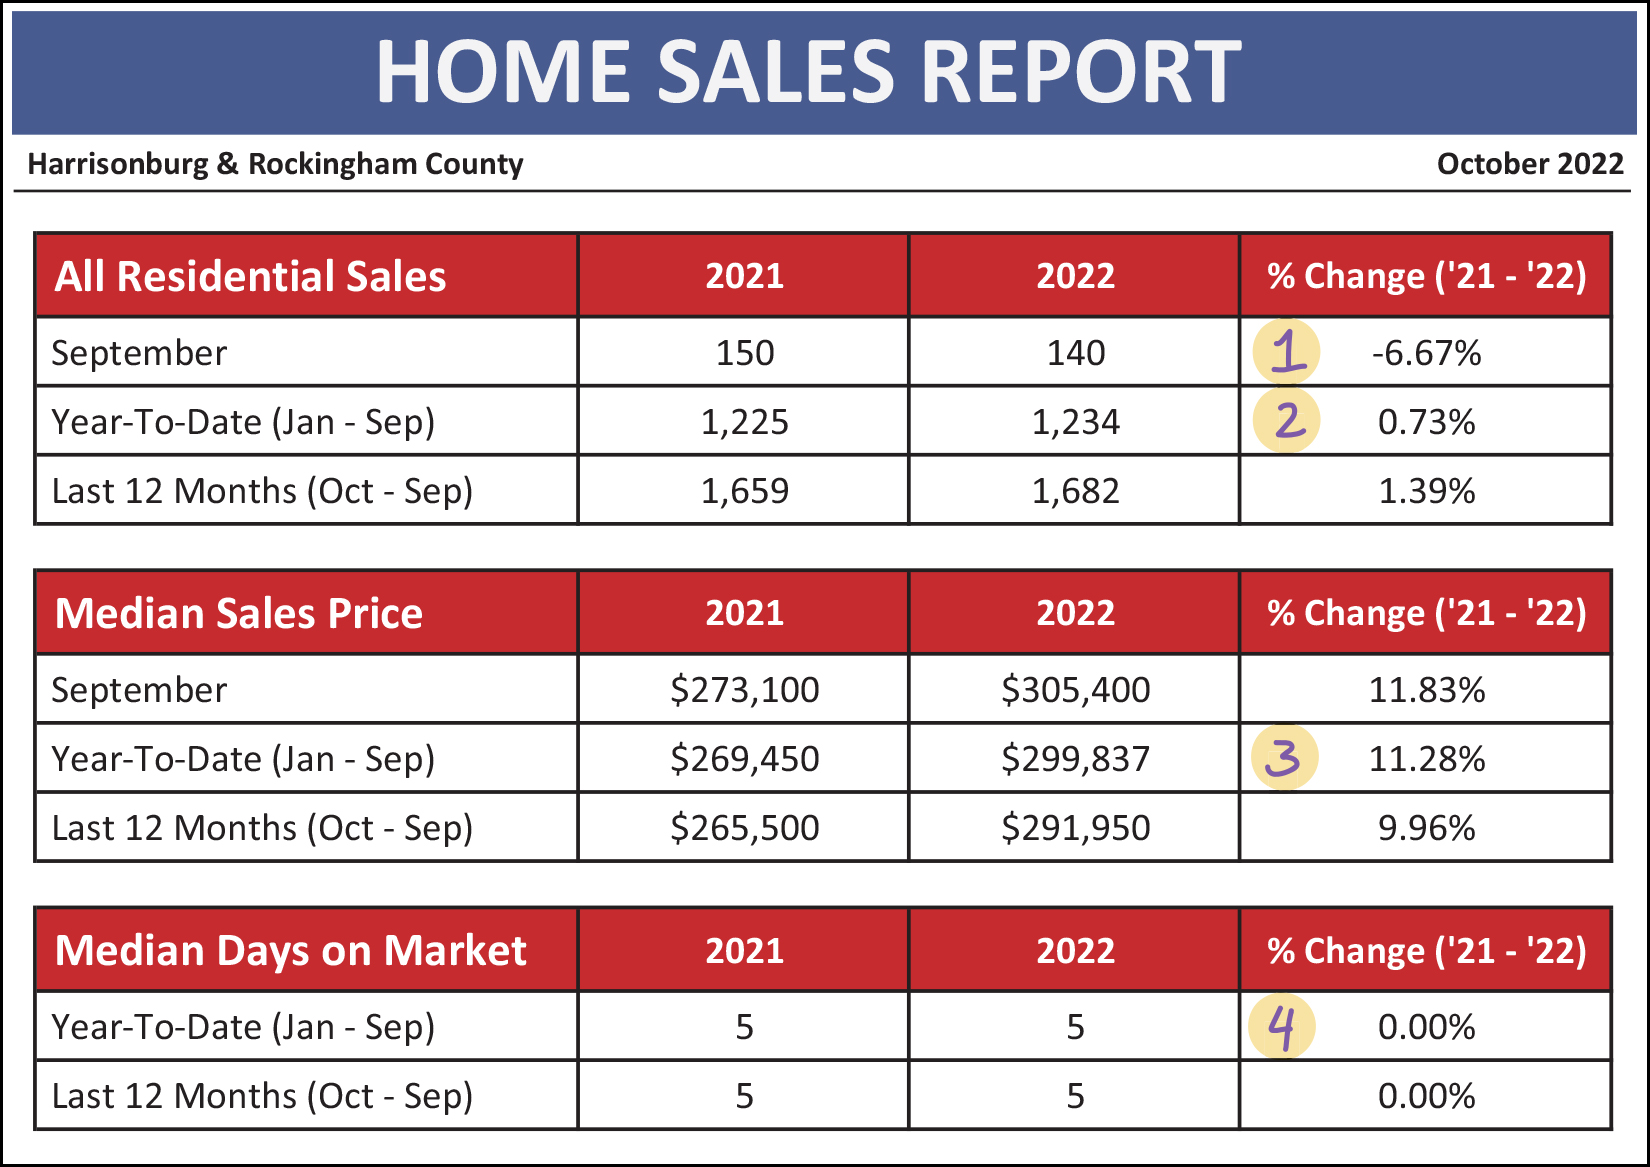 As shown above... [1] Home sales were 7% slower this September than last, with 140 home sales this year compared to 150 home sales last year. [2] Thus far this year we have seen 1,234 home sales in Harrisonburg and Rockingham County, which is 1% more than we saw in the first nine months of last year. [3] The median sales price has increased 11% over the past year in Harrisonburg and Rockingham County, from $269K to $300K. [4] Homes are still selling very quickly, with a median days on market of only five days. More on this later. So if things feel slow lately, how are things still stable? Good question... see below for a month by month breakdown... 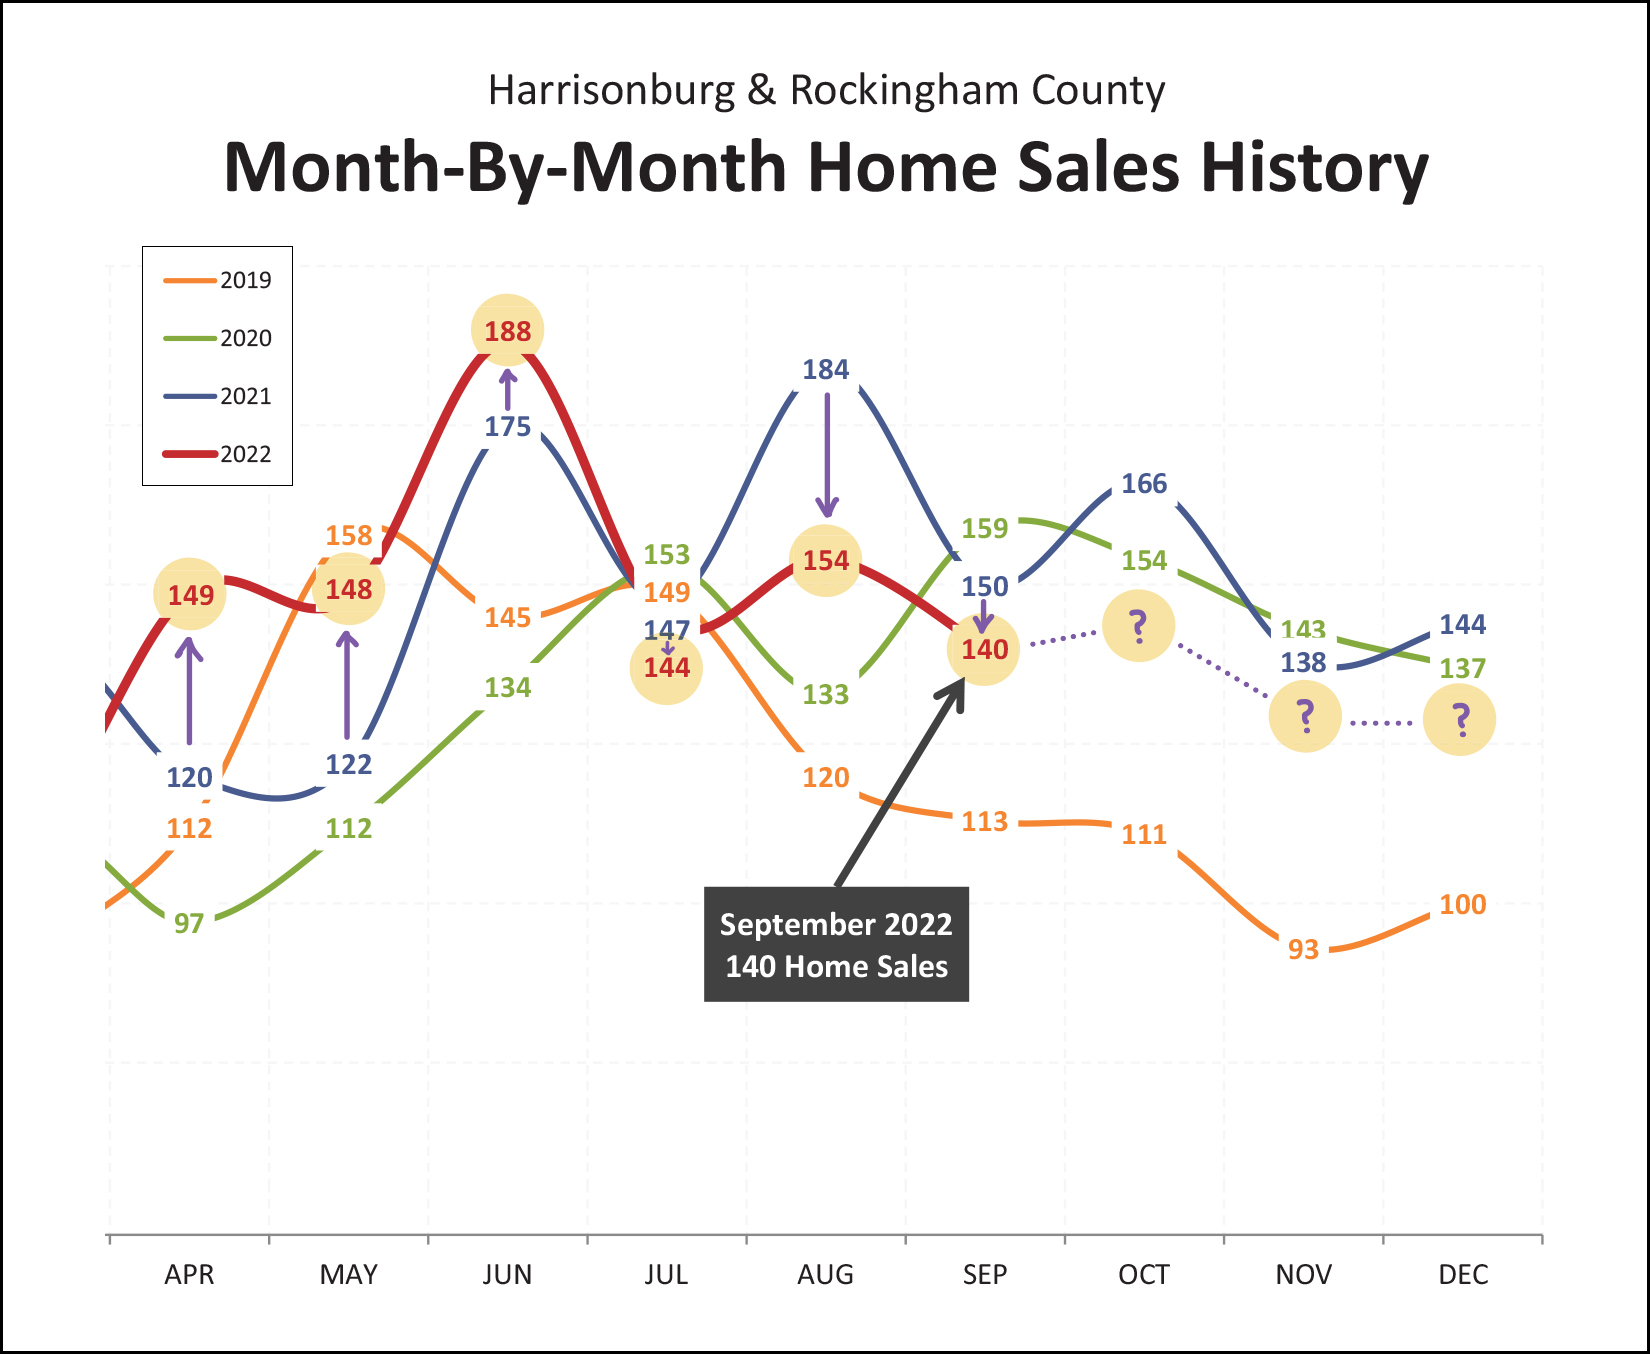 As shown above, we saw much higher numbers of home sales this year during April, May and June, followed by lower numbers of home sales this year during July, August and September. So, we had a very strong second quarter of the year, followed by somewhat weaker third quarter. What, then, will the fourth quarter of the year show? Given that mortgage interest rates keep creeping up higher and higher, I am anticipating that the fourth quarter of this year will show fewer home sales than the fourth quarter of 2021... which would then lead to an overall decline in the number of home sales between 2021 and 2022... if my guess is correct... and I make plenty of guesses that are not correct. ;-) The following graph helps put this year in an even more helpful context... 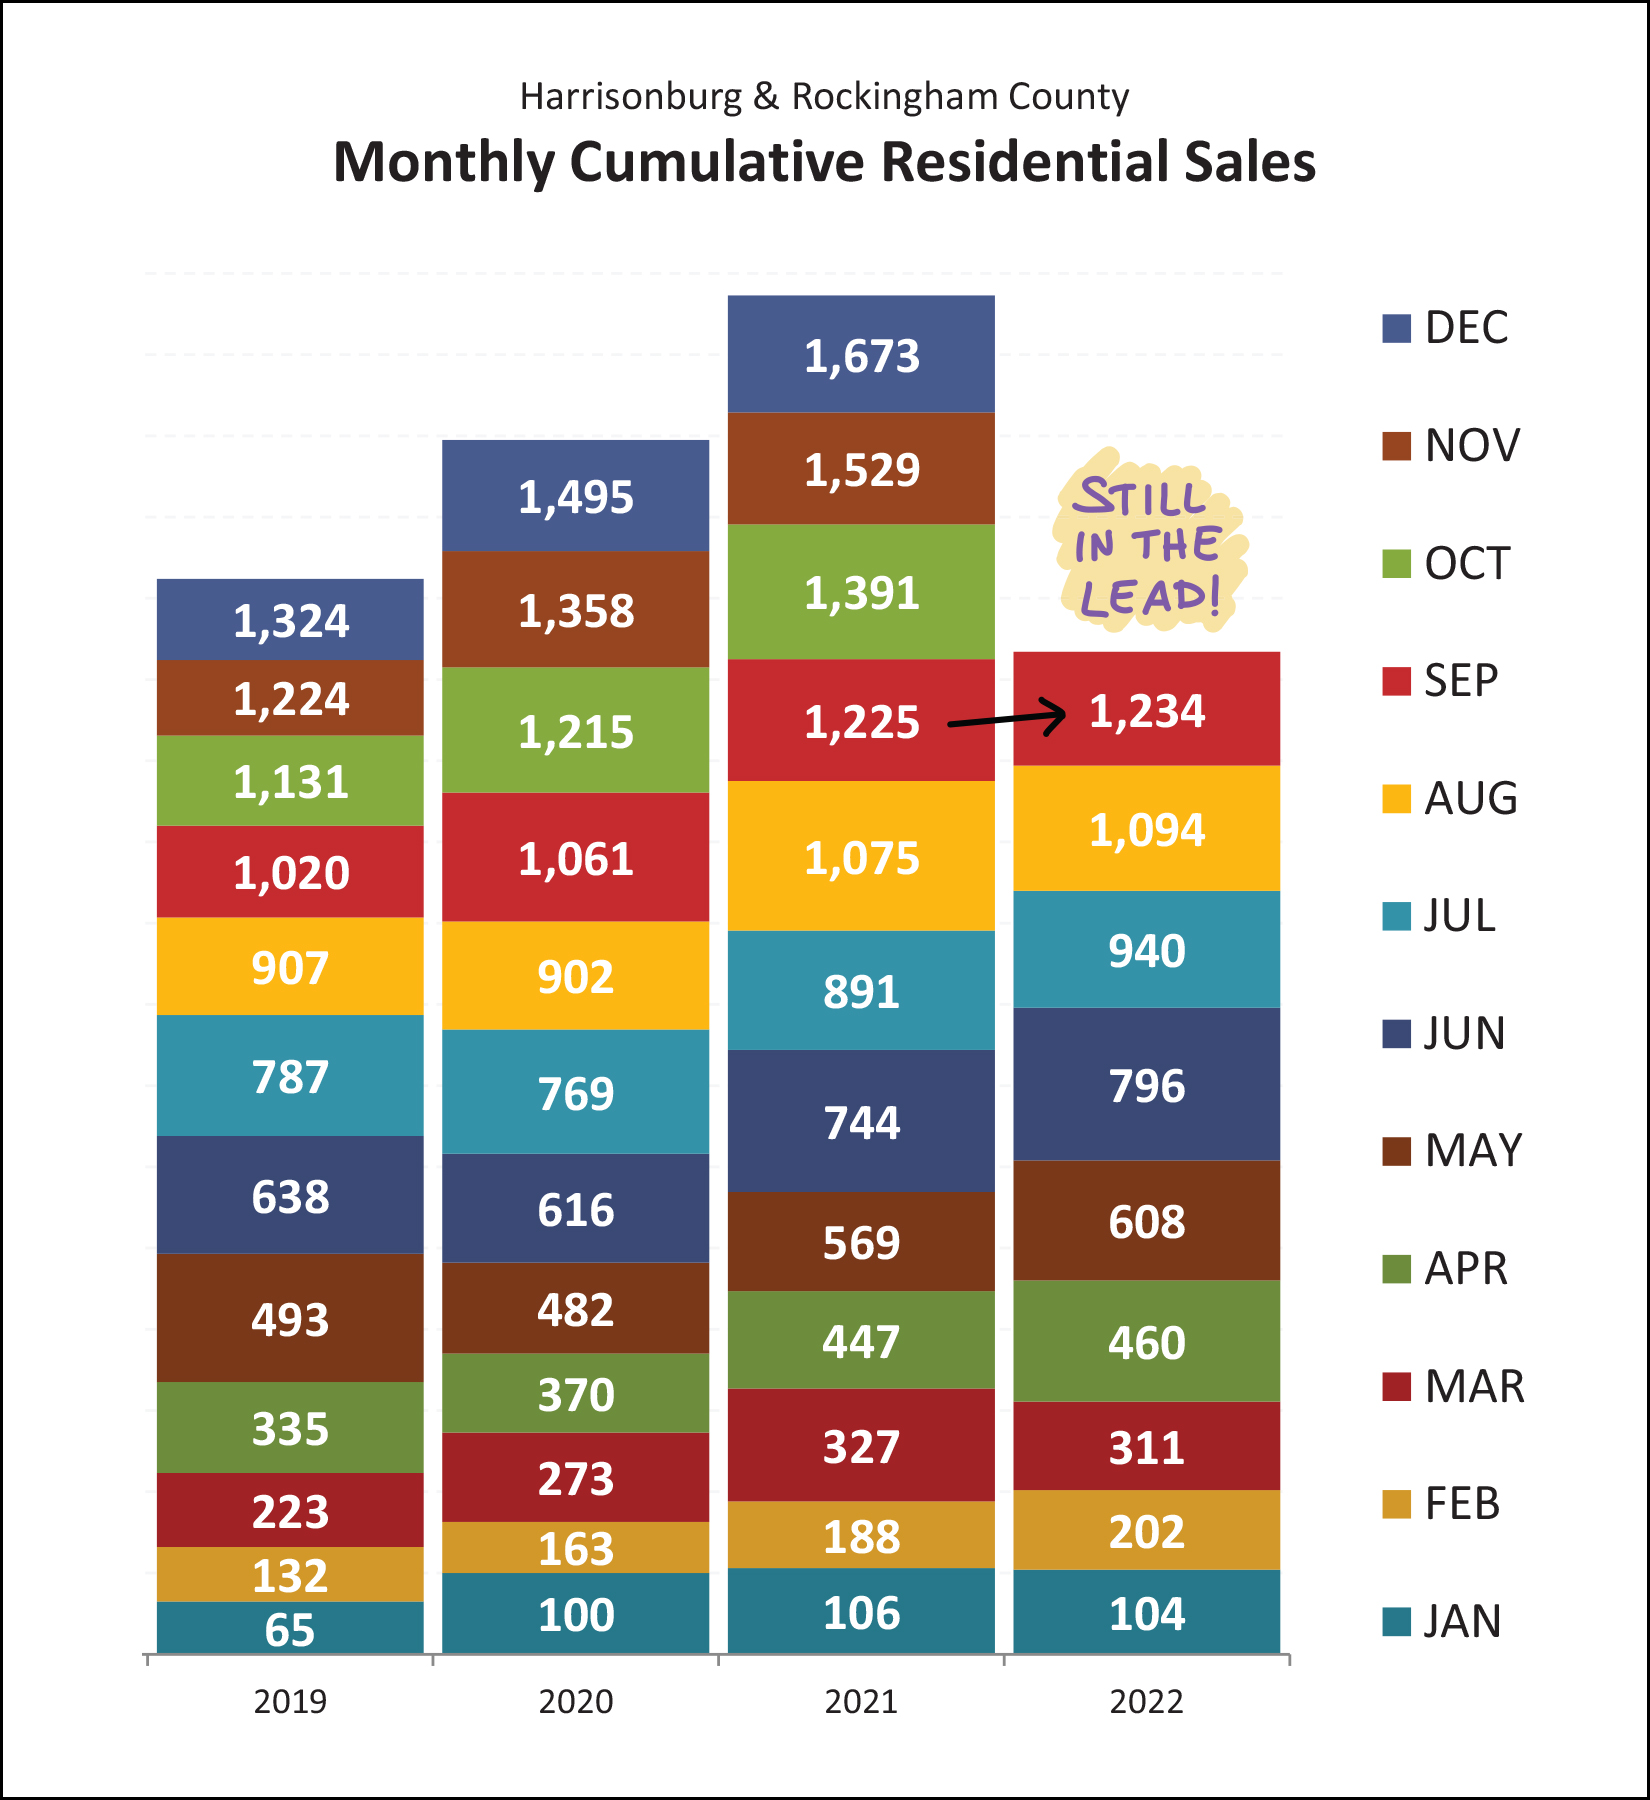 Two few observations about this "stacked up" graph above... [1] Yes, 2022 is still slightly ahead of 2021 through September... but we the gap is much narrower than it was a few months ago. [2] Even if we don't see 1,673 home sales in 2022 to match last year's total count, it seems very likely that we will still eclipse both 2019 and 2022. The following two trends seem to be running counter to each other, at least thus far... 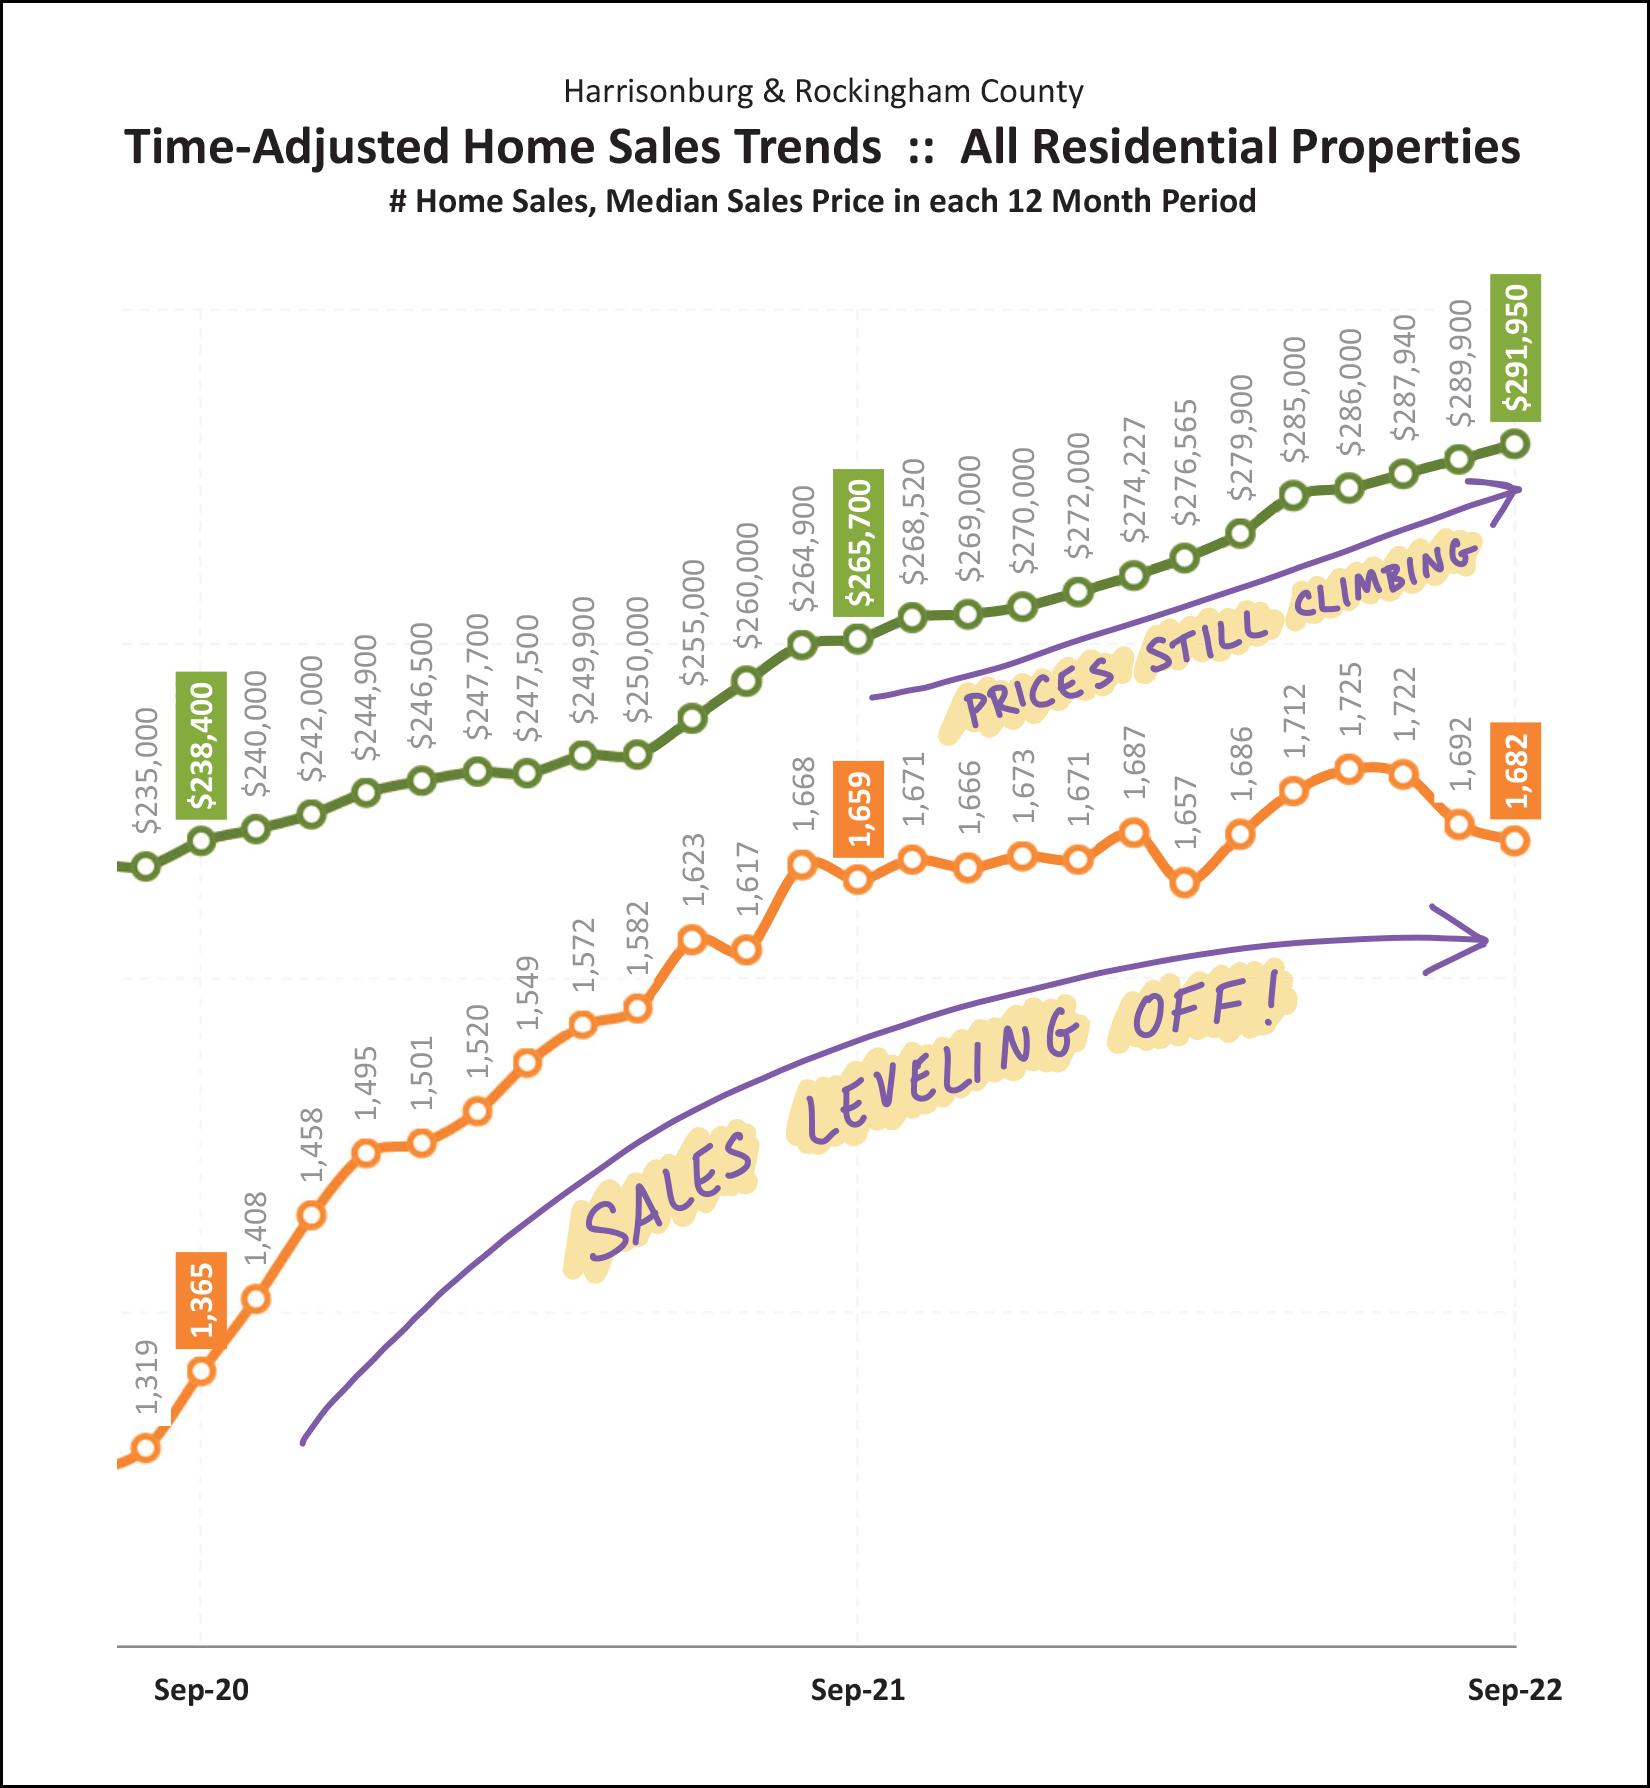 The orange line above shows the number of homes selling on an annual basis in Harrisonburg and Rockingham County. The number of annual sales was climbing quickly through the end of 2021 but has mostly leveled off since the start of 2022. It seems unlikely that the annual pace of home sales will start increasing again anytime soon. The green line above shows the median sales price of homes selling in a 12-month period. As you can see, sales prices keep on rising. The median sales price over the past 12 months has been $292K... which is about $26K higher than the median sales price of $266K just a year ago. Moving forward, I expect we'll see home sales (green line) stay level or decline somewhat... while sales prices (orange line) will likely keep rising or possibly level out a bit. Changes in home prices over time are pretty wild if we scoot back a bit and look at a multi-year picture... 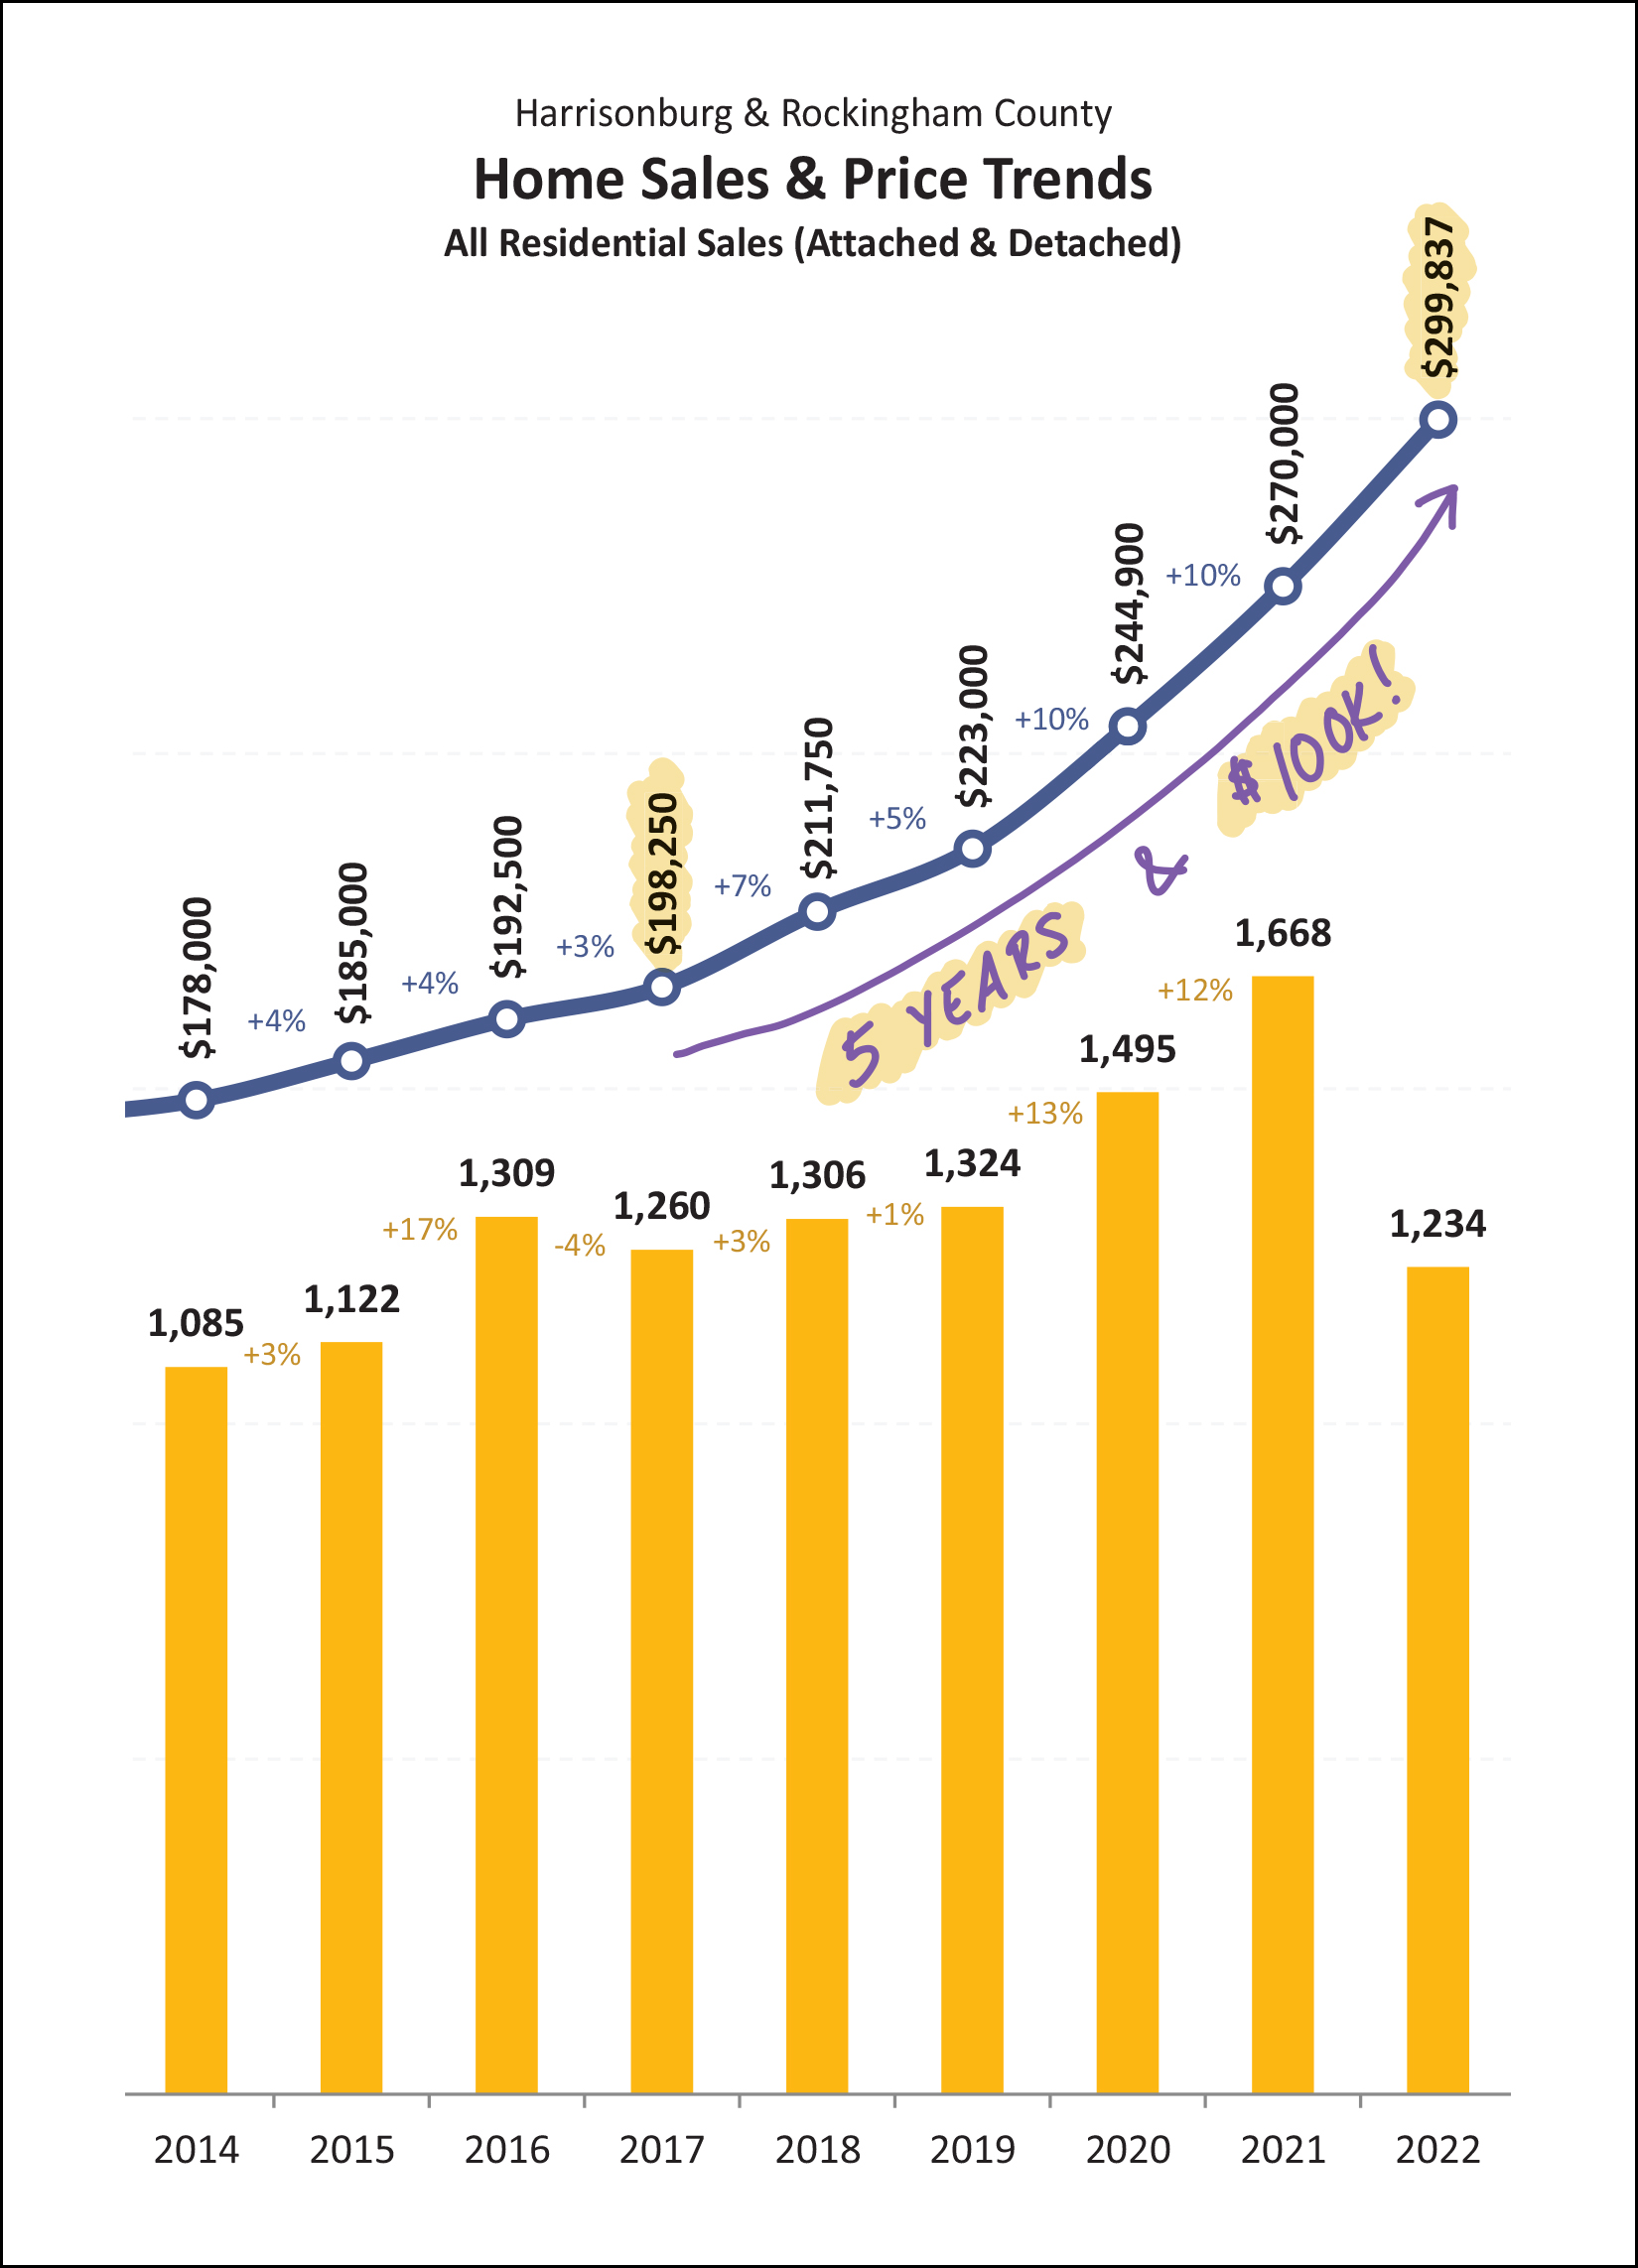 If only everyone had bought a median priced home ($198K) five years ago... then everyone would own a home that is now potentially worth $100,000 more, given the current median sales price of $299,837 in Harrisonburg and Rockingham County. This is a drastic shift in sales prices over a relatively short timeframe, meaning that... [1] Housing is more expensive for anyone who does not currently own a home. [2] Anyone who has owned a home during this time likely saw a significant increase in their home value and net worth. I am simultaneously thrilled for all of my past clients who have bought homes and are feeling good about these trends... and depressed for all of my clients who have not been able to purchase a home and are now faced with much higher purchase prices (and interest rates) in today's market. But back to that leveling off thing... 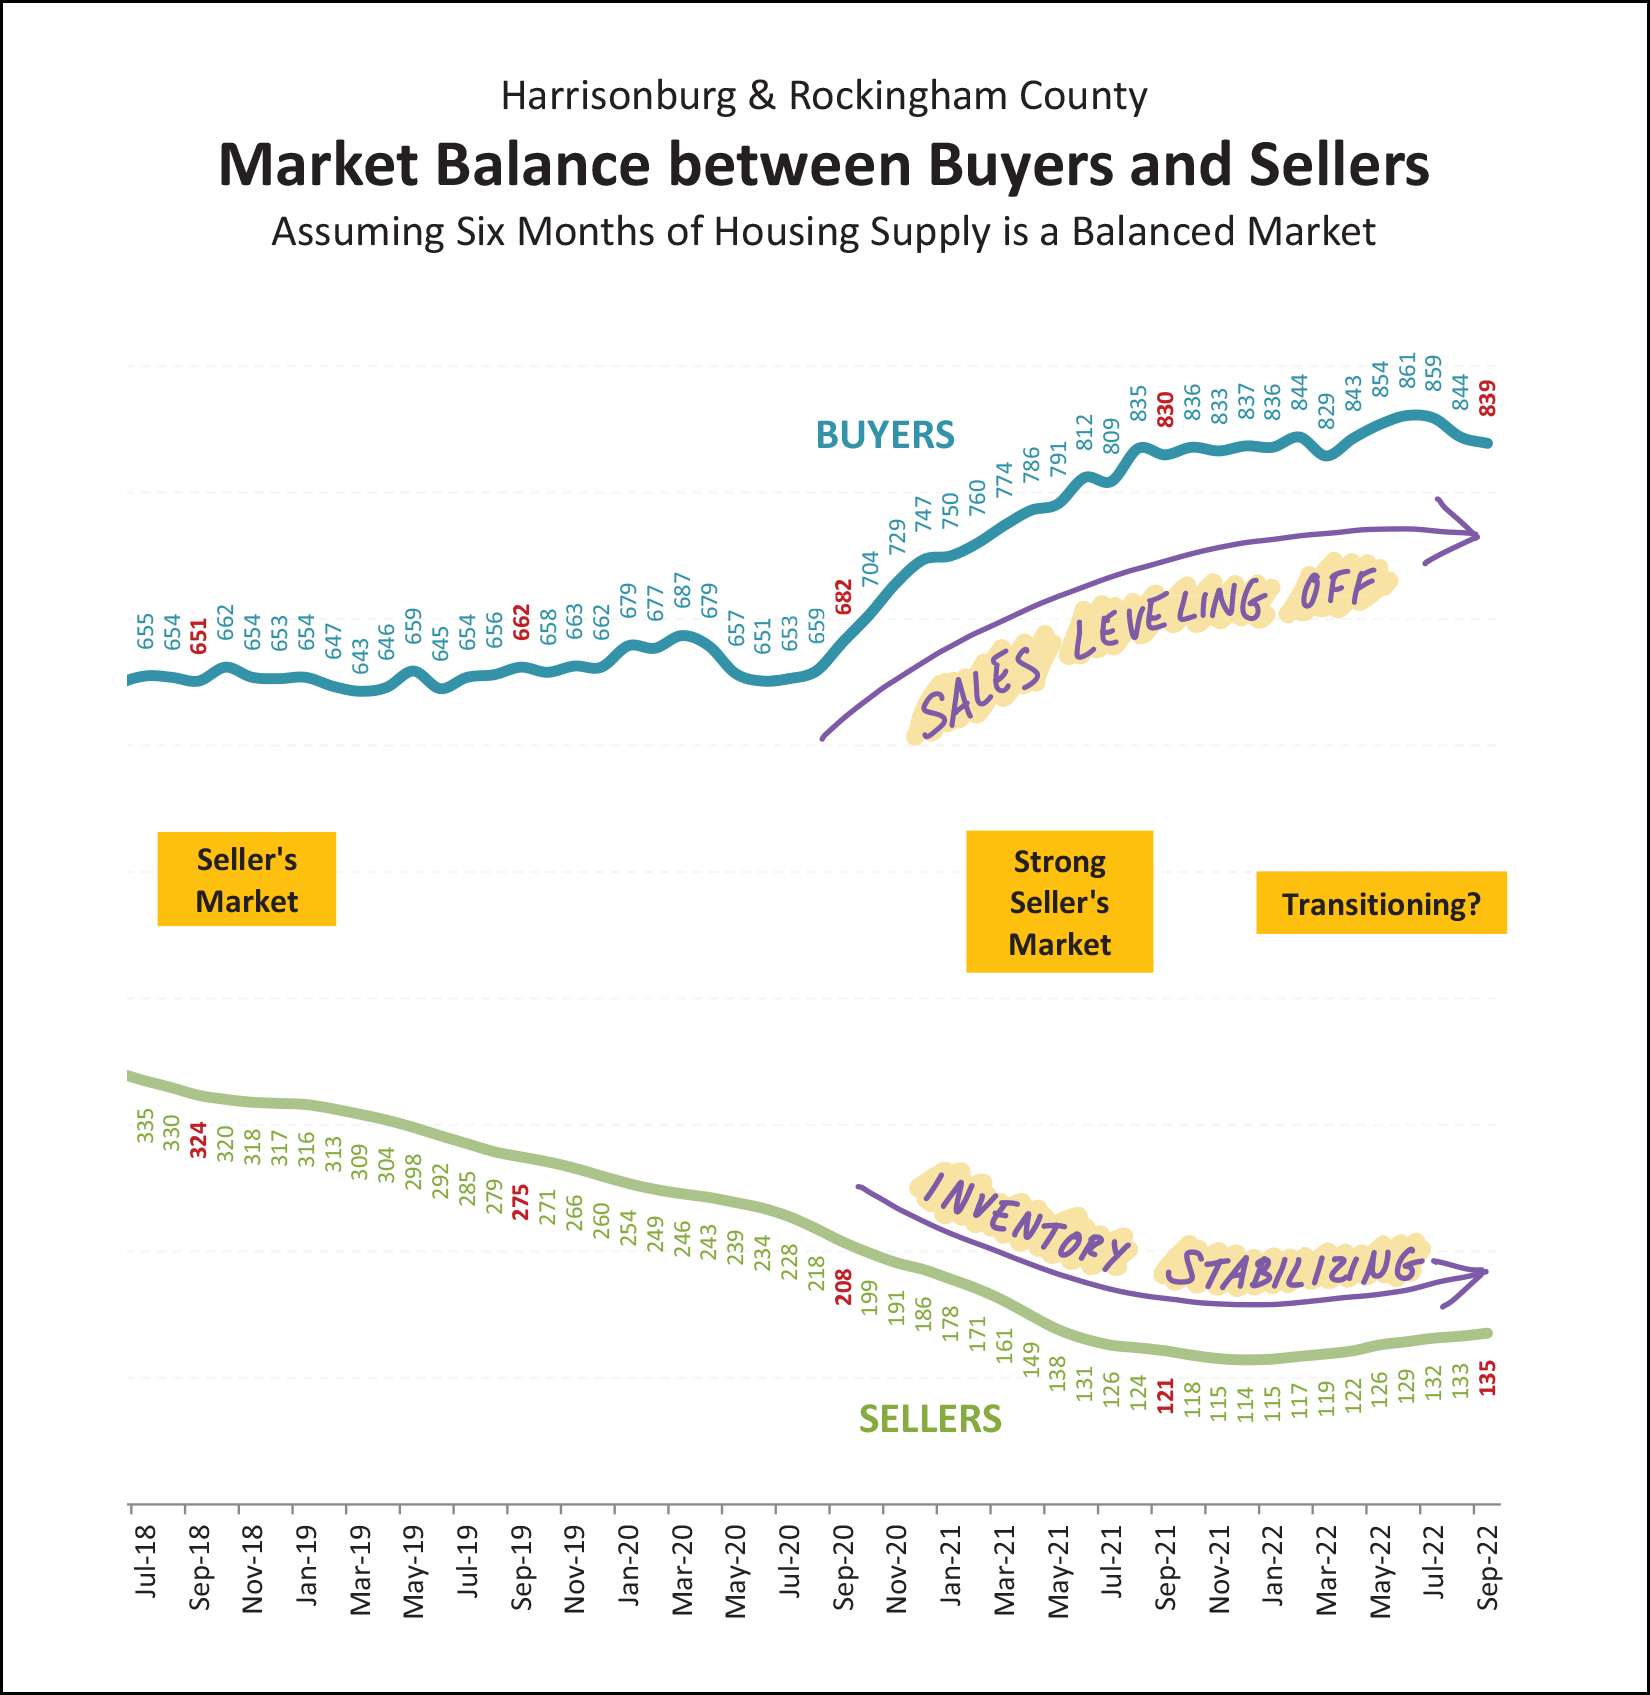 This graph shows that home sales (blue line) are starting to level off and inventory levels (green line) are starting to stabilize and increase a bit. If there continue to be slightly fewer buyers in the market, and slightly more sellers in the market, then... [1] Home buyers might have a slightly easier time securing a contract on a home they hope to purchase. [2] We might see a slightly smaller increase in the price of homes over time. Read that twice, please. I'm not currently anticipating a decline in prices, but rather, a slightly smaller increase in prices. I don't hit on this every month, but it can be helpful to realize that we have seen a pretty good sized increase in the number of new homes being built and sold in this area... 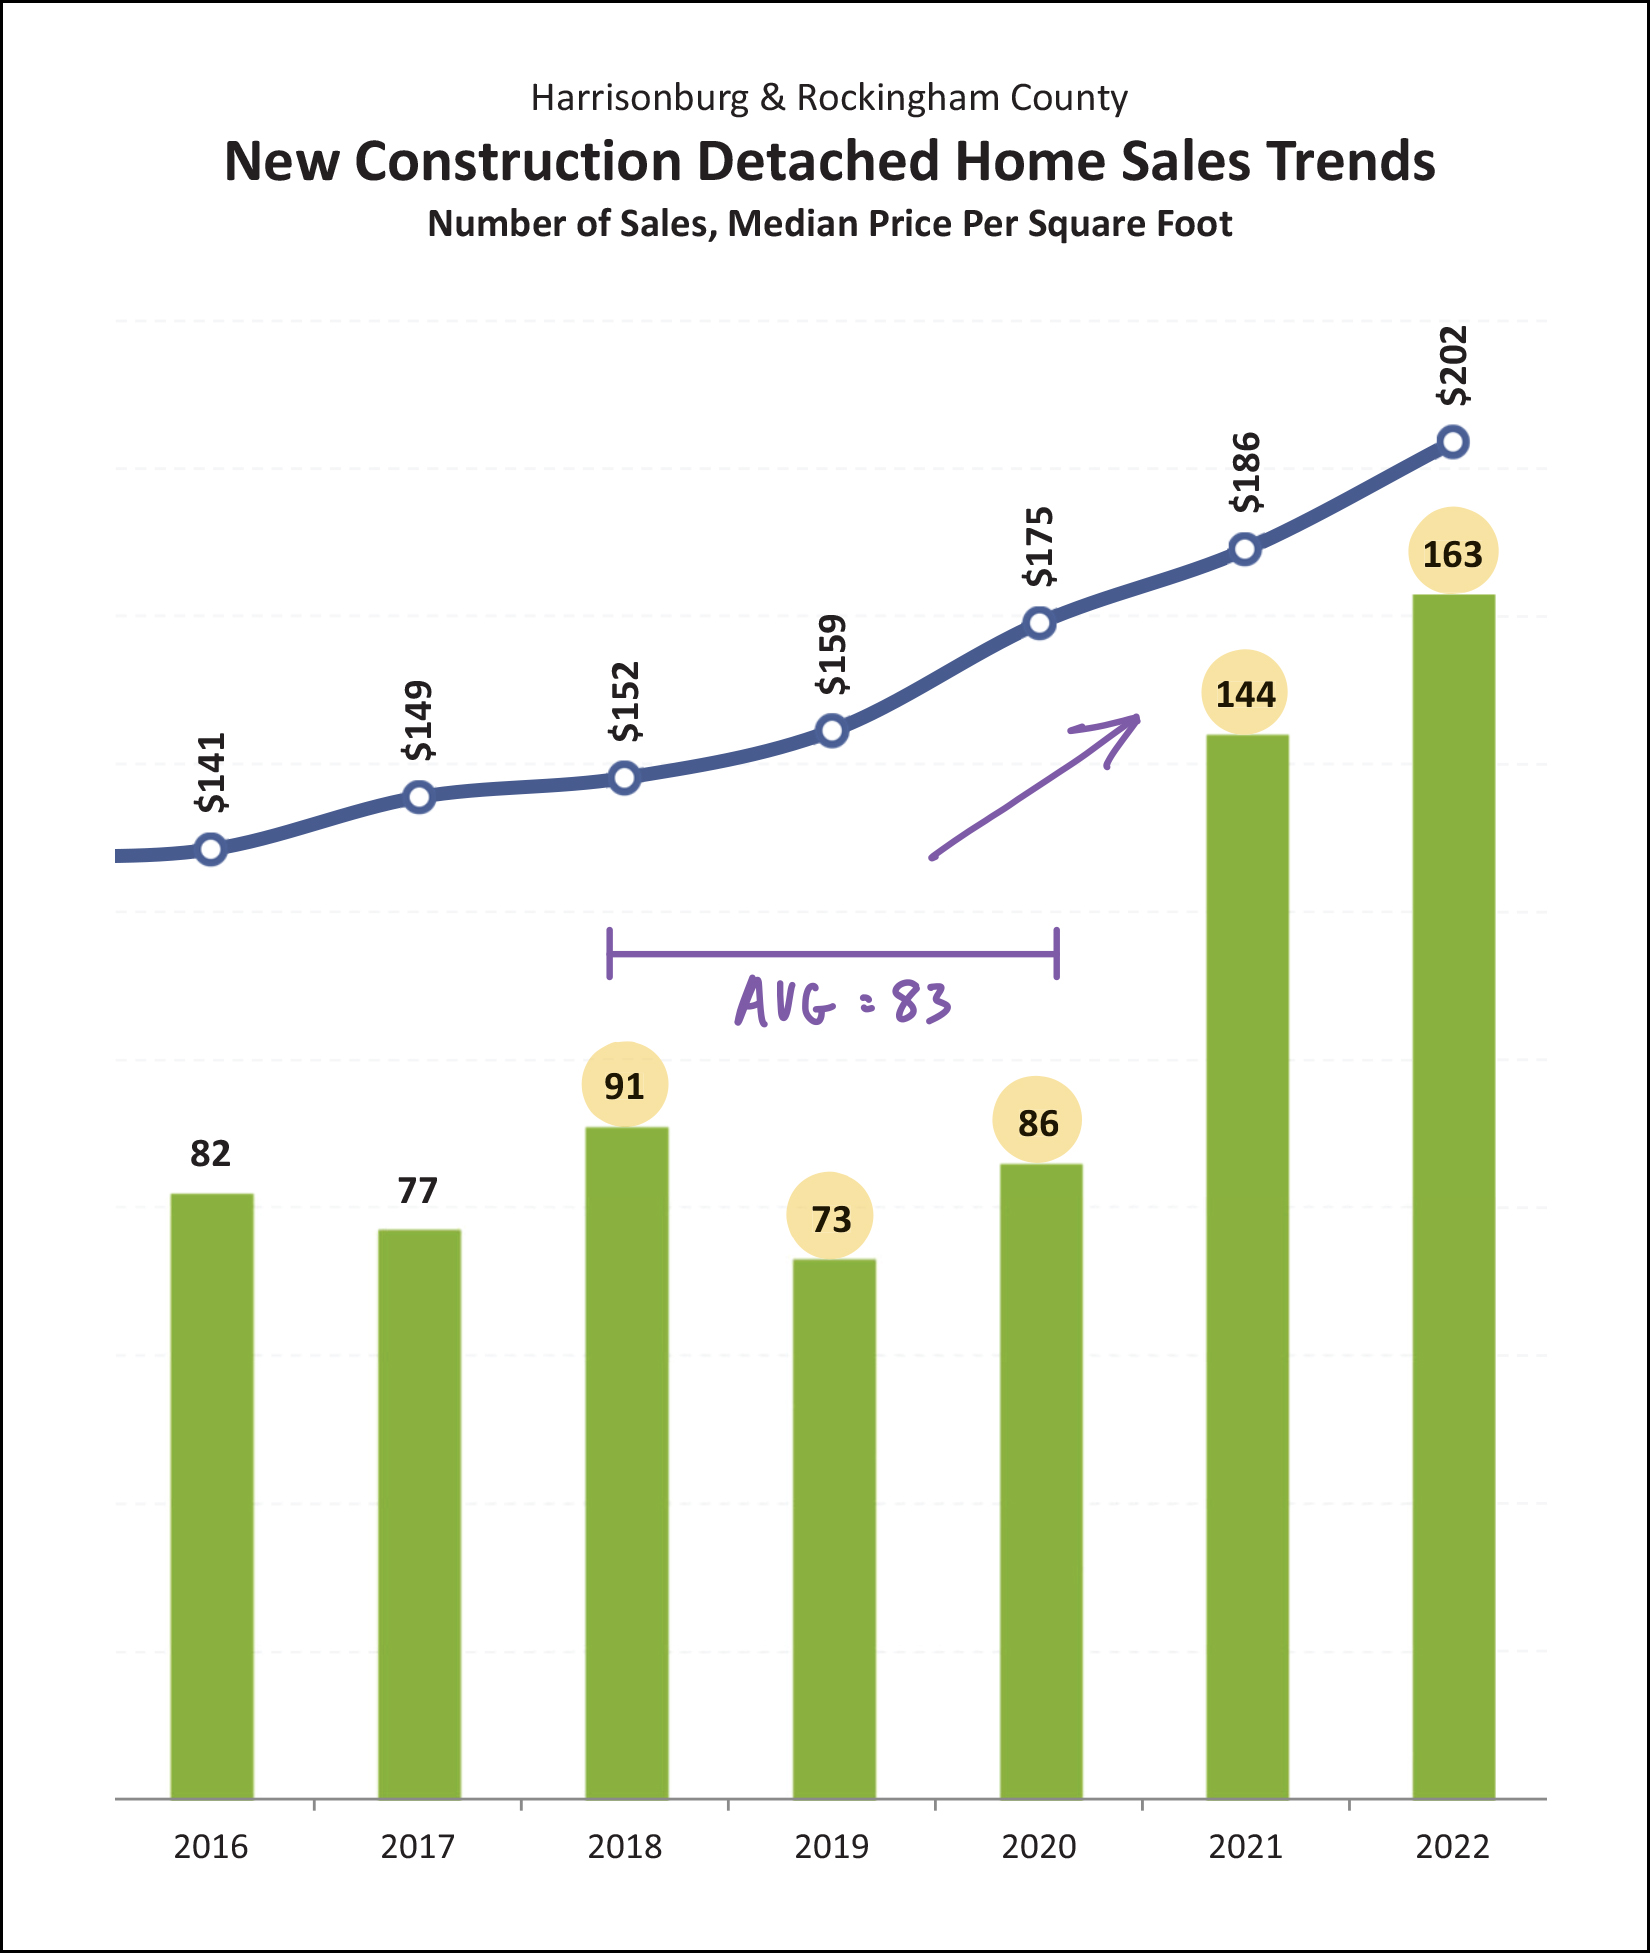 This graph is showing the number of new detached home sales per year in Harrisonburg and Rockingham County. This does not include attached home sales... which would would be duplexes or condos. After averaging 83 new home sales per year between 2018 and 2020, we saw a significant increase in 2021 to 144 new homes... and thus far in 2022, that is a total of 163 new home sales. Many, but not all, of these new detached home sales have been in Ryan Homes communities. It will be interesting to see how new home sales and resale homes track over the next few years especially within the context of higher mortgage interest rates. Now, a peek into the near future... 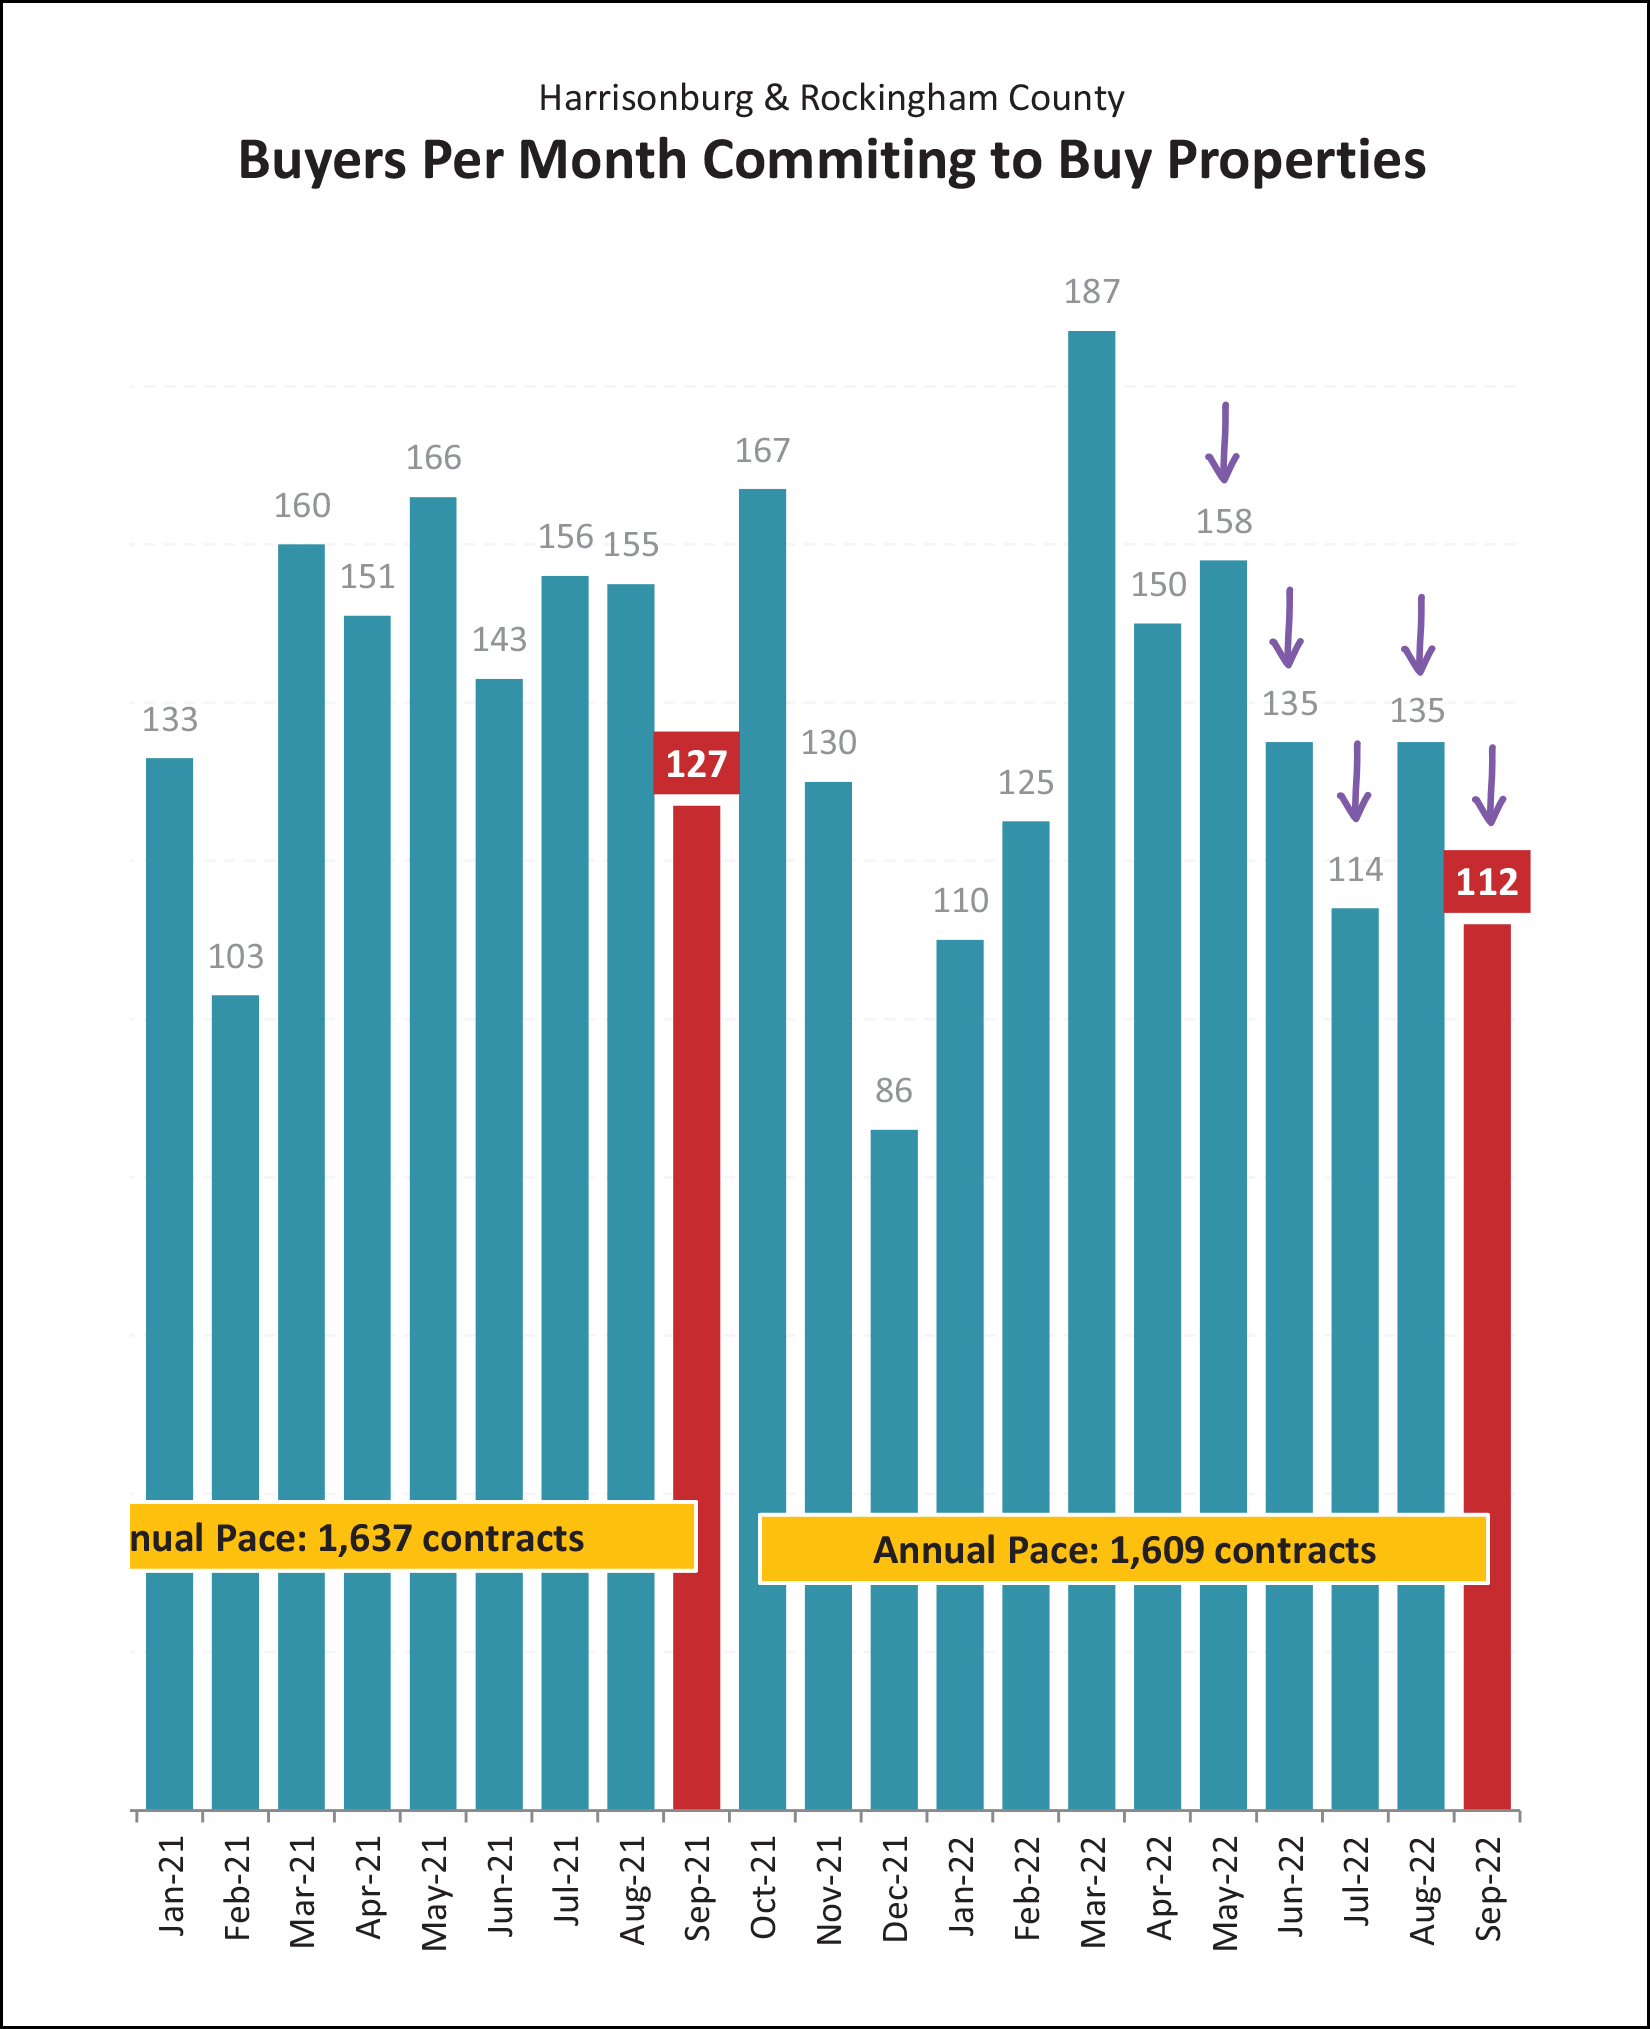 In each of the past five months (purple arrows) we have seen fewer contracts signed than were signed in the same month last year. This probably doesn't surprise anyone who has been paying attention to changes in mortgage interest rates. Ever higher interest rates have changed the potential mortgage payment for buyers, which is definitely impacting how many potential buyers are capable of buying or interested in buying. Multiple (five) months of lower levels of contract activity means that we will continue to see lower levels of closed sales over the next few months... which is why I expect we'll see a slower fourth quarter of home sales this year as compared to last year. And after years of saying inventory levels are down, now we see that... 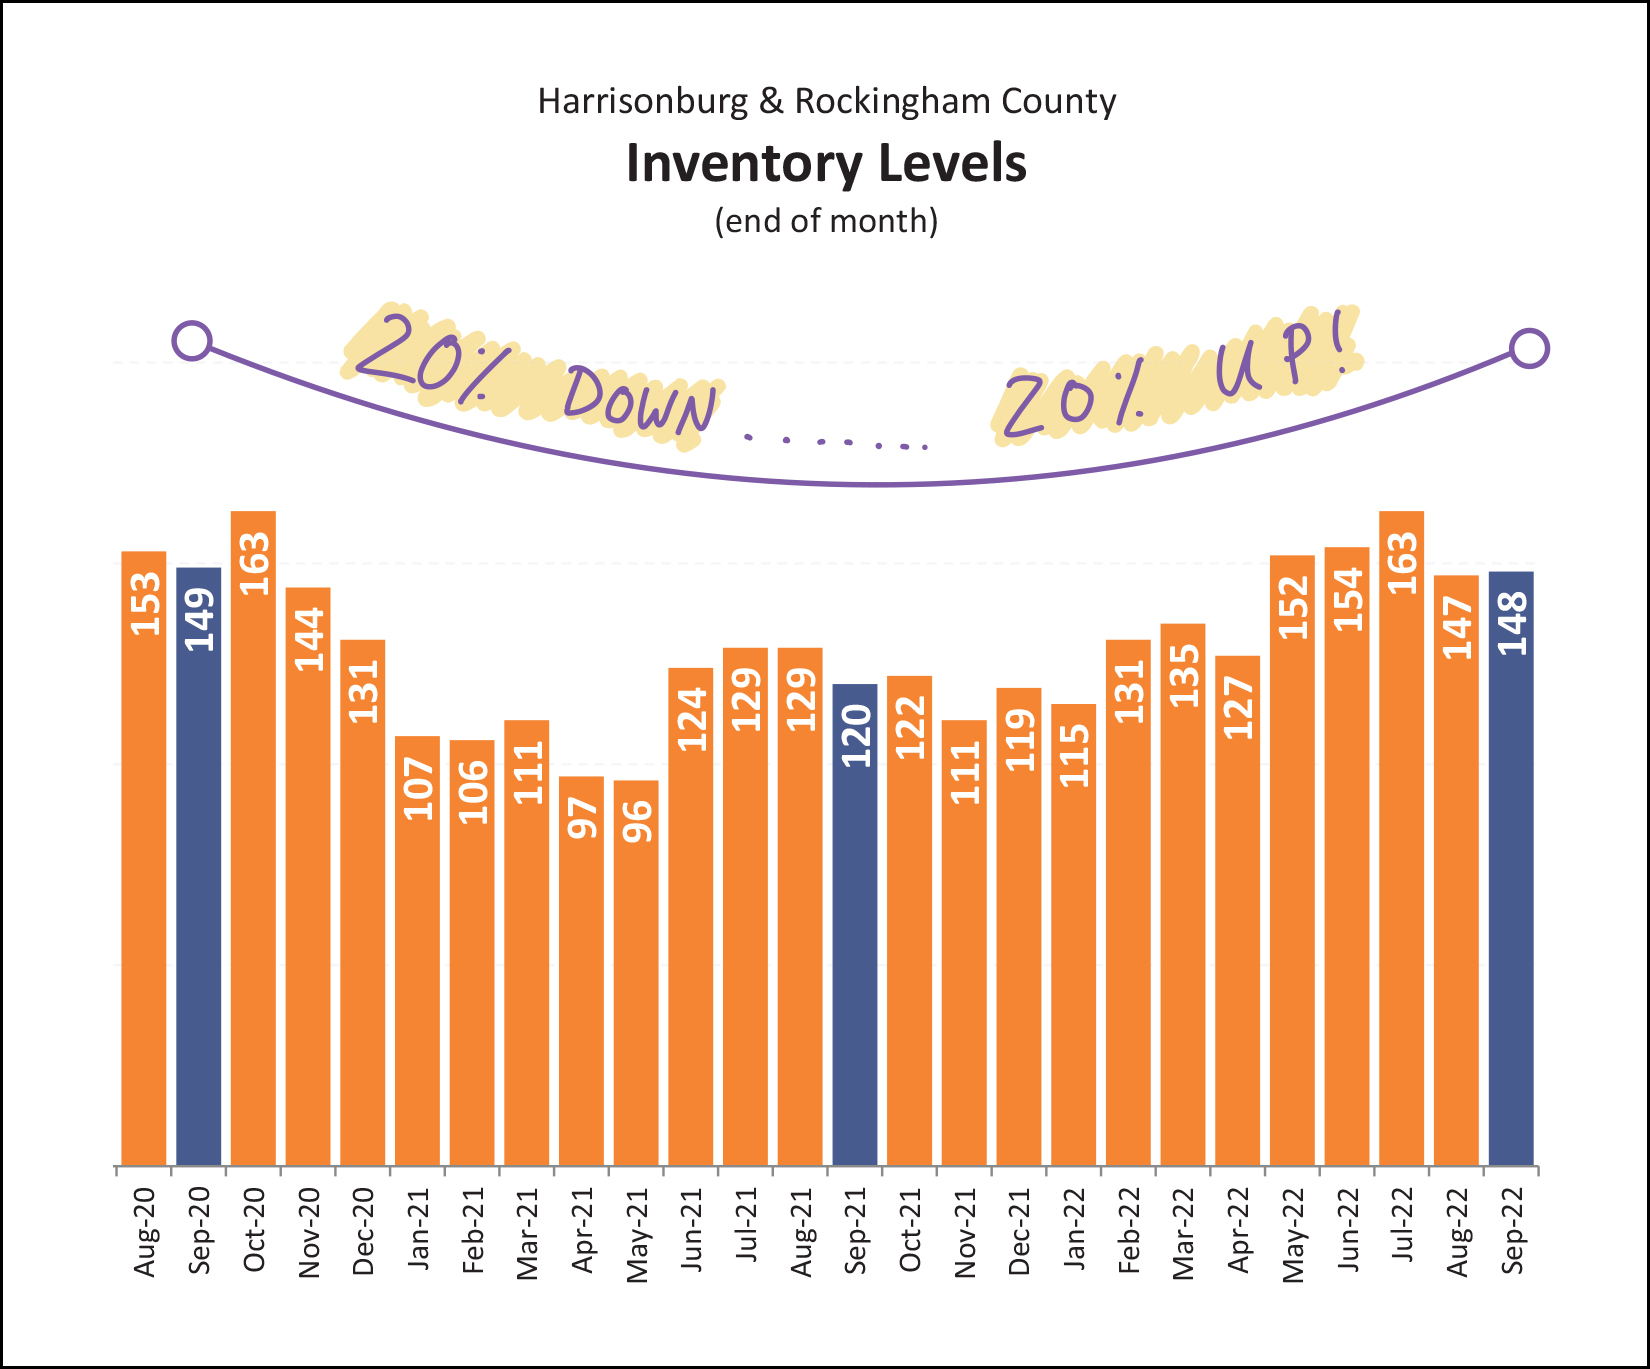 Inventory levels are actually rising a bit. When looking at two years ago compared to one year ago we see about a 20% decline in inventory levels. When looking at one year ago compared to today we see about a 20% increase in inventory levels. Today's inventory levels are still *very* low compared to historical norms, but buyers today seem happy to have slightly more choices of homes for sale, or to see homes sticking around on the market for slightly longer before going under contract. Though... about that time on market trend... 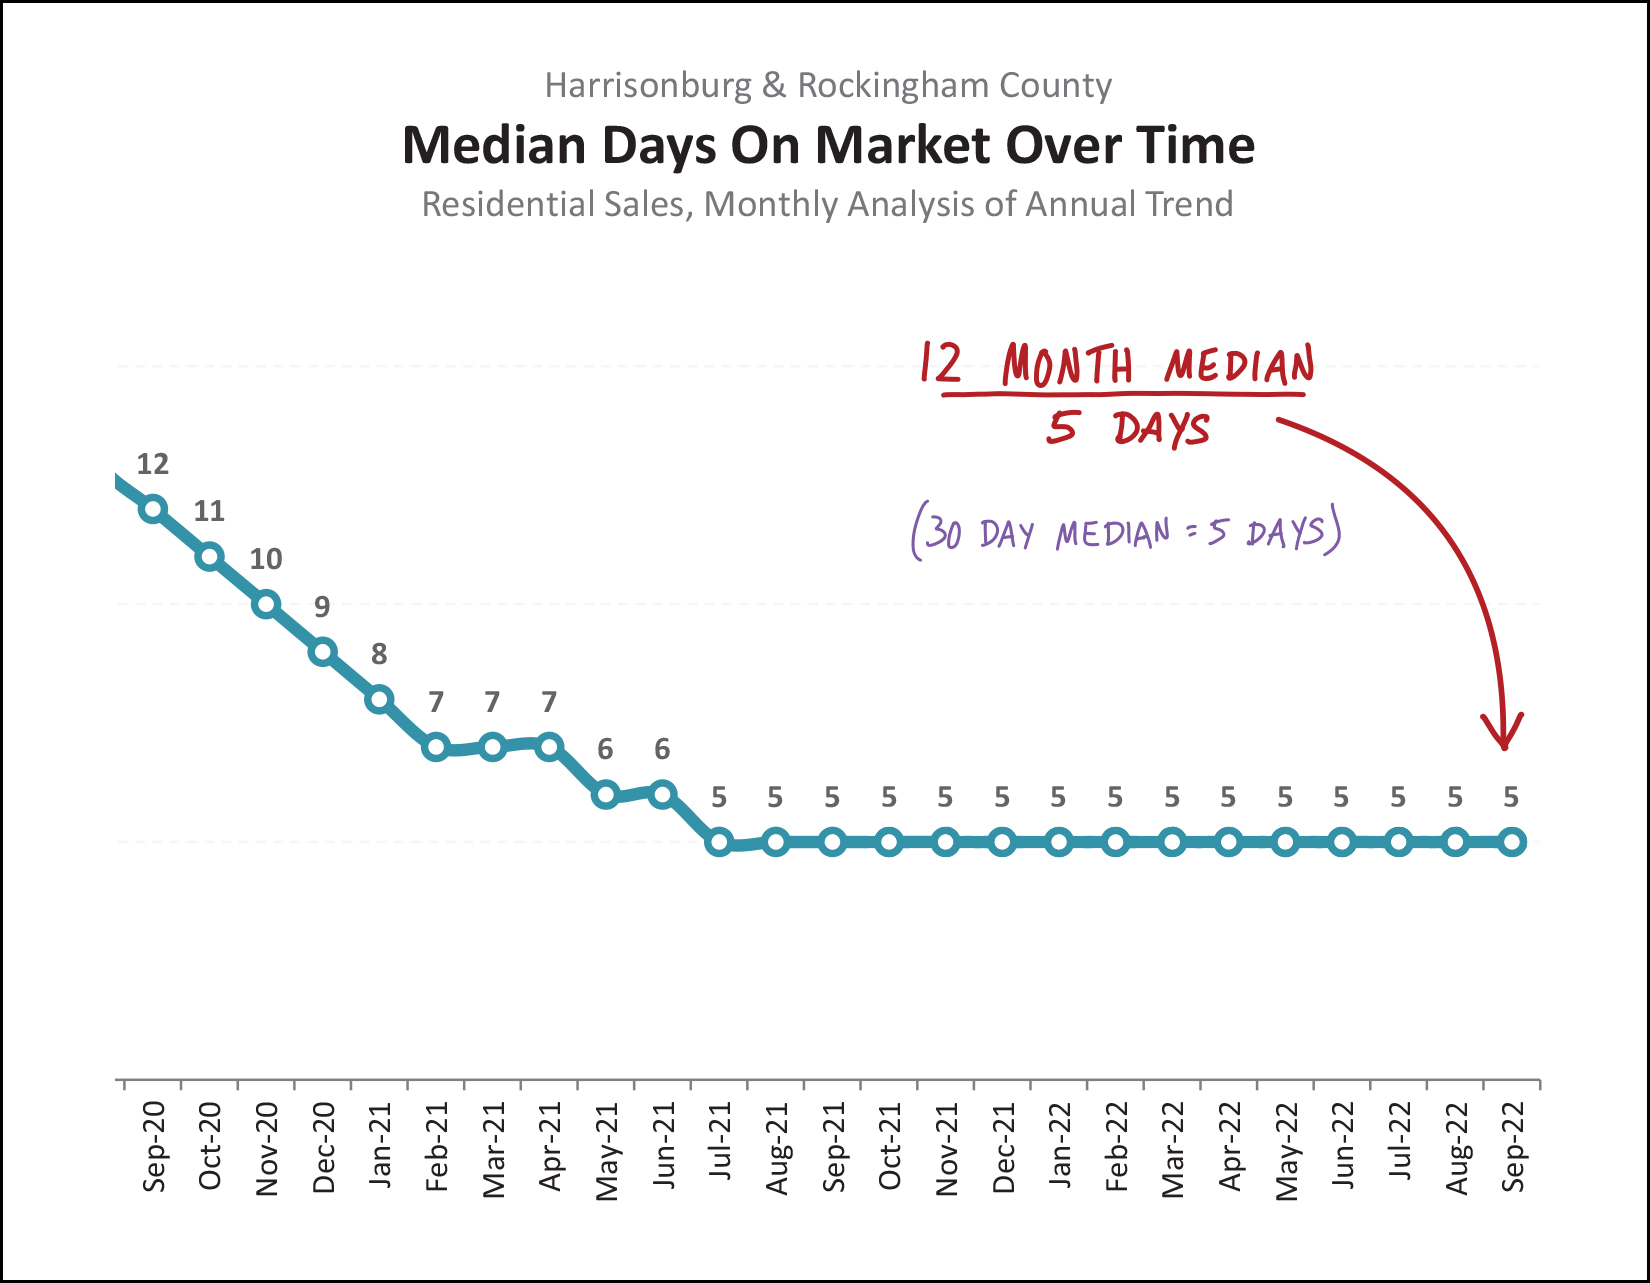 Over the past 12 months, the median number of days it took for homes to go under contract once listed for sale was... five days! We first hit that low (low!) level of a median of five days back in July 2021, and we have been hanging out at that same level ever since. Interestingly, I suspected that if I looked at a shorter, more recent, timeframe that I would find that it is taking homes longer to go under contract. With that theory in mind, I looked at the median days on market over the last 30 days and it was... still five days. So, the market (overall) seems to still be moving very quickly with half of new listings that go under contract doing so in five or fewer days. And finally, a visual to show you how quickly mortgage interests have been rising... 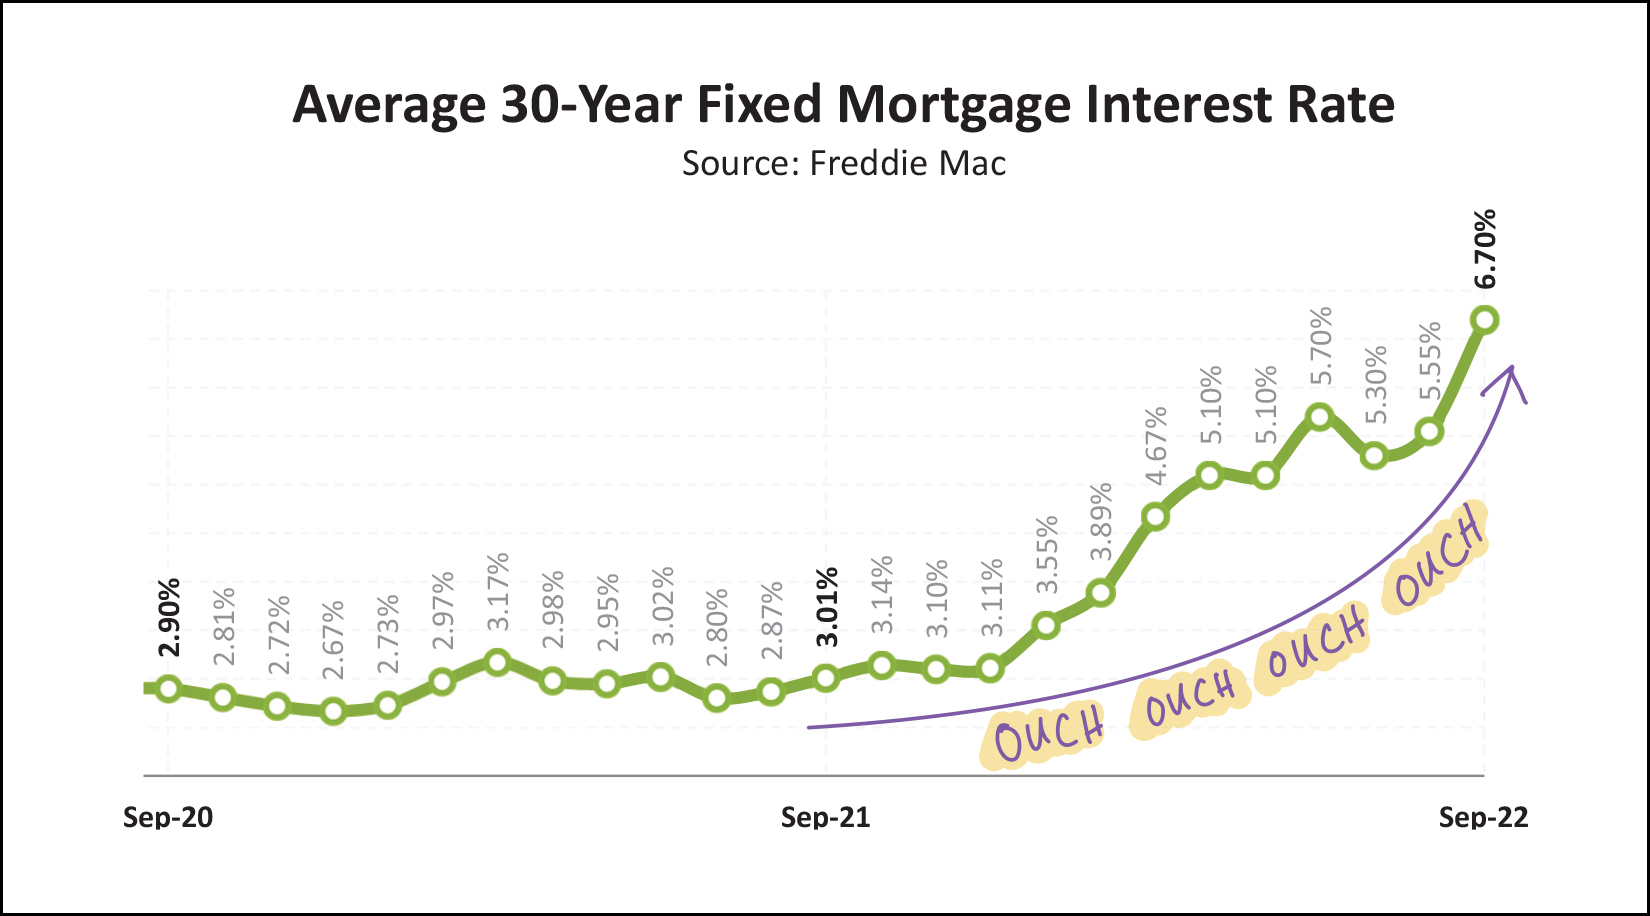 A year ago, mortgage interest rates were right around 3%. Six months ago, mortgage interest rates were right around 4.7%. Now, today, they are all the way up to 6.7%. As you might imagine, this increase in mortgage interest rates significantly affects a buyer's mortgage payment - and potentially their ability to purchase the home they might hope to purchase. So where does all of this leave us? Despite what may be going on in other real estate markets around the state or the country, here's what seems to be true in our local market at this moment in time... [1] Contract activity and home sales has slowed in the second half of 2022, though the highly active first half of 2022 is still keeping us on track with 2021 thus far. [2] Higher mortgage interest rates are affecting buyer behavior which is often resulting in fewer showings and fewer offers. [3] Despite the points mentioned above, homes are still going under contract very quickly and home prices keep on rising. As you look ahead to the remainder of fall, and into the winter months, if you're thinking about buying a home, or selling a home, we should chat about how things are going in your segment of our local market as it relates to the property type, price, size, location and age of your home. I'll check in on the market again in about a month, but until then, enjoy your fall days, and best of luck to anyone else running in the Harrisonburg Half Marathon this Saturday! | |
Should You List Your Home Now Or Wait Until Spring? |
|
 Now or Later? Now! :-) I mean... don't get all panicky about it... but I would definitely recommend listing your home now, rather than waiting until the spring. Oftentimes homeowners who might sell in fall or might sell in the spring decide that they might as well wait until spring. I think this year is or should be different for homeowners who aren't sure whether to sell now or wait until spring. Yes, interest rates are high right now, but inventory levels are still low, homes are selling quickly, and at great prices. [1] Interest rates might have come down some, but they may also be just as high or higher. [2] Inventory levels could quite possibly be higher (more competition) if the market slows over the next six months. [3] Homes may not be selling as quickly. [4] Home prices might be even higher in six months, but they could also have flattened out or declined a touch. I am not predicting a major change in the state of our local housing market... and I am not saying that the sky is falling... and I don't think the local housing market is going to be much worse six months from now... ...but, I think the calculus on whether to sell in the fall or to wait until spring is a bit different this year, and some homeowners that might have normally waited until spring should probably consider listing their homes this fall instead. Just a thought. What are your thoughts? | |
Another Visual Of A Slightly Slowing Pace Of Home Sales |
|
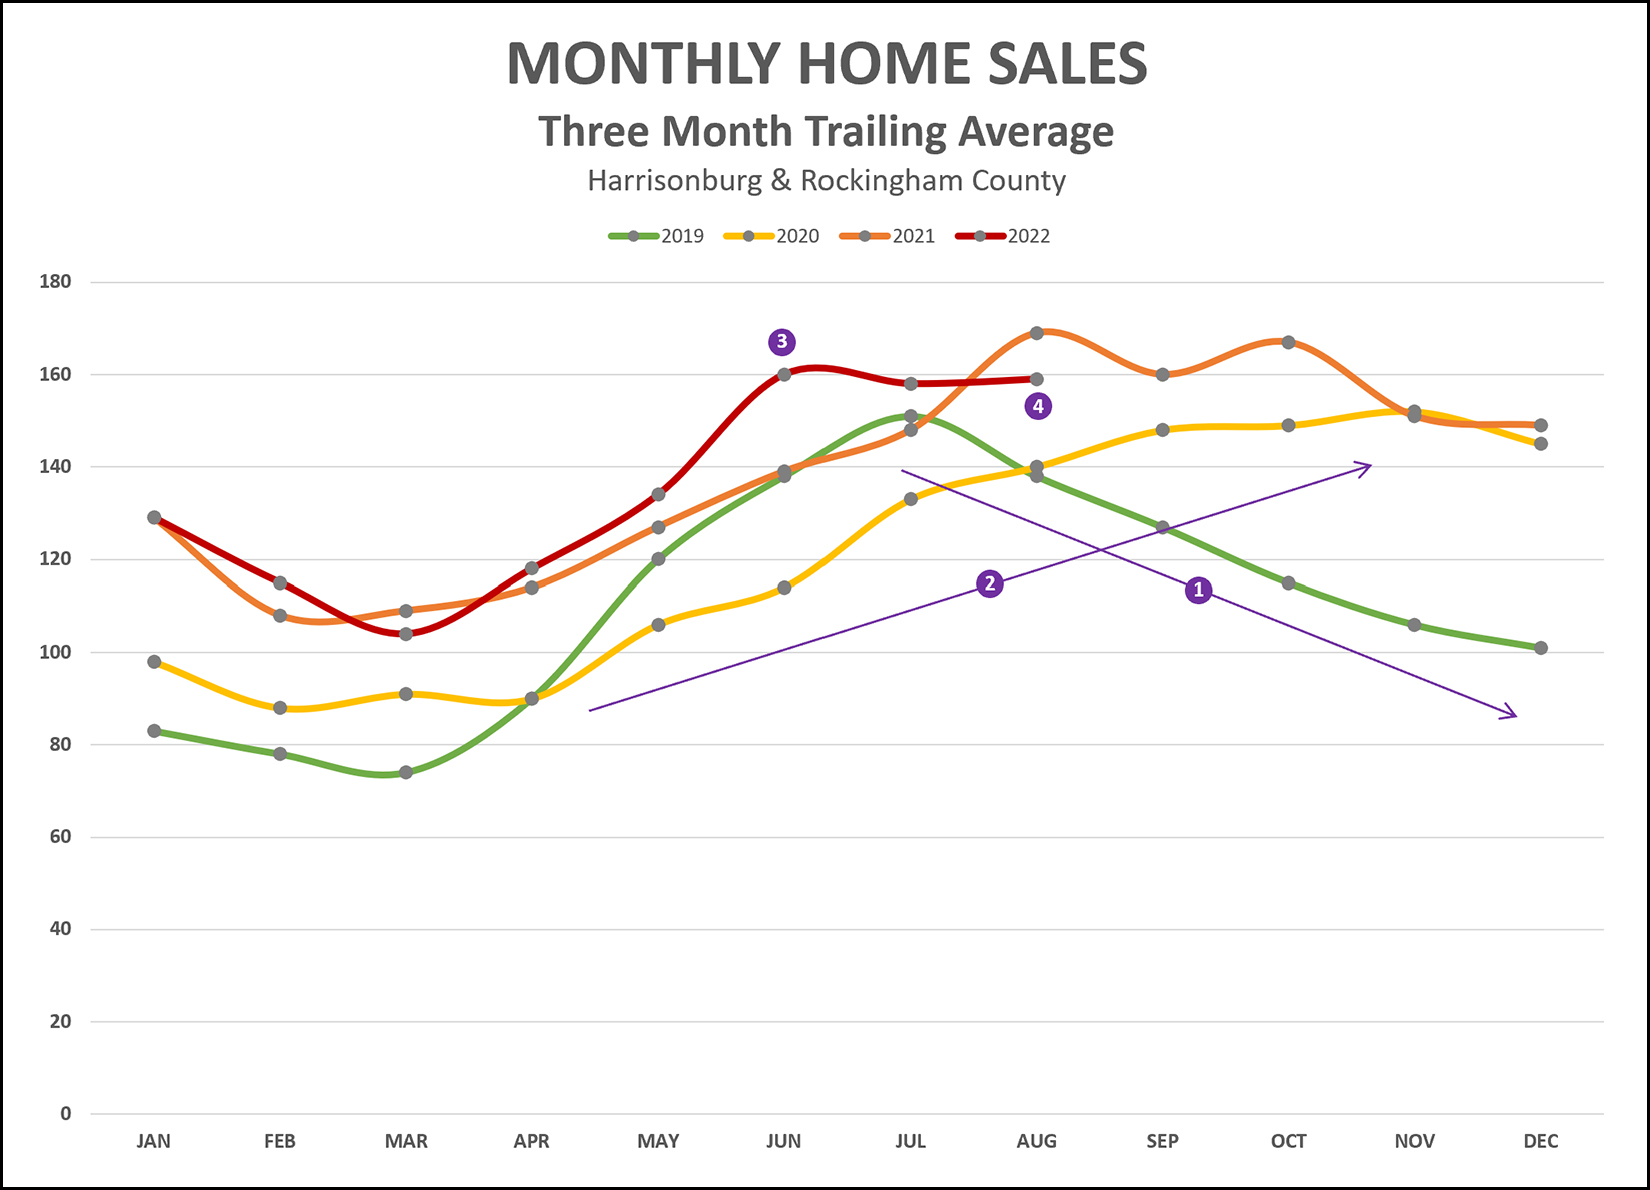 I usually look at the pace of home sales each month, which shows quite a movement up and down as some months are surprisingly slow and some are surprisingly active. I also usually examine the annual pace of home sales to see how home sales are trending from a long term perspective, though this view of the data is very slow to reveal any shorter term trends. Upon a recommendation from a reader, I have created the graph above that averages the three most recent months of sales in order to smooth out the monthly data but get faster insights into trends than the annual data can provide. Thus... The August 2022 data point is the average of June, July and August home sales. The July 2022 data point is the average of May, June and July home sales. Etc., etc. A few things, then, to point out on the graph above... [0] There are plenty of normal season trends illustrated on this graph. For example, home sales are typically lowest in the first quarter of the year, accelerate through the second and third quarter and then decline in the fourth quarter. This happens most years. [1] The green line (2019) took a nose dive in the second half of the year due to the uncertainty and anxiety of a pandemic sending many people home to work, for school and more. [2] As shown on the yellow line, things were rocking and rolling again by mid 2020 as buyers were snapping up houses as fast as they could because "home" was so important during the pandemic and because of rock bottom interest rates. [3] Looking at the red line (2022) we see that home sales activity was setting new records all the way through June 2022... though that data point is an average of April, May and June. [4] Now that we're into August, we have seen a slight decline in home sales activity as compared to 2021. We are still well above 2020 and 2019 at this point. It will be interesting to see how the remainder of 2022 plays out. It seems unlikely that the market will be as active as it was in the last five months of 2021. | |
Are Home Prices Rising Because Larger Homes Are Selling? |
|
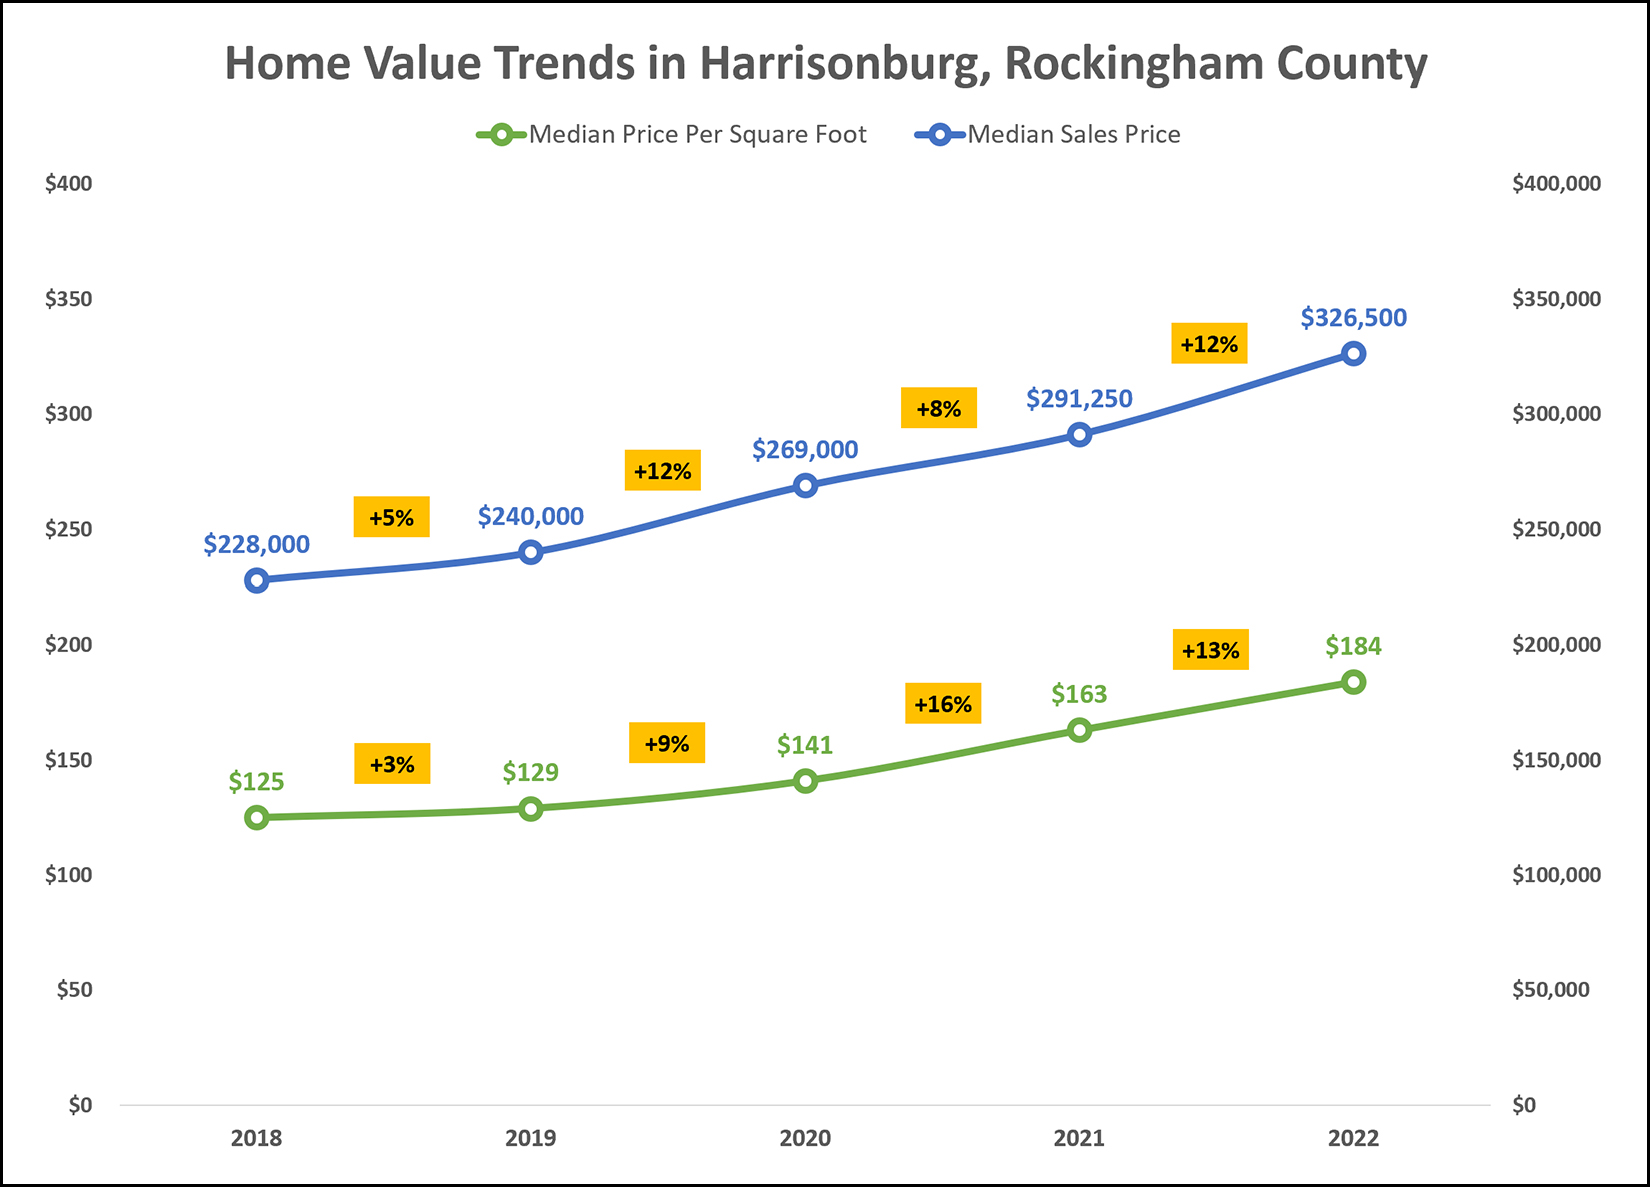 When you see a 12% increase in the median sales price between 2021 and 2022 you might wonder if it is just a result of larger homes selling this year than last. It's a reasonable question, and a relatively straightforward one to investigate... The graph above shows... BLUE LINE = median sales price of single family homes in Harrisonburg and Rockingham County GREEN LINE = median price per square foot of those same single family homes in Harrisonburg and Rockingham County If the 12% increase in the median sales price could best be understood as a collective increase in the size of homes being sold, we would see an increase in the median price per square foot that was smaller than 12%. In fact, over the past year, the median price per square foot has increased by 13%, right alongside the median price increasing by 12%. So, this significant increase in sales prices does not seem to be attributable to larger homes selling. | |
Home Prices Keep Rising in Harrisonburg, Rockingham County Despite Slightly Fewer Home Sales |
|
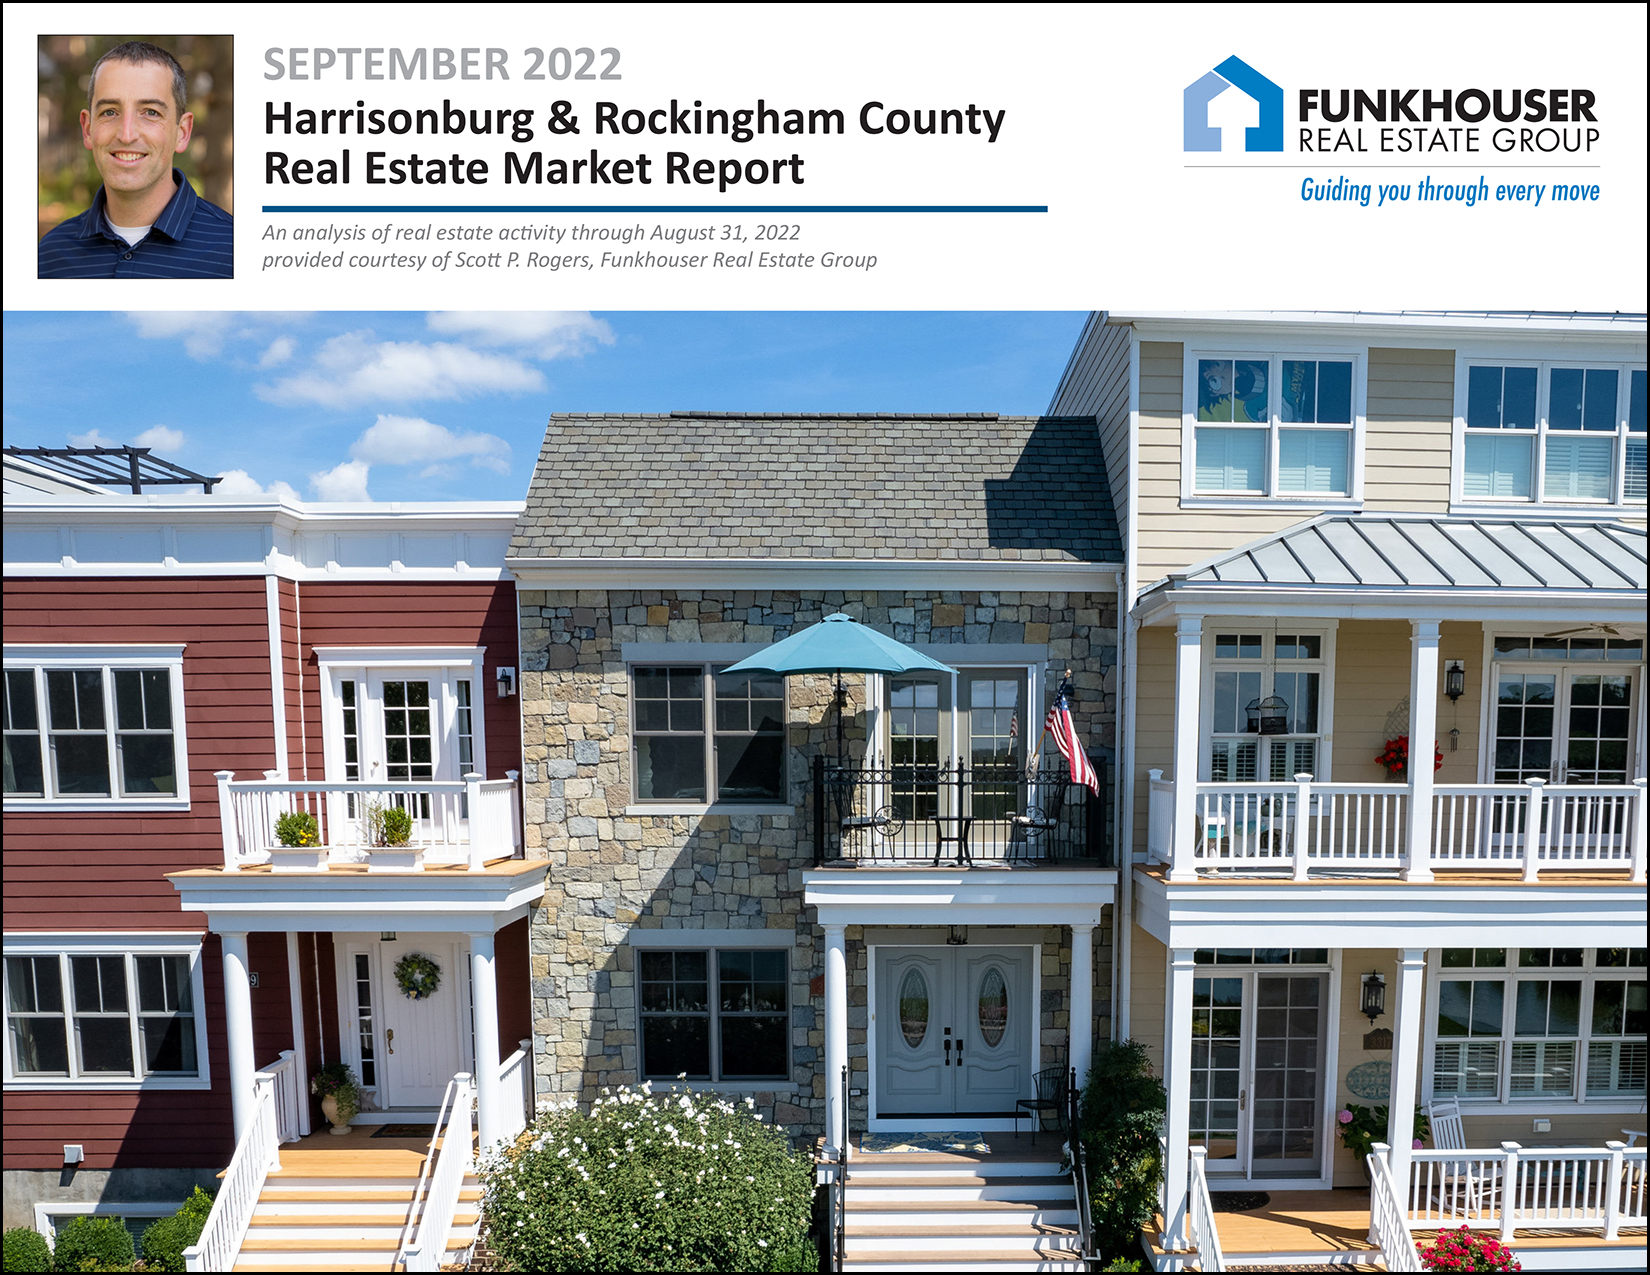 Greetings, and Happy Tuesday morning, friends! Would you believe it if I told you we're 70% of the way through 2022!? It's hard to believe, I know, but indeed, we only have about 30% of the year to go. Would you believe it if I told you I am now old enough to be the dad of an adult!? It's hard to believe, I know, but Luke recently celebrated his 18th birthday. Shaena and I are tremendously proud of the man he is and is becoming and we're excited to see what is in store for him in the coming years. Happy 18th, Luke! :-)  This Month's Featured Home... The upscale rowhouse on the cover of this month's market report is one of the original lakefront rowhouses at Preston Lake, and you can find out more about this beautiful property by visiting 3313PrestonShoreDrive.com. Another of My Favorite Places... Each month I offer a giveaway, of sorts, for readers of this market report, highlighting some of my favorite places (or things) in Harrisonburg. Recent highlights have included Village Juice & Kitchen, Black Sheep Coffee and the Harrisonburg Half Marathon. This month I'm highlighting the JMU Forbes Center for the Performing Arts which is the premier destination for arts in the Shenandoah Valley with countless top notch musical, dance and theatrical performances each year. Have you been to a show at the Forbes Center? Would you like to? I'm giving away a pair of tickets to what is bound to be a hilarious show at the Forbes Center... "Whose Live Anyway?" featuring current cast members of the Emmy-nominated television show "Whose Line Is It Anyway?" for 90 minutes of hilarious improvised comedy and song. The show is on Friday, September 30 at 8:00 PM. Enter here for a chance to win this pair of tickets. And now, let's take a look at the latest news from our local real estate market... 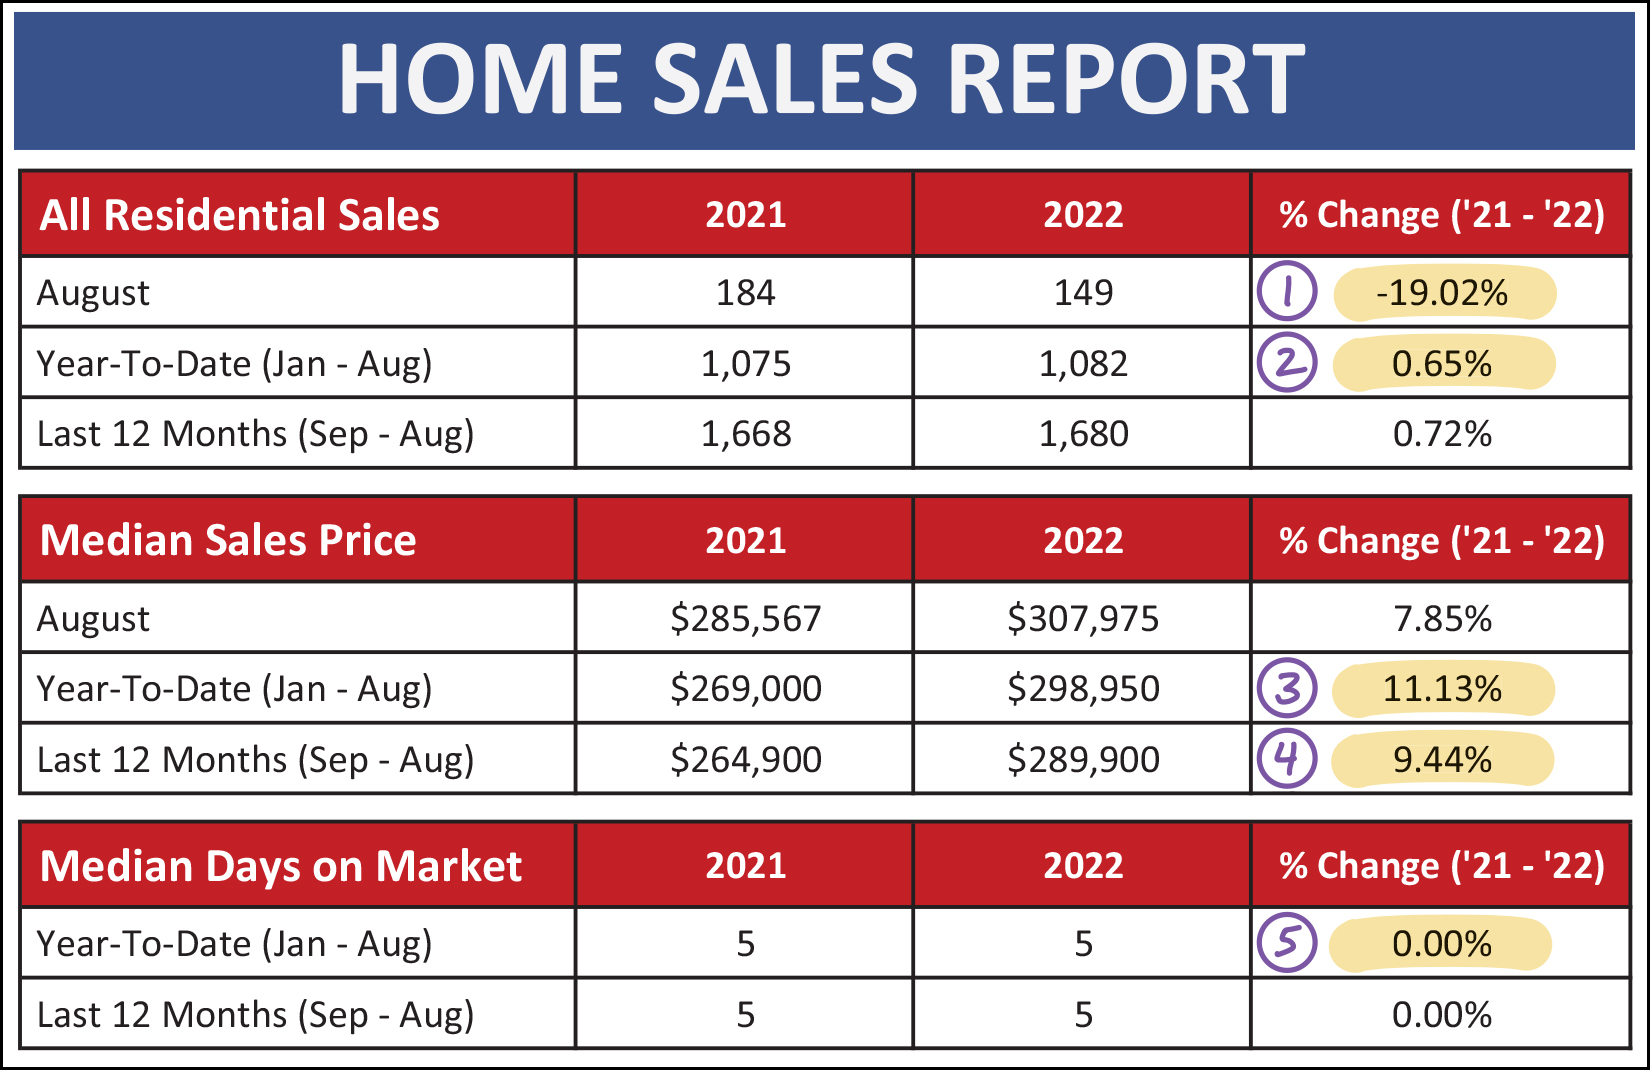 First off, let's get right to it... we saw significantly fewer home sales this August as compared to last August. We've been in "always more, every month more" mode for so long when it comes to home sales that it might seem jarring to see a 19% drop in August home sales, but it is important to realize that we couldn't necessarily always see more and more home sales forever and ever. We have seen an extraordinarily high amount of home sales activity over the past two years. Those home sales levels may have been inflated beyond the norm, so we may see a downward shift in the number of homes selling per year as we finish out 2022 and enter 2023. This isn't a catastrophe and it does not necessarily mean we will see any adjustments in home values and sales price in this area. In fact, in the "this is not a catastrophe" category, when we move beyond #1 above, where we see a 19% decline in August home sales, we'll also find... [2] The pace of home sales during the first eight months of this year are still slightly (0.65%) ahead of last year during those same eight months. Though, if home sales activity continues to be a bit slower through the rest of 2022, we should expect the annual pace of sales in 2022 to eventually fall behind 2021 levels. [3] The median sales price this year in Harrisonburg and Rockingham County ($298,950) is 11% higher than it was last year during the same first eight months of the year when it was $269,000. [4] When looking at a full year of data (September through August) we find that there has been a 9% increase in the median sales price over the past year, from $264,900 up to $289,900. [5] Homes are still selling just as fast as last year... with a median "days on market" of five days. So, while the number of homes selling might be slipping a bit compared to last year, prices are still rising, and homes are still selling very quickly. Now, let's break things up a bit by detached homes (green) and attached homes (orange) below... 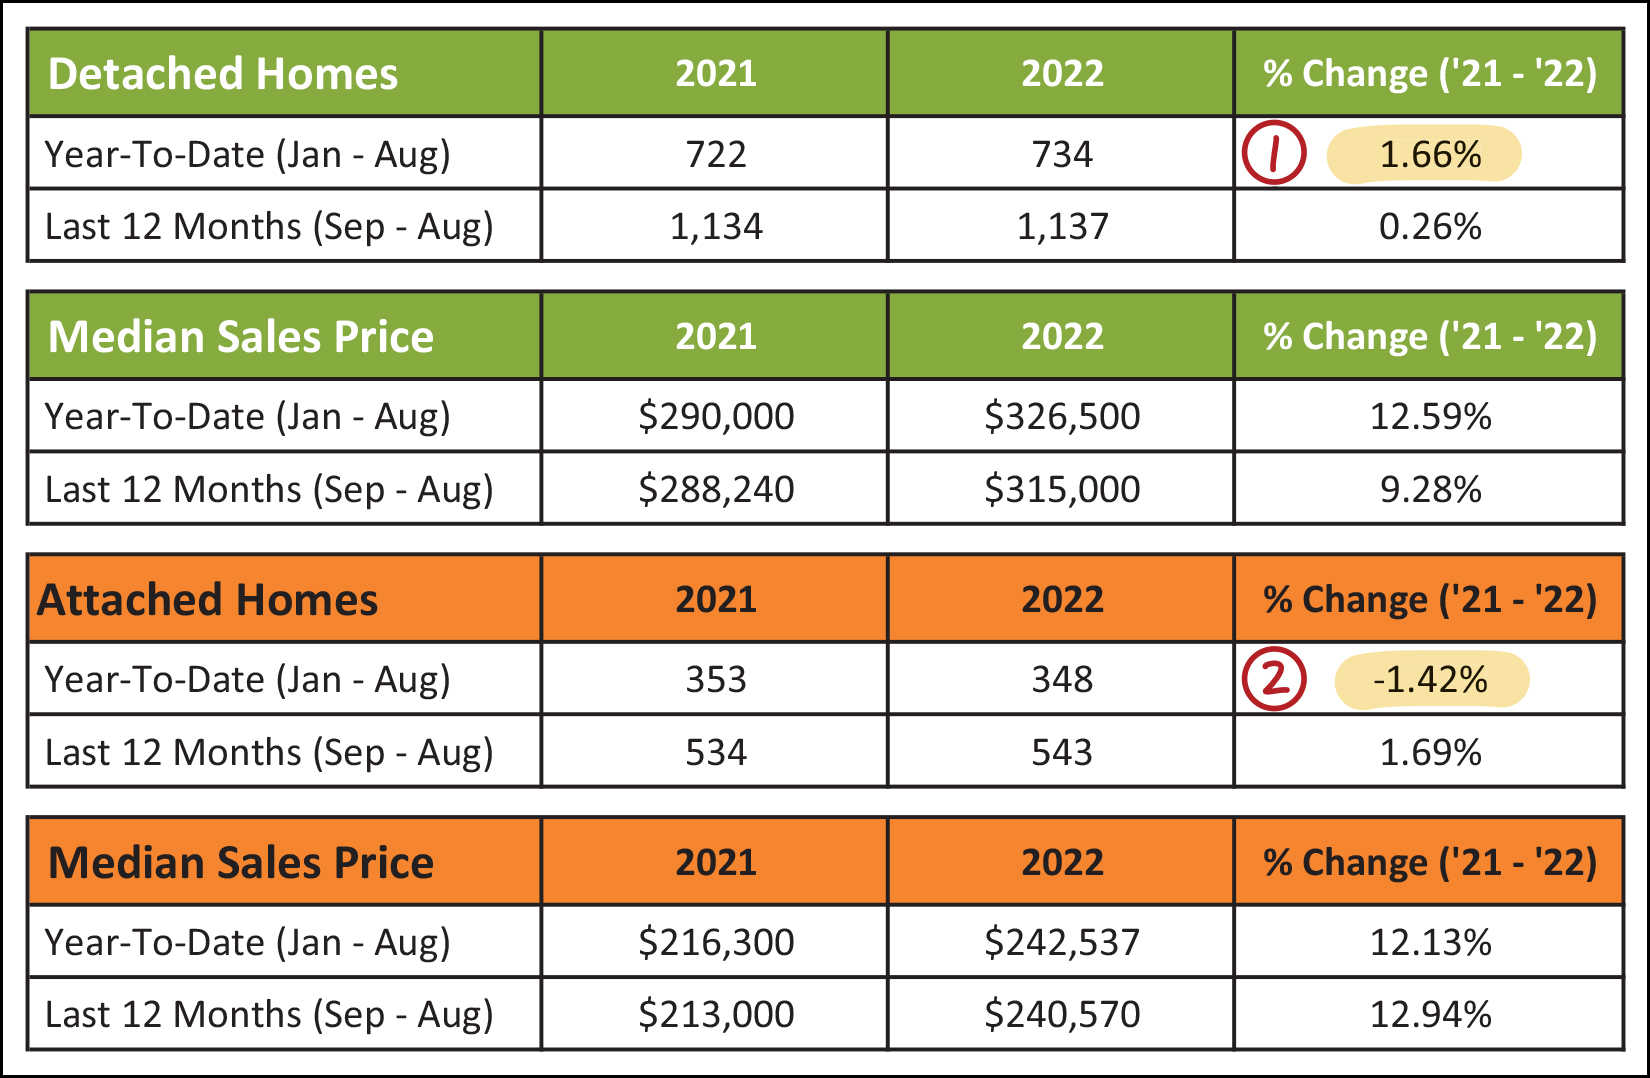 This chart pull a few things out that provide some helpful comparisons... [1] There have been slightly more detached home sales this year (734) as compared to last year (722) for a total increase of 1.66%. This has been accompanied by a year-to-date increase of 12.59% in the median sales price of those detached homes. [2] There has been a slight decline in the number of attached home sales this year (348) as compared to last year (353) for a total decrease of 1.42%. This has been accompanied by a larger, 12.13%, increase in the median sales price of those attached homes. So... we're seeing a slight uptick in single family home sales and a slight downturn in townhouse / duplex / condo sales... though the median prices of both property types are increasing. Finally, slicing and dicing the data one more time to compare the City and County, here's what we find... 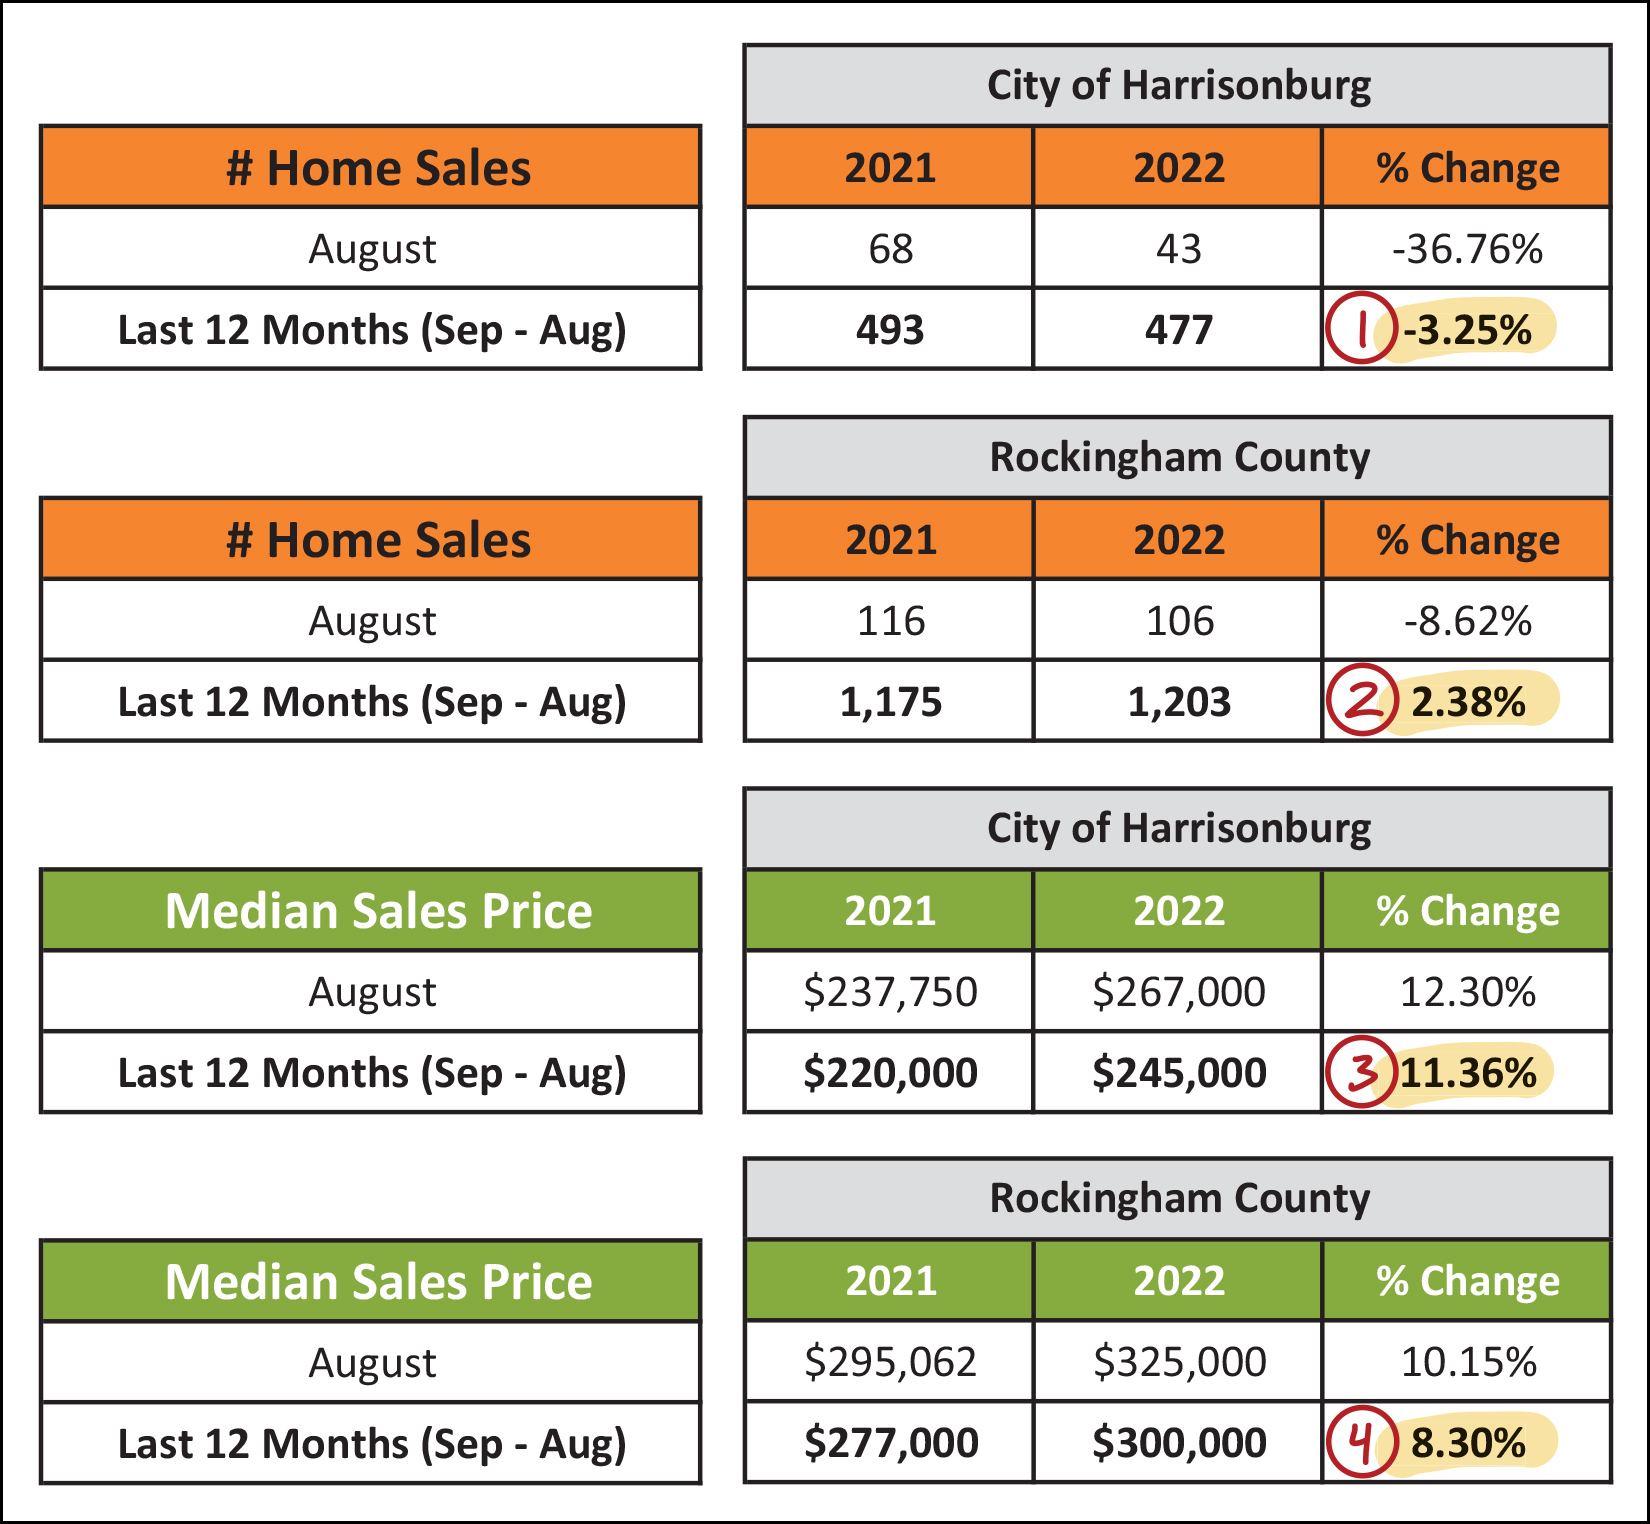 Here's what pops out to me in the chart above, when looking at a full year (Sep - Aug) of data... The pace of home sales has slowed a bit (-3%) in the City (#1) while the pace of County home sales (#2) has increased slightly (+2%). The median sales price has increased by double digits (+11%) in the City (#3) while the median sales price in the County (#4) has increased by a slightly lower amount (8.3%). So, again, lots of home sales at high prices in the City and County... but the pace of sales is slightly more robust in the County, and price increases are slightly higher in the City. Now, the summer that makes you say: Nice! Yikes! Hmmm... 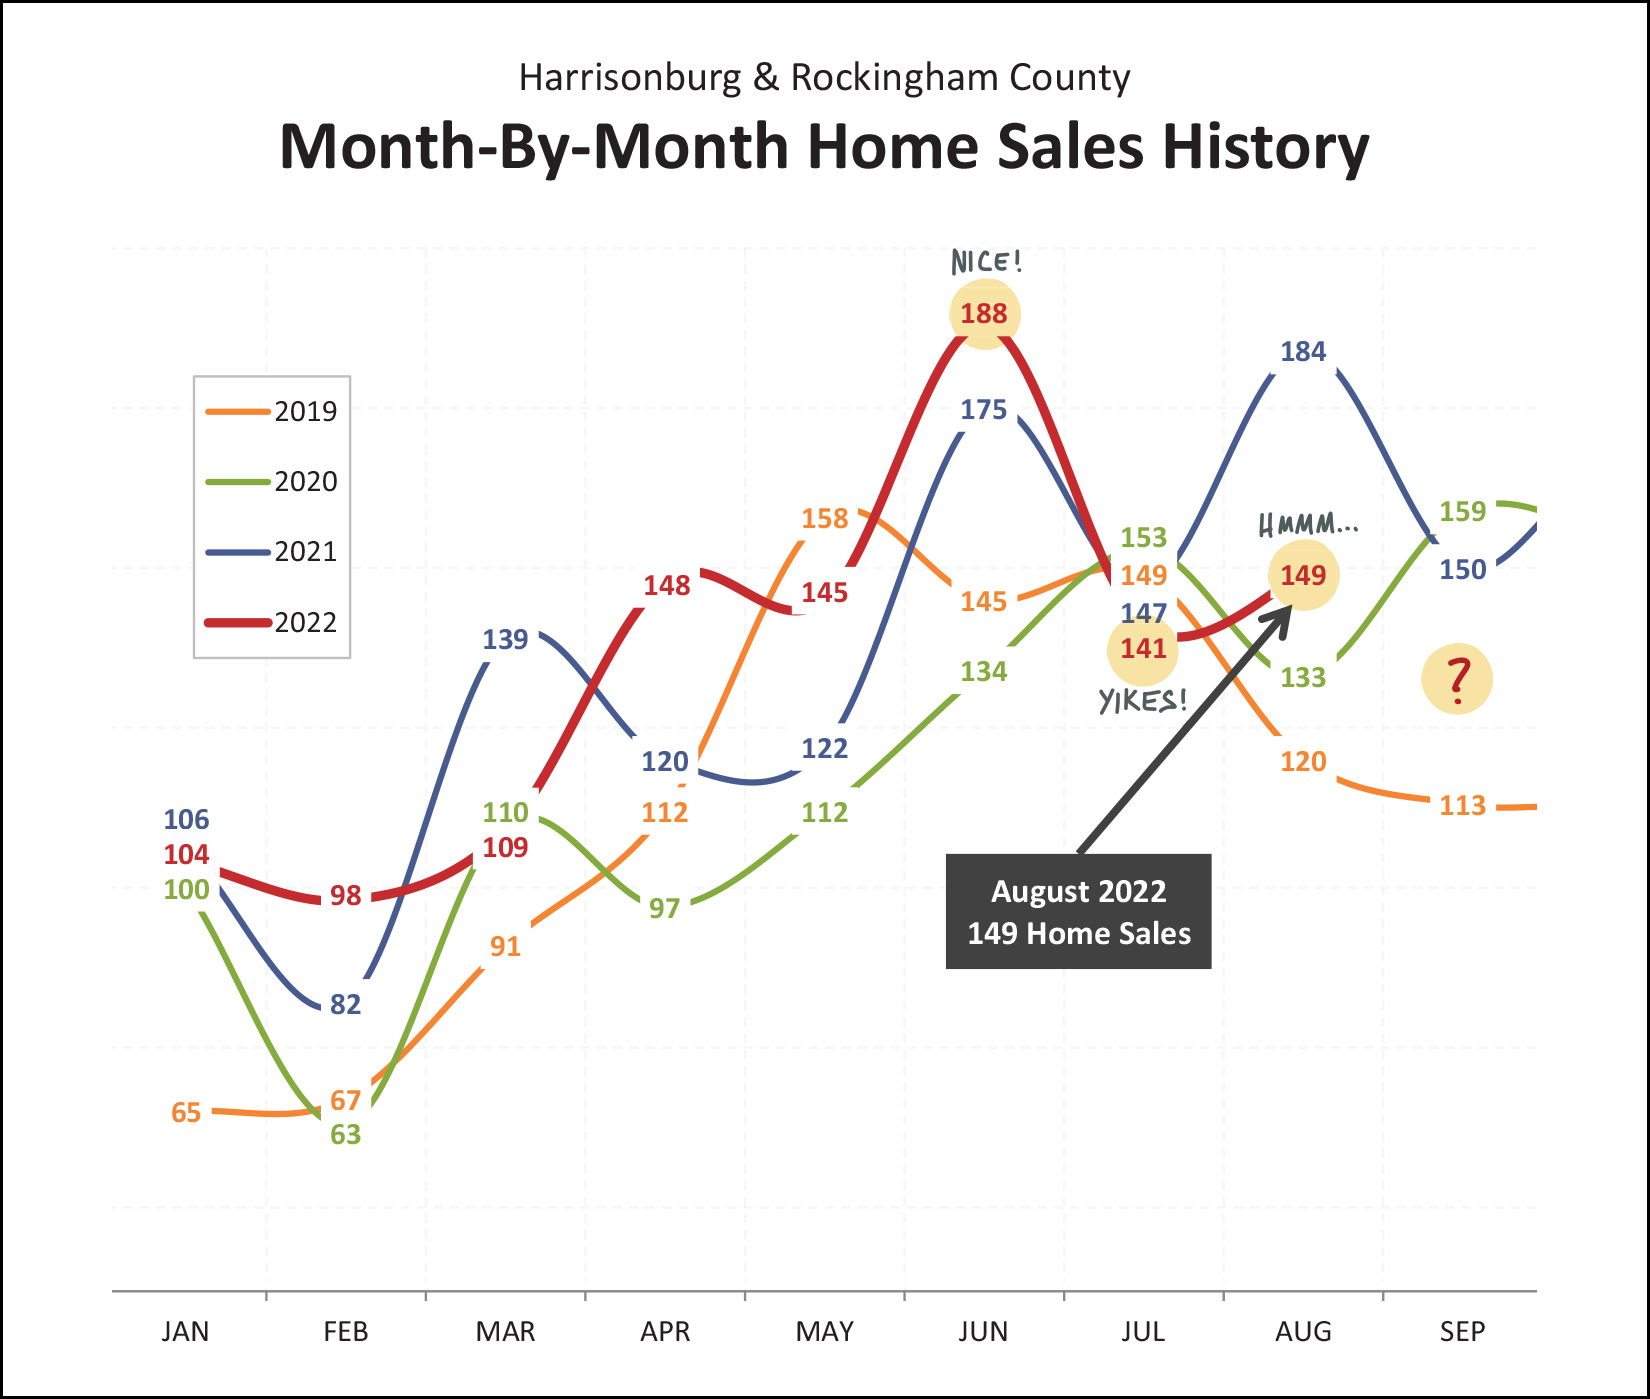 It was a wild summer in the Harrisonburg and Rockingham County real estate market... JUNE = NICE! We saw an incredible number of home sales in June 2022. The 188 home sales this past June was the highest single month of home sales in many, many years! JULY = YIKES! After sky high home sales in June, we saw the slowest month of July home sales in at least three years. July 2022 home sales weren't drastically lower than the previous few years but it was surprising (yikes!) to go from the "best June in 3+ years" to the "worst July in 3 years." AUGUST = HMMM... Home sales this past month were markedly lower than last August, with a 19% decline from 184 home sales to 149 home sales. But... home sales this August were still higher than in August 2019 and 2020. So... were home sales surprisingly slow this August? Or do they just look slow compared to a surprisingly active month last August? At this point it can be helpful to stack all of those months of home sales on top of eachother to look at things from a broader perspective... 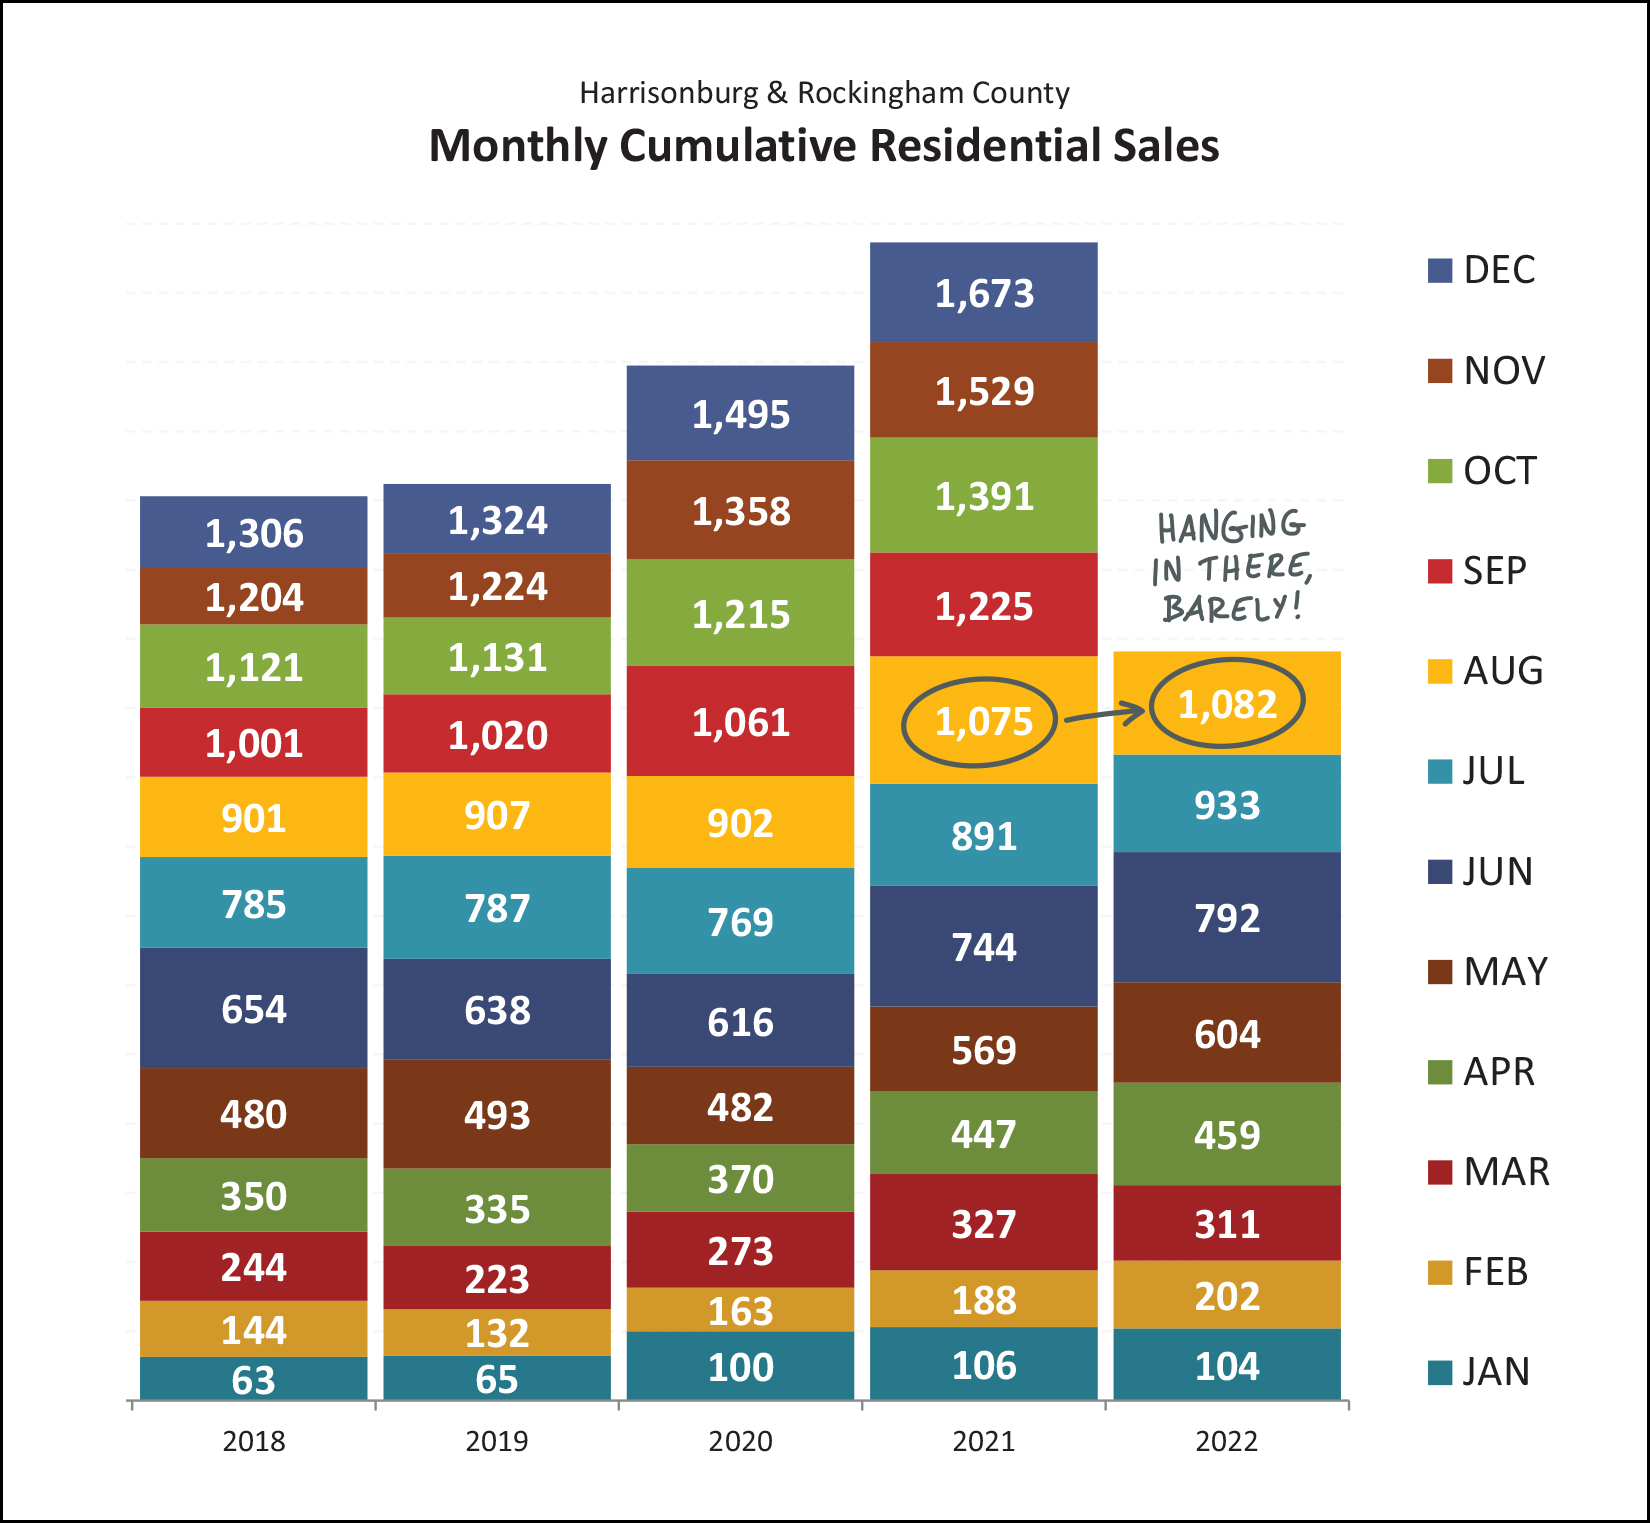 Here you can more clearly see that 2022 year-to-date home sales are barely sticking in the race with 2021. Yes, we have seen slightly more home sales thus far in 2022 than in 2021 (and than in the previous few years) but we're barely ahead now. It seems quite likely that the year-to-date pace of home sales will fall behind as we get through September and October of 2022, especially when we examine contract activity below. So, if you haven't picked up on it yet, it seems the rapid growth in the number of home sales we have been experiencing lately might be starting to... level off... 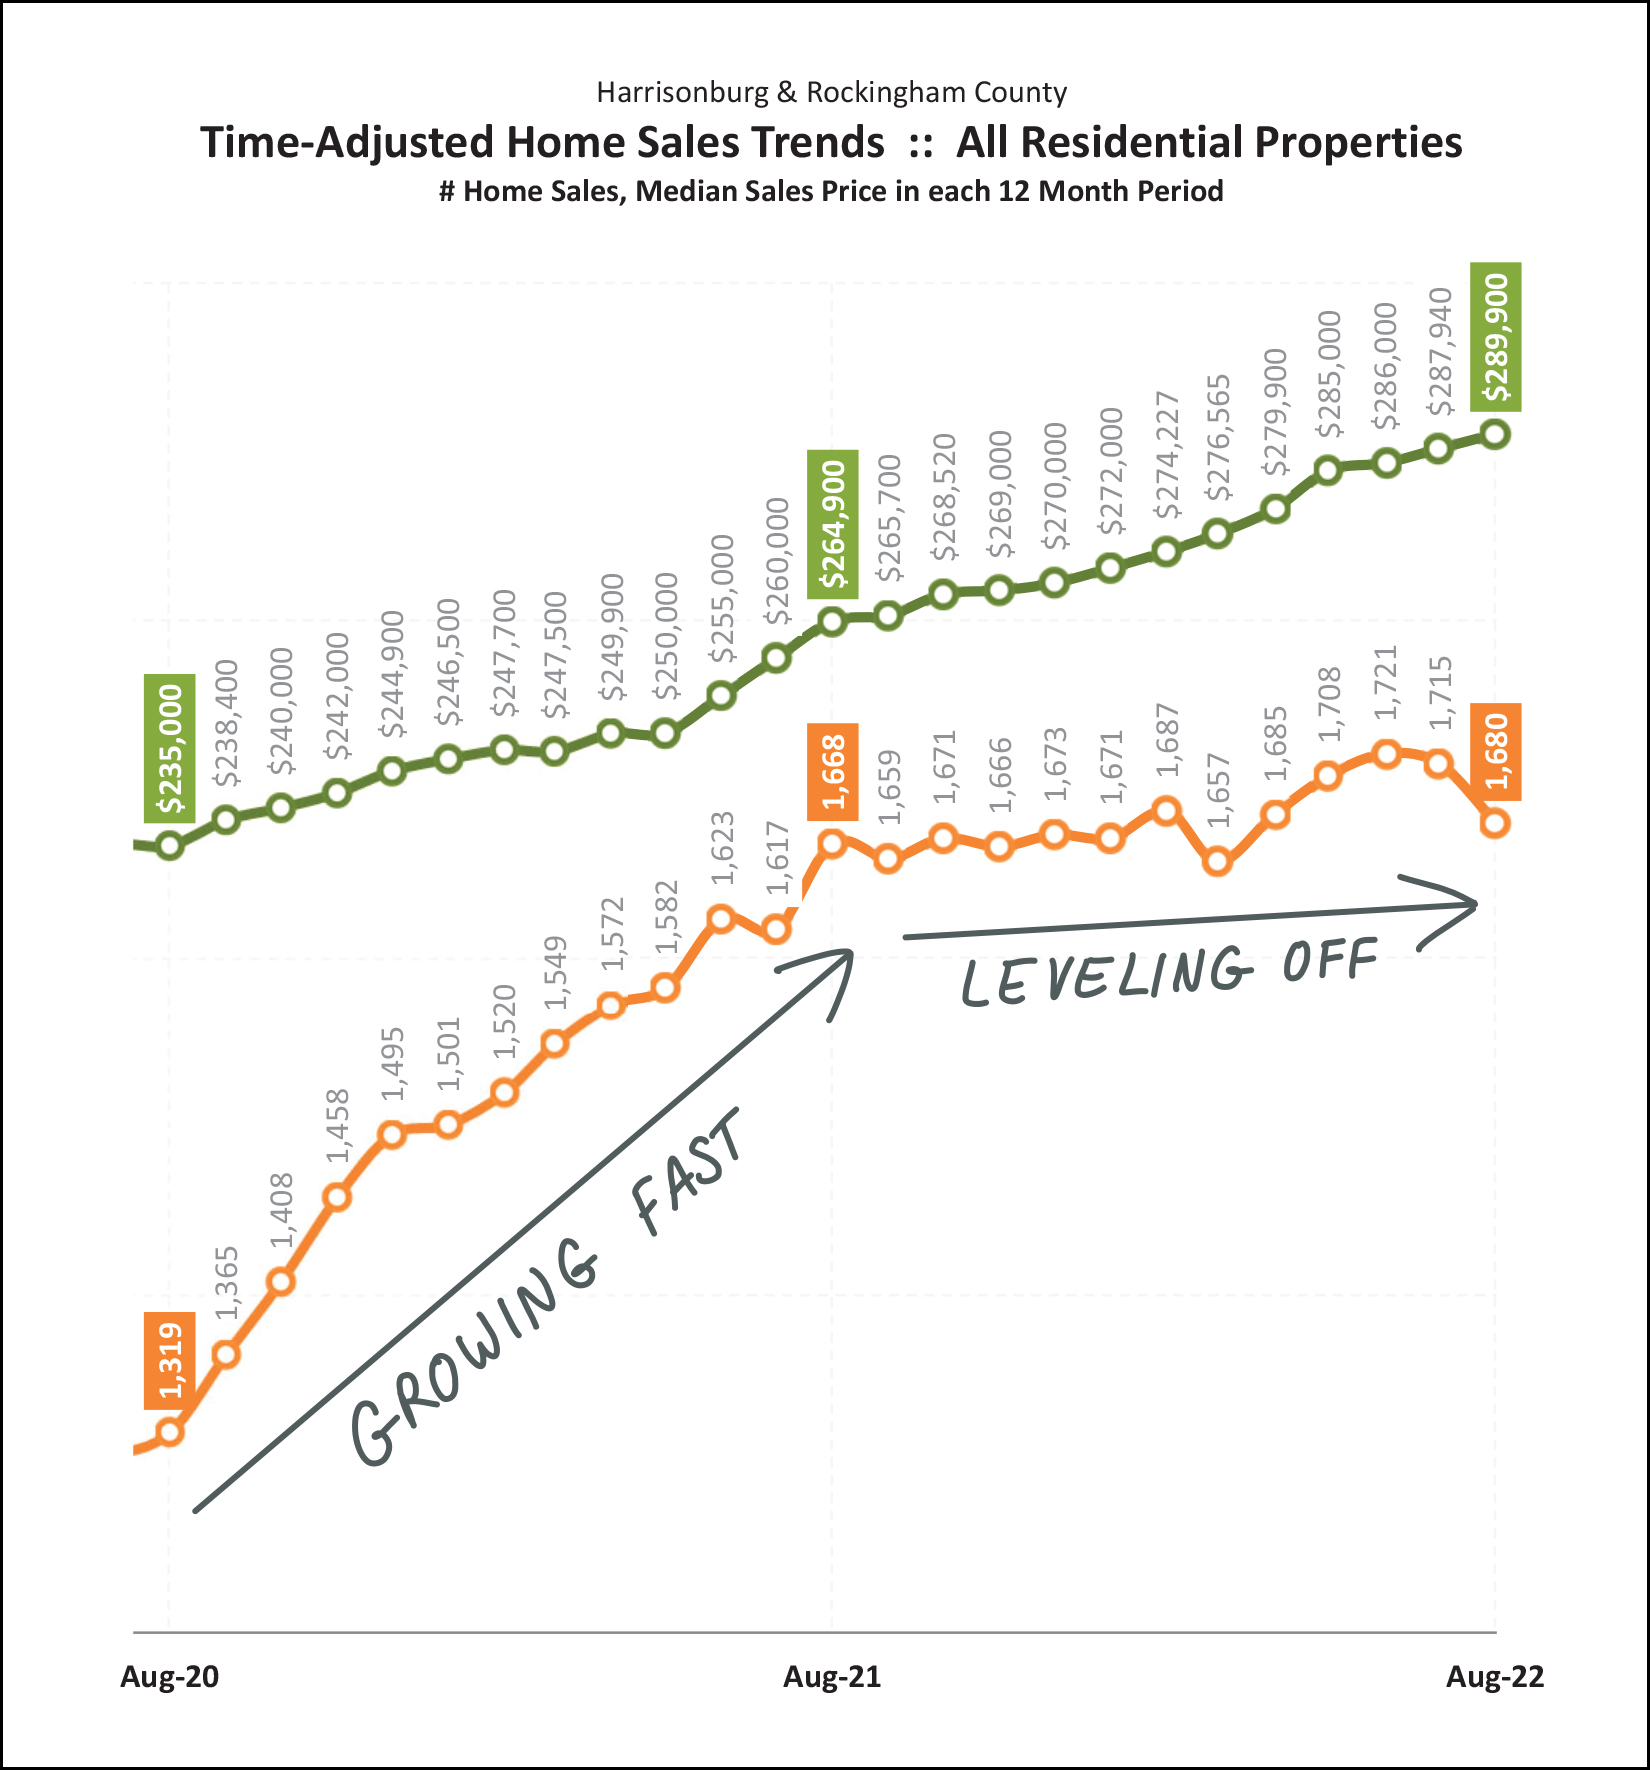 During the height of Covid (2020-21) we saw an ever-increasing number of home sales on an annual basis, seemingly due in large part to the size and shape of "home" being more important than ever as people were spending more time at home during the pandemic... and because of historically low interest rates. Now, however, many of life's patterns (actually going to work, actually going to school) seem to be returning... and mortgage interest rates (if you haven't heard!?) are quite a bit higher than they were a year ago. So, it seems very unlikely that we will continue to see rapid growth in the annual pace of home sales like we saw between August 2020 and August 2021, and it seems more likely that we will see a leveling off, or even a slight slowdown, in the number of homes selling in Harrisonburg and Rockingham County each year. All of this, though, is related to the orange line above... the number of homes selling. Quietly, in the background, the median sales price (green line) just keeps on rising, and rising. The unknown, at this point, is whether we will see home prices start to level out at all. Thus far, they are continuing to rise quite rapidly. Speaking of rising prices, here's a graph that will put these price increases in context pretty quickly... 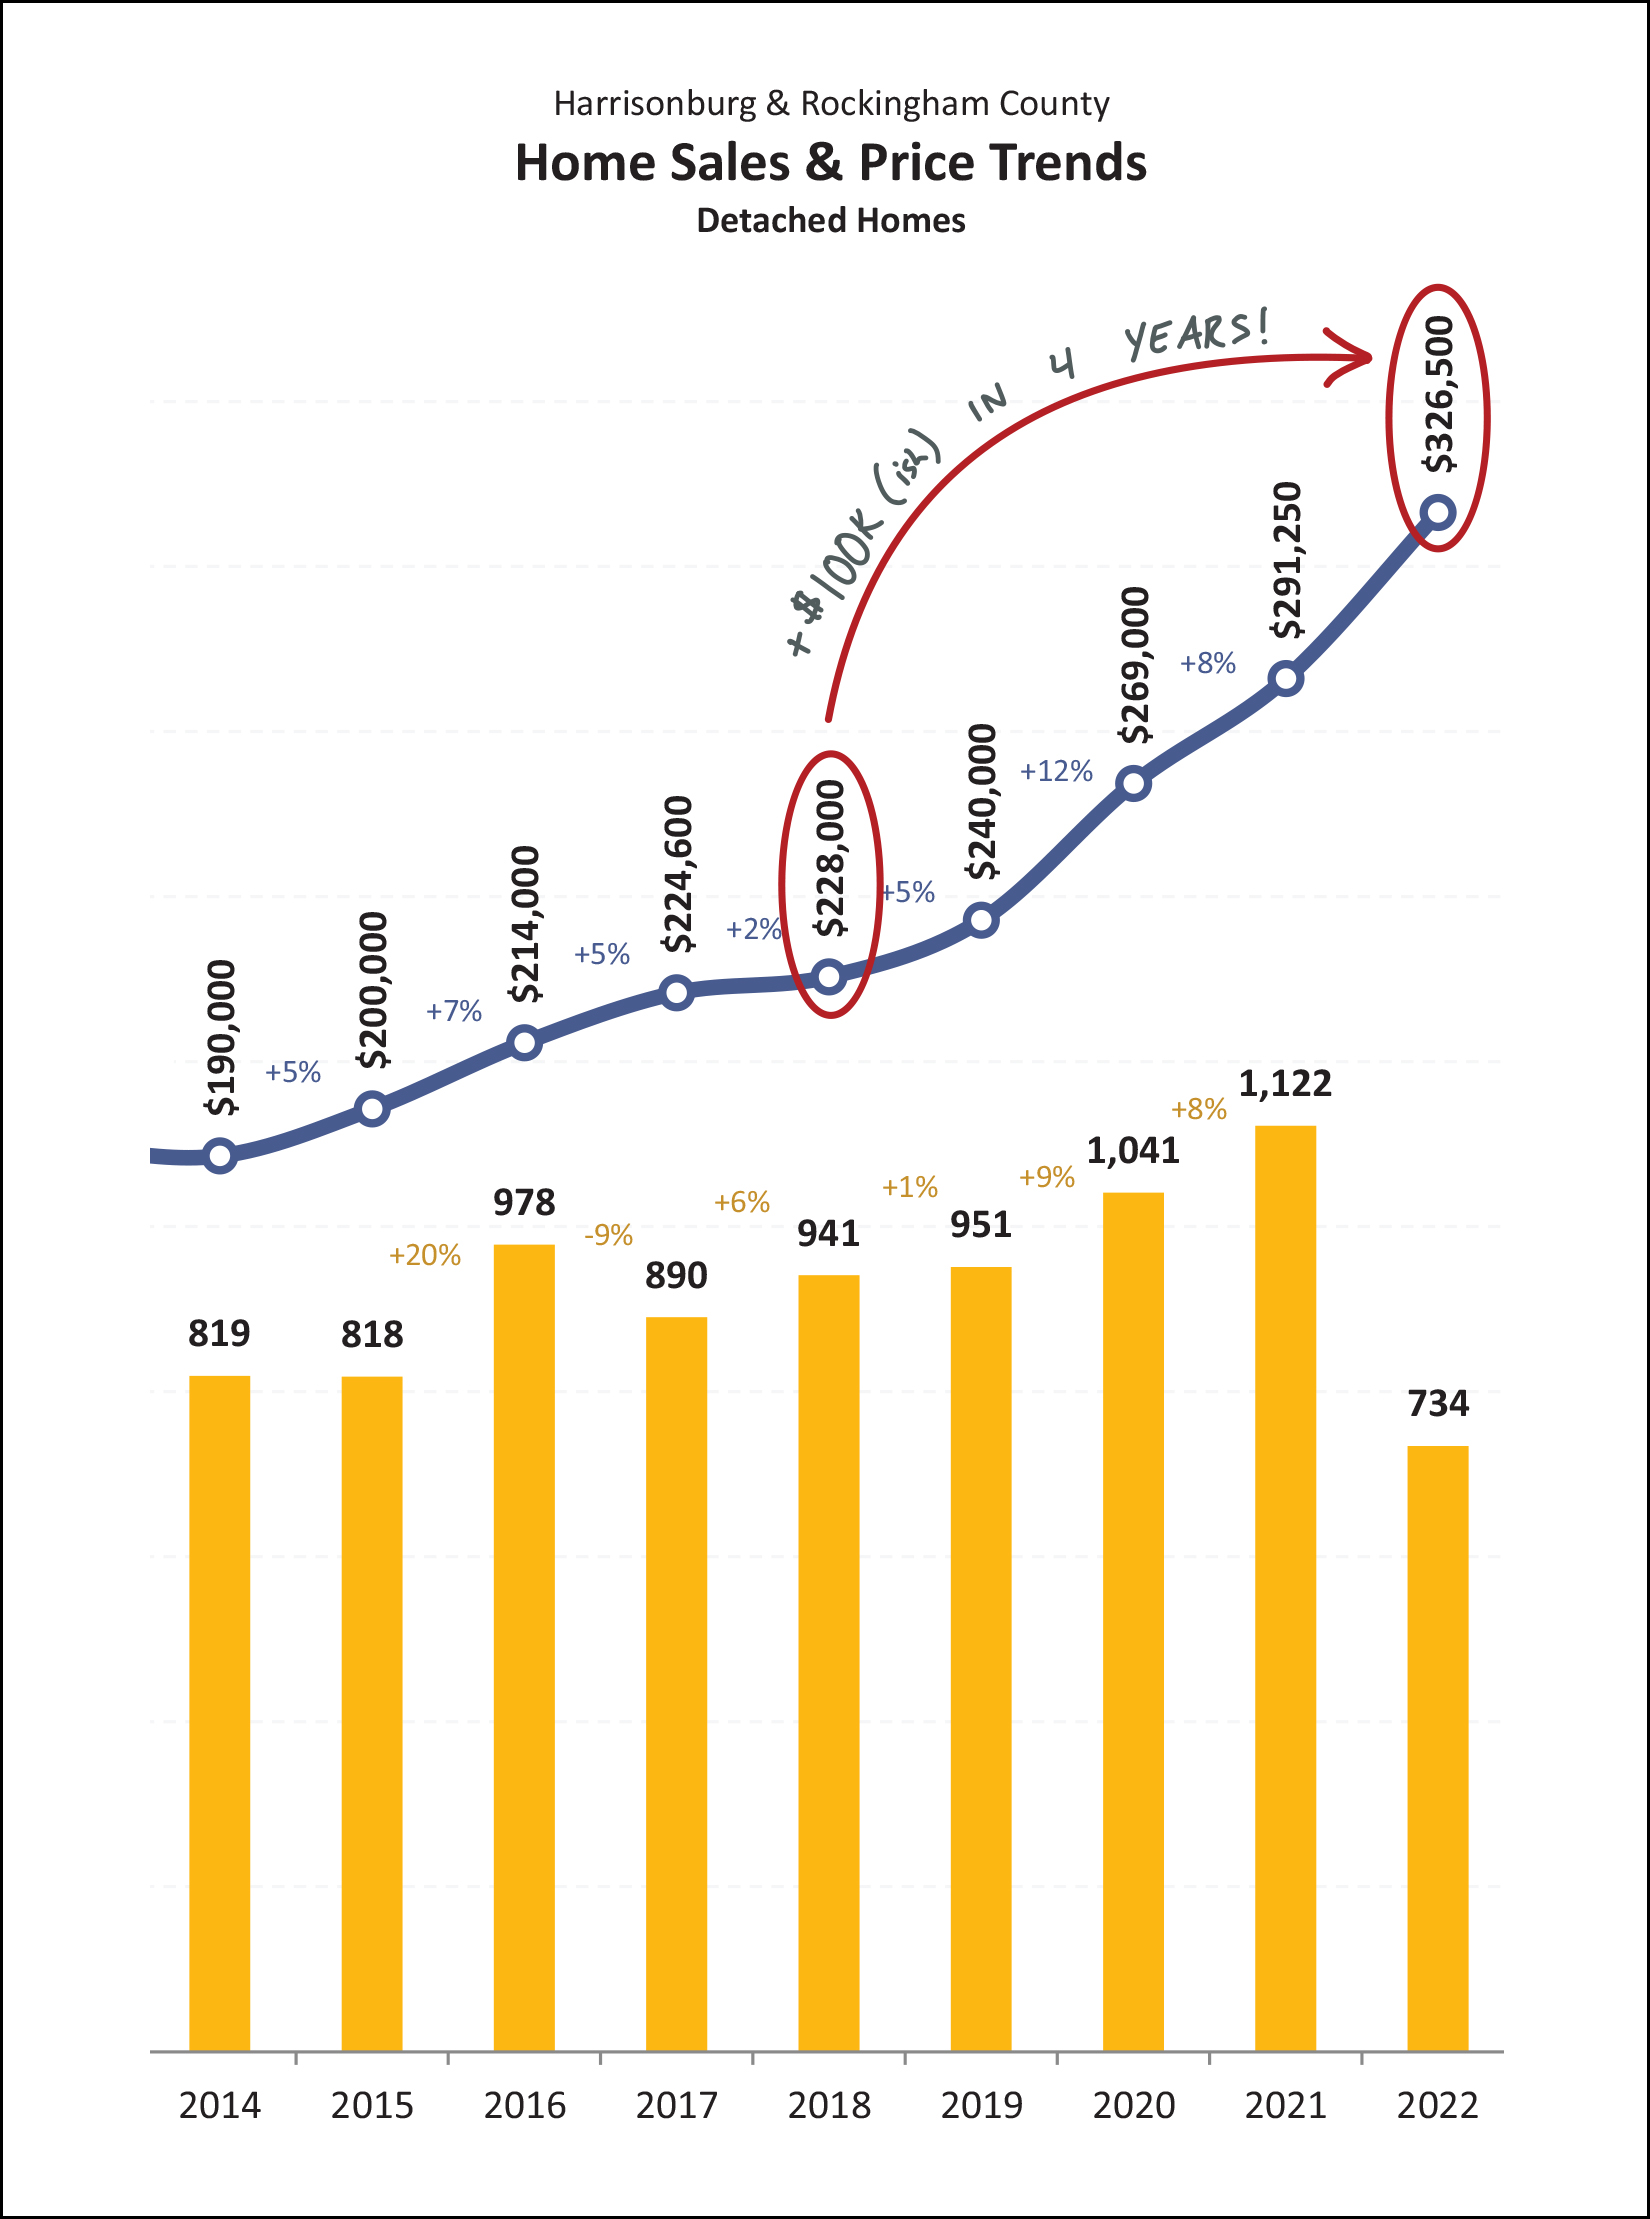 In just four years (2018-2022) the median sales price of a single family home in Harrisonburg and Rockingham County has increased by almost $100,000... from $228,000 to $326,500! What a great time to have owned a home... and what a tough time to buy one now if you haven't owned a home for the past few years to be a part of a joyful ride up the roller coaster of home values. Here's another graph that provides further evidence of the likelihood that we will continue to see the market slow down when it comes to the number of homes selling... 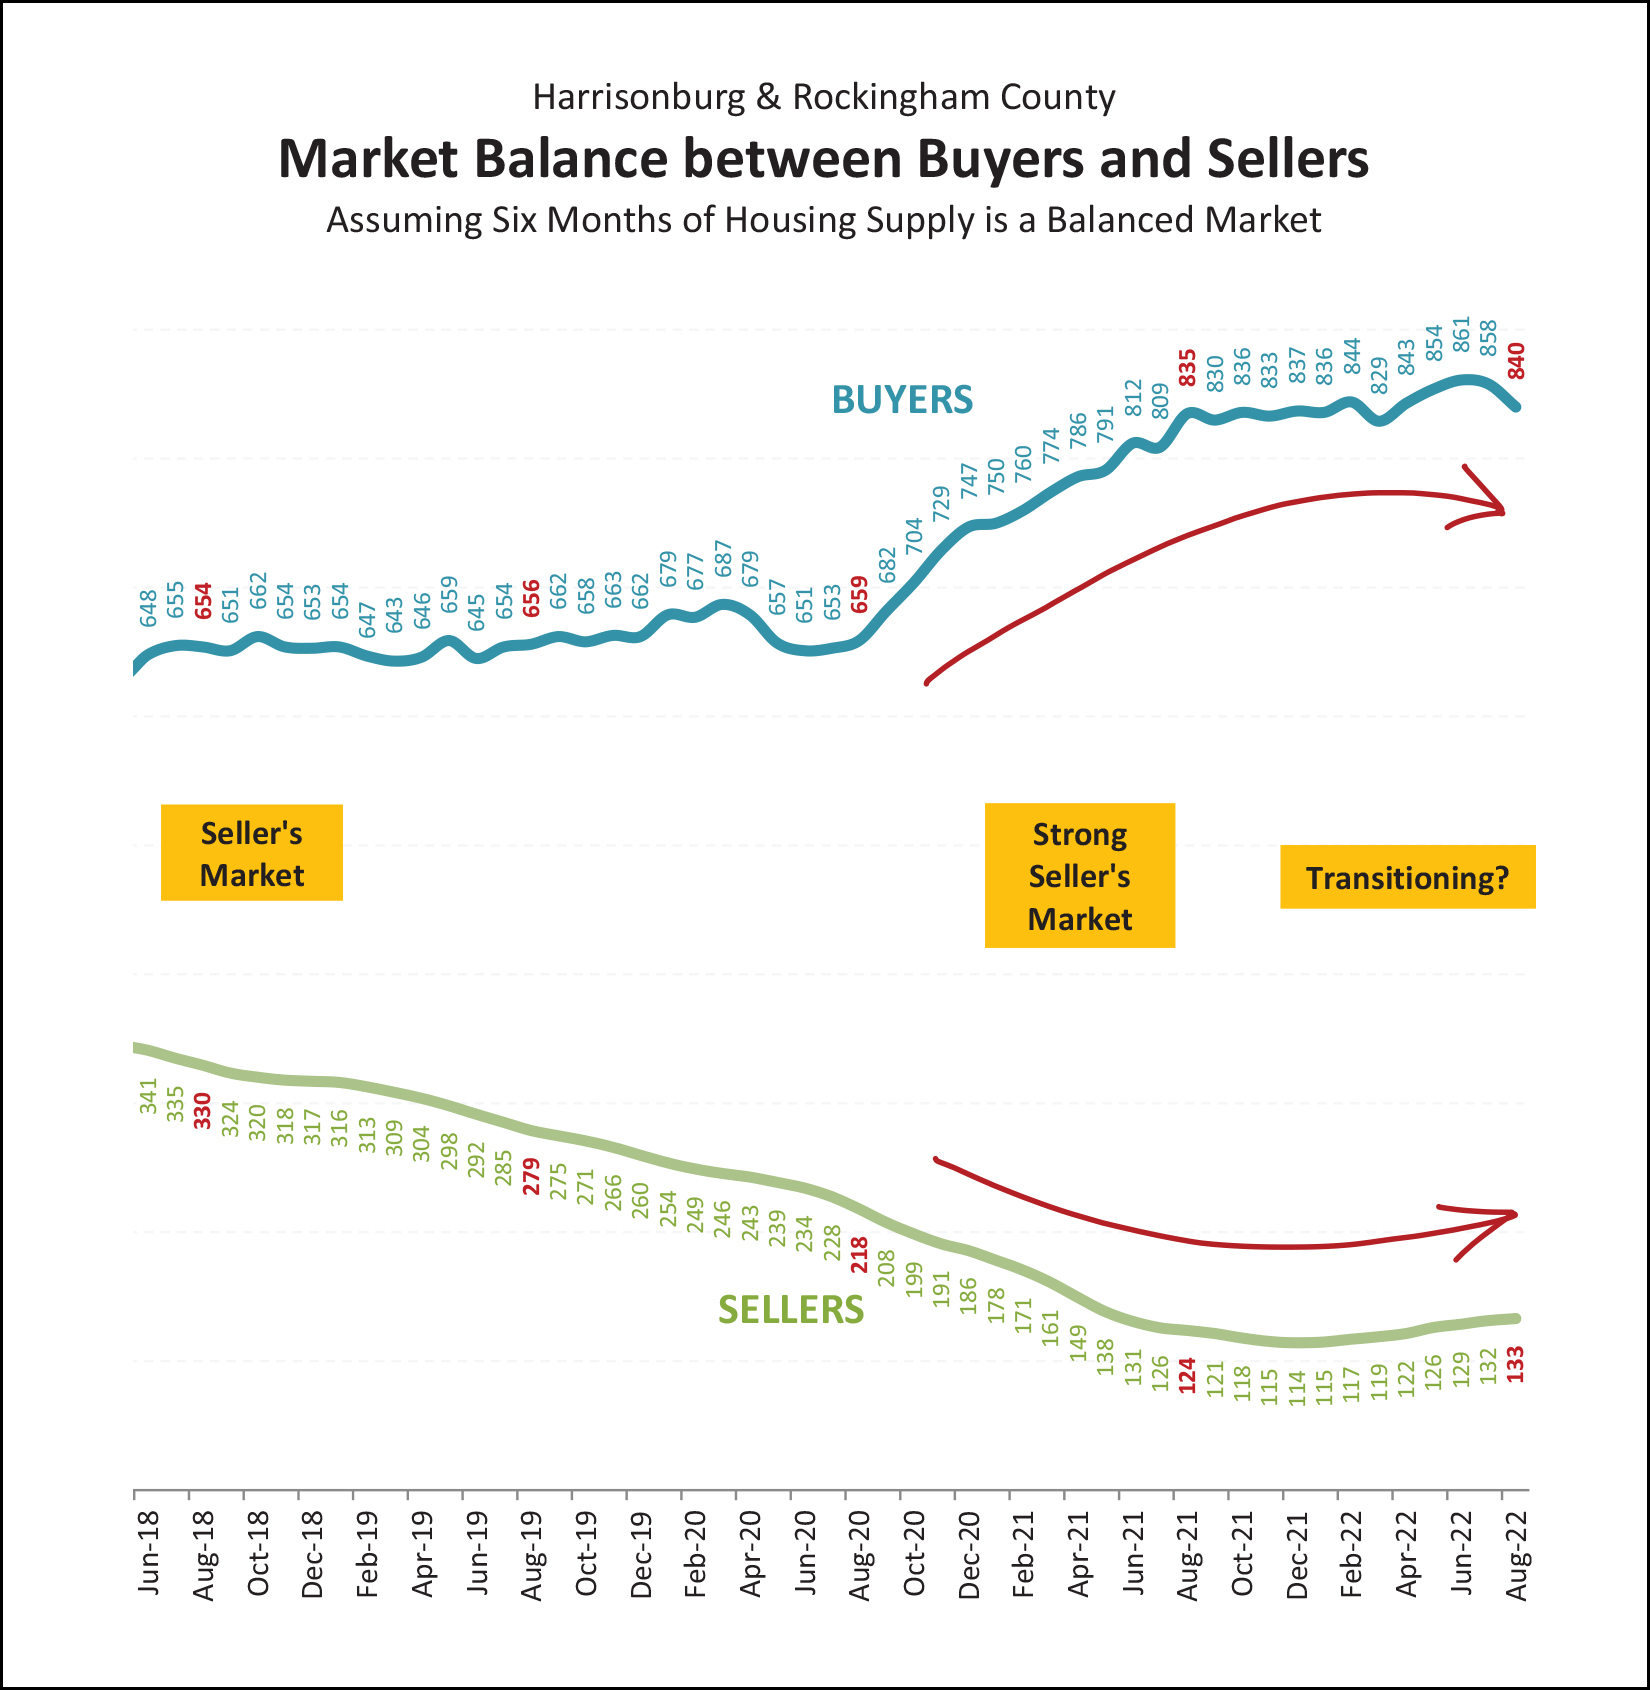 I've drawn the arrows above to show where I think things have been going and are going... Top Arrow = slight, slow, decrease in the number of buyers buying Bottom Arrow = slight, slow, increase in the number of sellers selling as it relates to active inventory at any given time So, indeed, the market may be transitioning a bit. A few fewer buyers are buying and a few more sellers are selling. These dynamics are turning our market, ever so slightly, towards a slightly less strong seller's market. But, yes, still a strong seller's market. Several times in this synopsis I have spoken about home sales slowing and referenced that I anticipate a further slowdown in the next few months. Here's why... 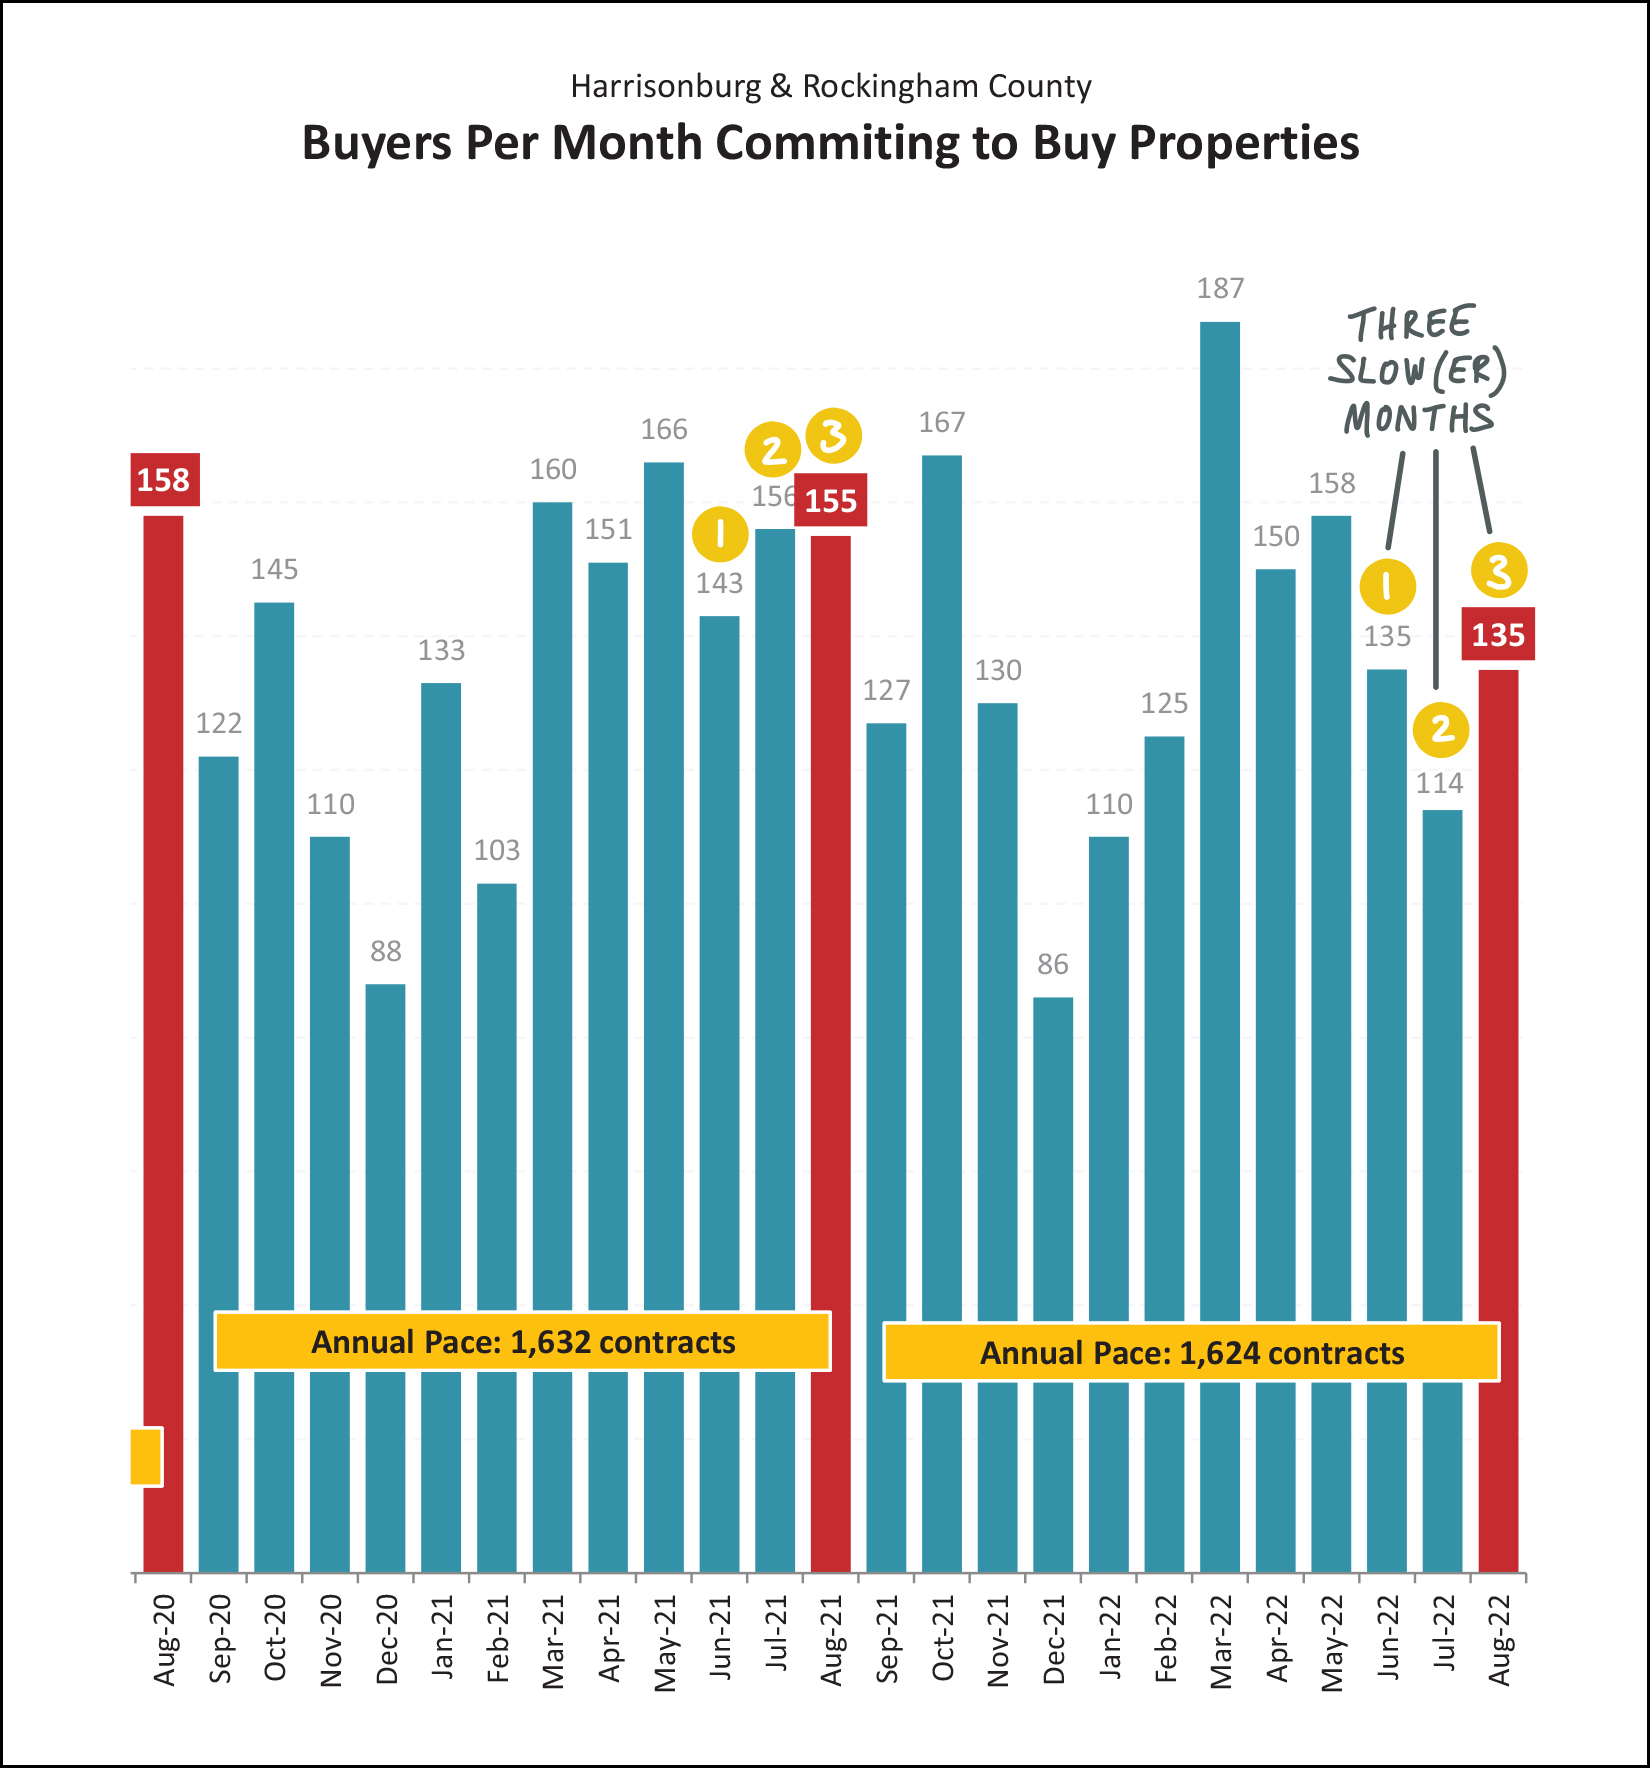 The graph above is showing us contract activity per month in Harrisonburg and Rockingham County... counting how many homes go under contract each month. Last summer (the first set of 1, 2, 3) there were 143, 156 and 155 contracts signed for a total of 454 contracts. This summer (the second set of 1, 2, 30) there were 135, 114 and 135 contracts signed for a total of 384 contracts signed. So, indeed, fewer contracts for several months in a row has already started to translate into fewer home sales, and will continue to do so for at least another month or two in the future. With slightly fewer buyers buying are we seeing inventory levels starting to rise? Slightly... 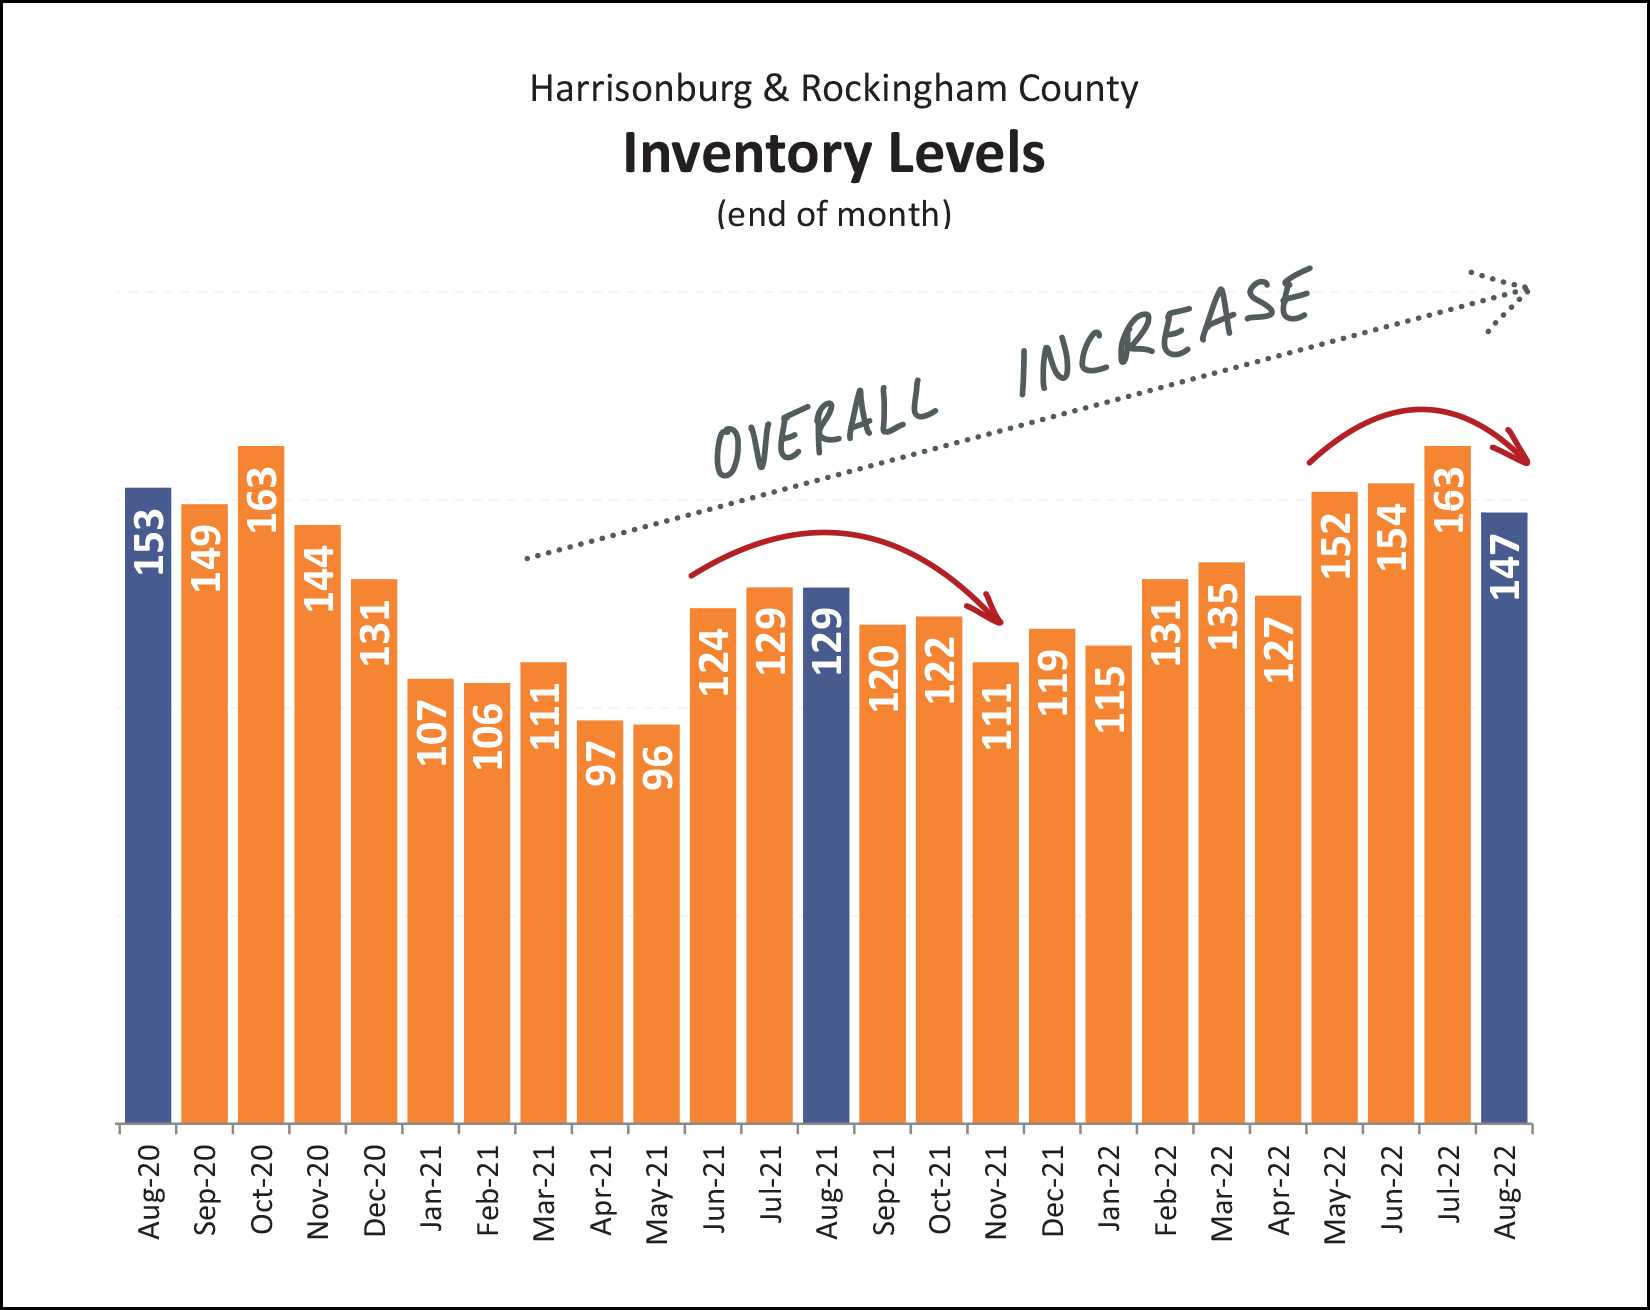 A year ago there were 129 homes on the market for sale at this time... and that has risen, slightly, to 147 homes for sale. So, yes, we are seeing somewhat of an overall increase in the number of homes for sale... but not by that much. And... from a shorter term perspective, inventory levels are currently trending down as they usually do as we move from summer into fall. Finally, one last graph for a bit of AHHHHH and GRRR... 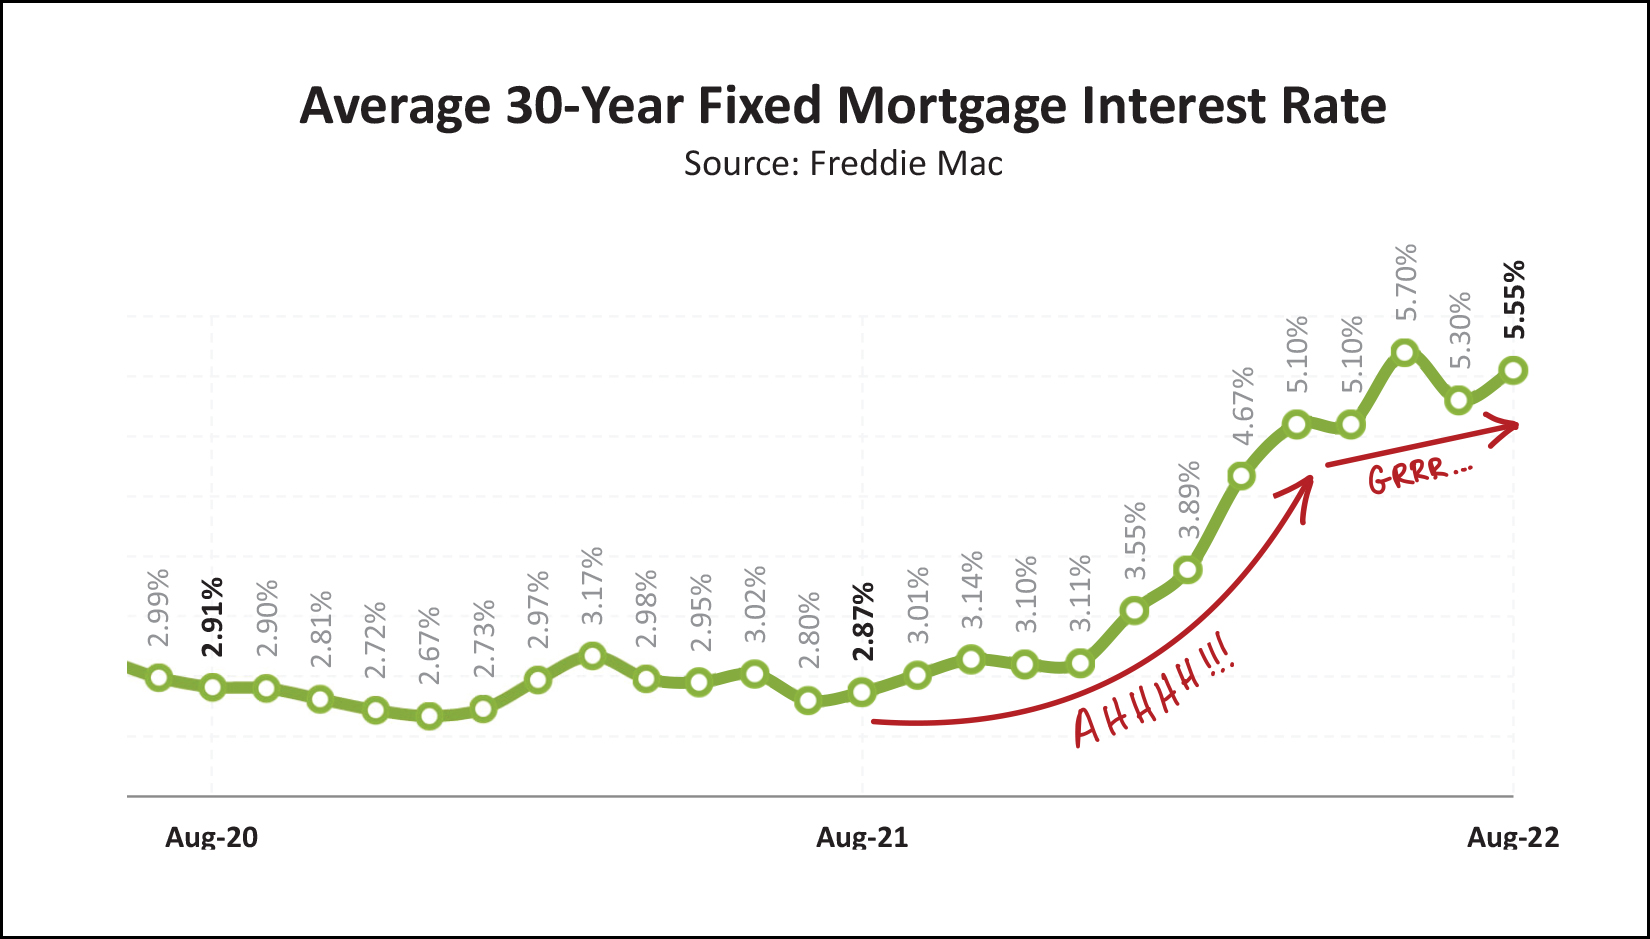 From the end of last summer (Aug 2021) through early 2022 we saw a rapid increase in mortgage interest rates. They rose from less than 3% up to over 5% in only eight months. Ahhhhh!!! Over the past few months, mortgage interest rates have shown they might not get all the way to 6%, but they haven't made their way back down to, or below 5%. Grrr... Comparably higher mortgage interest rates (as compared to the past few years) continue to have an impact on how many buyers are able to, or are willing to, buy a home right now... and it doesn't seem that these higher interest rates will be leaving us as quickly as they showed up. So... in summary... [1] The pace of home sales seem to be slowing, slightly, though 2022 is still ahead of 2021 at this point. [2] Contract activity is slowing, slightly, which means closed sales will also continue to slow. [3] Home prices continue to rise rapidly. [4] Inventory levels are rising, slightly. [5] Mortgage interest rates are still quite high. If you're thinking about buying a home, or selling a home, let's talk about how things are going in your segment of the market as it relates to the price, size, location and age of your home. The first step? Email me or text/call me at 540-578-0102. I'll check in on the market in about a month, but until then, enjoy the slightly shorter, cooler days ahead! | |
Indeed, Fewer Homes Went Under Contract This Summer Than Last |
|
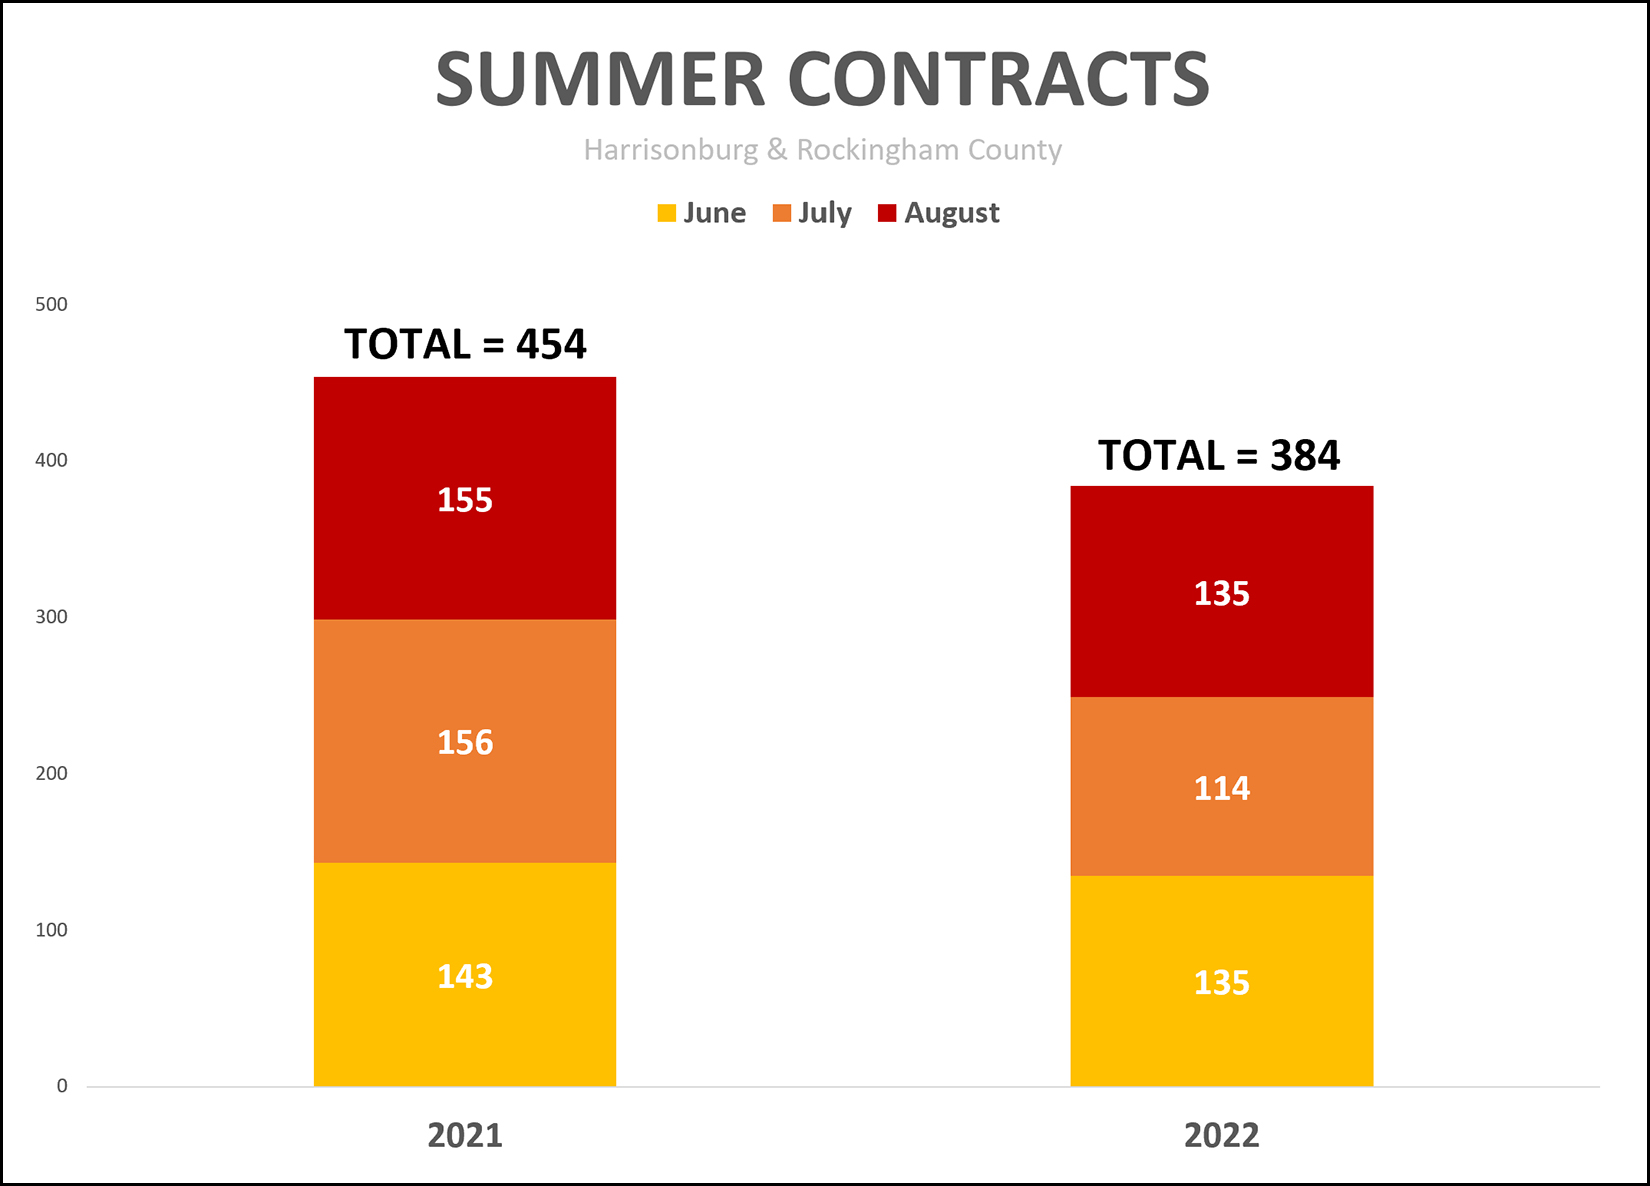 Indeed, as is shown rather clearly above, fewer buyers signed contracts to buy homes this summer than last. When I'm talking summer, in this instance, I'm referring to June, July and August...
So, about 15% fewer contracts were signed this summer than last. Why? A large part of it is likely the higher mortgage interest rates.
But despite fewer houses going under contract this summer than last...
If mortgage interest rates remain as high as they are now, it is reasonable to assume that home buying activity will continue to be a bit subdued this fall compared to last fall. | |
Just As Many Homes Are Selling Over Asking Price Now As Compared To In 2021 |
|
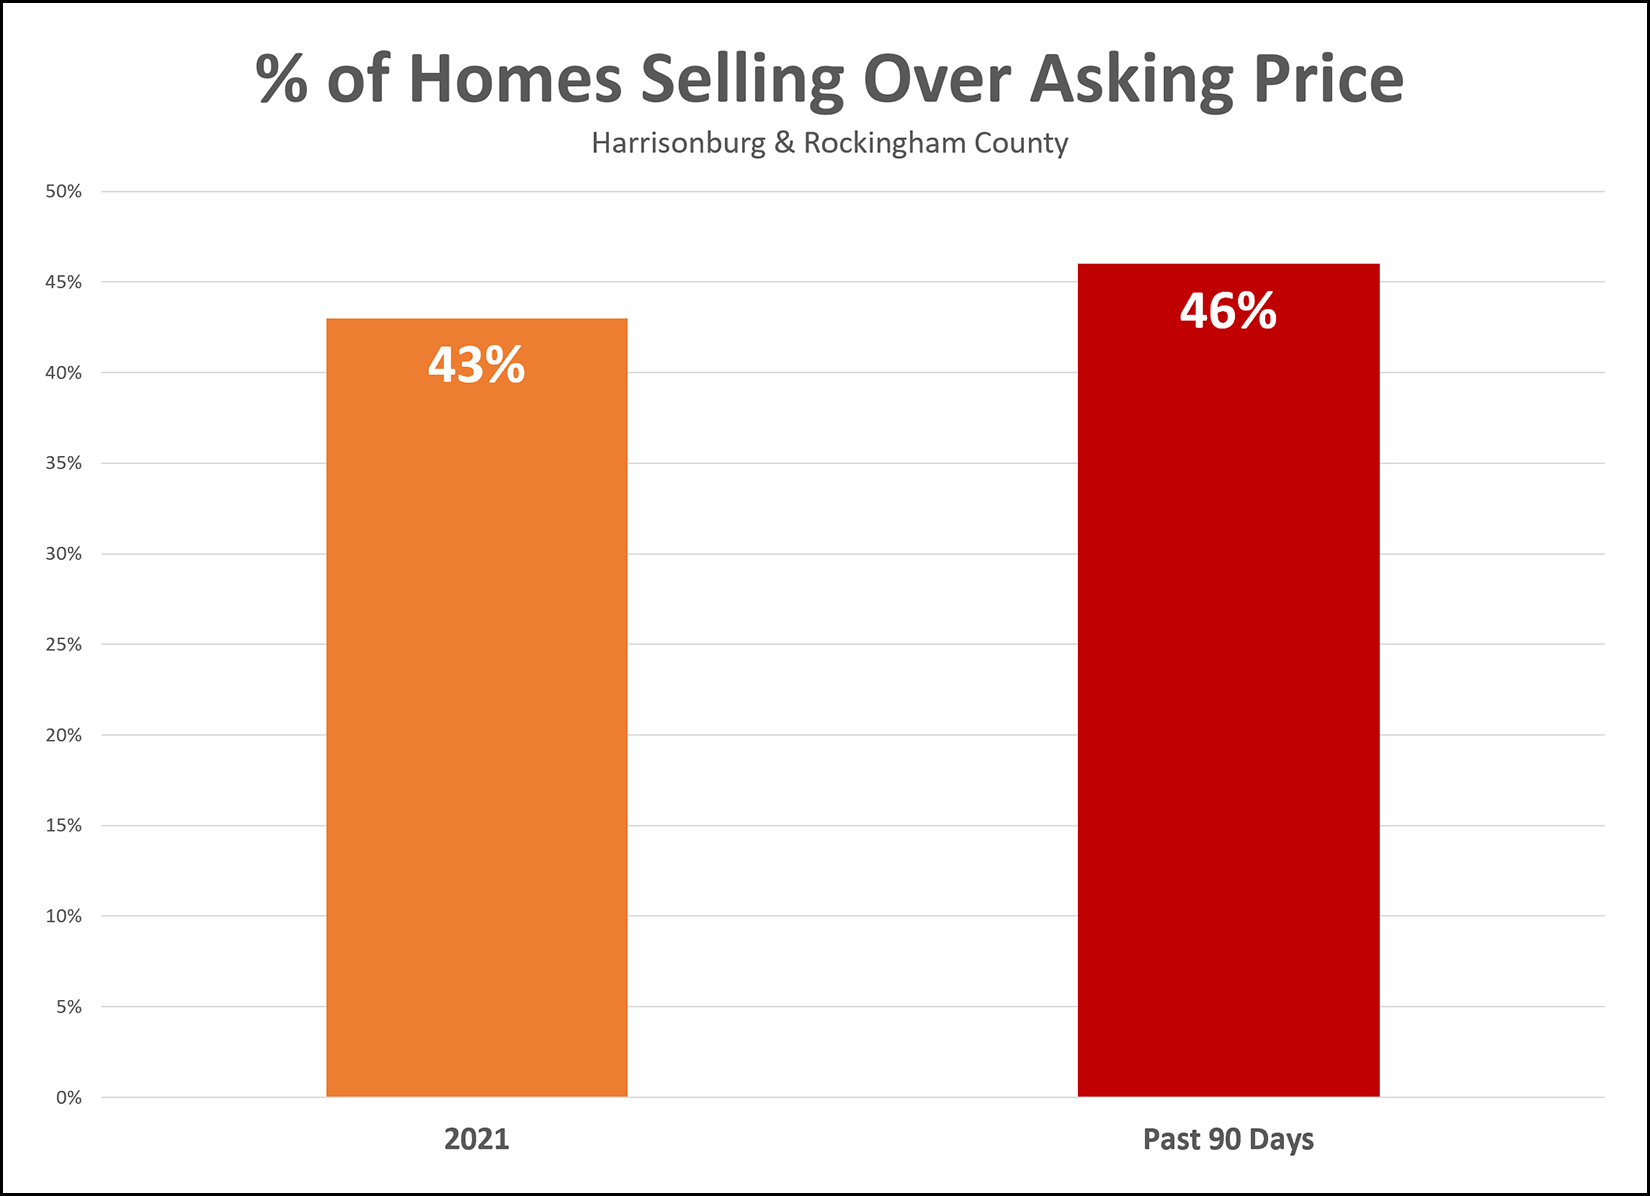 This statistic might surprise you. It surprised me. Just as many homes are selling over the asking price now (in the past 90 days) as compared to in 2021. And, technically, slightly more are selling over the asking price now as compared to in 2021. Sometimes it seems that the market might be "slowing down" in some ways... with fewer showings and/or fewer offers in the first week of a house being on the market. But then, you see that we're still seeing about half of homes selling for more than the list price and it doesn't seem like things are slowing down at all!?! | |
Is The Last Item On Your Back To School Shopping List... A House? |
|
 Happy first (or second) week of school! It's at this time of year -- over the next few weeks -- that we often see a surge (or mini-surge) of home buying activity. Summer vacation is over, school is starting back up, and some folks will find themselves ready to make a move... buying for the first time, or buying a new home to upsize or downsize. Home sales activity is often topsy-turvy in the summer, affected by everyone's summer plans. Sellers put their houses on the market based on when they are around to prepare it for the market. Buyers go see houses and make offers based on when they are around to do so. But now, people will start settling back into their normal routines, and many may decide this is the time to contract to buy a home. None of this, of course, is based on hard, cold, data... just a general observation I have made over the years. We'll see what the numbers actually show as we move through the next month or two. If you're engaged in school, as a student, a teacher, a parent of a student, or otherwise... may your school year be off to a good start! | |
Harrisonburg Housing Market Still Showing Strength Despite Some Signs Of Slowing |
|
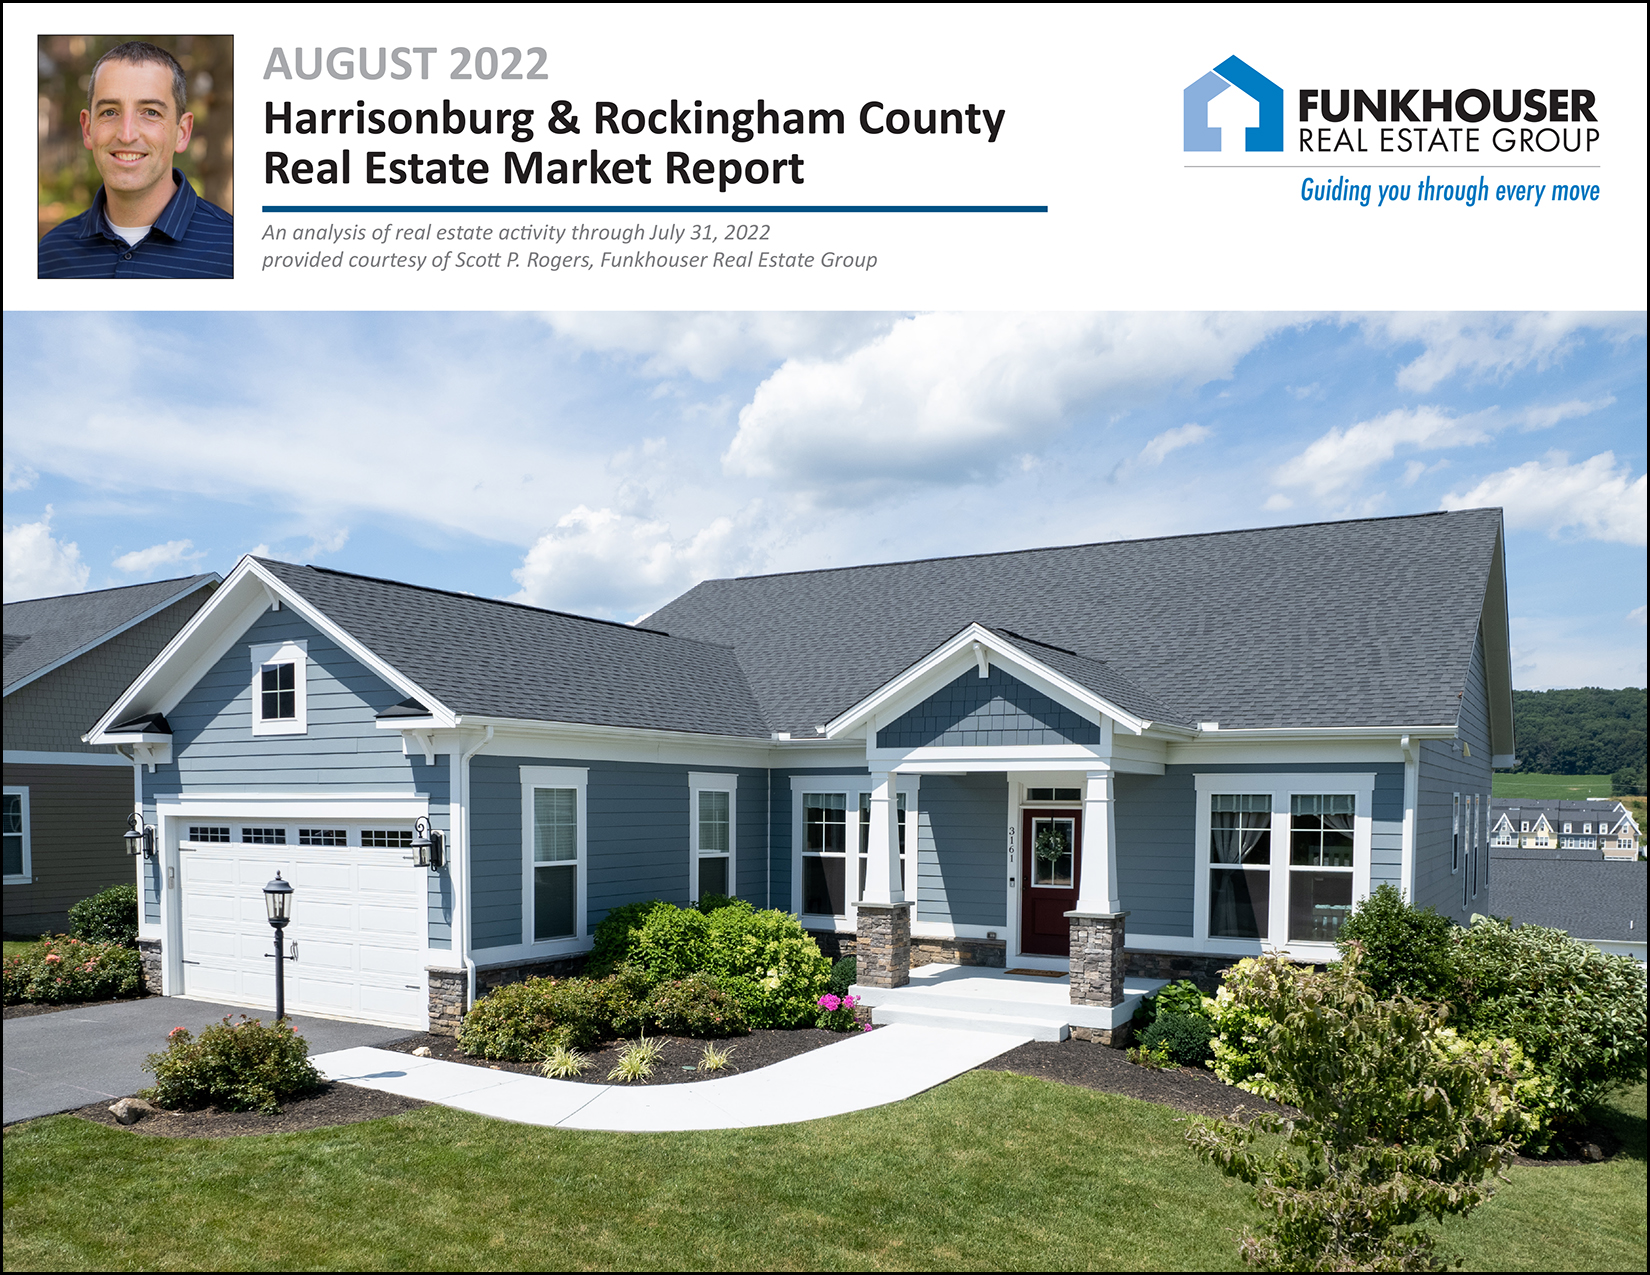 Happy Thursday afternoon, friends! As any student or teacher will tell you, summer is almost over! čśó I hope that you and your family had a wonderful summer and that you had at least one opportunity to sneak away... to the beach, the lake, a tropical island, a music festival, a rural AirBNB, a national forest, a campsite or a new city! One of my favorite spots to sneak away is Deep Creek Lake, MD... 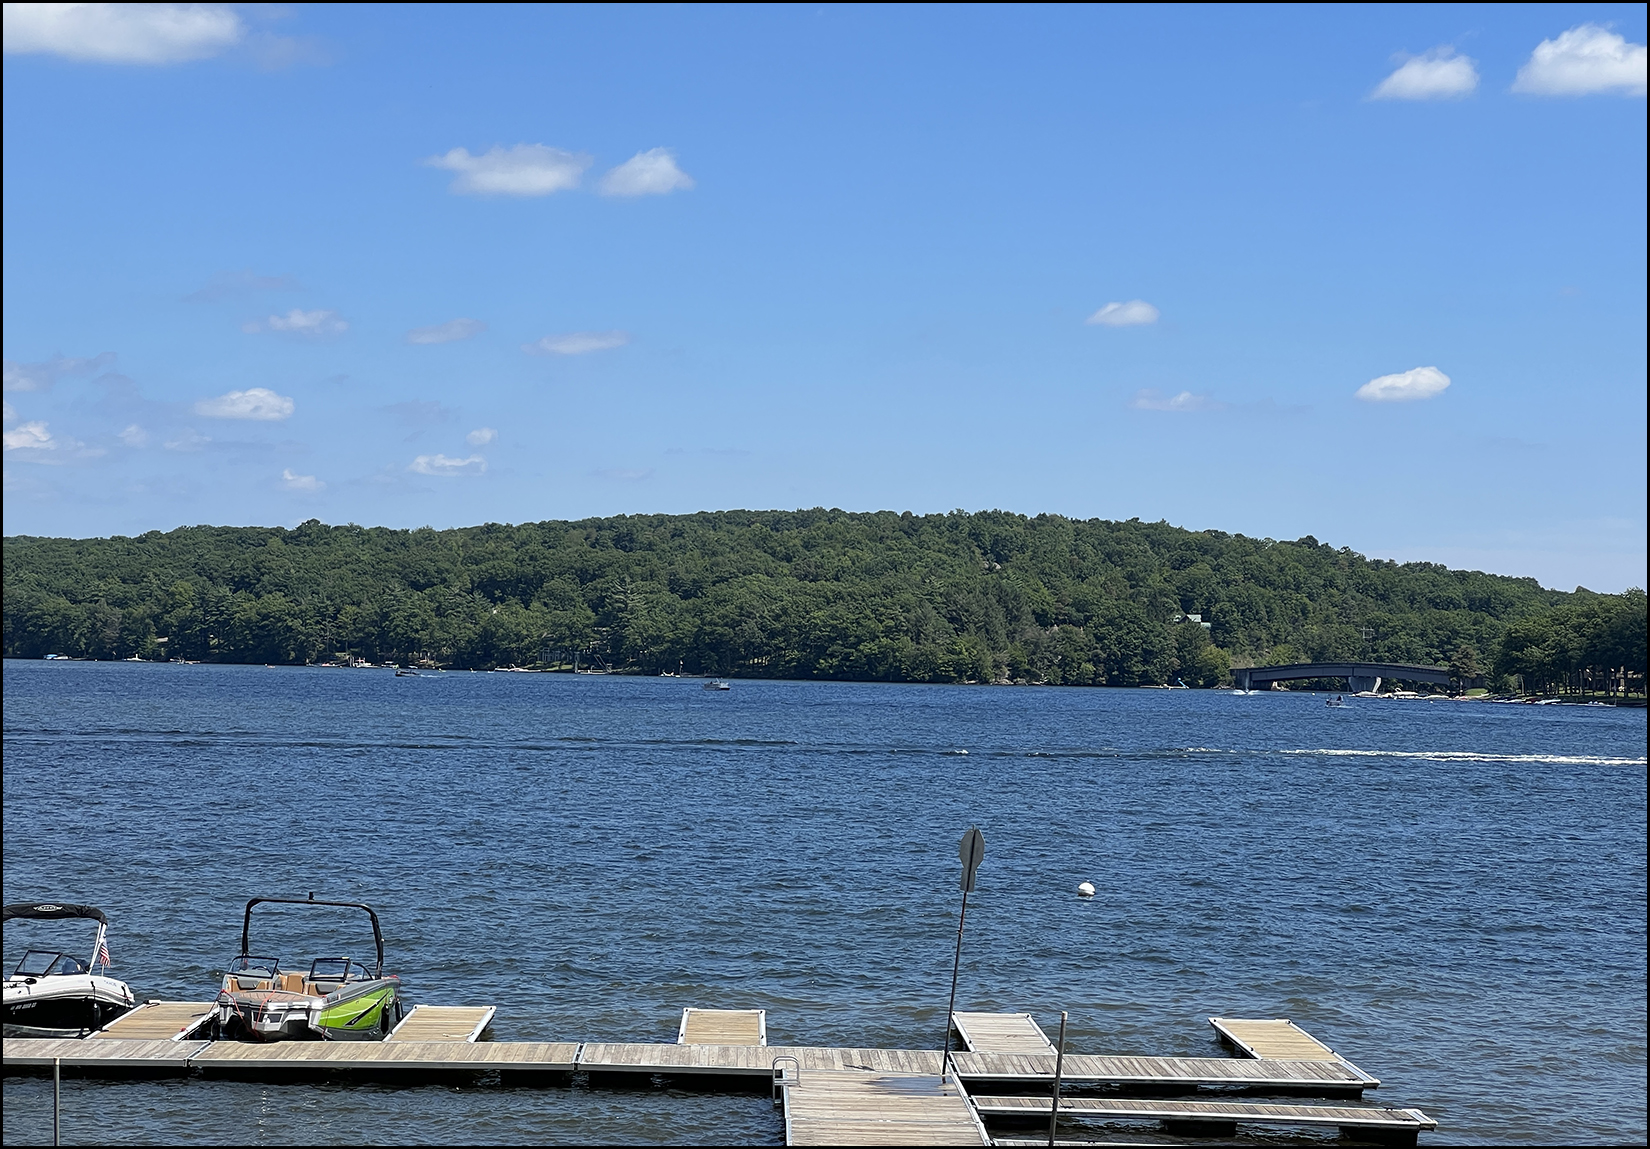 But getting back to business... The beautiful house on the cover of this month's market report is located at 3161 Henry Grant Hill in Preston Lake and you can find out more about this spacious home here. Each month I have a giveaway, of sorts, for readers of this market report. This month's giveaway requires a special sort of market report reader... one who also likes to run... a lot. I enjoy running and frequently participate in races put on by VA Momentum, and thus I was excited to hear they are putting on a half marathon this fall. So... this month, you can enter for a chance to win a free registration to the Harrisonburg Half Marathon, to be held on October 15, 2022! Find out more about the half marathon here. Enter to win the free race registration here. Email me and tell me I'm crazy for thinking you'd run a half marathon here. čśë And now, after all that, let's dig in and see what is happening in our local housing market... 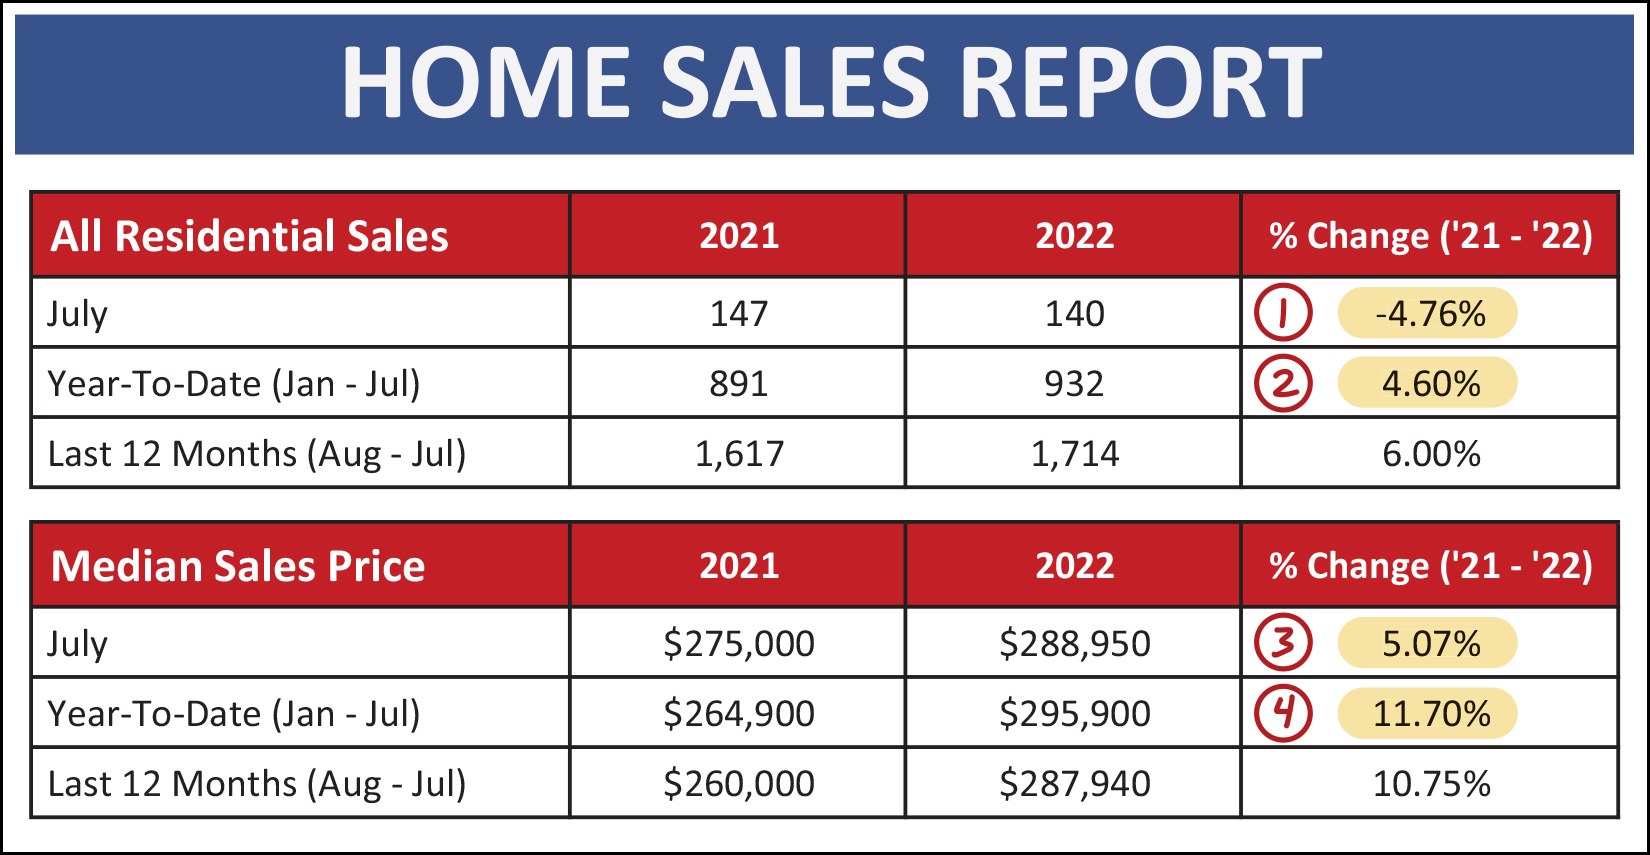 As noted in my headline above, there are some signs that our local real estate market might be slowing down a bit. This very well may mean, though, that it slows down from going 90 MPH in a 60 MPH zone to going 75 MPH in a 60 MPH zone. The latest numbers, as shown above, indicate that... [1] July home sales were slower (140) than last July. We'll see this again on a graph in a moment. [2] Thus far this year we have seen 932 home sales, which is 4.6% more than last year. We had a record number of home sales last year, so a further increase this year is... record breaking. [3] The median sales price in July was 5% higher than last July. [4] When looking at the first seven months of the year, the median sales price has risen 11.7% in Harrisonburg and Rockingham County. So... most of these indicators are quite positive, rosy, exuberant, except the slight slow down in July. This is seen a bit more clearly here... 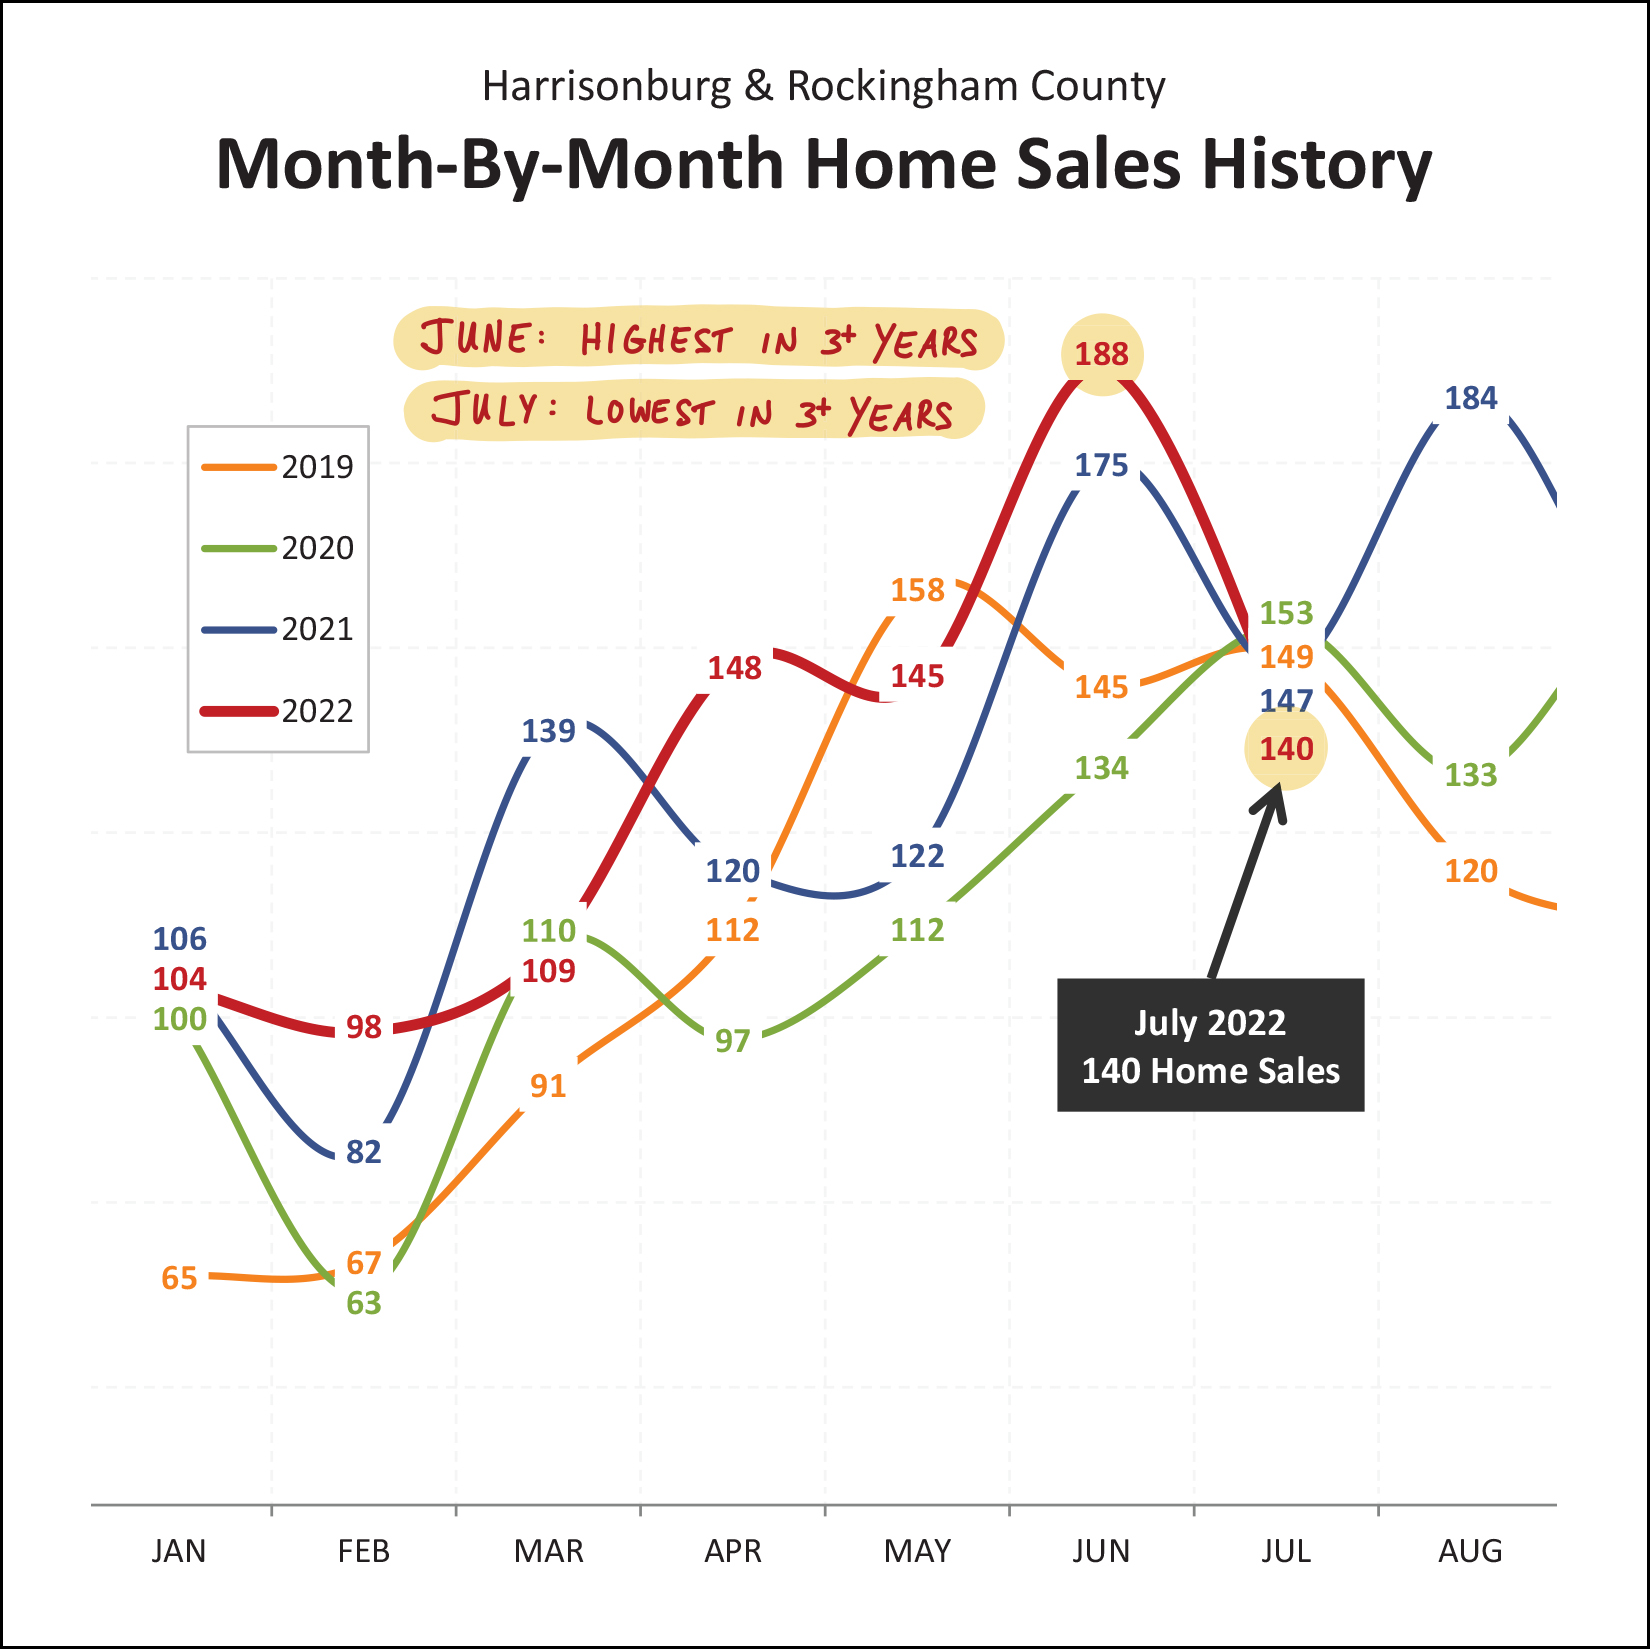 Above, you'll note that in June 2022 we had an astronomical 188 home sales... higher than any of the past three months of June. But, then, July. In July 2022 we only saw 140 home sales, which is less than any of the past three months of July. Some might point out that looking at a single month of housing data, in a small-ish housing market, can make you think something is happening, when nothing is happening. I agree that can happen. If we smash the two months together, we find that there have been 328 home sales this June and July... compared to 322 home sales last June and July. So... maybe things are "just fine" right now, and maybe things are starting to slow, slightly. 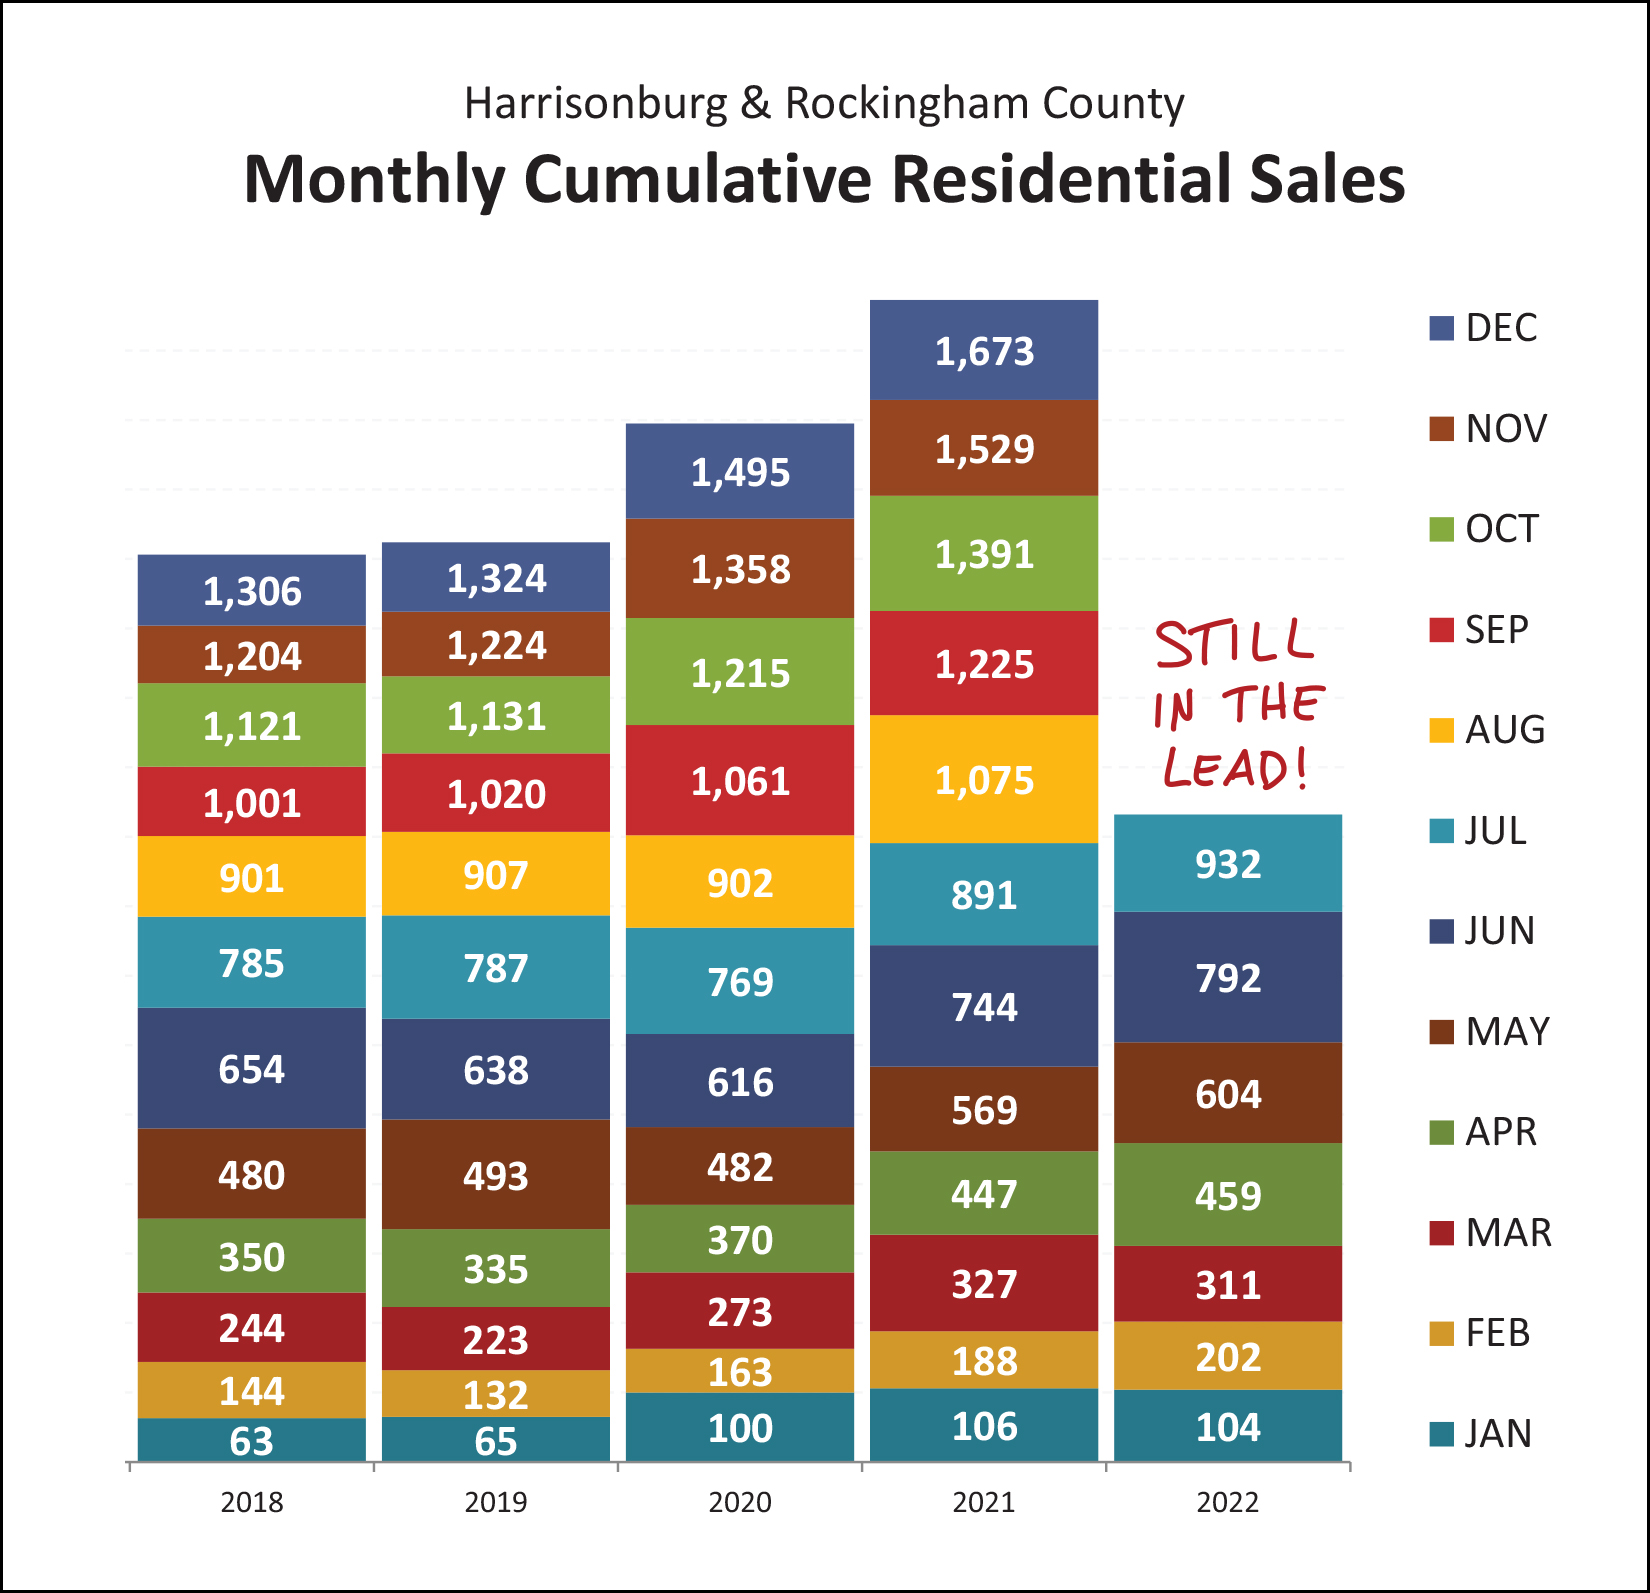 As shown above, if things are starting to slow... they're only just starting to do so, and they're doing so verrrrry slowly. The 932 home sales seen thus far in 2022 is more than we have seen in the first seven months of any of the prior four years. Perhaps when we get another month or two into the year we will see things level out a bit in 2022? 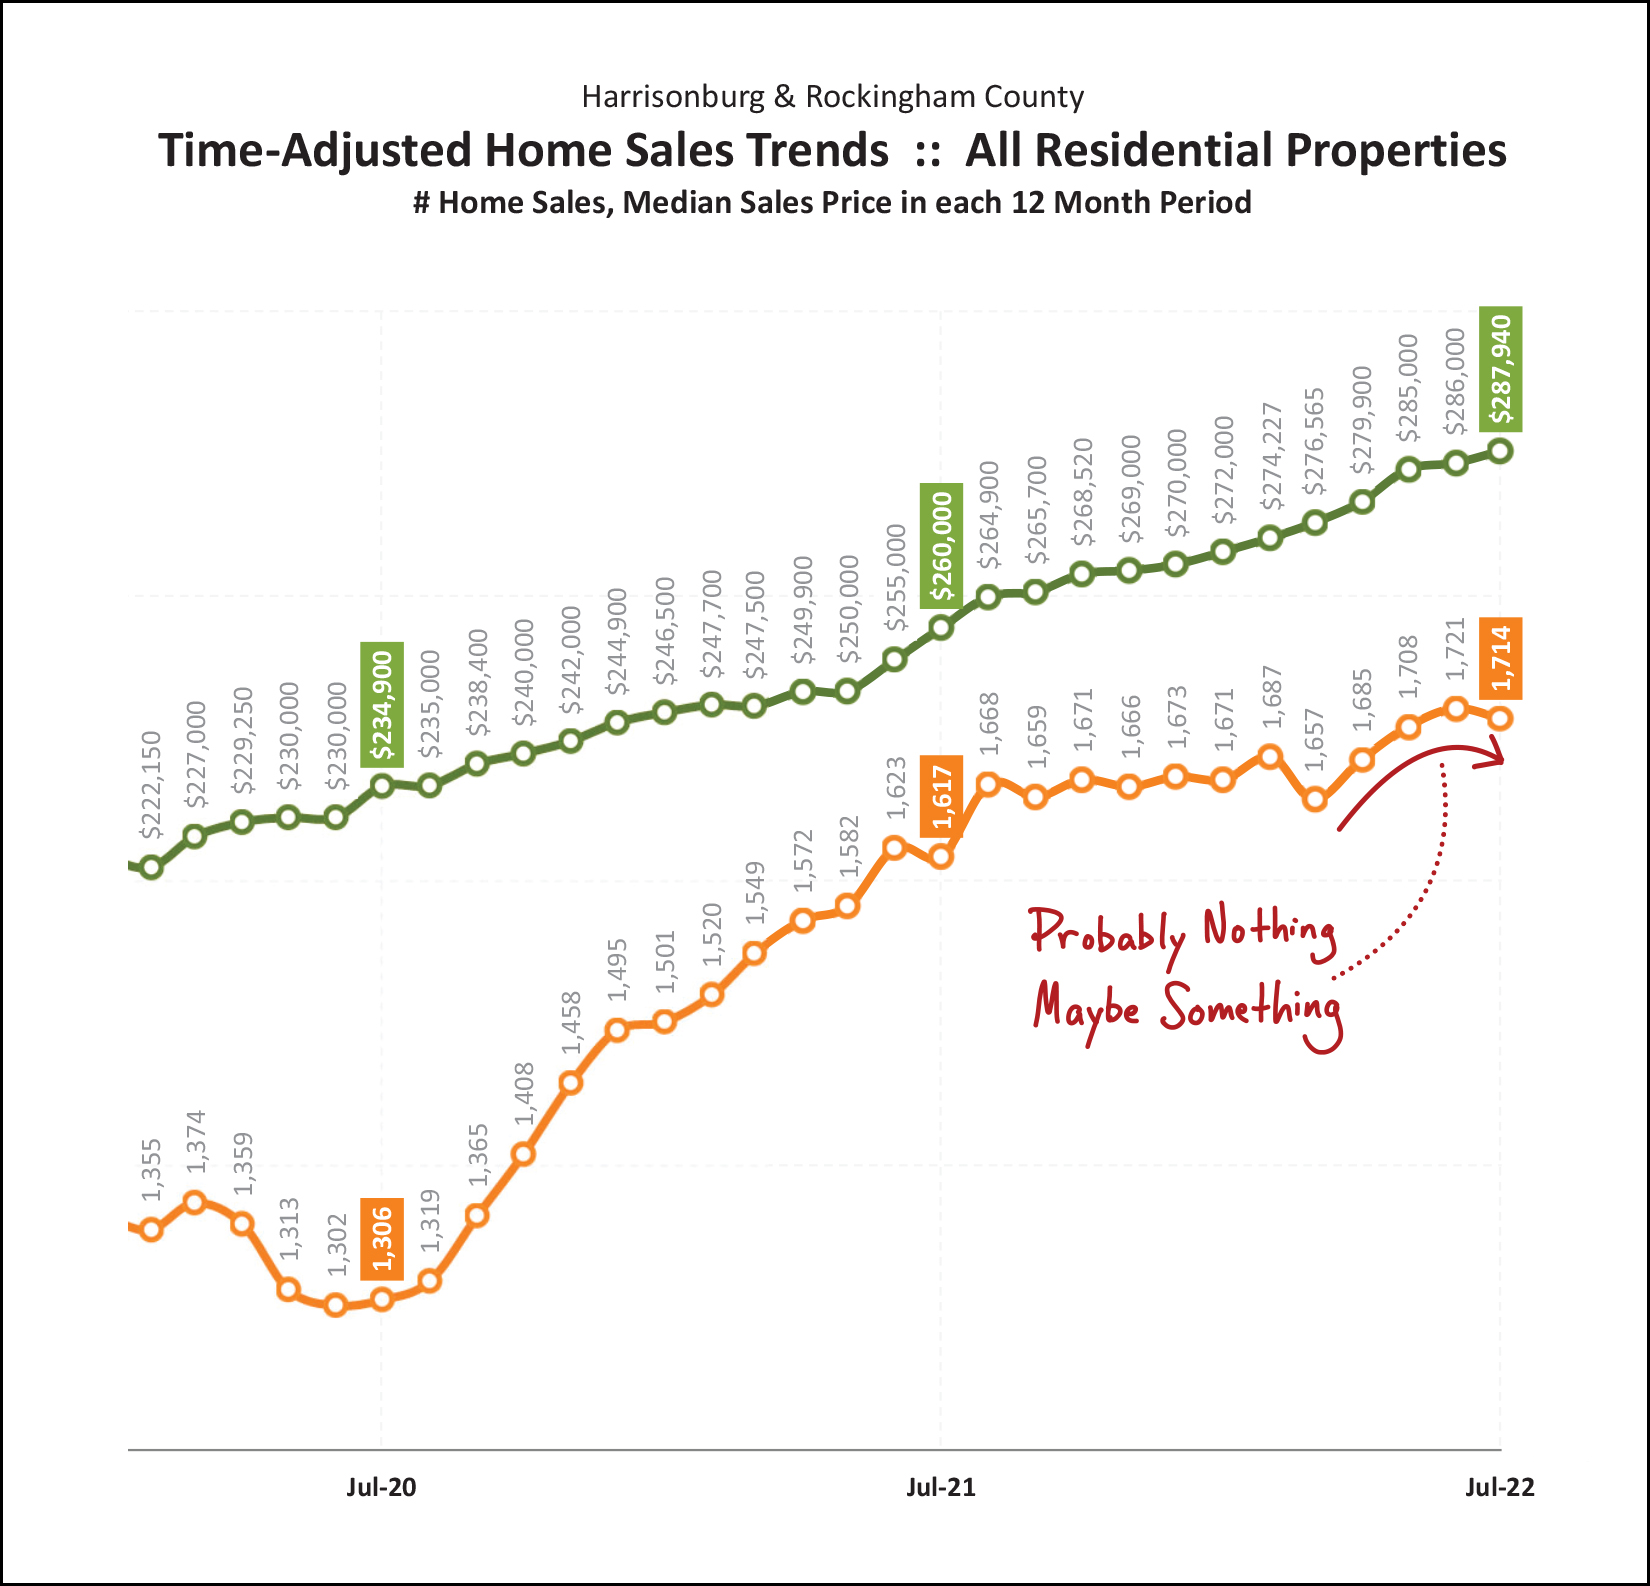 Slicing and dicing the data once more, this graph (above) measures (each month) the number of sales in a 12 month period as shown with an orange line, and the 12-month median sales price (measured each month) shown with the green line. As you can see at the end of the orange line, it's possible that the overall pace of home sales is slowing a bit... but then again, maybe not. We'll need to watch this for a few more months to know for sure. Speaking of the future, our most reliable indicator of future sales is... current contracts... 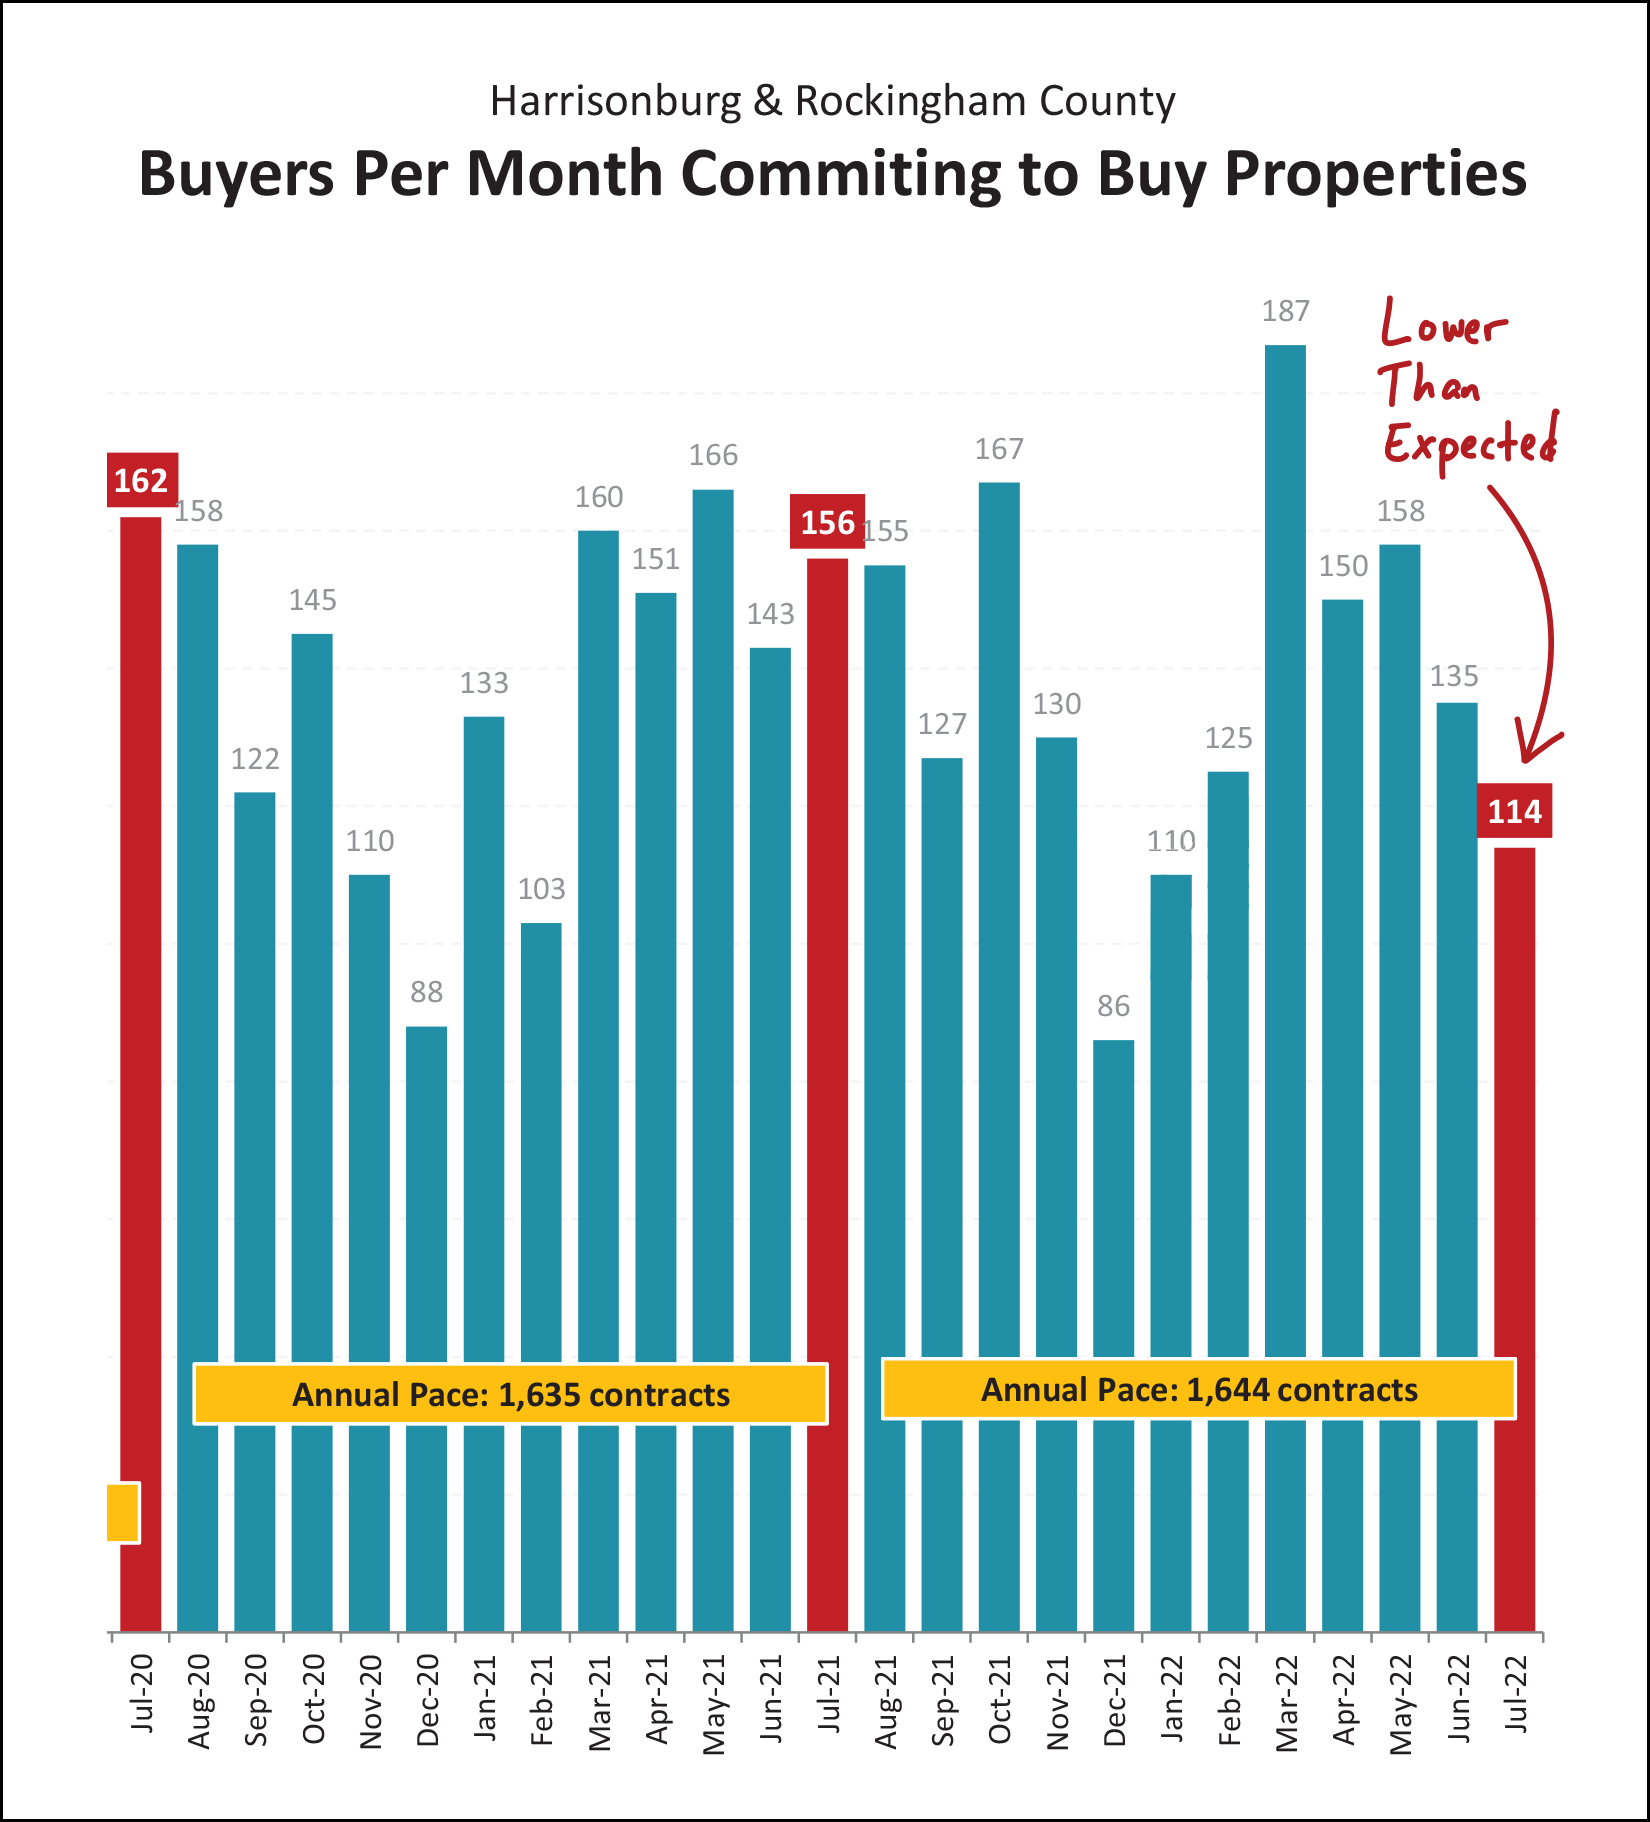 This one surprised me a bit. We usually see around 150 to 160 contracts signed in any given month of July. But... not this July. There were only 114 contracts signed in July 2022, which is much lower than usual, and likely means we will see a lower than usual month of closed sales in August and/or September. This falls to the category of "things that make you say hmmmm...." and this will definitely be a trend we will need to continue to monitor. Somewhat fewer buyers signing contracts might mean that inventory levels would rise a bit... 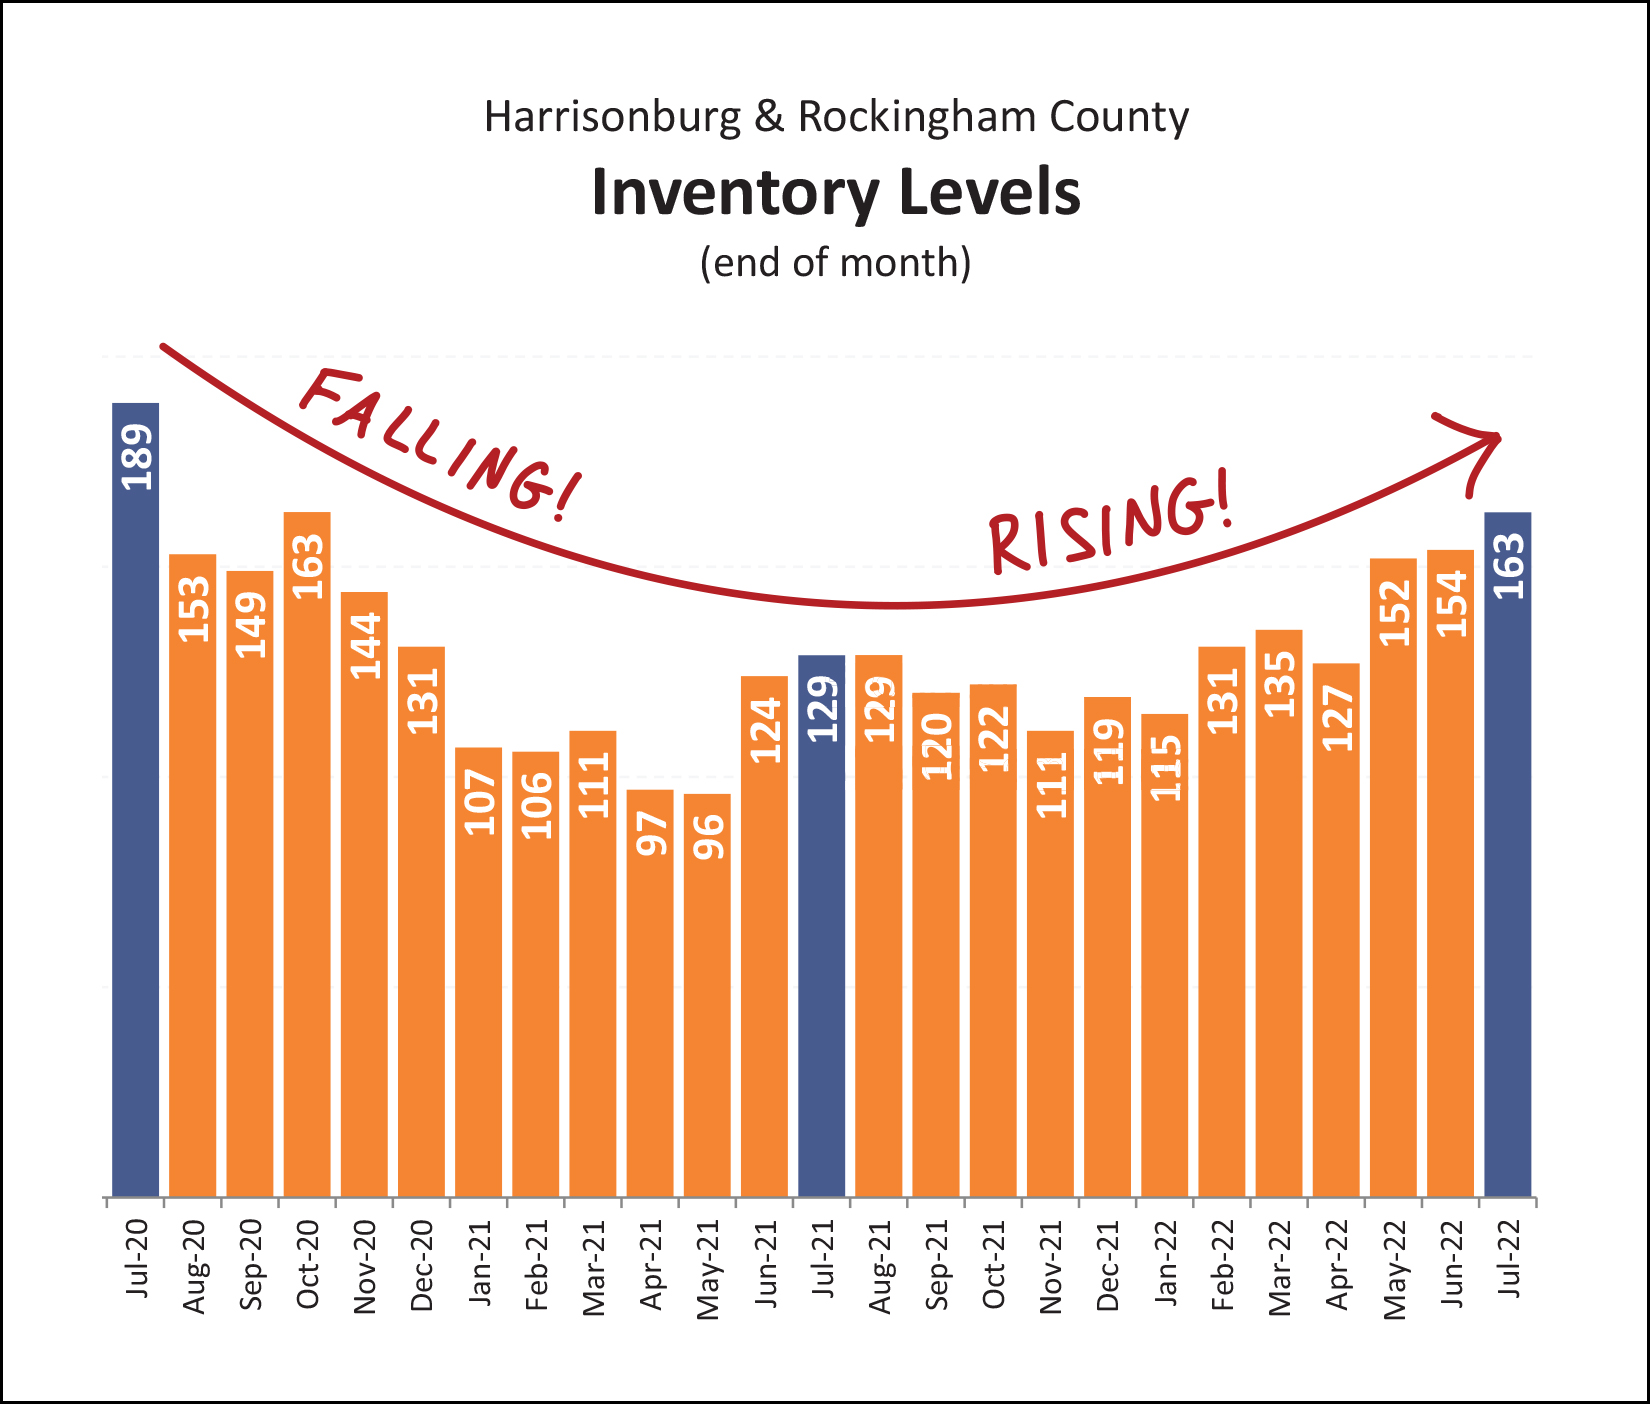 Indeed, we are starting to see inventory levels creep up a bit. There are now 163 homes for sale in Harrisonburg and Rockingham County, which is a bit more than the 129 we saw at this time a year ago. It is important to note, though that these "slightly higher" inventory levels are really still VERY, VERY low. Many or most buyers in most price ranges and locations still have very few options of homes to buy right now. So, yes, inventory levels are creeping up a bit, but don't think that's necessarily giving buyers more choices... or giving buyers more leverage... at least not at this point. So... a few fewer sales... fewer contracts... slightly higher inventory levels... that probably means that homes aren't selling as quickly, right!? Well... 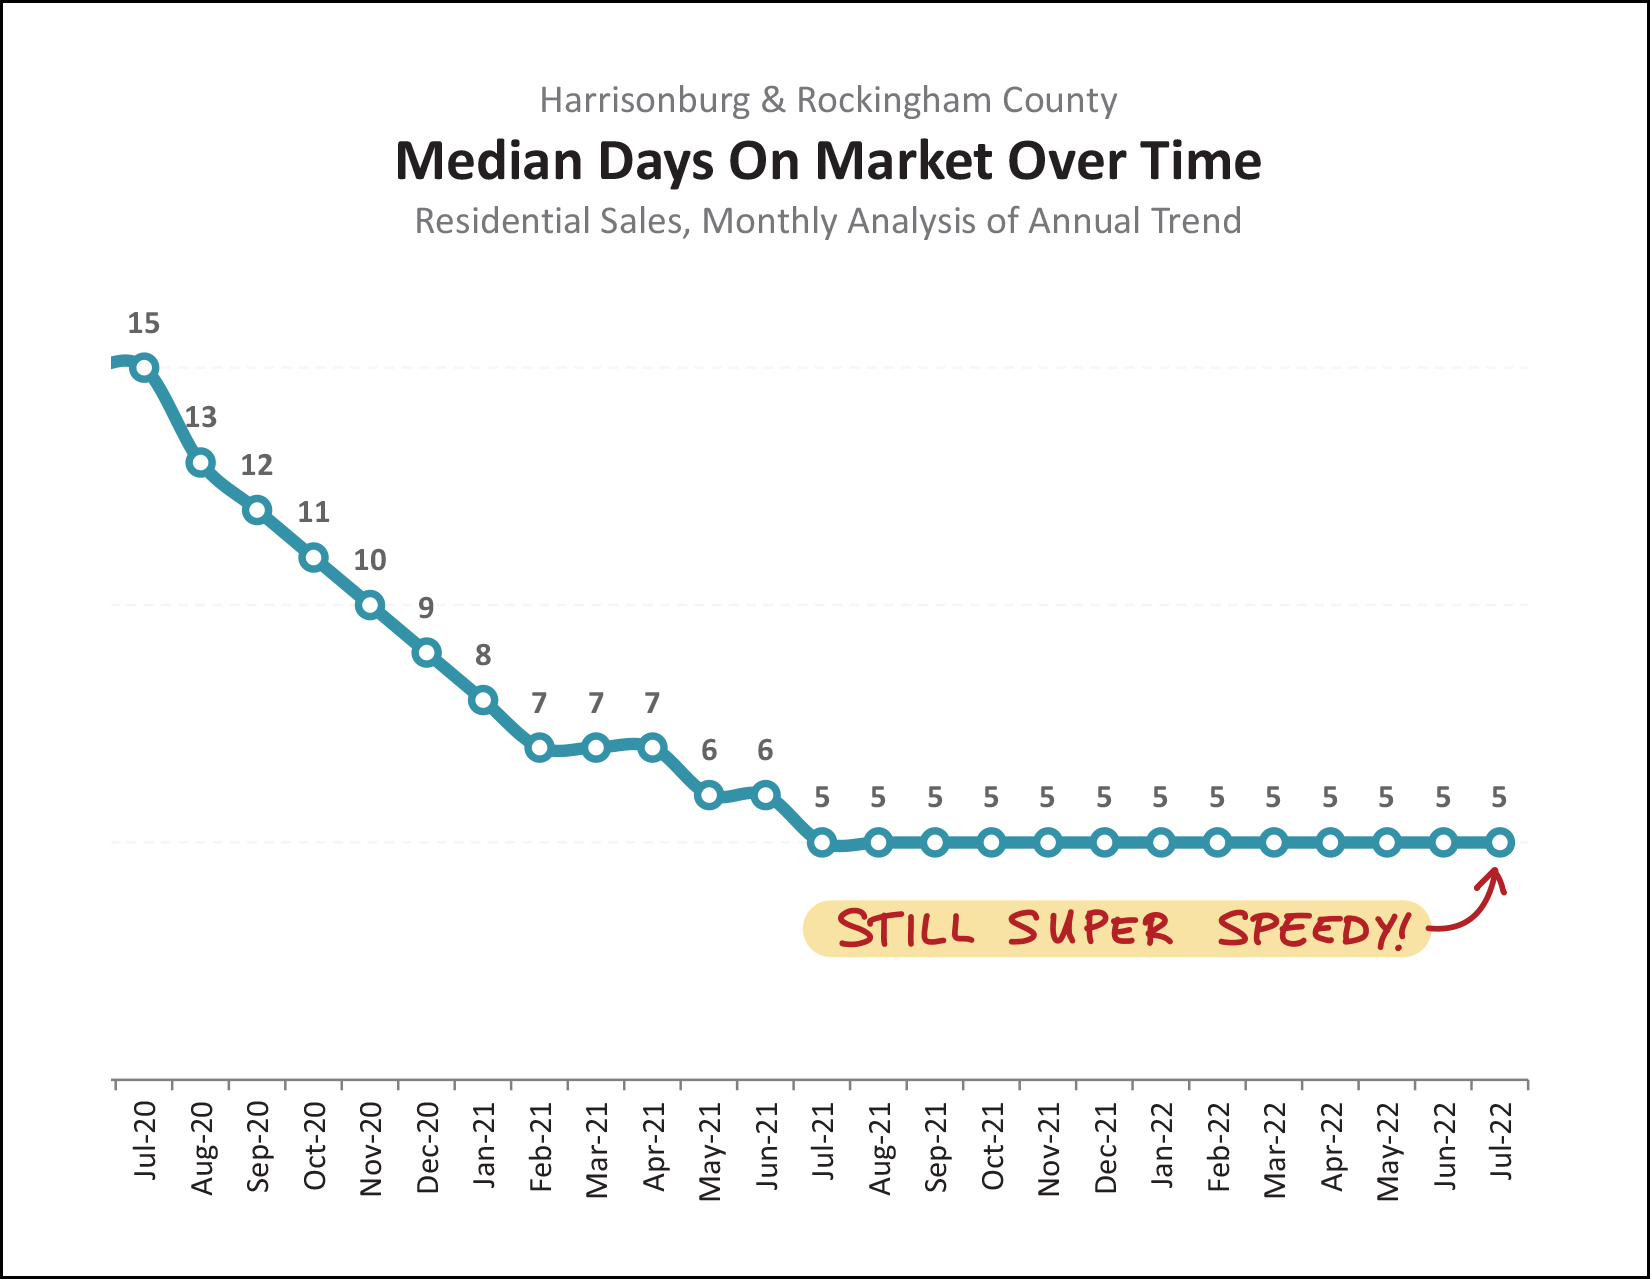 Looking at the 12 months of home sales prior to July 2021 (a year ago) the median "days on market" for those sales was only five days. That metric has remained constant for 13 months now... and today, when looking backwards by a year, the median "days on market" is still just five days. Narrowing the focus even more, to just the 114 properties that went under contract in July 2022, we might expect to see a higher "days on market" -- and we do -- but only barely. The median days on market during July 2022 was... six days. So, homes are still going under contract very, very quickly! Finally, maybe this (below) is a contributing factor to the slight slow down over the past 30 to 45 days? 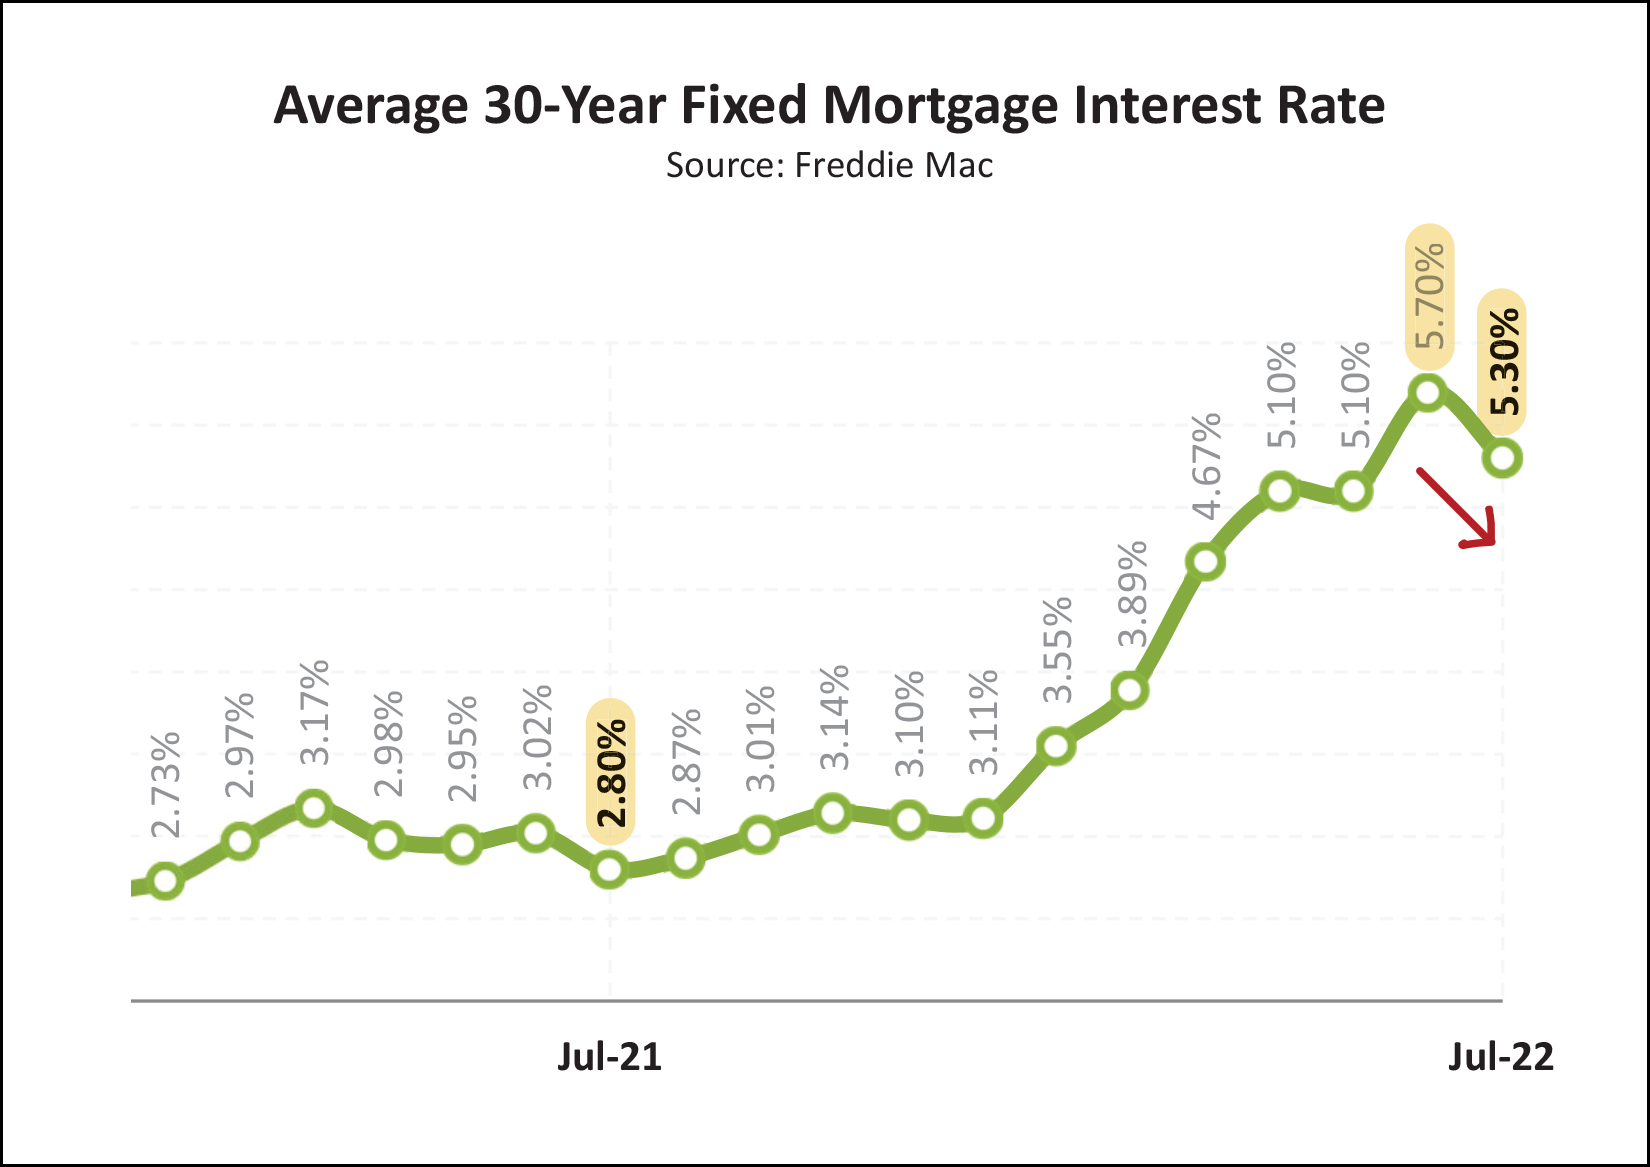 A year ago, the mortgage interest rate was 2.8%. Six months ago it was 3.55%. During June and July it was as high as 5.81%, though it has started to decline now. It is quite possible that these higher mortgage rates have caused some buyers to not be able to buy any longer... or that it has at least partially dampened their enthusiasm. So, there you have it, friends. The housing market in Harrisonburg and Rockingham County is still showing great signs of strength with more sales than ever, at higher prices than ever. But... we might be seeing a slight slow down in home sales (from record high levels) and we might be seeing a slight increase in inventory levels (from record low levels). We'll have to give it a few more months to see how things continue to develop in the local market to know for sure. Until then... If selling a home is on your mind, let's talk sooner rather than later. Before you know it, we'll be halfway through fall and headed into winter. If you are planning to buy a home soon, let's start watching for new listings of interest and going to see them quickly when they hit the market. If I can be of any help with the above (selling, buying) please call/text me at 540-578-0102 or email me here so we can talk about working together to navigate your way through the ever changing Harrisonburg real estate market. | |
Anecdotally, A Smaller Percentage of Showings Seem To Be Resulting In Offers These Days |
|
 I don't have any data to back this up, but it seems that a smaller percentage of showings are result in offers right now. A year ago, 20 showings might have resulted in 5 to 10 offers. Today, 20 showings seems to be resulting in 2 to 3 offers. It's hard to know what exactly is driving this change... [1] Home prices are certainly higher now than they were a year ago, and maybe it's harder for buyers who look at houses to get excited about paying today's prices as compared to the prices a year ago? Though, a year ago, prices seemed pretty high to most folks as well... [2] Mortgage interest rates are certainly higher now than they were a year ago, and maybe buyers are excited about Home X at Price Y but when they run the numbers and determine Mortgage Payment Z their excitement cools? Though, they could have known that before they decided to go see the house... [3] The housing market was on fire a year ago with no signs of cooling off, whereas now some markets are seeing sales and/or prices level off or decline slightly. So, maybe buyers are a touch more hesitant to act today as compared to a year ago because there is some small amount of doubt of whether home prices will continue to accelerate upwards over the next few years? Though, a year ago, there was some doubt about whether prices would keep accelerating upwards because they had been increasing so quickly up until that time... So, it's hard to say why, but a somewhat smaller portion of buyers who go to view homes seem to be deciding to make an offer on those homes right now. Does this matter to sellers? Not necessarily. [1] Homes are still selling very quickly. [2] Homes are still selling at prices that are very favorable to sellers. [3] Sellers are still often having more than one offer to consider, even if they don't have ten offers. So, changes are afoot, but they aren't necessarily changes that are affecting the pace of sales or sales prices in our local market. | |
Contract Activity Slowing A Bit In July 2022? |
|
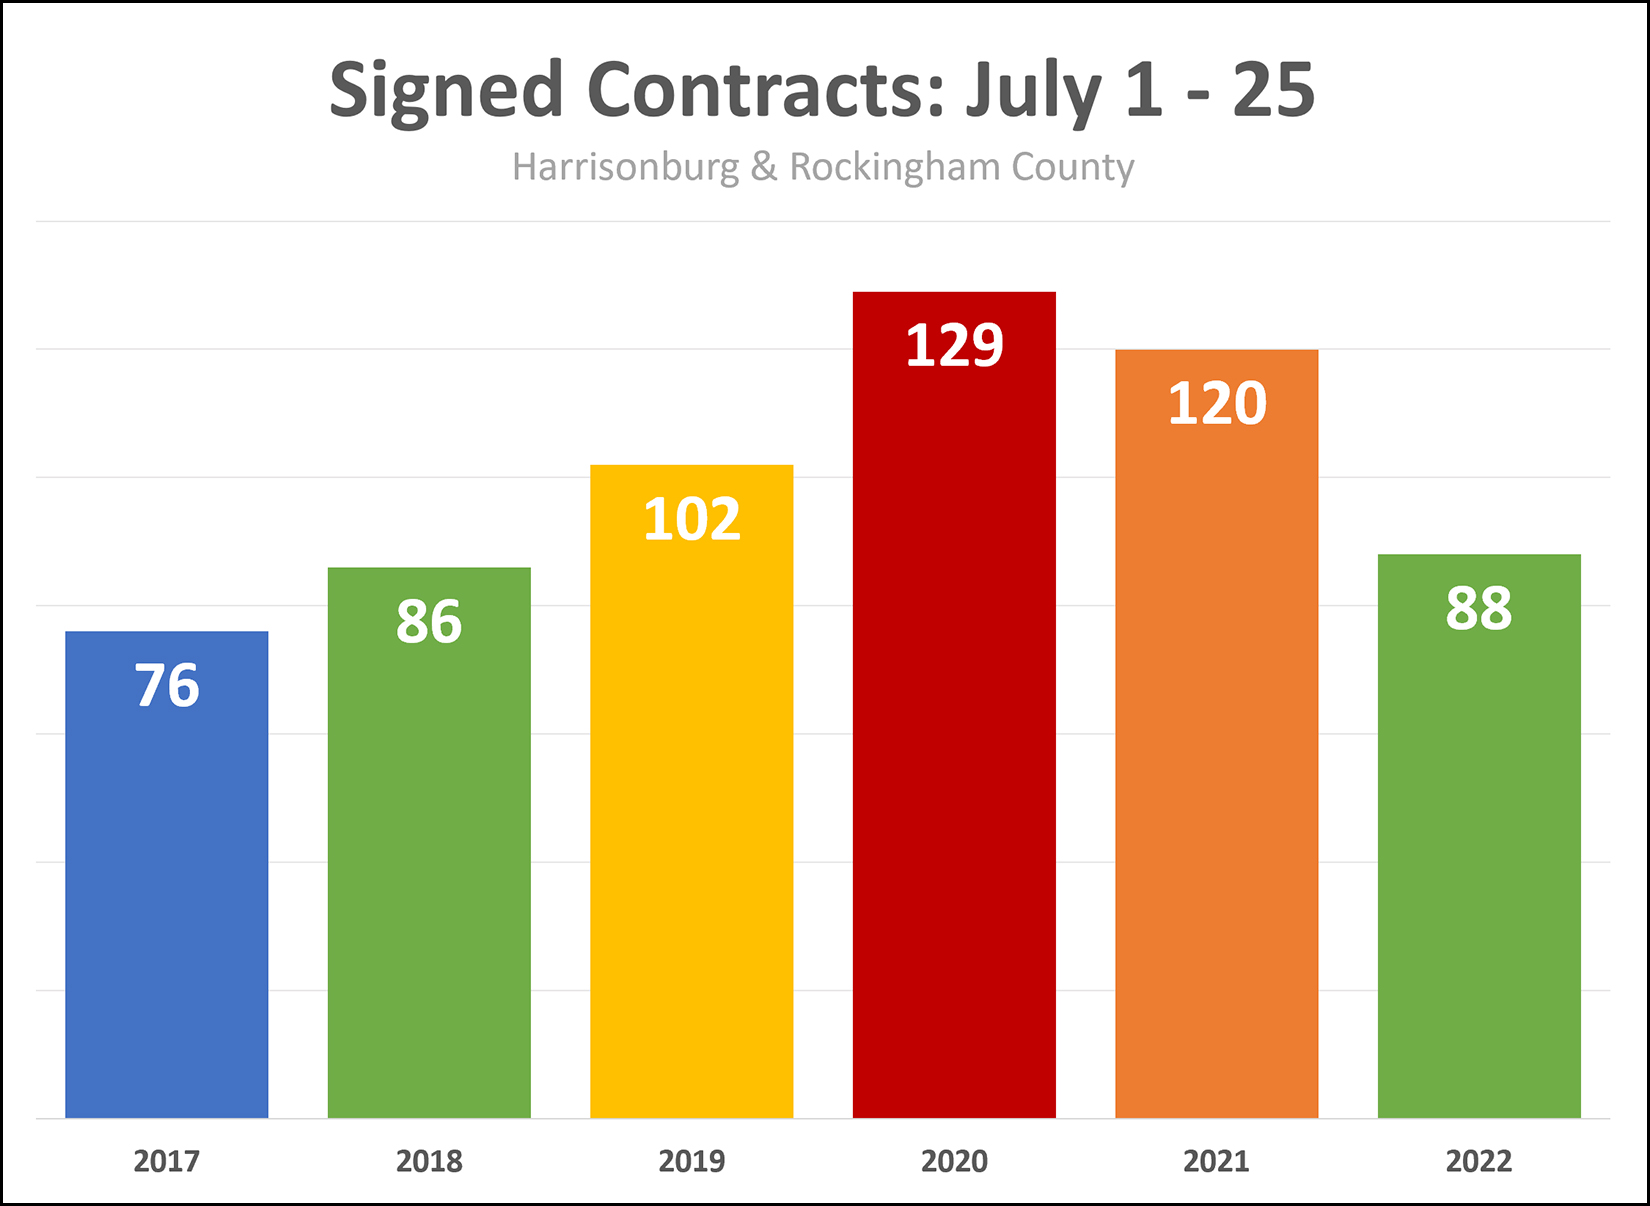 In the first 25 days of July 2022, we have seen 88 signed contracts. Some context and notes...
Is this a massive slow down or a one month anomaly? Only time will tell, but thus far, contract activity in July is certainly seeming slower that I would have expected. | |
Inventory Levels Creeping Slowly Upward, To Higher Low Levels |
|
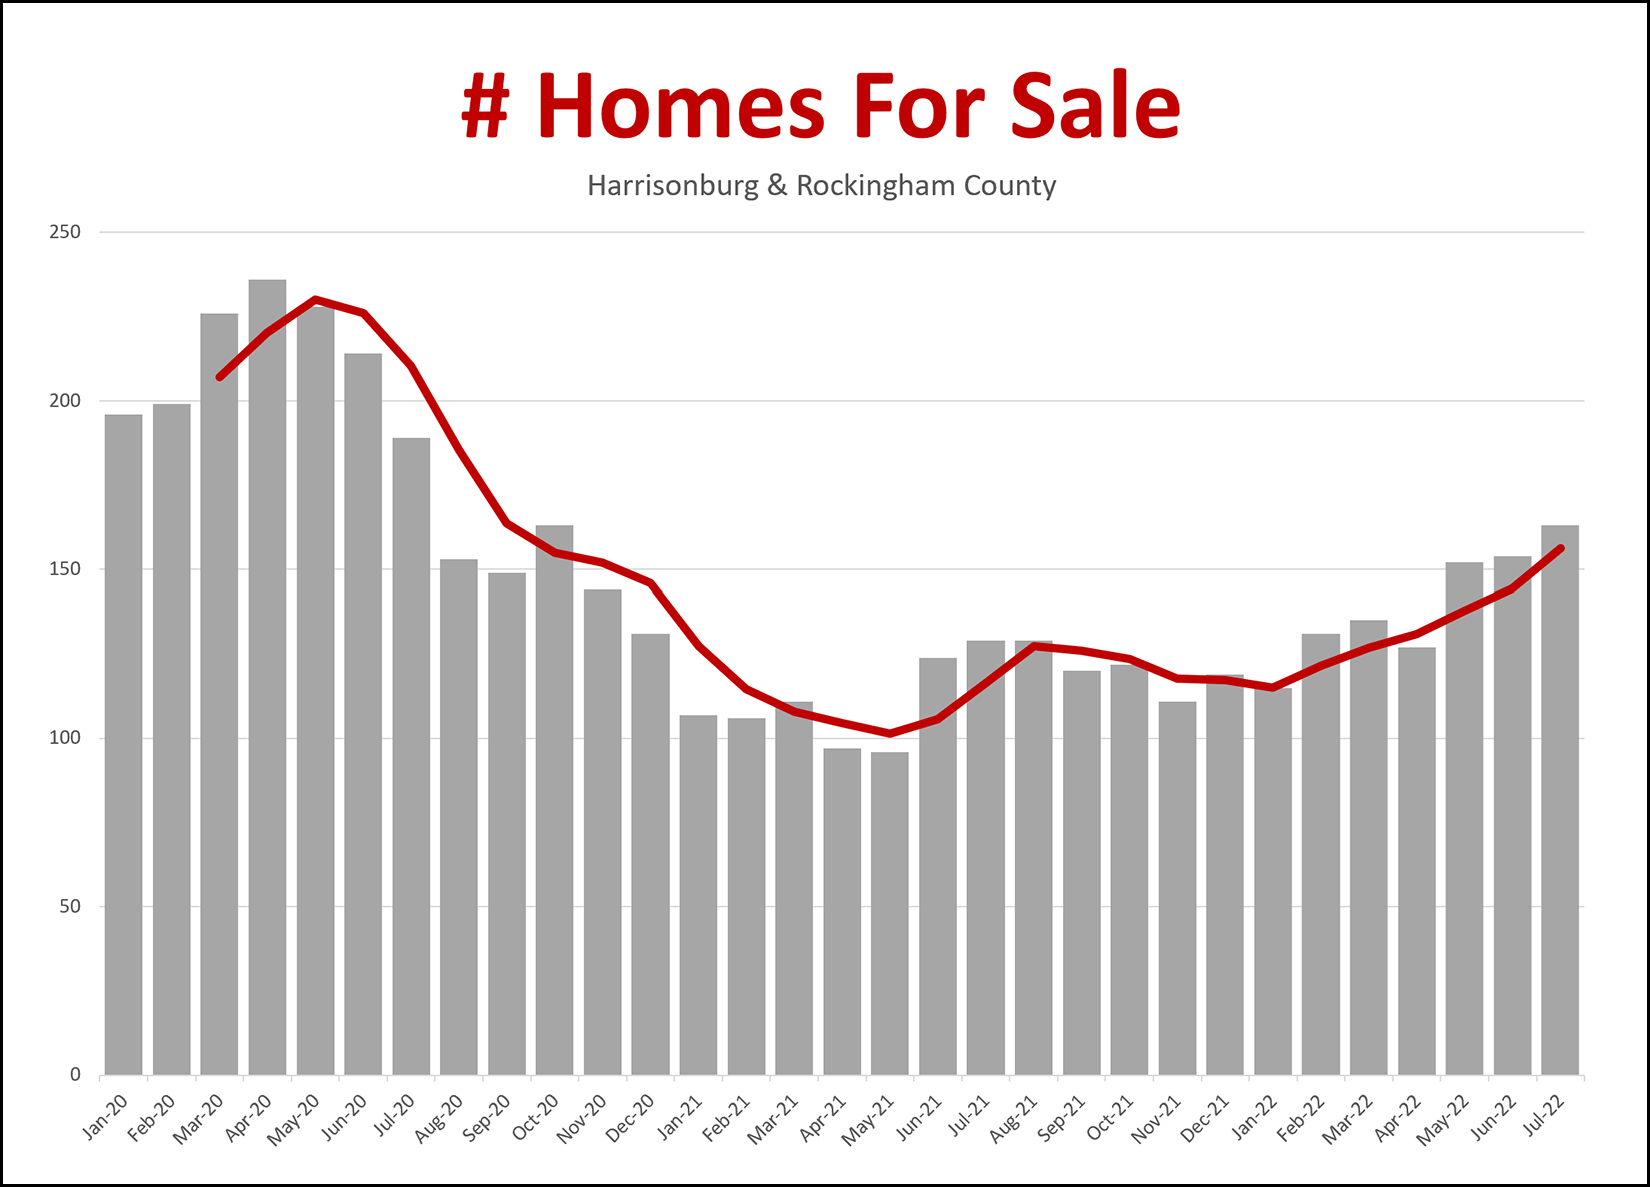 Inventory levels - the number of homes for sale at any given time - have been creeping upward for the past 6+ months. With 163 homes for sale, we are now seeing more homes for sale than we have seen at any time since late 2020. The gray bars above show the number of homes on the market at the end of each month. The red line above shows a moving three month average to show the overall trend more clearly. To put this in a bit of context though, these new highs are actually still pretty low... Homes for Sale In...
So, yes, July 2022 inventory levels are higher than a year ago... but are also much lower than any other recent July... | |
There Will Come A Time When Homes Will Not Sell Instantly, And That Is OK |
|
 Over the past year, the median "days on market" has been five days in Harrisonburg and Rockingham County. That means that half of homes that sell are under contract in five or fewer days. That is fast. It's the fastest homes have ever sold in this market. Just three years ago, the median "days on market" was 23 days -- a bit over three weeks. That is also rather fast, but certainly not as fast as five days. And guess what folks, just as ridiculously low mortgage interest rates stuck around for a few years and then came to an end -- it is very likely that we will eventually see the time it takes to sell a home start to increase from this record median of five days. For example... in the past 30 days, the median days on market was seven days... yes, a full two days longer than that prolonged low of five days. If we do start to see the pace of homes selling starting to slow a bit... maybe from a median of five days on the market, to seven days, to (gasp!) a median of 10 days, here's what it might mean for our local market... [1] Home buyers will still need to look at homes quickly when they go on the market, but they might be able to sleep on the decision of whether or not to make an offer. [2] We might eventually see fewer multiple offer scenarios, at least in some price ranges. [3] Many homes (those in desirable locations, price ranges, etc.) will still sell very quickly, perhaps in five days, even if the overall market statistic increases. [4] Sellers will need to put up with showings for more than a few days. :-) One nice part about a fast moving market is that many home sellers only had to put up with home showings for a week or less - and that might start to change. There are plenty of additional *possible* implications of the pace of the market slowing. But rather than speculate as to what they will be, what they will mean, and when they will happen, I'll keep monitoring the data to see what is actually happening on the ground in our local market. Of note, related to median days on market (DOM) in our local market... Median DOM in the past 12 months = 5 days Median DOM in the past 30 days = 7 days Median DOM in the past 30 days for homes priced under $250K = 5 days So, even if the overall market slows down -- a smidge -- many segments of the overall market will likely still be moving quite quickly! | |
The Local Real Estate Market Is Constantly Changing |
|
 Over the past two years as home sales and home prices have rapidly accelerated upwards, we couldn't assume anything about pricing... We know - your neighbor's identical house sold three months ago for $350K. We assume - your house will sell for around $350K. And then - your house actually sells for $380K. Home prices were increasing so quickly that a recent sales price of $___ did not necessarily mean the next similar home would sell for that same price. And now, as the market seems to be slowing down a bit, we still can't assume anything about pricing... We know - your neighbor's identical house sold three months ago for $375K. We assume - your house will sell for around $375K. And then - your house might sell for $350K, $375K or $400K. These days... [1] There are certainly plenty of homes that are going on the market and selling very quickly, often with multiple offers. [2] There are some homes that are going on the market and sitting around for a bit before having an offer. [3] Some homes are still selling for more than we would have thought based on recent sales prices. [4] Some homes are selling for a bit less than we would have thought based on recent sales prices. I don't think we're seeing a wholesale shift at this point. We're still seeing more sales, at higher prices. But I don't think we can assume as reliably that home prices are steadily marching upwards at a rate of 10% per year right now. | |
The Harrisonburg Housing Market Keeps Defying Expectations |
|
 After A Worldwide Pandemic...
After Mortgage Interest Rates Almost Doubled...
When the pandemic began, I was convinced home sales would slow and prices might drop as well. The market defied my expectations. When interest rates skyrocketed, I was convinced home sales would slow and prices might drop as well. Thus far, the market has defied my expectations. As you can see, the Harrisonburg housing market doesn't always do what we might expect, even with significant external factors having the potential to make large impacts on our local market. So... don't assume our local housing market will do whatever you might read in national headlines... the local market seems to keep having some surprises for us! | |
Harrisonburg Housing Market Still Speeding Right Along |
|
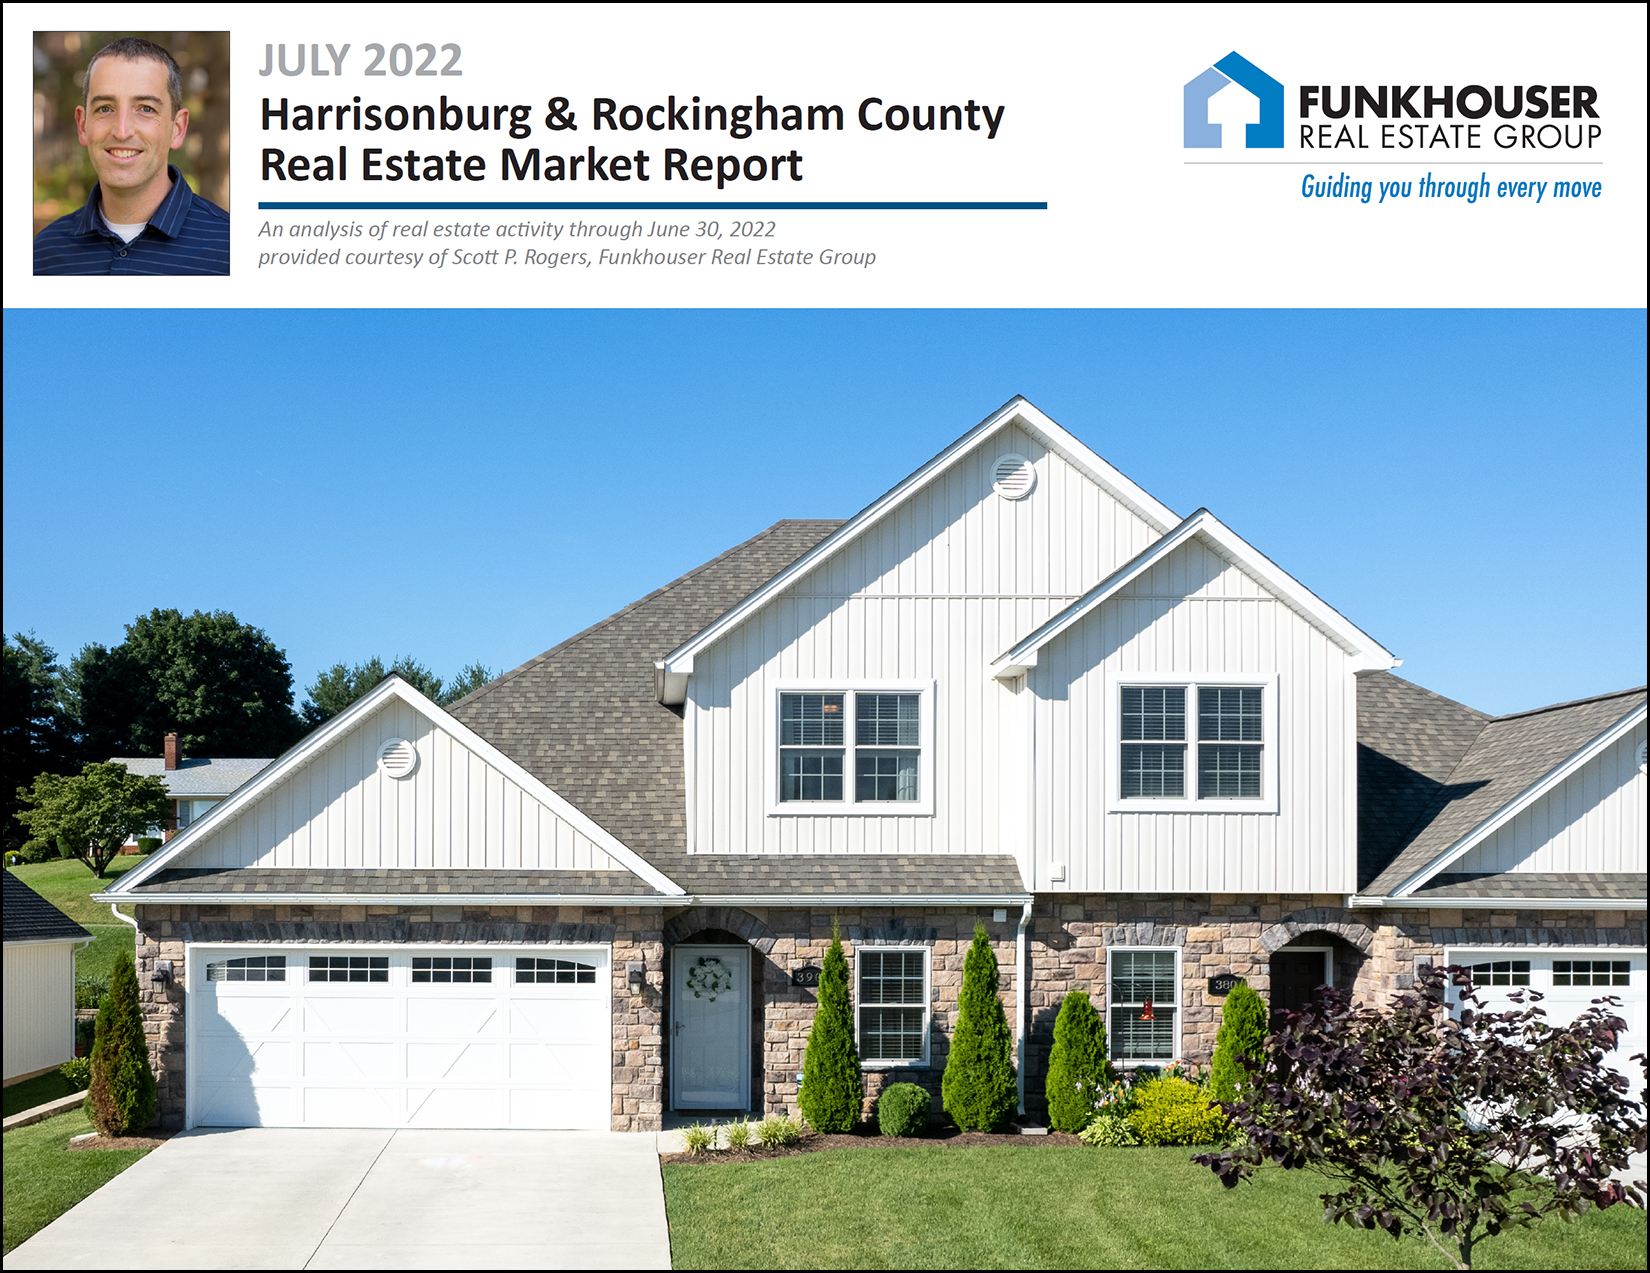 Happy Tuesday morning, friends! The starting and ending point of summer likely varies for many of us, but it seems like we're somewhere around the middle of summer. Gasp! As such, I hope the first half (or so) of the summer has treated you well, and that you still have some fun, adventures and relaxation in the works for the second half of summer. Before we get to the real estate news of the day, I'll mention that Red Wing was *fantastic* this year... 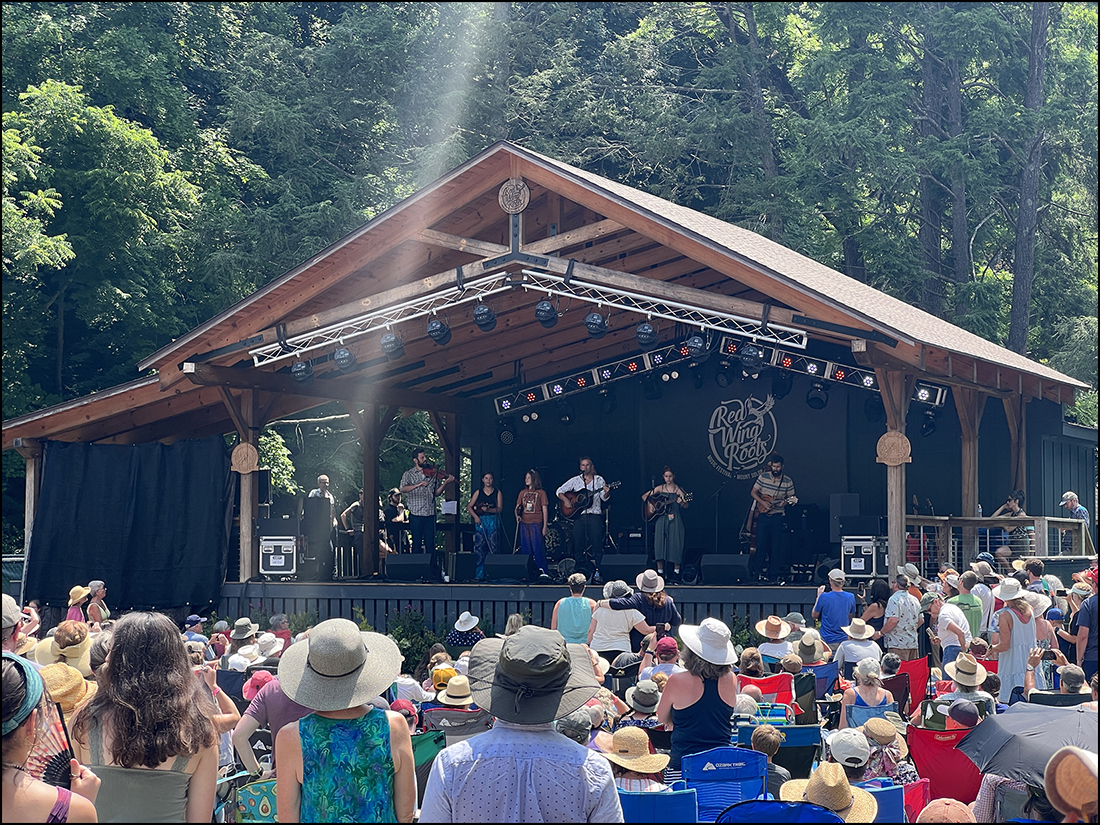 I enjoyed seeing many of you out at Natural Chimneys over that long (but not quite long enough) weekend and I hope the rest of you will consider checking it out next year! Sign up for Red Wing Updates here. Next, I should mention that the beautiful home on the cover of my market report is on the market, for sale, as of this morning! Find out more about 390 Callaway Circle here. Finally, if you're looking for a good cup of coffee (or a caramel latte) one of my favorite coffee spots in the 'burg is Black Sheep Coffee, tucked away over on West Bruce Street. Interested in checking out Black Sheep Coffee? I'm giving away a $50 gift certificate, which you can enter to win here! And now, let's spend a few minutes together exploring the latest news and happenings in our local housing market... 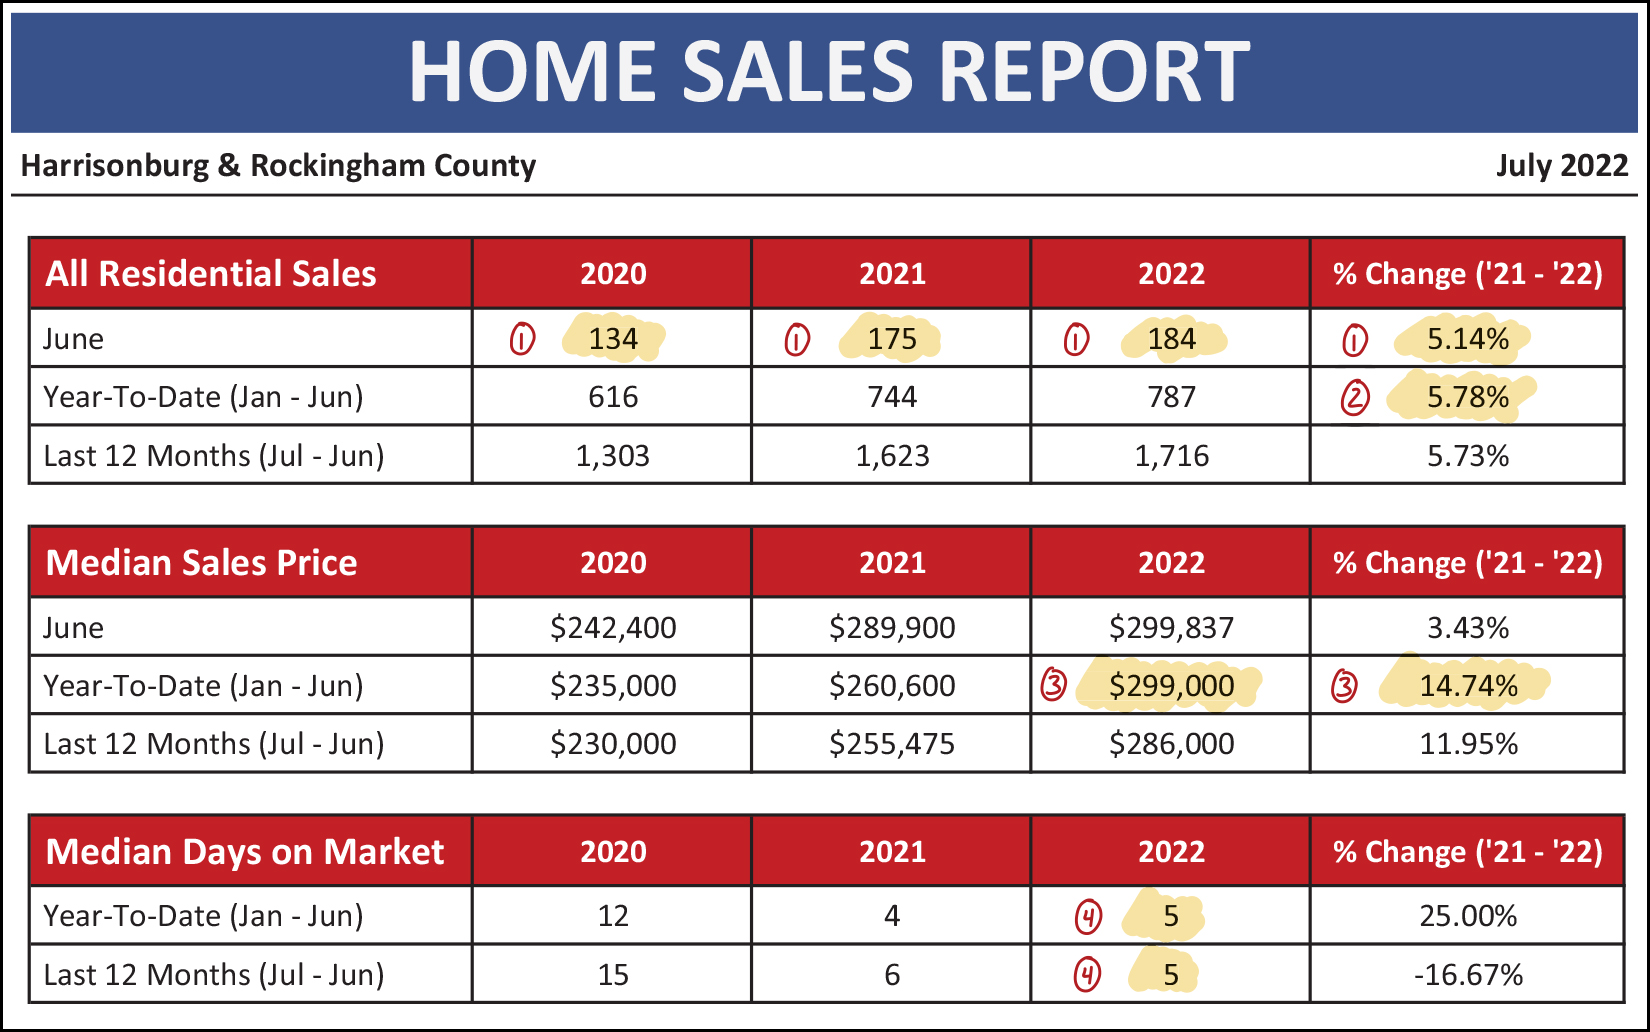 Right off the bat, we get to some rather fascinating updates just checking out the very basic metrics of our local market. As referenced in the tiny red numbers above... [1] A normal June might have around 135 or 145 home sales. Last June (2021) we saw an impressive 175 home sales. I did not think we would clear that high bar this June. But... we did. There were an astonishing 184 home sales in June 2022! [2] The median sales price in the first half of this year was $299,000! That is almost 15% higher than it was in the first half of last year, when it was $260,600. Even with *much* higher mortgage interest rates, homes keep selling at higher and higher prices! [3] Homes are still selling fassssssssst! The median days on the market in Harrisonburg and Rockingham County during the first six months of 2022 was... only five days, just as fast as when we look at the entire past 12 months of data. So... lots of sales, prices that are higher than ever, and homes are going under contract faster than ever. Hmmmm... things don't seem to really be slowing down thus far in 2022!? This fast moving market has been one contributor to the steady increases in home prices seen over the past two years. Take a look at these increases... 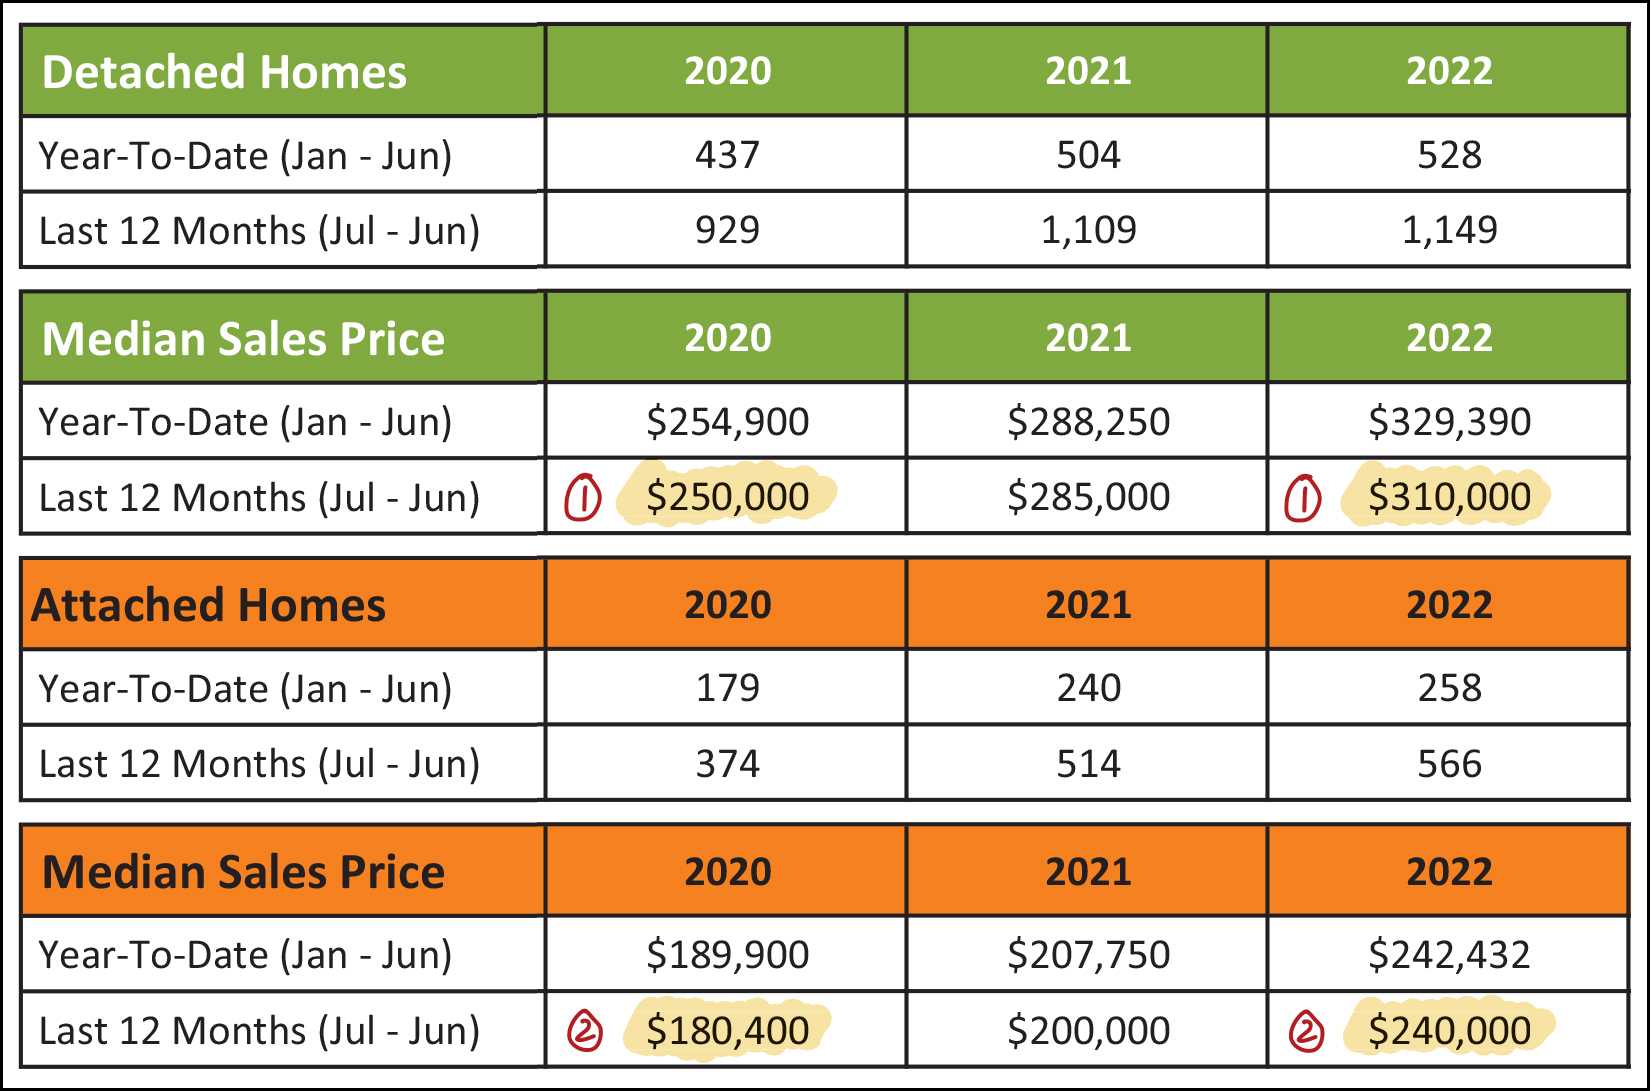 [1] The median sales price of detached homes was only $250,000 just two years ago... but over the past two years that median sales price has risen to $310,000! [2] The median sales price of attached homes (townhomes, duplexes, condos) was only $180,400 just two years ago... but over the past two years that median sales prices has risen to $240,000! Homeowners have been delighted with these increases. Sellers have also been big fans. Buyers... not so much. It can be tough for buyers to get excited about paying a *much* higher price alongside their *much* higher mortgage interest rate... but buyers still seem to be moving forward full steam with their home purchases thus far in 2022. Those home buyers are moving along so steadily that we're breaking (tying) some records... 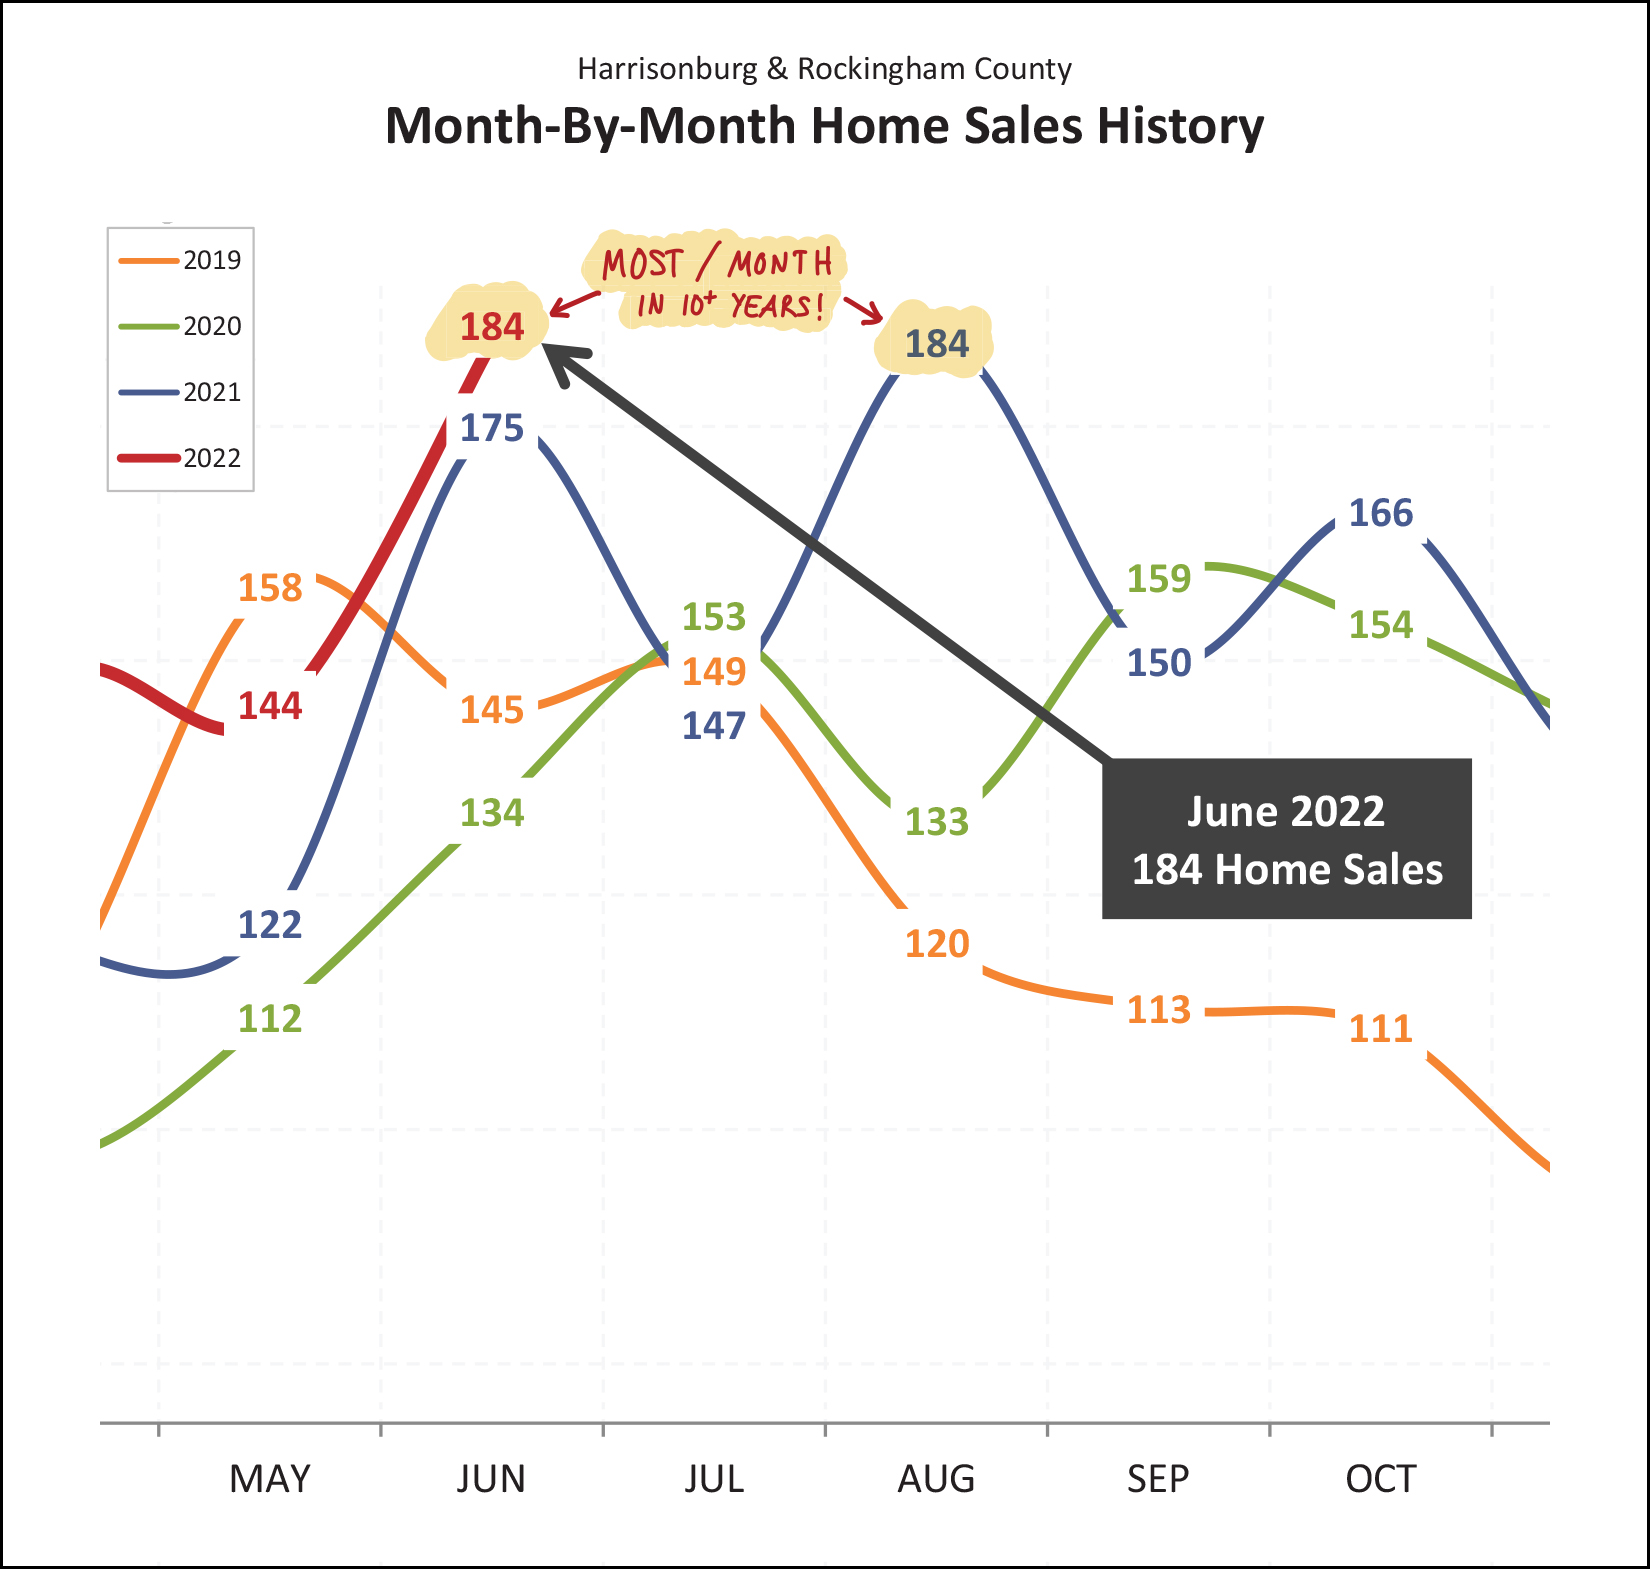 Over the past ten years, the most home sales we have seen in a month has been 184 home sales... which took place last year, in August. Well, what do you know!? This June (last month) we saw... 184 home sales! Looking ahead, what should we expect for July? The past three months of July have been tightly clustered around that 145 - 155 range, so I'm going to play it safe and guess we'll see right around that many home sales in July 2022. Perhaps 150 on the nose!? As I have mentioned to many of you, I fully expected (and still expect) that we'll see a bit of a slow down in home sales activity in 2022 due to higher mortgage interest rates... but... the data just isn't agreeing with me thus far... 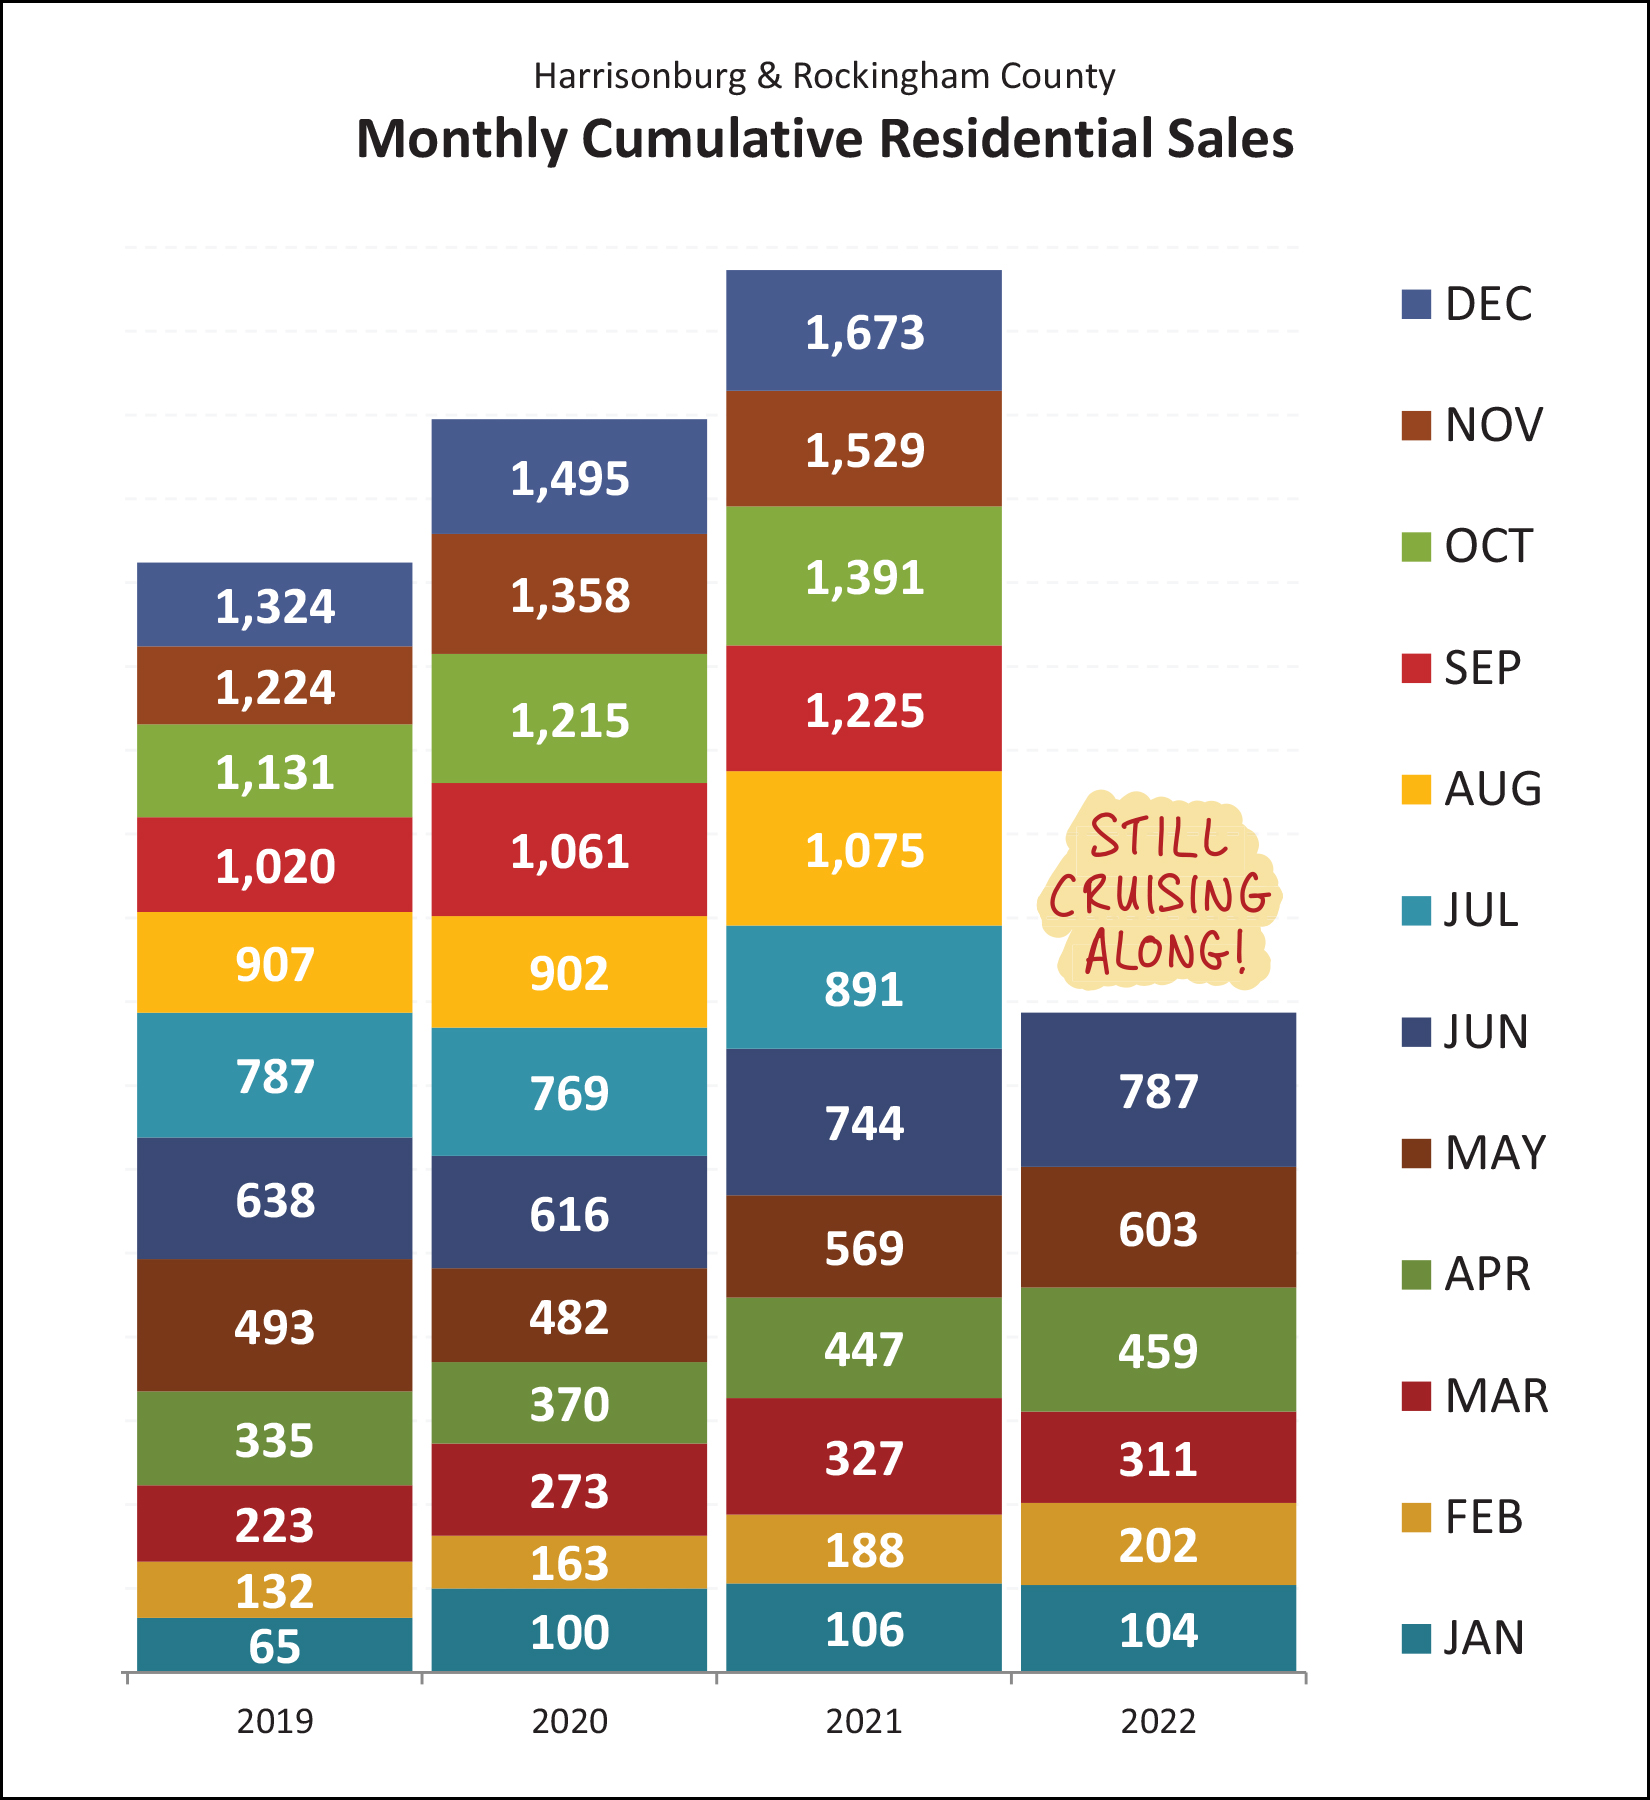 As shown above, the 787 home sales we've seen in the first half of 2022 exceed the number of home sales in the first half of each of the past three years! If I didn't know better, I'd think mortgage interest rates must be *lower* than ever in 2022 to spur on so much buyer activity!? But, no, not so much. More on that later. Looking at these big picture trends in a slightly different way, it's astonishing to see three years in a row of double digit growth in the median sales price in our market... 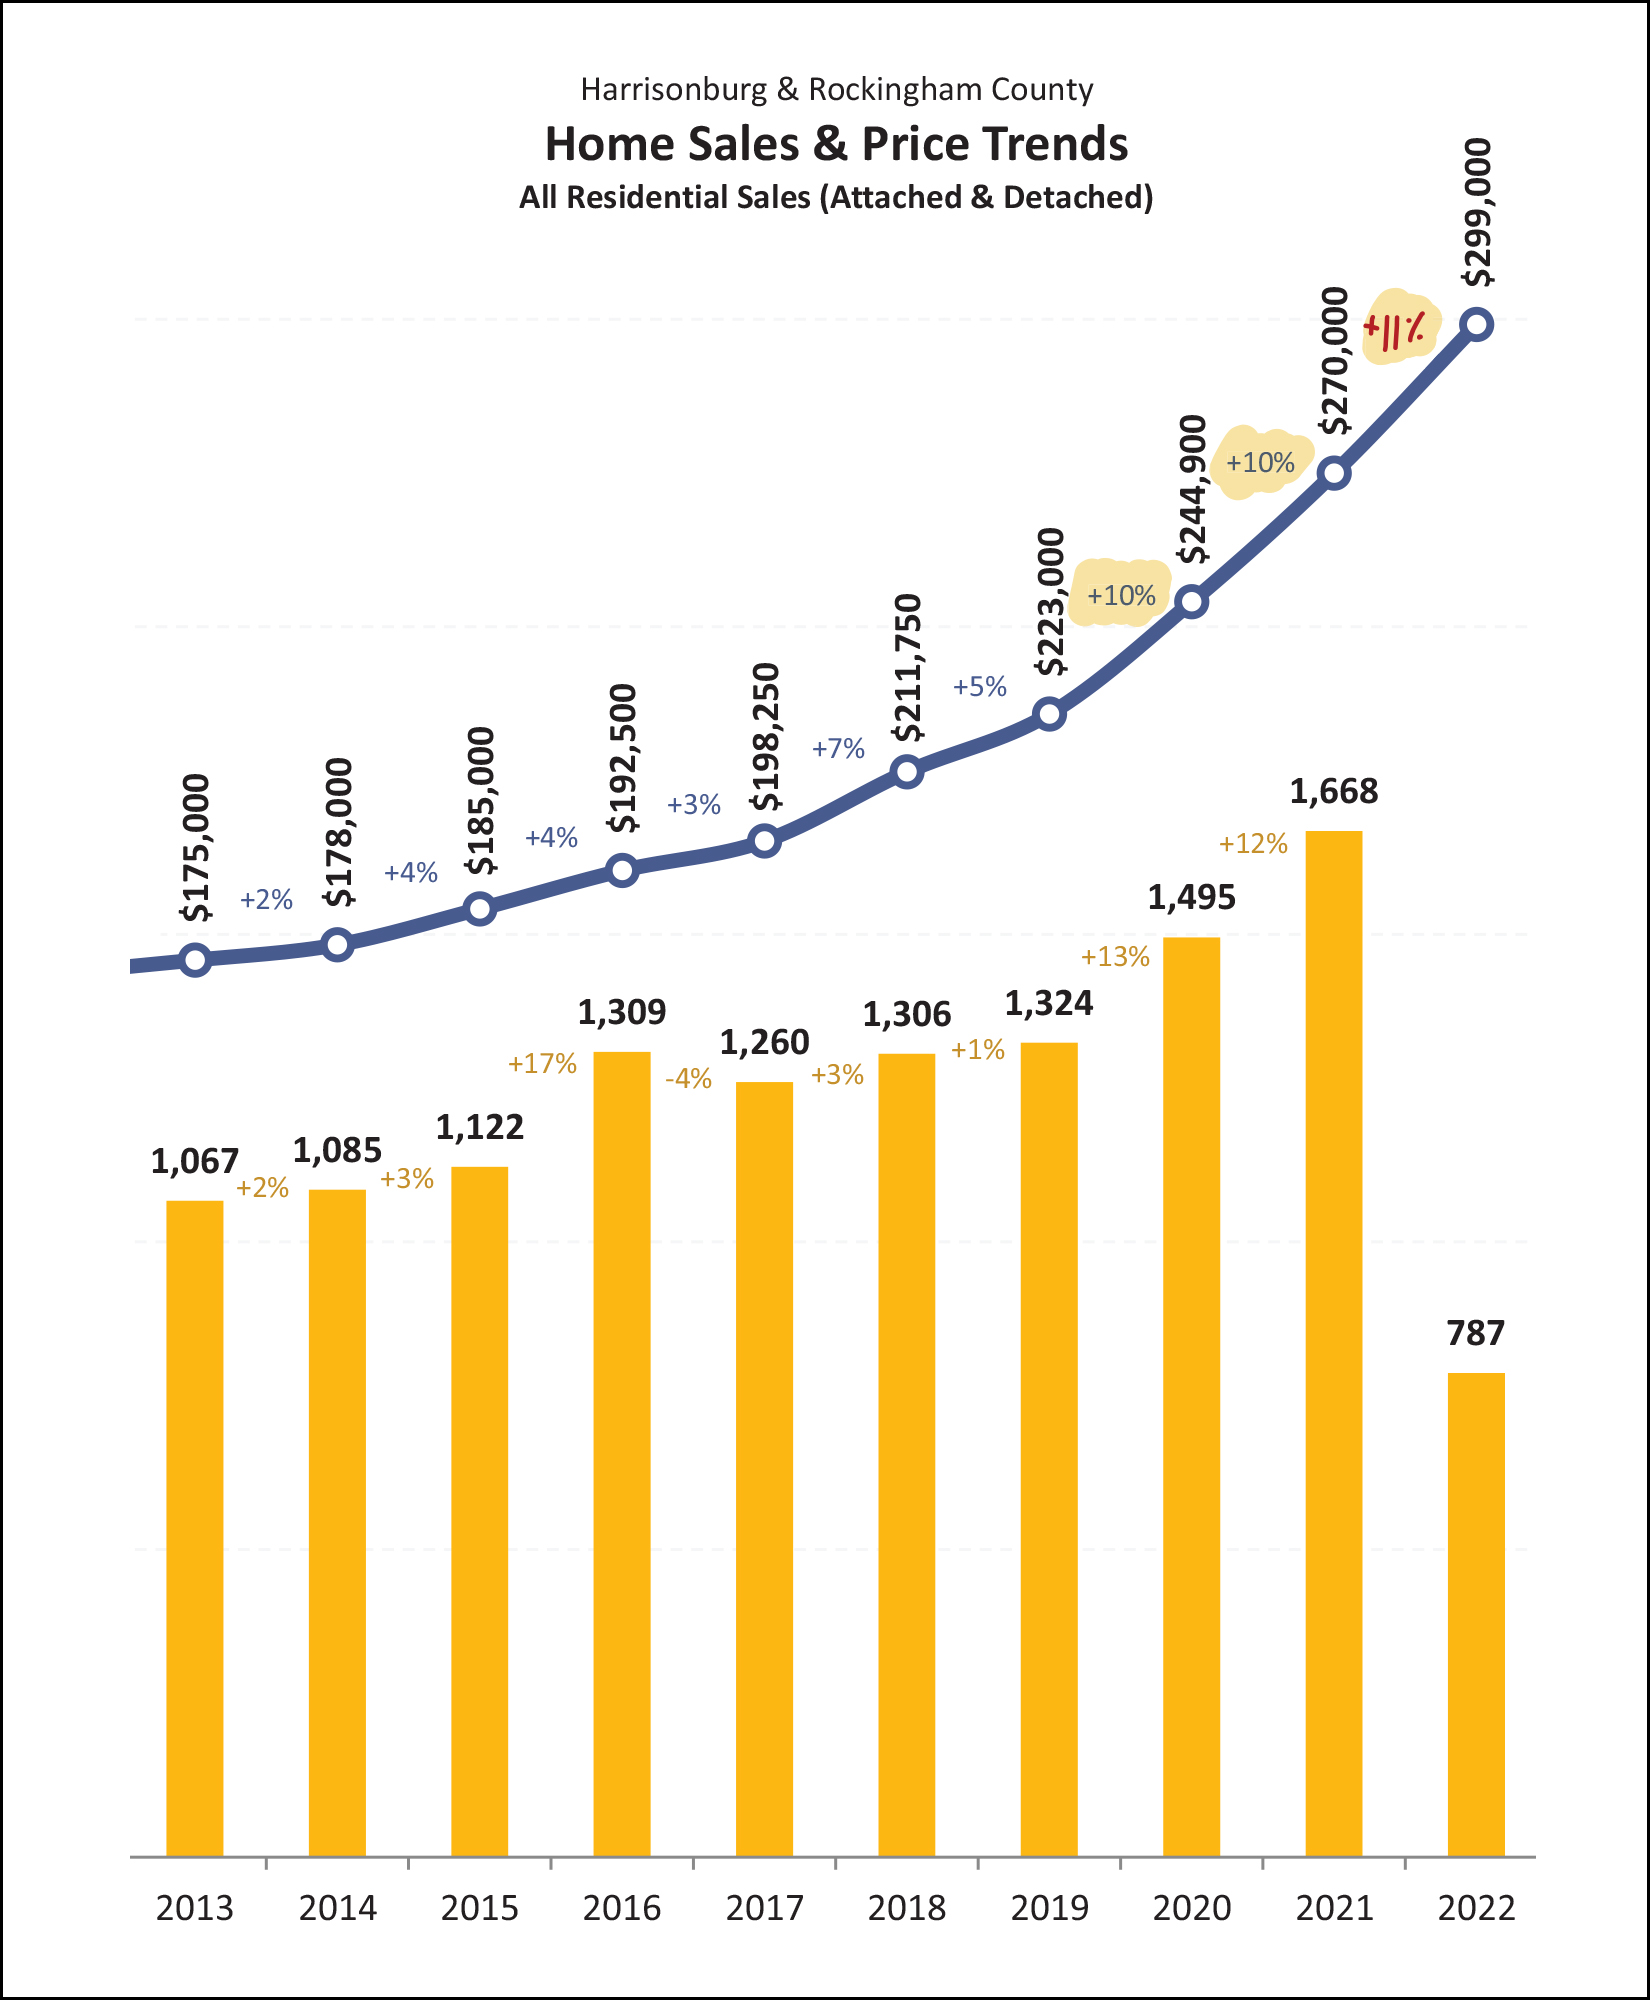 How much did our area's median sales price increase in 2020? 10% How much did our area's median sales price increase in 2021? 10% How much has our area's median sales price increased thus far in 2022? 11% It's been an astonishing few years in our local market to see home values escalating so quickly... without any signs of slowing down. But... to try to reel us back in a bit from cloud nine... 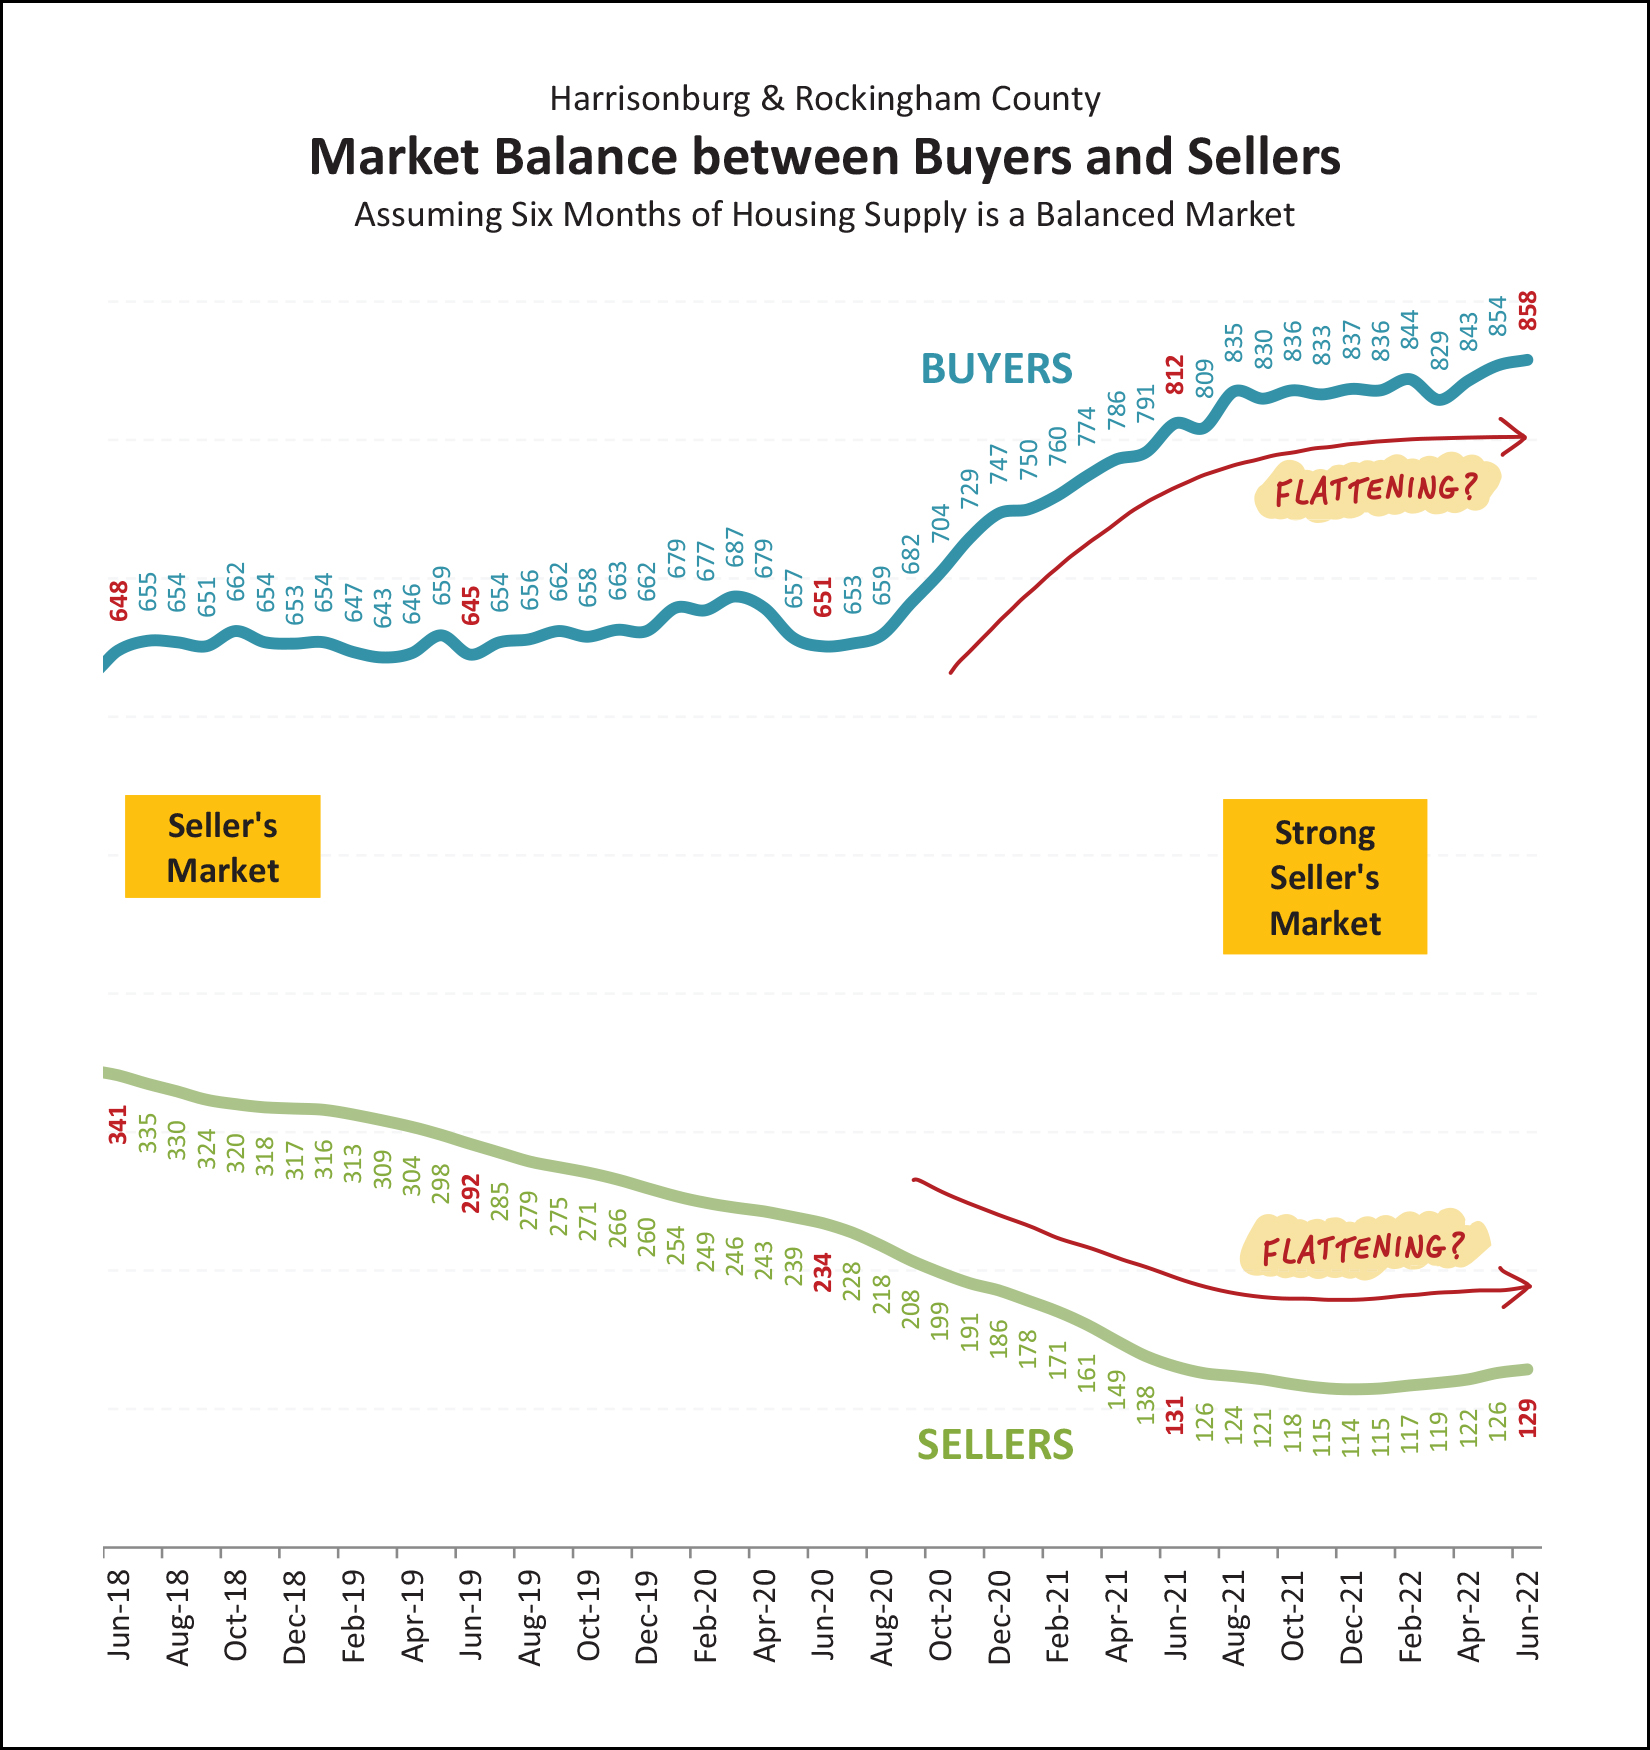 It's hard not to look at the graph above and think that things could be, might be, possibly be changing... [BLUE] The top, blue, line shows the number of buyers buying in a six month period as evaluated over the past four years. This metric has been steadily marching upward over the past two years... but... it seems that the number of buyers buying might be flattening out a bit. Again, not that the amount of buyers buying is decreasing, but buyer activity might not be continuing to increase as quickly as it has for most of the past two years. [GREEN] The bottom, green, line shows the numbers of sellers selling at any given time... the inventory levels at the end(ish) of each month. For most of the past four (plus) years we have seen fewer and fewer (and fewer and fewer) homes on the market, due largely to excessive amounts of buyer demand. But... over the past six months... we're starting to see some modest flattening out of inventory levels in our local area. Inventory levels seem to be steadying themselves. Bear in mind that it is still definitely a strong (strong!) seller's market, but we might be starting to see some early signs that the market might be slowing down a touch... perhaps cooling off from a strong-strong-strong seller's market to a strong-strong seller's market!? Changing gears, slightly, here's an interesting trend to make sure that we recognize... 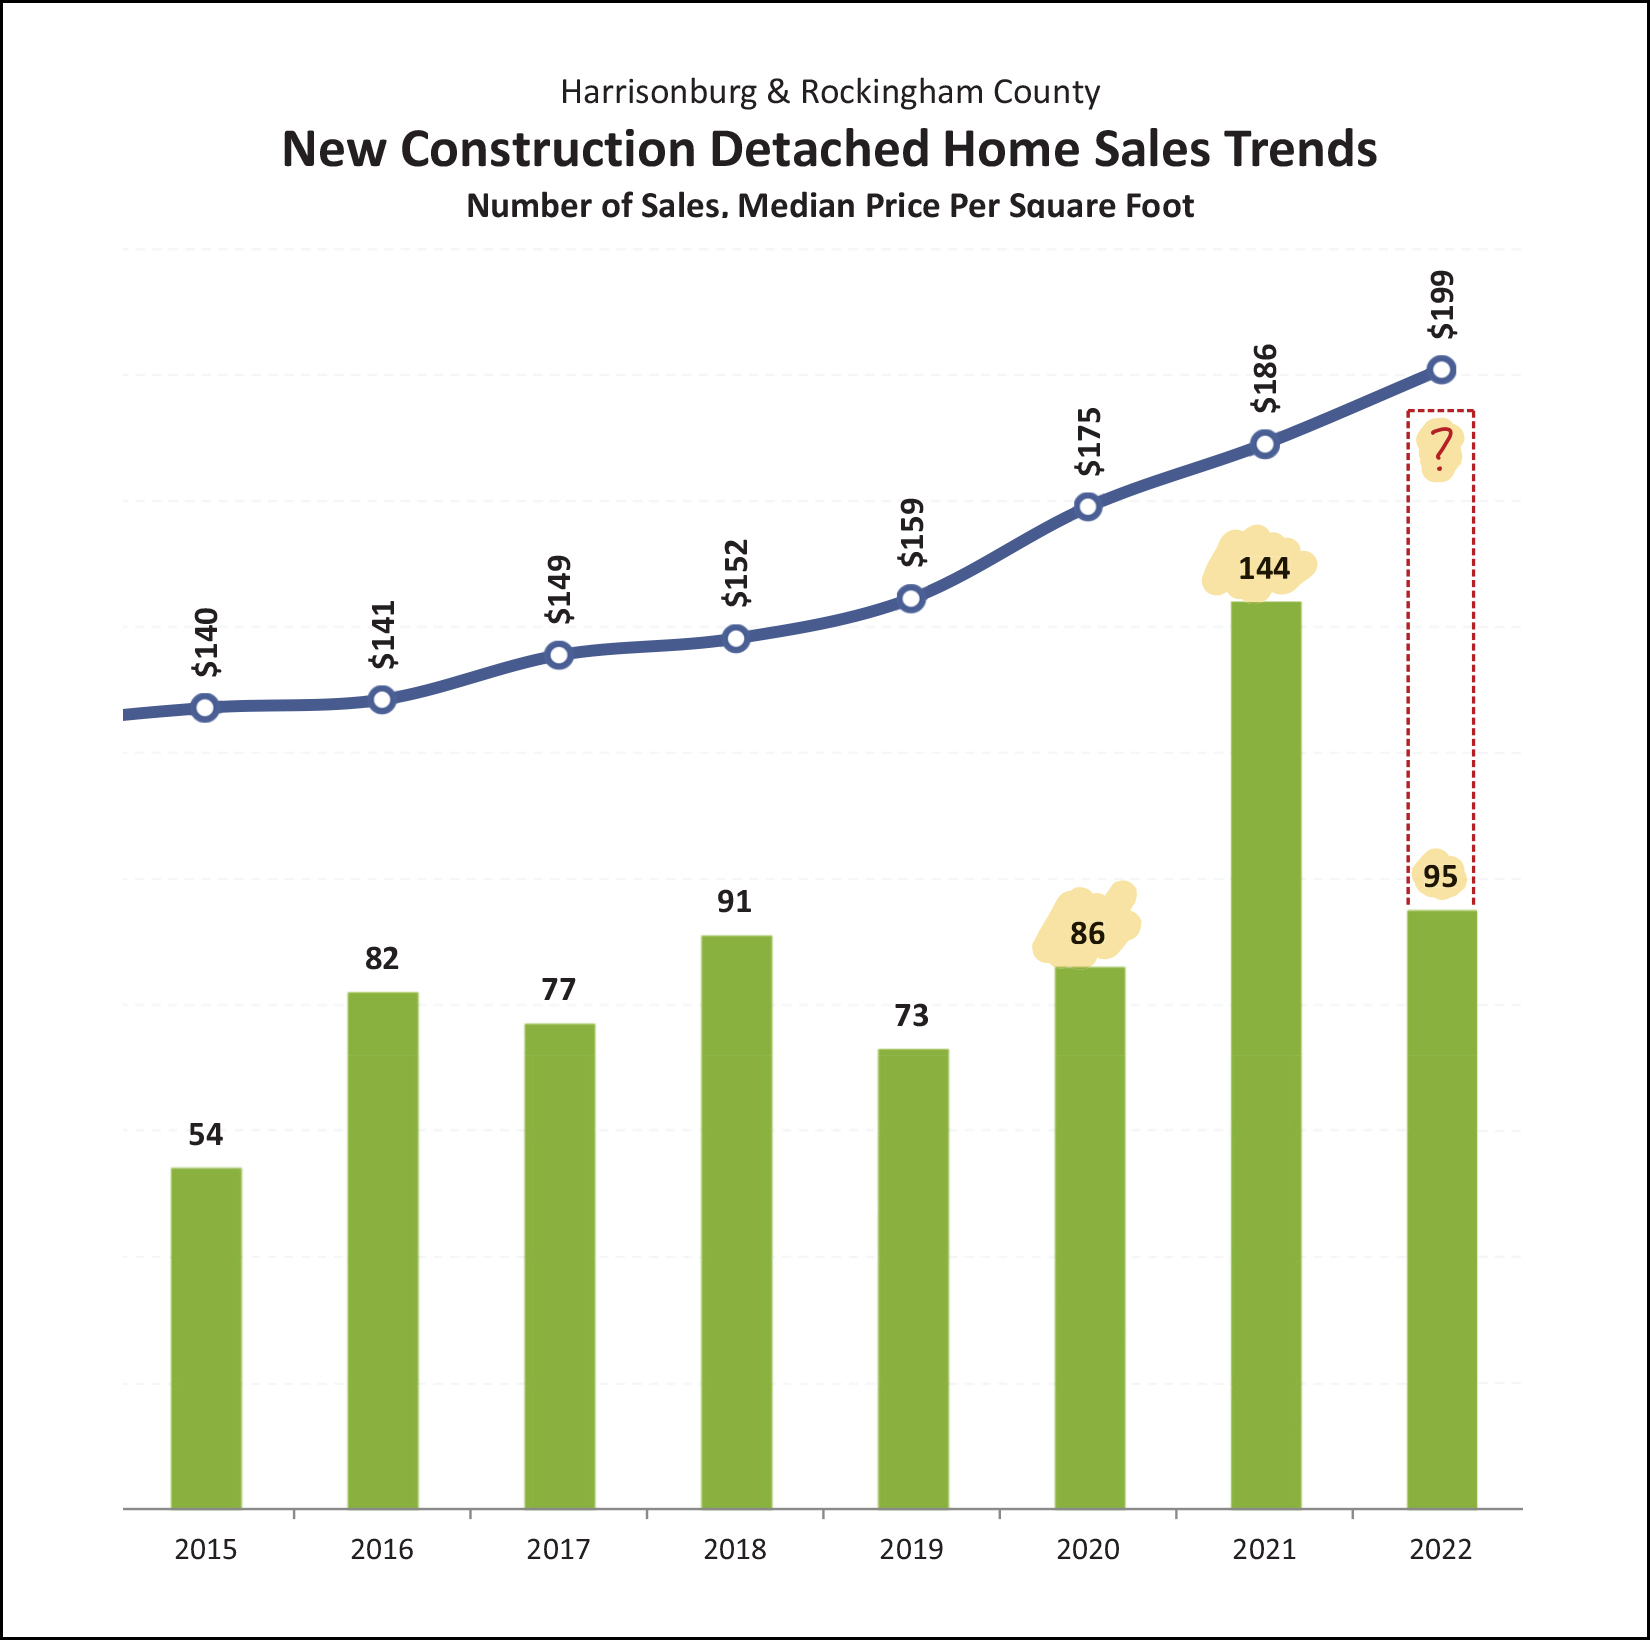 After typically only seeing around 70 - 90 new (detached) home sales per year, we saw a remarkably high 144 such sales last year... and this year we seem to be on track to see around 180 new detached home sales in Harrisonburg and Rockingham County. These recent, steady increases in the number of new homes selling in our market is doing two things... one, allowing the overall number of home sales to increase without relying just on resale homes as inventory... and allowing the median sales price in our market to keep climbing, given that new homes are typically more expensive than resale homes. OK, shifting back to the overall sales market, here's a look at recent months of contract activity... measured by when contracts are signed... 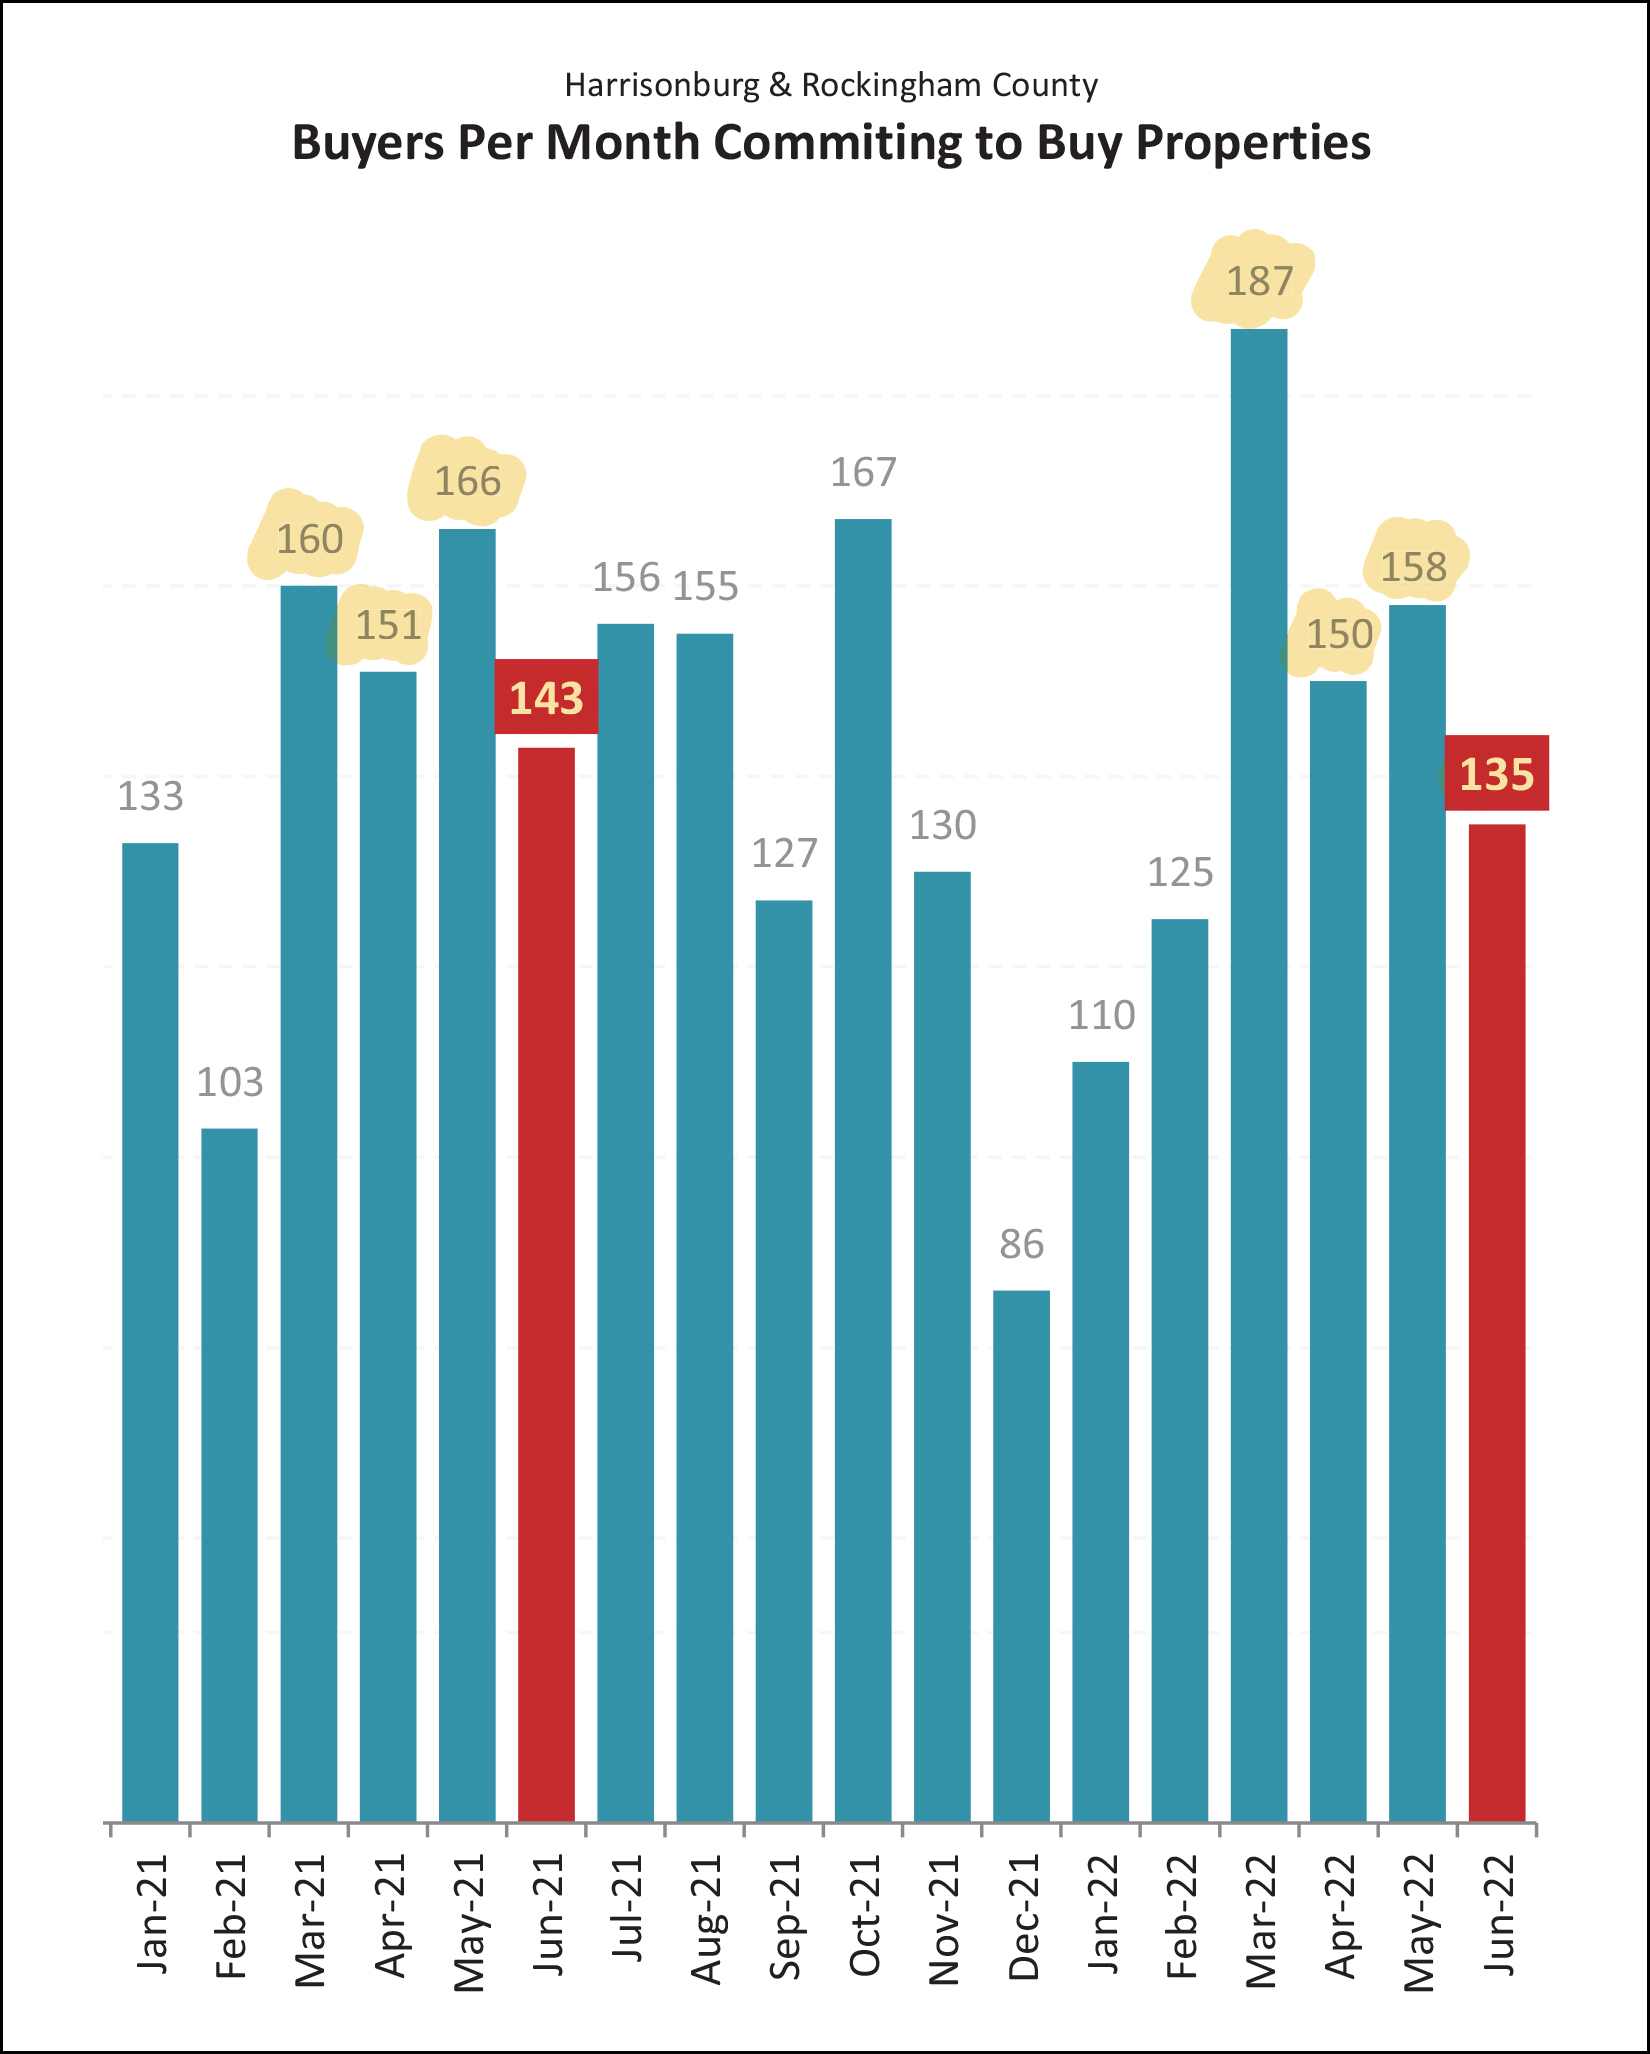 Looking at the highlighted months... [2022] We have seen 630 signed contracts in the past four months. [2021] In the same months last year, we saw 620 signed contracts. So, yes, even with *much* higher mortgage interest rates, we are seeing more buyers sign contracts to buy homes now as compared to a year ago. Is this surprising? Yes, relative to interest rates. No, relative to what seems to be a significant number of buyers who wanted to buy homes in this area in the past two years who have not yet been able to do so. In other words, demand exceeds supply. There are still lots of buyers who want to buy... even if the interest rates are higher than they were previously and higher than they would prefer. So, demand is high. How about supply? Well... 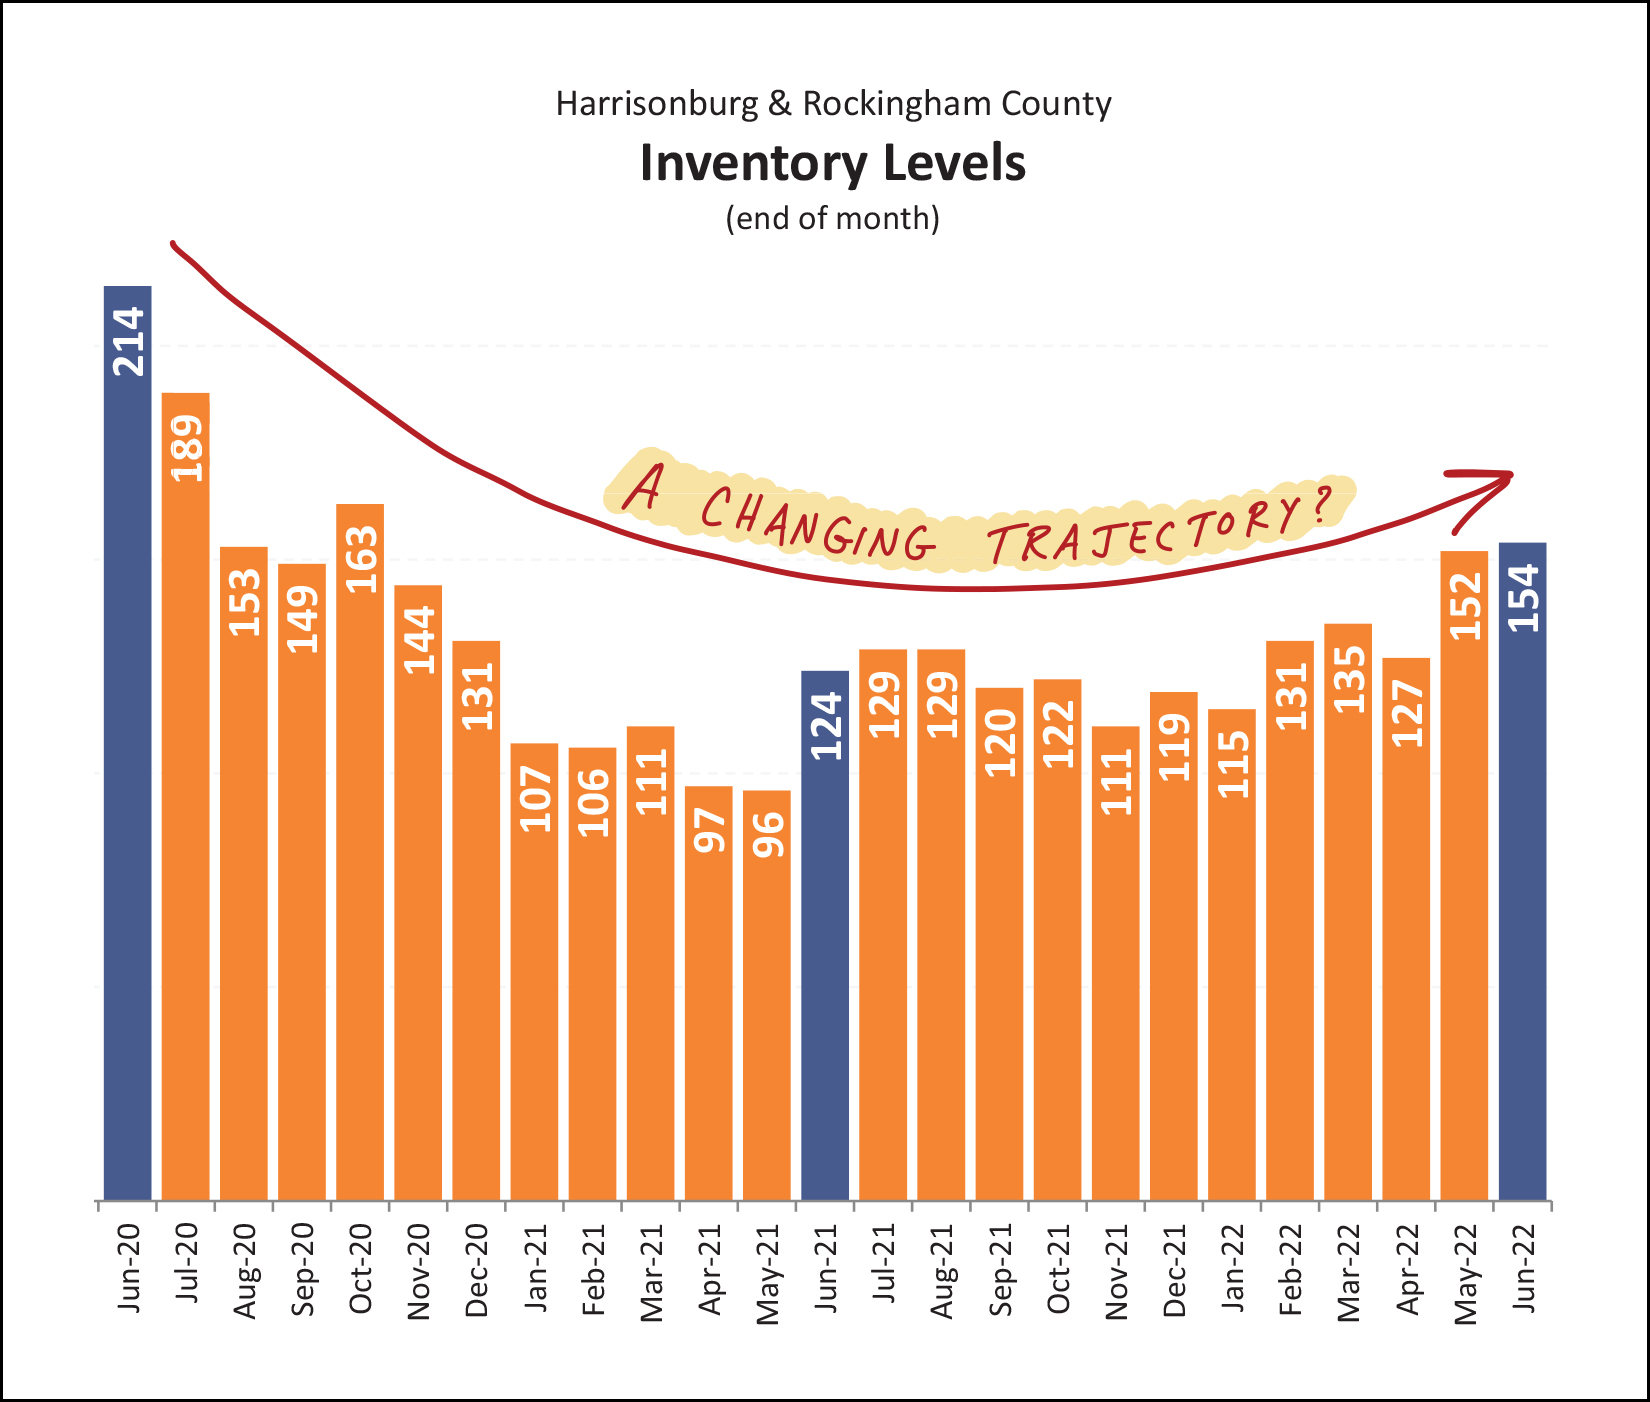 It is possible that our local housing supply is increasing, slightly. After multiple years of constantly declining inventory levels, we now seem to be seeing inventory levels increasing a bit. Sadly, these *slightly* higher inventory levels aren't evenly spread across all property types, locations and prices... so many buyers will still find inventory levels to be *quite* low in their segment of our local market. Because inventory levels are still so low in most segments of the market, we are still seeing homes selling just as quickly has they have for the past year... 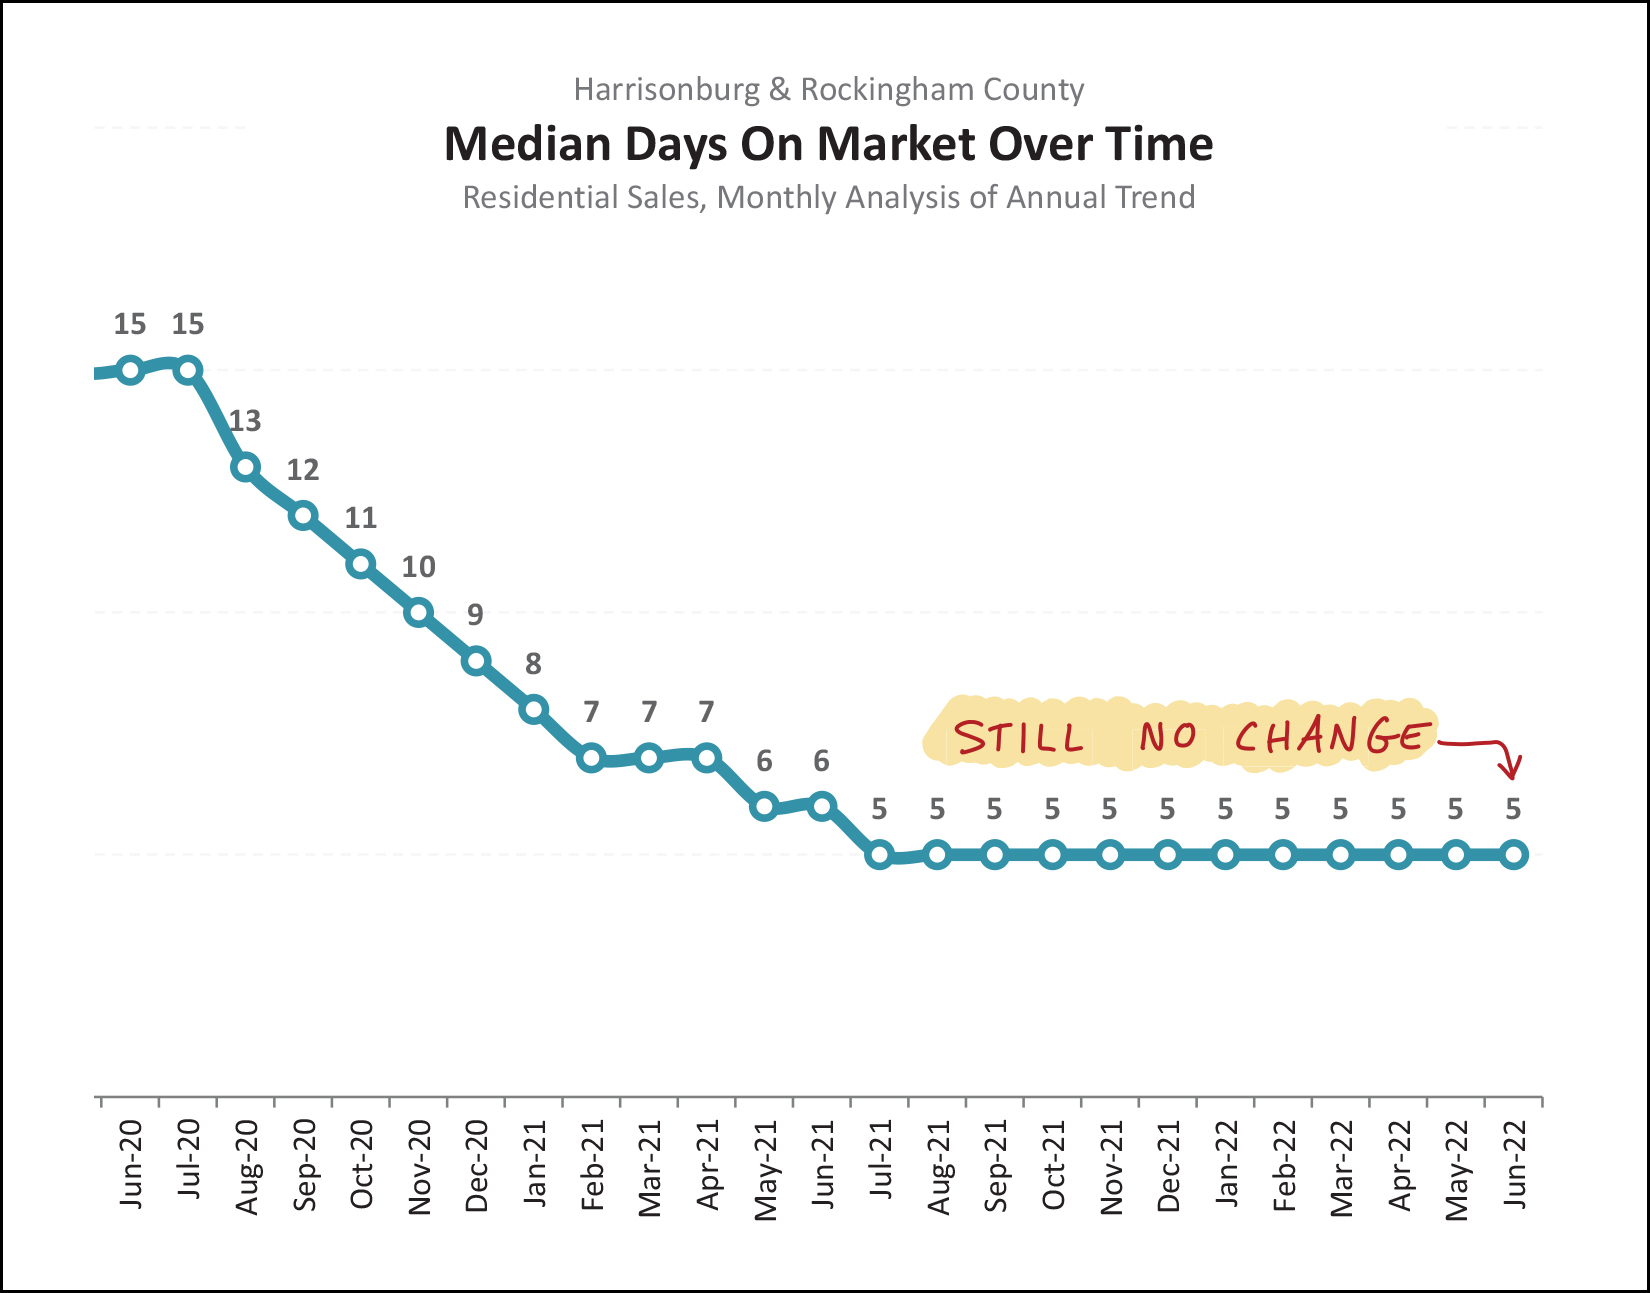 As shown above, the pace at which homes go under contract once listed (days on market) declined steadily through 2020 and 2021 until it seemed to bottom out at a median of five days on the market. That is to say that half of homes go under contract in five or fewer days... and half go under contract in five or more days. This metric hit a median of five days on the market back in July 2021 and has stayed there ever since. If or when the market starts to slow, soften or cool, we'll start to see this metric drift upward again. Finally, that one topic that isn't quite as exciting to talk about... mortgage interest rates... 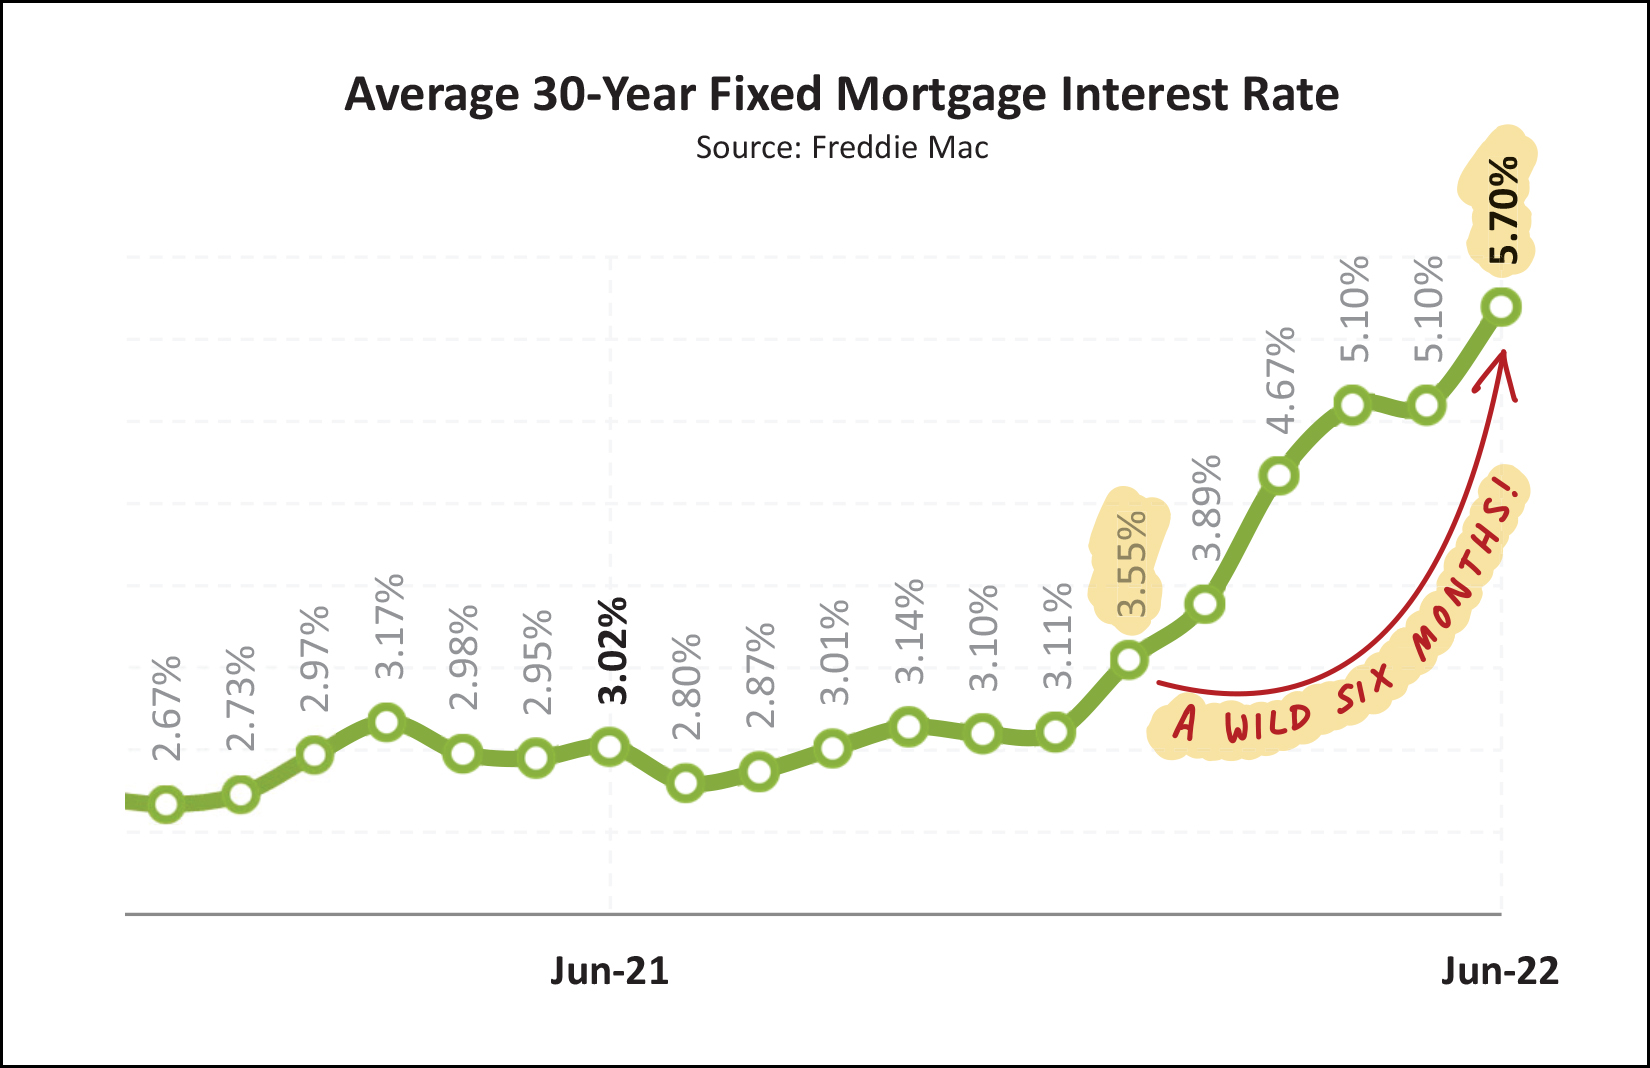 Just six months ago... the average mortgage interest rate for a 30 year fixed rate mortgage was... 3.55%. Now, it has risen all the way up to 5.7% as of the end of June. This drastically affects the monthly payment for buyers in today's market as compared to just six (or twelve, etc.) months ago. I don't think we'll see interest rates rise above 6% but it is definitely possible. If there is one thing that could cool off our local housing market, it's this "cost of money" in the form of the mortgage interest rates. But, again, it hasn't happened yet despite drastic changes in interest rates. And here we find ourselves again, at the close of what seems to be another red hot month of real estate activity in Harrisonburg and Rockingham County. By the headlines... [1] More and more home sales are selling! [2] Homes are selling at higher and higher prices! [3] Homes are selling as fast as ever! [4] Inventory levels are increasing, slightly, in some pockets of the market. [5] Mortgage interest rates are higher than they have been in years! What will we see over the next few months in our local real estate market? Most likely, more of the same... but we won't know for sure until those next few months pass... and I'll pause each month to check the numbers and share some thoughts with you so that we can all have a good sense of where we have been, where we are and where we might be going next. Speaking of next... If you are planning to SELL a house in the next few months, sooner is likely better than later, and I'd be delighted to chat with you about how we might work together. If you are planning to BUY a home in the next few months, you ought to check in with your lender sooner rather than later to get proper expectations of your potential mortgage payments within the context of rising mortgage interest rates... and yes, I'd be delighted to help you with buying as well. Be in touch at any point if I can be of any help to you or your family or friends. You can call/text me at 540-578-0102 or email me here. Until next month... may your summer be as relaxing as this crazy real estate market can be stressful! ;-) | |
But Officer, I Just Slowed Down!?! |
|
 So, you're cruising along on Interstate 81 (somehow not stuck in traffic) in a 70 MPH speed zone.... ...but, you're going 115 MPH. Wow! But then, you slow down a bit, to 95 MPH. When your friendly, neighborhood police officer pulls you over and asks you why you were going so fast... 95 MPH... you tell the officer you just slowed down. "Sure, pal, you may have slowed down... but you were still driving very fast!" Maybe you see where I'm going with this... The local housing market has been moving very quickly over the past two-ish years, perhaps it's been going 115 MPH... well beyond the speed limit, and definitely a seller's market, often with 5+ or 10+ offers on new listings within days if not hours. The local housing market has now slowed down a bit, perhaps to 95 MPH... still well faster than normal, still definitely a seller's market, often with 1 to 3 offers on new listings within days, but likely not within hours. So, yes, the local real estate market seems to have slowed down a bit over the past few months -- but it is still moving very, very quickly! | |
| Newer Posts | Older Posts |
Scott Rogers
Funkhouser Real
Estate Group
540-578-0102
scott@funkhousergroup.com
Licensed in the
Commonwealth of Virginia
Home Search
Housing Market Report
Harrisonburg Townhouses
Walk Through This Home
Investment Properties
Harrisonburg Foreclosures
Property Transfers
New Listings

