News
| Newer Posts | Older Posts |
City of Harrisonburg Considers 5% Increase In Real Estate Tax Rate |
|
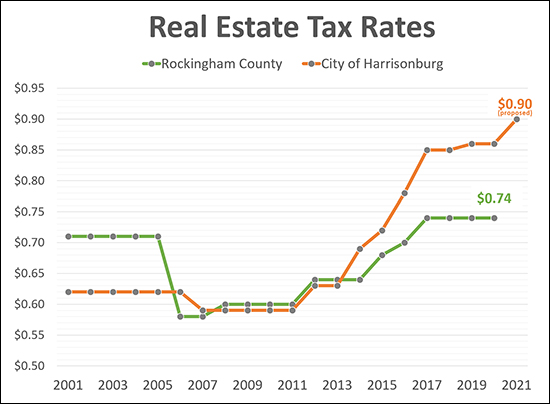 Here's the current lay of the land as it relates to real estate taxes in the City of Harrisonburg...
Harrisonburg City Council is considering an increase in the real estate tax rate...
Stay tuned for further news of decisions from City Council as to changes in the real estate tax rate! | |
Home Sales Up 19% In Harrisonburg, Rockingham County In 2021 |
|
 Happy bright, sunny, soon-to-be-hot, Wednesday morning to you! Curious about how things are going in our local real estate market? Here's a snapshot of what now just seems like a typical day in the local real estate market... Driving To Work In The Morning: "Oh, look, that house was just listed for sale!" Driving Home From Work In The Evening: "Wait!? What!? Already under contract!?" Indeed, homes are selling FAST right now - often with multiple offers - often selling over their asking price. Feel free to download a PDF of my full market report or keep reading as I dive into the data to take a closer look at the latest trends... 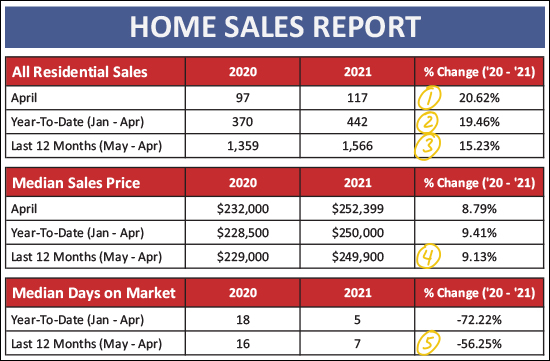 As shown above...
So, if April 2021 home sales were way above April 2020, how did they compare to other recent months of April? 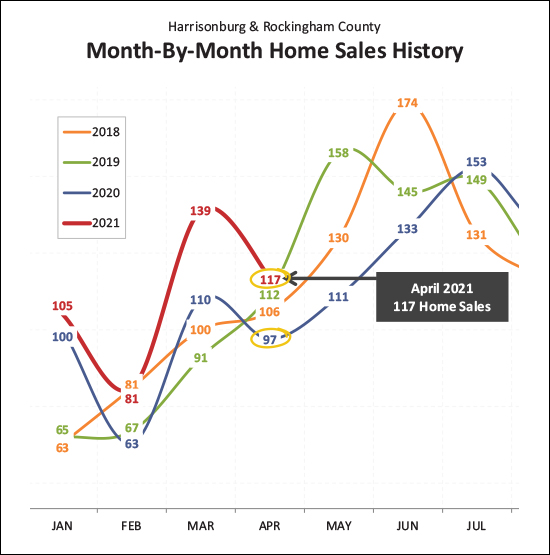 As shown above, this month of April -- with 117 home sales -- was the strongest recent month of April. The next strongest month of April was in 2019 when we saw 112 home sales. Looking ahead, it seems likely that we'll see somewhere between 130 and 160 home sales in May, if 2018 and 2019 are a good guide. It seems unlikely that we'll sink as low as the 111 home sales we saw in 2020 during the start of Covid. Slicing and dicing things a bit differently, this year has stacked up quite nicely compared to past years... 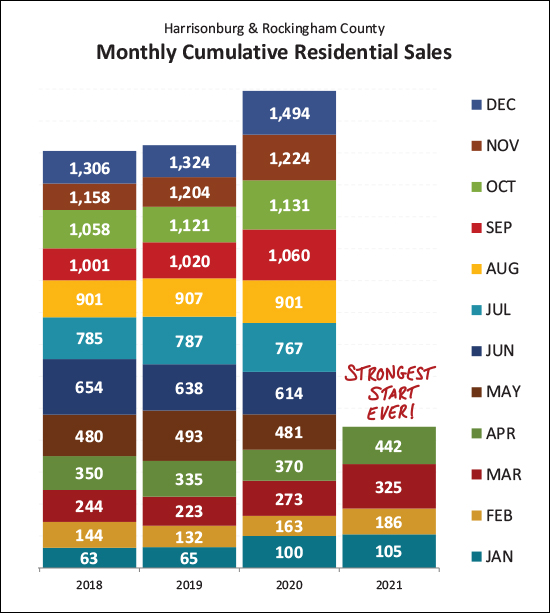 With 442 home sales in the first four months of this year, this is a very strong start compared to the past few years, and even most/all of the years prior that are not shown! Here's another visualization of the surge of home sales activity we have been experiencing over the past year... 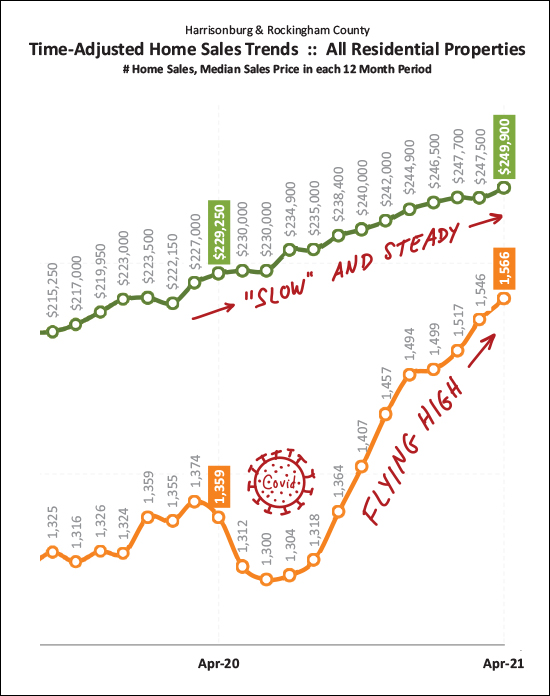 The orange line above is the one that looks a bit odd right now - largely due to Covid. After seeing the annualized pace of home sales steadily increase for several years, things dropped off quickly between April and July of 2020 due to the onset of Covid. But then, things started heating up -- quickly! Home sales have been flying high, increasing ever further and faster, for the past nine months and aren't showing any signs of slowing down. Sales prices, on the other hand, didn't take a nose dive last spring -- they have been "slowly" and steadily plodding along and upward. I say "slowly" because the increase has not been at the same breakneck speed of home sales -- but we have seen a much higher than normal (9%) increase in sales prices over the past year. What should we expect over the next few months, you might ask? 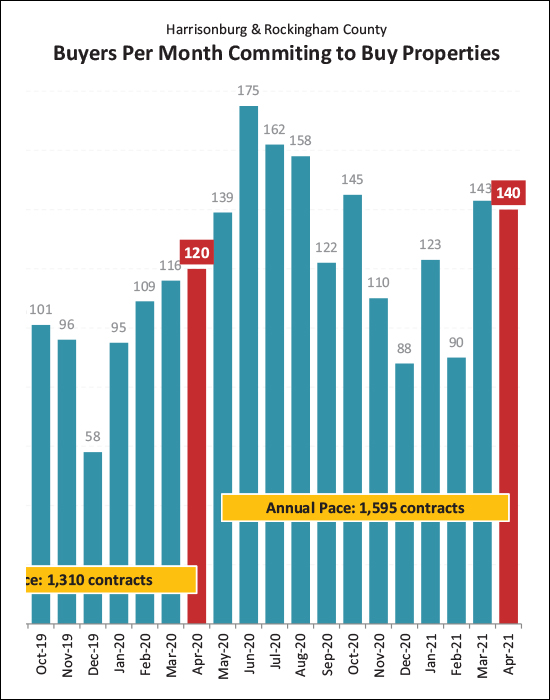 We have seen many more contracts over the past two months (143, 140) than we saw during those same months last year (116, 120) though - to be fair - last March and April were an uncertain time due to Covid. The number of contracts signed over the past two months does, though, indicate that we'll see strong months of closed sales over the next two months -- and we're still at the front end of the strongest six months of the year as far as the number of homes that sell in Harrisonburg and Rockingham County. So, don't expect things to slow down or calm down anytime soon! Several folks have asked me over the past month -- how can so many homes be selling when inventory levels are so low!? 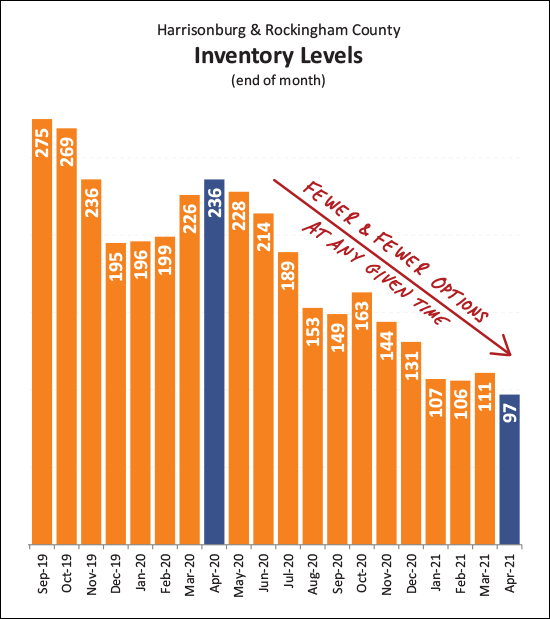 Indeed, a confusing phenomenon, at first. There are fewer houses on the market right now than at any time in the past several years. Buyers today have less than 100 homes to choose from in all of Harrisonburg and Rockingham County. But -- that doesn't tell the whole story. Quite a few new listings come on the market each month -- giving buyers quite a few choices over a month long period -- but because so many of those new listings are going under contract so quickly, the influx of new listings never has a net impact on the number of houses remaining actively for sale at the end of each month. So - you won't have many options of homes to buy in a single day, but if you can give it a few weeks or months, you should have plenty of options over time. Did I mention that homes are going under contract quickly? 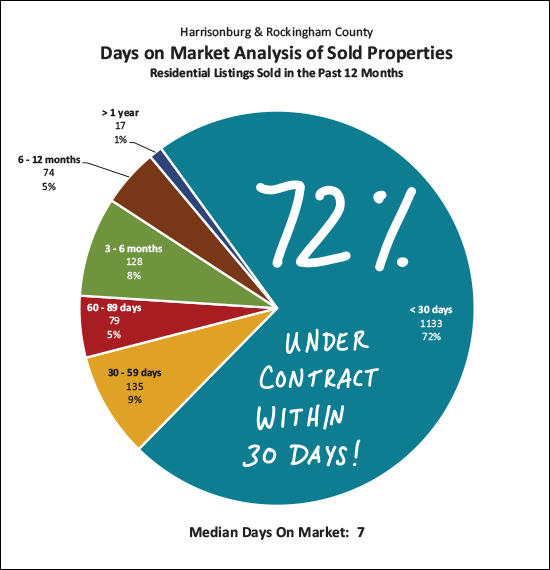 Over the past year, 72% of homes have gone under contract within 30 days -- and half of homes have gone under contract within 7 days!?! This rapid pace of buyers signing contracts on homes is what is keeping inventory levels so low. If you're just entering into the market to buy, you'll likely be astonished / disappointed by how few options you have right now -- but again -- just give it a bit of time and evaluate those new listings as they come on the market -- but do so quickly, before they are under contract! If you're fortunate enough to secure a contract on a house, you are likely excited about the low interest rate you'll have on your new mortgage... 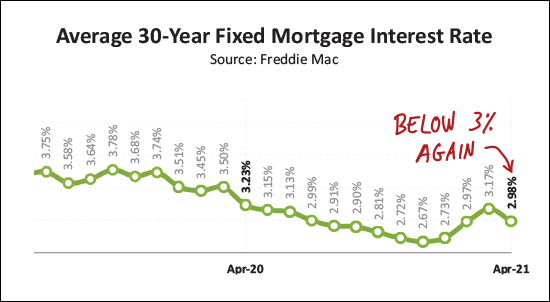 After having started rising -- above 3% -- the average 30 year fixed mortgage interest rate has dropped (barely) below 3% again. This is an outstanding (and historically low) interest rate that gives current home buyers a unique opportunity to lock in a low long term interest rate on your mortgage. So, there we have it. Lots of homes are selling, quickly, at higher prices than ever. What is a seller to do?
What is a buyer to do?
If you're thinking about buying or selling soon and would like to talk a bit more about your particular situation, I'm happy to meet with you or set up a time to chat by phone or zoom. Simply reply to this email or text/call me at 540-578-0102. Best wishes for a pleasant balance of the month of May, and I'll be in touch again in June! | |
The Morning Brew on whether the housing market will crash like it did in 2008 |
|
 Do you read the Morning Brew? It's a daily email with top new stories in a format that is enjoyable to read. Subscribe here if you are interested. Here's an excerpt from today's Morning Brew that is applicable to the sort of things I usually share with you in this space...
Again, sign up for other great content from the Morning Brew here, and let me know if you agree with their editor's take on the future of the housing market. | |
Home Sales Soar In First Quarter of 2021 in Harrisonburg, Rockingham County |
|
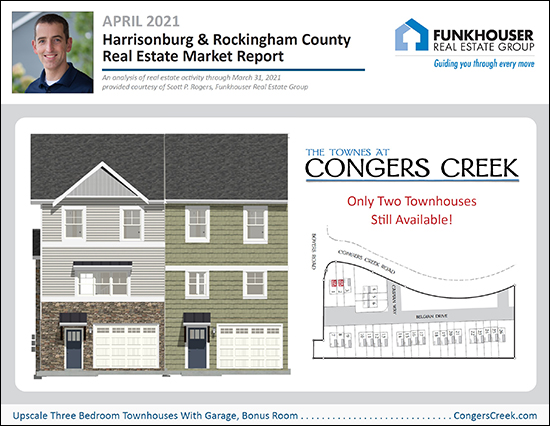 Happy not-really-tax-day, friends! (taxes are due May 17 this year) What a wild first three months of the year it has been thus far in the Harrisonburg and Rockingham County real estate market! Before starting to pick through the data to find some meaningful insights, here are a few general notes for you...
Now, let's dive right into the data and see what we can learn about our local housing market... 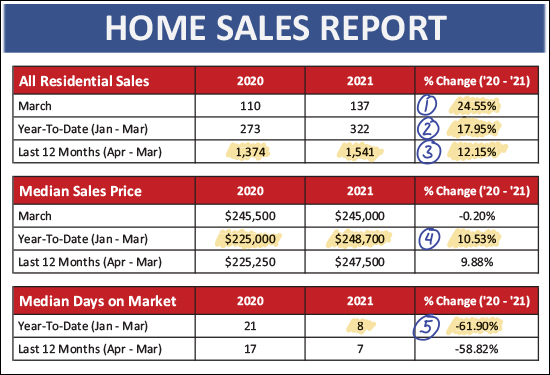 OK, some of these numbers (above) are just bonkers...
Now, then, let's take a look at a break down of detached homes (single family homes) and attached homes (duplexes, townhomes, condos)... 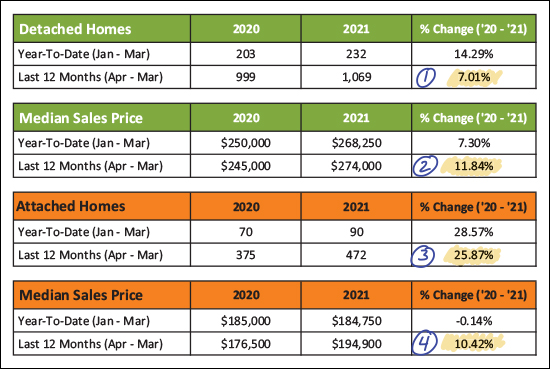 A few things to note when we look at this data sliced a bit differently than in the first data table... [ 1 & 3 ] While sales of detached homes increased 7% over the past year compared to the prior year, sales of attached homes increased 26% during that same timeframe. [ 2 & 4 ] The median sales price of detached homes increased 12% over the past year which is just slightly higher than the 10% increase in the median sales price of attached homes. Chopping the data up one more time by City vs. County we can note some differences as to how these two portions of our local market are performing... 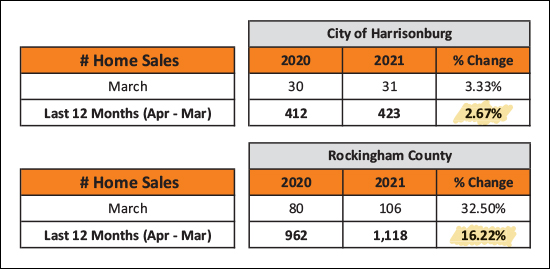 The data above is just looking at where we are seeing home sales increase and by how much. Over the past year there has been a 3% increase in the number of homes selling in the City -- while there has been a 16% increase in the number of homes selling in the County. I believe this is primarily because the majority of new construction is now happening in the County -- thus those sales numbers have more of an ability to grow as compared to the City numbers where most home sales are resales. OK, next, let's visually contextualize that exciting month of March... 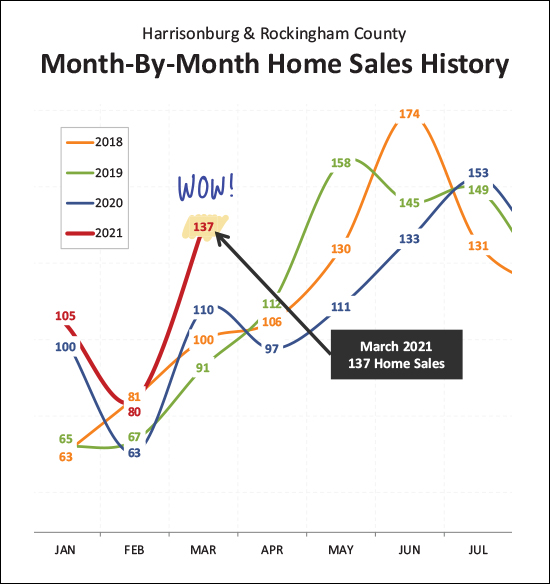 Indeed, March was a BUSY month of home sales in Harrisonburg and Rockingham County. While I am only showing three years of data above, the file I'm working in when I create these reports includes data all the way back to 2003 when I started in real estate. There has never, in that time, been a month of March where we have had 137 or more home sales in Harrisonburg and Rockingham County! Given contract data (we'll look at that a bit later) it seems likely that we will see another strong month of sales in April and May, which means the year is likely shaping up to be a year of a LOT of home sales. Which leads me to... 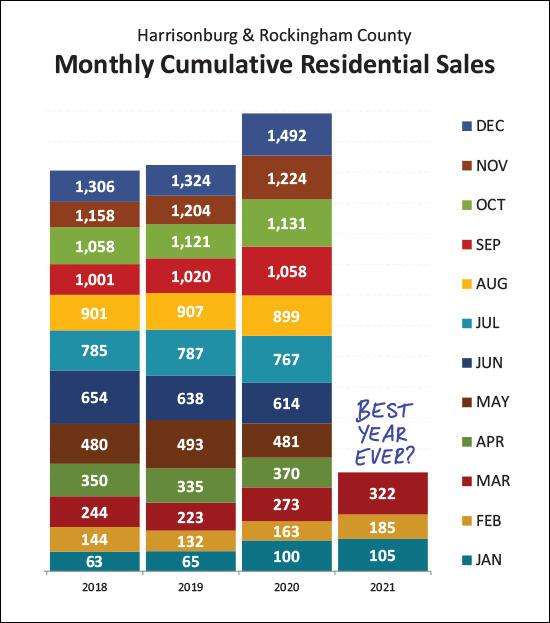 I put this graph together by stacking each month of home sales on top of the prior to see how each new year stacks up in comparison to past years. As you can see, above, this year (2021) is currently poised to be the best year ever as far as the number of properties selling in Harrisonburg and Rockingham County. So, lots of homes selling, how did we get here? 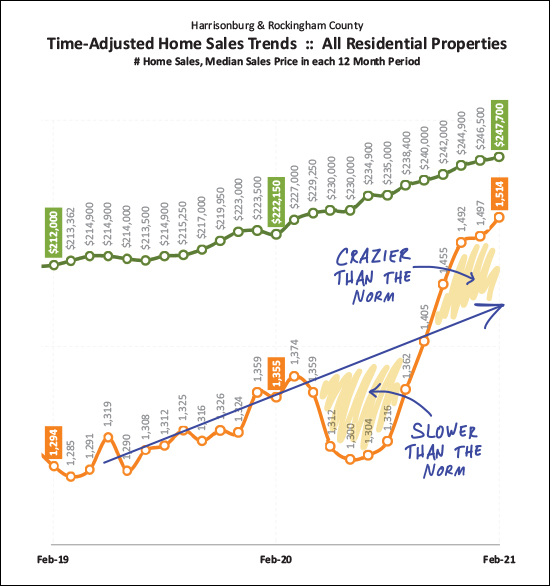 We didn't get here (1500+ home sales) without some turbulence. A year ago we had seen a slow and steady increase from 1300 sales/year up to 1350 sales/year. Then the COVID dip and then the COVID spike! Looking back, we had a five month period with far fewer home sales than we would have expected given our overall trajectory. And now, we are in the fourth month of what a much (much!) more active market than we would have expected given our overall trajectory. Now, you might find yourself saying that things have been crazy for MUCH longer than four months. Yes, you are right. The graph above is looking at a rolling 12 months of home sales, which evens out some of the peaks and valleys of home sale seasonality, but also can mean it takes longer for overall trends to appear. And yes, I know you probably didn't need a graph to tell you that a lot of homes are selling these days... but this graph made me realize that these two conflicting realities are being experienced daily in our local market...
But I digress. Lots of homes have been selling. What is to come over the next few months? 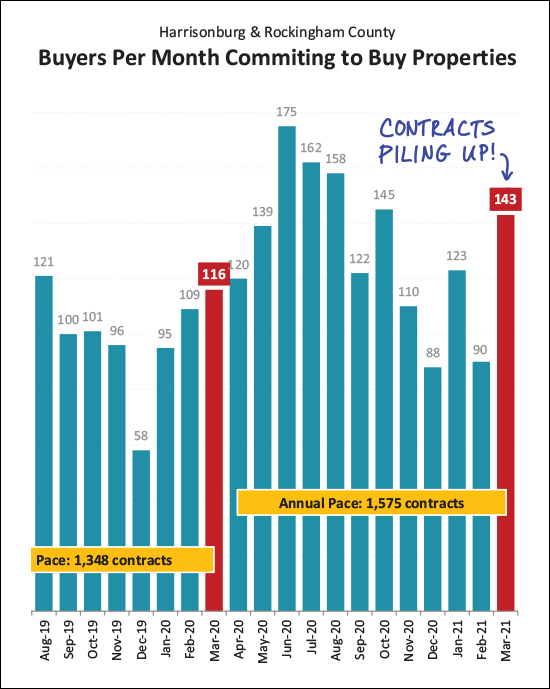 Well, based on a STRONG month of contract activity in March (143 contracts) it would seem that we'll continue to have strong months of home sales in the coming month or two. Furthermore, we're entering into what is typically one of the busiest seasons for buyers to be buying homes, so I expect contracts and closed sales to continue to stay at higher levels for the next five or six months, at least! And now, I think I mentioned (or you may have heard) that there aren't many homes for sale right now... 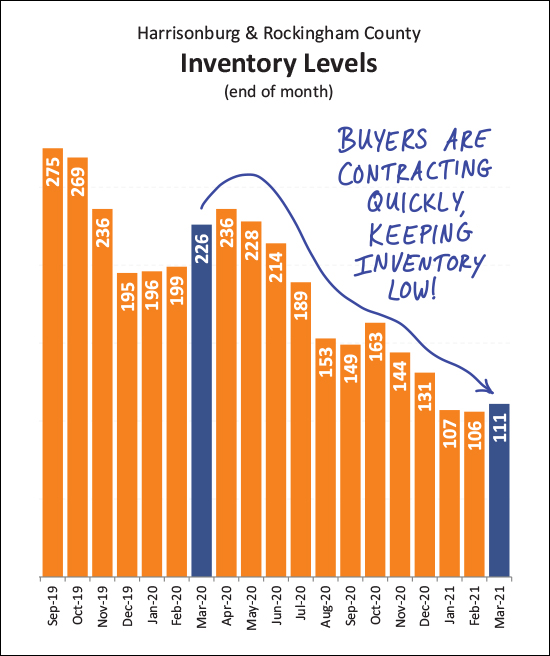 Yes, it is true. Even though we are seeing an ever increasing number of homes selling, we are also seeing an ever declining number of available listings. As I recently commented to a client, if we start the month with low inventory and 5,000 homes are listed for sale and 5,000 homes go under contract, we will still end the month with low inventory. As such, understand low inventory fully by remembering that...
Finally, just one more graph for your perusal... 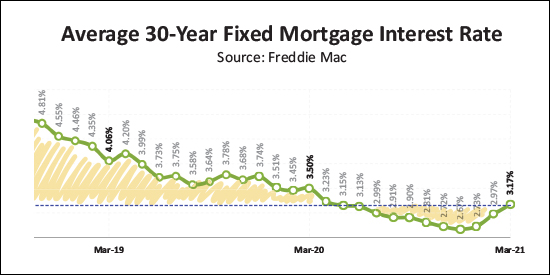 This graph shows trends in the average 30 year fixed rate mortgage interest rate and there are a few things to note here as well...
Alright, that's all I have for you at this point. You are now up to speed on the latest news and developments in our local housing market. But if you are thinking about buying or selling sometime soon, these general market trends are only part of what you want (and need to know) as you also should dig into the market in which you are hoping to buy or sell -- whether that is best defined by price range, location, property type, etc. If I can be of help to you as you make plans to list your home for sale, or to seek a home to purchase, just let me know. I'd be happy to meet with you in person, via Zoom, or to chat by phone to help you think and talk through the possibilities. You can reach me at scott@hhtdy.com or via phone/text at 540-578-0102. Until we chat, or until I write again, here a few final tips... Sellers - Even though the market is hot, you still need to prepare your home well, price it appropriately based on historical sales data and market it thoroughly and professionally. Buyers - Get prequalified for a mortgage, start stalking new listings, go see them on the first day they hit the market, and get ready to compete in a multiple offer situation. Seller / Buyers - If you need to (or want to) sell in order to buy, this will require a bit more strategery than normal. It can be done, but we need a solid plan in place from the start. | |
The Harrisonburg Area Real Estate Market Is As Strong As Ever Two Months Into 2021! |
|
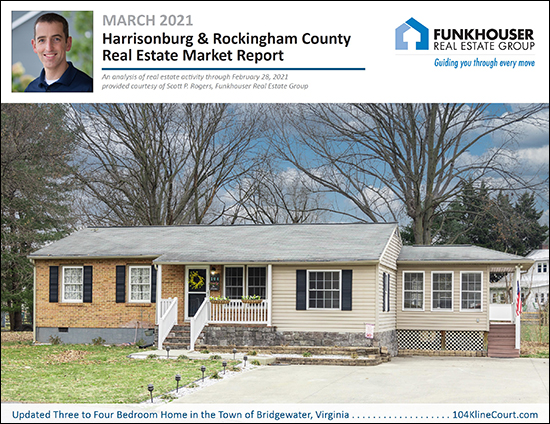 Happy Thursday morning to you! It's been a busy week on my end, what with St. Patrick's Day yesterday, and my daughter's 13th birthday the day before (Happy Birthday Emily!) so forgive me for the slight delay in getting the news to you that... The Harrisonburg Area Real Estate Market Is As Strong As Ever Two Months Into 2021! Before I dive into the data below, a few quick links...
Now, on to the data... 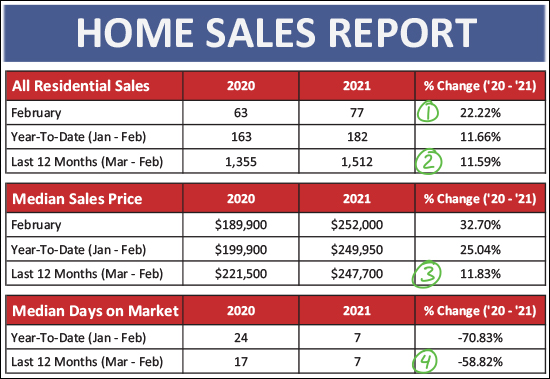 As shown above, with St. Patrick's Day green numbers for ya, you'll note that...
So -- more home sales, at higher prices, selling more quickly! Sounds like a good time to be a seller and a bit less exciting of a time to be a buyer! What might develop as we finish out March? 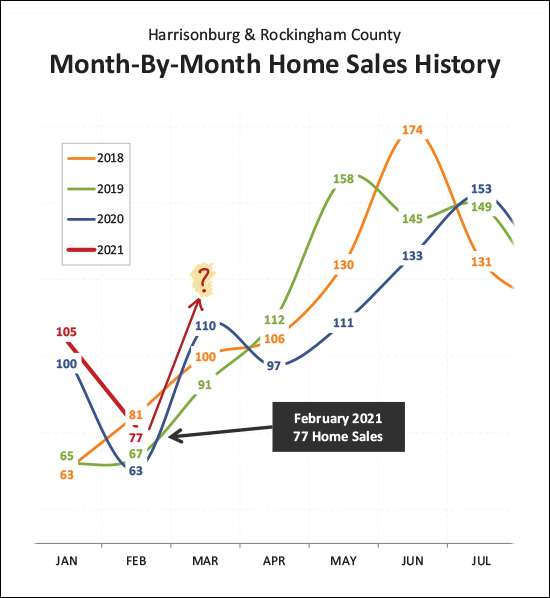 You might notice that the 77 home sales seen in February 2021 was higher than last February (63) but was not the strongest recent month of February home sales. There were 81 home sales back in February 2018. Looking ahead to March, will we see more than 110 home sales close? It seems quite possible! Here's the data stacked up a bit differently... 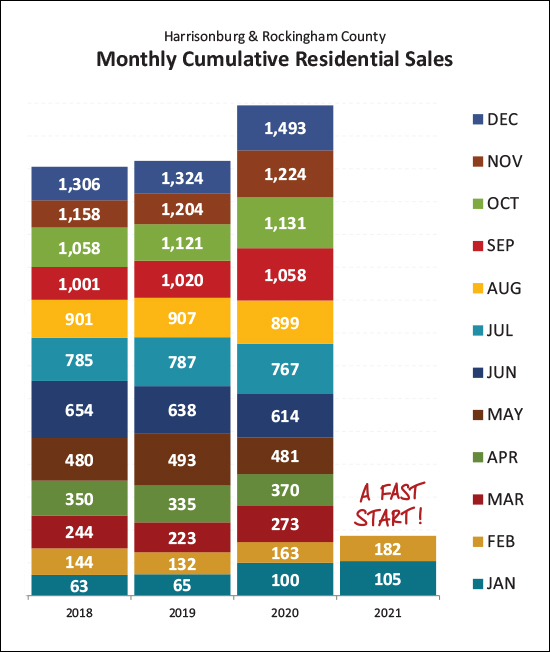 As shown above, the January + February sales pace during 2021 of 182 home sales is the fastest start we've seen in the past several years. This is a good indication (though not a guarantee) that a relatively strong year of home sales lies ahead of us. You've seen a version of this graph below, but it surprises me again every time I see it... 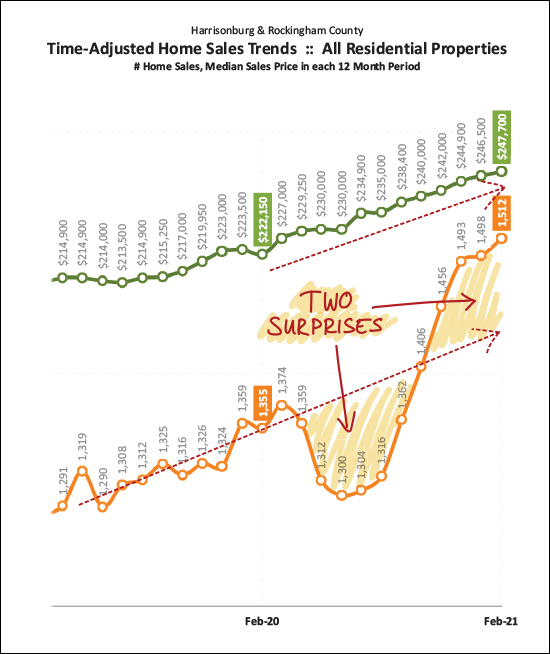 The orange line (above) is tracking the number of home sales per year -- measured each month. Throughout 2019 and into the beginning of 2020 this was steadily increasing, from just below 1300 to nearly 1400. Then, Covid hit -- and within a few months the annual pace of home sales had dropped back down to 1300 sales per year. That's the downward dip shown above. Then, as we made it into the summer and fall (and winter) of 2020, the pace of home sales picked up incredible momentum, and accelerated beyond where we might have expected it to have been otherwise -- as shown with the dashed red line. All the while, the median sales price just kept on climbing, up to its current level of $247,700 as compared to $222,150 a year ago. So, Covid dealt us two surprises -- a rapid slow down and then a fast and furious rebound! 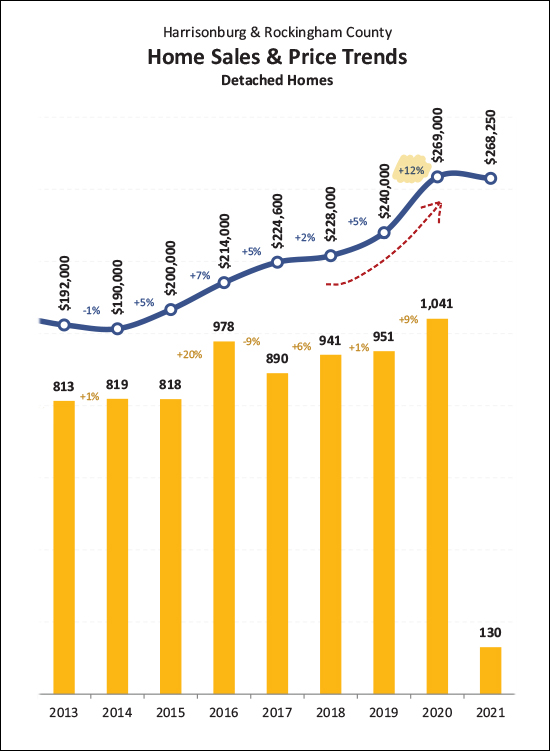 As noted previously, sales prices are on the rise. The median sales price of all detached homes (not duplexes, townhouses or condos) sold in Harrisonburg and Rockingham County (via the HRAR MLS) rose 12% in 2020 -- from $240,000 up to $269,000. If you bought a home in the past year, you likely paid 5% to 15% more than you would have a year prior. Not as fun for you as a buyer -- though the seller on the other end of your purchase transaction likely thoroughly enjoyed that increase! Looking ahead, again... 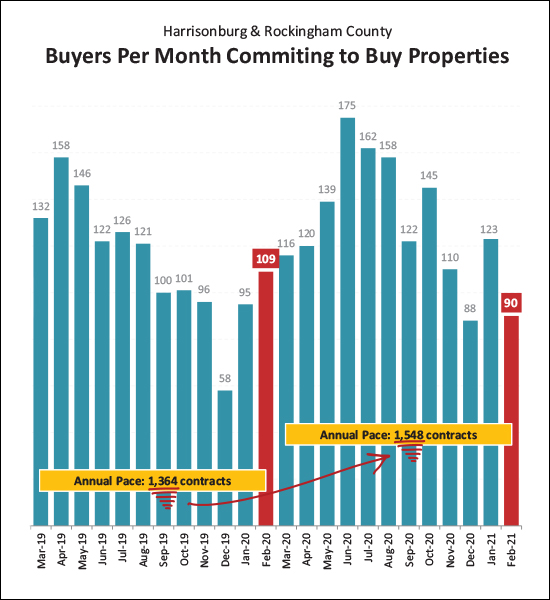 While we have seen a significant increase in the annual pace of contracts being signed (1364/year up to 1548/year) the number of contracts signed in February did actually drop off a bit from last year. Admittedly, the January 2021 contracts helped keep the Jan/Feb numbers higher this year than last, but this February did have a bit slower pace of contract signing than I expected. Maybe this smaller number of contracts has something to do with inventory levels?? 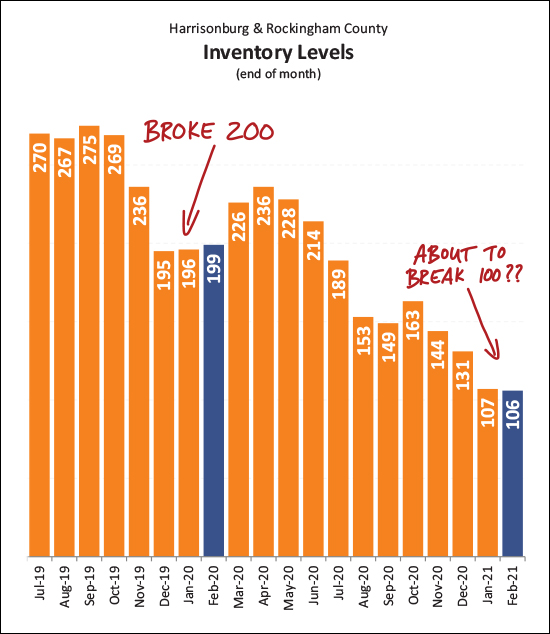 A year-ish ago I thought it was quite something that we had broken through the 200 mark -- and all of a sudden we were in the 190's as far as the number of homes for sale in all of Harrisonburg and Rockingham County. But now -- we might break through the 100 mark?? A month ago there were 107 homes for sale -- now 106. Please, let's keep it to triple digits -- let's not get down to only 95 or 97 homes for sale!? One of the reasons buyers haven't minded (too terribly) that they were paying higher prices for homes over the past year was because mortgage interest rates were soooooo low... 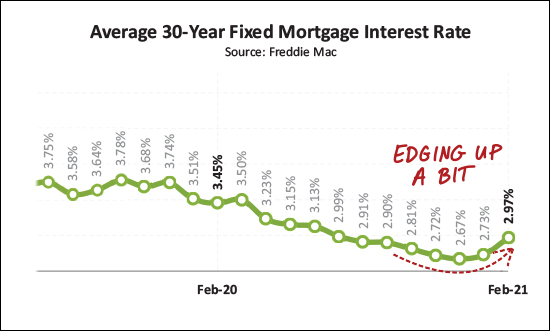 But now, yes, mortgage interest rates are starting to rise a bit. It doesn't seem likely that they will rise dramatically through 2021, but the lows of being below 2.75% might be (??) behind us for good. OK -- I'll wrap it up there for now. A bit less than a month from now I'll send you another update on where we are a full quarter of the way through the year. My how time flies! Until then... Sellers - Even though the market is hot, you still need to prepare your home well, price it appropriately based on historical sales data and market it thoroughly and professionally. Buyers - Get prequalified for a mortgage, start stalking new listings, go see them on the first day they hit the market, and get ready to compete in a multiple offer situation. Seller / Buyers - If you need to (or want to) sell in order to buy, this will require a bit more strategery :-) than normal. It can be done, but we need a solid plan in place from the start. | |
Home Sales Up, Prices Up, Inventory Down in January 2021 |
|
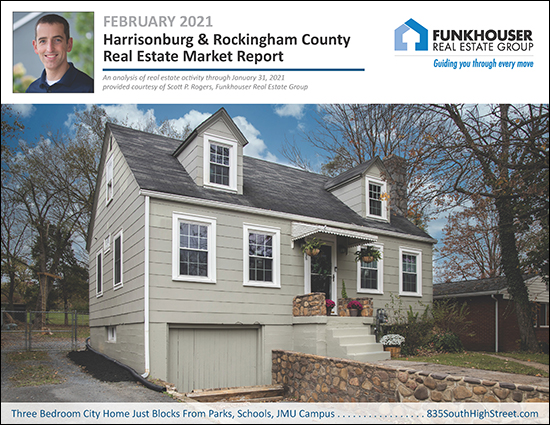 Happy Wintry Monday Morning, friends! It looks like it might be a touch above freezing temperatures today, so perhaps some of the lingering snow and ice and will start to melt today. This has been one of the coldest and snowiest and iciest months of January / February that I can remember anytime recently in the Harrisonburg area! As a preview of where we're headed in this overview of the local real estate market:
So, no huge surprises. It seems the 2021 housing market is trying to keep the momentum going from 2020. Read on for a recap of what is happening in our local housing market or:
Now, onto the data and some pretty charts and graphs... 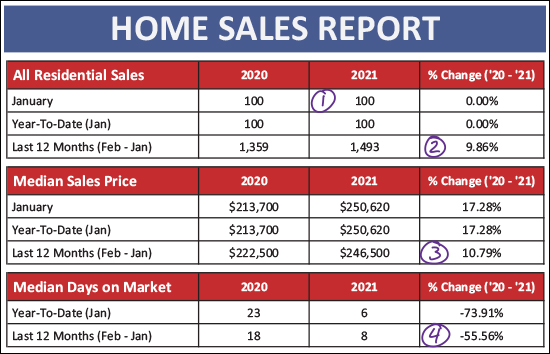 A few observations from the overview data presented above...
Now, I was telling you that January was a bit unusual, even though it was a repeat of last January, right? Let's take a look... 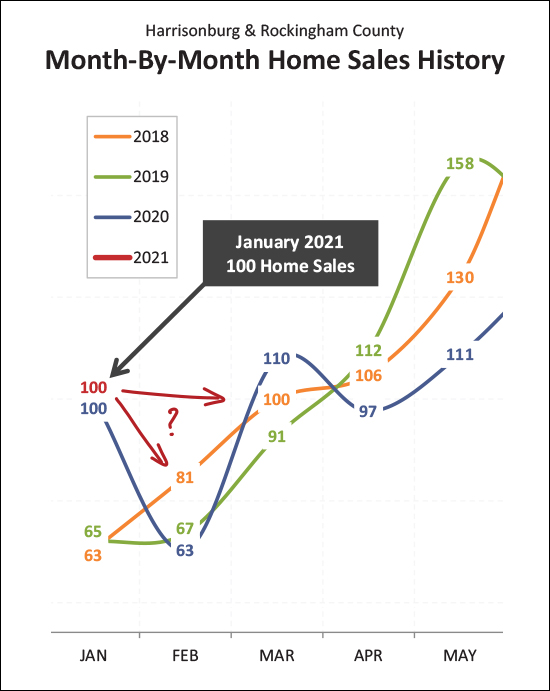 Indeed, the 100 home sales we saw in January 2021 was merely a repeat of January 2020 -- boring! ;-) -- but that is many more home sales than we typically see in January. We usually see 60 to 70 home sales in the month of January. Last year's super strong month of 100 home sales was followed by a super slow month of only 63 home sales in February. Stay tuned to find out whether home sales will again quickly slide downward in February, or will remain strong. Keep reading to see how many people signed contracts in January, which might be at least some indication of what we'll see as far as February sales. Looking for a big picture graph that summarizes what has been happening in our local housing market over the past year? It's this funny looking one... 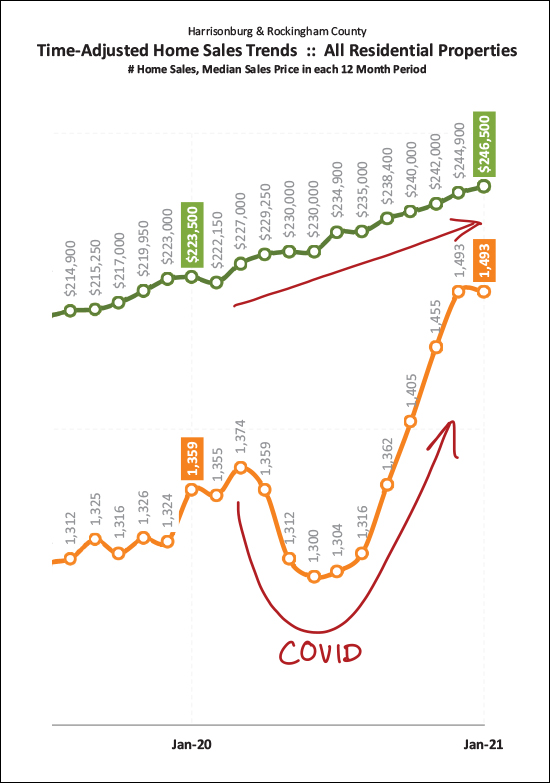 Starting with the bottom, orange, line -- this is showing the number of home sales per year for each of the past 12+ months. You'll note that the annual pace of home sales took a nose dive last year between April and August, which are usually the strongest months of the year for home sales. But then, home sales took off quickly in the fall and continued to accelerate into winter, leading to huge rebound in the pace of home sales in our area. This seems to mostly be able to be attributed to COVID. There was a lot of uncertainty in the market in March, April, May, etc. which slowed down home sales, but then as people realized that the housing market wasn't falling apart AND they realized that their homes weren't working as well for them when they were in them 95% of the time (thanks, COVID) AND they realized that super low interest rates made it a compelling time to upgrade their home, we saw home sales take off quickly! The top, green line, then is the median sales price. We have been seeing steadily increasing sales prices in our local area for the past few years and those prices kept marching upward quickly in 2020. The annualized median sales price at the end of January 2021 was $246,500 -- a significant increase above a year ago when it was $223,500. So, remember that I mentioned that January contracts might give us an idea of what to expect for February sales? Let's take a look... 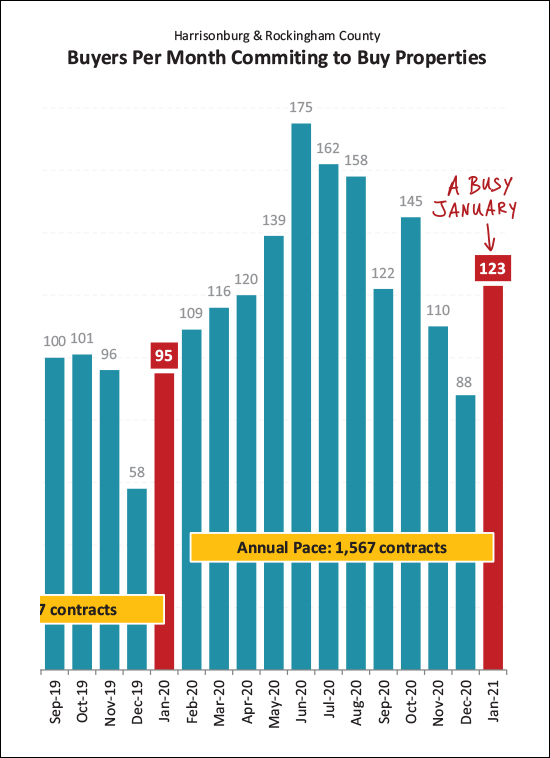 It seems January wasn't just a busy month of closings - it was also a busy month for buyers (and sellers) signing contracts to buy (and sell) homes. There were 95 contracts signed in January 2020, and 123 in January 2021! As such, it seems likely that February (and March) will be busy months for closed home sales. What's it like buying a home these days? It can be a bit challenging, and stressful, mostly because of the very (very, very) low inventory levels at any given point... 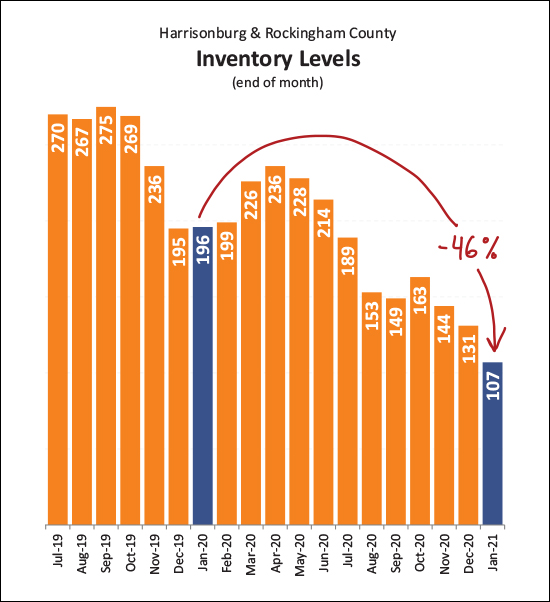 A year ago, a buyer would have been choosing from 196 homes on the market in Harrisonburg and Rockingham County. Today, there are only 107 homes on the market for sale!?! This huge (46%) decline in inventory levels means that a buyer doesn't have a whole lot of options at any given moment in time. Now, that's not to say that they don't have options at all -- they do. If we see 1400 home sales over the next 12 months it will be because around 1400 homes will be listed for sale. So, there will be plenty of options of what a buyer might buy -- but if recent market dynamics continue through 2021, most of those new listings will go under contract quickly (median of eight days on the market) which will keep the inventory levels quite low! Finally, those interest rates. Yes, they are still low... 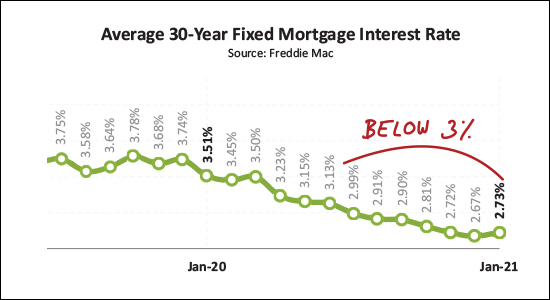 Some part of what fueled the wild real estate market in 2020 was super low mortgage interest rates. As shown above, the average 30 year fixed mortgage interest rate has been below 3% for over six months now. This has kept monthly housing prices affordable for buyers amidst rising prices and has also allowed plenty of folks to refinance and see cost savings on a monthly basis. So there we have it. We're a month (ok, really a month and a half) into 2021 and thus far we're seeing a continuation of the strong local housing market that we saw in 2020. Generally speaking that means it will be pretty fun to be a seller, pretty challenging to be a buyer, and you'll get to experience the full range of emotions of you are selling AND buying! If you are making plans for selling or buying in spring 2021... Sellers - Even though the market is hot, you still need to prepare your home well, price it appropriately based on historical sales data and market it thoroughly and professionally. Buyers - Get prequalified for a mortgage, start stalking new listings, go see them on the first day they hit the market, and get ready to compete in a multiple offer situation. Seller / Buyers - If you need to (or want to) sell in order to buy, this will require a bit more strategery :-) than normal. It can be done, but we need a solid plan in place from the start. If I can be of help to you as you start to think about the possibility of making a move, selling your home, buying a new one, etc. -- just let me know. I'd be happy to meet with you in person, via Zoom, or to chat by phone to help you think and talk through the possibilities. You can reach me at scott@hhtdy.com or via phone/text at 540-578-0102. Enjoy the second half of February, and we'll check in again in early March! | |
Did City Home Prices Really Drop For The First Time Since Spring 2019? |
|
 Today's edition of the Daily News Record leads with a story about home prices dropping in the City of Harrisonburg. The headline and much of the article might cause you to misunderstand the bigger picture of what is going on with City home prices. After all, most people would read that and say "oh, City home prices have fallen" when I think most people would come to a different conclusion when examining the actual data and/or if trying to buy a home in the City right now. :-) Let's dig in... The article states that the "median sales price dropped from $214,400 in the fourth quarter of 2019 to $205,200 in the fourth quarter of 2020, a difference of 4%" which is from data provided by the Harrisonburg Rockingham Association of Realtors. Here's the problem... The City is sufficiently small such that there aren't many home sales per quarter (only 116 in 2020-Q4) and thus the data can lead you to the wrong conclusions if you are looking at too small of a data set. When looking at just one quarter of data...
Oh my, home prices are falling, right? But let's look to see what happens when you expand the data set to include a longer time period to avoid improper conclusions drawn from smaller data sets...
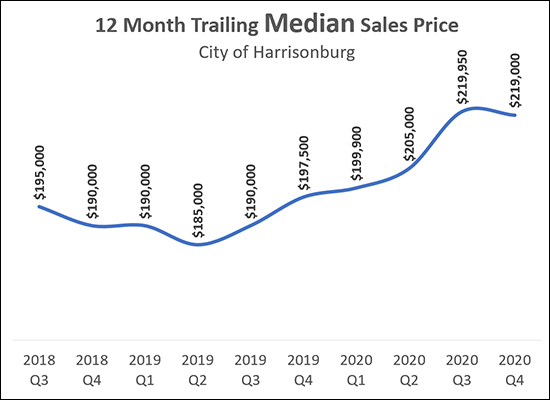
Are home prices falling? It seems they have actually risen 11% over the past year. The graph above attempts to offer a slightly clearer picture of home prices. It shows the median sales price over a 12 month period for each of the past (10) quarters. You'll note that the median sales price has been steadily increasing over the past several years. Did it tick downward slightly in 2020 Q4? Yes. By $950. Could it decline further as we get through 2021 Q1 and 2021 Q2? Yes, certainly. Anything is possible. Is it accurate to say that City home prices dropped in 2020 Q4? I guess? Technically? But that seems to be focusing in pretty narrowly and missing the larger picture. But you tell me -- what does the data say to you? | |
At Year End, Home Sales Up 13%, Prices Up 10% in 2020 in Harrisonburg, Rockingham County |
|
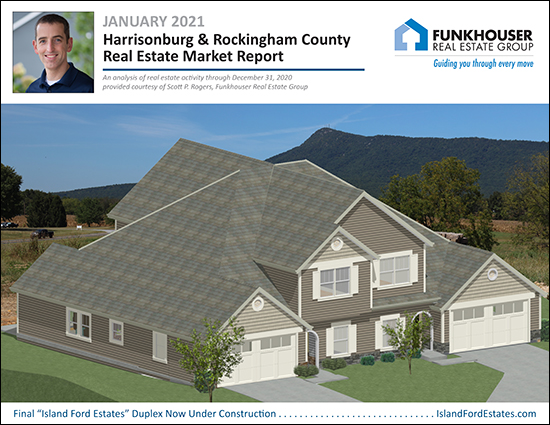 Happy New Year, friends! 2020 was a year like no other - in our local housing market - and in many (many!) other ways. I hope you and your family are doing well, staying healthy, and are full of hope looking forward to the year ahead! Below, I'll walk you through some of the overall trends we are seeing in our local housing market when reflecting back on a full year of 2020 home sales data. Before we get started, though, check out the featured home above here and feel free to download the full PDF of my market report here. Now, to the data... 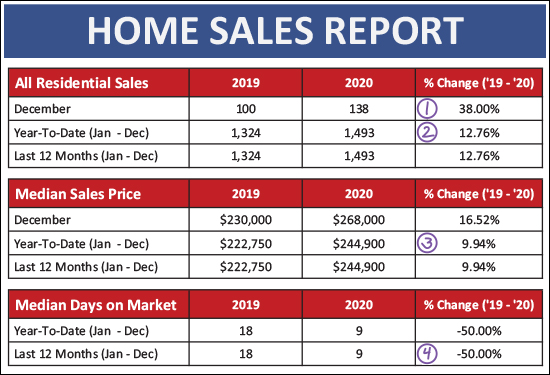 What a wild finish to the year! A few things to note when looking at this overall data...
Looking a bit further, let's break down the detached homes as compared to attached homes. Attached homes are duplexes, townhomes and condominiums. 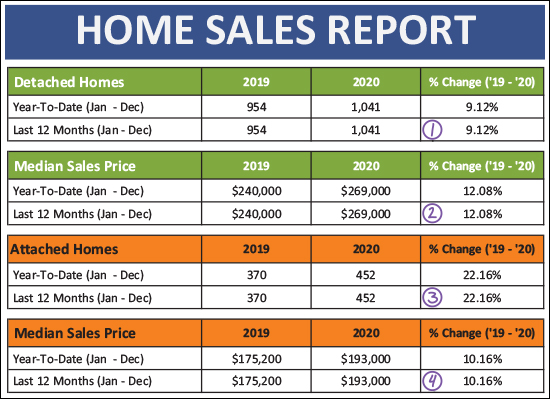 As you can see above...
It's hard to think of the best metaphor for the monthly pace of home sales in 2020. Perhaps someone running a race that tripped and fell and slowed down considerably a third of the way into the race, but who slowly picked up speed over the next third of the race and who absolutely SPRINTED through the final third of the race? 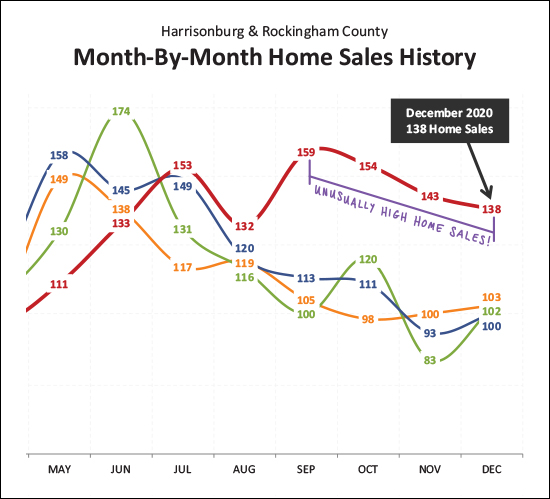 Take a look at September through December of 2020 above, marked with a red line. This is not normal / typical / expected. We expect to see an average of about 100 home sales per month for the last four months of the year. In 2020, it was an average of 149 home sales per month! This, clearly, makes me hesitant to guess about what we'll see in January and February. These winter months are typically the slowest months of the year for home sales -- but not in 2020. I expect we'll continue to see stronger than usual home sales for at least the first few months of 2021. And, looking at those sales on an annual basis... 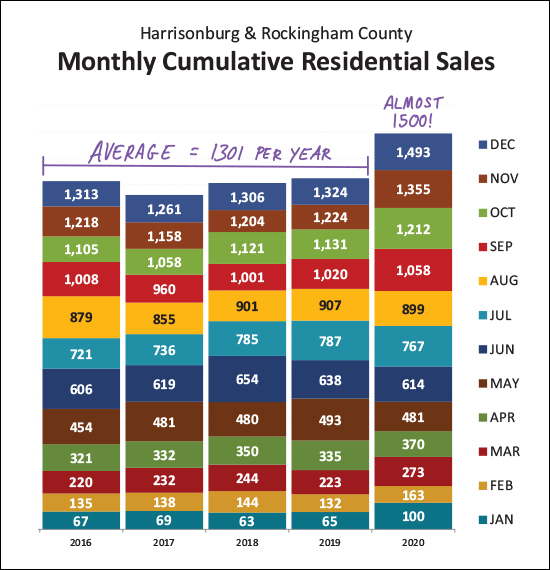 If you track along any particular color band in the graph above you can see where we were at that point of the year for each of the past five years. In August (yellow) of 2020 we were tracking right around where we would expect to be based on 2019 sales. But then those last four months of the year happened, catapulting us waaaaay ahead of where we have been for any recent year in Harrisonburg and Rockingham County! Here's an even crazier look at what has been happening for the past four months... 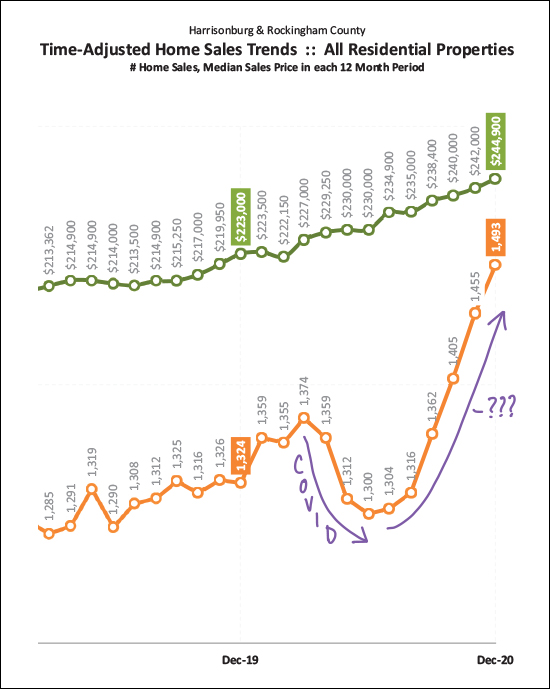 The more interesting (confusing!?) line above is the orange one. That is showing the number of home sales we're seeing per year in our area. That trajectory took a nose dive in early 2020 thanks to COVID but has been absolutely skyrocketing over the past four months. Why, why, why? Here are some guesses...
OK, I went on a bit more than I expected there, let's look one more time at the annual trends before we move on... 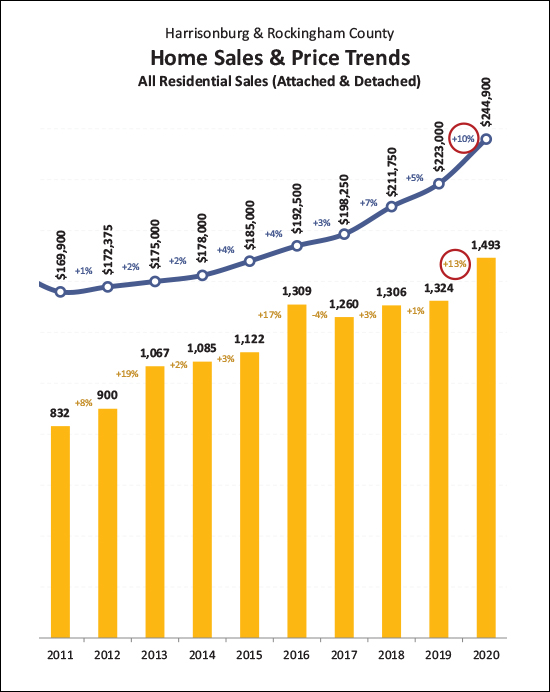 Two main things to note above...
Now, looking briefly at what is to come... 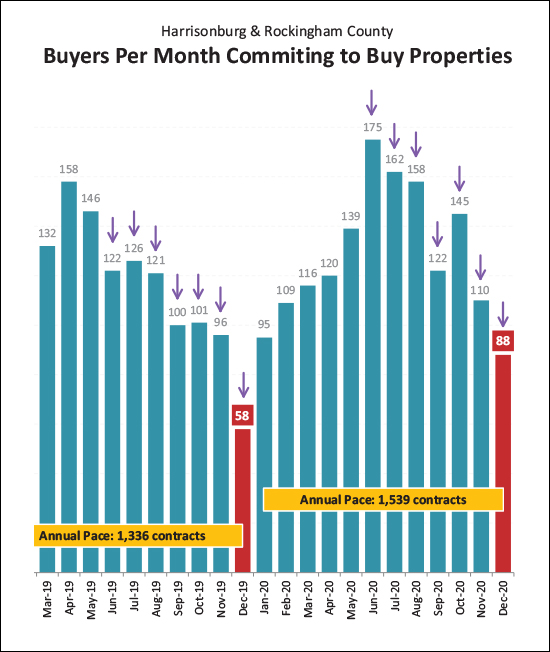 After I meticulously drew all of those purple arrows to point something out (see below) I realized it might seem like I was saying those numbers were decreasing. They're not. I didn't re-draw the arrows. You'll forgive me? OK - now to the point -- if you look at the seven purple arrows on the left you'll see that I'm pointing out the contracts signed between June and December of 2019 -- a total of 724 contracts. The seven purple arrows on the right are pointing out the contracts signed between June and December of 2020 -- a total of 960 contracts. So -- here's that evidence of a big increase in contract activity in the second half of the year. We saw that bear itself out in lots of closed sales between September and December, and I think that is going to keep on rolling into January and February. I expect we will see stronger than normal months of home sales for the first few months of 2021 if not longer. As I've alluded to a few times thus far, there is a lot of competition amongst buyers as each new listing hits the market. This abundance of buyers in the market, and scarcity of sellers, has caused continued downward shifts in inventory levels... 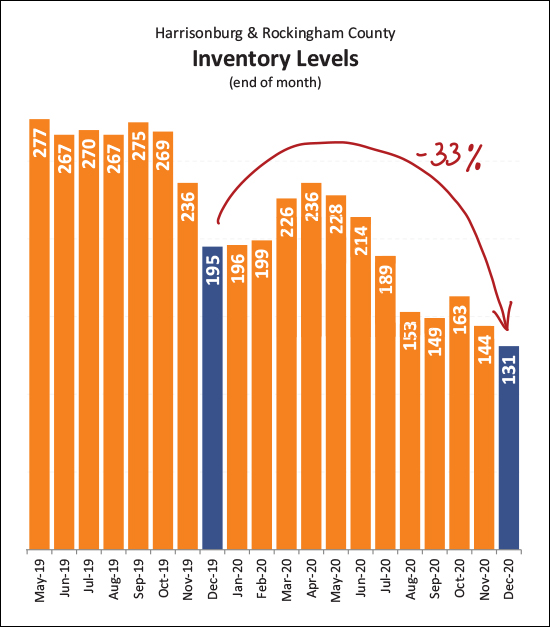 As you can see above, end-of-year inventory levels fell 33% over the past year. The important detail to note here is that these are just "moment in time" inventory levels. How many homes are on the market, actively listed for sale, on a particular day. Clearly, the 33% decline in inventory levels did not result in a decline in home sales in 2020. Perhaps it's actually the other way around -- the 13% increase in home sales in 2020 caused inventory levels to drop another 33% OK, one last graph to illustrate something I've referenced above... 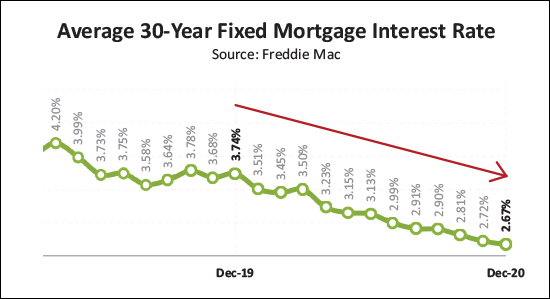 I told you mortgage interest rates had fallen - but look at how far they have fallen! Less than two years ago, the average 30 year mortgage interest rate was above 4%. Only a year ago it was 3.74%. Now, it's 2.67%. That marks a 29% decline in interest rates over the past year. This makes mortgage money cheap -- and monthly payments low -- and is part of what allowed median sales prices to rise 10% over the past year. Buyers were willing to pay higher prices for homes at least partly because their monthly costs keep declining. OK, I'll wrap it up there for now. Again, 2020 was a wild year and not at all what I expected it to be in March and April when things started slowing down. I did make a few predictions for 2021, but given how many surprises 2020 threw at us, it's certainly hard to imagine where exactly things might go in 2021. If you're thinking about buying a home in 2021, let's chat sooner rather than later if I can be of help to you in that process. You'll want to get pre-approved for a mortgage right away and then we'll want to start stalking the new listings as they hit the market. If you're thinking about selling your home in 2021, it is likely going to be a lot of fun to do so -- even if still a bit stressful. You will still need to prepare your house well, price it according to pertinent market data, and we'll need to market it thoroughly, but many sellers in most price ranges and locations are finding it to be a very favorable time to sell. If/when you're ready to connect to talk about buying or selling, feel free to email me (scott@hhtdy.com) or call/text me at 540-578-0102. Happy New Year! | |
Home Sales Rise Around 12 Percent In 2020! |
|
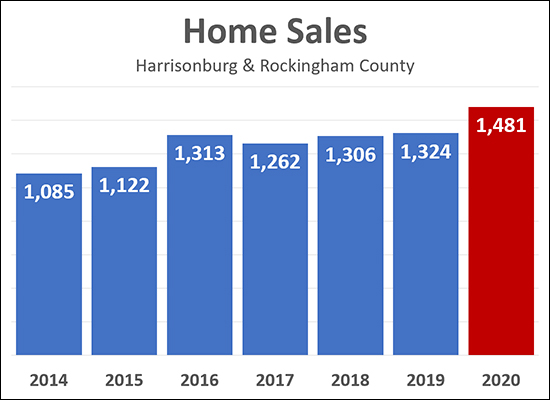 All home sales have not yet been reported but it is seems that we will see around a 12% increase in the pace of home sales in Harrisonburg and Rockingham County between 2019 and 2020! There have been 1,481 home sales recorded in the MLS thus far for last year and we may see that figure rise a bit more over the next few days, but not by much. This 12% increase is a SIGNIFICANTLY larger increase than we have seen in the last few years...
Stay tuned for my full market report in the next week or two, as well as predictions for the 2021 housing market. Oh, and HAPPY NEW YEAR! | |
Harrisonburg Area Home Sales Up 10%, Prices Up 11% Thus Far In 2020 |
|
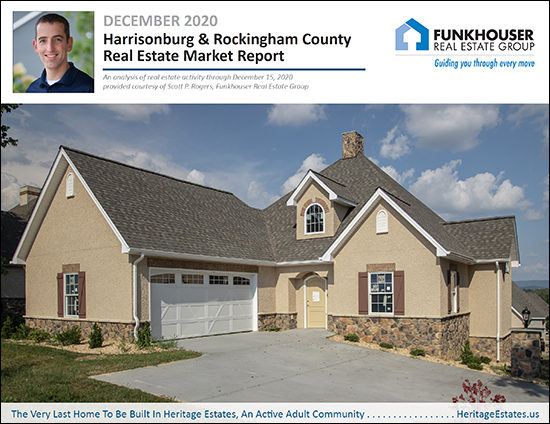 Happy Tuesday, friends! They say it might snow tomorrow. I'm currently seeing predictions of 6 to 9 inches. What is your best guess? We haven't had a sizable snowstorm in the Harrisonburg area in several years - maybe it's finally showing up? Or maybe it will just be rain - you know - 2020 and all... ;-) But enough about whether the snow will be piling up tomorrow -- home sales have been piling up BIG TIME this year and the last few months have been surprisingly busier than you'd expect at this time of year! Read on for details, or download a PDF of my full market report here. But first, not to be overlooked, the home shown above is the last home to be built at Heritage Estates. If you know someone who wants to live in this active adult community in Harrisonburg, this will be the last opportunity for a new home in the neighborhood. OK, now, an overview of the basics... 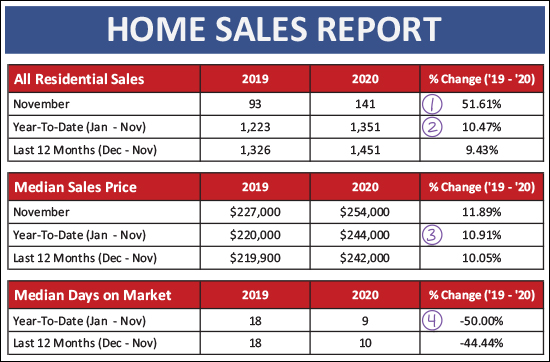 Check out the crazy numbers above...
So, did I mention the fall home sale season has been a bit atypical? 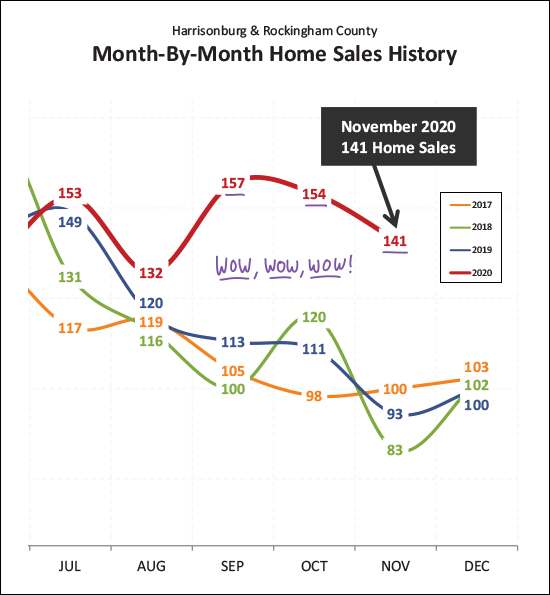 Yes, as you can see by the red line above, fall 2020 has been crazy! Usually, home sales fall during the fall. They gently decline into the slower winter season. This year, not so much. Home sales shot up in September and have stayed at unpredictably high levels through the end of November! And when you pile all of those strong months of sales on top of each other... 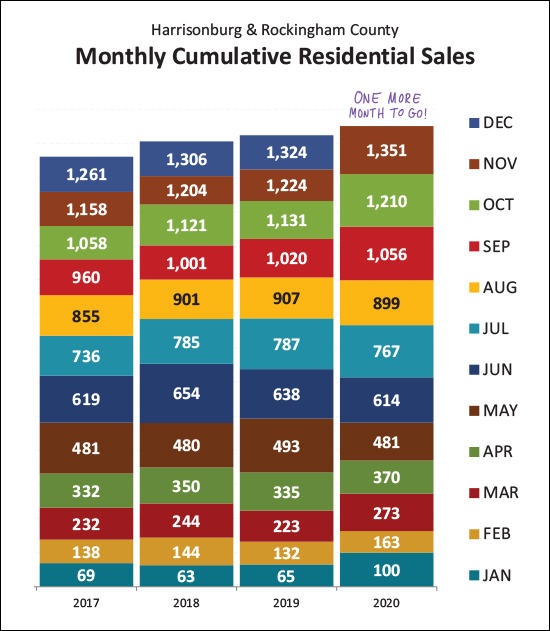 As you can see above, the number of home sales we've seen (1,351) in the first 11 months of this year is more than we have seen in any of the past three years... during the entire year! So, once we pile December on top, we're likely to be looking at well over 1,400 home sales this year -- and maybe as many as 1,450? But we didn't get to these high levels of home sales without some dips... 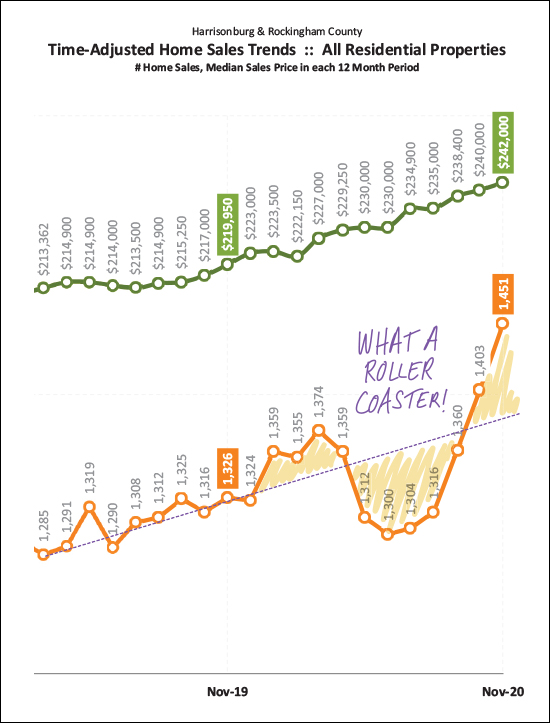 The orange line above shows the number of home sales in a 12 month period -- each month for the past year+ and it reveals the roller coaster that we've been on for the past year. Just before COVID started impacting our lives, the annual pace of home sales was starting to sneak up above its previous normal trendline. But then, COVID, and the annual pace of home sales dipped down quite a bit and it was uncertain where we'd go next. But by the time we got to August it was evident that the home sales market was roaring back and it is now well above where we might have expected it to be a year ago! And all that interest in buying homes has caused prices to rise... 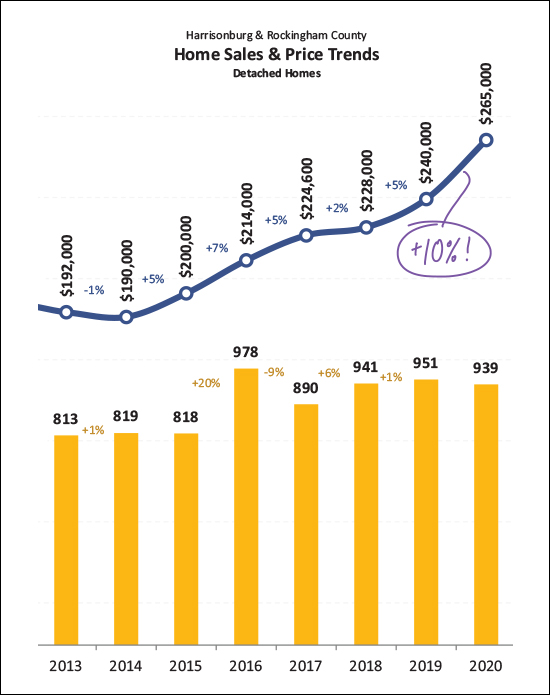 Over the past five years we have seen the median sales price of detached homes rise anywhere from 2% to 7% per year and average out at about 5% per year. But this year -- how does 10% sound? I suppose it sounds good if you are a seller and it sounds pretty rotten if you are a buyer who has not yet found a home to buy! A year ago the median sales price of detached homes (not townhouses, duplexes or condos) was $240,000. Today... $265,000! Looking forward -- will we keep seeing lots of home sales? 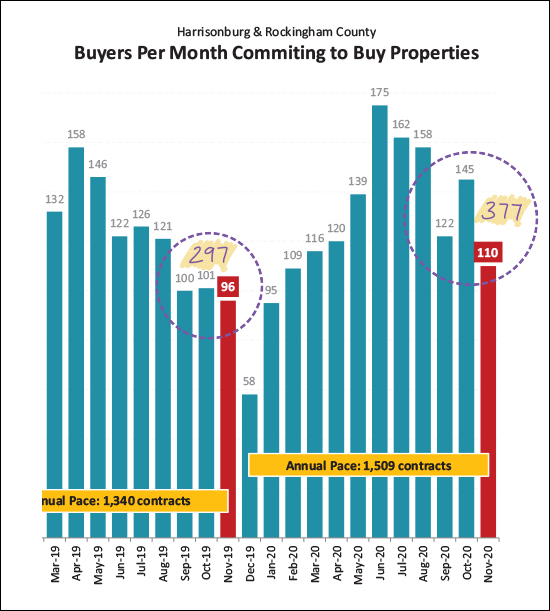 It seems likely. During the past three months 377 buyers (and sellers) have signed contracts to buy (and sell) homes. Looking back a year ago to the same three months we only see 297 contracts signed. Thus, we should probably expect a relatively high number of closed home sales in December and January. Maybe things won't slow down as much as usual this winter. Hard to believe! And as 2020 goes, houses are getting about as hard to find as toilet paper... 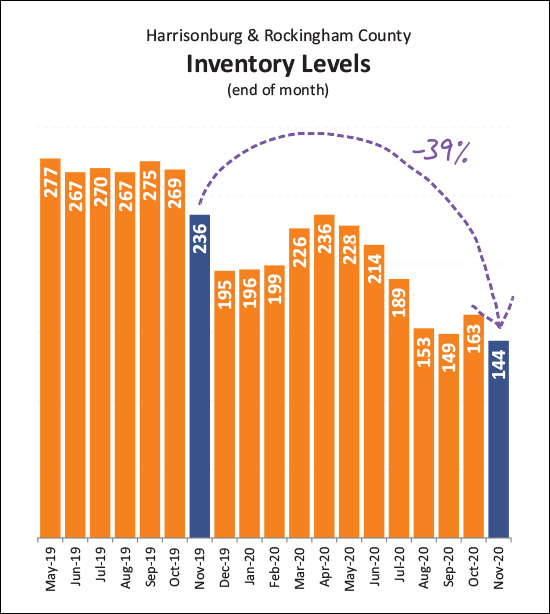 Indeed, there have been fewer and fewer homes for sale at any given time this year as compared to last. Rampant buyer activity has caused many (most?) new listings to be snatched up as quickly as they have been listed for sale. This has driven inventory levels lower than I thought we'd ever see. A bit under a year ago we dropped below 200 homes for sale which was a shocker... but now, fewer than 150 homes for sale!? It's tough to be a buyer right now in many locations and price ranges! But if you do find a house to buy... you'll love those low interest rates... 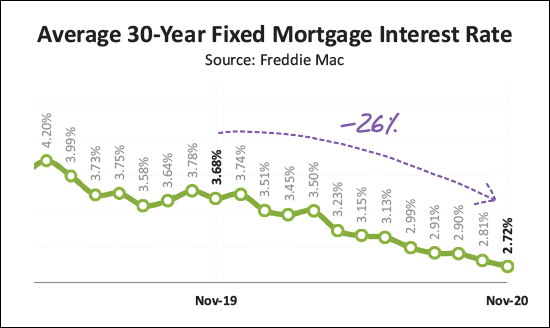 Mortgage interest rates have been steadily declining for the past 18+ months now, and are solidly below 3%! It's hard to believe, but most buyers are locking in interest rates at 2 point something -- fixed for 30 years! These lower rates have allowed mortgage payments to stay relatively steady over the past year despite increases in home prices.
OK, folks, that's all for now. I have to go see if I can find my snow shovel just in case it really does snow tomorrow. I hope you have a wonderful remainder of the 2020, and I look forward to connecting with you again in 2021! Reach out anytime by calling/texting me at 540-578-0102 or by dropping me an email at scott@hhtdy.com. | |
Mortgage Interest Rates Will Never Be This Low Again, I Said Countless Times In Recent Years |
|
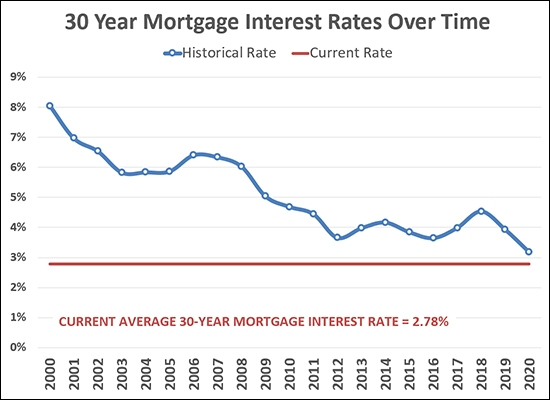 I've been in this business for 17 years now. When I started, mortgage interest rates were right around 6%, which was amazing, given that they had been up above 8% just three years prior. But then, after major housing market adjustments in 2007 and 2008, mortgage interest rates started dropping. They kept on going down until they were just below 4% in 2012. This was, again, amazing! We then actually saw some ups and downs between 2012 and 2018 -- though rates generally stayed between 3.5% and 4.5%. And where do we find ourselves now? Below 3%! Again, amazing! Current average interest rates are 2.78% -- and I have had clients buy homes this year with fixed rate mortgages as low as 2.5%. If you happen to be buying a home (or investment property) right now you are going to greatly enjoy the low rates that you will be able to lock in for years to come! | |
Local Home Sales, Prices Hit Record Highs In October 2020 |
|
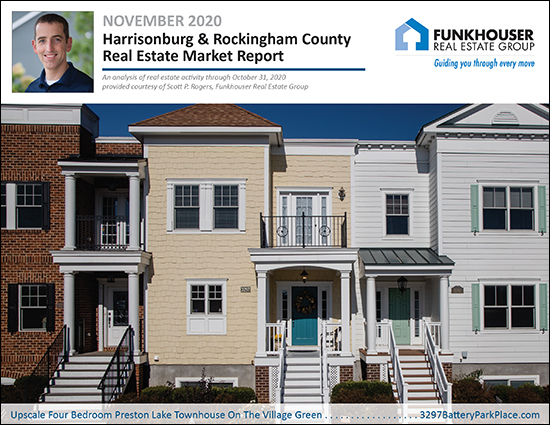 Happy Veterans Day and an enormous thanks to all who have served our country! Also, Happy November and Happy Thanksgiving! Speaking of thankfulness, we have a lot to be thankful for when it comes to the residential real estate market in Harrisonburg and Rockingham County! Despite all of the twists and turns and ups and downs that 2020 has brought to our lives, the local housing market has remained stable and has even grown stronger over the past ten months. Unfortunately, as with many things in life, this has meant that there have been winners and losers. Home owners and home sellers have done well and have appreciated this strength of and growth in our local housing market. Folks who do not own a home, or who have been unsuccessful in trying to buy a home, and even those who have been successful in buying a home this year are likely a bit less excited about how strong and vibrant our local housing market has been in 2020. All that said, I believe this is the second best type of housing market trend to be seeing locally. Here's how I rank them as far as what is best for us locally...
So, as stated, we're in category two above, which I prefer to three and four if we can't be in category one. :-) Now, after that rather long intro, let's get on to some data, but first, be sure to check out the home featured above, an upscale four bedroom Preston Lake townhouse on the Village Green by visiting 3297BatteryParkPlace.com. OK, finally, unless you're skipping right to PDF of my full monthly report, let's dig into the data... 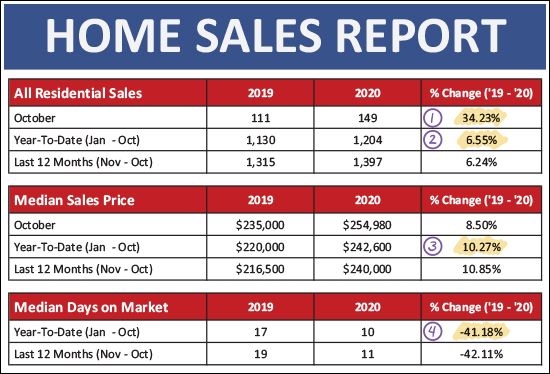 Quite a few things to note on the market snapshot above...
Interestingly, things do branch out a bit when we look at the City vs. the County... 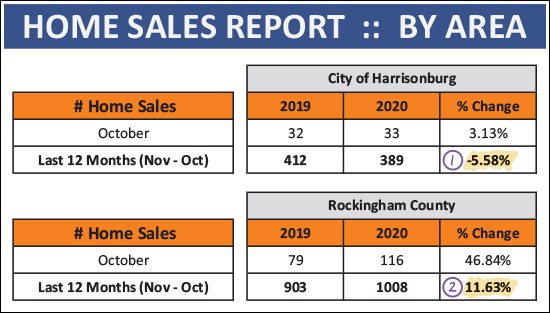 As shown above, there has been a decline in home sales in the City (-5.58%) while we have seen an increase in the County (+11.63%). Not shown is that the median sales price has increased in both areas -- up 11% in the City and up 9.76% in the County. The decline in City home sales is not for home buyers not trying -- there are plenty of folks who want to buy in the City but there seems to be a shortage of sellers willing to sell. So - did I mention that September and October were a bit surprising? 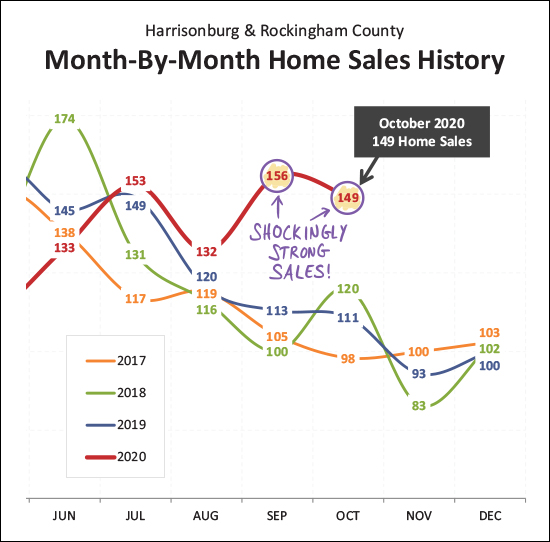 Take a few seconds to take in what the graph above is showing us. September 2020 home sales (156) were 47% higher than the average of the past three months of September. October 2020 home sales (149) were 35% higher than the average of the past three months of October. So, if the local housing market was unusually slow this Spring due to COVID, this September and October have more than made up for that given these shockingly high months of home sales! Which invites the question of how the year will finish out... 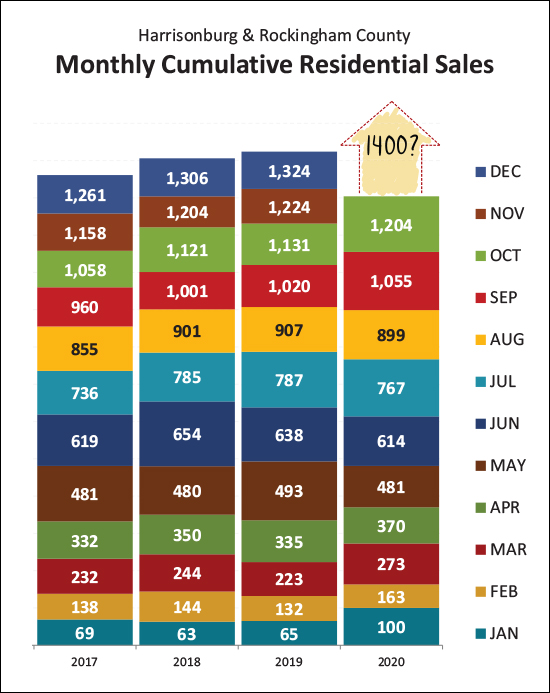 Earlier this year, I thought we were certainly going to see a decline in annual home sales after several years of increases. Not so much. We seem poised to easily surpass last year's pace of 1,324 home sales -- and it seems possible we could even make it to 1,400 home sales this year in Harrisonburg and Rockingham County. Who would have thought!? Here's where I'm getting that "maybe 1400" number... 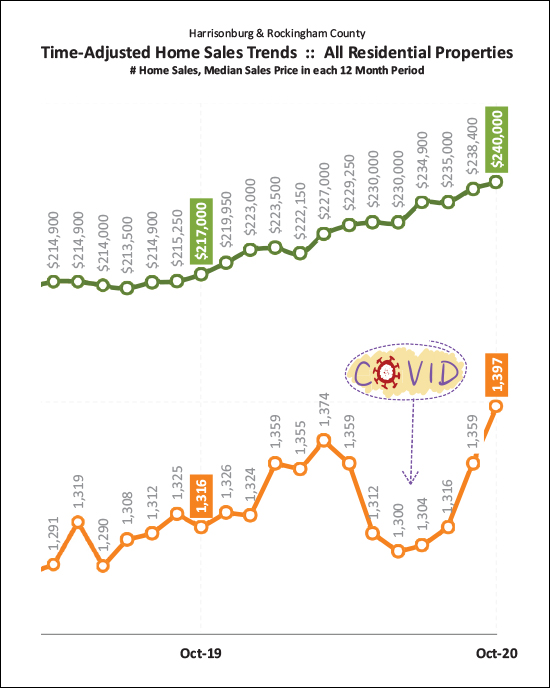 A few things going on above. First, the orange line, which is showing us the annual pace of home sales, evaluated on a monthly basis. After having risen from 1300-ish to 1350-ish, we fell back down to 1300-ish due to COVID, but the annual pace of home sales has rocketed back upward and is now approaching 1400 sales per year. The green line shows that home values didn't falter a bit despite a temporary slow down in home sales. We have seen steady increases in the annualized median sales price over the last year which has steadily (and quickly) risen from $217K to $240K. That seems like quite a large increase in the median sales price, right? 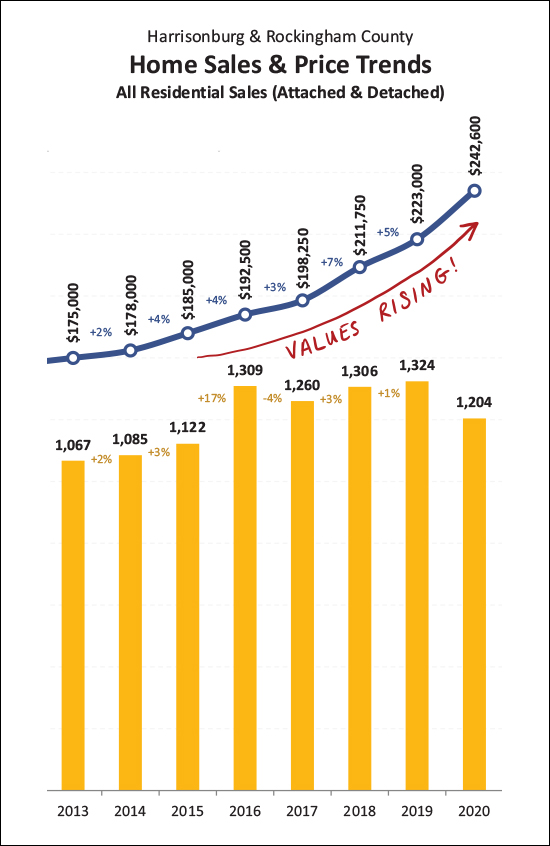 It is a large increase. Over the past five years the median sales price has increased at an average of 4.6% per year. This year, thus far, we have seen the median sales price increase 8.8% -- almost twice as much as these other recent years. This has been almost entirely fueled by increasing demand for homes, declining inventory levels and declining mortgage interest rates. These changes have made it more and more of a seller's market... 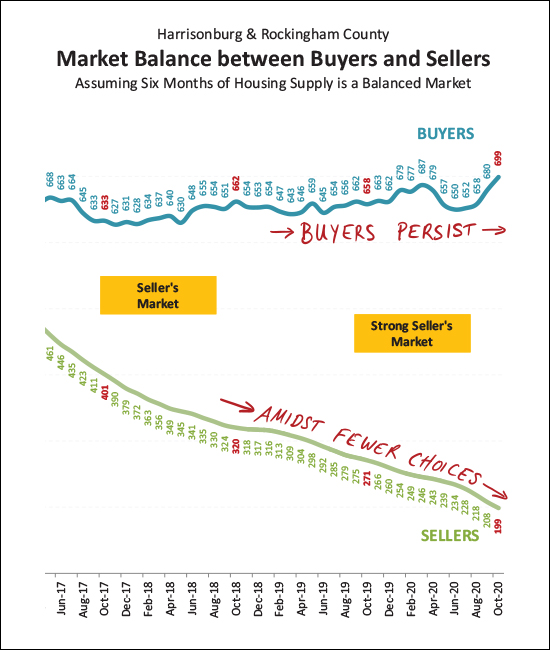 A few things to not and think about, above...
So, given this strong sellers market, are sellers negotiating much? 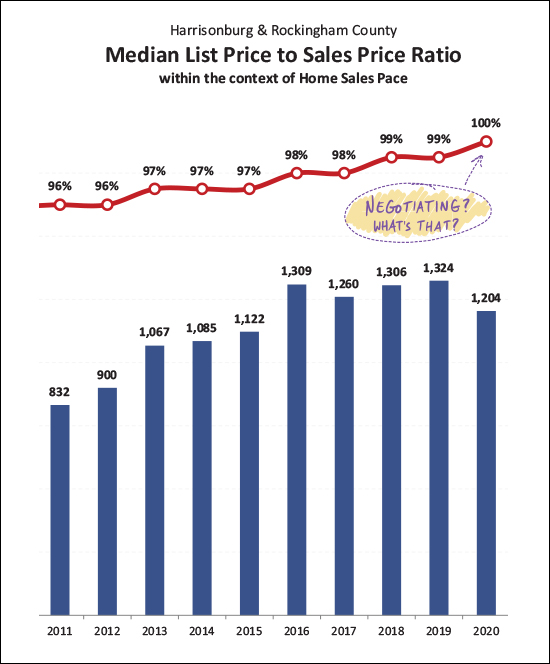 Nope. The median ratio between the list price and sales price for all homes sold in 2020 has been 100%. What!? Yes, that means that half of homes sold for the list price or more! This has been the least that sellers have negotiated in many, many years - maybe ever. Circling back to those inventory levels one more time... 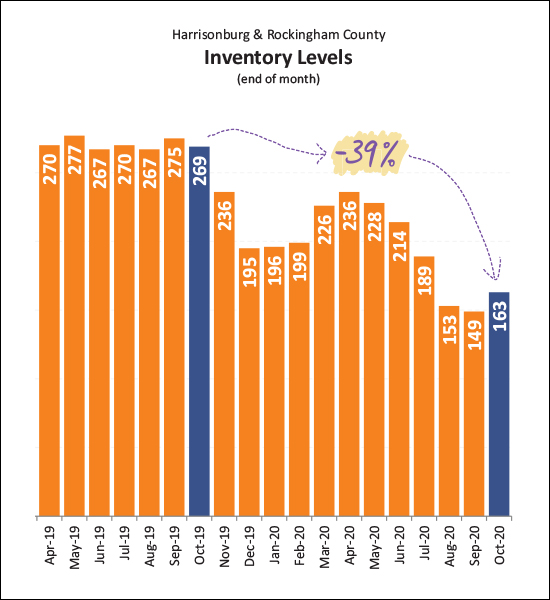 You'll see that we are seeing some amount of seasonable fluctuation in inventory levels as we did see a slight rise in homes for sale (and not under contract) during the spring months, but we have seen an overall 39% decline in inventory levels over the past year. Inventory levels ticked upward in October 2020, but I doubt that will be a lasting trend. We are likely to see relatively low inventory levels (under 200) even through the remainder of the fall and into and through the winter. Oh, and did I mention that mortgage interest rates are relatively low? 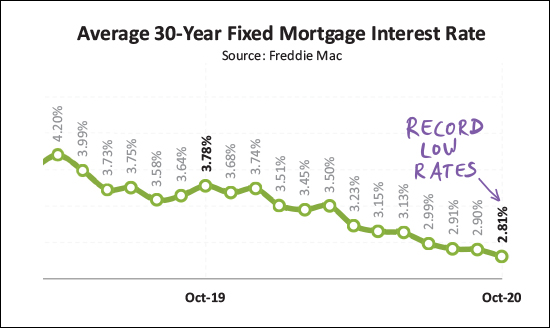 Perhaps absurdly, ridiculously, unexpectedly, historically low would be a better way to describe it. We just finished the fourth month of average 30 year mortgage interest rates being below 3%! This has created some very favorable monthly payment scenarios for buyers this year -- and thus far I'm not getting any sense that we'll see these interest rates rise much in the near future. OK, back to a few (real estate related) areas of thankfulness...
I'll close out with a few key recommendations for buyers and sellers in this crazy-ish market... BUYERS
SELLERS
OK. That's all folks. I hope you have plenty to be thankful for in your world. As always, if I can be of any help to you or your family, please let me know! Reach out anytime by calling/texting me at 540-578-0102 or by dropping me an email at scott@hhtdy.com. | |
November 19 Meeting To Discuss Harrisonburg Comprehensive Housing Assessment and Market Study |
|
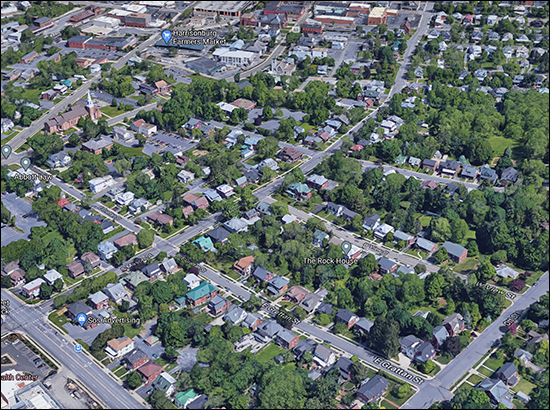 Mark your calendars for Thursday, November 19th at 6:00 PM to tune in to hear a presentation of the findings of the initial draft of the City's Comprehensive Housing Assessment and Market Study! From the press release from the City...
Here's how to tune in to this meeting... Watching on a computer or mobile device via GoToWebinar. Register in advance here - Webinar ID: 281-556-371. Calling in to listen by phone at +1 (951) 384-3421, Access Code 484-931-436. Watching the meeting live on Public Education Government Channel 3 | |
The Movie Theater (Regal Cinemas) In Harrisonburg Is Closed, Permanently |
|
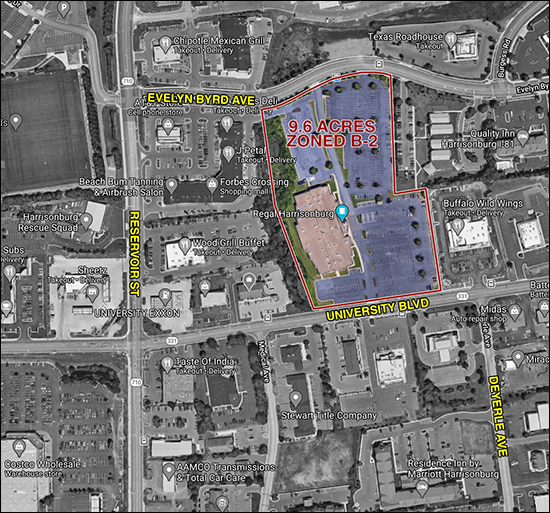 So much for catching the latest new movie on the big screen!?! The 9.6 acre parcel shown above - known to us as Regal Cinemas plus its very larger parking lot - is now owned by Armada Hoffler Properties. It would seem the tenant of the property (Regal Cinemas) defaulted on their lease and thus the company (Armada Hoffler Properties) terminated the lease. This shouldn't be an enormous surprise as the movie theater closed this past spring due to COVID and its parent company has ceased operating all theaters across the country earlier this month. But... it seems that this 9.6 acre property will not be sold... the owner of the property plans to redevelop the property. I assume this means they will tear down the building and build a much larger mixed use development, as the majority of the land is currently used for parking. Read more about this over at The Citizen... | |
Harrisonburg Area Home Sales and Prices Soar In September 2020! |
|
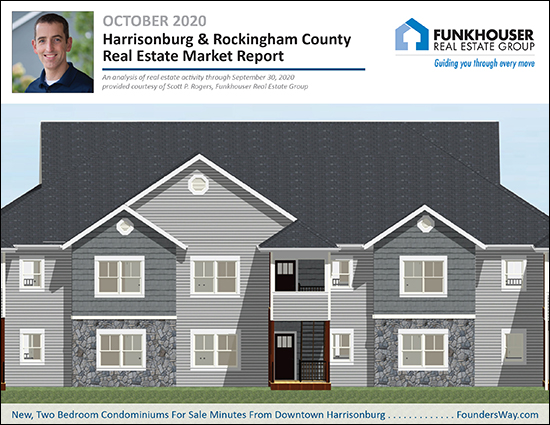 Happy Monday Morning! What a wild year this has been - and it is now, already, more than three quarters of the way to the end. Many things have been turned upside down in our daily lives, but as this year has continued to progress, one thing that has not been affected as much as you might expect has been our local real estate market. We're seeing more home sales this year than last, at higher prices, taking place at record speeds. Before we dig into the data, be sure to check out Founders Way, a condo development currently under construction just minutes from downtown Harrisonburg. Find out more about these new two bedroom condos starting in the $170K's by visiting FoundersWay.com. Now, feel free to download a PDF of my entire monthly report, or read on for some juicy tidbits to start your week off right... 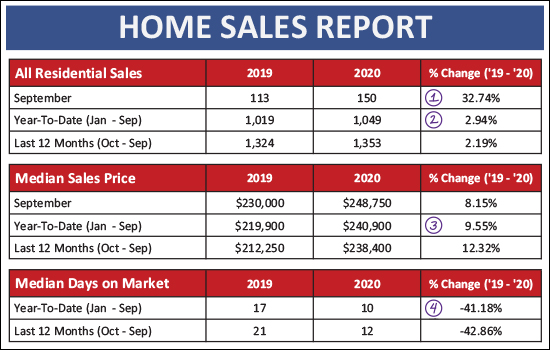 First, from a big picture perspective, referencing the chart above...
So, again, repeating the story from above - COVID has created plenty of train wrecks, but our local housing market has been able to keep on moving right along, full steam ahead. Now, looking for a moment at detached homes compared to attached homes... 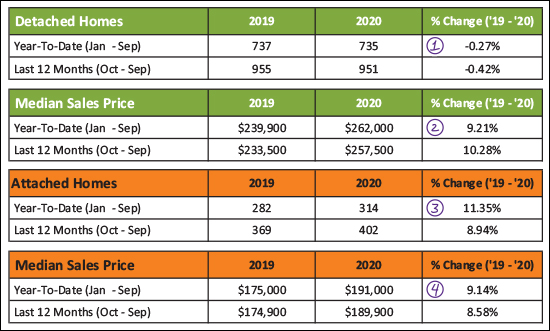 The green portions of the chart above show the trajectory of detached homes, and you might note that there have been slightly fewer (735 vs. 737) of these sales in 2020 when compared to 2019. Despite that ever-so-slight slow down, however, the median sales price of those homes has increased 9%! If detached home sales have slowed down, slightly, attached home sales have been running in the opposite direction, quickly. We have seen an 11% increase in the number of attached home sales in 2020 as compared to 2019 - and again - a 9% increase in the median sales price of these attached homes. Now, for the visual learners, let's take a look at September again... 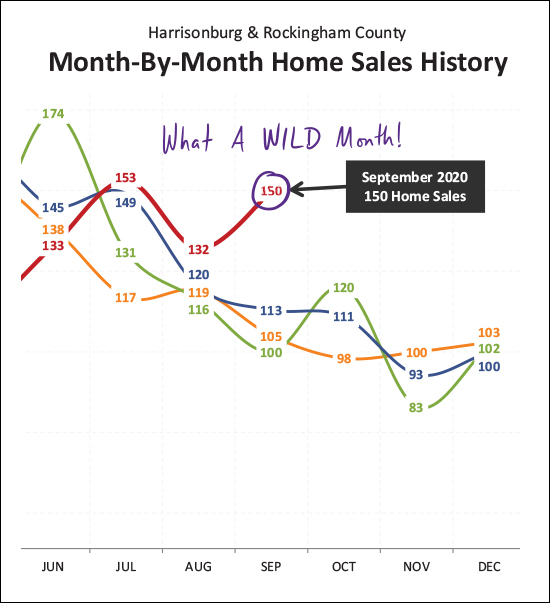 As shown above, September was a wild month for home sales. The (150) home sales seen in September 2020 make it the second highest month of home sales for the year - which is quite atypical for September! I assume that home sales will slow down quite a bit in October, and then much further in November and December -- but this year has been anything but predictable, so who knows!?! Oh, and did I mention that 2020 finally caught up with 2019? 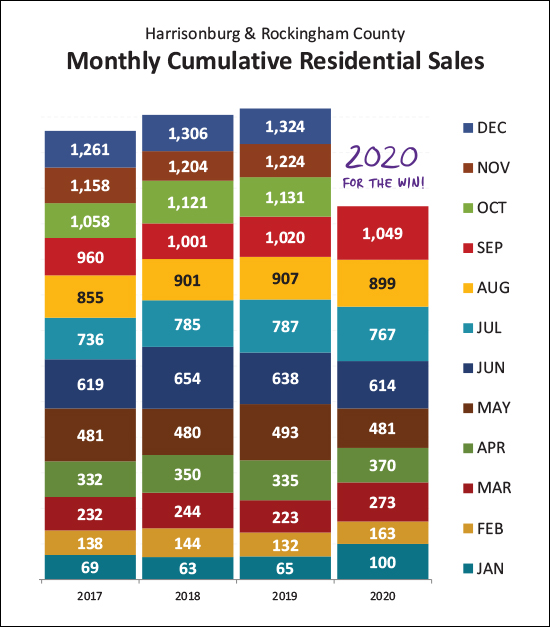 Back in March and April, I noted that 2020 was off to a STRONG start -- with more home sales in the first quarter of this year than in any recent year. But then, COVID. Many fewer sellers put their homes on the market in March, April and May, which resulted in fewer buyers being able to buy houses, which slowed down the annual pace of home sales quite a bit as we progressed through late spring and then through the summer. But then, September! The high sailing month of home sales in September caused our year to date trajectory to pop above all recent years again. So, 2020 is a great year - or at least for home sales in Harrisonburg and Rockingham County! Want another visual of the impact of COVID? 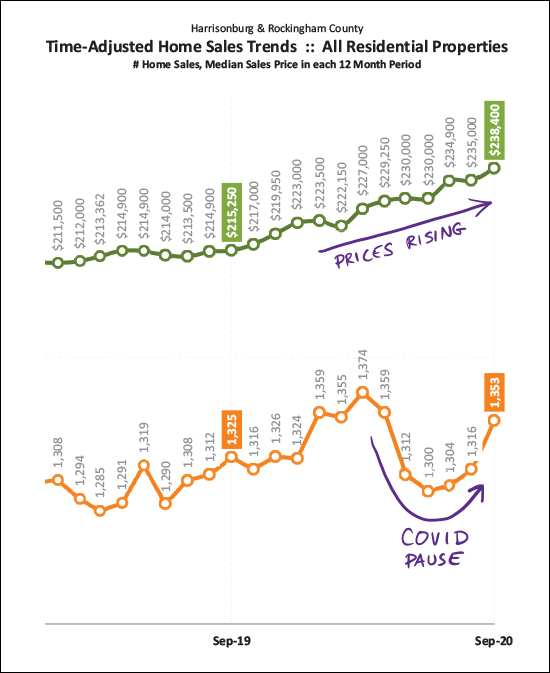 The weird dip in the orange line on the graph above is the impact of COVID. Our annual pace of home sales started dropping about five months ago, and we can only now confidently say that we're back on track to see the expected overall increase in that trajectory of home sales in this area. But that green line!?! Despite a slow down in home sales, we continued to see the median price rise, rise and rise some more. Maybe because COVID caused inventory levels to dip even lower, causing buyers to be willing to pay even more for a house? Maybe because the super low mortgage interest rates allow a buyer to be more flexible on price? Nobody knows for sure, but those prices, they keep on rising! Speaking of prices rising... 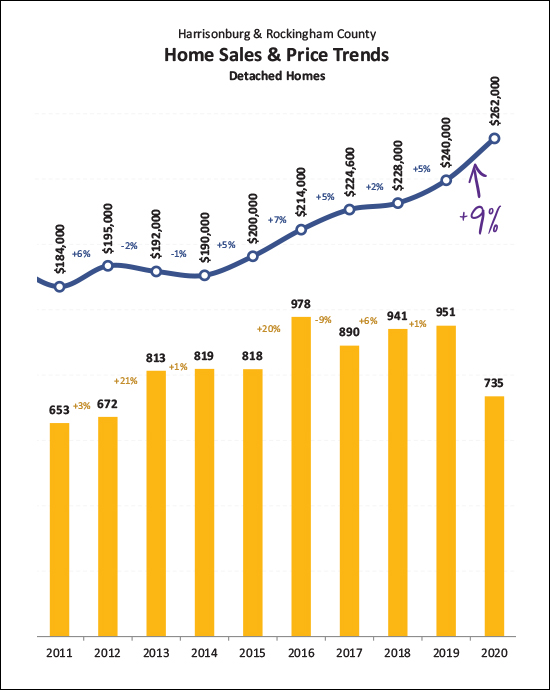 Over the past five years we have seen an average annual increase in the median sales price of 5% per year. This year, it is looking like it will be a 9% increase. This is not totally surprising -- more buyer interest, lower inventory levels, low interest rates, etc. -- but prices can't rise at 9% per year forever, so 2021 and 2022 will be interesting to watch to see how much further prices can or will increase. And now, looking back a bit to look forward... 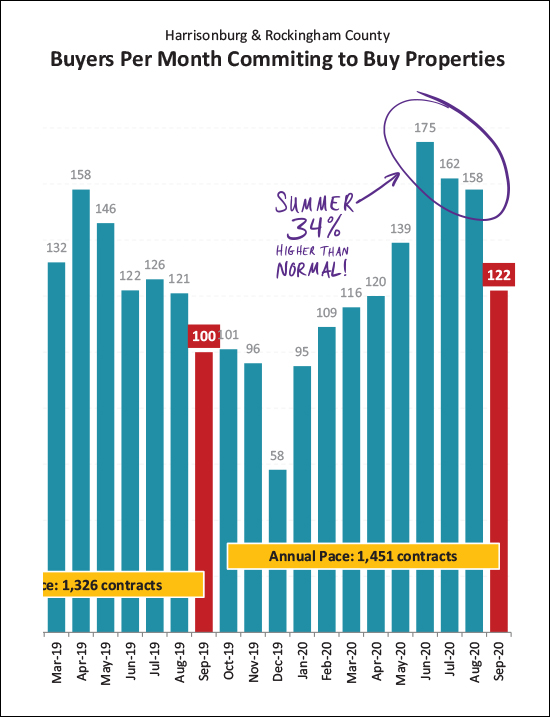 A few things to note here, on the graph above. First, it was a summer FULL of contracts. There were 34% more contracts signed this summer than last, and 32% more signed this September than last. Thus, it seems relatively likely that the strong home sales we have seen thus far in 2020 will continue on through at least October and likely into November. How many times have I said "low inventory levels now"? 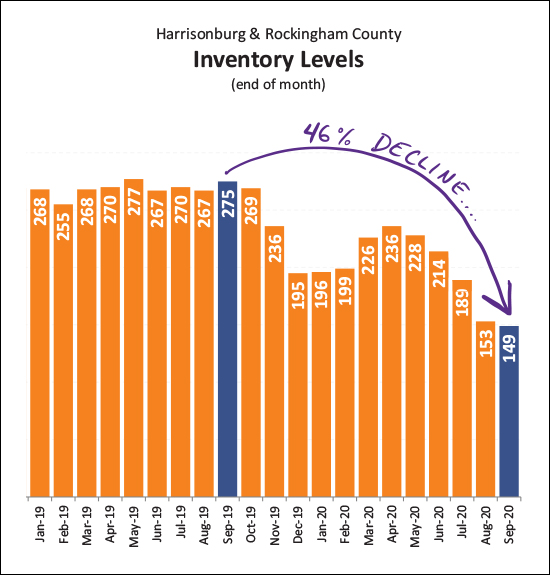 There it is, visualized, above -- the agony of buyers in our current local housing market. Inventory levels are at historic low levels. Never have there been fewer homes on the market, for sale, at a single point in time in Harrisonburg and Rockingham County. We have seen a 46% decline in active inventory over the past year. Now - keep in mind, we have seen a 2% - 3% increase in home sales, so these low inventory levels just mean that as quickly as new listings come on the market they are being scooped up by a buyer, preventing them from contributing to the "number of homes for sale" metric which we call "inventory". Unfortunately, I don't anticipate that these inventory levels will shift upwards anytime soon unless it is due to new construction at a large scale. Finally, a few times above I have noted that prices are rising - and this is perhaps one of the reasons why buyers can pay higher prices without blinking... 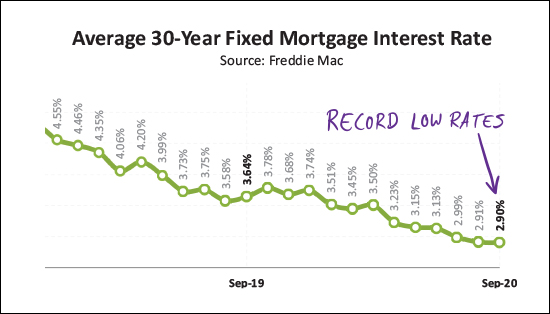 As shown above, the average mortgage interest rate keeps on falling. A year ago it was 3.64% and now it's down to 2.9%. These super low interest rates create a great opportunity for today's home buyers to lock in ridiculously low interest rates -- and they soften the impact of rising home prices. Alright, I'll pause here for now. If you've made it this far, thanks for taking the time to seek to better understand our local housing market. For more such joy, feel free to check out my blog or shoot me an email (scott@hhtdy.com) with any questions you have about our local housing market or about your house. Some key take aways... BUYERS
SELLERS
| |
Local Home Sales, Contracts, Prices Surge In Summer 2020 |
|
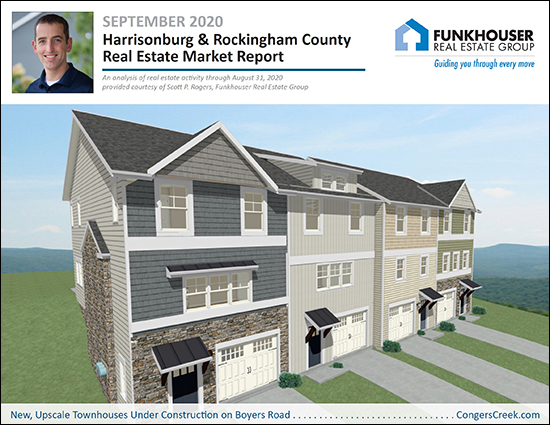 Happy Monday Morning! Temperatures are cooling, and fall will soon be upon us! It looks like the high temps will be in the 70's all week - except Friday when we're expected to have a high of only 67 degrees! I love fall and am looking forward to the slightly cooler weather. But even if the temperatures are cooling off, local home sales are not necessarily doing the same! Before we dig into the data this month, be sure to check out Congers Creek, the new townhouse neighborhood being built on Boyers Road near Sentara RMH Medical Center by visiting CongersCreek.com. Now, feel free to download a PDF of my entire report, or read on for highlights... 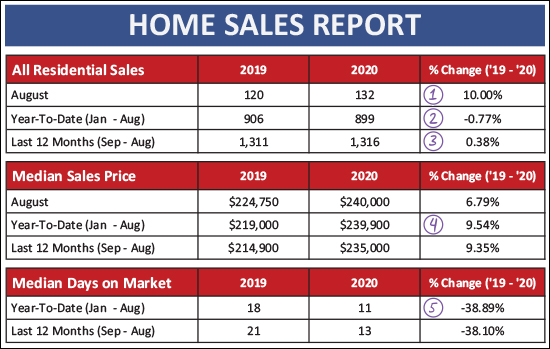 Quite a few items to note above...
Now, let's take a look at how the past few months have fallen into the context of previous years... 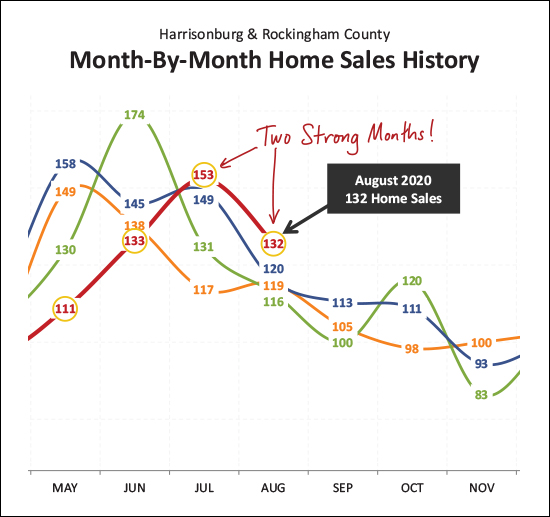 As you can see above, May and June were remarkably SLOW months for home sales - well below the normal pace for those months. But then, July and August came storming in -- with higher numbers of home sales than we would have or could have expected. So it seems that home sales may have just shifted this year to be later in the year than most years. Who could even guess what might happen in September and October at this point!?! And here is how the year is stacking up with the past two years thus far in 2020... 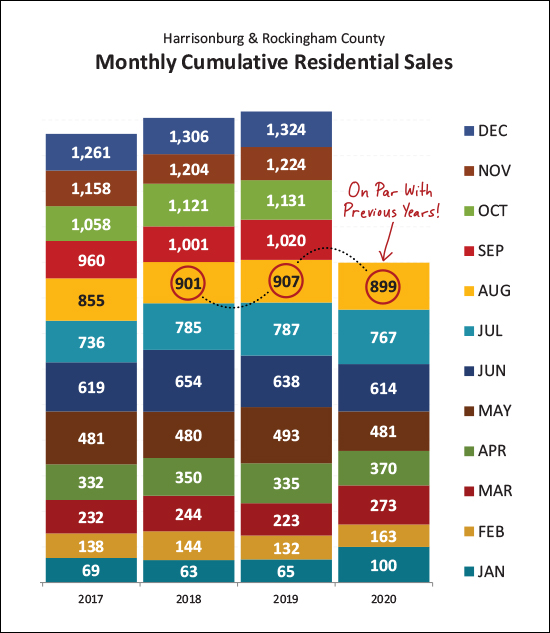 For all the things one might say about 2020, it seems we won't be able to say that home sales stunk. A busy late-summer has caused this year to catch right back up (almost) to where we have been for the past two years -- and based on contract activity (keep reading) I think we might surpass last year's sales trajectory as we close out 2020. That's not to say, of course, that home sales didn't take a temporary dip as a result of COVID... 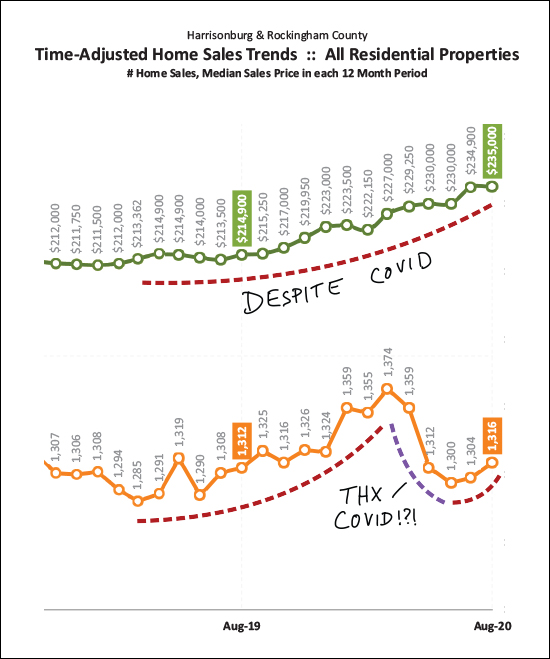 Indeed, the annual pace of home sales took a nose dive in the spring -- OK, that might be an exaggeration, but they did slow down. Despite that temporary slow down, though, home prices kept right on climbing!?! That disconnect likely means the slow down was largely a result of sellers not wanting to sell -- not a result of buyers not wanting to buy. Now about those rising prices - how fast are they actual increasing? 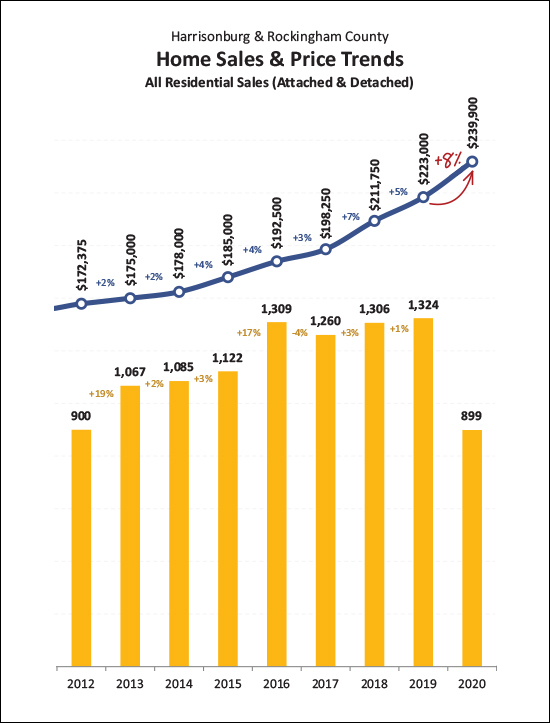 Faster than anytime recently - though barely. We've seen an 8% increase in the median sales price between 2019 and 2020. To try to put that in context...
So - I guess prices are rising somewhat faster than in recent years, but not absurdly faster. Now, let's look back in order to look forward... 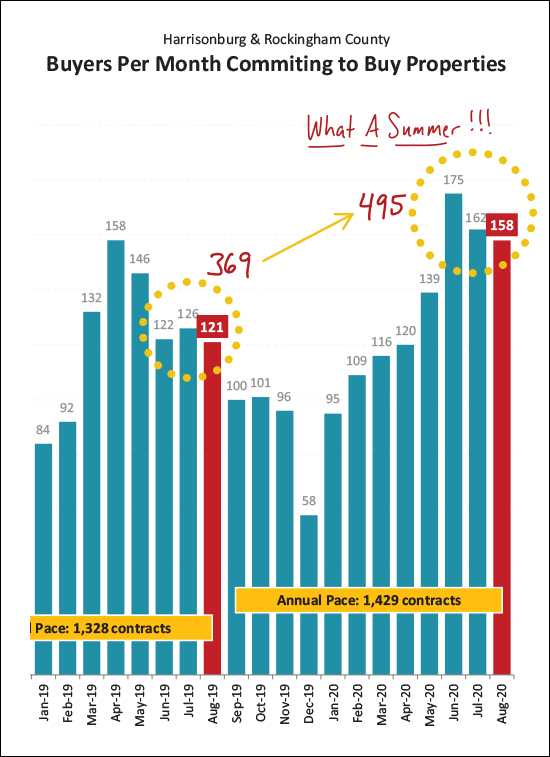 The graph above is showing us contract activity -- when buyers (and sellers) are signing contracts, not when they are closing on their purchase/sale. As you can see, this was a blockbuster of a summer for contract activity! Only 369 contracts were signed last June through August, and that increased to 495 contracts this June through August. That's a 34% increase in summer contracts! This all means we are likely to see a high number of home sales continue take place as we move into the fall. I expect that we'll see an abnormally high number of home sales in both September and October. Perhaps it is no surprise that all of these buyers signing contracts is keeping/driving inventory levels low, so very, very low... 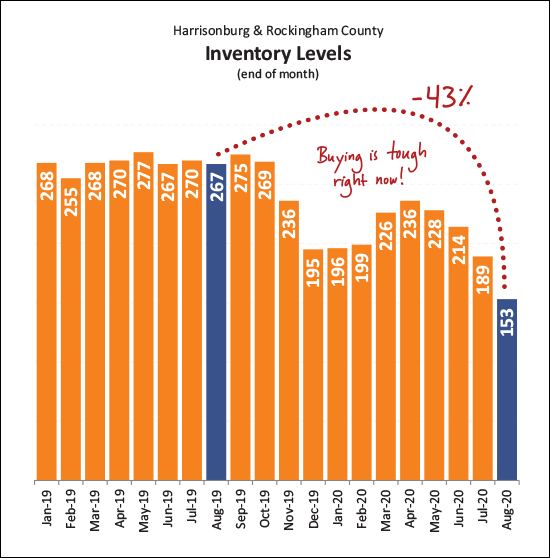 There have been fewer, and fewer, and fewer homes on the market at any given time as we have moved through this year. It is a tough time to be a buyer as there are not many choices for you at any given time, and you will likely have competition from other buyers if you are pursuing a new listing. Those buyers who are able to secure a contract on a house are financing their purchases at some rather extraordinary rates... 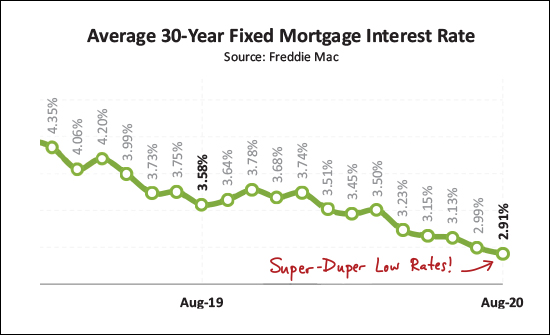 The mortgage interest rates they just keep on falling The average rate fell to 2.91% by the end of August, and I have seen my clients locking in as low as 2.85% and even 2.75% on a 30 year fixed rate mortgage! OK - that brings our monthly jaunt through the local homes sales data to a close, for now. You can read more about our local real estate market on my blog, and of course you can email me (scott@hhtdy.com) with any questions about the market or about your particular situation. Some key take aways... BUYERS
SELLERS
OK, that's all folks! I hope that you have a wonderful balance of September, and that you and your family are healthy and well and are finding ways to manage the many changing dynamics in our daily lives! Reach out anytime (540-578-0102 or scott@hhtdy.com) if I can be of any help to you! | |
Local Home Sales Slow Slightly But Prices Are Up 10% in 2020! |
|
 Happy Tuesday Morning! Summer is winding down, and it's been a bit of an unusual one...
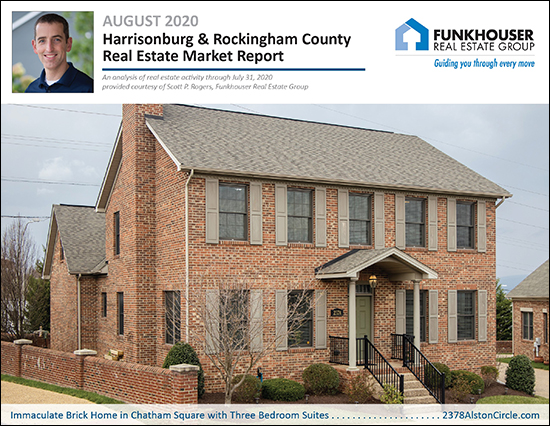
As your summer comes to a close, I hope you have found some ways to relax and take a break, despite everything going on right now. Go for a run! Head out on a bike ride! Plan a day hike! In the latest adventures of the Rogers family, I took Emily zip lining and Luke water skiing this past weekend. :-) Whatever your version of fun and relaxation, I hope you can find some of it in these last weeks of summer. And now, if you have been looking for a distraction from the craziness in your everyday life, read on for some crazy news about our local housing market. :-) But first -- check out this beautiful home (shown above) in Chatham Square by visiting 2378AlstonCircle.com. Also, feel free to download a full PDF of my market report here. OK, OK, now, on to the data... 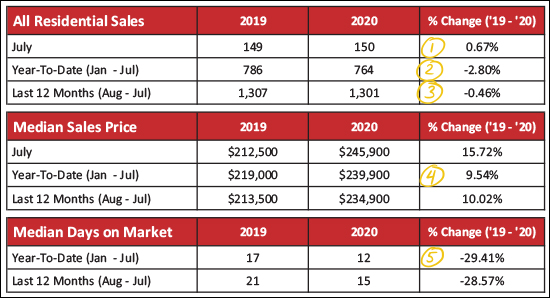 Quite a bit to note above...
To pick up on a few nuances, let's break things down by detached homes (single family homes - shown in green below) as compared to attached homes (townhomes, duplexes, condos - shown in orange below)... 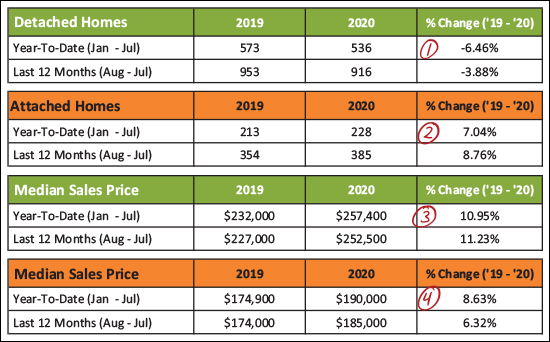 We start to see some differences when breaking things down by property type...
Now, let's contextualize those 150 home sales we saw in July... 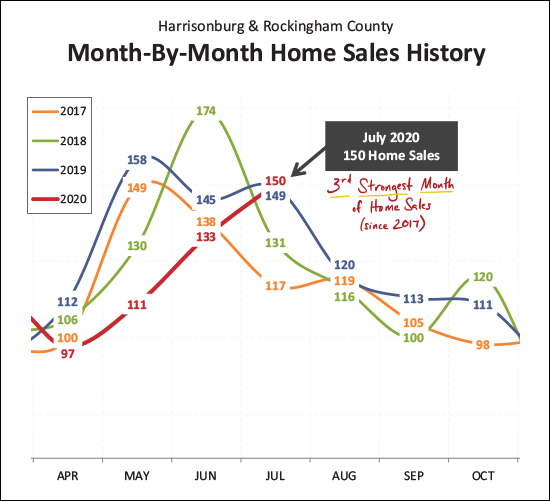 As shown above, home sales often or usually peak in May or June with sales then slowing down as we roll into July. But not this year! Home sales seem to be accelerating month by month as we have seen steady increases between April, May, June and July. In fact, the 150 home sales see in July was the third strongest month of home sales we have seen since at least 2017! This next graph might be a bit confusing, but let's see if we can make sense of it... 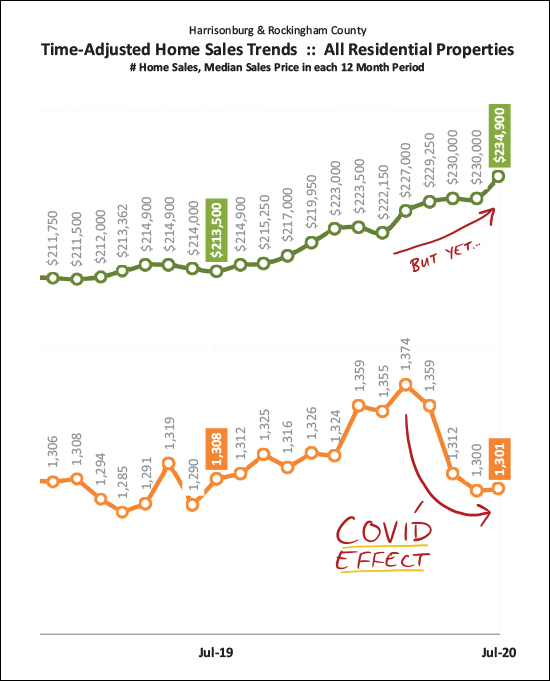 OK - starting with the orange line at the bottom of the graph... The annual pace of home sales had risen all the way up to 1,374 home sales per year by the end of March 2020. This was a slow and steady increase over several years -- but that all started to shift downward once we started incorporating April and May data into the mix. Home sales did decidedly slow down for several months, causing the annual pace of home sales to slide. It seems we may now be seeing that trend line stabilize in July as the annual pace of sales is no longer declining. But yet -- as noted next to the green line -- home prices have continued to go up, up, up. Back in March and April I wondered whether we'd see a slow down in sales and whether we would see a slight downward shift in home prices. It seems I was half right. Sales slowed, but prices have continued to rise! These two contradictory trends may best be understood by realizing that sellers drive trends during a seller's market. Fewer sellers wanted to list their homes for sale during the "time of COVID" and thus fewer sales happened in April and May (if the houses aren't listed for sale, they surely won't sell) but there were seemingly just as many (or more) buyers ready to buy. An unusual (and temporary) decline in sellers combined with just as many (or more) buyers caused home prices to continue to climb, perhaps even higher and faster than they would have otherwise! OK - thanks for sticking with me on that one. Now, let's predict the future by looking at contract activity... 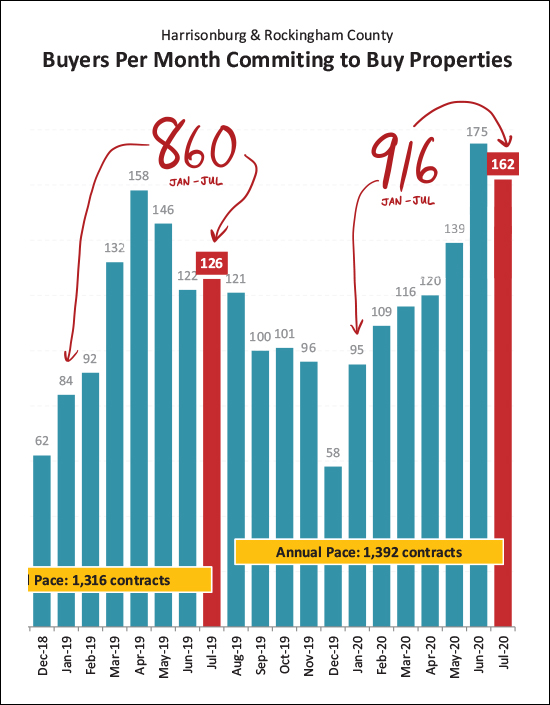 First, the big, red, handwritten numbers will quickly show you that the pace of contract signing this year (916 between Jan and Jul) is quite a bit higher than last year (860 between Jan and Jul), but there's more! Last year in June and July we saw 247 buyers (and sellers) sign contracts to buy and sell homes. This year there were 337 contracts signed during that same timeframe! It is almost as if buyers (and sellers) are trying to make up for lost time -- as contract activity has been ramping up for the past few months after a slower than expected spring market. OK, I told you I'd circle back to it... 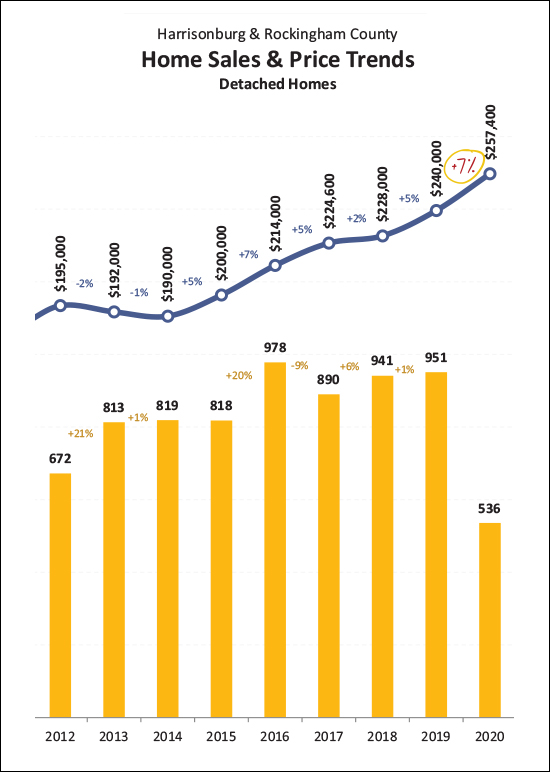 OK - so - about those home prices. As shown above, you'll note that the median sales price of detached homes (not townhouses, duplexes or condos) has increased 7% between 2019 and 2020. That's more than the 4.8% average over the past five years -- though we did also see a 7% increase between 2015 and 2016. So, should we be concerned about prices increasing this much? After all, didn't prices skyrocket back in 2004 and 2005 leading to eventual declines in housing prices? Why yes, you are correct - we did see significant increases in the median sales price in 2004 (+16%) and 2005 (+24%) and those increases were unsustainable -- prices eventually came back down, slowly, between 2006 and 2011. But this time, perhaps it's different? It's hard to say for sure whether the price increases we are seeing are "too fast" or "too much" to be sustainable. We'll only really know a year or two from now, looking backward. I suppose it is important to note that while a 7% increase is much higher than any long term average, it is also not as crazy as we were seeing back in 2004 and 2005. One of the things that is driving these prices up is the vast number of would-be buyers competing over an ever-shrinking number of homes for sale... 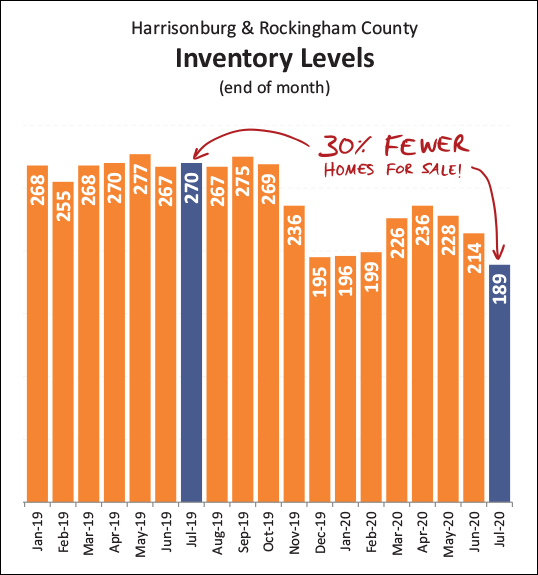 Yes -- you're reading that correctly -- there are currently 30% fewer homes for sale now as compared to a year ago. Further -- the current inventory level (189 homes for sale) is actually lower than this past winter, which is rather unusual for July/August! There are many things causing so many buyers to want to buy, and buy now, which is driving down the inventory levels, but one of those motivators for buyers is... 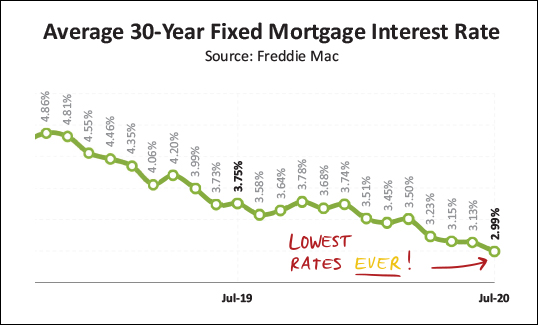 ...super low interest rates! Mortgage interest rates have been below 3% for the past few weeks -- yes, the 30 year fixed mortgage interest rate -- below 3%! I have had a few clients lock in at 2.65% and 2.75% which is rather hard to fathom. So, not to encourage you to jump on the bandwagon if you're not ready to do so, but if you're thinking about buying soon, these interest rates sure do make it compelling to try to buy sooner rather than later. OK - that wraps it up for now. A few closing notes... SELLERS - Even though it is a seller's market, it is still essential that we prepare, price and market your home well! Read more about that here and shoot me an email if you want to meet to start talking about getting your house on the market in the coming weeks or months. BUYERS - Be prepared to be patient, as you'll likely be competing with plenty of other buyers. Make sure to talk to a lender ASAP (ask me if you need a recommendation) so that we have a pre-qualification letter in hand when making an offer. HOMEOWNERS - Yes, certainly the vast majority of those who receive this market report won't be buying or selling next month. So, for the rest of you, enjoy the fact that your home's value has likely increased over the past year! If that makes you want to think about selling - let's chat. Otherwise, just enjoy knowing that your home's value has likely increased. :-) That's all for now, folks. If there is any way that I can help you or your family with real estate, or otherwise, let me know. Otherwise, enjoy the balance of August and I'll be back to crunch the numbers all over again in mid-September. | |
Harrisonburg Area Home Prices Up Nearly 7% in First Half of 2020 |
|
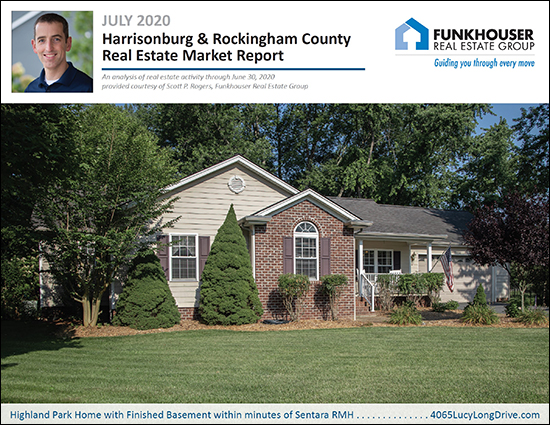 Happy Tax Day! Yes, that's right, today is the extended deadline for filing and paying income taxes. But the day is still young, so read on for an update on our local housing market before you go submit your tax filing. ;-) But first -- check out this recent listing (shown above) in Highland Park priced at $365K by visiting 4065LucyLongDrive.com. Two other notes before we get started...
OK, now, on to the data... 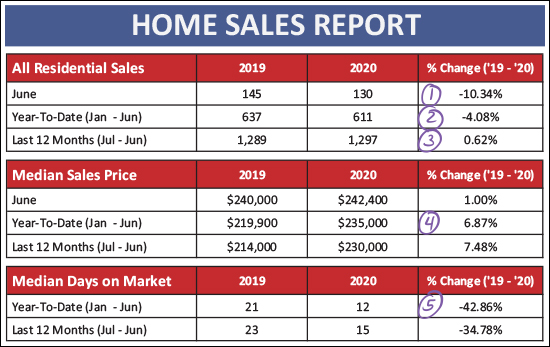 We're now officially halfway through the year when looking at year-to-date sales figures and there is plenty of interesting trends to note above...
Now, let's take a brief look at detached homes compared to attached homes. Attached homes includes duplexes, townhomes and condos. 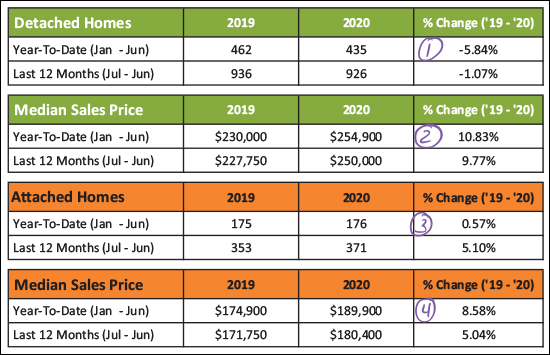 As shown above...
So, prices have risen quite a bit between 2019 and 2020 even without much of an increase (actually a slight decrease) in the number of homes that are selling. But perhaps the trend in the pace of home sales is shifting... 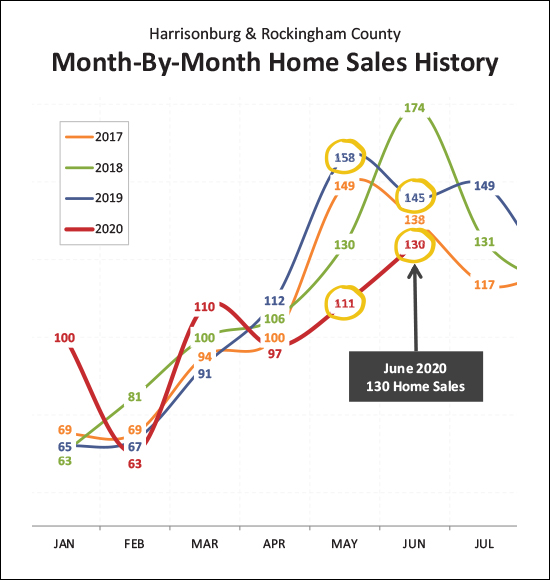 If you look at the four numbers I circled in gold above, you'll see that May 2020 home sales were drastically lower than May 2019 -- but the gap between June 2020 and June 2019 was not as severe. Perhaps we are starting to see home sales pick back up again? At least some of the (slight) decline in home sales in 2020 seemed to be a result of fewer would-be home sellers listing their homes for sale which gave would-be home buyers fewer options for buying. Now, looking at some longer term trends... 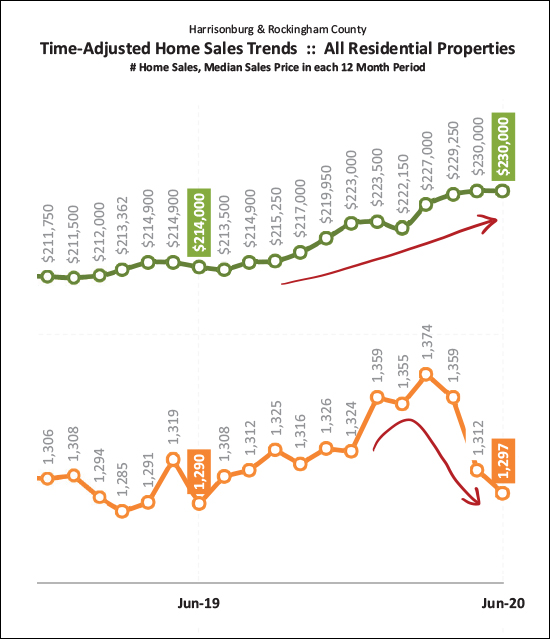 The data above looks at a moving 12-month set of data, and we're seeing divergent trends now. The median sales price (green line) keeps on steadily rising -- while the annual pace of home sales (orange line) has been drifting downward over the past three months. As noted above, fewer sales seems likely to be a result of fewer sellers being willing to sell and not fewer buyers being willing to buy -- which would at least partially explain why prices keep on rising. All of this means that is definitely still a STRONG seller's market... 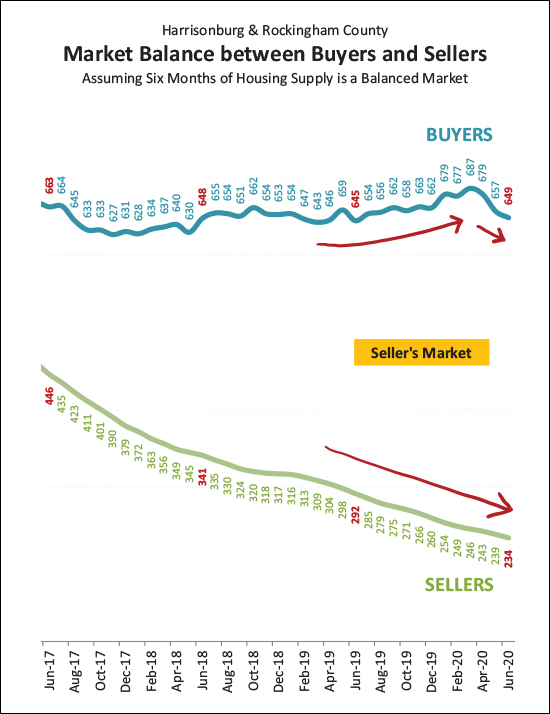 As shown above, the number of buyers buying in the market has stayed rather steady over the past few years (though it has dropped off a bit over the past few months) while the number of sellers selling (inventory at any given time) continues to decline. This makes it an absolutely wonderful time to be a seller -- and probably a not very fun time at all to be a buyer. And, well, if you need to do both (sell and buy) you'll be both ecstatic and depressed! This next stat might surprise you... 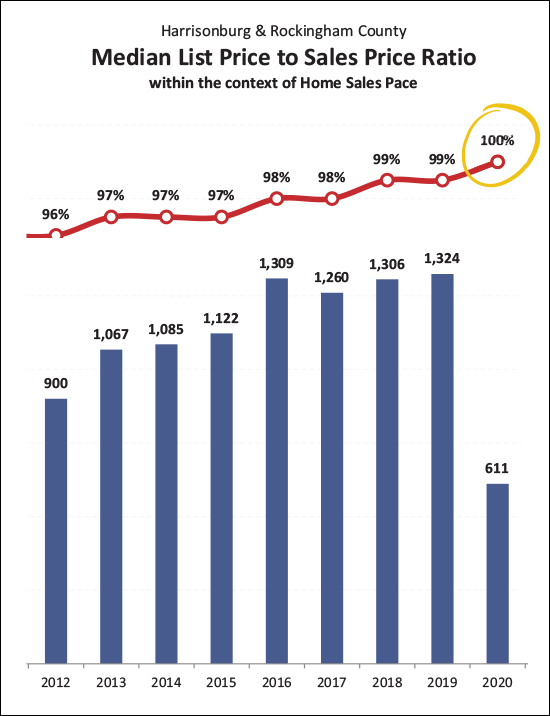 I did not see this one coming! I'll dive a bit deeper into this in the coming days, but it seems that the median "list price to sales price ratio" has risen to 100% in 2020! That means that half of sellers are selling below their list price and half of sellers are selling ABOVE their list price!? I knew sellers were having to negotiate less and less on price -- but this statistic is still rather shocking. Again, I'll dive deeper into the data in coming days to see what else I can uncover here. And set your coffee cup back down, because here's another surprise for you... 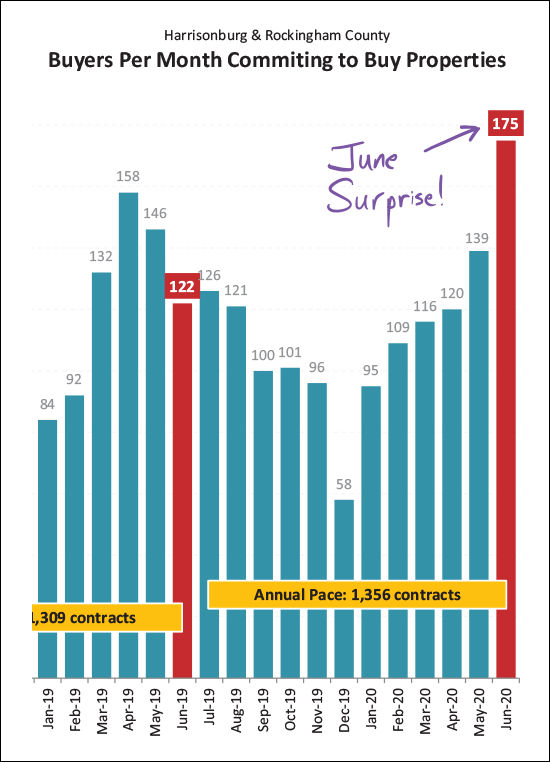 Contract activity in the first five months of the year was lagging behind this year (-5%) as compared to last year. But when we factor in June contracts, not such much! Now there have been 3% more contracts in 2020 than in the same timeframe in 2019, mostly because of the astonishingly high 175 contracts signed in June 2020! Wow! Again, I'll break this down further over the next few days to try to better understand this spike in contract activity. And as is likely NO surprise, inventory levels keep on dropping... 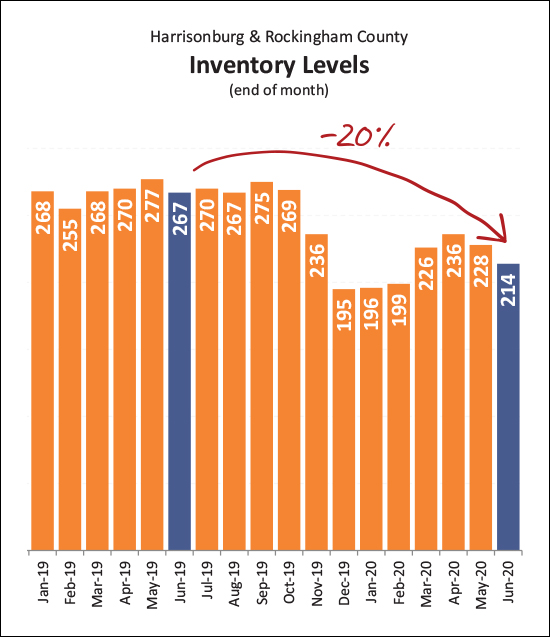 There are currently only 214 homes for sale in Harrisonburg and Rockingham County -- which is 20% lower than where we were a year ago. I was hopeful that we'd see inventory levels pick up a bit during the spring -- which didn't really happen. Maybe we'll see some late summer, early fall increases?? Finally, on to this super low, historically low, ridiculously low interest rates... 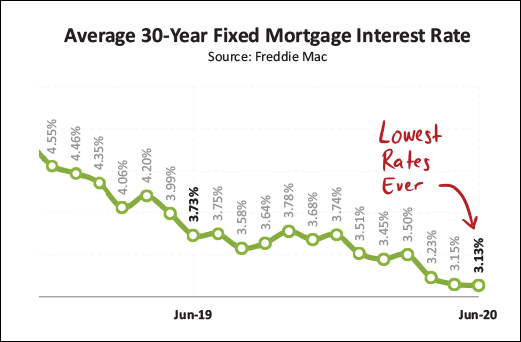 Buyers financing their home purchases over the past few months have enjoyed some absurdly low mortgage interest rates. The current average is 3.13%, which is the lowest EVER and I've even had some buyer clients pay a point or so to get under 3% -- on a 30 year fixed rate mortgage! Wow! OK - that about wraps up my monthly run down of what is happening in our local real estate market. Stay tuned over the next few days for some deeper analysis of some of the trends as mentioned above. If you have questions about what I have discussed, or about other market trends you are observing, shoot me an email. Otherwise, until next time...
Finally... if you're thinking about buying soon, or selling soon, and are looking for a Realtor to assist you with that process - I'd be happy to connect with you at your convenience. You can reach me most easily at scott@HarrisonburgHousingToday.com or by calling/texting me at 540-578-0102. Have a great second half of the first month of the second half of the year! :-) | |
Rockingham County Considers Purchase of 27 Acres Between Barrington, Lakewood for Stormwater Management Purposes |
|
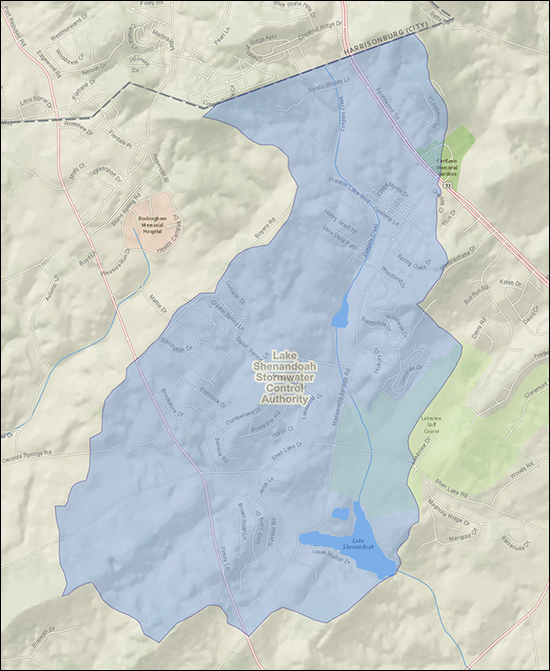
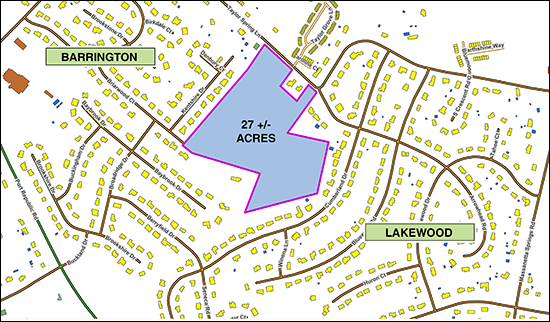 Rockingham County will likely purchase the 27-ish acre parcel on Taylor Spring Lane between Barrington and Lakewood to use for managing stormwater in the Lake Shenandoah Watershed. The purchase has not been finalized, but the County is in discussions with the land owner regarding the purchase. The County does not have a design for how the property will be used, but according to Lisa Perry, (Environmental and Land Use Manager for Rockingham County) it is safe to say that the low lying areas of the parcel will be used for stormwater storage capacity. My understanding is that only half of the property will be needed for stormwater management and that the County intends to use the other half of the land for a future County park once funding is available to build the park. Here's a reminder of some of the details of the Lake Shenandoah Stormwater Authority... If you live in (or own property in) the area shown above, you'll have a new tax to pay come December 2020 - a fee that will go towards funding upgrades in the stormwater infrastructure in the Lake Shenandoah Watershed.
These fees should bring in approximately $2.8 million over the next ten years - though the total estimated costs for the needed infrastructure improvements are between $3.15 million and $4.75 million. Also in their June meeting, the Lake Shenandoah Storm water Control Authority Board (made up of the same members as the Rockingham County Board of Supervisors)
If you live in this area, hopefully the news of this new tax isn't a surprise to you -- as it has been discussed for about a year now. The County held the first public hearing on this matter back in July 2019. | |
Local Home Prices Still Rising Despite Slightly Fewer Home Sales |
|
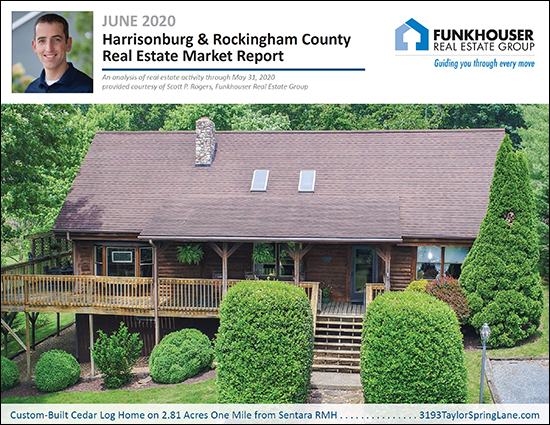 Happy Monday Morning! We're nearly halfway through the year now, and it has been a year like no other when it comes to our local real estate market and in so many other ways. Read on for an overview of our local housing market, or click here to download a 28-page PDF with all of the latest local housing market trends. But before we dive into the data, take a few minutes to check out this custom-built cedar log home on 2.81 acres one mile from Sentara RMH by visiting 3193TaylorSpringLane.com. Now, on to the data... 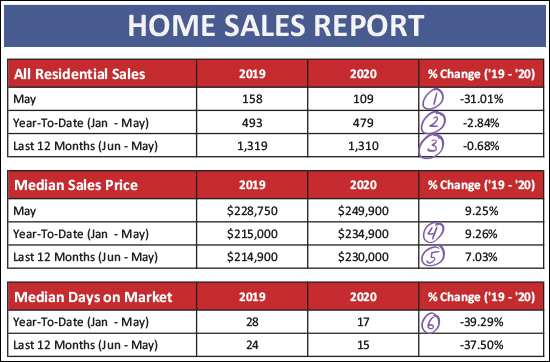 So much to point out here as this has been anything but a "normal" year...
OK - that was a lot of words to absorb - let's get to more visuals and fewer words. Relax and sip your coffee as you scroll through the following trends - knowing you'll be smarter, even if a bit more confused, by the time you get to the bottom of this overview... 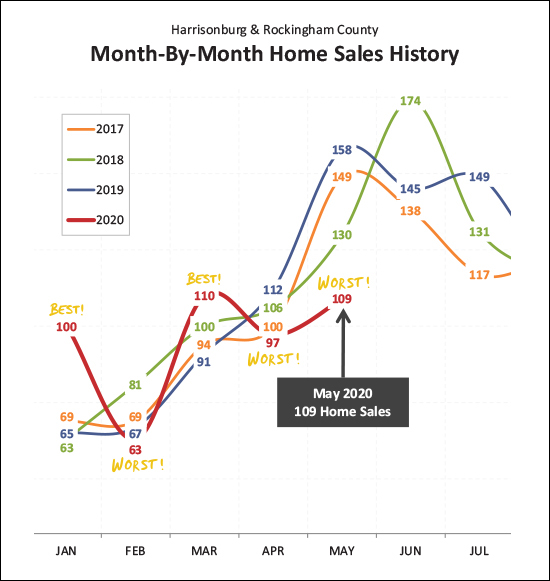 This has been a year of bests and worsts! Home sales were on fire in January and March (best months ever) and were dreadfully slow in February, April and May (worst months ever) - leaving no clear indication of whether we should be extraordinarily excited or depressed about 2020. Maybe we are experiencing this same dichotomy as we think about other aspects of 2020 as well!? :-) But when viewing these bests and worsts piled on top of each other... 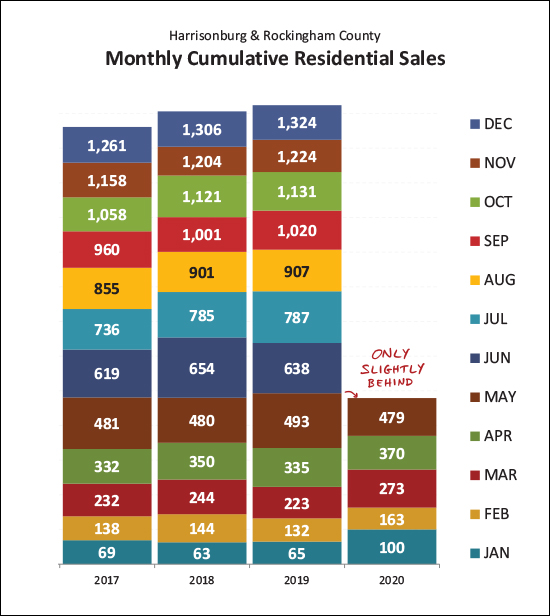 The positive impact of the strong months (Jan/Mar) have almost entirely made up for drag of the slow months (Feb/Apr/May) bringing our year-to-date total of home sales up to 479 -- only slightly behind where we were a year ago. But even if those year-to-date numbers are rosy, the most recent two months of slower sales do impact the longer-term trajectory... 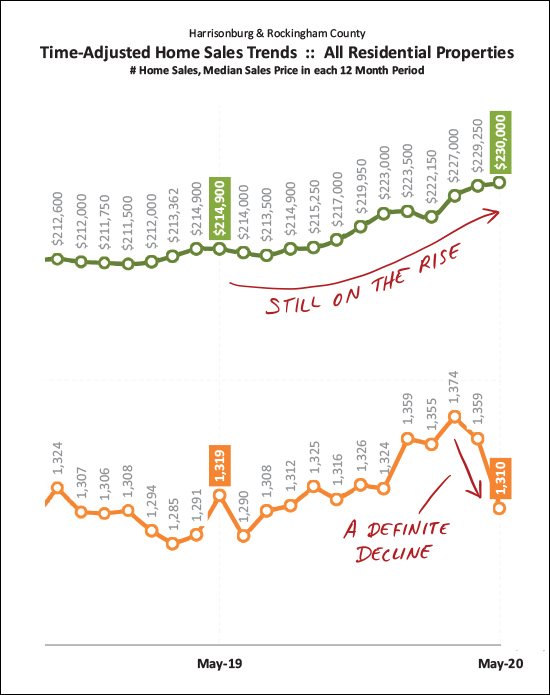 We can get excited about the top graph above -- in green -- as the median sales price is definitely still on the rise. The bottom graph (above, in orange) does show that the annual pace of buyer activity is starting to decline based on slower than normal sales in April and May. We may yet see this bounce back up depending on how June and July and August go, so stay tuned... And speaking of how future sales will go -- we ought to take a look at contract activity... 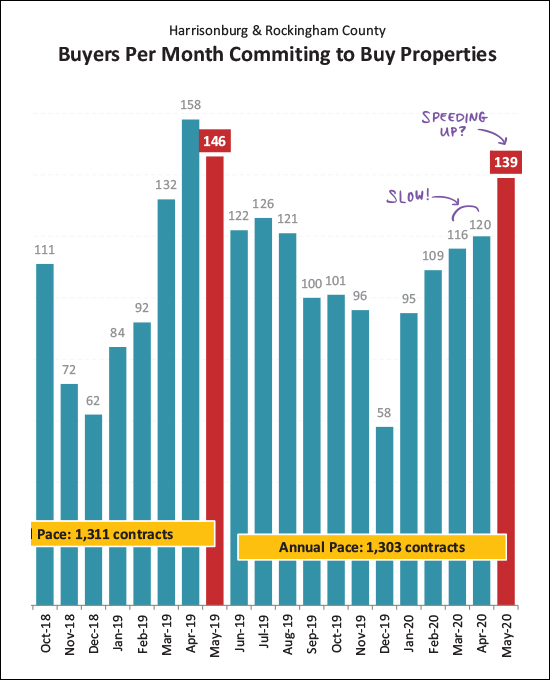 Contract activity is (clearly) a leading indicator for closed sales. Above you'll note that March and April of 2020 (116, 120) were much slower than last year (132,158) but we did see an increase in May contract activity. If we continue to see another increase in contract activity in June, then perhaps the surge of contracts being signed will just have been later in 2020 than in most other years. And if you're wondering why contract activity has been lower than usual, here is one reason for it... 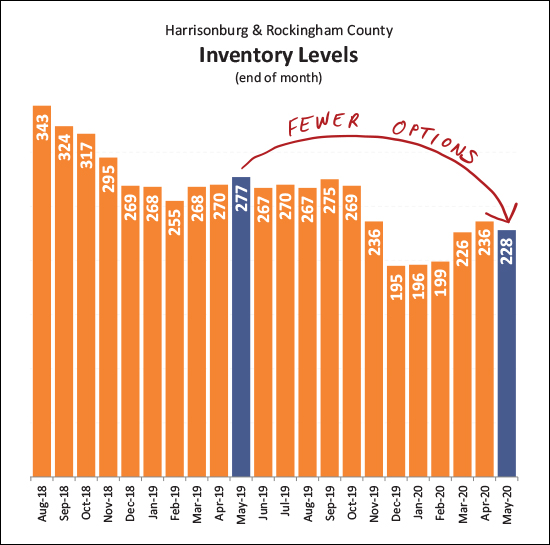 Inventory levels (the number of homes on the market for sale at any given point in time) continue to decline. As such, buyers are finding fewer (and fewer) options of homes to buy. This has been a steady trend (lower inventory levels) over the past few years and the fact that inventory levels are still dropping tells me that slower sales is a result of fewer sellers selling more than a result of fewer buyers buying. The speed at which homes sell also reinforces that conclusion... 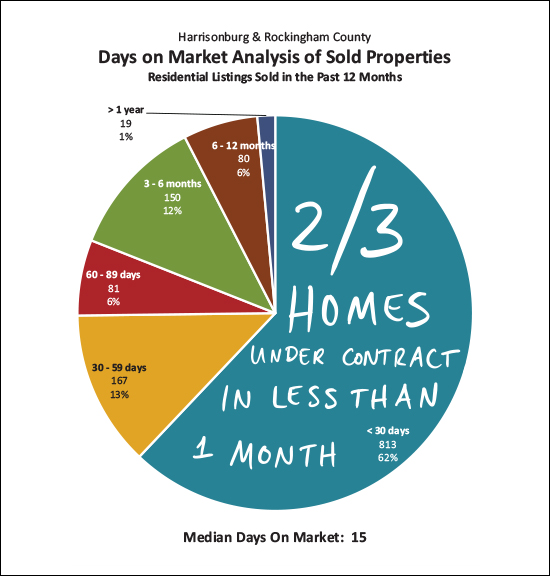 As shown above, two out of three homes are under contract within one month of hitting the market for sale. Beyond that, the median days on market for all homes that have sold in the past year -- was 15 days! So, there are fewer homes for sale at any given time, and homes are selling more quickly than ever -- indicating that buyers are still out there ready to buy -- we just need some sellers ready and willing to sell! And finally, some big picture economic indicators that are great and awful... 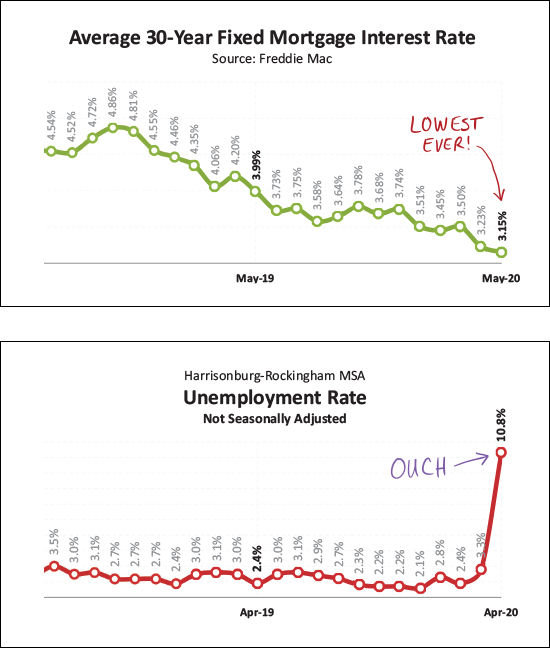 We are experiencing the lowest mortgage interest rates -- ever! Several of my buyer clients have locked in 30 year fixed mortgage interest rates below 3% (paying a point) but even without paying a point, the average rate at the end of May was only 3.15%! Yet at the same time, the unemployment rate (which had been trending lower and lower and lower) shot up from 2 point something up to 10.8% in April. This is likely at least somewhat temporary - and seems to affect folks renting homes more than those buying homes - but it is still not a great indicator of the health of our local economy. I'll be following this trajectory close over the next few months. OK - that brings your Monday morning snapshot of our local housing market to a close. And yes, I'll forgive you if you didn't get around to reading this until some other time than Monday morning. A few quick out takeaways...
If you're thinking about buying soon, or selling soon, let me know if you'd like to chat more specifically about your situation and goals. I'd be happy to help you with our potential purchase or sale. You can reach me most easily at scott@HarrisonburgHousingToday.com or by calling/texting me at 540-578-0102. Have a great week! | |
| Newer Posts | Older Posts |
Scott Rogers
Funkhouser Real
Estate Group
540-578-0102
scott@funkhousergroup.com
Licensed in the
Commonwealth of Virginia
Home Search
Housing Market Report
Harrisonburg Townhouses
Walk Through This Home
Investment Properties
Harrisonburg Foreclosures
Property Transfers
New Listings

