| Newer Posts | Older Posts |
Home Sales and Prices Still Rising Despite Declining Contract Activity |
|
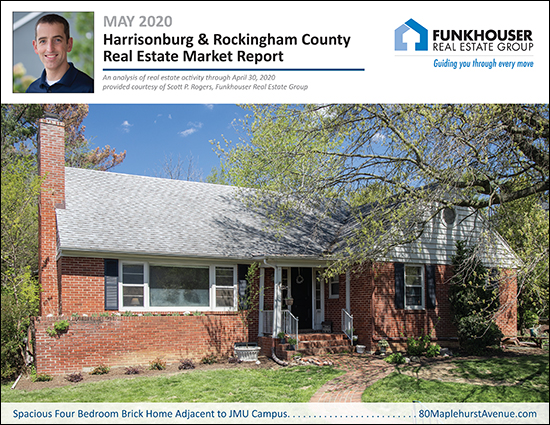 I just published my monthly market report, which you can download as a PDF here, or read on for the highlights of what is happening these days in our local housing market. But first, check out the details of the house shown above, located adjacent to the JMU campus, by visiting 80MaplehurstAvenue.com. Now, let's dive into the housing data and see what we can learn about the latest trends in the Harrisonburg real estate market... 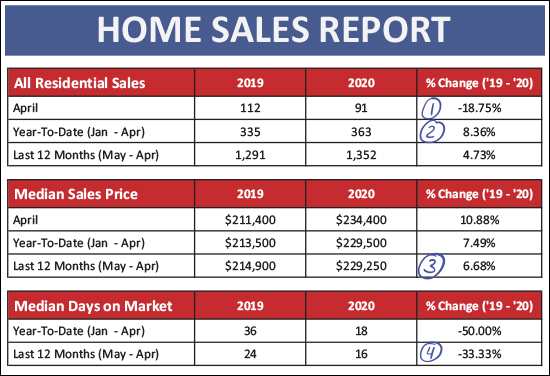 As you can see above, the pace of home sales dropped off a good bit in April 2020 (see #1) as there were only 91 closed sales as compared to 112 last April. This is not altogether surprising, as we had seen contract activity starting to decline slightly in March. The year-to-date pace of sales (see #2) is actually still quite a bit higher (8.36%) this year as compared to last year. There was a surge of home sales in January 2020 which has kept us ahead of last year when it comes to year-to-date sales despite slower sales in April. The median sales price is still on the rise (see #3) over the past year -- having risen from $214,900 a year ago to $229,250 at the end of April. Homes are selling faster and faster and faster (see #4) with a 33% decline over the past year in the median days on market. And now, let's look at how sales have bounced all over the place thus far in 2020... 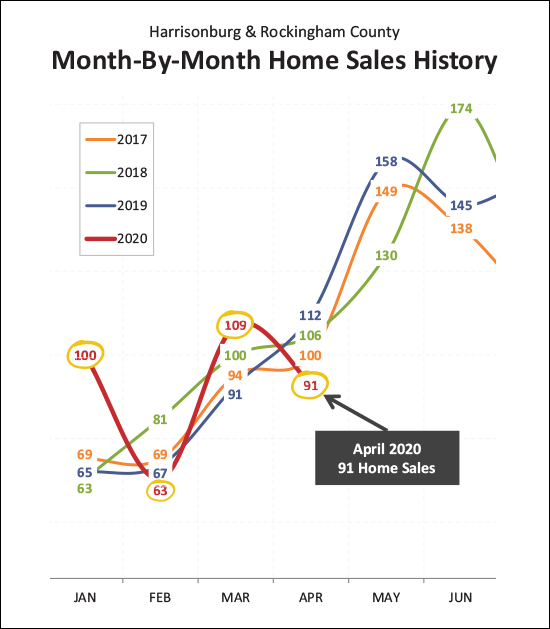 If you're feeling dizzy in 2020 trying to keep track of how the housing market is doing, you're not alone...
So, yeah - the net effect is still an increase between 2019 and 2020 - but that might shift when we include May home sales. We are likely to see fewer than 130 home sales in May based on contract activity in April. Only time will tell whether these short term interruptions of long term trends will impact those long term trends, as shown below... 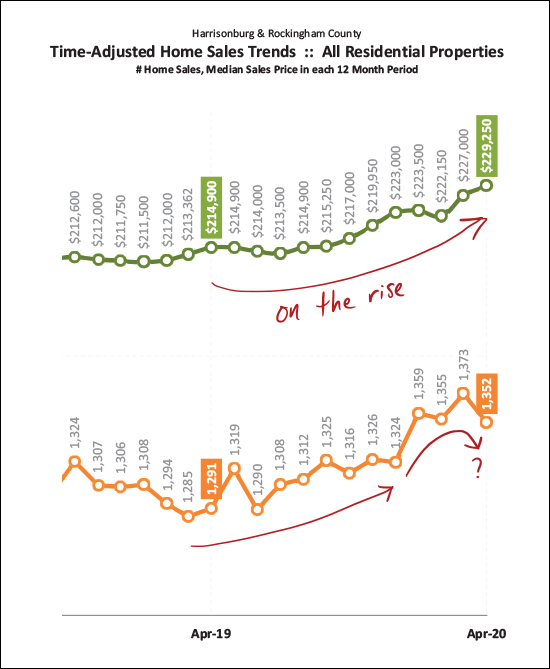 As you can see (in green) the median sales price has been steadily rising over the past year (quite a bit longer actually) to the current median sales price of $229,250. So far, we're not seeing any indications that we'll see a flattening or decline in market values in this area. Over the past year, we have seen an increase (even if choppy) in the pace of home sales, but that dropped a bit in April 2020, and might drop a bit more in May 2020. I think this is mostly related to fewer sellers being willing to sell which is resulting in fewer buyers being able to buy. It's also helpful to look at values over time just for single family homes, as the townhouse/condo market often includes investors which doesn't show owner occupant buying activity as clearly... 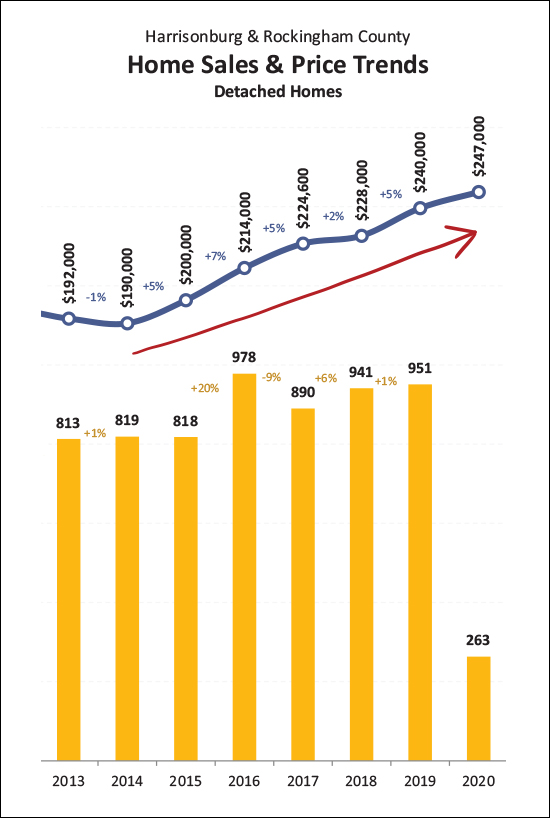 The figures above are showing the median sales price of detached homes over the past six plus years. The median sales price has risen between 2% and 7% for each of the past five years, and seems to be ready to increase again in 2020, perhaps by around 3%. Part of the reason that prices are going up is because we're seeing steady buyer demand amidst fewer and fewer options of homes for sale at any given moment... 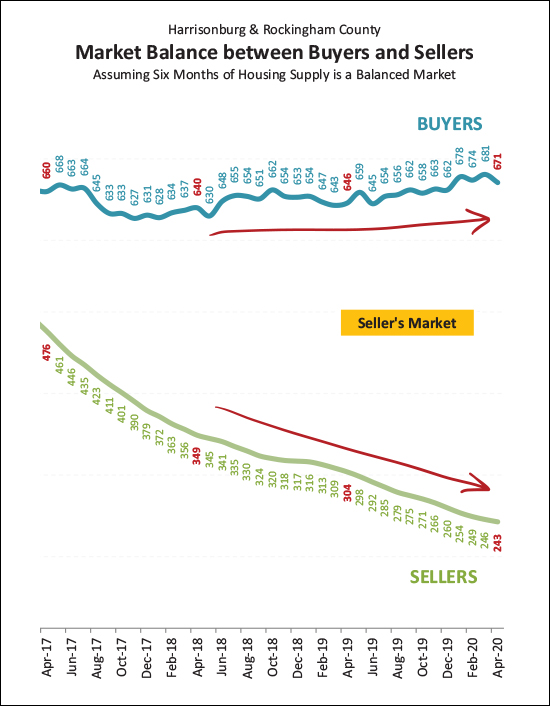 Above, we're looking at the number of buyers buying in a six month period -- which has been relatively steady over the past few years -- as compared to the number of homes on the market at any given time. The buyers are consistently ready to buy -- but they're fighting over fewer and fewer homes for sale. All that has made this an increasingly strong seller's market over the past few years. That said, buyer activity has faded a big over the past two months... 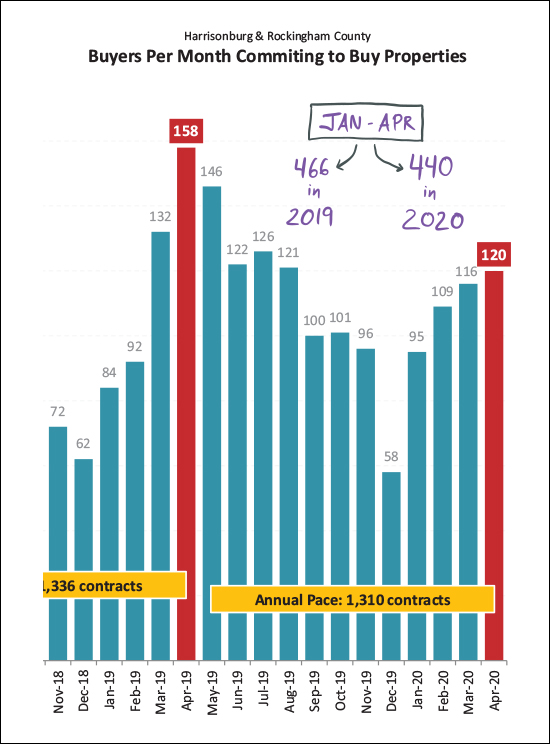 Last year, April was the strongest month of buyer activity for the entire year -- this year, not so much. We've seen an increase each month this year in the number of buyers buying -- but it has only resulted in a total of 440 contracts, as compared to a slightly higher pace of 466 contracts last year. So, slightly fewer buyers have contracted to buy in 2020, which will eventually result in a slower year-to-date sales figure, though that hasn't shown up yet. And why are fewer buyers buying, you might ask? I think the largest factor is fewer sellers being willing to sell... 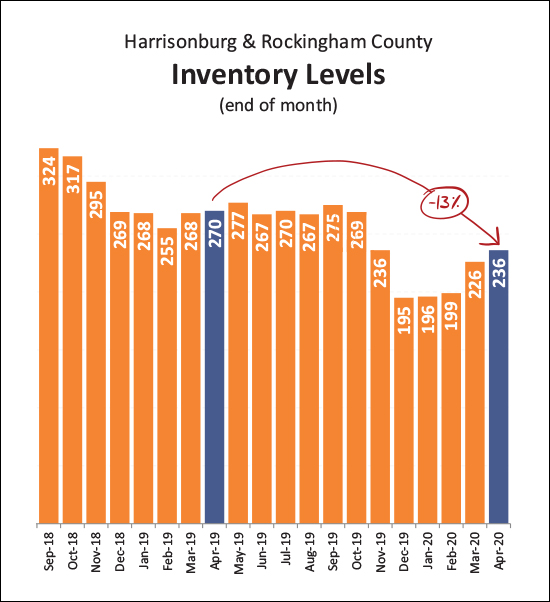 As shown above, we have seen a 13% decline in the number of homes for sale over the past year. Last year, the number of homes for sale rose to around 270 homes and stayed around that number between March and October. This year, it is not clear that we'll see inventory levels get that high. Those buyers that are able to buy, though, are financing their home purchase at a historically low mortgage interest rate... 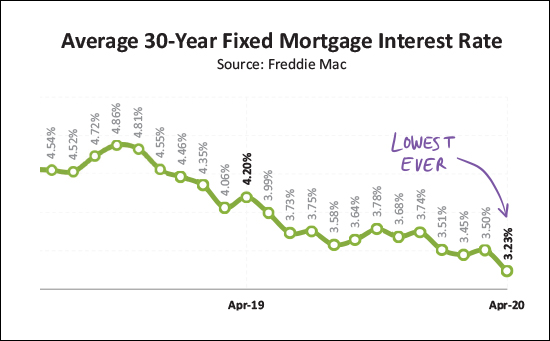 The mortgage interest rate at the end of April was 3.23%, which is the lowest on record -- ever. If you are buying in today's market, and are able to secure a contract on a house in this low inventory environment, you are certain to be pleased with your mortgage interest rate. OK, well, I'll leave it at that for now. You can review all of the trends and graphs by downloading a PDF of my market report here, or follow my blog at HarrisonburgHousingToday.com where I'll continue to monitor trends in our local market. In summary, the local housing market continues to see more homes selling, faster, at higher prices - but a small slow down in seller (and thus buyer) activity over the past two months will likely start to translate into slightly slower pace of sales, even if prices are not affected. Until next month, stay healthy, stay sane, and be in touch if I can be of any help to you or your family - with real estate or otherwise. | |
Harrisonburg Area Housing Market Still Strong Through End Of March 2020 |
|
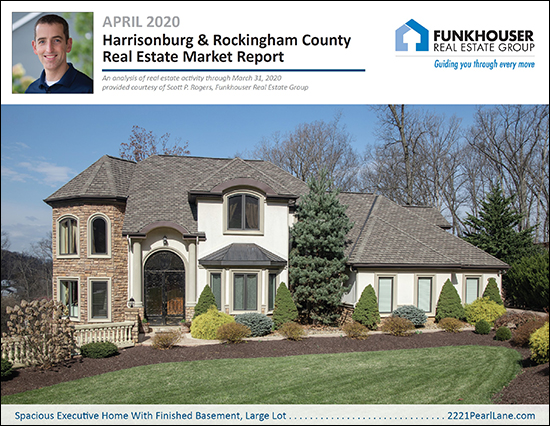 I'm working from home today, as is the norm for many of us these days. I hope that you and your family are in good health and good spirits as we travel through these unprecedented times. Before we get going, here are two articles I wrote a few weeks ago that are still quite applicable given the current scenario with COVID-19... What follows is an update on our local (Harrisonburg and Rockingham County) real estate market as measured by home sales data through the end of March 2020. Overall, you'll see that almost all indicators are still quite positive in our local market. If we are going to see an impact of COVID-19 on our local housing market, we might first see signs of that another month or two from now. Before we dive in, take a few minutes to learn more about this month's featured home - an upscale home in the Blue Stone Hills area - by visiting 2221PearlLane.com. Also, for those that like to cut to the chase, here's a PDF of my entire market report. Now, onto some data, and what we might conclude that it means... 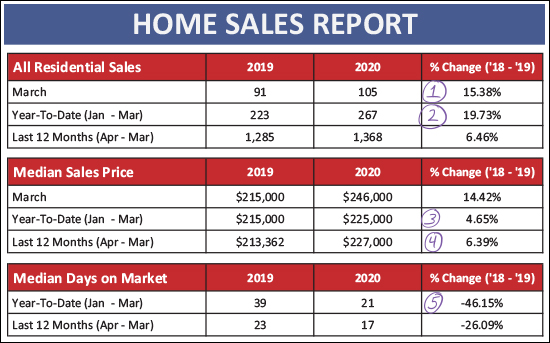 As shown above...
So, we have been seeing a relatively strong and robust market through the end of March! It gets even more interesting when examined visually... 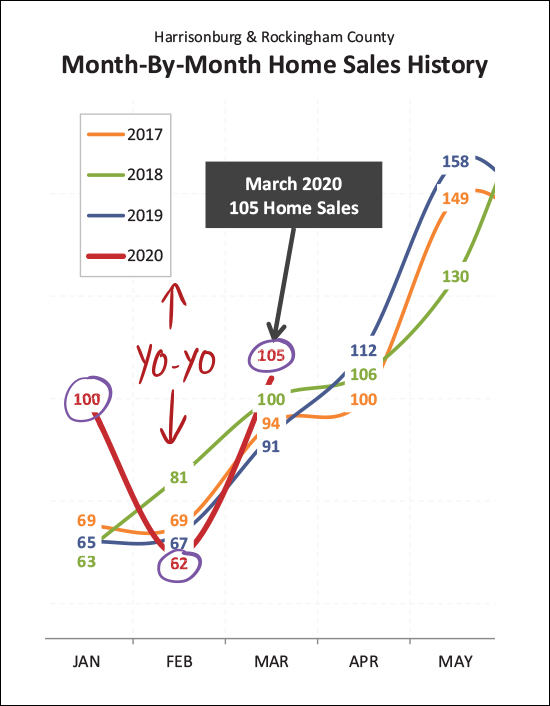 This year has certainly been quite a yo-yo when it comes to sales per month. We saw a record breaking number of sales in January (higher than the prior three months of January) and then a depressingly low number of sales in February (lower than the prior three months of February) and then things bounced right back up again in March to the highest month of March sales seen in the last few years. I suppose it's not totally unreasonable to think we could see another yo-yo move in April if home sales dip back down somewhat due to COVID-19. Read on a bit more for data on contract activity in March. 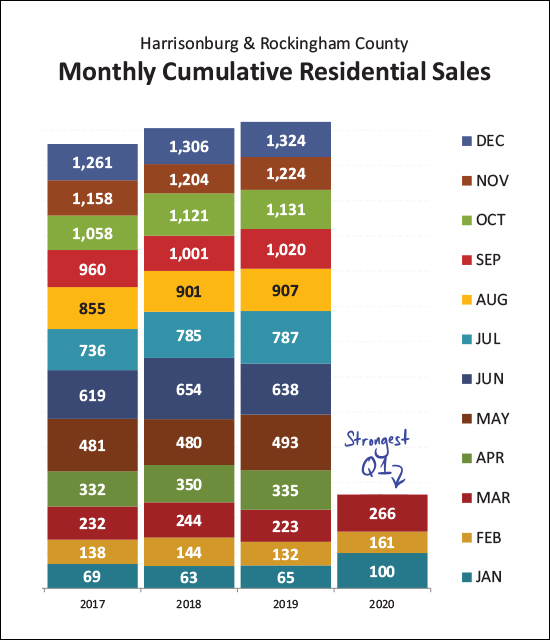 Looking at the data visually, again, you'll note that we saw the strongest first quarter of home sales in quite a few years in 2020. If this trend continues we would likely see 1,350+ home sales this year. 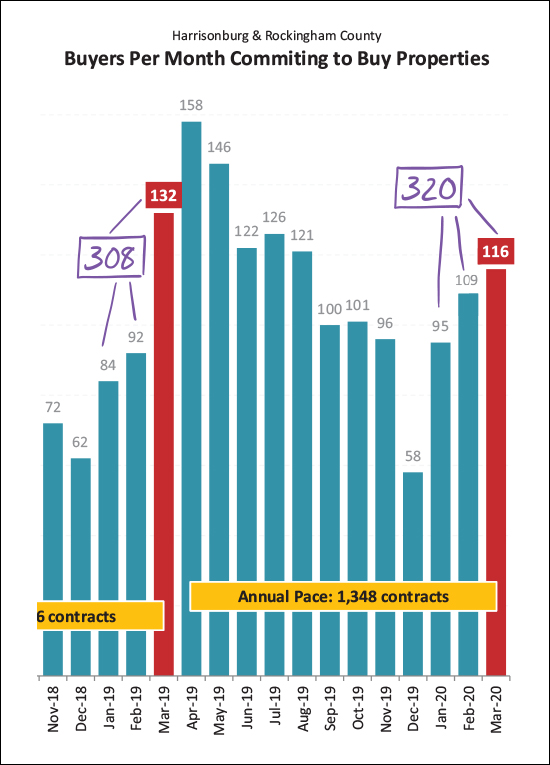 Looking now at contract data (above) you'll note that there were only 116 contracts signed in March 2020 - which is a drop off from the 132 contracts signed last March. However, when looking at the entire first quarter (Jan-Mar) this year's buyers have been a group of 320, while only 308 buyers showed up last year during the same timeframe. Last year, April was the strongest month of buyer activity -- as measured by when buyers are signing contracts -- and it will be interesting to see if that proves to be true this year. 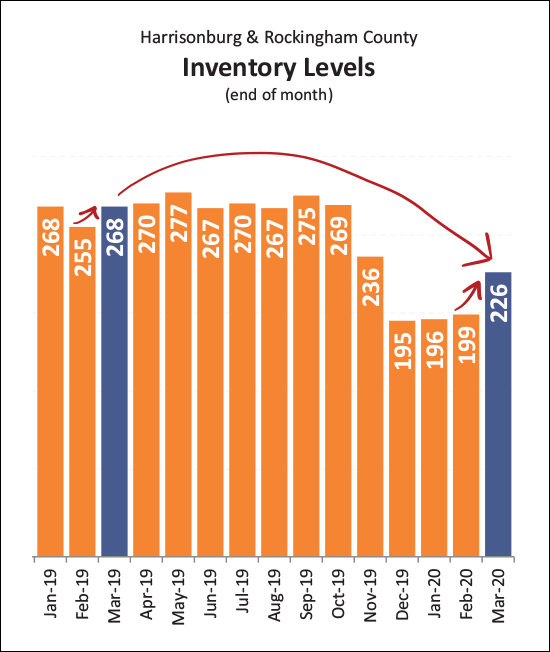 Changes in housing inventory (the number of homes on the market for sale) were somewhat predictable over the past month. We usually see inventory levels starting to climb in March (we did this year) but we also saw an overall year-over-year decline in inventory levels, as we have been seeing for the past few years. This will be another good indicator to watch in the coming months to see how the number of homes on the market is affected by COVID-19. 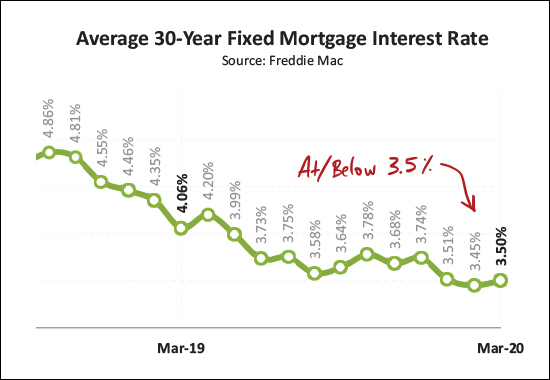 If you're buying a home right now -- or refinancing your mortgage -- you are likely quite pleased with some super-low interest rates. The current average rate for a 30 year fixed rate mortgage (on a purchase, not a re-fi) is 3.5%. This creates an extraordinary opportunity for today's buyers to lock in their housing costs at a low level as it relates to the interest they are paying on their mortgage. 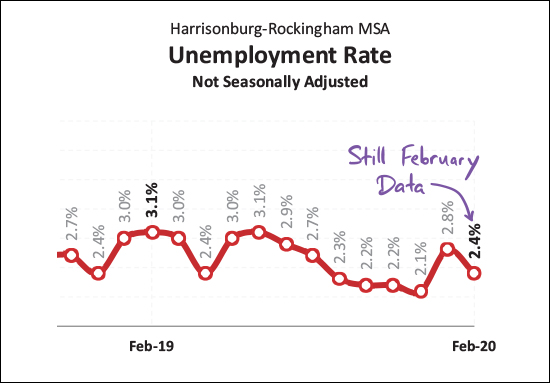 Any changes to this chart above will be telling in the coming months. We only have unemployment data through February right now, and at that point, things were looking great! This could change quite a bit moving forward. That is all of the graphs I'll throw at you today. In conclusion, through the end of March, our local housing market was continuing to move right along at a steady clip. Plenty of sellers are still listing their homes for sale. Plenty of buyers are still contracting to buy homes. Here are a few other articles that I have written over the past few weeks that explore some of the nuances of our market... As we continue through this unprecedented time, I'll continue to monitor where we are and contemplate where we might be headed, and I'll share them with you in my monthly market reports. Until next month, I hope you and your family remain healthy, and if you have questions about how current market dynamics might impact your plans for potentially buying or selling a home this year, feel free to reach out by sending me an email - scott@hhtdy.com. | |
How Is Coronavirus Affecting How Many Buyers Are Buying Homes In Harrisonburg, Rockingham County? |
|
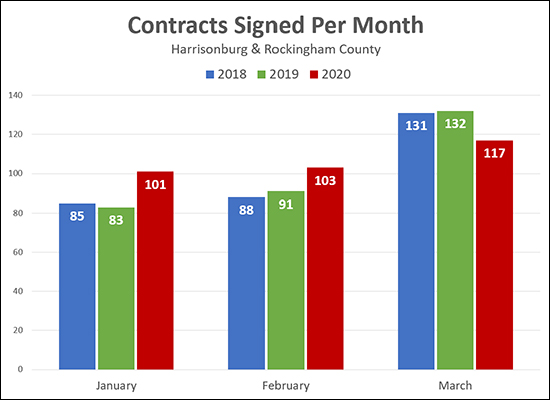 Is Coronavirus slowing down home buyers in Harrisonburg and Rockingham County? It seems it may be, somewhat, but it's probably too early to make any definitive conclusions. Based on the graph above...
Here's another graph that shows looks at the cumulative number of home buyers who signed contracts through the entire year in 2018 and 2019, and thus far in 2020... 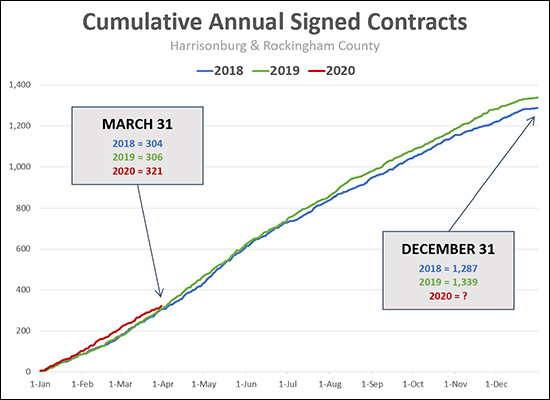 Above, you'll note that 2020 is still ahead of 2018 and 2019 when looking at the sum of January through March -- but that 2020 is drifting back downward towards 2018 and 2019. And, plenty disclaimers...
Anyhoo - lots of data, lots of possible conclusions, lots of caveats, and lots to continue to monitor over time. If you're thinking of buying or selling this Spring, let's chat about what makes sense from a timing perspective given continually changing market dynamics. | |
Should I List My House For Sale Now? |
|
 School is cancelled and/or happening at home for the rest of the year. Businesses are closing. Folks are encouraged to stay at home and certainly not spend time in groups any larger than 10 people What does this mean for someone thinking about selling their home? If you were planning to sell your home this Spring, should you list it for sale now, given the current state of affairs? As usual, it depends... Yes, you should list your house for sale now...
No, you should not list your house for sale now...
So, plenty of reasons to list your home for sale, and plenty of reasons to hold off on doing so. All that said, this gets slightly more nuanced once we consider your reasons for selling...
So - yes - it depends. If you were planning to list your house for sale this Spring, the decision to do so is at least a bit more complex than it was previously. Let's talk sooner rather than later (and then on an ongoing basis) to figure out what makes the most sense for you given your circumstances and goals. | |
Is COVID-19 Impacting Our Local Real Estate Market? |
|
 Public Service Announcement: Wash Your Hands! :-) Now, back to COVID-19, several folks have asked me if it is impacting our local real estate market. So far, it seems maybe not, for most folks?
So, amidst some rapidly changing times, with many folks working from home and with schools, movie theaters and many businesses closed, it seems that many sellers are still willing to sell and many buyers still want to buy. A few notes, though...
One last note -- all I'm pointing out above is that so far, things seem to be continuing on at a relatively normal clip in the local real estate market. That said, I do recognize that many folks may be seeing significant changes in their lives, their work, their small businesses, their income, etc. So -- two things I'm not saying...
If you have further questions about all of this -- or thoughts, comments or suggestions -- drop me a line at scott@hhtdy.com. | |
Harrisonburg Area Home Sales Remain Strong in 2020 Despite Slower February |
|
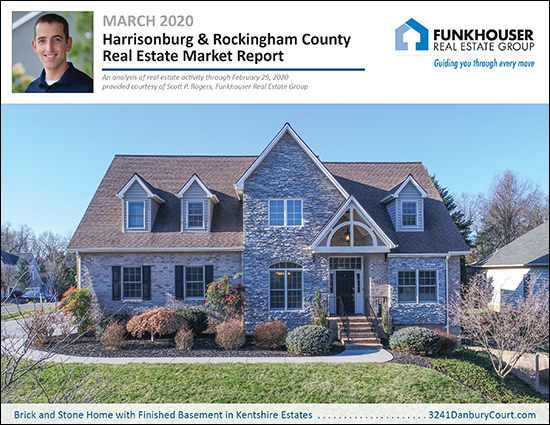 This month's featured home (shown above) is located in Kentshire Estates and you can find out much more about it out by visiting 3241DanburyCourt.com. OK. Now. Let's set the stage... Home sales slowed and prices fell in February 2020. Ahhh! Is the sky falling? Before you lump this news in with the rise of the coronavirus and the decline of the stock market -- remember two things...
So, there we go. Read on to better understand both short and long term trends in our local housing market -- but don't let a few less-than-exciting short term trends make you think our local housing market is (necessarily) experiencing anything as dramatic as what you're hearing about in the (health and economic) news of the week. Moving out from my drawn out intro -- here's the PDF of the entire report -- and let's dive in... 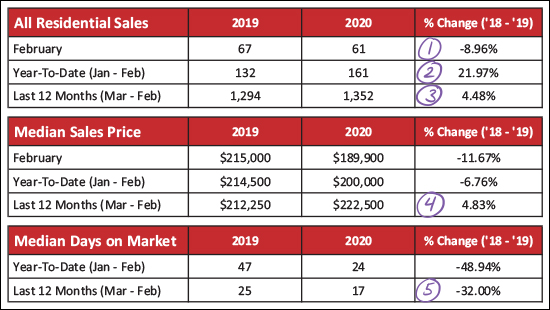 Lots to see and think about above...
This next graph could - again - scare you, given the sort of crazy news we're hearing about all day long this week... 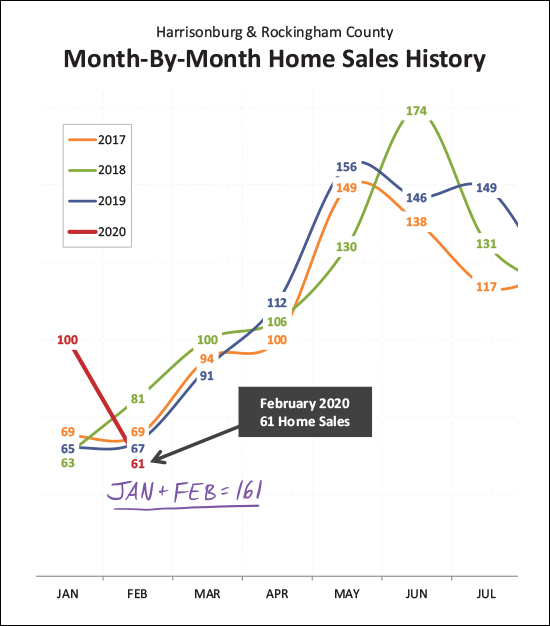 January 2020 was the strongest January we've ever seen -- and it was followed by one of the slower months of February in recent years. Again, should we panic? That red line is going nearly straight down! Here's my take on it -- any given month can be abnormally strong and any given month can be abnormally weak -- perhaps January was overly strong and February was overly weak. I come to this conclusion by looking at January and February sales combined, and am noting that the 161 sales in these two combined months is much higher than the same two months during the previous three years. So -- this isn't a message of "don't worry about that slow, slow February - everything is going to be just fine - trust me" -- it's more of a message of "the market still seems to be quite strong despite a slightly odd (slow) February." And now, we might be done with the nail biting portions of this monthly update on our local housing market, because most of the remainder of these graphs focus on the big picture and the long term trends... 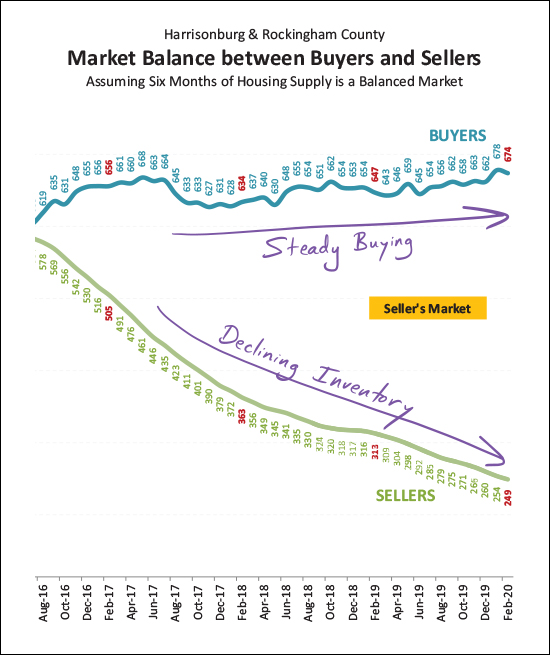 As shown above, buyers have been steadily buying homes at a slightly (just slightly) faster pace for each of the past few years -- but they have been choosing from a smaller and smaller pool of homes for sale at any given time. This has created a strong "seller's market" where many homes are seeing a flurry of showings when they first come on the market and sometimes are seeing multiple offers. 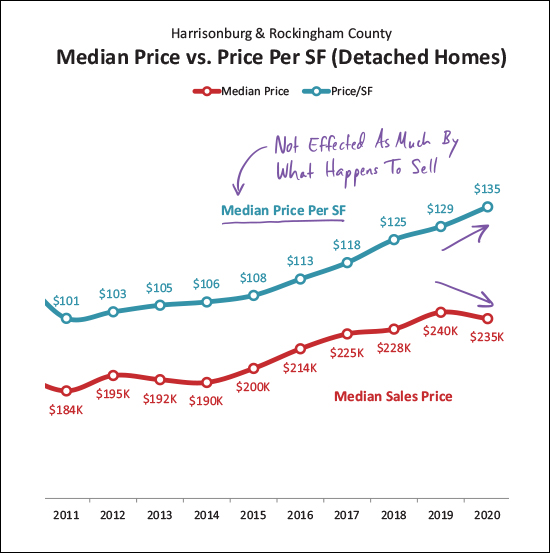 I don't usually include the graph above in this monthly re-cap, but I thought it was helpful this month. The median sales price has declined slightly between 2019 and 2020 (looking only at January and February 2020, of course) but you will note that the median price per square foot has increased during that same timeframe. This is a good indicator that the downward shift in sales prices is likely a change in what is happening to sell, more so than a change in home values. If more smaller homes are selling thus far in 2020 (as compared to all of 2019) then the median sales price would decline while the median price per square foot increases. 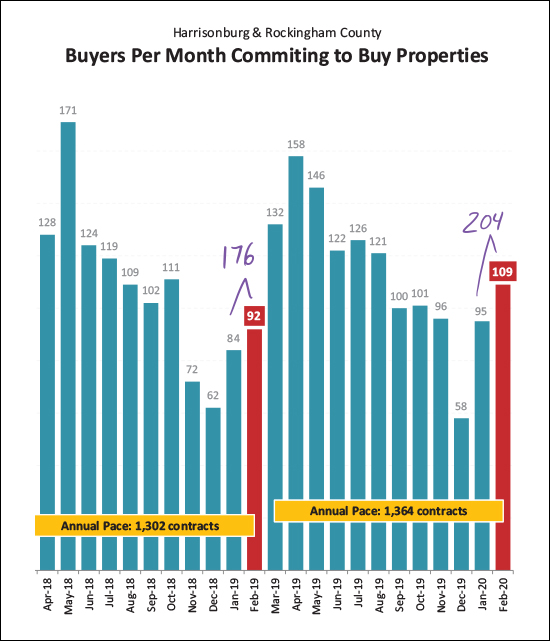 Another important distinction to make when thinking about short term market trends -- changes in the pace of closed sales are not a good measure of current buyer behavior, they just show how many buyers were (or were not) signing contracts 30 to 60 days ago. So, the fact that there have been 204 contracts signed this January and February -- compared to only 176 last January and February -- is likely a good indicator that we will see (closed) home sales bounce back up again in March and April. 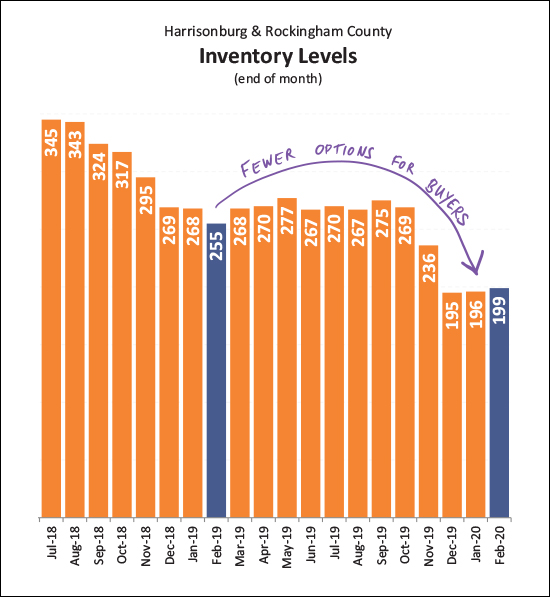 One of the main story lines of the past few years has been fewer and fewer choices for buyers in the market -- and this has continued into 2020. The number of homes on the market at any given time continues to fall -- and has now been (slightly) below 200 for three months in a row. This makes it a thrilling time to sell (many showings, sometimes multiple offers) but makes it a nerve-racking, frustrating time to (try to) buy a home. 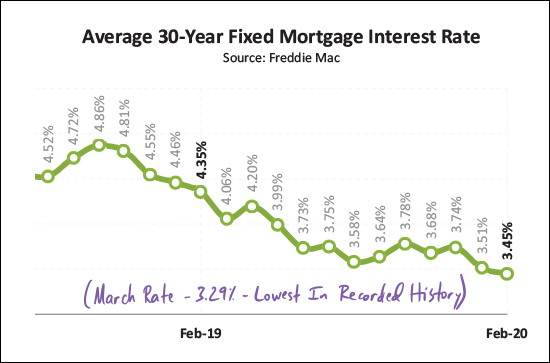 OK -- if there is one trend in this report that is definitely and 100%, completely, and fully related to the coronavirus, this (above) is the one. The Federal Reserve cut its benchmark interest rate by half a percentage on March 3 to try to combat any adverse economic effects of the coronavirus. That March 3rd rate cut isn't shown above, since my graph only goes through the end of February, but it caused the already low average rate of 3.45% to dip even lower, down to the current level of 3.29%, which is the lowest average mortgage rate that we have ever seen for a 30 year fixed rate mortgage. OK, alright, we made our way through the data for the month. There is much more, of course, in the full PDF of my market report. As we continue to learn more about the coronavirus I hope that you and your family and friends remain well. I don't expect that we'll see drastic ramifications of the coronavirus on our local real estate market because I believe people will still need housing, and people will still have jobs - but we will all have to closely monitor how things develop from here. My advice from last month still applies... If you're planning to sell your home in 2020 -- let's chat SOON about the best timing for doing so, what you should do to prepare your home for the market, and of course, we'll want to start by analyzing your segment of the market. As always -- shoot me an email if you have follow up questions or if you want to chat about your plans to buy or sell. | |
Home Sales Soar To Surprising New Heights in January 2020 |
|
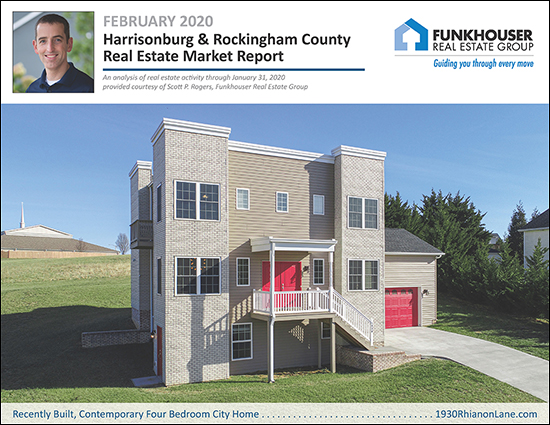 Time seems to be passing quickly these days, perhaps because my two kids are growing up faster than I can believe - age 15 (also known as "almost driving") and 11 (but 12 next month!). In the vein of time passing quickly, I was surprised to realize this week that the year is essentially 1/8th of the way over now!? How does the time slip by so quickly? Well, if you blinked, and missed January - you missed a LOT of home sales in Harrisonburg and Rockingham County. We'll get to that soon (keep reading) but first I'll point you to a few quick links... OK - now back to the business at hand - breaking down the latest trends in our local housing market. First, some of the basics... 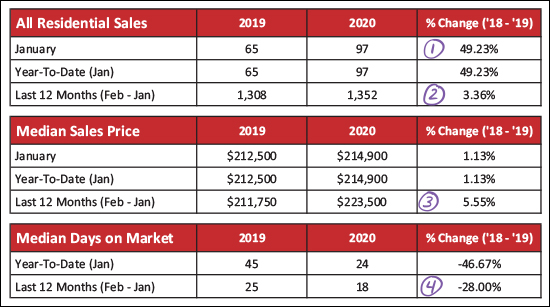 As shown above...
If we then dive into detached (single family homes) and attached (townhouses, duplexes and condos) we find relatively similar trends... 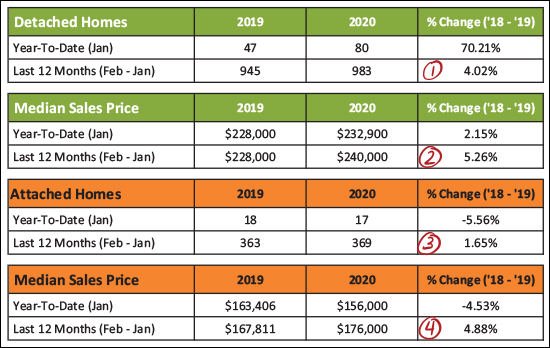 In the breakdown above, you might note that...
And now, the visual of what we'll call a crazy January... 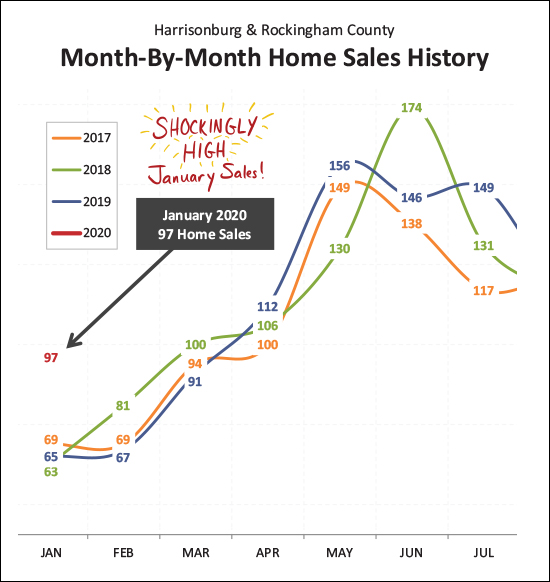 If there was one thing it seemed we could count on, it was that we'd see between 60 and 70 home sales in January. That's what we've seen for the past three years - and looking back even further (2010-2016) we find even lower months of January sales - 47, 40, 41, 49, 56, 49, 67. But not this year. This year started off with a BANG with a shockingly high 97 home sales in Harrisonburg and Rockingham County. Could this be an anomaly? Will February sales be miserably slow, bringing a January/February average to more normal levels? Maybe. Will every other month this year fall back in line with normal historical trends? Maybe. Or -- will this year be unlike any prior with much higher sales than expected, all year long? Maybe. Stay tuned to see how things shape up after this blockbuster month of sales in January. And look what this crazy January contributed towards... 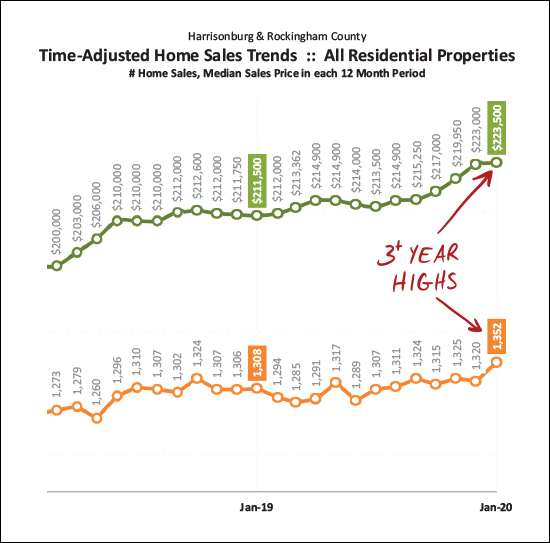 The data above looks at 12 months of data at a time - month after month - to see long term trends. These long term trends have now pushed us to the point of having 3+ year highs in both categories shown - the pace of sales and the price of sales. The median sales price of $223,500 is higher than it has been in many more than three years. Likewise, the annual pace of 1,352 home sales is higher than it has been in over three years. So, it's a wild time right now in the local housing market with steady growth in sales prices and stable but strong numbers of home sales. Circling back to the prior question - will home sales taper off in February? 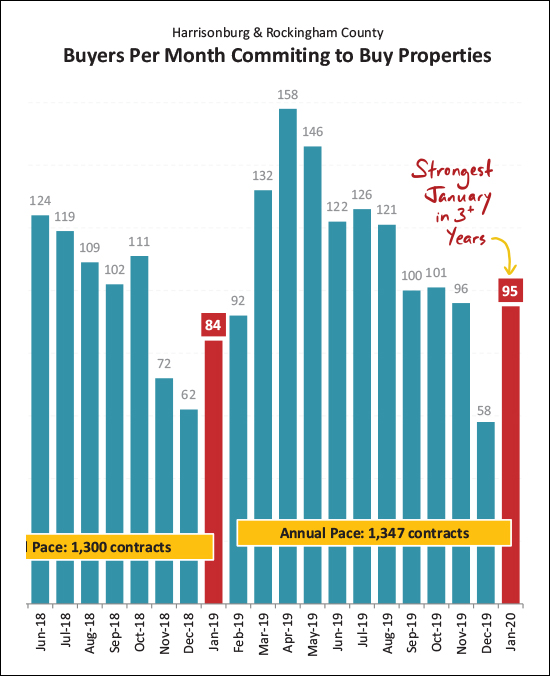 I'm going to lean towards "no" -- given that 95 contracts were signed in January -- many of which will result in February home sales. As an aside - I have been tracking "under contract" data since 2008 -- and there has never been a January with quite so many contracts signed as we saw this January. So, maybe February will be a relatively strong month for home sales as well? And these increases, while one major metric keeps decreasing... 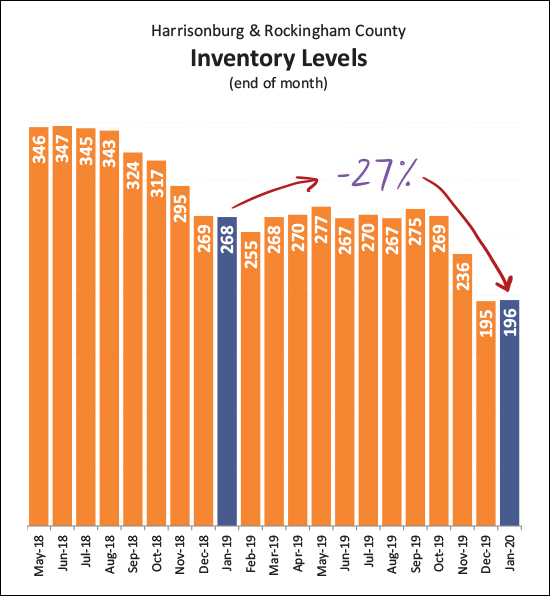 Indeed, despite increasing sales, the number of homes on the market at any given time keeps declining. We've seen a 27% year-over-year decline in the number of active listings on the market. So, how do more homes sell if fewer homes are on the market? It seems that plenty of homes are coming on the market for buyers to buy - but because buyers are contracting to buy them so quickly these new listing aren't staying on the market long enough to allow inventory levels to see an effective increase. Speaking of buyers contracting to buy homes quickly... 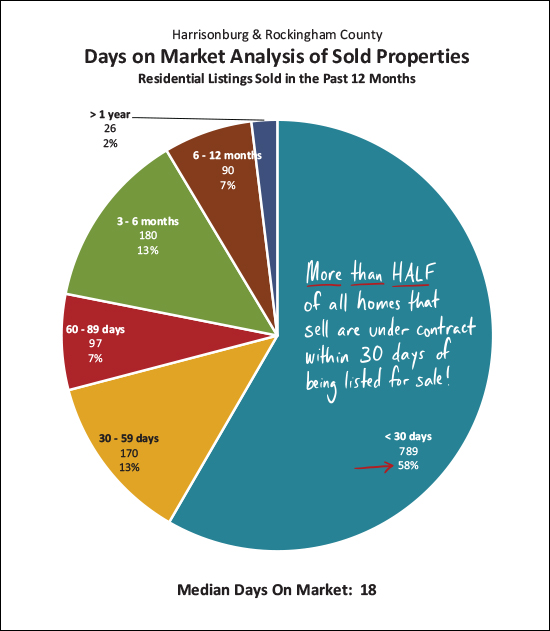 More than half (58%) of homes that have sold in the past year were under contract within 30 days of being listed for sale. Homes are, indeed, selling quickly. The median "days on market" currently stands at 18 days. A nice time to be a home seller if you're hoping not to have a prolonged period of time having buyers coming to view your house. Depending on your home's price, condition, layout, location, it may very well go under contract quickly! And today's buyers are paying lower mortgage interest rates than we've seen in a while... 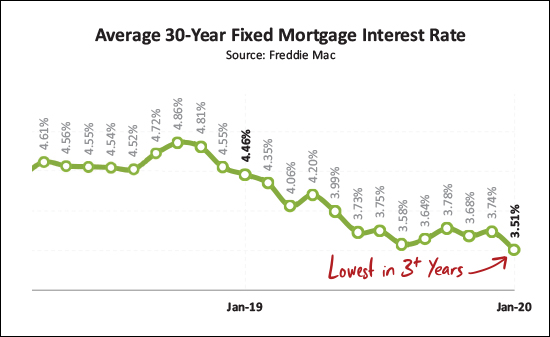 The average mortgage interest rate on a 30 year mortgage has now dropped to 3.51% - the lowest rate seen in over three years. Buyers who are currently buying a home are fixing in lower monthly payments than they would have seen with any recent mortgage interest rate - though that is offset somewhat by the increases in median sales prices over the past few years. OK - that's it for now - I'll be diving into a few more market dynamics in the coming days. But until then... If you're planning to sell your home in 2020 -- let's chat SOON about the best timing for doing so, what you should do to prepare your home for the market, and of course, we'll want to start by analyzing your segment of the market. If you're planning to buy a home in 2020 -- get ready to compete with lots of other buyers in a low inventory housing market. To assist you, sign up to get alerts of new listings, talk to a lender to get pre-approved, and let's get ready to make a mad dash to see new listings as soon as they come on the market! As always -- shoot me an email if you have follow up questions or if you want to chat about your plans to buy or sell. | |
More Homes Sold... More Quickly... at Higher Prices in 2019! |
|
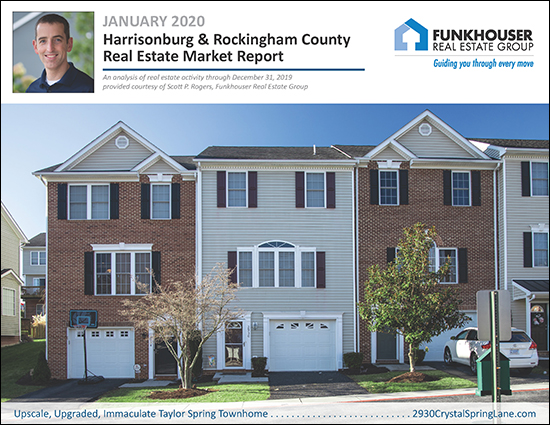 Happy New Year and New Decade! And what a decade it was for the Harrisonburg and Rockingham residential real estate market! Read on to learn more about the new highs (and lows) we experienced in 2019 to finish out the decade -- or download the PDF here. But first -- feel free to explore this month's featured home -- an upscale townhouse in Taylor Spring that just hit the market this morning. Visit 2930CrystalSpringLane.com for details. And now, on to the some highlights of what's new and exciting in our local real estate market... 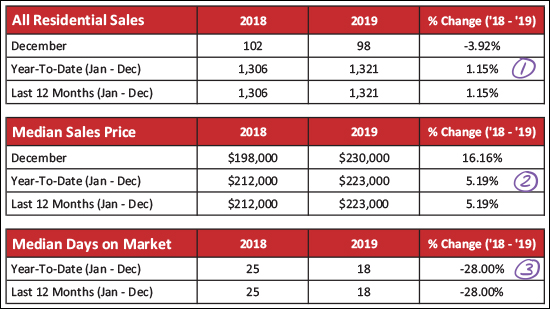 [1] First things first -- we saw more home sales in 2019 than we did in 2018 -- though barely. There was a 1.15% increase in the number of homes selling in Harrisonburg and Rockingham County. This 1.15% increase did set some new (recent) records though, so keep on reading for that fun detail. [2] If the increase in the pace of sales was possibly smaller than expected -- the increase in the median price of those homes was probably larger than expected. I typically reference that median home prices usually increase around 2% to 3% per year over the long term -- but last year the median sales price jumped 5.19% in a single year to $223,000. This is certainly exciting for home owners and home sellers -- though not as thrilling for home buyers. [3] Finally, the time it took for homes to sell in 2019 dropped 28% to a median of only 18 days! This is a measure of how many days it takes for a house to go under contract once it is listed for sale. In summary, more homes sold, at higher prices, more quickly in 2019. But let's dig a bit deeper... 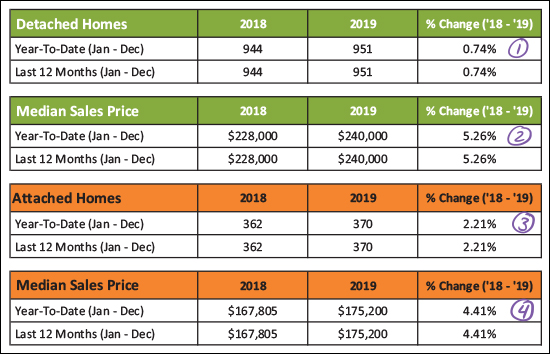 [1] The number of detached (single family) homes that sold in 2019 was only 0.74% higher than in 2018. So, we'll say about the same number of detached homes have sold in each of the past two years. [2] The median price of those detached homes has risen - a full 5.26% over the past year to the current median sales price of $240,000 for all of Harrisonburg and Rockingham County. [3] There was a slightly larger (+2.21%) increase in the pace of sales of attached homes (duplexes, townhouses, condos) in 2019 -- though that small increase (362 sales to 372 sales) isn't anything to write home about. [4] The median price of the attached homes that sold in 2019 was 4.41% higher than the prior year -- bringing us to a $175,200 median sales price for attached homes in Harrisonburg and Rockingham County. Zooming in a bit on December and the fourth quarter of 2019 we find... 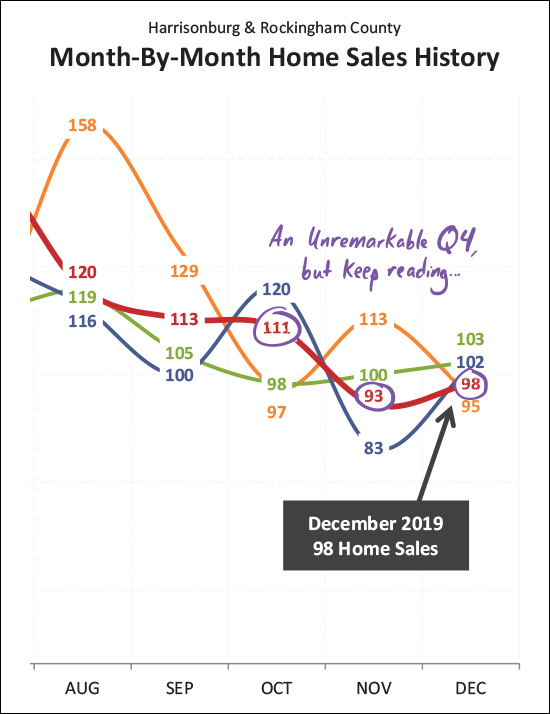 ...just about nothing extraordinary. Darn. :-) Home sales during October, November and December of 2019 were squarely in the middle of the pack as compared to the past few years. So, no main takeaways there -- it seems we had a typical end of the year in our local housing market. But that typical end of the year piled on to the first nine months... 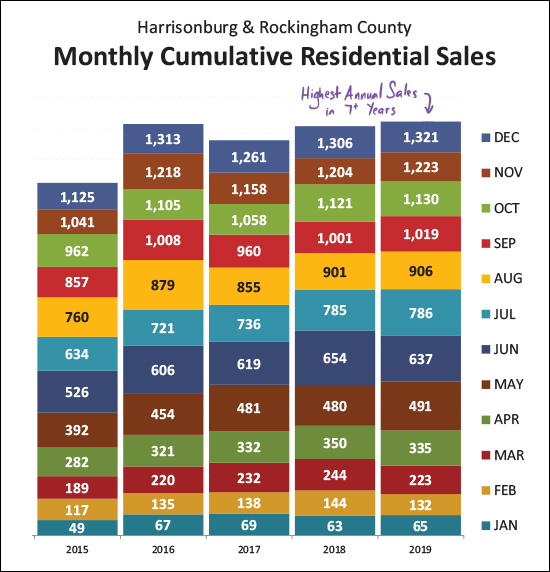 As shown above, it was only a small (small, small) increase in the number of homes selling between 2018 and 2019 -- but it was enough to push us above the two recent highs seen in 2016 and 2018. I cropped this graph a bit too tightly to see it, but 2019 home sales were the highest we have seen in 7+ years. Oh, and it seems I can make an even broader statement... 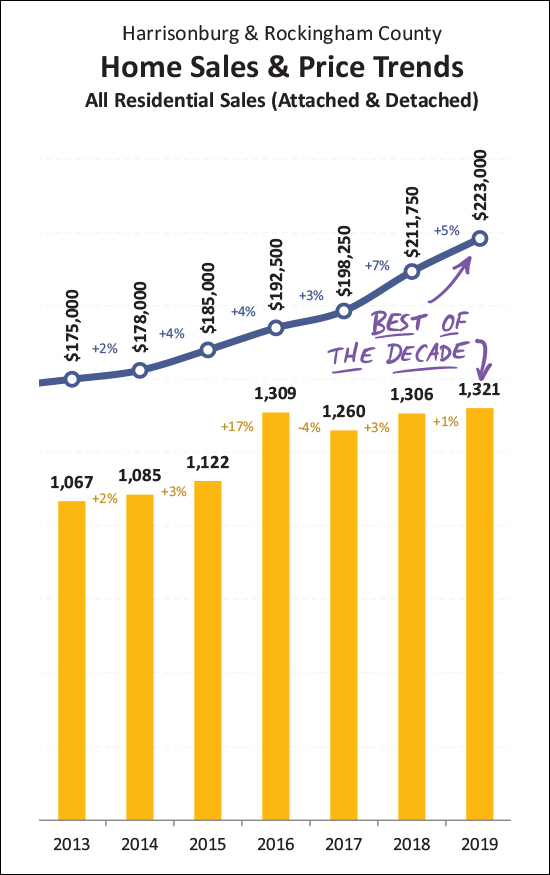 We hit some of the best number of the decade in Harrisonburg and Rockingham County... The 1,321 home sales seen last year was the highest number of home sales seen any time in the past decade! The median sales price of $223,000 seen last year was the highest median sales price seen any time in the past decade! So, there's that! Exciting, indeed -- again, for everyone except those looking to buy right now. Speaking of the future... 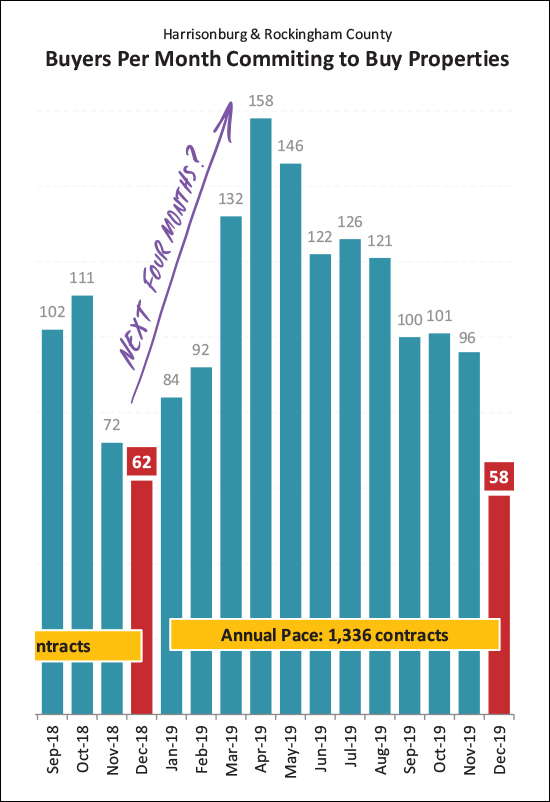 Looking back can often help us understand what we'll see when moving forward. The graph above illustrates when buyers sign contracts to buy homes and the purple arrow is marking the typical January through April trajectory in our local housing market. So -- January and February are likely to be slow for contract activity -- but we should see things starting to pop in March and April. Get ready! And now, possibly the worst news in this market re-cap... 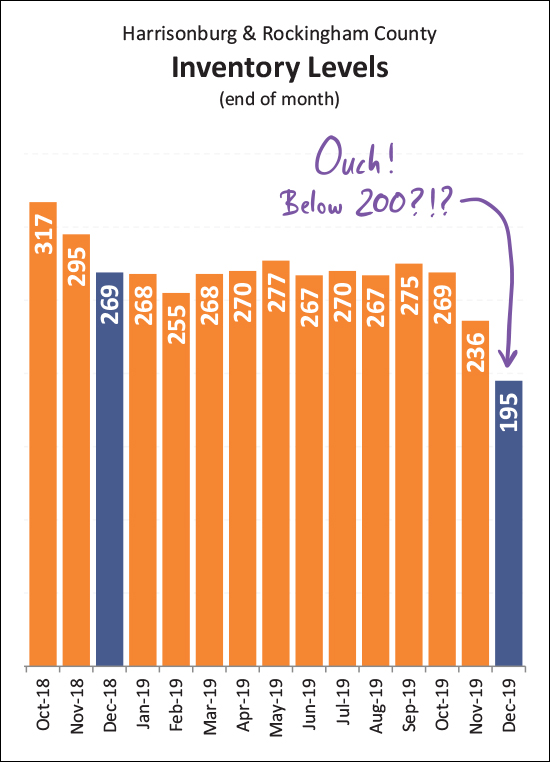 Inventory levels were not contingent to have dropped below 250 homes for sale at the end of November -- they dropped even lower (!?!) by the end of the year to where there are now only 195 homes for sale! We can conclude several things here -- today's buyers won't have many choices -- and when good choices do come on the market they are likely to go under contract quickly! Just to further dissect the depressing decline in inventory... 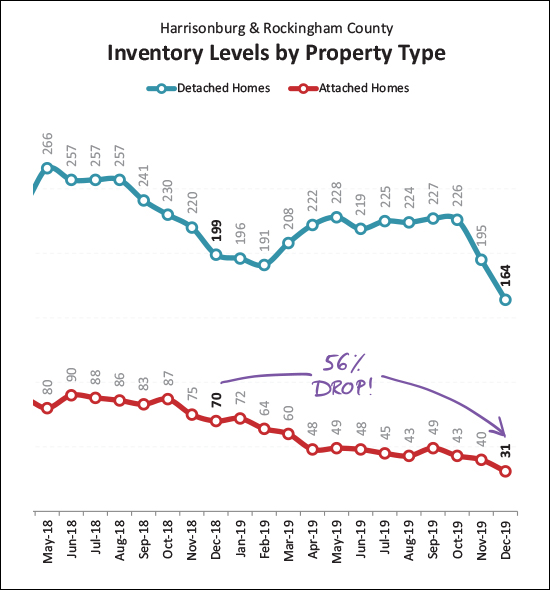 The larger drop in inventory over the past year has been in attached homes (the red line above) where there are now 56% fewer homes on the market as compared to a year ago. This is largely because there haven't been many new townhouses constructed in the past year as compared to many previous years. And when we look at the City compared to the County (brace yourself) we find... 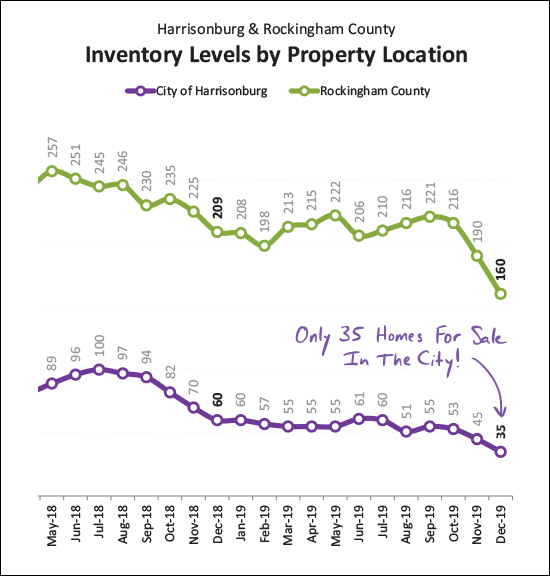 The purple line above is showing you that there are only (it's real folks) 35 homes on the market for sale in the City of Harrisonburg! This is a 42% decline from a year ago. There was also a sizable decline in the number of County properties on the market, but buyers looking to buy in the City right now will find it to be a particularly tight market. OK - that's it for now - I'll be diving into a few more market dynamics in the coming days. Until then... If you're planning to sell your home in 2020 -- let's chat soon about the best timing for doing so, what you should do to prepare your home for the market, and of course, we can chat about pricing. If you're planning to buy a home in 2020 -- sign up to get alerts of new listings, talk to a lender to get pre-approved, and let's get ready to make a mad dash to see new listings as they come on the market to give you a shot at buying a home in a very tight real estate market. Happy 2020, friends! I am looking forward to a great year and hope to work with many of you to help you accomplish your real estate goals. As always -- shoot me an email if you have follow up questions or if you want to chat about your plans to buy or sell. | |
Home Sales Rise Around One Percent In 2019 |
|
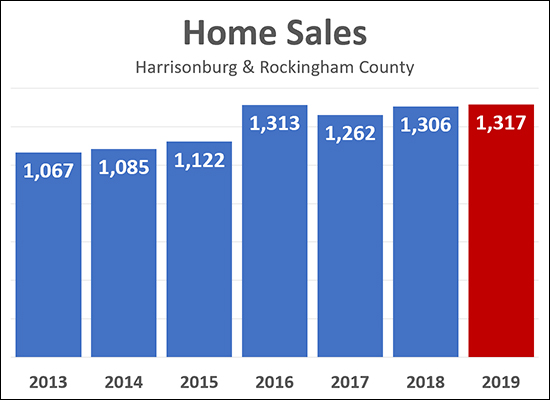 All home sales have not yet been reported but it is seems that we will see around a 1% increase in the pace of home sales in Harrisonburg and Rockingham County between 2018 and 2019. There have been 1,317 home sales recorded in the MLS thus far for last year and we may see that figure rise a bit more over the next few days, but not by much. This is a slight increase compared to last year -- and marks the highest year in recent memory...
Stay tuned for my full market report in the next week or so, as well as predictions for the 2020 housing market. Oh, and HAPPY NEW YEAR! | |
Home Sales Solid, Contracts Strong, in November 2019 |
|
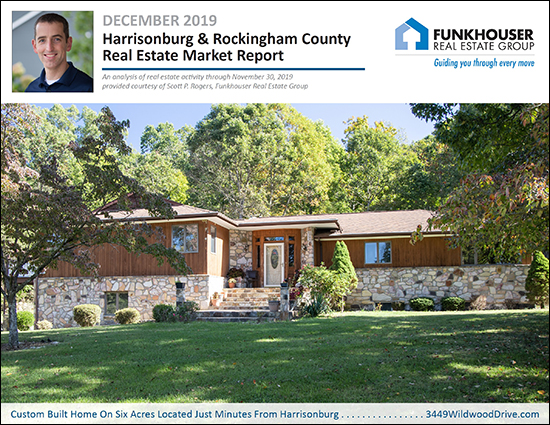 Happy December, friends! The end of the year is approaching, so let's take one last partial-year look at our local housing market before we have a full twelve months of data to analyze. You can download my full market report here or read on for the high points... But first -- check out this custom built home on six acres, pictured above, by visiting 3449WildwoodDrive.com. Now, to the data... 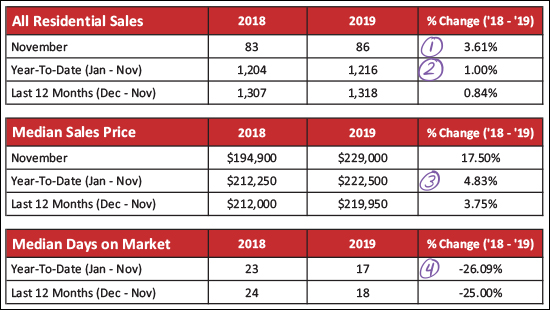 As shown above...
Now, breaking things down between detached and attached homes... 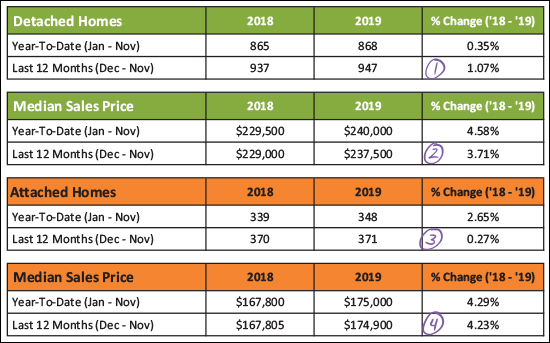 As shown above...
It can also be helpful to break things down between the City and County... 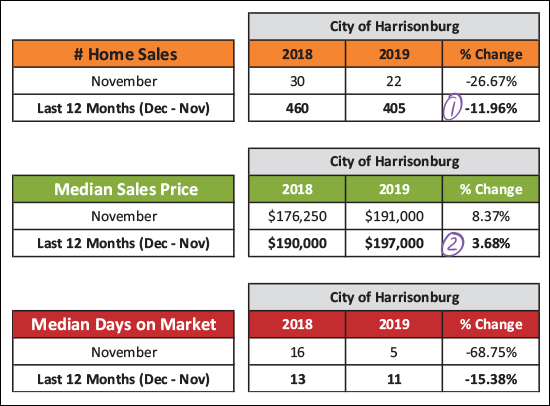 As shown above...
But in the County... 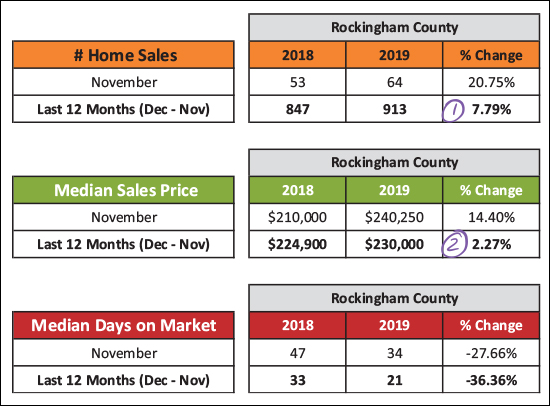 As shown above...
And now, for the roller coaster of month-by-month home sales activity... 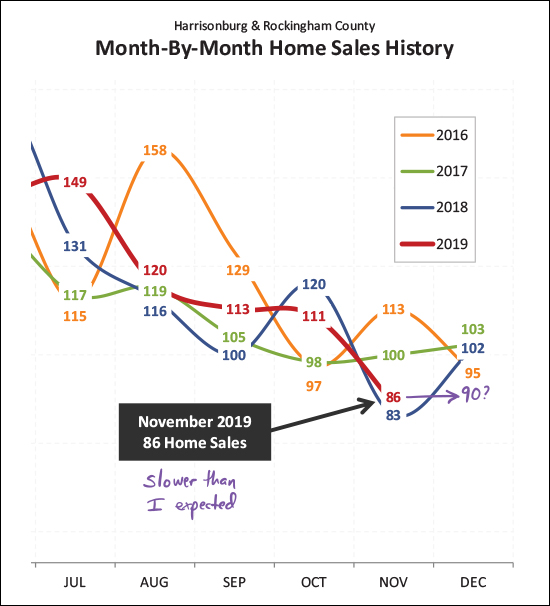 I thought we'd see more home sales in November than we did end up seeing. The 86 sales this November was more than we saw last November -- but a good bit below the prior two months of November. Looking forward, I'd expect we'll see around 90 home sales in December. 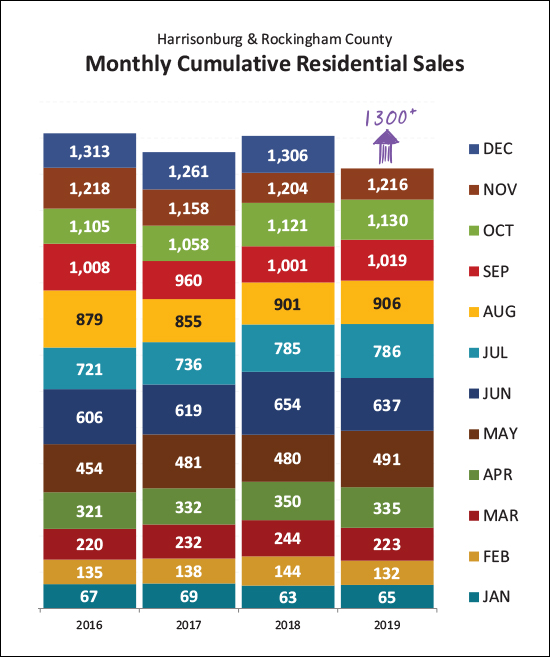 When we stack up each of the past three years -- plus this year -- you'll note that we're almost certainly on track to see 1,300 home sales in 2019 -- and we may very well beat the recent high of 1,313 sales seen back in 2016. 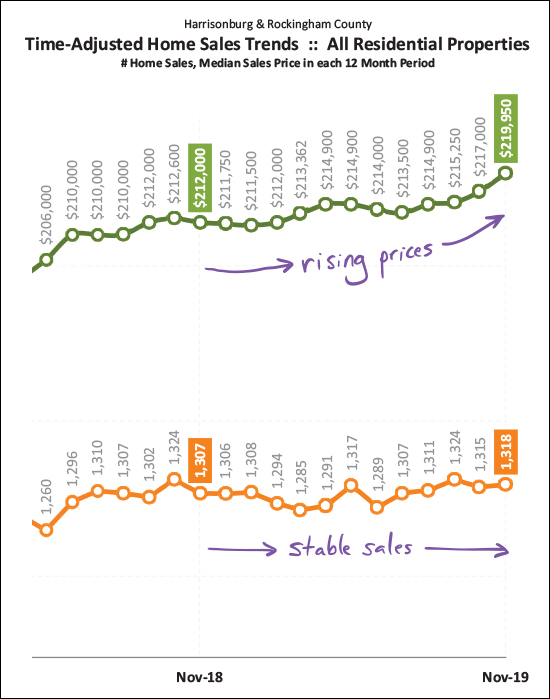 When looking (above) at the annual pace of sales (the orange line) you'll note that it has bounced around some over the past year -- but has stayed right around 1300 sales per year. During that same timeframe, however, the median sales price has been slowly (and then more quickly) rising -- up from $212K a year ago up to $219,950 when looking at the most recent 12 months of sales data. 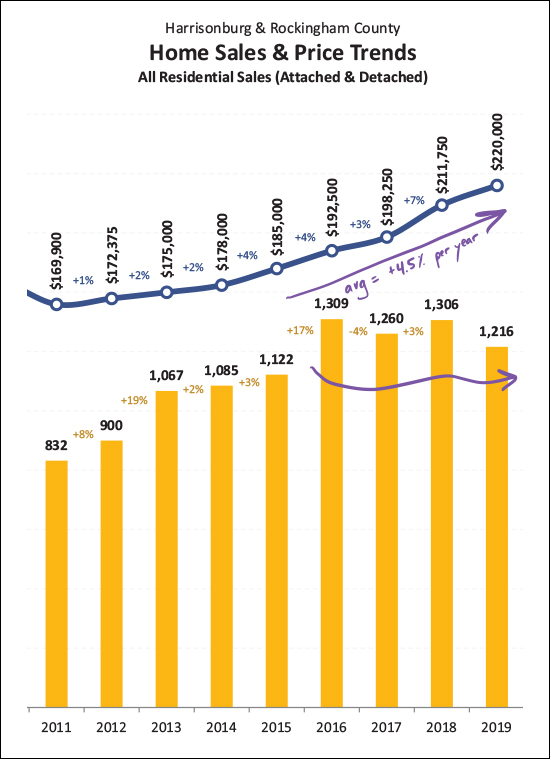 Examining a slightly longer (four year) trend we'll see that home sales have stayed right around (just above, just below) 1300 home sales per year -- while the median price of those homes has climbed, on average, 4.5% per year. This increase in prices is certainly higher than the 2% - 3% long term historic "norm" but is much more sustainable than the double digit annual increases we saw during the past real estate boom. 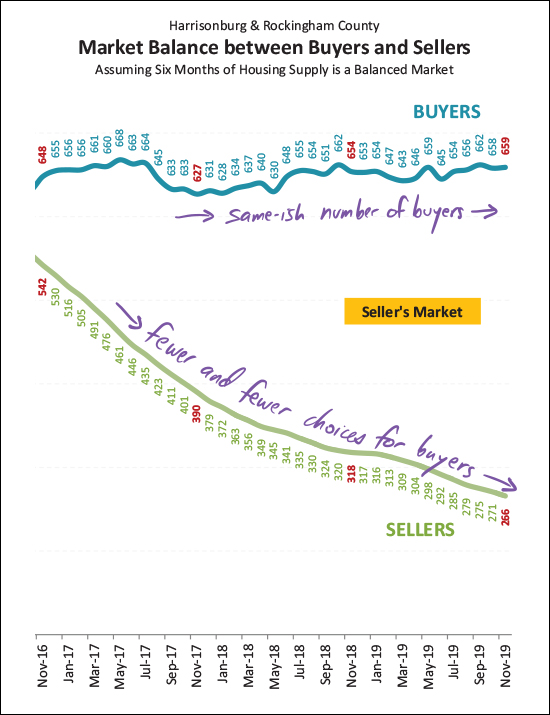 Here's (above) a curious one -- and an unfortunate one for buyers -- over the past few years the same number (more or less) of buyers have been buying -- but they have had fewer and fewer and fewer homes from which to choose at any given time. It has caused homes to sell more quickly and buyers to become more frustrated. 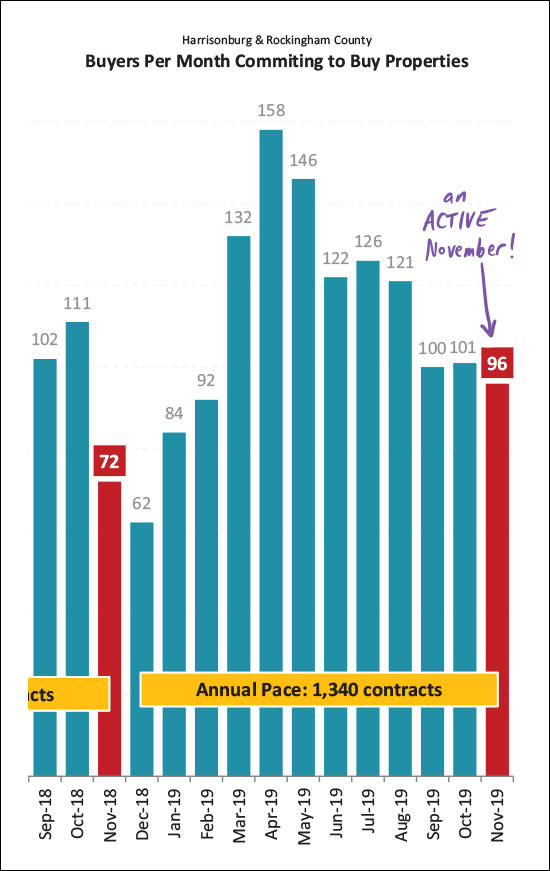 While closed sales were slower than I expected in November -- buyer activity in contracting on homes was much more active than I expected! We typically see a drop off between September/October and November when it comes to signed contracts -- but this year, we saw just about as many buyers commit to buy homes in November as we had seen in September and October. The 96 contracts signed in November gives me hope that we'll see 84 sales in December, which would get us up to 1,300 home sales for the year. 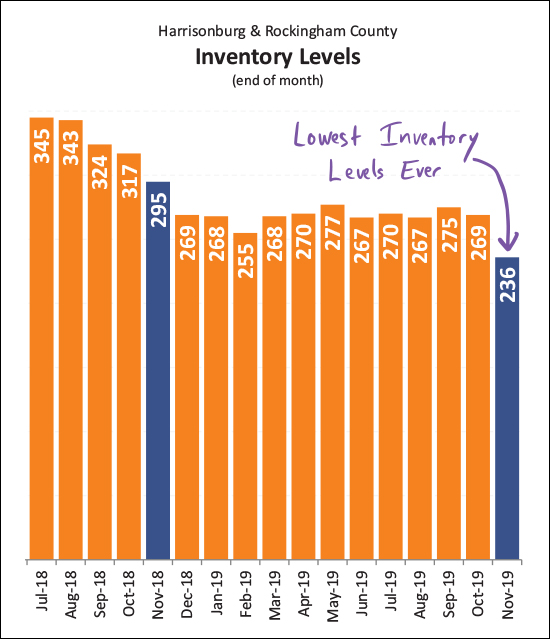 Did someone say inventory levels were low? Yes, inventory levels are low! You'll see that the number of homes on the market (for sale, not under contract) has now dipped down to 236 homes as of the end of November / beginning of December. Again -- a great time to be a seller, but not as exciting of a time to be a buyer. Maybe we need some new construction?? 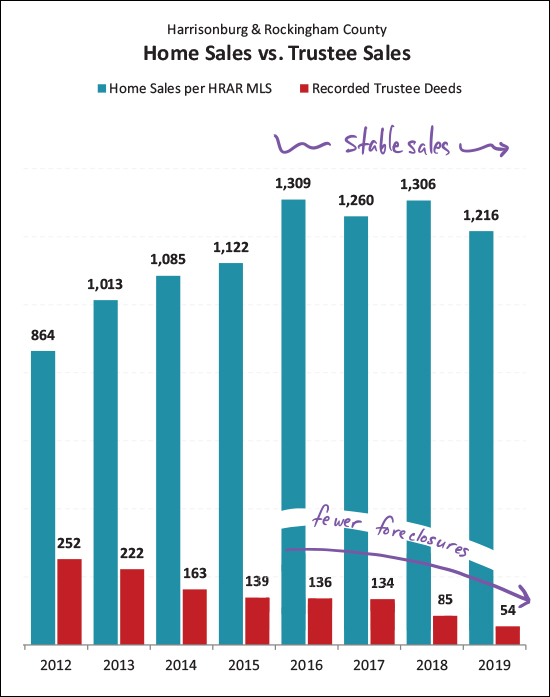 Over the past eight years we have seen more and more home sales -- and fewer and fewer foreclosures. Just two years ago 134 properties were foreclosed upon in Harrisonburg and Rockingham County -- and in the first 11 months of this year that number has only been 54 properties! 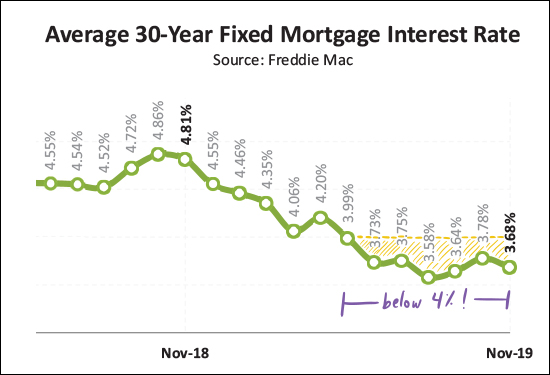 If, as a buyer, you somehow manage to find a home to buy -- you'll be excited to find extremely low mortgage interest rates. They have been below 4% for the past seven months now, giving you the opportunity to lock in a low housing cost with a fixed rate mortgage. OK, I'll wrap it up there for now. Again, you can download a PDF of my full market report here, or feel free to shoot me an email if you have follow up questions. In closing... If you're planning to sell over the next few months -- let's get going now/soon while inventory (your competition) is SUPER low. We can connect at your house or my office to discuss timing, preparations for your house, pricing within the current market and more. Call (540-578-0102) or email me and we can set up a time to meet to chat. If you're planning to (or hoping to) buy a home soon, be ready to be patient and then to ACT QUICKLY! :-) Make it a bit easier for yourself by knowing the market, knowing the process, knowing your buying power, and closely monitoring new listings! That's all for now. Enjoy the remainder of the year, and I'll be back in January with a full re-cap of our local housing market for all of 2019. | |
Home Sales Steady, Prices Slowly Rising in Harrisonburg, Rockingham County |
|
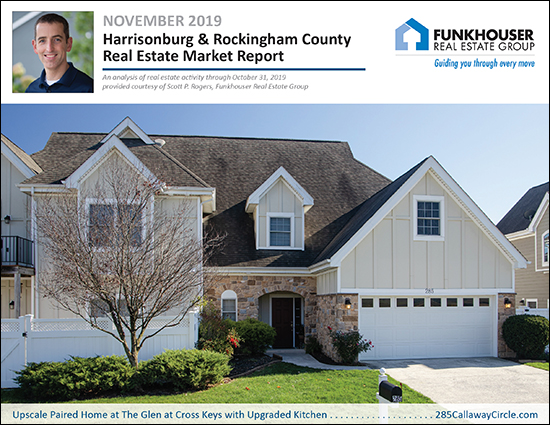 Despite rapidly declining temperatures (15 degrees last night!?) the local housing market is still rather hot! Read on for an overview of the latest market trends in Harrisonburg and Rockingham County, or download a PDF of the full report here. But first, check out this new listing at The Glen at Cross Keys, pictured above, by visiting 285CallawayCircle.com. OK, now, diving into some data... 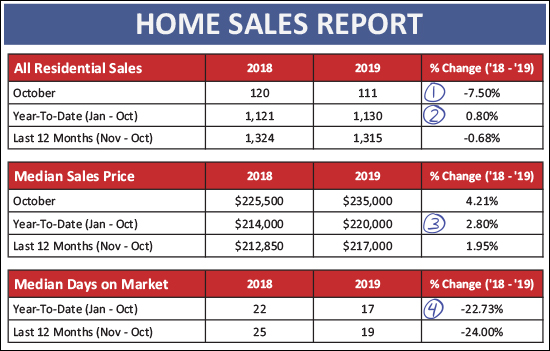 Several things to note above, as we can now look at 10 out of 12 months of 2019...
Now, looking at the detached sales trends vs. attached trends, we see similar but slightly different trends... 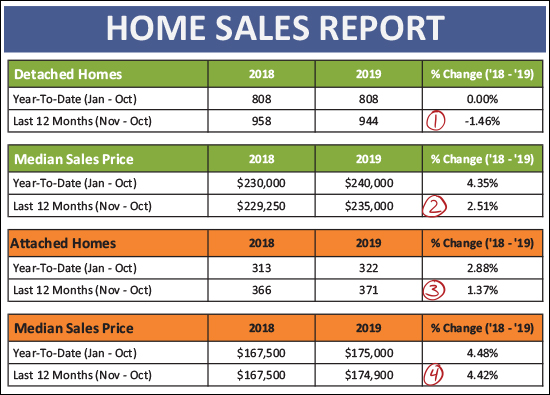 Above, you might note that...
Next, let's pause for a moment to evaluate sales in the City vs. the County... 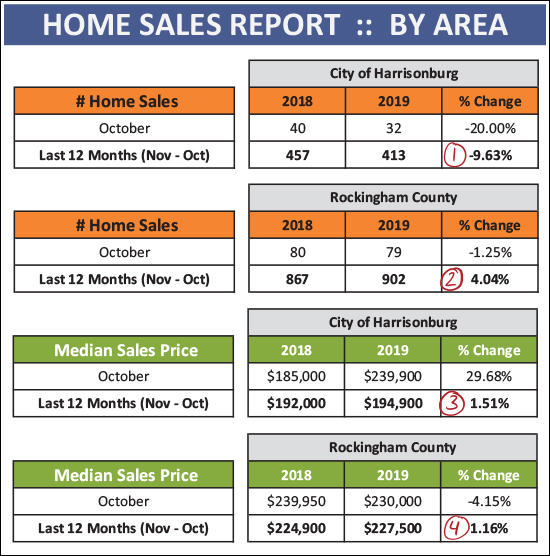 As you'll see above...
Now, for the roller coaster of the month-by-month activity... 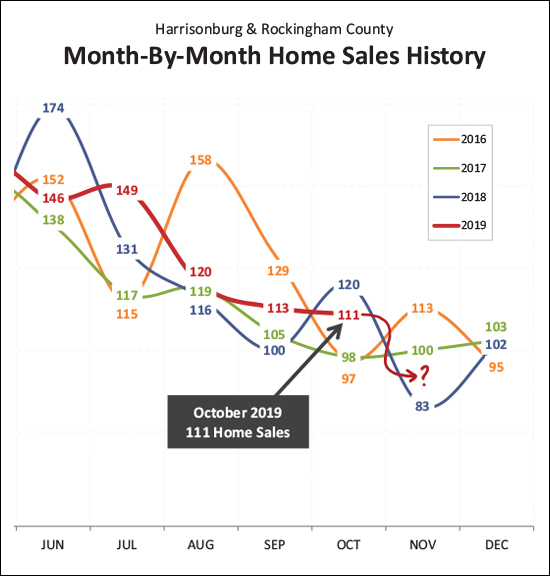 As shown above, October home sales in 2019 were certainly stronger than we saw in 2016 and 2017 -- but not as strong as last year. That said, home sales then slowed down quite a bit (!!) last November, so perhaps we'll see a stronger performance this November? I'm guessing we'll see 90 to 100 home sales in November 2019. 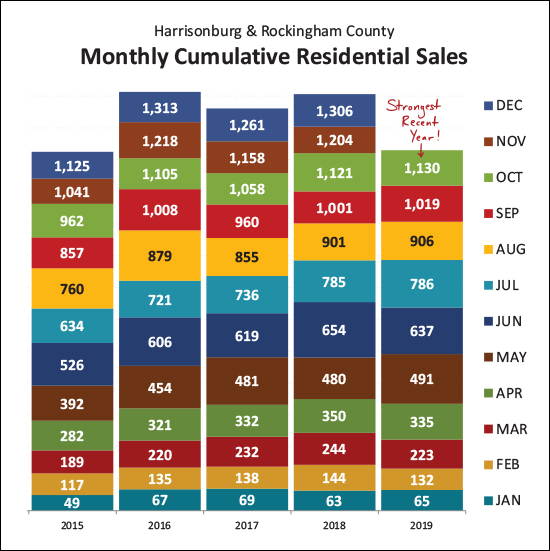 How do these monthly home sales stack up towards annual sales? The graph above breaks it down -- and we're moving at the fastest pace this year (1,130 sales in 10 months) that we've seen anytime in recent years. We seem to be on track to eclipse 1300 home sales again in 2019 - just as we did (barely) last year. 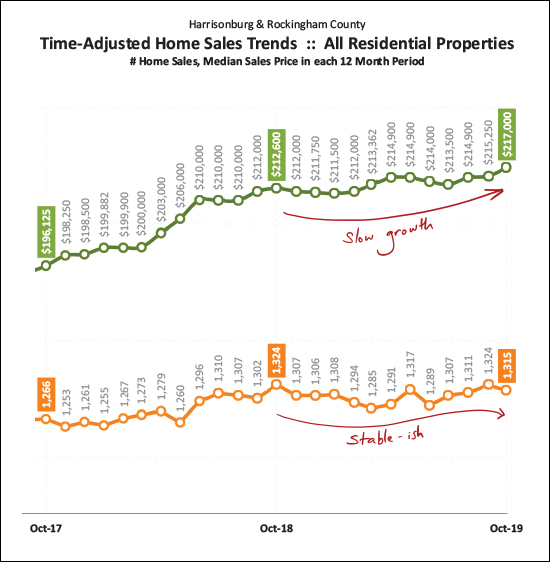 We can often get the best sense of long term trends by looking at a rolling 12 months of data, as shown above. Here we see that growth in the median sales price has been relatively slow over the past year (compared to a faster increase last year) and the pace of homes selling has remained relatively stable over the past year. 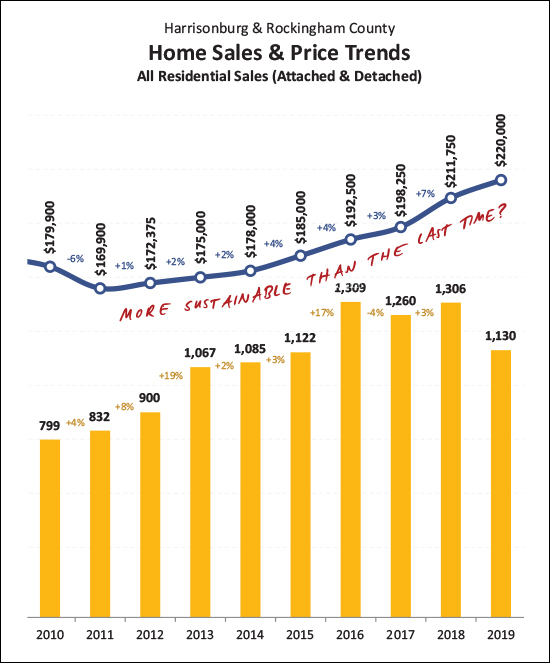 Looking back a few more years, it is clear that median sales prices (and home values) have been increasing steadily for quite a few years now -- ever since 2011 per this data set. But, the increases per year are smaller (1%, 2%, 2%, 4%, 4%, 3%, 7%, 4%) than during the last real estate boom when we had three years of double digit (17%, 14%, 14%) increases in the median sales price. So, perhaps this increase in home prices is more sustainable than the last time we saw steady increases over time. 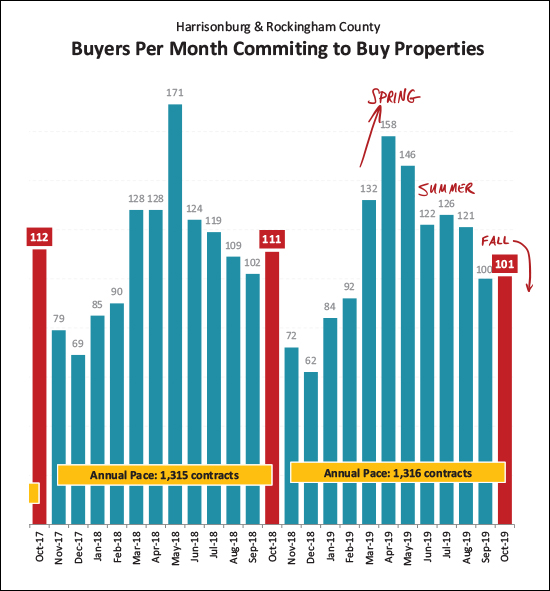 Back to temperature and seasonality - even though the annual pace of buyer activity is up, right now contract activity is starting to decline. The strongest months of buyer activity are typically in the Spring and Summer. We have started to see the usual slow down this Fall and will likely see continued declines in monthly contract activity as we move through November, December and January. 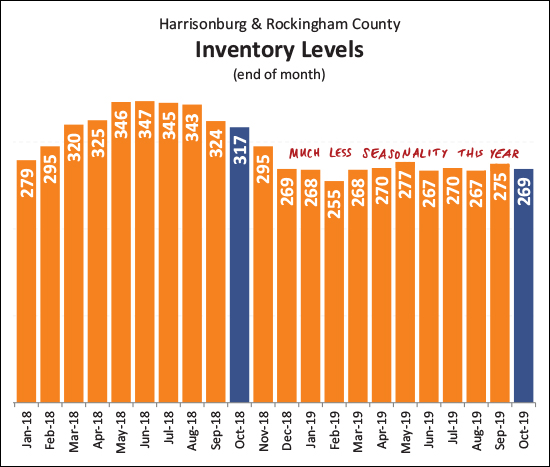 Somewhat curiously, despite the seasonality of buyer activity -- the inventory levels have stayed relatively steady for the past year -- or at least the last 10 months. We did not see the usual increase in inventory levels in the Spring and Summer this year -- perhaps because buyers were poised and ready and snapped up the new listings as soon as they hit the market. Thus, we may not see much of a decline in inventory levels over the next few months either. 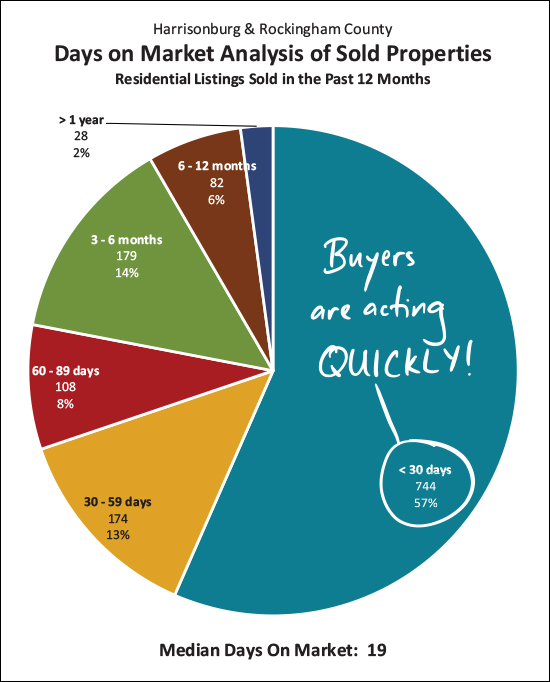 Ah, yes, the buyers DID snap up the listings quickly! In fact, over the past 12 months, 57% of homes that sold were under contract in less than 30 days -- and the median days on market was only 19 days! 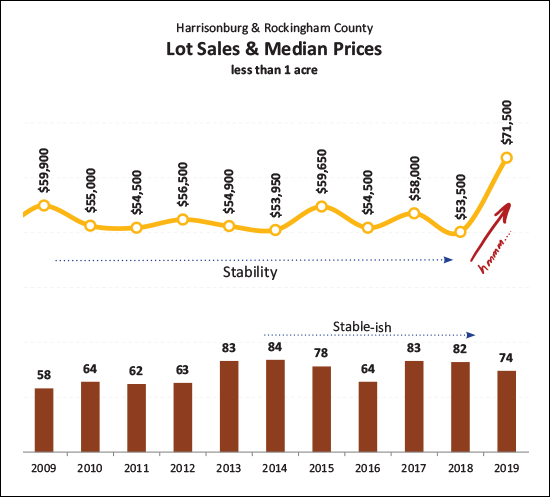 Breaking out of the "house" mold for a moment -- look at lot sales this year It seems we'll likely see a similar number of lots of less than an acre selling this year (around 80) but the median sales price has increased quite a bit over any recent past year!? 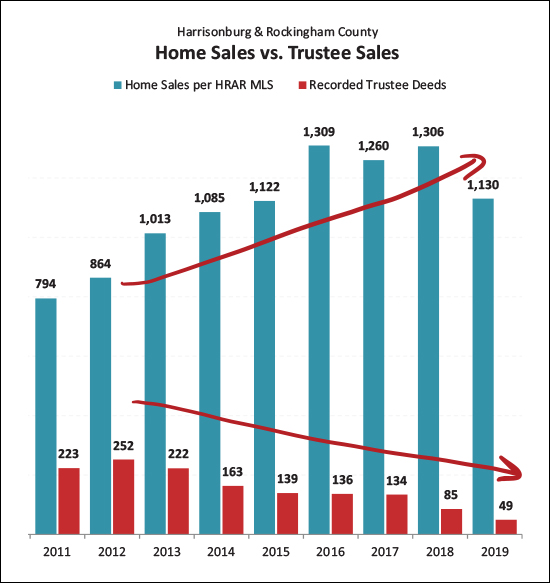 If you're looking for a sign of relative health in the local housing market -- look no further than the declining foreclosure rate in this area. As shown above, we have seen fewer (and fewer) foreclosures over the past eight years as more and more homes have sold. 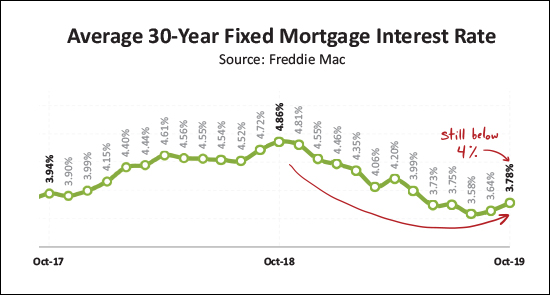 And finally, if you're buying now or soon, you'll likely still be locking in a fixed mortgage interest rate below 4%. The average mortgage rate has risen a bit over the past two months, but we're still seeing absurdly low mortgage interest rates for folks buying principal residences. OK -- that's it for now. Again, you can download a PDF of my full market report here, or feel free to shoot me an email if you have follow up questions. In closing... If you're planning to sell over the Winter -- let's chat sooner than later about timing, preparations for your house, pricing within the current market and more. Call (540-578-0102) or email me and we can set up a time to meet to chat. If you're planning to (or hoping to) buy a home soon, be ready to be patient and then to ACT QUICKLY! :-) Make it a bit easier for yourself by knowing the market, knowing the process, knowing your buying power, and closely monitoring new listings! That's all for now. May we find warmer days ahead! :-) | |
Home Sales, Prices Continue To Rise in Harrisonburg, Rockingham County |
|
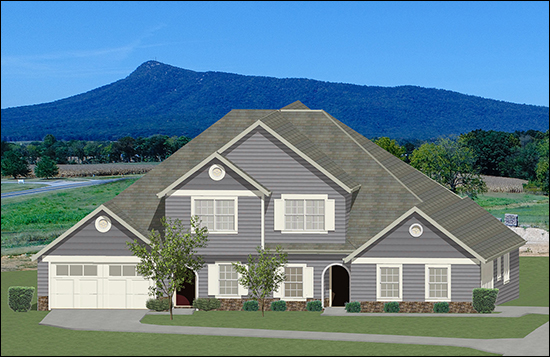
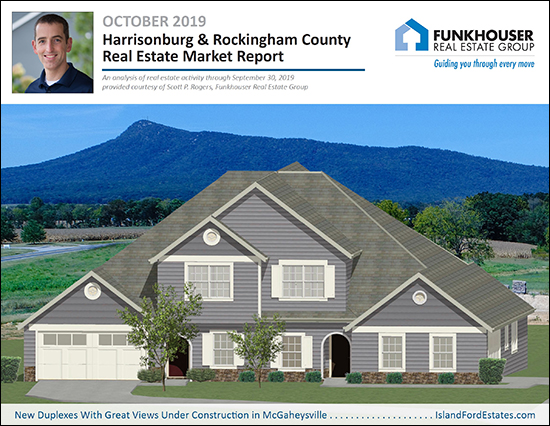 Autumn is here! Leaves are falling. Temperatures are falling. Home sales are not -- and prices are not! So, brew yourself a cup of coffee or tea, and let's take a look at some market trends for our local housing market... But first -- find out more about the new homes (rendering above) being built in McGaheysville by visiting IslandFordEstates.com. Now, onto the data, though you can skip to the full PDF report here. 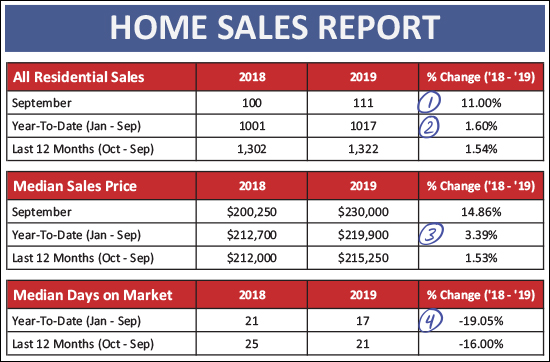 September was another solid month of home sales in Harrisonburg and Rockingham County. As shown above...
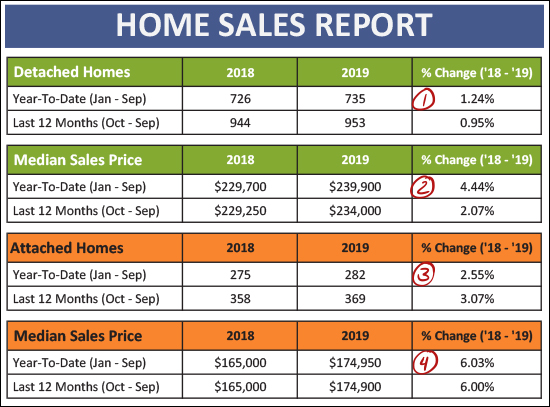 Breaking things down between detached homes (single family homes) and attached homes (duplexes, townhouses, condos) we see some trends that have been consistent throughout the year...
And let's look a bit closer at the month to month trajectory... 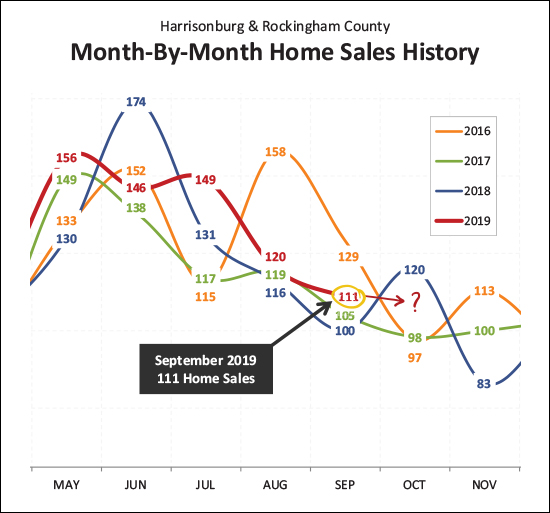 A few things stand out above...
Looking afresh at how this year stacks up to prior years... 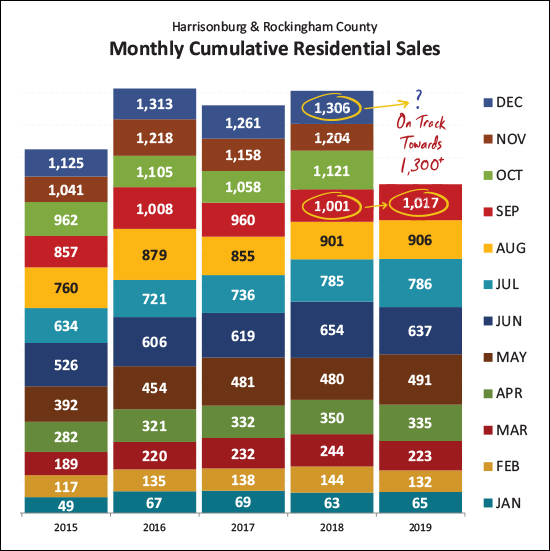 This has been the fastest (though not by a huge amount) start to the year that we've seen in a while. The 1,017 home sales through the first three quarters of the year surpasses sales seen during the same timeframe in each of the prior four years. So, it seems we may see another year of 1,300+ home sales in our area. 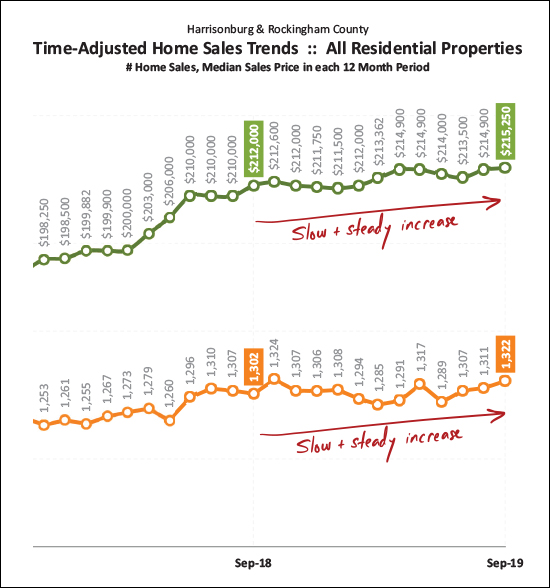 Zooming out -- looking at a rolling twelve months of market data -- we find a slow and steady increase in sales prices over the past year, and a slow and steady increase in the pace of home sales. All indications are that this could / might / should continue on into the remainder of 2019 and potentially 2020. 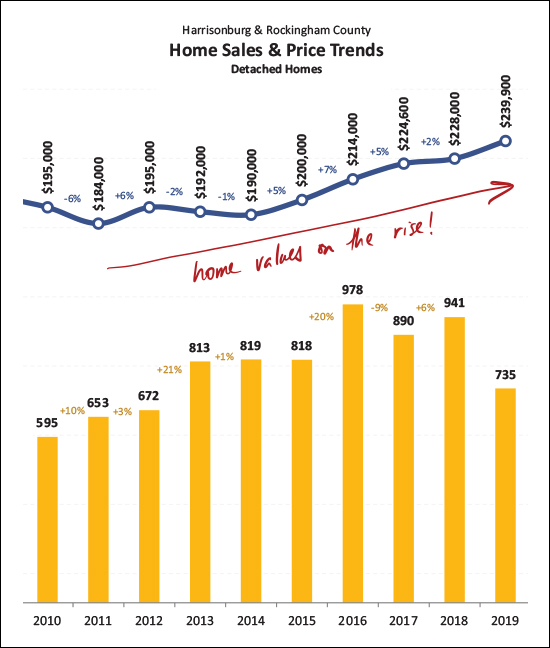 Taking one more look (above) at value trends we see that the median sales price of detached homes was a190K five years ago -- and has risen to $240K today. That's a healthy increase in home values, though with annual increases of 2% to 7%, it doesn't seem that the overall increases are as unsustainable as they were during the 2003-2007 market boom. 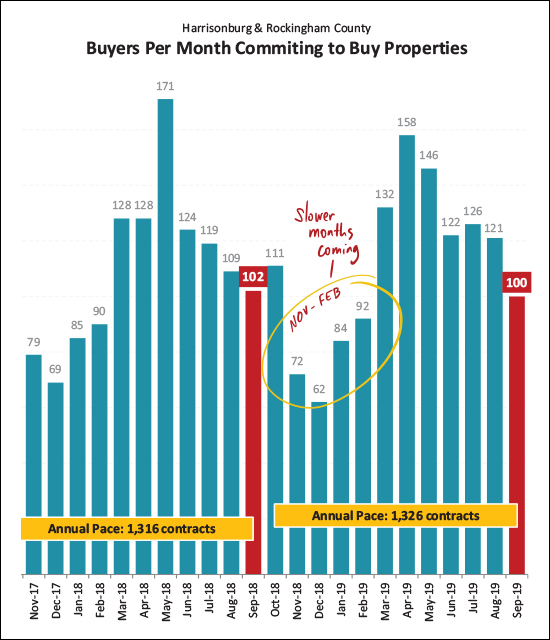 This (October) could be the last strong month of contract activity for a while. Above you'll note that contract signing slowed quite a bit between November and February -- and I expect we'll see something similar this year. The 100 contracts signed in September 2019 was on pace with the 102 seen last September. 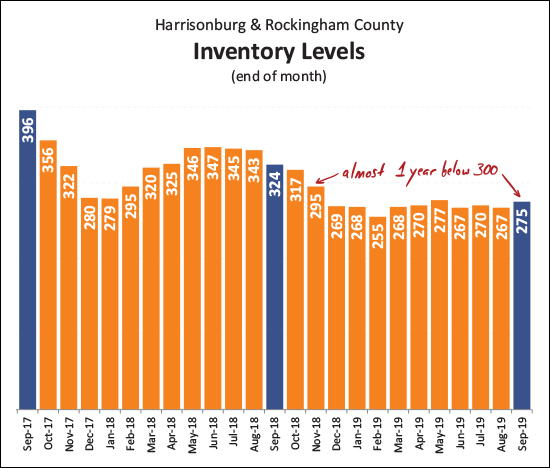 The new norm seems to be fewer than 300 homes on the market at any given time. Over the past 11 months there have always been fewer than 300 homes for sale -- though no fewer than 255. This is a far cry from where inventory levels were a few years ago, but perhaps this is where we'll be staying for a while. Buyers don't have many options at any given time, and yet, we're on track for a record setting year of home sales. 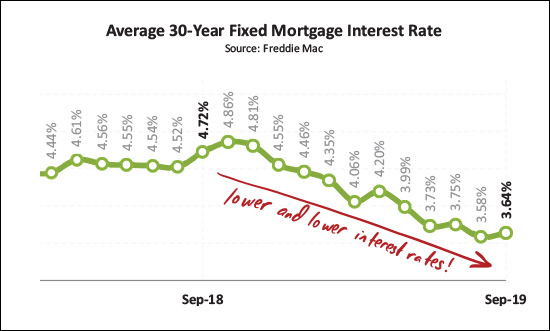 If buyers are sad about declines in inventory levels, they certainly aren't sad about declining interest rates! A year ago, the average 30-year interest rate was 4.72% and now it's down over a full percentage to 3.64%. This certainly makes it an affordable time to lock in a housing payment. A few closing thoughts...
| |
New Duplexes Being Built in McGaheysville, VA |
|
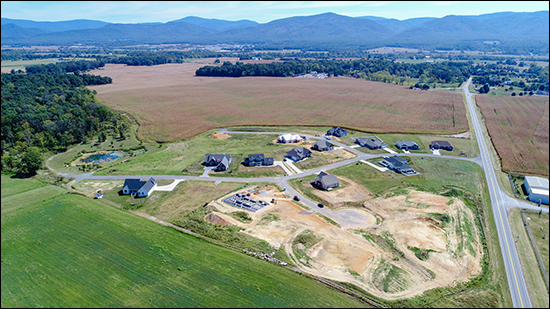
Welcome to Island Ford Estates in McGaheysville, VA! The same builder who brought you The Glen at Cross Keys is now building a very similar floor plan just a few minutes further East in McGaheysville... The site is being prepared for these duplexes -- and wow -- what amazing mountain views! Island Ford Estates duplexes offer an open floor plan on the main level which includes a kitchen, dining area, living room, master bedroom, office or sitting room and laundry room. Enjoy spectacular mountain views and a cul-de-sac location in these thoughtfully designed homes. These homes feature 9 foot ceilings in many areas, light-filled living areas, luxury vinyl plan flooring, upscale cabinetry, granite countertops and many options and upgrades. Visit IslandFordEstates.com to find floor plans, a site plan, standard features, a vicinity map and more! | |
Home Sales Stable, Median Prices Slowly Rising in Harrisonburg, Rockingham County |
|
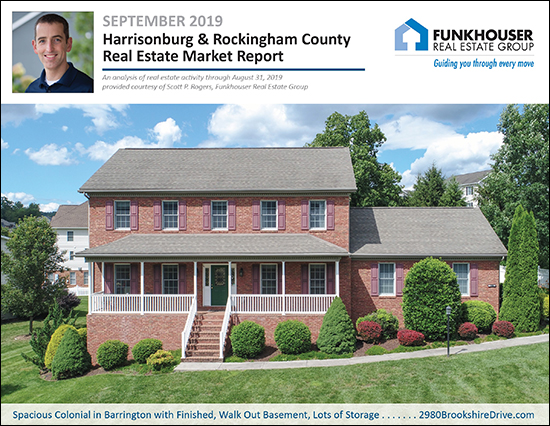 Summer might not officially end for another six days, but today has certainly has been a nice taste of the cool Autumn days to come. That said, even if the temperatures are starting to cool down, home sales are not yet ready to do so in our local market. Before we take a look at the most recent market trends, take a few minutes to check out this spacious Colonial in Barrington that is pictured above by visiting 2980BrookshireDrive.com. Now, then, let's get down to some overall market stats... 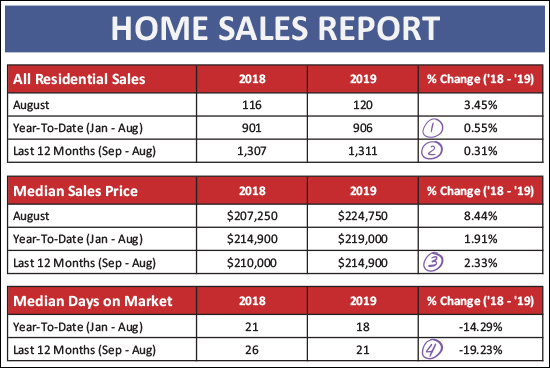 First above, lots (and not much at all) to observe here...
And how about if we break it down between detached homes (almost all purchased by owner occupants) and attached homes (mostly purchased by owner occupants, but also purchased by investors)... 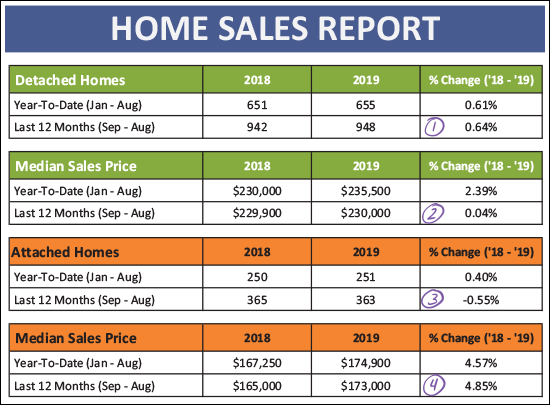 Here's what we're finding...
And now for that pretty visualization of the month to month ebb and flow of home sales... 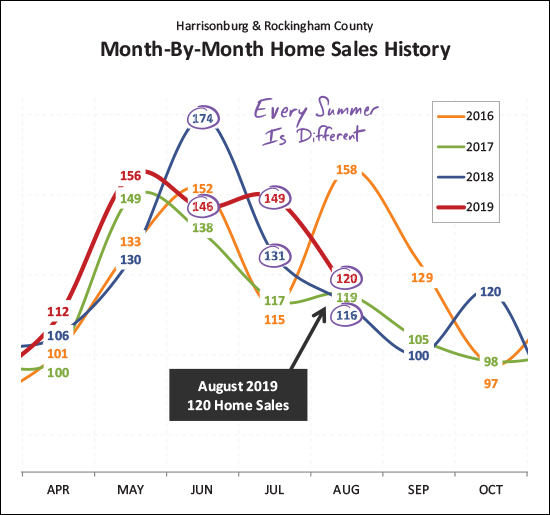 Here (above) we note that every summer is different. Last year (blue line) June was a spectacular month for home sales - with 174 closings - more than seen anytime (ever!) in our local area. This year (the red line) June home sales were mediocre at best. But then, July and August home sales were stronger this summer as compared to last year. Looking ahead to September, I anticipate that we're likely to see around 110 home sales - slightly more than the past two years, but not quite as many as back in 2016. 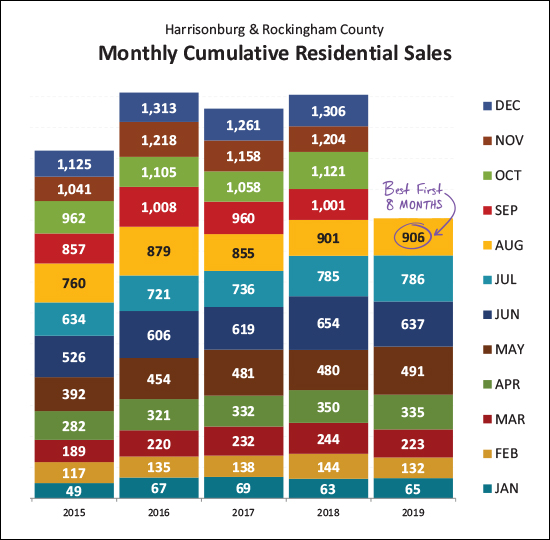 When we pile all of the months on top of each other we can get a clearer view of how the first eight months of this year (Jan-Aug) compares to the first eight months of the past four years. And this is where we find that we have had the best first eight months of anytime in at least the past five years. Given the current trajectory, it seems likely that we'll see at least 1,300 home sales this year. 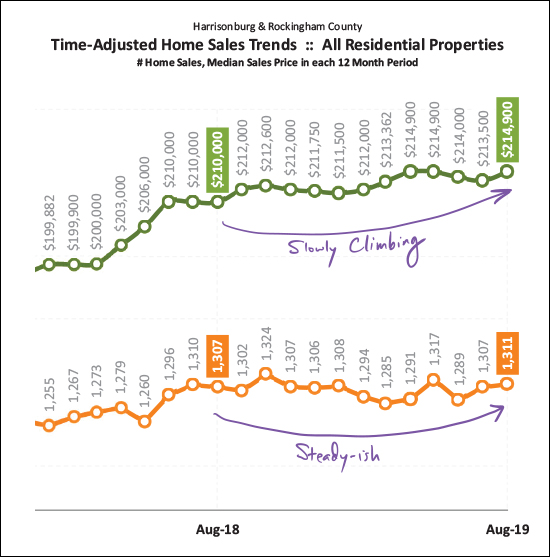 This graph shows us the overall long term trends in local home sales. The green line is the median sales price which has been creeping its way up over the past year. The orange line shows the annual rate of home sales, which has been hovering around 1,300 home sales for the past year. 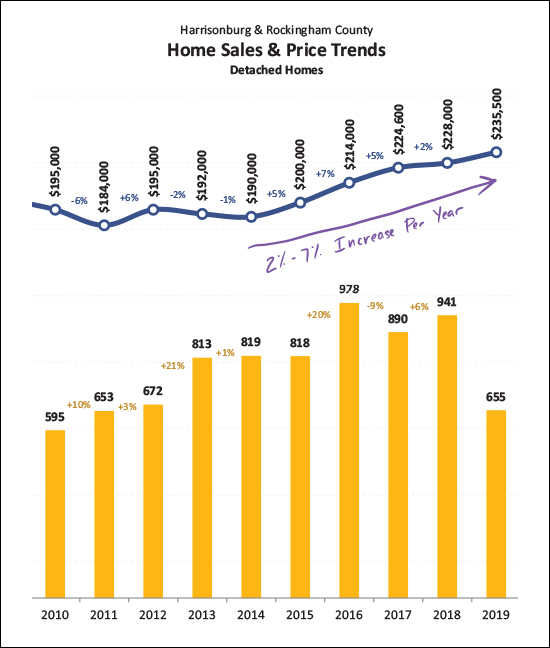 Focusing in just on the detached homes, we see that the median sales price has been increasing anywhere from 2% to 7% per year for each of the past four years. This year we are likely to see another increase in the median sales price somewhere in that range. 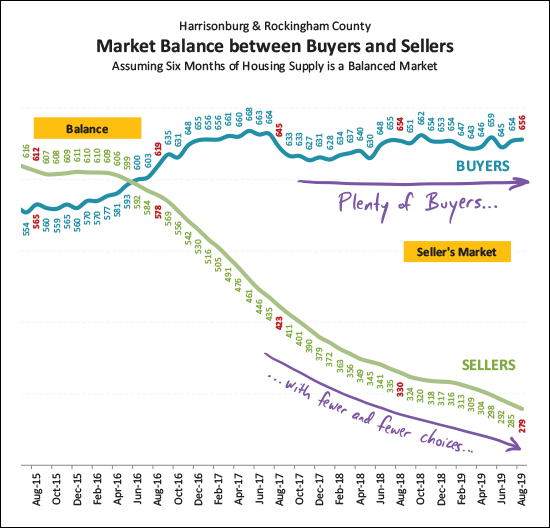 With steady home sales and increasing sales prices, it's a great time to be a seller. But not as great of a time to be a buyer. As shown above, there have been a relatively stable number of home buyers over the past few years, but the number of homes for sale at any given point has been steadily declining for over three years. 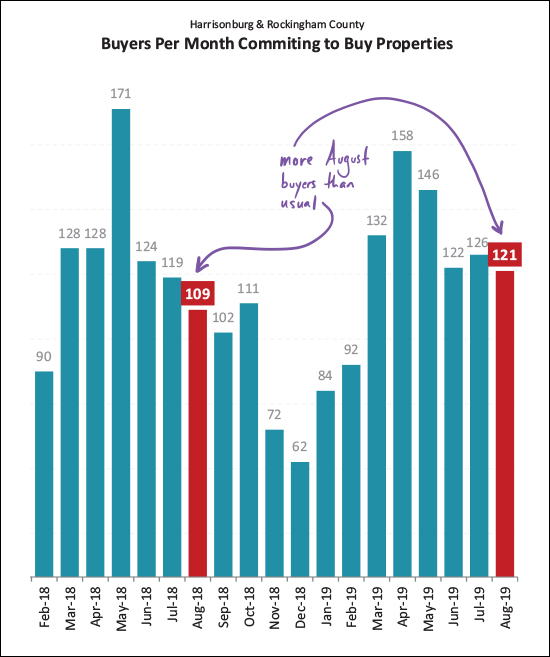 Why do I think we'll see 110 home sales in September? Well, partially because 120 home buyers signed contracts in August. This was a higher rate of contract activity than last August and suggests that sales will continue to be relatively strong as we continue into the Fall. 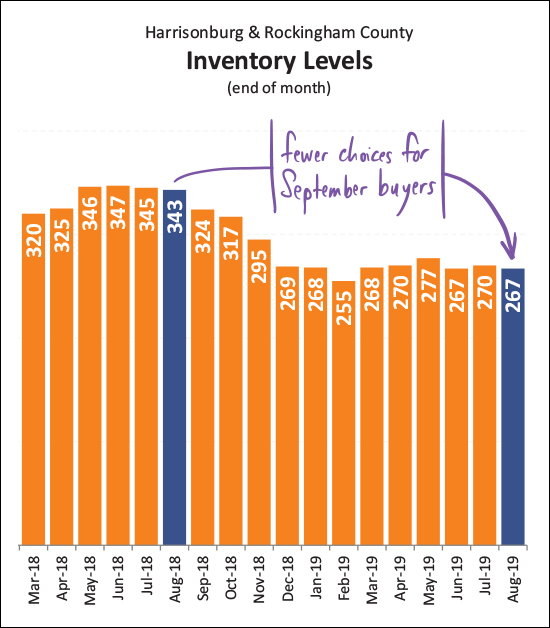 And here (above) are those overall inventory numbers. The number of homes for sale has been declining over the past year. We used to see much more of an increase in available inventory during the Spring months but this past year buyers were contracting on new listings almost as fast as they were being listed, which kept the inventory levels low. 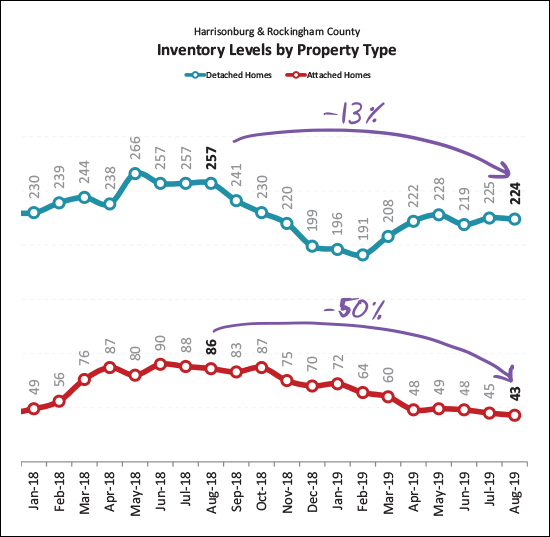 Here's a startling statistic. Inventory levels have declined 13% over the past year when we look just at detached homes -- but when we look just at attached homes (duplexes, townhouses, condos) we find a shocking 50% decline in the number of homes for sale! It is a tough time to be a first time buyer these days! 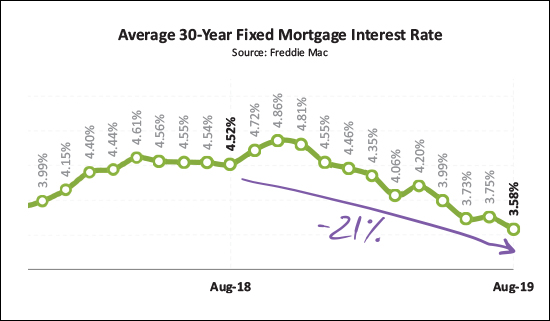 Finally, mortgage interest rates. If there is any consolation for today's home buyer it is that their mortgage interest rate is likely to be lower than anytime in the past year or longer. Interest rates have fallen 21% over the past year -- from 4.52% to 3.58%. A few final notes and thoughts for those that made it this far...
That's all for today. Have a delightful, pleasant, cool evening! | |
High Temps, But Low Mortgage Rates Throughout Summer 2019 |
|
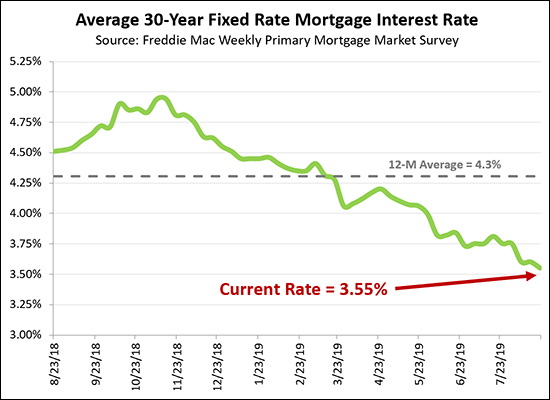 Mortgage interest rates kept dropping lower - and lower - and lower all summer long! The current average rate for a 30 year fixed rate mortgage is only 3.55%, well below the 12 month average of 4.3%. If we look back even further, we're approaching the lows of mid-2016... 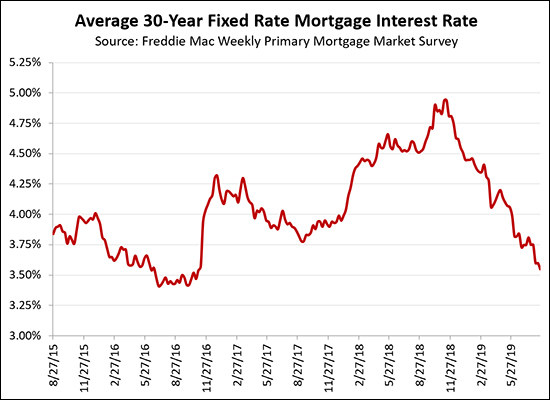 All of this adds up to VERY favorable times to be buying a house - in that you can lock in your monthly housing costs at some of the lowest long term interest rates ever seen. | |
Home Sales Slow, Prices Inch Higher In First Half of 2019 |
|
 It's hard to believe, but half the year has already flown past! Let's take a few minutes to review some recent trends in the local housing market -- but first...
Now, starting with some data packed charts before we get to the colorful graphs... 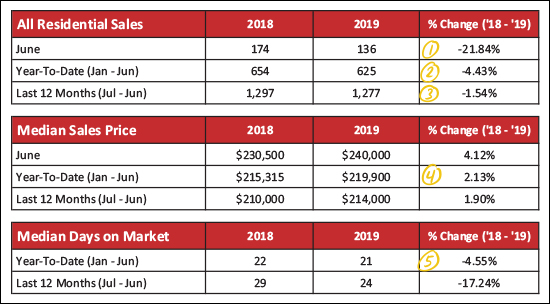 Looking at the market overview above, here's what's popping out to me...
Now, let's see how detached home sales compare to the sale of attached homes. Attached homes are townhouses, duplexes and condos... 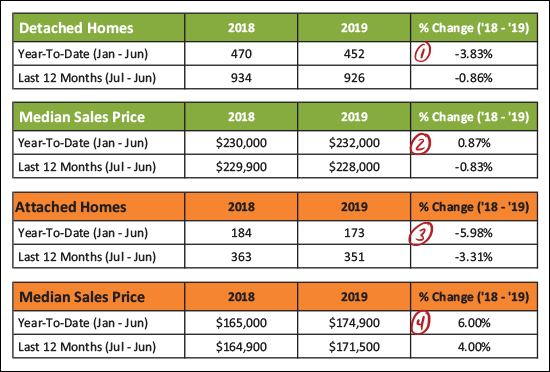 The green chart above is detached home sales, and the orange chart is attached home sales, and here's how things break down...
And now, the pretty graphs... 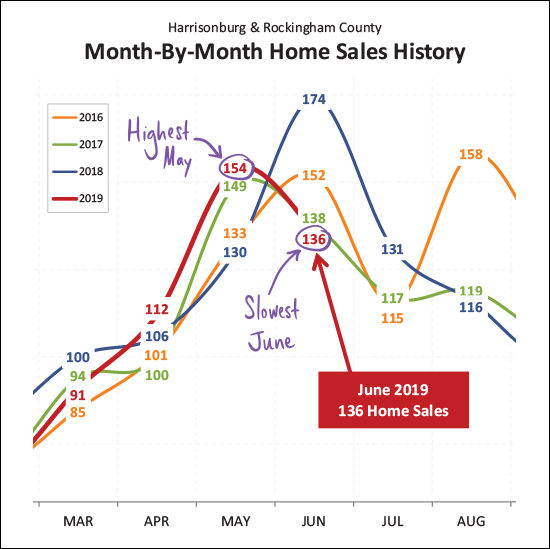 What a roller coaster! As shown above we just experienced the HIGHEST month of May home sales in the past few years, and then the LOWEST month of June home sales in the past few years. So, right, hard to conclude much there -- other than that May and June are some of the busiest months for home sales. Looking ahead, hopefully we'll see a nice mid-range July -- how about 120 or 125 sales? 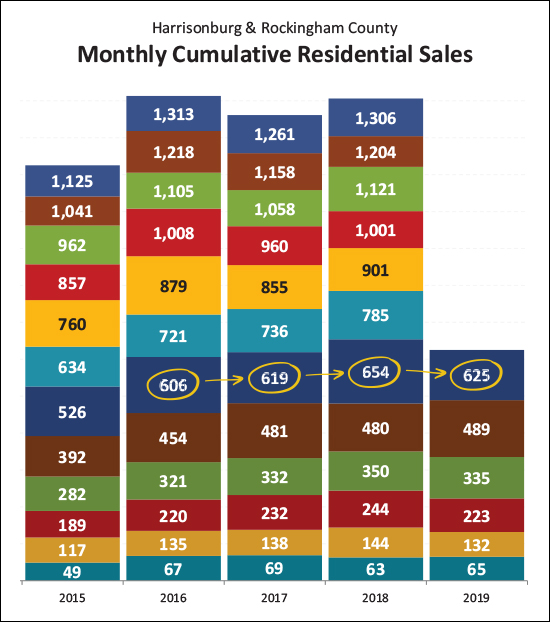 I use the graph above to see how we're doing in the current year as compared to the prior four years. As you can see, the 625 home sales in the first half of this year is about on par (above two, below one) with the past three years when we have ended up with 1250+ home sales. So, if I had to guess, we'll probably see between 1250 and 1300 home sales in total this year. 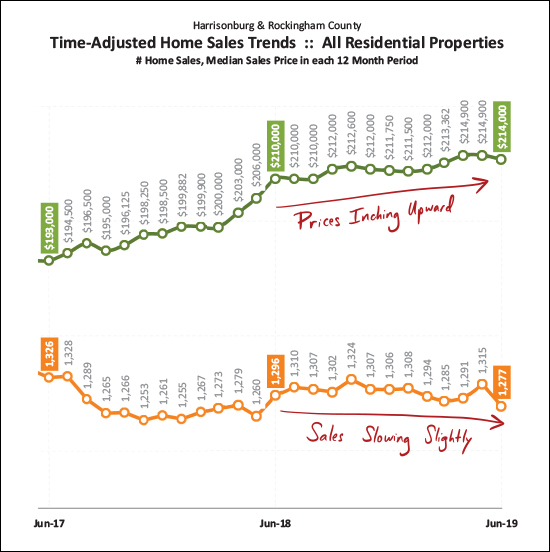 The graph above is the best indicator of overall long term trends. Each data point reflects 12 months of sales data. As you can see, the pace of home sales (orange line) has been declining slightly over the past year -- while the median price of those home sales has been inching upwards to its current level of $214,000. 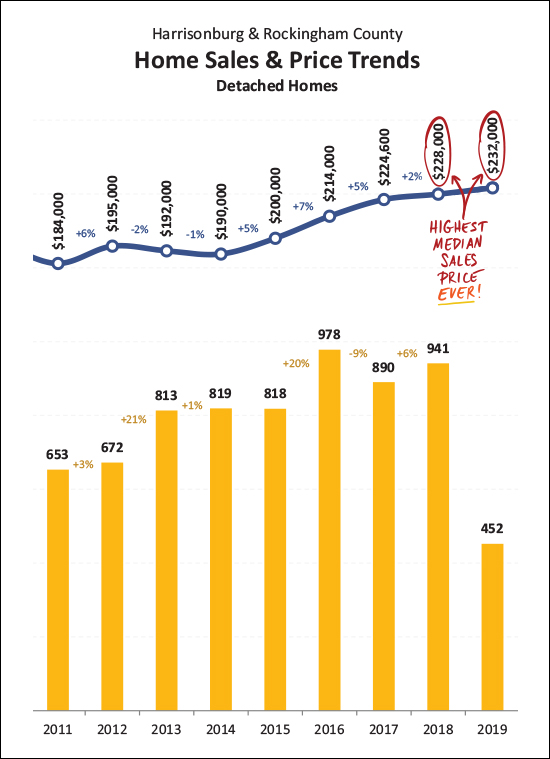 I'm throwing this one (above) in for fun - because I haven't highlighted this fact lately. The median sales price of detached homes is $232,000 thus far in 2019, and was $228,000 in 2018. Both of these median sales prices are/were the highest median sales price we have seen for Harrisonburg and Rockingham County -- ever! We've come by these prices slowly and steadily over the past five years. 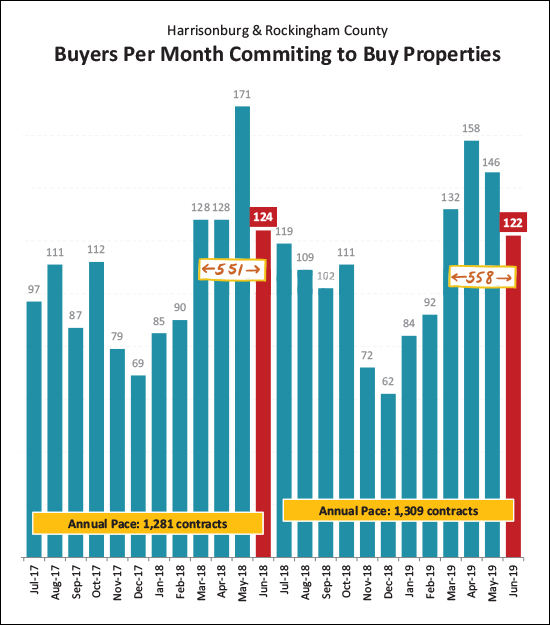 Those new contracts, they keep getting signed! A total of 122 properties went under contract in June 2019 as compared to 124 last June -- and when we look at the March-June timeframe, we find 558 contracts this year and 551 last year. As such, this year's Spring/Summer buyers (and, incidentally, sellers) are certainly keeping pace with last year at this point. 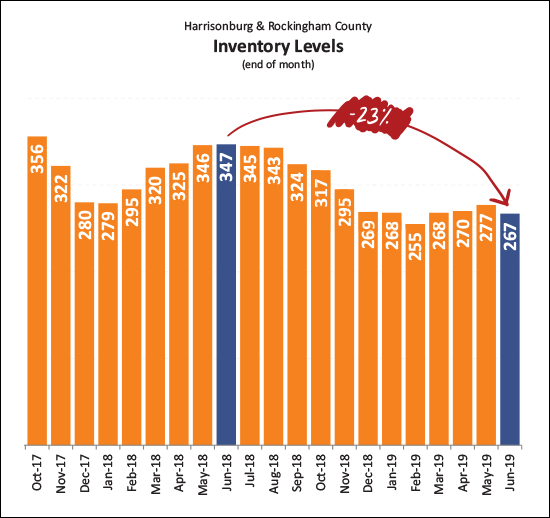 And what are those buyers buying? Well, it seems that they have fewer, and fewer, and fewer choices at any given point in time. As shown above, current inventory levels (267 homes for sale) are 23% lower than they were a year ago -- and just about as low as we saw inventory levels drop over this past Winter!?! Well priced, well prepared, well marketed new listings are going under contract quickly partially because of how few options buyers have these days. 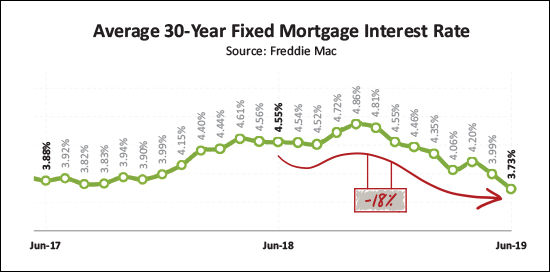 Those buyers who are fortunate enough to secure a contract on one of the few available listings are super fortunate to find astoundingly low mortgage interest rates! Over the past year, the average 30-year fixed mortgage interest rate has fallen 18%, down to its current level of 3.73%. I didn't think we'd see rates below 4% after they soared up to 4.5% a year or so ago - but today's buyers are certainly enjoying locking in some low housing payments given these low rates! Let's pause there, folks. Hopefully that gives you a good general sense of what is happening in our local housing market. And as always, if you have follow up questions about YOUR portion of the local housing market - based on price range, neighborhood, property type, etc. - just let me know! SELLERS -- even though it is a seller's market in just about every price ranges right now, you must still focus on price, condition and marketing. For further reading on buying or selling in this area, check out.... | |
Local Home Sales Stable, Prices Rising in First Five Months of 2019 |
|
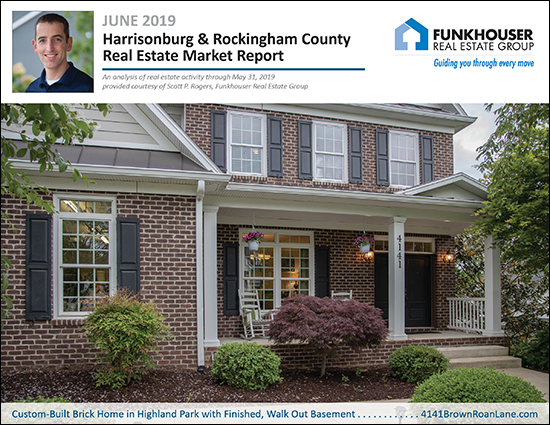 We're nearly halfway through the year and 2019 is shaping up to be a strong year of home sales, very similar to last year. But before we dive into the data, here are a few quick links...
Now, let's see what the data is showing us this month... 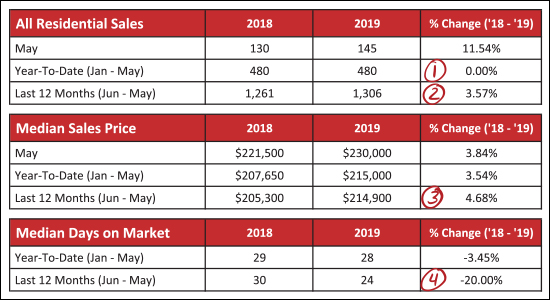 As shown above, we have seen a solid start to the year, now five months in...
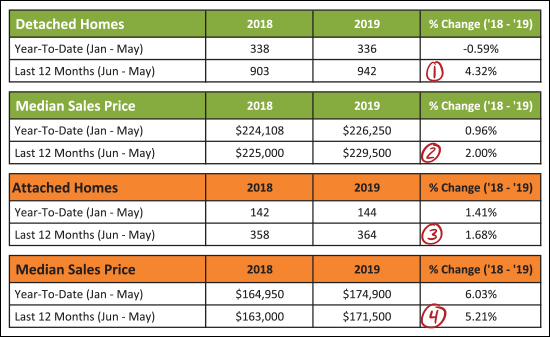 Breaking things down a bit further, as outlined above, we'll start with the green portions of the chart -- which are detached homes...
The orange section above represents attached homes -- including duplexes, townhouses and condominiums, where we find that...
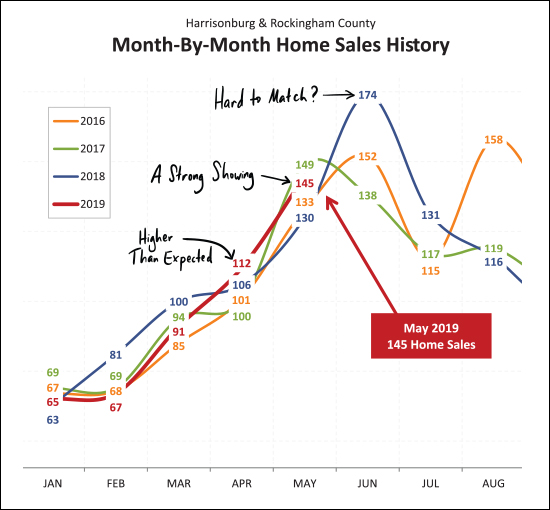 As you look at the graph above, find the dark red line and follow it from month to month from January through May to see how this year compares to previous years. What you'll find is that January, February and March were nothing special -- at all. They were slower or the slowest such months from the past few years. But once we hit April, things started to change -- we saw more home sales in April than any of the past three months of April -- and May home sales were also stronger than two of the past three months of May. So, as noted above -- April was surprisingly high, May was a pretty strong showing, but June, that might be where this year starts to slow down, comparatively. Last June we saw a surprising, historic, 174 home sales in a single month. It seems rather unlikely that we'd see that many home sales this June. 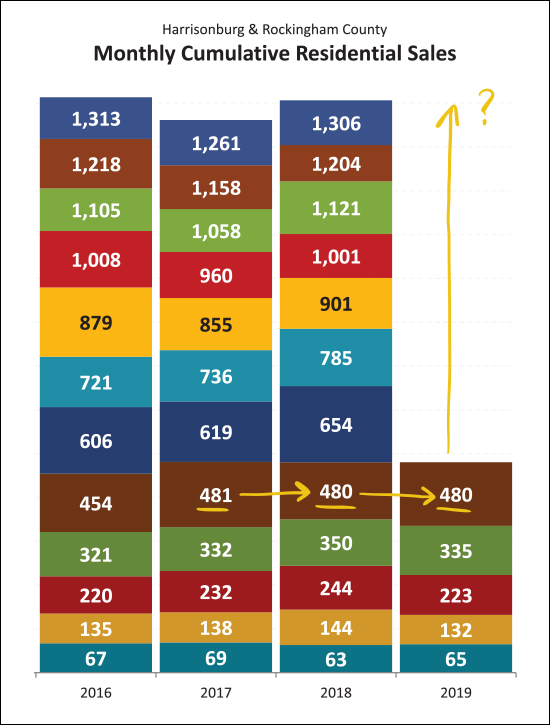 This tall, colorful, graph shows each month of home sales stacked on top of the prior month -- and you'll see that the first five months of this year have tracked pretty consistently with the first five months of each of the past two years. So, it seems reasonable to think we might end up somewhere around 1280 - 1300 home sales for the full year of 2019. Stay tuned as the year continues to develop. 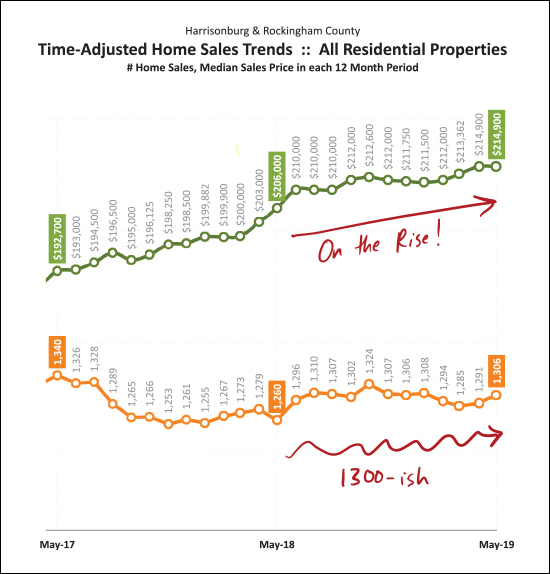 This graph shows looooong term trends -- tracking a rolling twelve months of data when it comes to the quantity of home sales and the median price of those home sales. The highly technical 1300-ish red squiggle at the bottom of the graph represents the meandering annual pace of home sales as shown in orange. We've been somewhere around an annual pace of 1300 home sales for the past 12 months or so -- with the most recent (two month trend) heading us in a positive direction. The top, green, line is showing the long term trend for the median sales price of homes in Harrisonburg and Rockingham County. The median sales price keeps on climbing -- from $193K to $206K to $215K over the past two years. 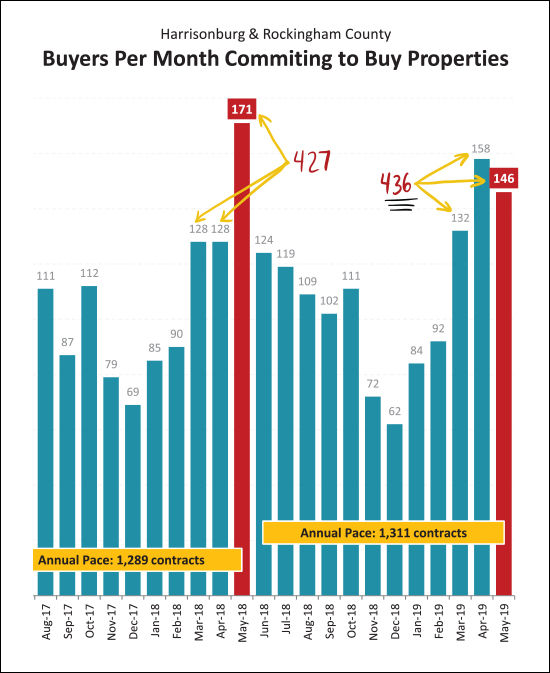 Sometimes looking at a single month of data can throw us off -- getting us overly excited or overly depressed. Last May (2018) we could have been elated about the incredibly strong month of contracts -- though it followed two slower months in March and April. This year we saw strong months of contracts in both April and May -- even though neither reached the 171 contracts seen last May. But in the end, March-May contracts only added up to 427 contracts last year -- and 436 this year -- so, a net increase. 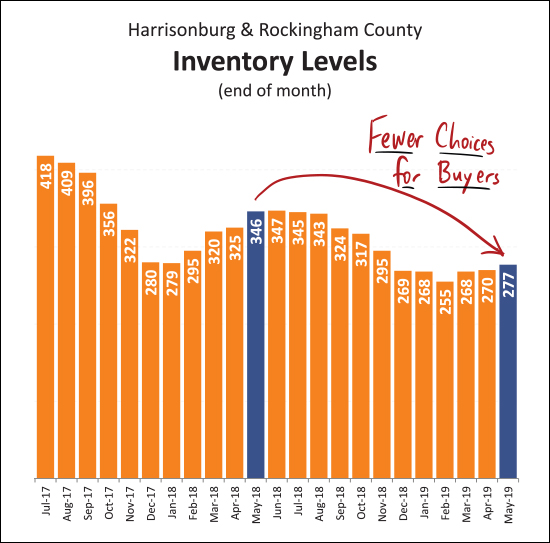 And so, as shown above, the sad story continues -- it is a tough time to be a buyer. Inventory levels might be rising and falling seasonally (rising, slightly, right now) but the overall trend over the past several years has been fewer and fewer homes for sale at any given time. This causes buyers to have fewer choices at any given moment -- and requires that they be able to act quickly and decisively when a house of interest comes on the market. 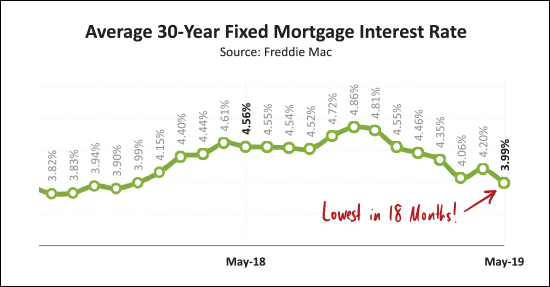 I'm not always convinced that month to month increases or decreases in mortgage interest rates can specifically spur on buyer activity (there has to be a house listed for sale that you actually want to buy) but the lower (and lower, and lower) mortgage interest rates of late certainly don't hurt! We haven't seen mortgage interest rates below 4% in over a year -- and right now many mortgage lenders are quoting rates of 3.875%, 3.95%, etc. An exciting time to lock in a fixed mortgage interest rate! Alright -- we'll wrap it up there for now, though keep in mind that there is a LOT more in my full market report, which you can download as a PDF here. And -- if you're getting ready to buy or sell -- here are some things to keep in mind... SELLERS -- even though it is a seller's market in just about every price ranges right now, you must still focus on price, condition and marketing. For further reading on buying or selling in this area, check out.... | |
Home Sales and Contracts Surge in April 2019 |
|
 After a somewhat slow start to 2019, the local real estate market has now picked up speed in April! But before we start looking at the data, two quick links for you...
Now, onward! 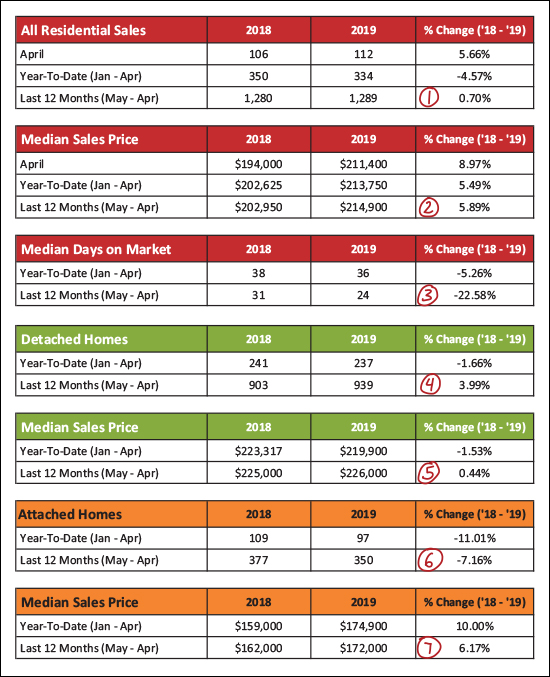 Lots going on above...but here are the high points...
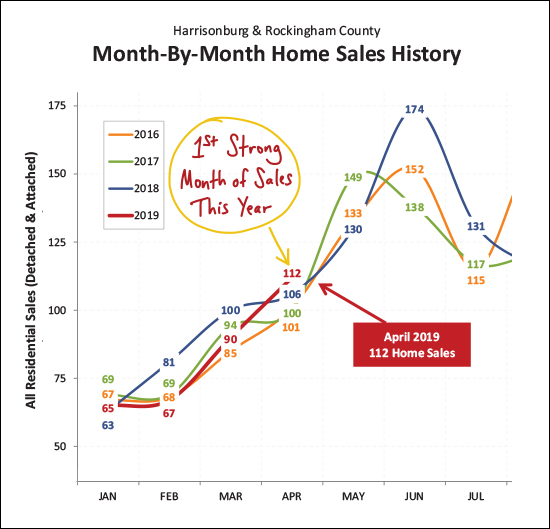 OK - here's what I was talking about earlier. January, February and March sales were simply nothing to write home about. This February was the slowest February out of the past four years. January and March were the 3rd slowest such months from the past four years. But April -- wow! Home sales surged in April, up to 112 home sales -- the best month of April seen in the past four years! 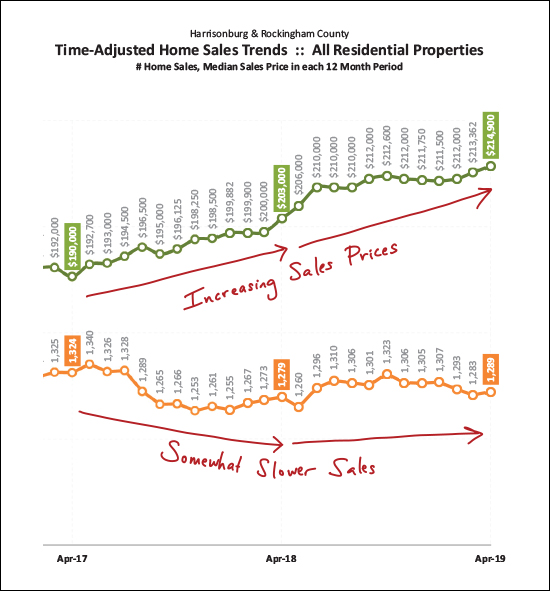 Zooming out from the granular data, this graph looks at long term trends -- the slowly shifting 12-month trend line for the pace and price of home sales. As you can see, sales prices have been increasing despite somewhat slower sales. 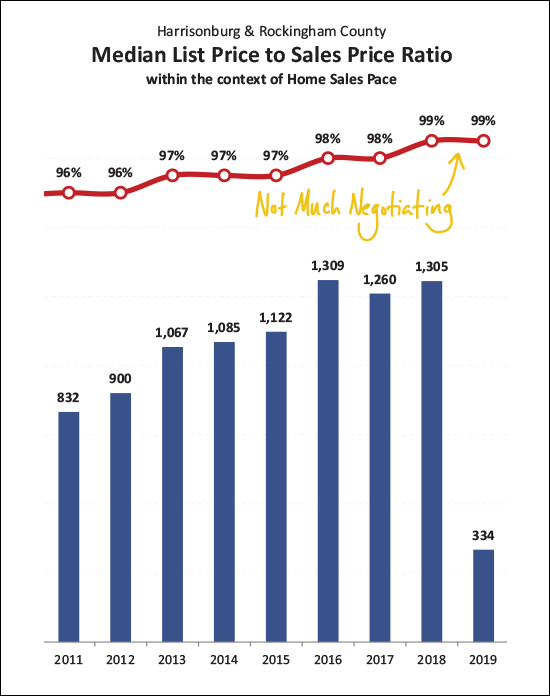 It shouldn't be too much of a surprise that stable sales, rising prices, low inventory levels and low days on market are leading to very little negotiating on price. Homes are selling at a median of 99% of their list price. This means that half of homes are selling for 99% or more of their list price. 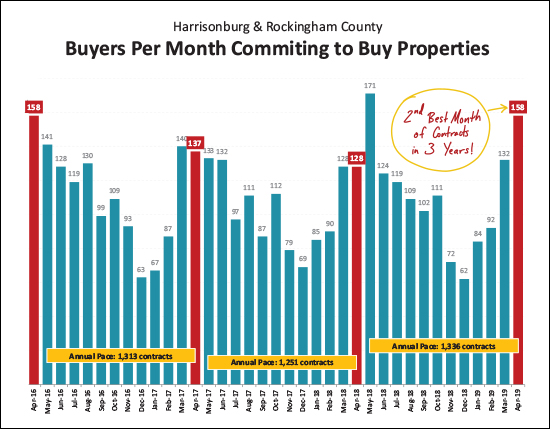 OK - this one was a bit surprising. And I squished all of the data down so far to fit a large context on the graph above that the image is not quite as crystal clear as I'd like it to be. But the message is quite clear - buyers came out in full force in April 2019 -- the 158 contracts signed last month was the second highest month of contracts seen in the past three years! That said - prepare yourself to be at least a bit disappointed next month. I think it's relatively unlikely that we'll be able to see a spike of contract activity all the way up to the showing 171 contracts that were signed last May!? 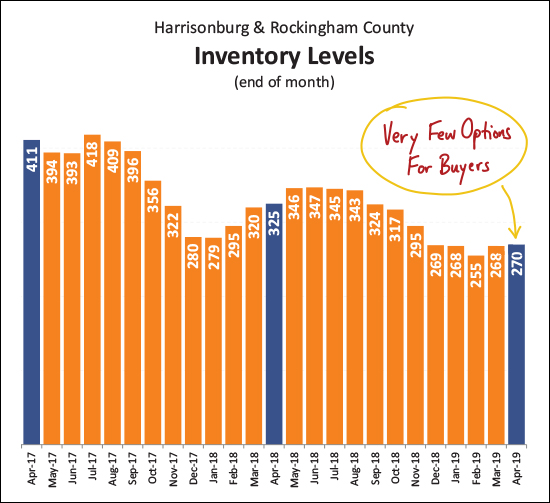 Home buyers like choices, right? Well, right now, they don't have many. In all of Harrisonburg and Rockingham County there are only 270 properties listed for sale. This number has been steadily declining over the past few years -- and the supposedly busy Spring of plenty of listings has not been able to increase these inventory levels -- probably because buyers keep snapping the new listings up as soon as they hit the market. 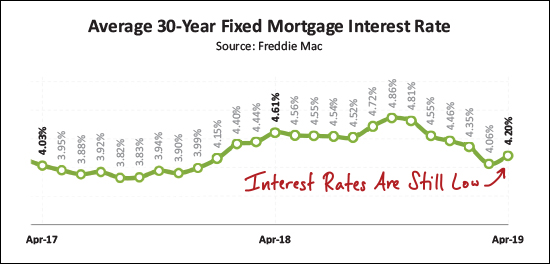 As some welcome news for buyers who are able to find a home to buy - they're able to finance that purchase at a relatively low interest rate! After having risen all the way up to 4.86% (it seemed like 5% was bound to be seen) mortgage interest rates have now dropped all the way back down to the low 4% range. This gives buyers the ability to lock in low monthly housing costs for the long term! OK - we'll cut it off there for now - though there is plenty more that you can scroll through in the PDF of my full market report. My guidance to local soon-to-be home buyers and sellers remains consistent... SELLERS -- even though it is a seller's market in just about every price ranges right now, you must still focus on price, condition and marketing. For further reading on buying or selling in this area, check out.... | |
Merck Announces $1 Billion Investment in Elkton, Virginia Facility, Over Three Years, To Create 100 Jobs |
|
 In a major employment announcement for Rockingham County, Virginia Governor Ralph Northam announced yesterday that Merck will be investing up to $1 Billion over the next three years to expand its manufacturing facility in Elkton, Virginia and create a new Gardasil Purification Center. This growth will add up to 100 new jobs and 120,000 square feet to the Elkton facility. Here's an excerpt from this report from NBC29... "As part of the expansion, Blue Ridge Community College (BRCC) and James Madison University (JMU) will collaborate to address Merck's short- and long-term workforce needs through the development of a custom workforce solution. BRCC and JMU will establish a pipeline of biotechnology engineering and computer science talent that will allow the Shenandoah Valley to accommodate the future growth of Merck and other life science industries and manufacturers in the region." Read more via this article at NBC29... Governor Northam Announces Significant Investment in Rockingham County Merck & Co., Inc. to expand Elkton manufacturing facility, creating about 100 new jobs. | |
Sales Slow, Prices Plateau, Contracts Console in First Quarter 2019 |
|
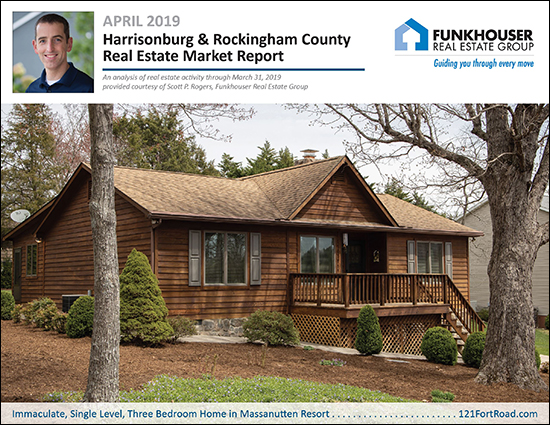 Just like that - the year is already more than 25% behind us. Looking back over home sales activity during the first quarter we find a mixed bag of market indicators. Before we delve in, two quick links...
Now, on to the data... 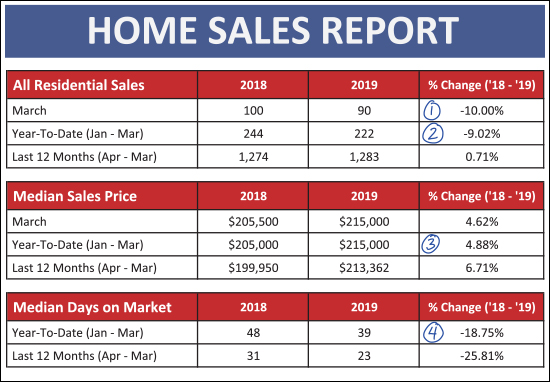 As shown above...
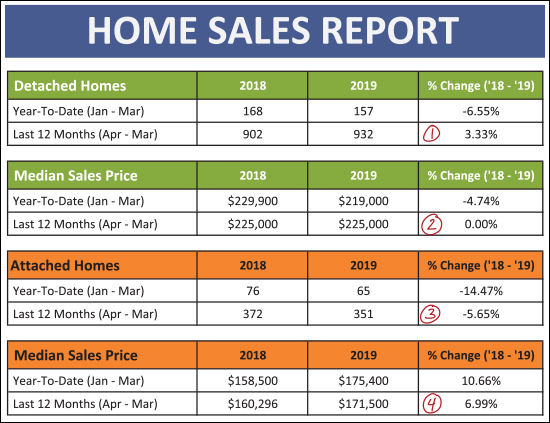 The green rows above are showing sales activity for detached ("single family") properties. The orange rows are for attached properties - which includes duplexes, townhouses and condos.
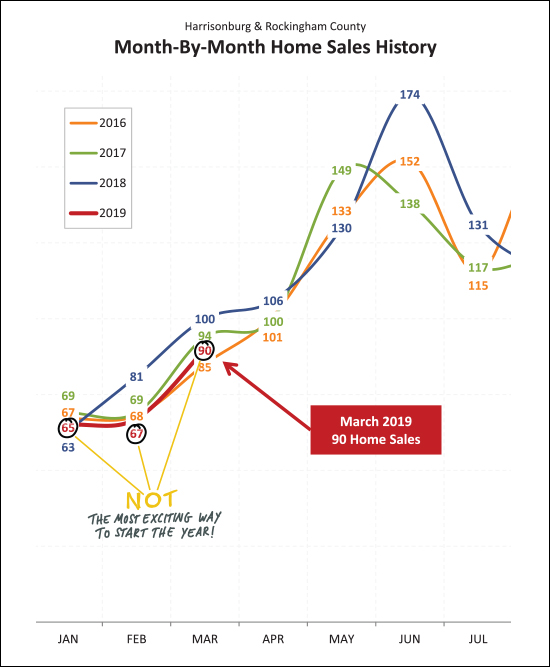 Here (above) is a visual of the not-so-exciting way that this year has begun when we look at monthly home sales compared to the same months in recent years. February home sales were the slowest out of the past four years - and January and March were the second slowest. So - clearly - a slow start to the year - but keep on reading for some news on contract activity. 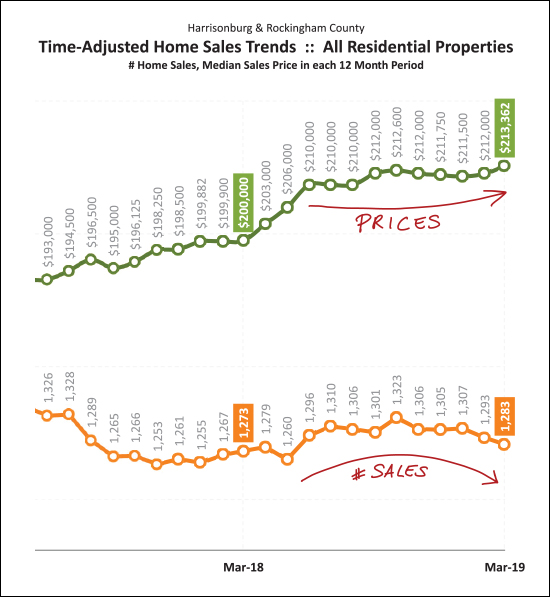 The graph above explores long term (rolling 12 month periods) trends in home sales and prices. Over the past year we have seen sales start to trend slightly downward - while prices have trended slightly upwards. Nothing drastic in either direction, really, but those are the general directions we're seeing the market move. Of note - the rising prices shown above have more to do with a change in the mix of what properties are selling (more higher priced detached homes and fewer lower priced attached homes) more than an actual increase in values. As shown a bit ago (scroll up) the median sales price of detached homes has remained flat over the past year. 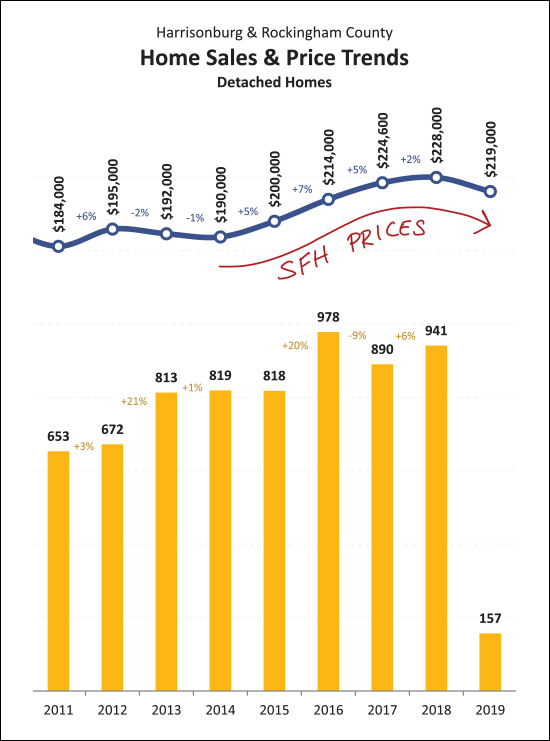 Here's a slightly more depressing view of value trends for detached homes. Over the past few years the increase in sales prices has been decreasing (+7%, +5%, +2%) and with data only from the first quarter of 2019, the median sales price has actually declined. I am guessing that we'll actually end up with a net gain in median sales price once all 2019 data is in the books, but for now, prices are appearing slightly soft when just viewing first quarter data. 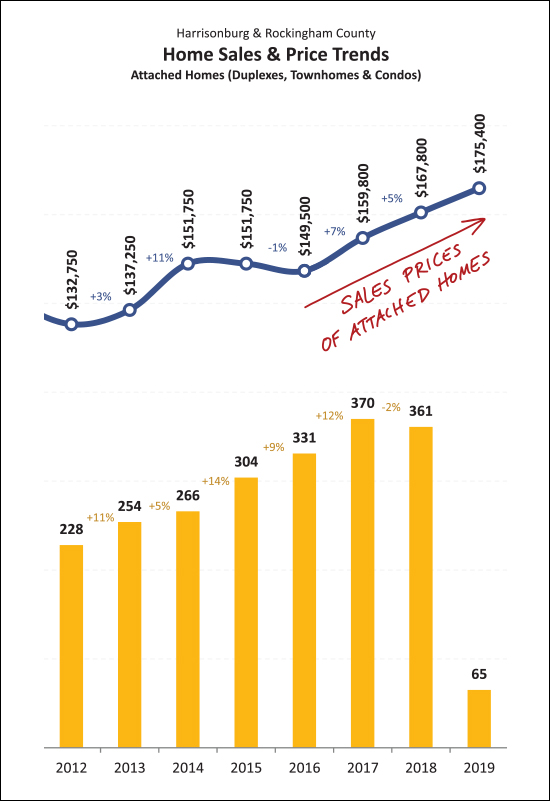 But if you're selling an attached (duplex, townhouse, condo) property - the state of the market is looking promising! As shown above, the prices they just keep on rising. Part of this is likely a result of constrained supply (not enough new townhouses being built) amidst increasing demand. This is keeping sales prices on the rise and that doesn't show signs of stopping in the near term. 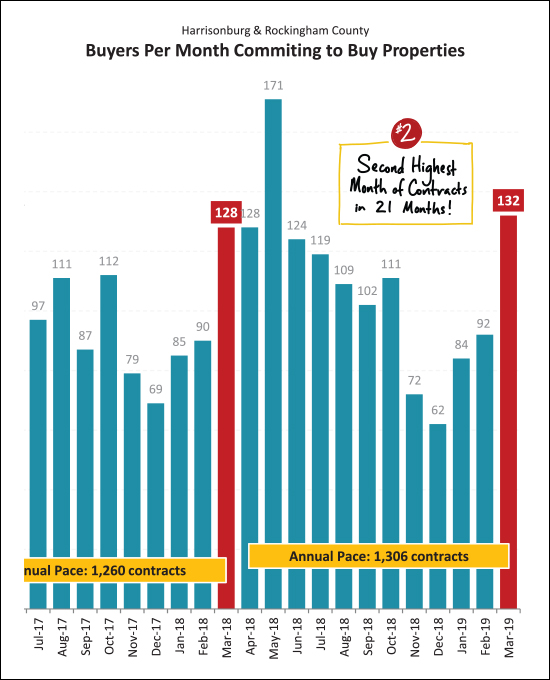 OK - hopefully you read this far - because here is the silver lining of the first quarter of our local housing market. Despite slower sales in the first quarter, contract activity was STRONG in March 2019. In fact -- it was the second strongest month of contract activity in the past 21 months! This should lead to strong months of closed sales in April and May, and hopefully this is just the beginning of a strong Spring and Summer of contracts being signed. 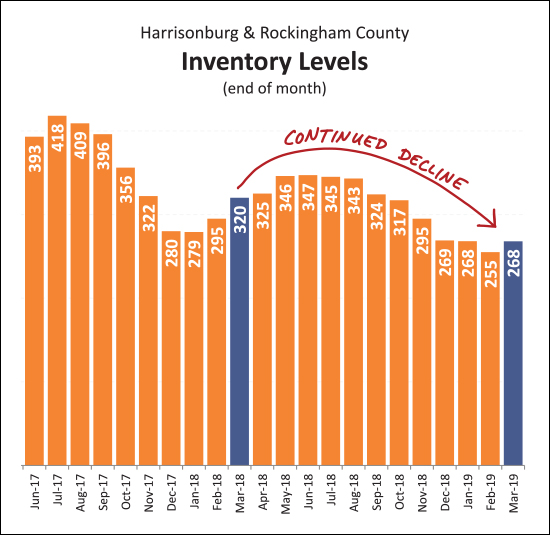 For the past few years I kept saying I didn't think inventory levels could drop any further. Well, they did, they have, and somehow the market keeps on moving. As shown above, despite a monthly increase in inventory levels between the end of February and end of March, we have seen another year-over-year decline in the number of homes on the market. Unless we see a significant growth in new construction in this area, these low inventory levels are likely to remain the norm for the next few years. 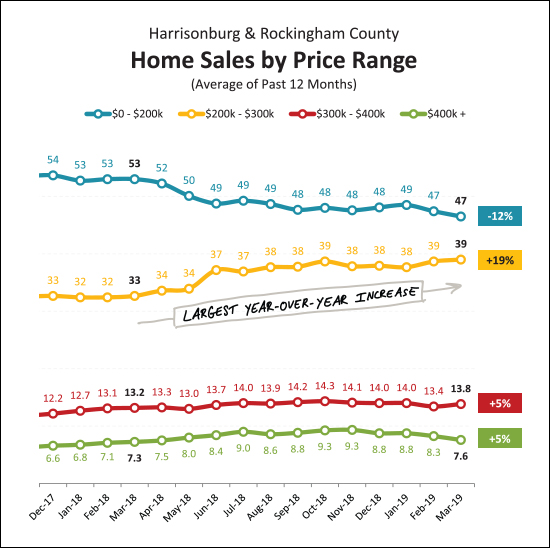 And here's a bit of trivia for you -- the fastest growing price segment of our local housing market is --> the $200K - $300K price range. There has been a 19% increase in sales of homes between $200K and $300K, which is the largest increase of any of the price categories shown above. 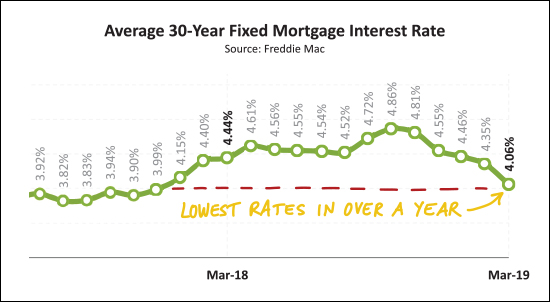 What brought on the strong surge of contract activity in March 2019? Could it be the sudden drop in mortgage interest rates, down to an average of 4.06%? Probably not just that -- it was likely also a surge in new listings combined with anxious buyers who had seen very few options over the winter months. But the low mortgage interest rates likely helped and were an added bonus to anyone making a decision to commit to a home purchase during March 2019. Well, folks, that's a wrap. You read to the end of my overview of our local housing market. You can delve into even more details by downloading a PDF of the full report here. And as always, if you have questions about our local housing market feel free to be in touch. My guidance to local soon-to-be home buyers and sellers remains consistent... SELLERS -- even though it is a seller's market in just about every price ranges right now, you must still focus on price, condition and marketing. For further reading on buying or selling in this area, check out.... | |
| Newer Posts | Older Posts |
Scott Rogers
Funkhouser Real
Estate Group
540-578-0102
scott@funkhousergroup.com
Licensed in the
Commonwealth of Virginia
Home Search
Housing Market Report
Harrisonburg Townhouses
Walk Through This Home
Investment Properties
Harrisonburg Foreclosures
Property Transfers
New Listings

