News
| Newer Posts | Older Posts |
Home Sales Slowed Considerably In Late 2022 But Home Prices Kept On Rising |
|
 Happy Thursday afternoon, friends! And... Happy New Year! It's hard to believe the New Year is upon us. Actually.. we're already more than halfway through January at this point. What a whirlwind. I hope you had a delightful finish to 2022. I capped off the year with a slightly warmer than anticipated New Years Eve Glow Run, another fantastic community running event put on by VA Momentum. Below is a photo just prior to the start of the race... after which it became progressively darker and our glow bracelets and necklaces were lighting up the hilly course at Heritage Oaks Golf Course...  Two other items of business before we get into the real estate data... First, take a few minutes to check out my featured home of the month... 3078 Preston Lake Blvd... This beautiful cottage home with a finished basement is located in the Preston Lake community with a clubhouse, pool, walking paths and playground, all just minutes from Sentara RMH, JMU, Merck and Coors! You can check out the house here or walk through it here. Finally, each month I offer a giveaway, of sorts, for readers of this market report, highlighting some of my favorite places, things or events in Harrisonburg. Recent highlights have included Grilled Cheese Mania, Walkabout Outfitter and Bella Gelato. And this month... This month it's back to music... I'm giving away a pair of tickets to see The Steel Wheels and Sierra Hull at JMU's Wilson Hall on February 11th! Read all about the event, and the artists, here - and if you're interested in a pair of free tickets, enter to win them here. :-) Now, onward to the latest data on our local housing market! First, how many homes have been selling lately... 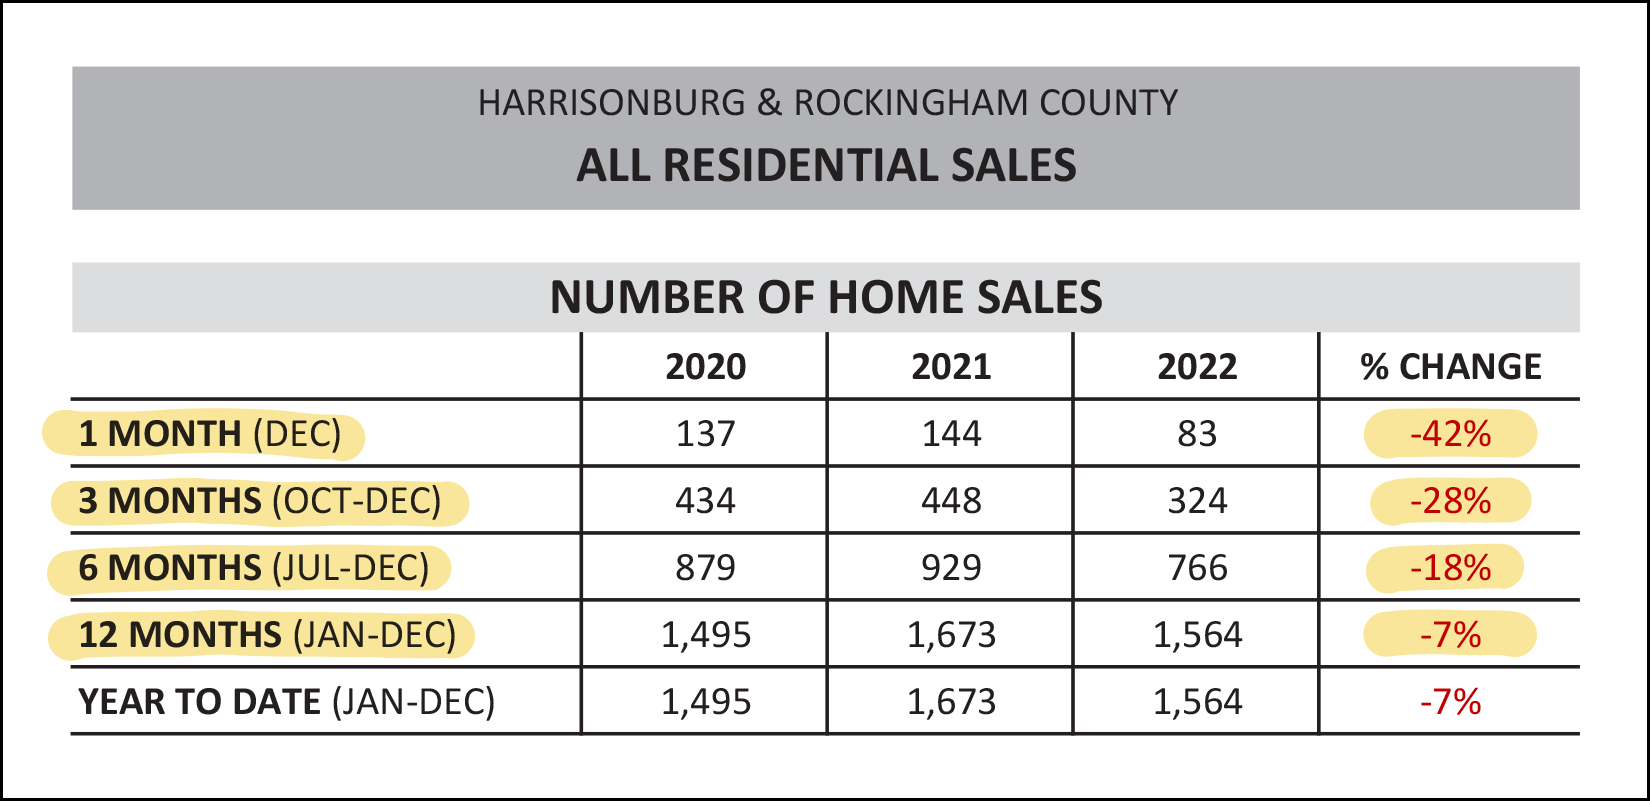 There's a lot to note in the graph above, and some of these numbers informed the headline for this article... [1] There were only 83 home sales in December 2022... compared to 144 in December 2021. That's a rather surprising 42% decline in home sales for the month of December. [2] When we pile in a few more months (October and November) we see that there were 28% fewer home sales in the fourth quarter of 2022 than in the fourth quarter of 2021. [3] Finally, when looking at the full year of 2022... there were 7% fewer home sales than in 2021. After several years of rapidly increasing numbers of home sales, it seems that higher mortgage interest rates finally slowed down buyer activity... though not very significantly until the very end of 2022. But yet, despite slowing sales, home prices did what!? 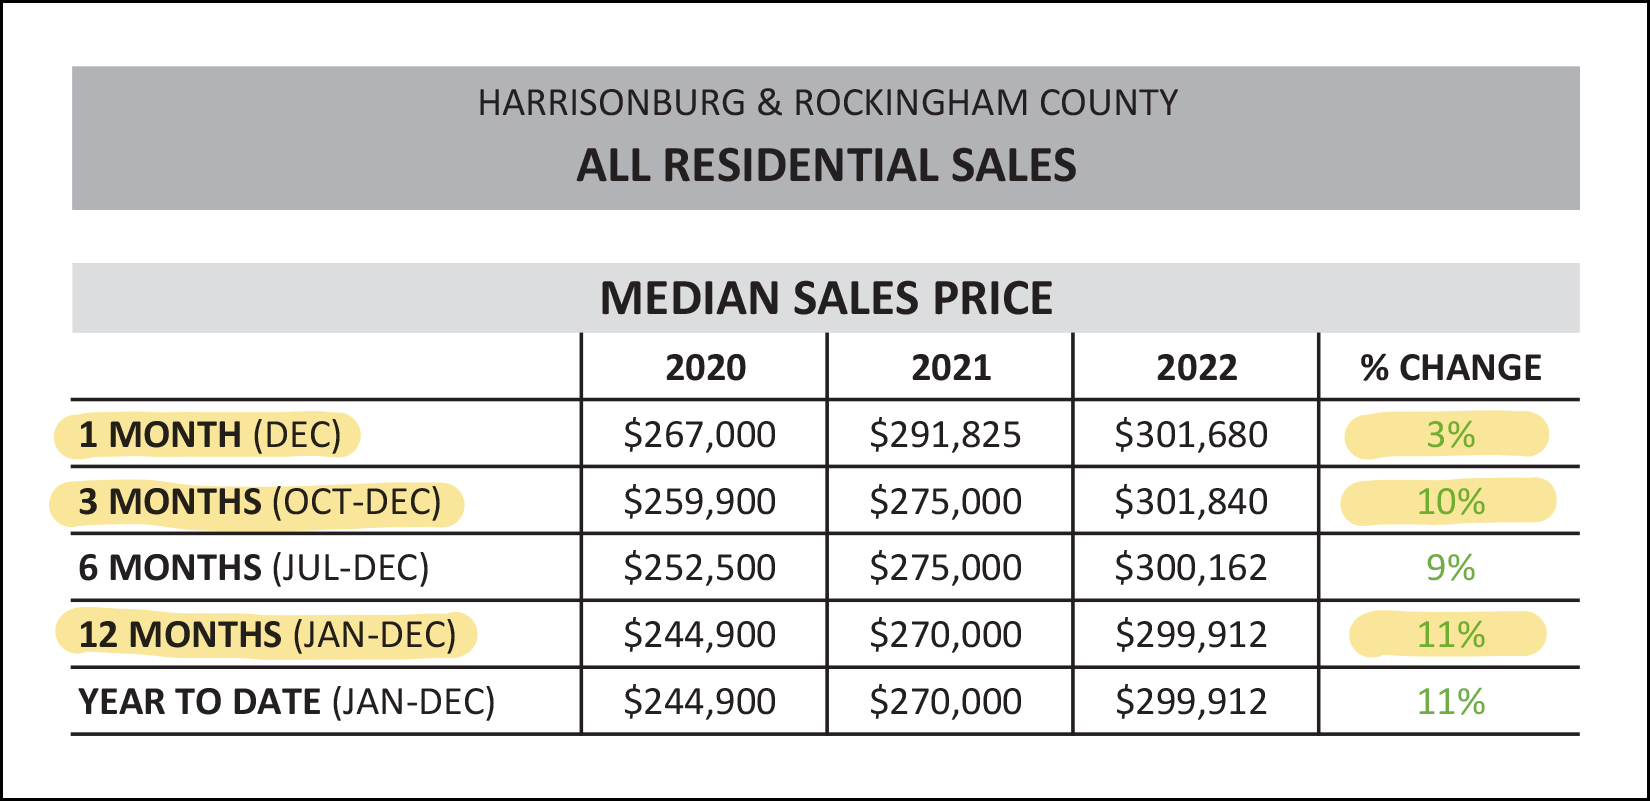 Home prices... kept on rising! [1] Starting from the bottom of the chart (above) this time we see that there was an 11% increase in the median sales price when comparing all of 2021 to all of 2022. That's a rather significant increase in the median sales price and it follows on after two preceding years of 10% increases in the median sales price. Needless to say, homes have become quite a bit more expensive over the past several years. [2] The median sales price in December 2022 was 3% higher than in December 2021. This could be an indication that we'll start to see a slow down in the rate at which home prices are increasing... or, as is more likely, it may be lower than the longer term trend (+11%) because it is a smaller data set of only the homes that sold in a single month. So... was it just December when we were seeing slowing home sales? 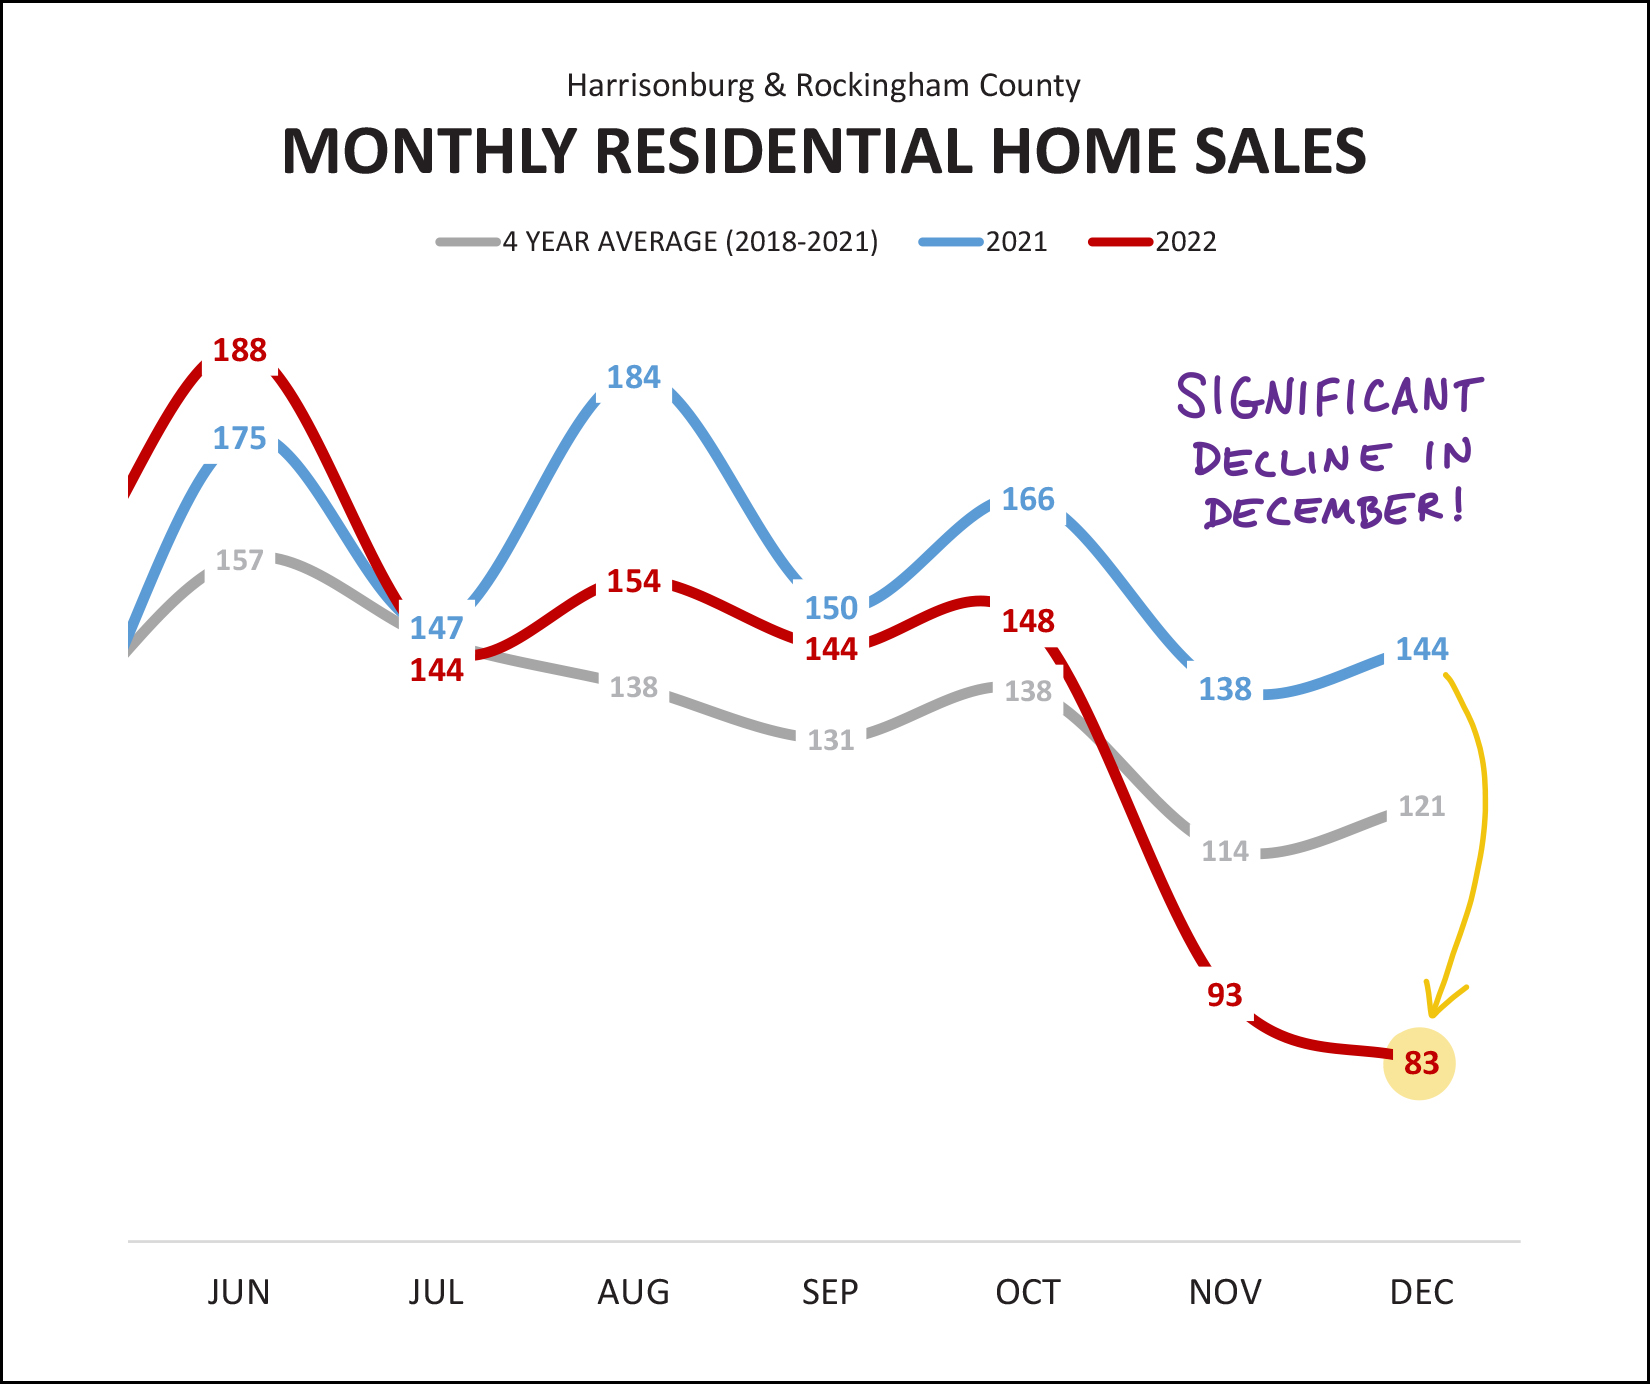 The decline in home sales was certainly significant in December... but if you track that red line (2022) back to November and compare it to the blue line (2021) you'll see that the slow down started before December rolled around. The graph above (and many of the graphs in this month's report) are in a slightly different format than in past months. I spent some time going through to revamp my monthly market analysis process to hopefully make the resulting graphs and analysis even more helpful and pertinent for all of us as we see how 2023 unfolds. As such, the graph above is showing the current (just finished) year of 2022 with a red line -- and the previous year of 2021 with a blue line -- and the grey line is showing a longer term trend calculated by averaging 2018 through 2021. Next up, let's look at monthly cumulative home sales... 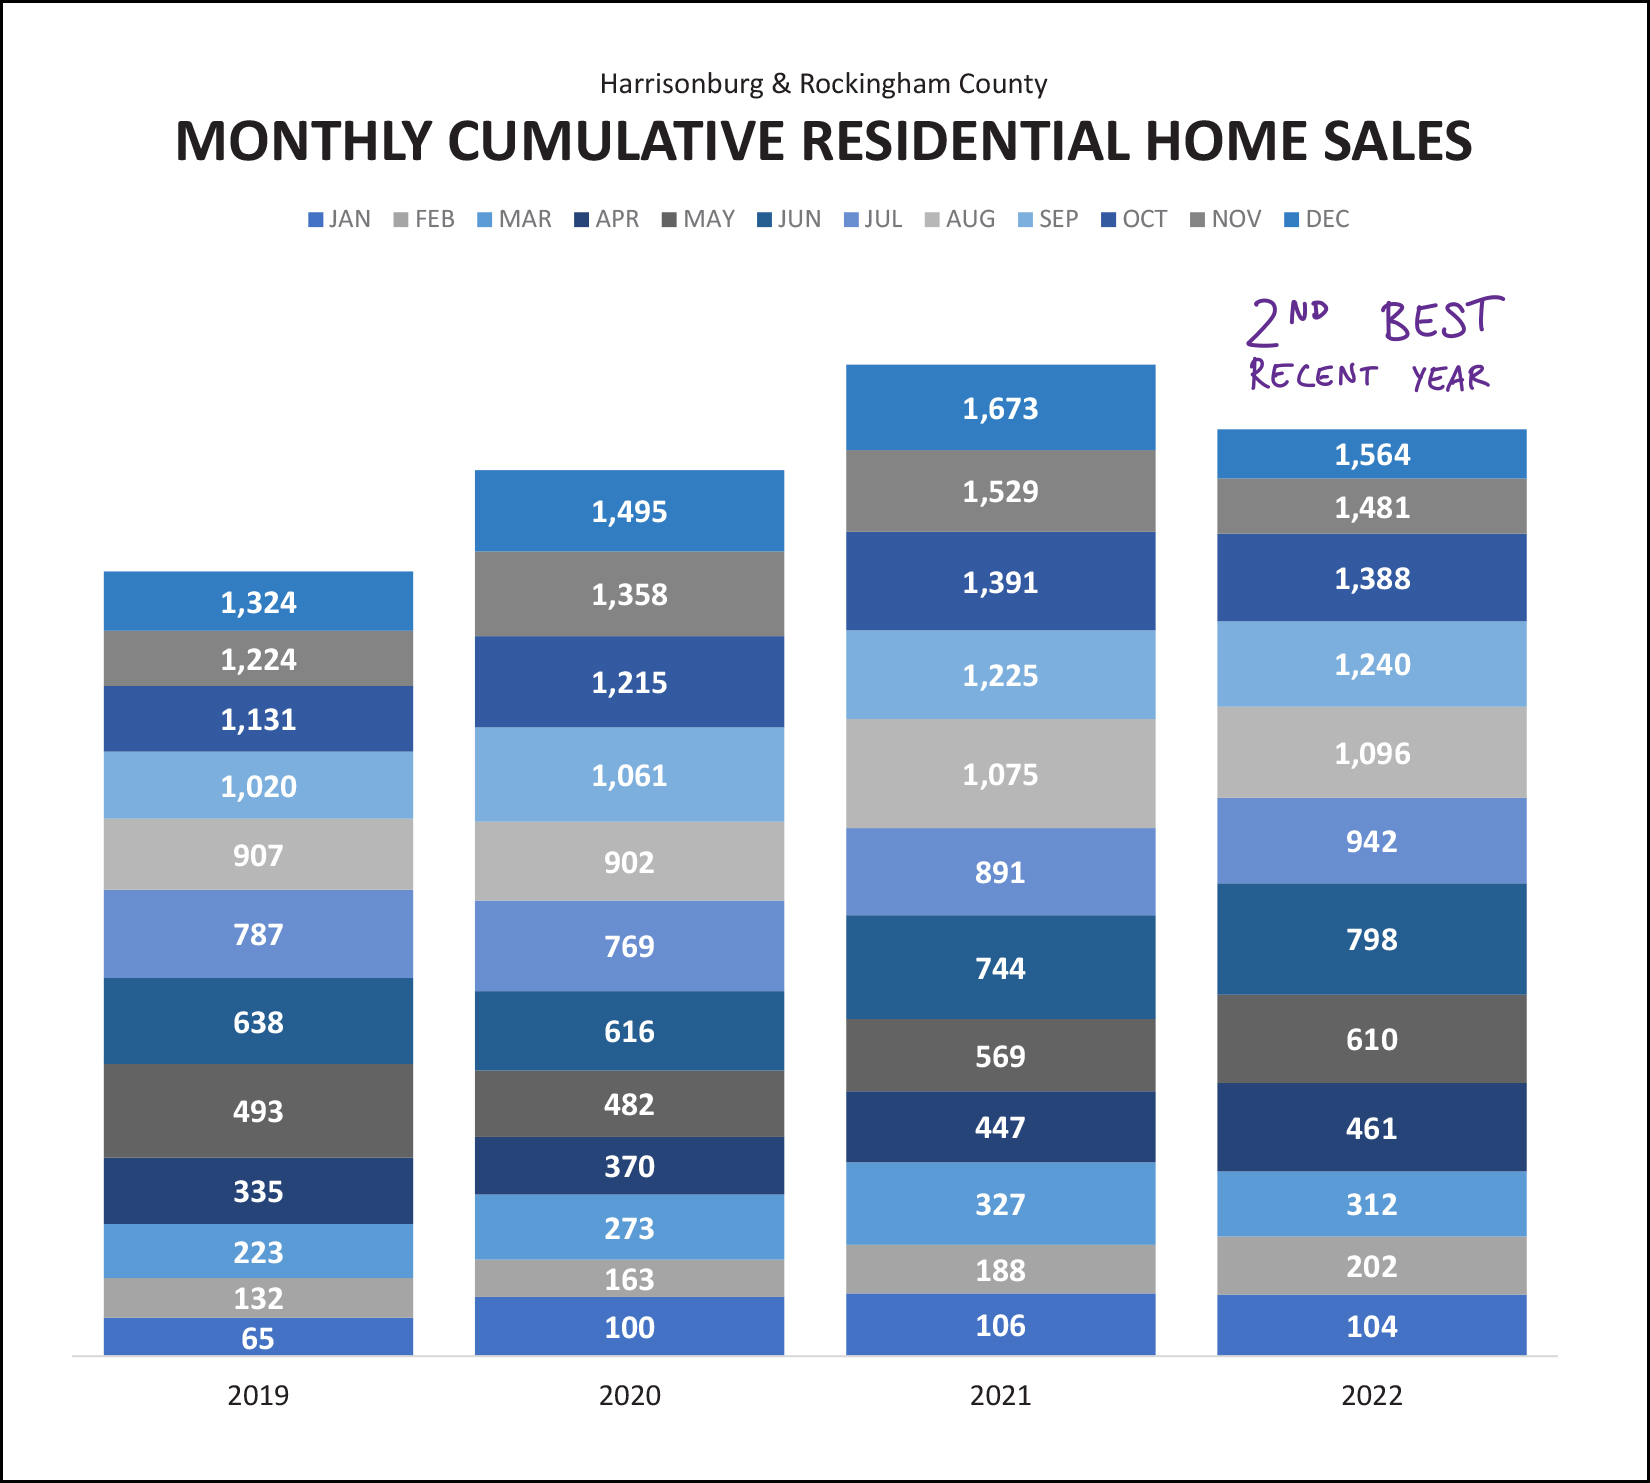 The graph above provides another illustration of the fact that 2022 was keeping pace with 2021 all the way through the end of October... and then November and December fell short. This resulted in the second strongest recent year of home sales in Harrisonburg and Rockingham County. Indeed... there were 7% fewer home sales in 2022 than in 2021... but there were well more than in 2019 and 2020! Next, let's look at general long term trends over the past few years... 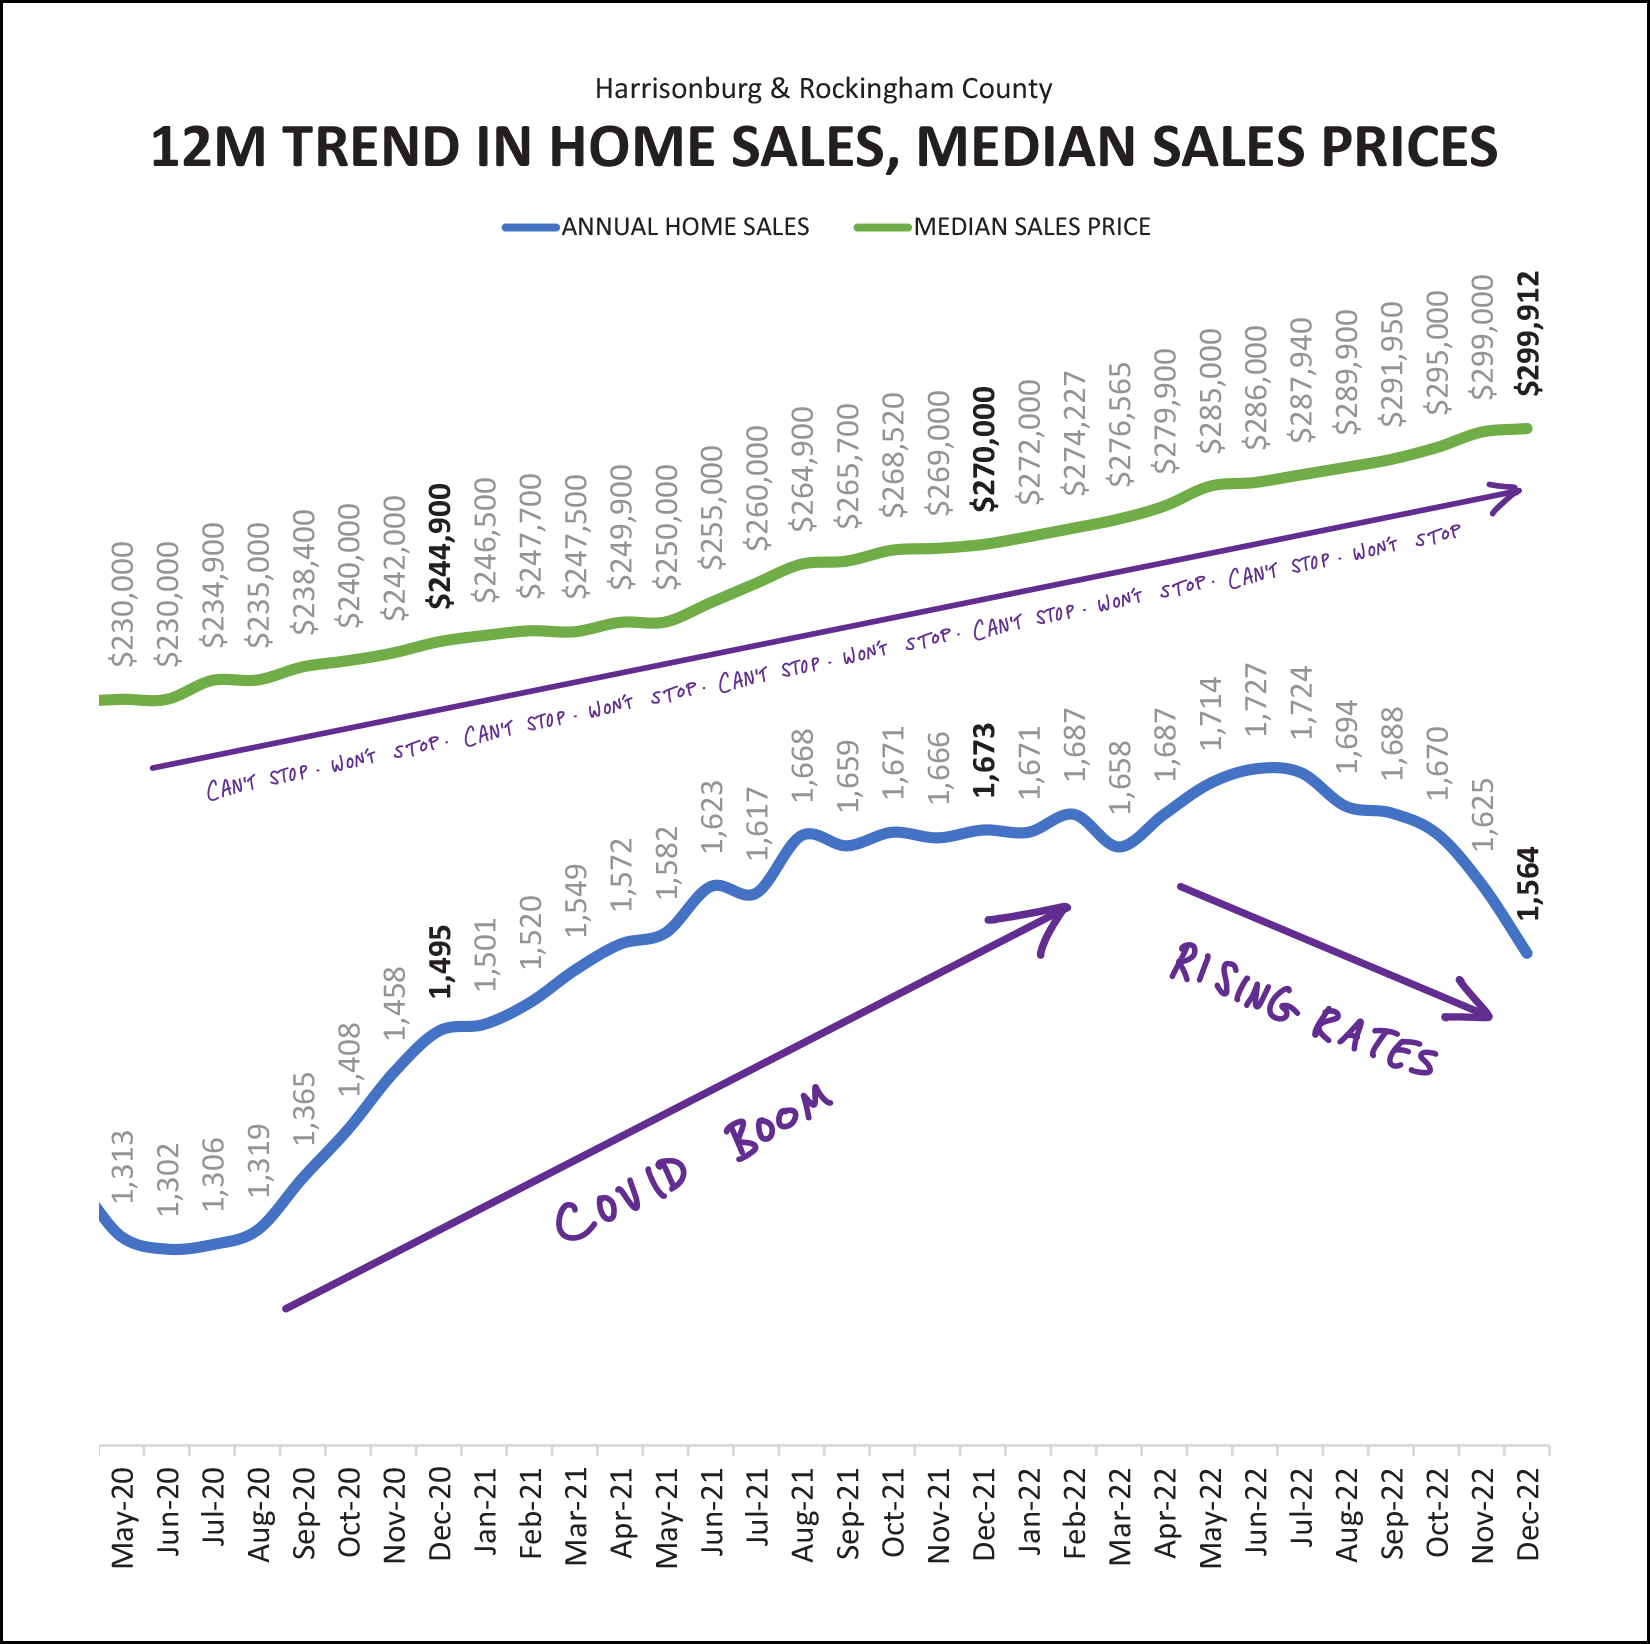 The top green line is showing the median sales price of all homes selling in Harrisonburg and Rockingham County... measured monthly by looking at the median of the previous 12 months. In tiny letters underneath someone (ok, me) wrote "can't stop, won't stop, can't stop, won't stop" -- but, I should definitely, definitely clarify that -- yes -- the median sales price could stop increasing. It didn't do so anytime in the past three (plus) years as illustrated above, but as they say, past performance is not a guarantee of future results. The bottom blue line (above) is a monthly check-in on the annual pace of home sales. During Covid the annual rate of home sales in our area shot up from around 1,300 sales per year all the way up to 1,700 sales per year... but as mortgage interest rates rose during 2022, eventually the annual pace of home sales started to decline again. Where did we finish out 2022, you might ask, within the context of the past few years? 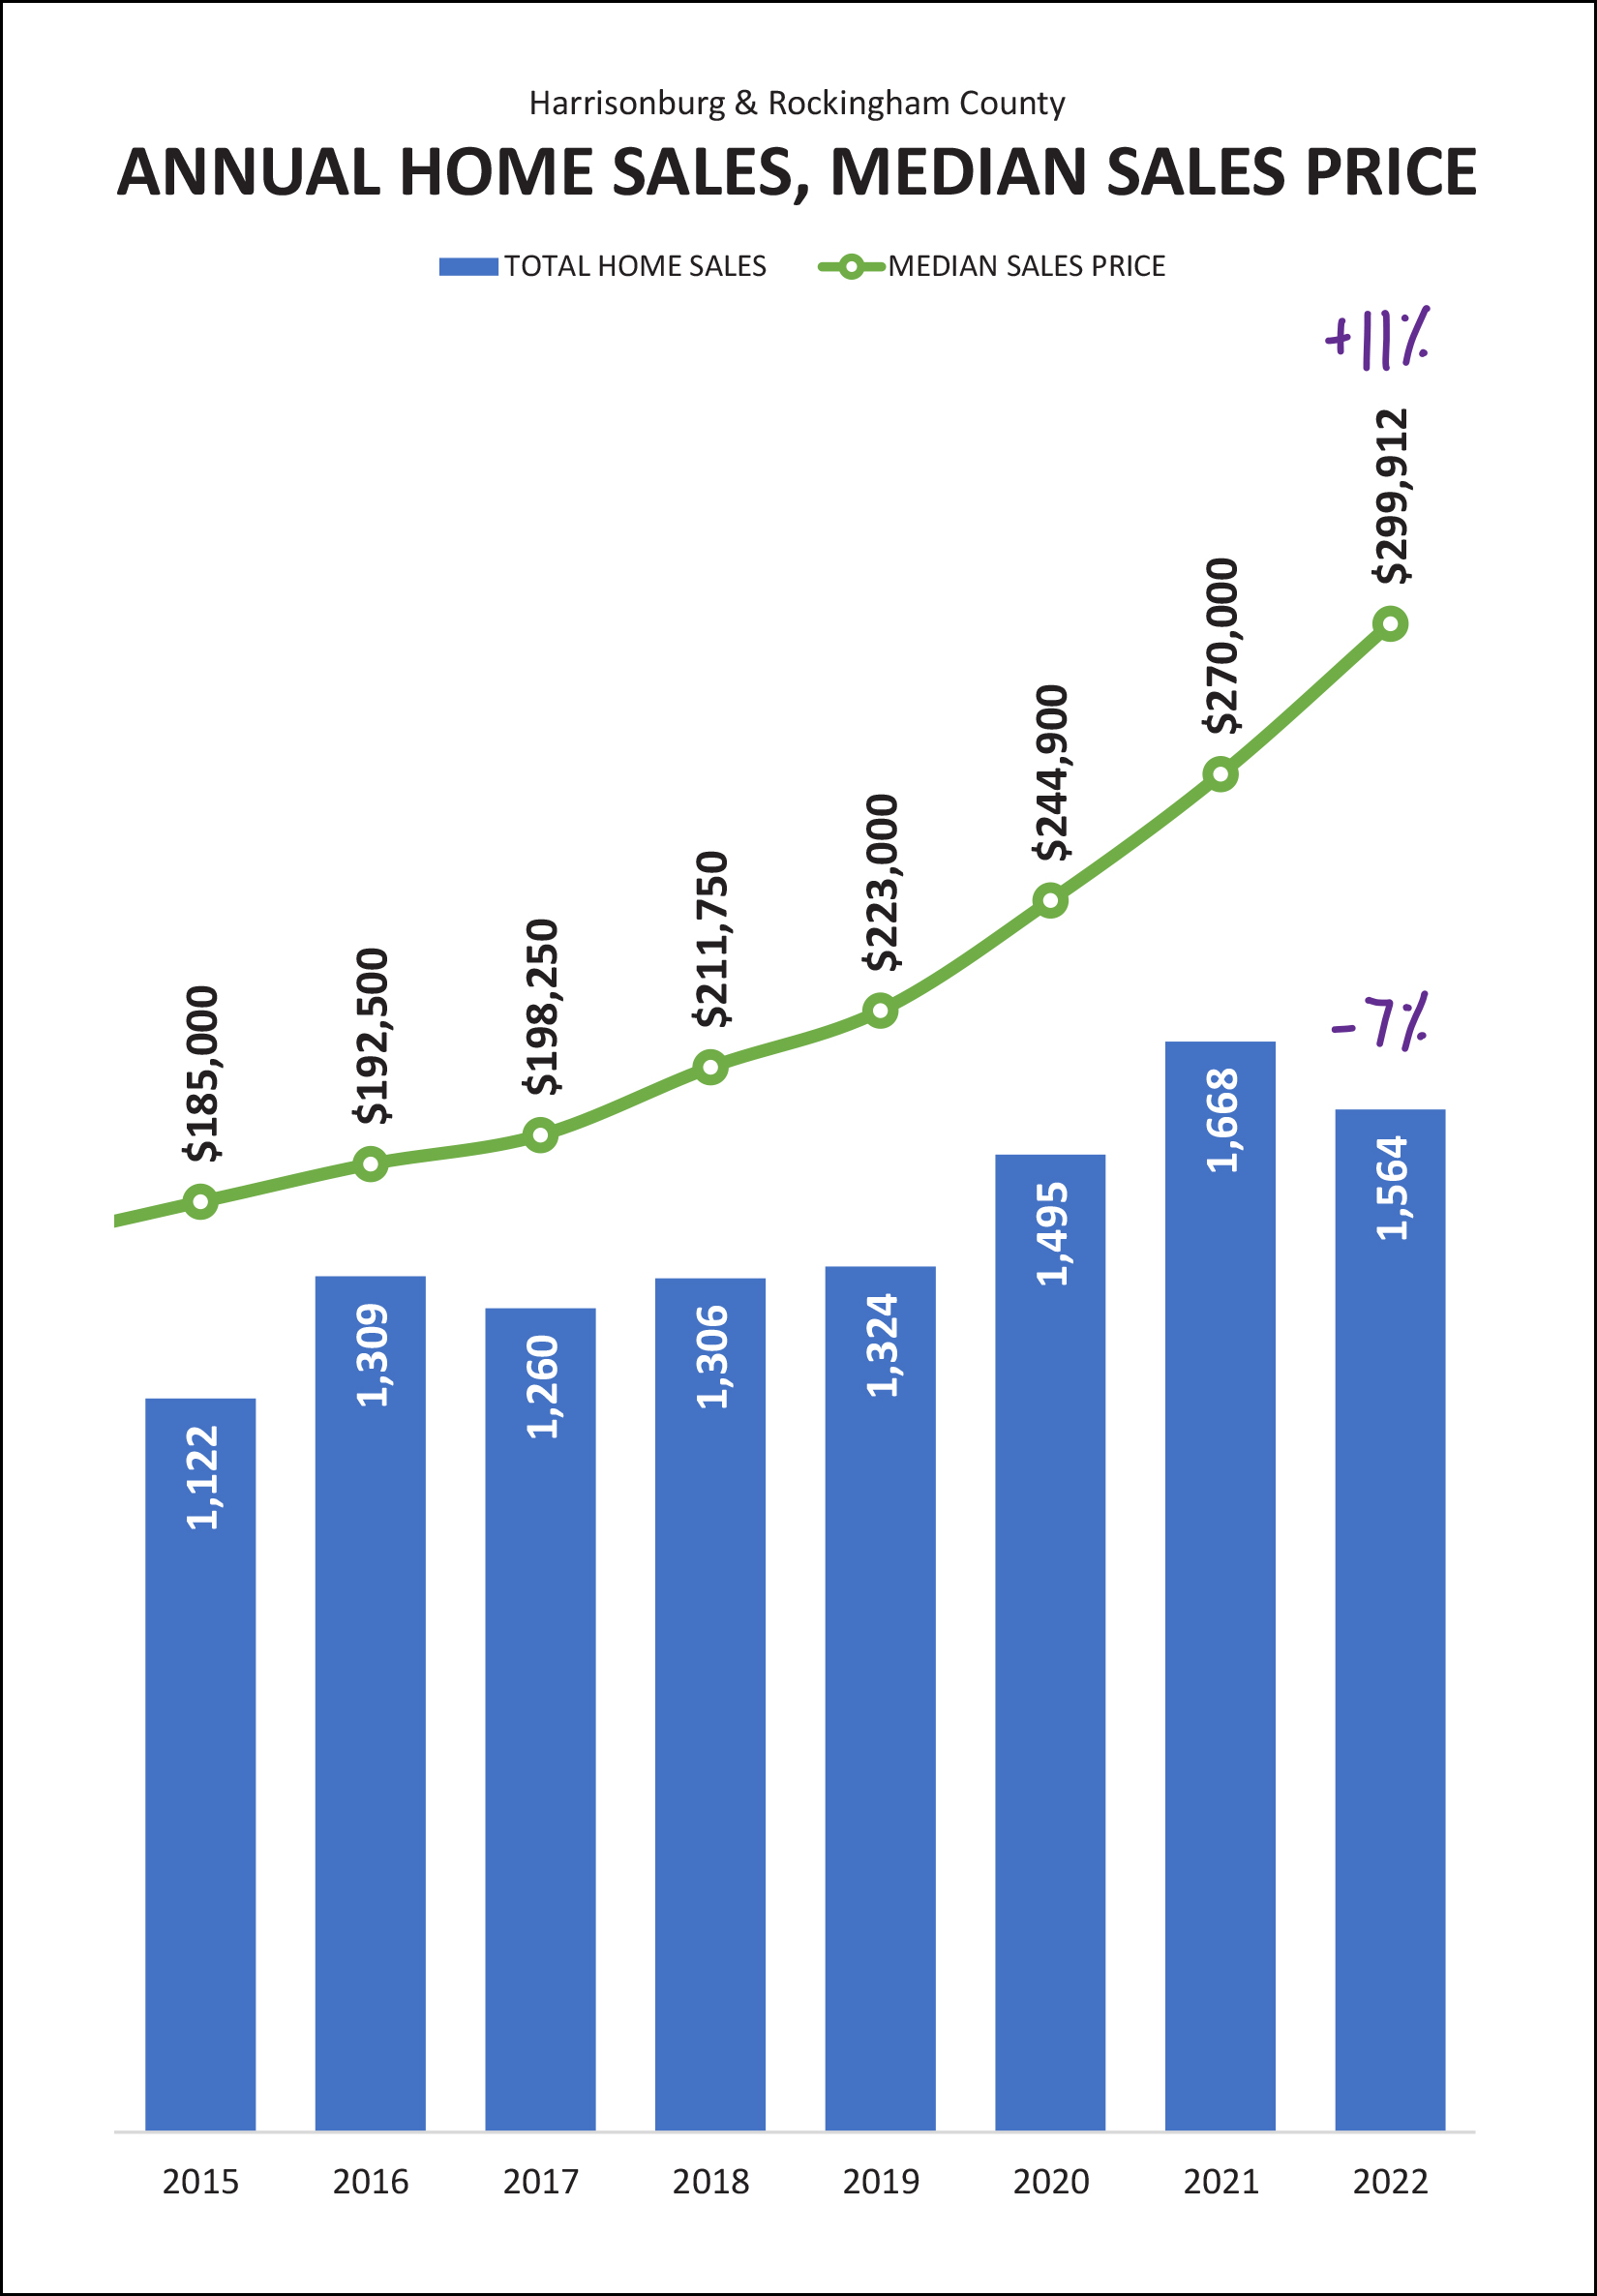 We ended up seeing 7% fewer home sales in 2022 than in 2021 -- though there were 5% more home sales in 2022 than in 2020. So, again, this past year was the second best year of home sales in recent times. You can see again here (in the graph above) that the median sales price has been aggressively climbing for multiple years. Five years ago (in 2017) the median sales price was $198,250... and it closed out 2022 just shy of $300K with a median of $299,912. This marks an 11% increase in the median sales price in 2022 after a 10% increase in both 2020 and 2021. Wow! This next one might surprise you. It surprised me, at least for a moment... 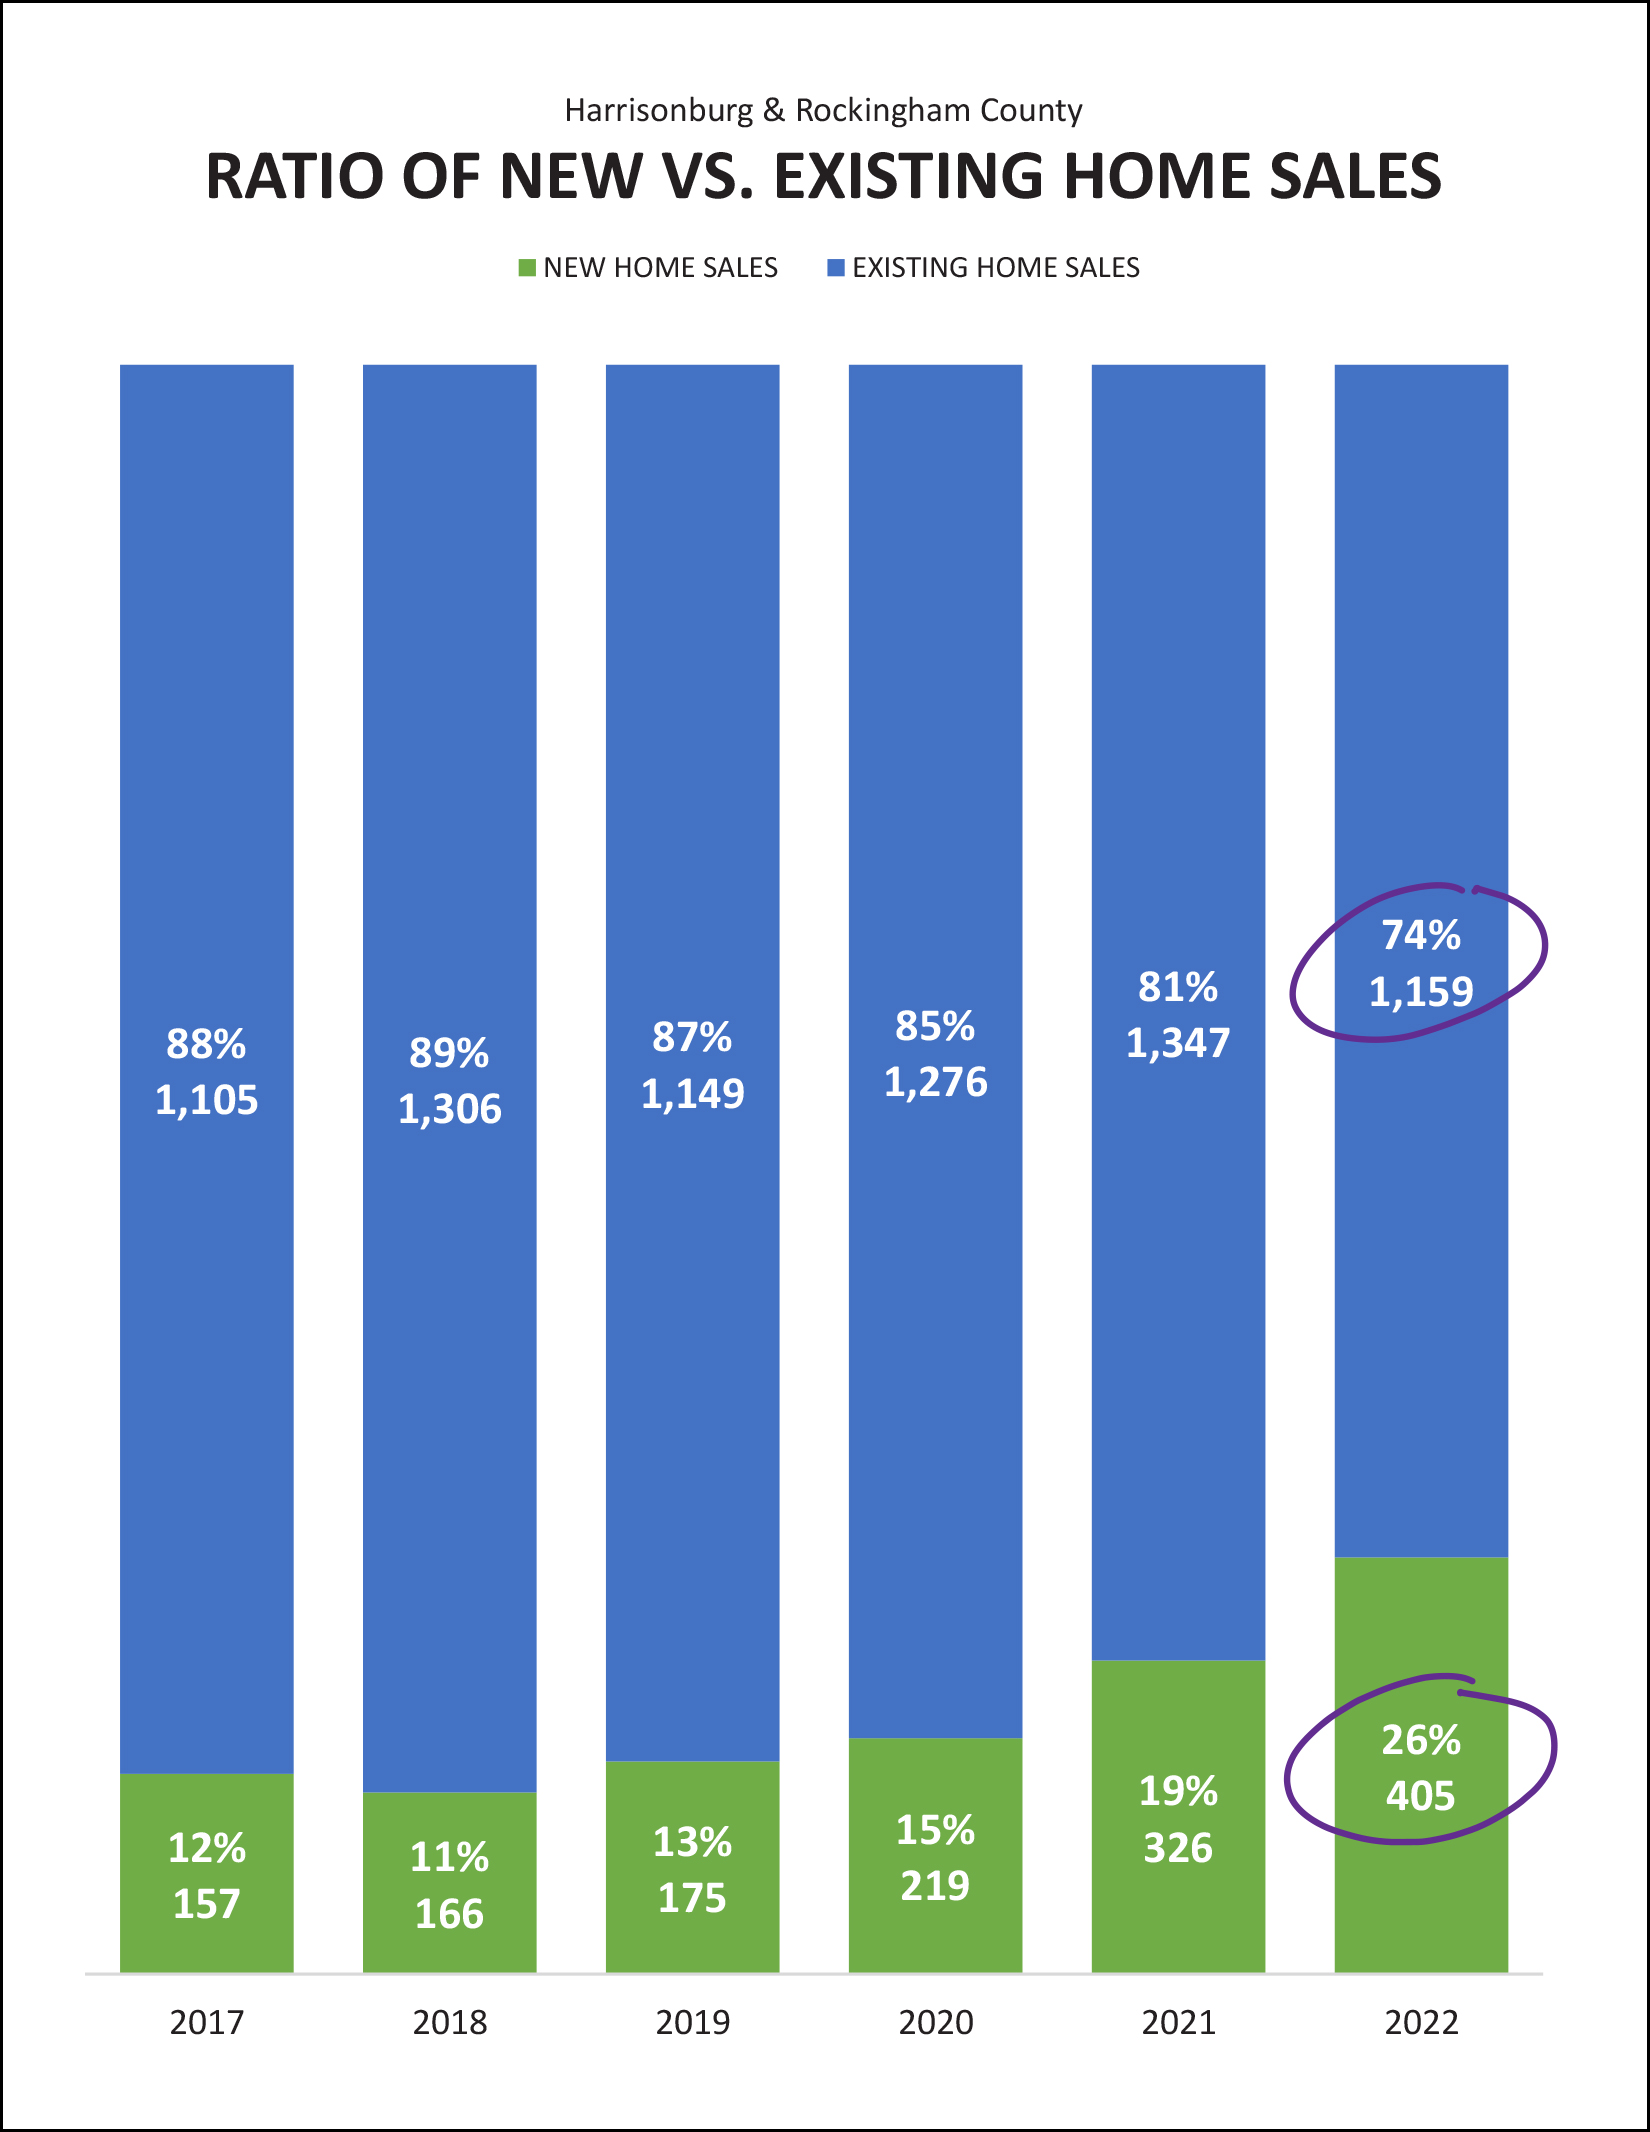 The 7% decline in home sales in 2021 was actually a much larger decline if we focus in on resale homes. There was actually a 14% decline in resale homes during 2022! We only ended up seeing a 7% decline in overall market activity because of the sale of new homes. We saw a 24% increase in new home sales in 2022. As a result (and as circled above) the balance between new home sales and existing home sales continues to shift with over a quarter of all home sales (26%) being new homes in 2022. I think there is a decent chance this ratio will be similar in 2023, or that we might see even more new home sales as plenty of homeowners will sit tight and enjoy their super low mortgage interest rate rather than selling their home. What comes next, I wonder... 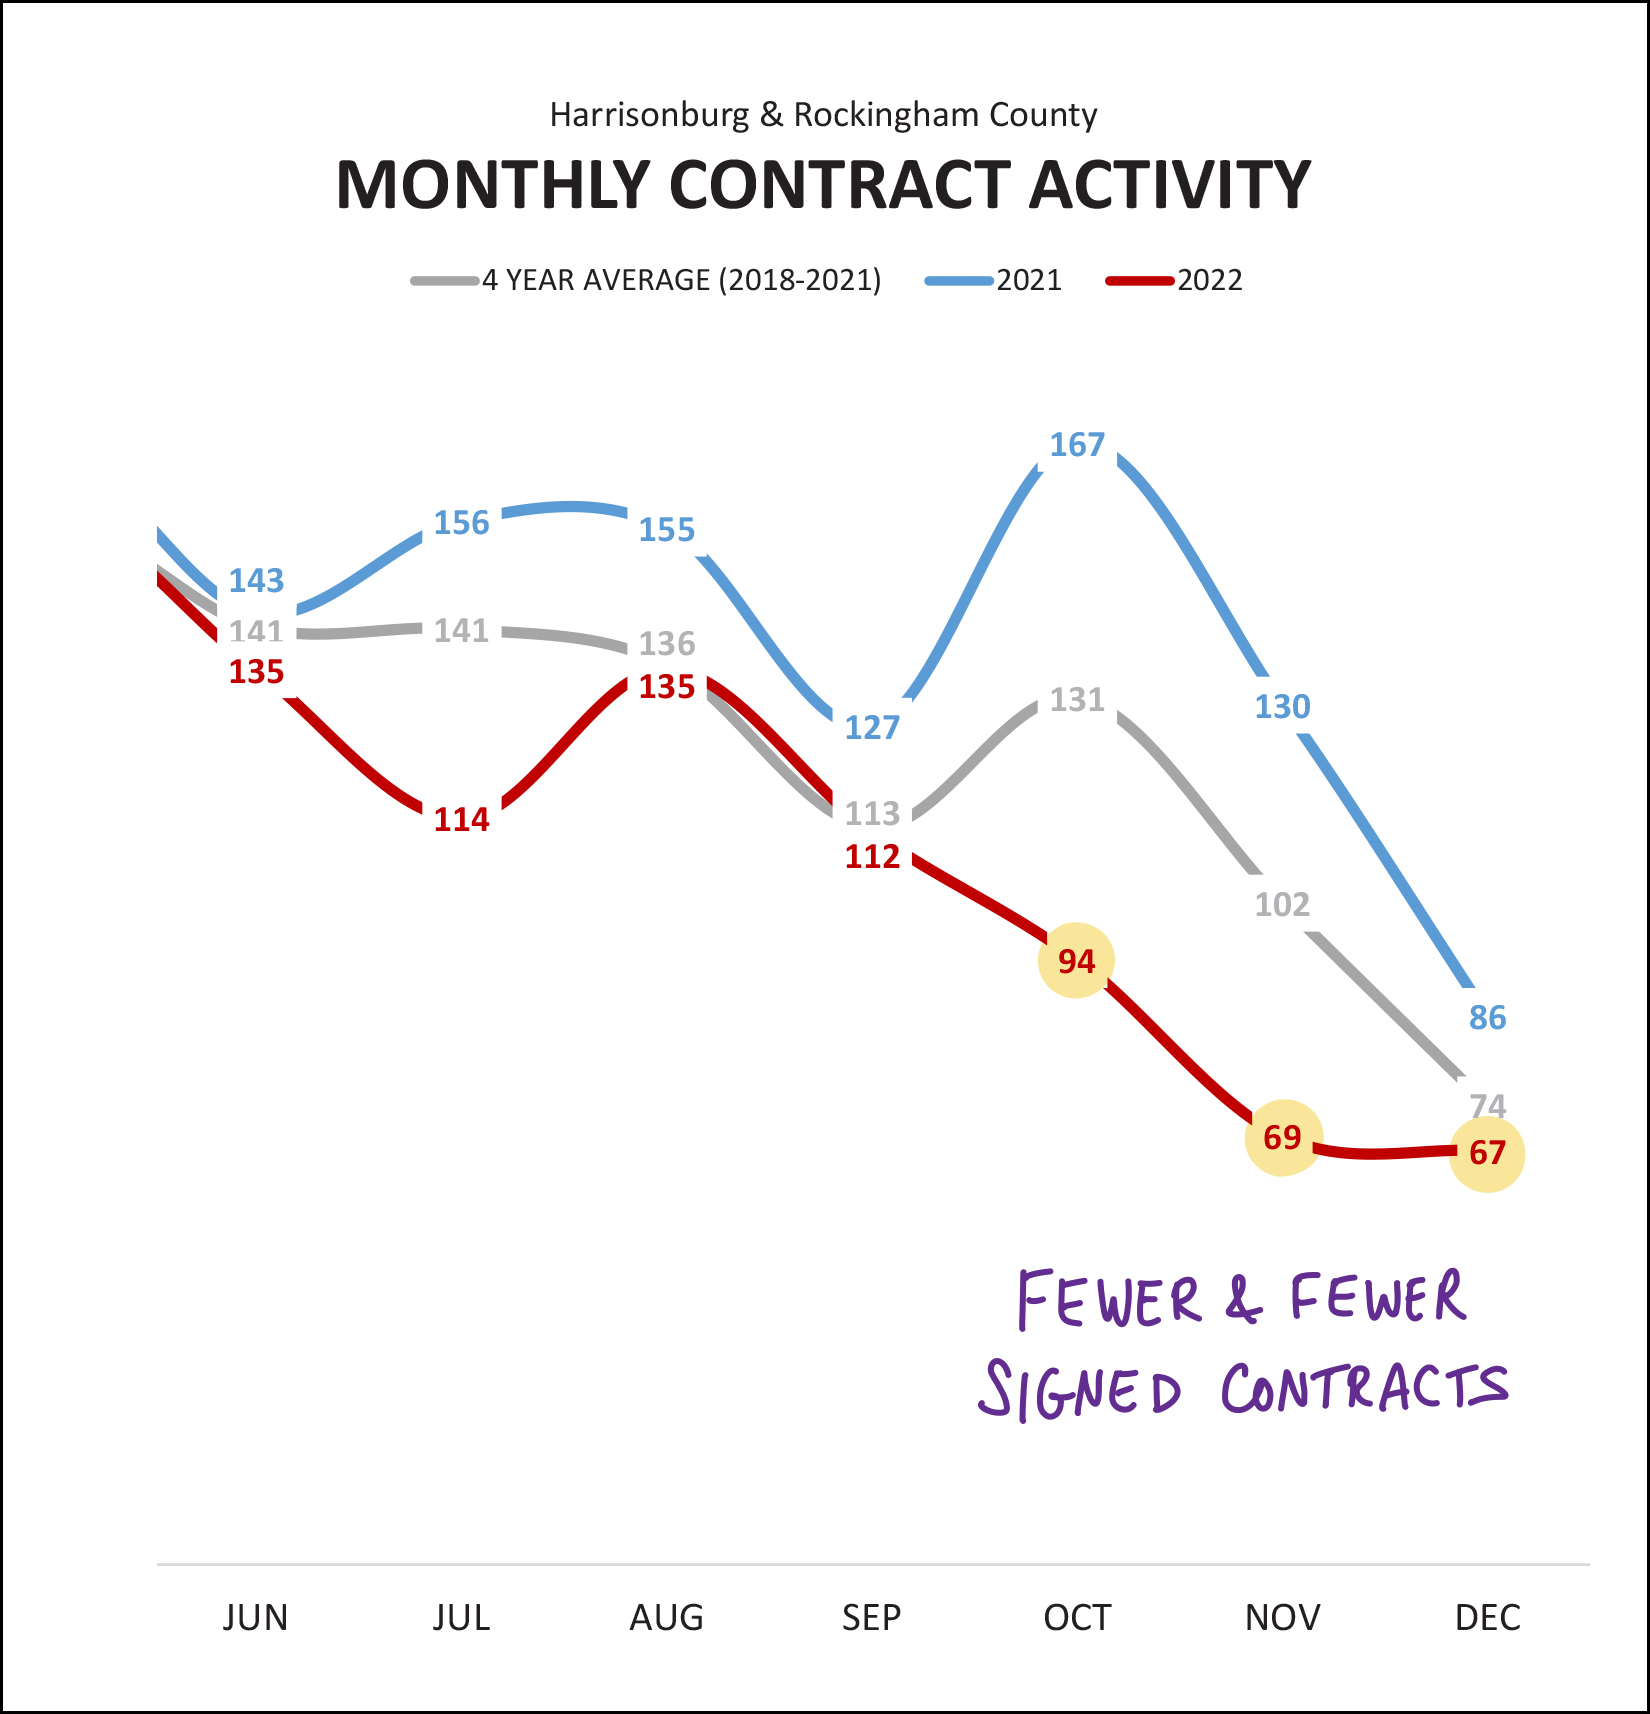 The graph above tracks how many contracts are signed (by buyers and sellers) each month... and here you can see that the slow down actually started halfway through 2022. Each month of contract activity in the second half of 2022 (red line above) was lower than the corresponding month in the second half of 2021 (blue line above) though the gap became much more pronounced in the last three months of the year. Interestingly, if we look at the typical November to December trend in contract activity per the grey line (four year average) we see that it is typical to see about 74 contracts in December... and December 2022 was only slightly below that with 67 contracts. Here's a new graph that provides a bit more insight into how many contracts are out there waiting to get to closing... 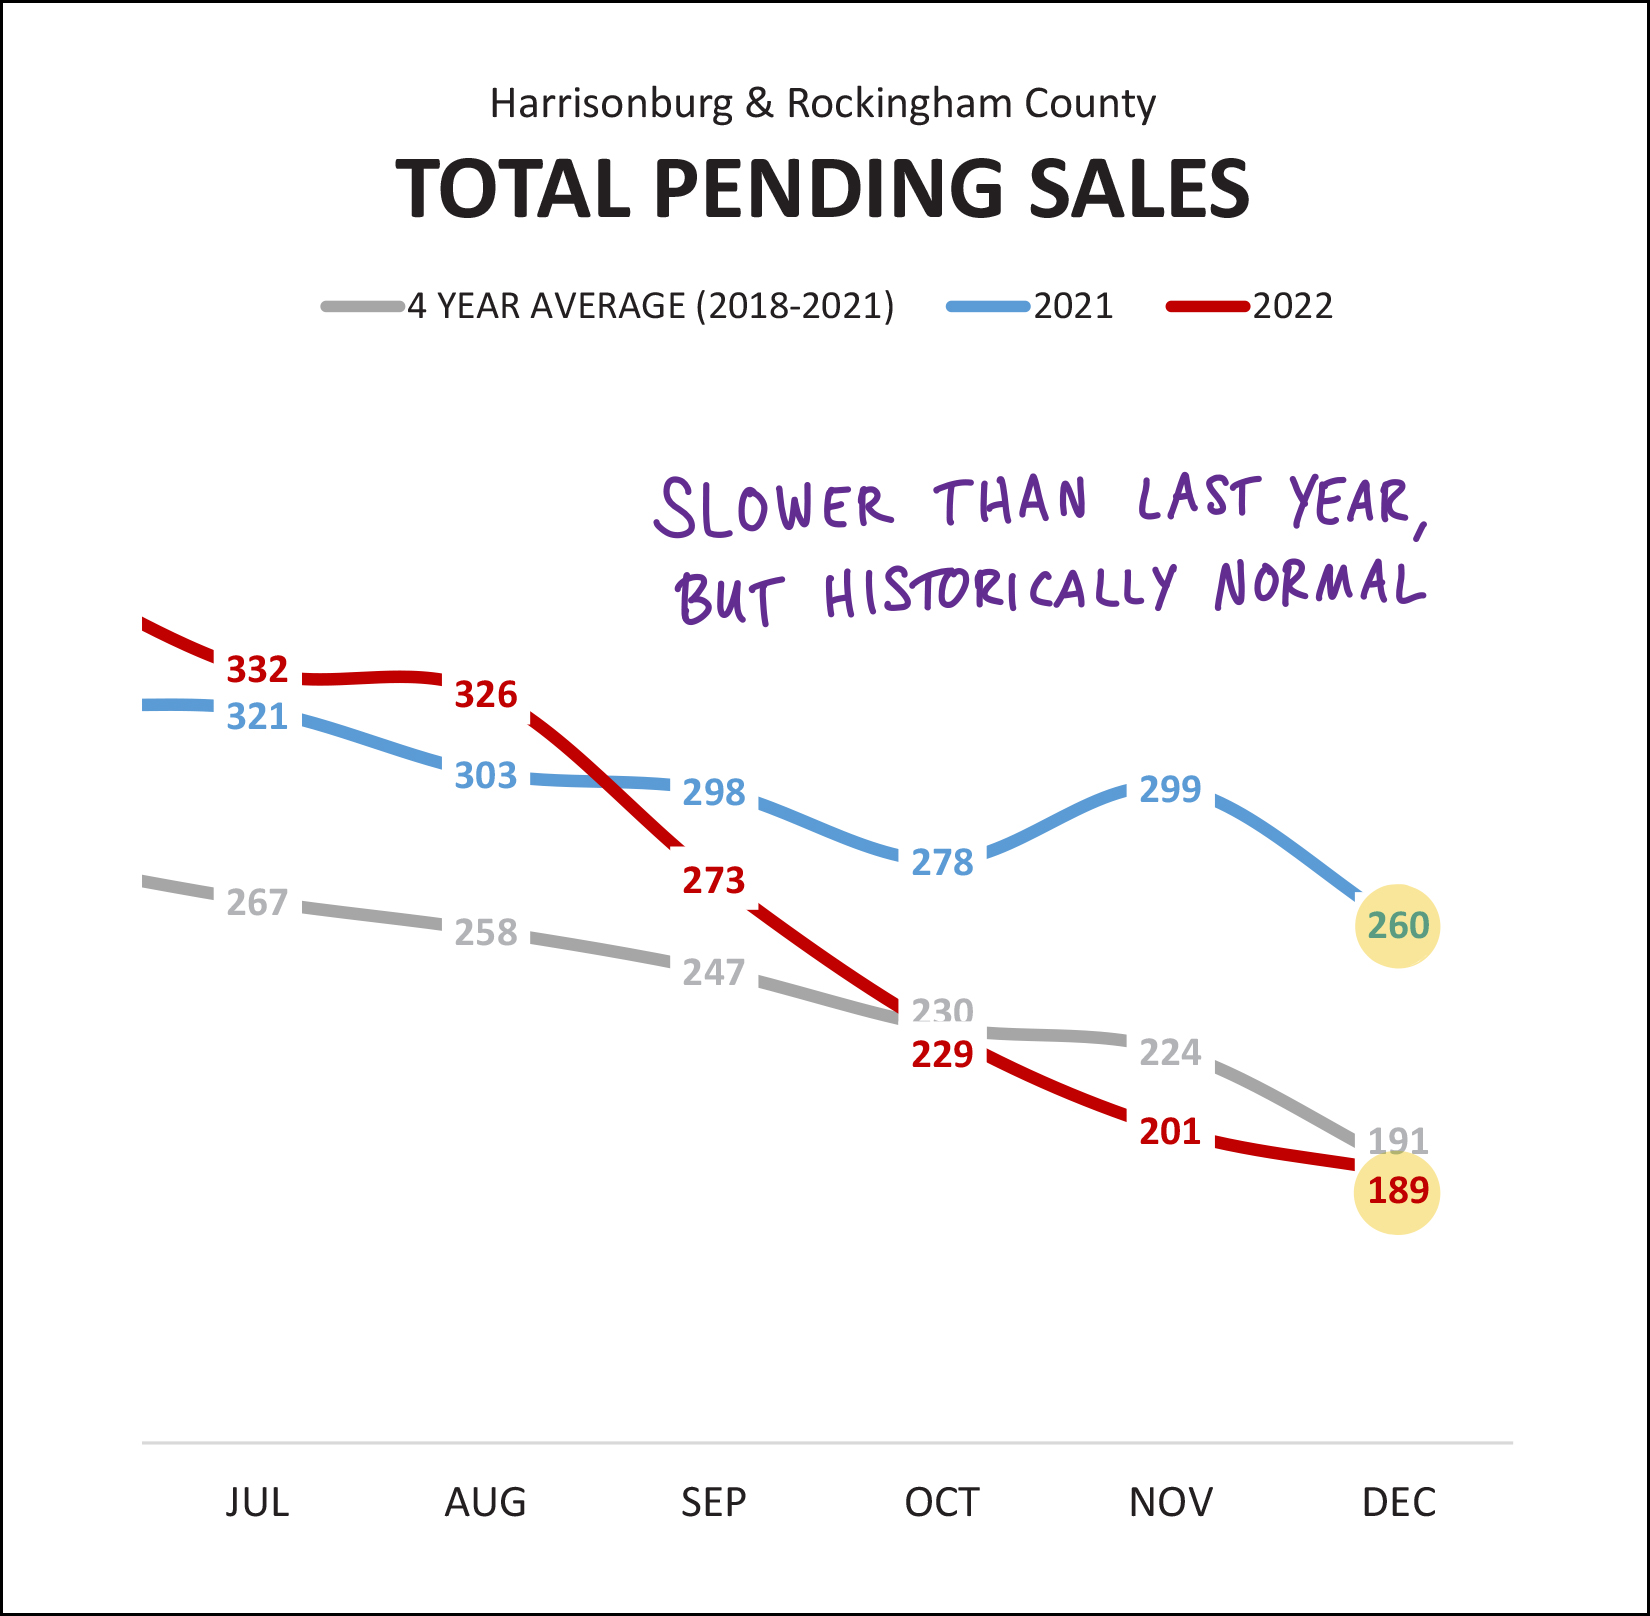 The graph above shows the number of properties that are pending (under contract) at the end of any given month. If you look at the second half of 2021 (blue line) you can see there were anywhere from 260 to 321 contracts pending from month to month. As we moved our way through 2022 the number of pending sales sank lower and lower... below that previous low of 260 all the way down to 189 pending sales at the end of the year. This graph (and the prior graph) would indicate that we will likely see a relatively slow month of closed sales in January and February. But again, looking a bit further back for context... the 189 pending sales at the end of 2022 is... just a smidgen below where we might have otherwise expected to be in a month of December. The anomaly here, it would seem, was the end of 2021 when things were still bonkers in the local real estate market due to super low mortgage interest rates among other factors. And how about those inventory levels -- they must be moving up given slower sales, right? 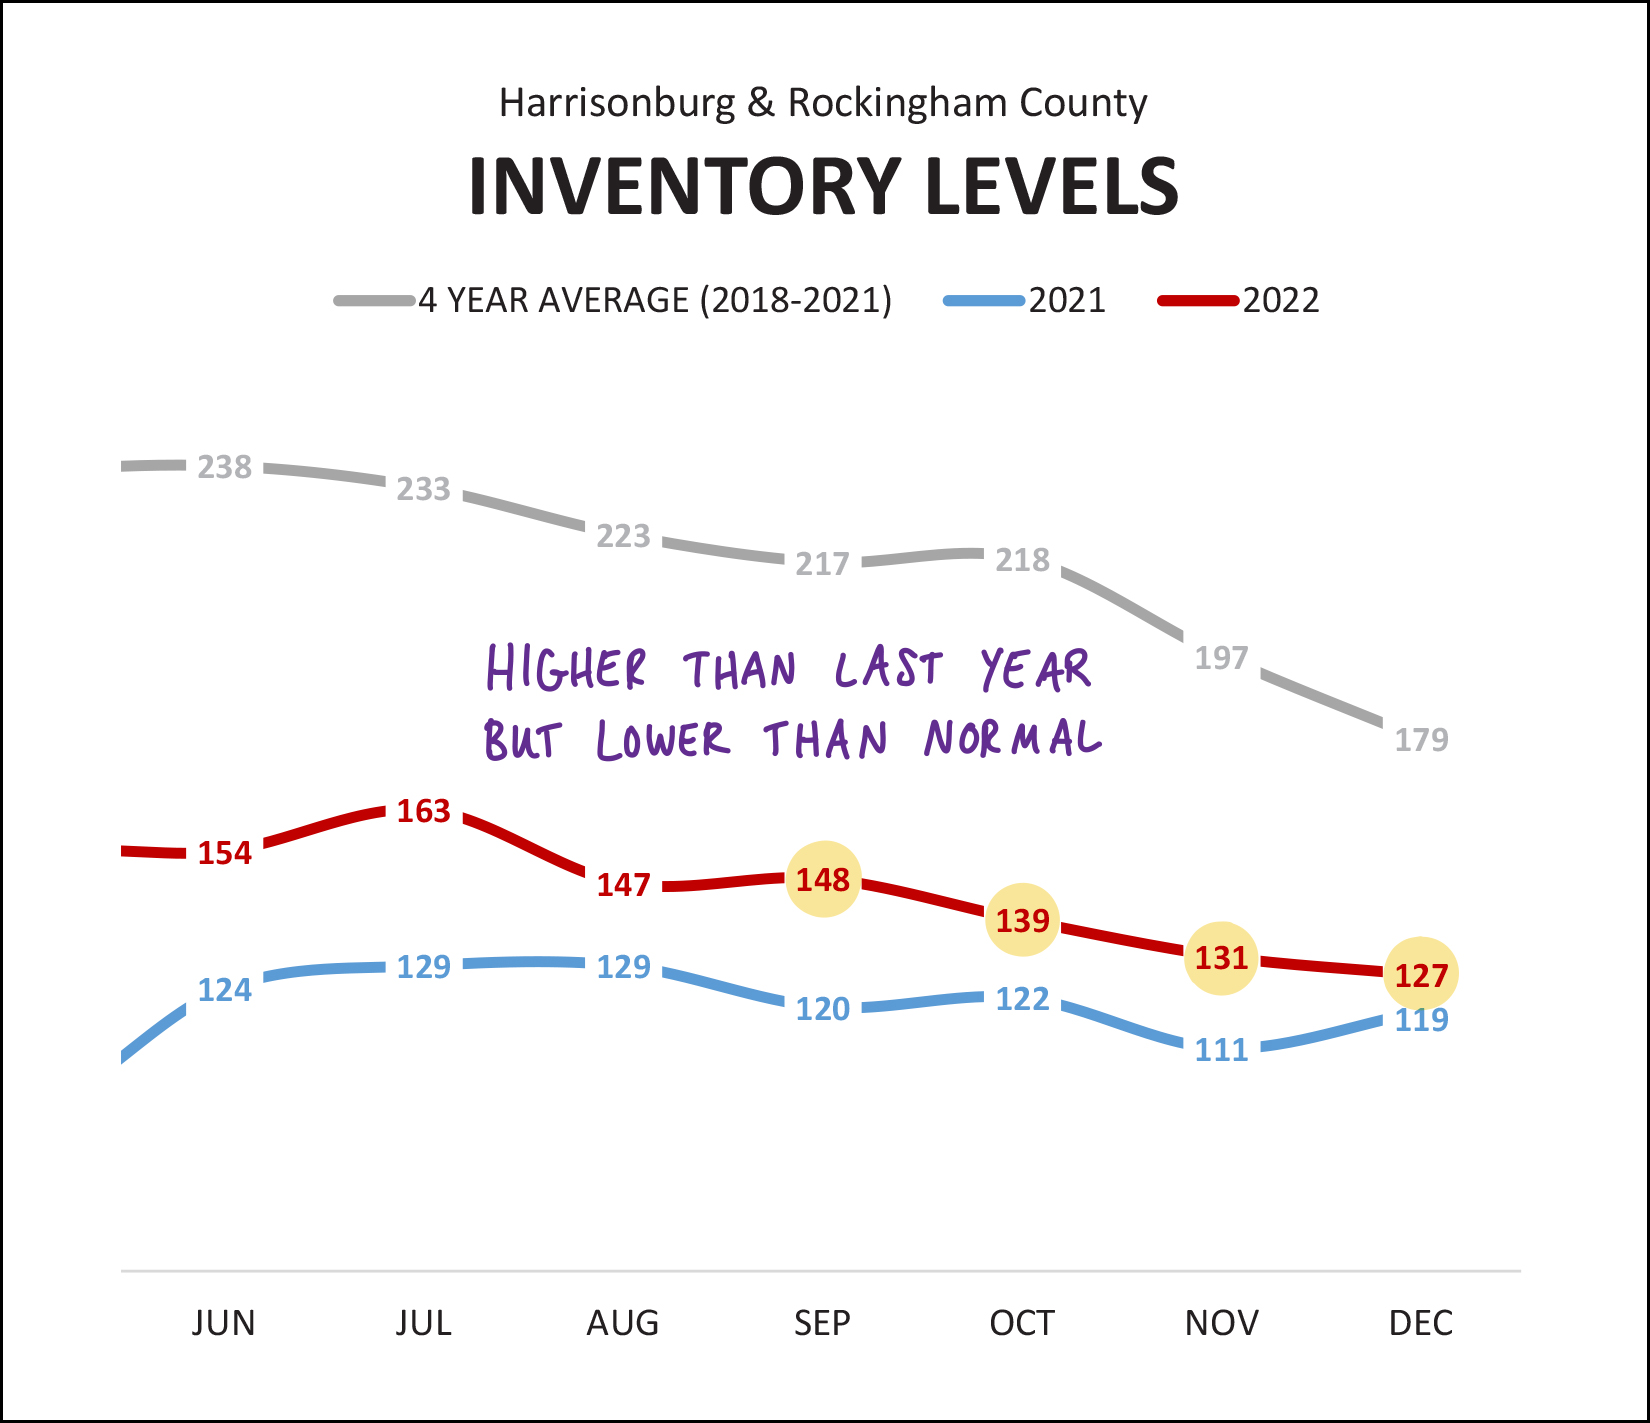 Well... maybe not. We closed out the year with 127 homes on the market in Harrisonburg and Rockingham County. Yes... this is a higher inventory level than one year prior when there were only 119 homes on the market... but it's not that much higher. Furthermore, even though the inventory levels in 2022 (red line above) were higher than in 2021 (blue line) they were still well below (!!!) the average of 2018 through 2021. These are still times over very low inventory... much to any home buyer's dismay. Oh, and how quickly are homes selling now? Slower, probably, right? 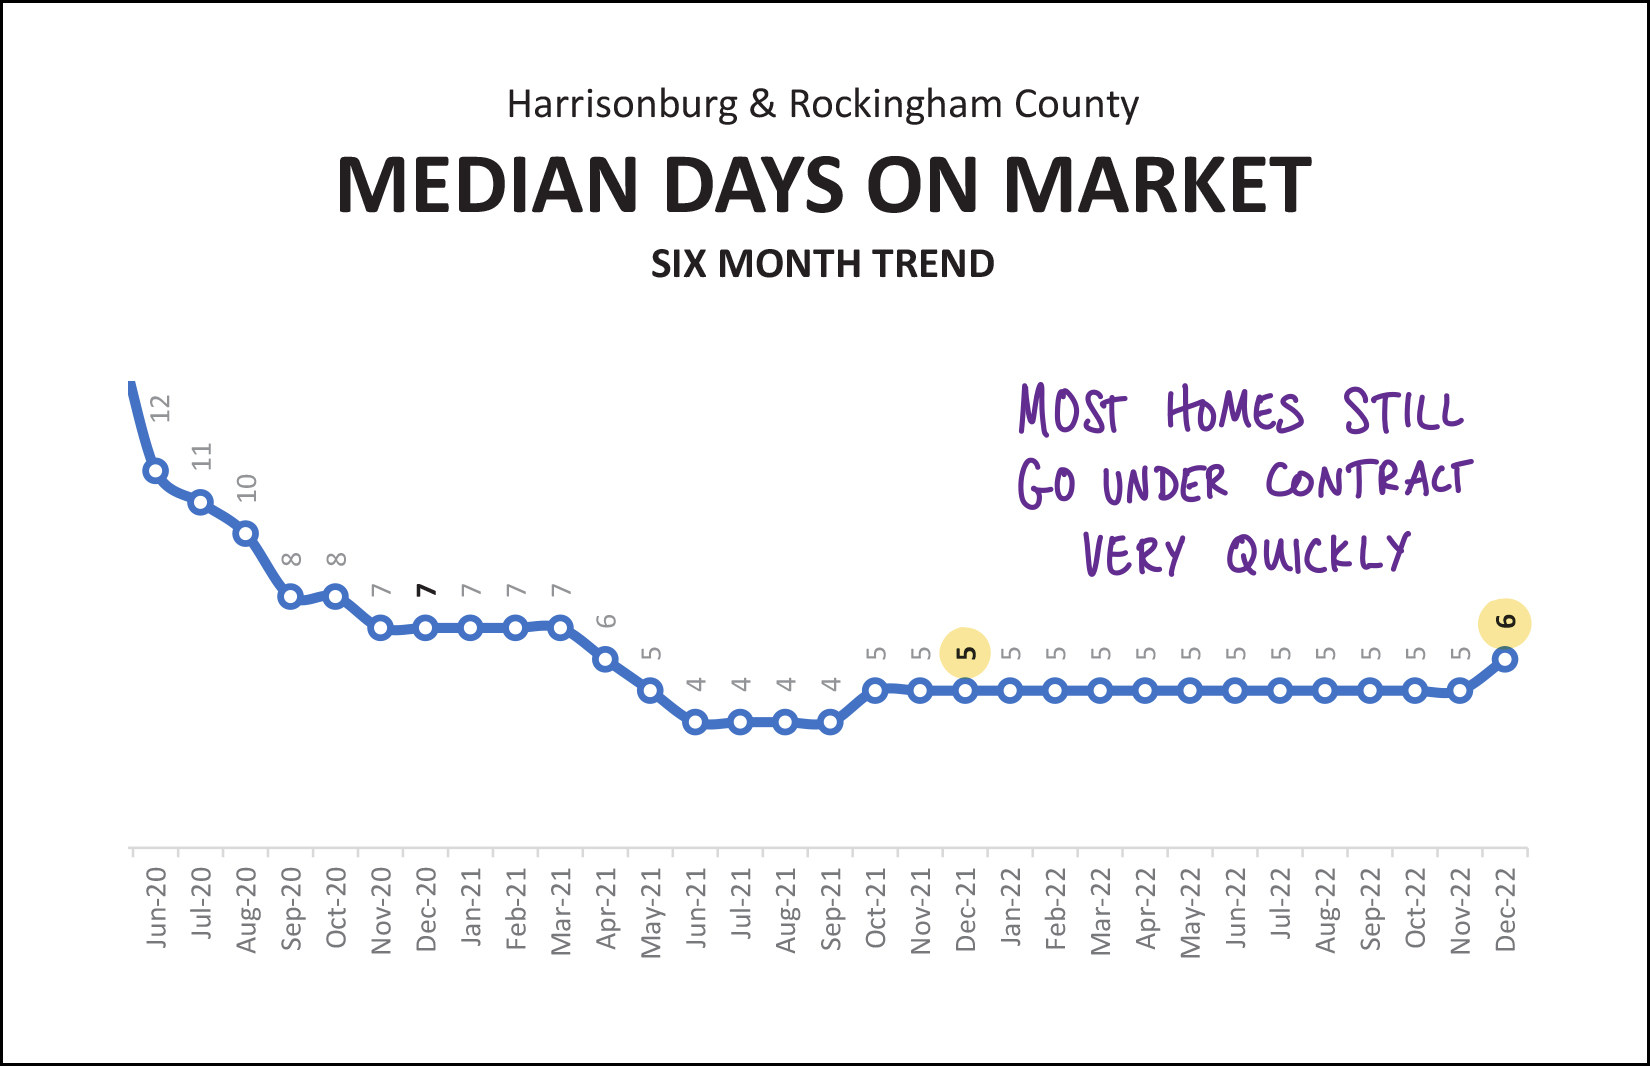 Not so much. The graph above shows the median days on market -- how quickly properties go under contract after being listed for sale -- within a six month timeframe. For over a year this metric stayed right at five days... so as to say that half of homes were under contract within five days and half took longer than five days. That has risen to... six days now. Clearly, not a significant shift, but perhaps we will see it shift further as we move forward. Of note, the median days on market two years ago was seven days... but that was after dropping steadily from double digits the summer prior. Interest rates, interest rates, all you talk about is interest rates... 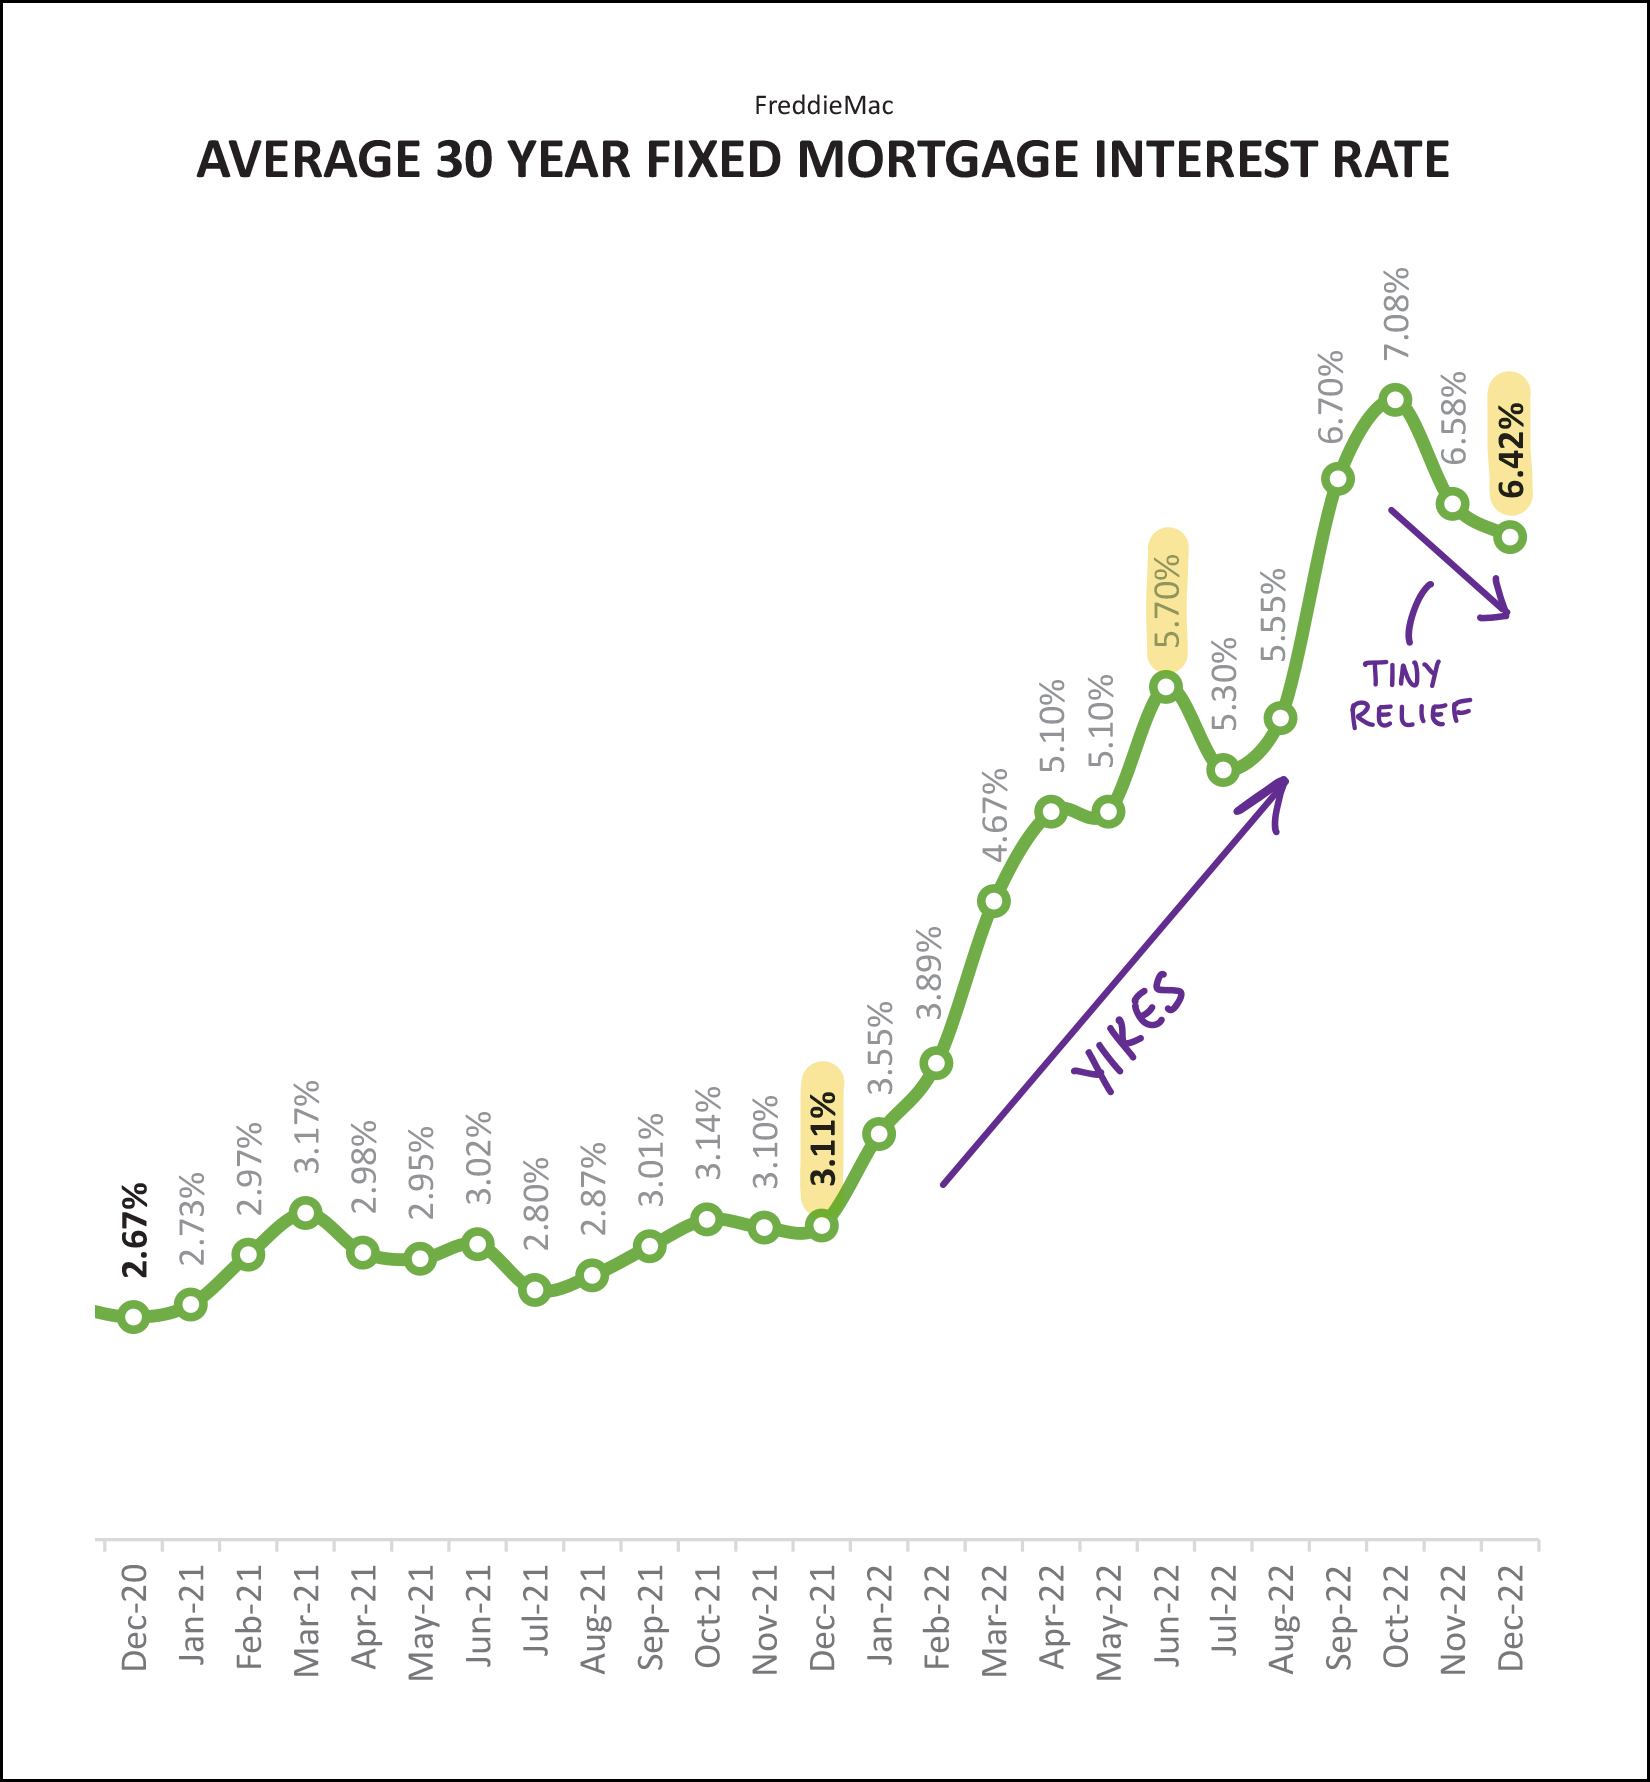 Well, yes, that's true. I have talked a lot about mortgage interest rates this month (and over the past year) because they have been rising, quickly. A year ago (as shown above) the average mortgage interest rate (on a 30 year fixed rate mortgage) was only 3.11%. We closed out 2022 with an average of 6.42%. Thankfully, these rates have continued to decline a bit further in the first few weeks of 2023... but the cost of financing a home purchase is still MUCH higher now than it was a year ago. And yes... these higher mortgage interest rates directly contributed to the slow down in home sales in the second half of 2022. Well folks, that's all for today. I hope the analysis above provides you with a bit more insight into all that has transpired in our local housing market in 2022... and a few thoughts as to where things might be headed in 2023. If you are thinking about selling or buying a home in 2023, I would be happy to assist you with that process. Yes, I spend a good bit of time analyzing our local housing market to educate our local community -- but the majority of my time is spent helping individual home sellers and home buyers. Feel free to reach out to start that conversation by emailing me or texting or calling me at 540-578-0102. I'll provide another update in about a month -- looking back at the first full month of 2023. Until then, I hope you and your family stay healthy and enjoy (???) the constant fluctuations between winter and spring temperatures we seem to be experiencing this year. ;-) Happy New Year! P.S. You can review a few more charts and graphs with further analysis of our local housing market through the close of December 2022 here. | |
Home Sales Slow In November 2022, But Prices Keep On Rising |
|
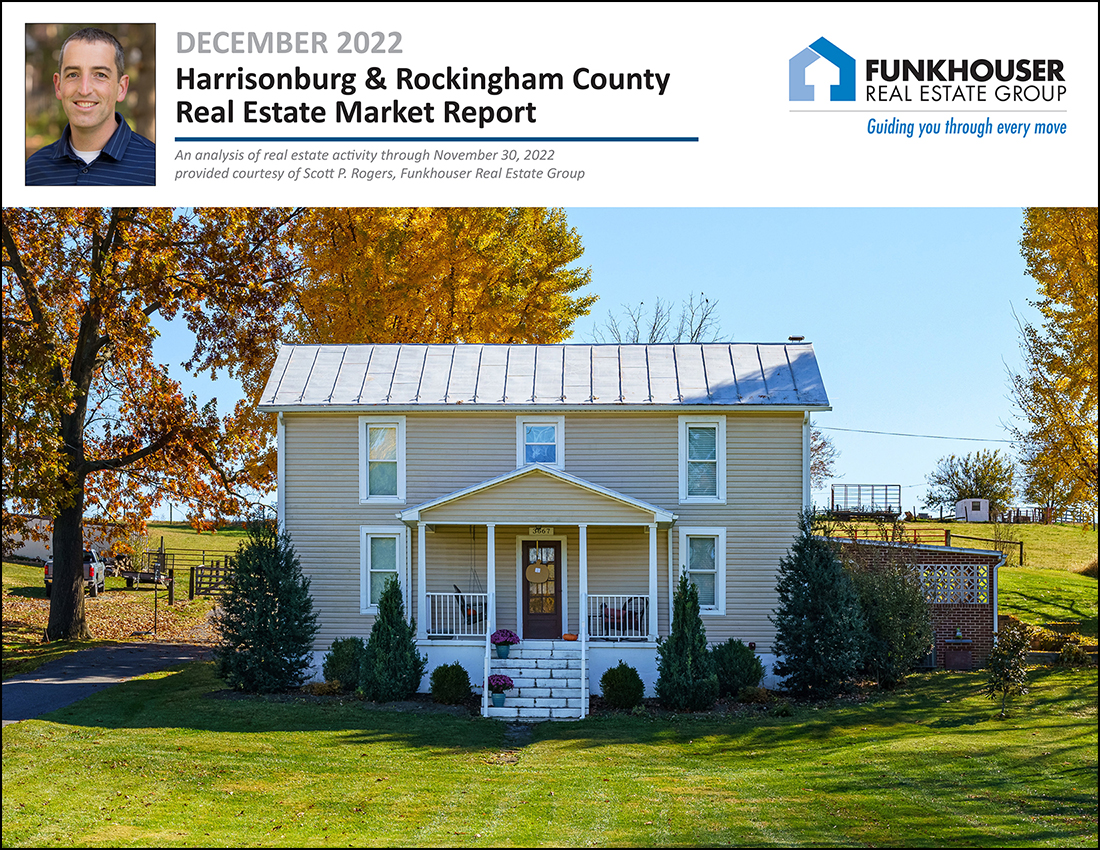 Happy Tuesday morning, friends! Winter is upon us. The holidays are upon us. I hope you have been enjoying the variety of Christmas light displays in and around Harrisonburg. Shaena and I, with several other family members, greatly enjoyed visiting the "Winter Wander" light display at the Boar's Head Resort in Charlottesville a few nights ago. Next time maybe we'll have to dine there or stay over as it was quite lovely! Check out the lights at Winter Wander yourself between now and January 7th...  Before we move onto the real estate data we're all waiting for, each month I offer a giveaway, of sorts, for readers of this market report, highlighting some of my favorite places (or things) in Harrisonburg. Recent highlights have included Walkabout Outfitter, Bella Gelato and the JMU Forbes Center. This month, I encourage you to go check out Grilled Cheese Mania on Main Street in Harrisonburg. If you find me at GCM, you'll likely find me enjoying the Triple Lindy with a side of Miss Tess' Tomato Mac. :-) Click here to enter to win a $50 gift certificate to Grilled Cheese Mania! Finally, take a few minutes to check out this month's featured home... a spacious, remodeled farmhouse on an acre in the Turner Ashby district with some excellent outdoor amenities located at 3667 Dry Hollow Road! Now, let's take a look at the latest data in our local real estate market... 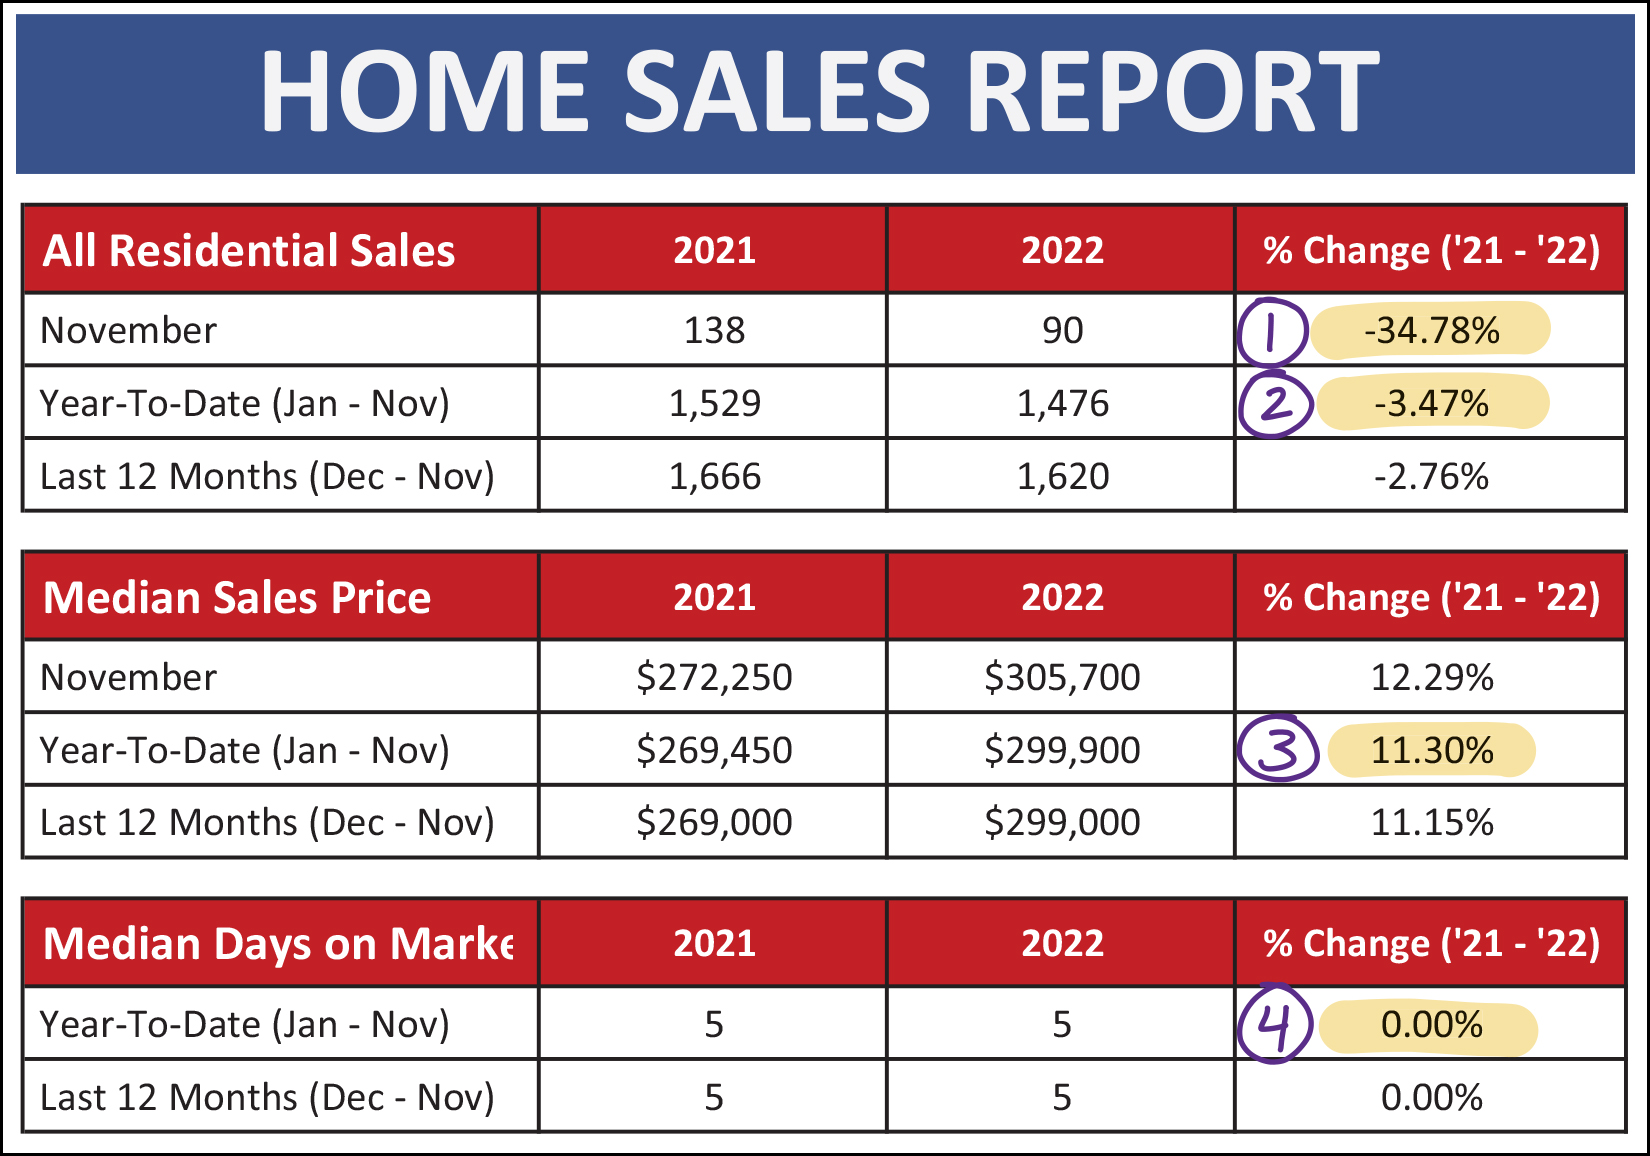 Let's drive right into a few of the main metrics of our local housing market outlined above... [1] Home sales slowed considerably this November compared to last November... declining 35% from 138 sales to 90 sales. You'll see a clearer (and more startling) visual of that shortly. [2] This significant decline in the number of home sales in November 2022 resulted in an overall 3.5% decline in 2022 home sales as compared to 2021 home sales when viewing the first 11 months of the year. [3] But yet... the median sales price in our area keeps on rising, up 11.3% from a year ago to $299,900 when looking at the first 11 months of 2022. [4] Furthermore, homes are (as a whole) still selling just as quickly... with a consistent median of five days on the market thus far in 2022, which matches the speed of home sales a year ago. Now, that startling visual of the November 2022 dip in home sales... 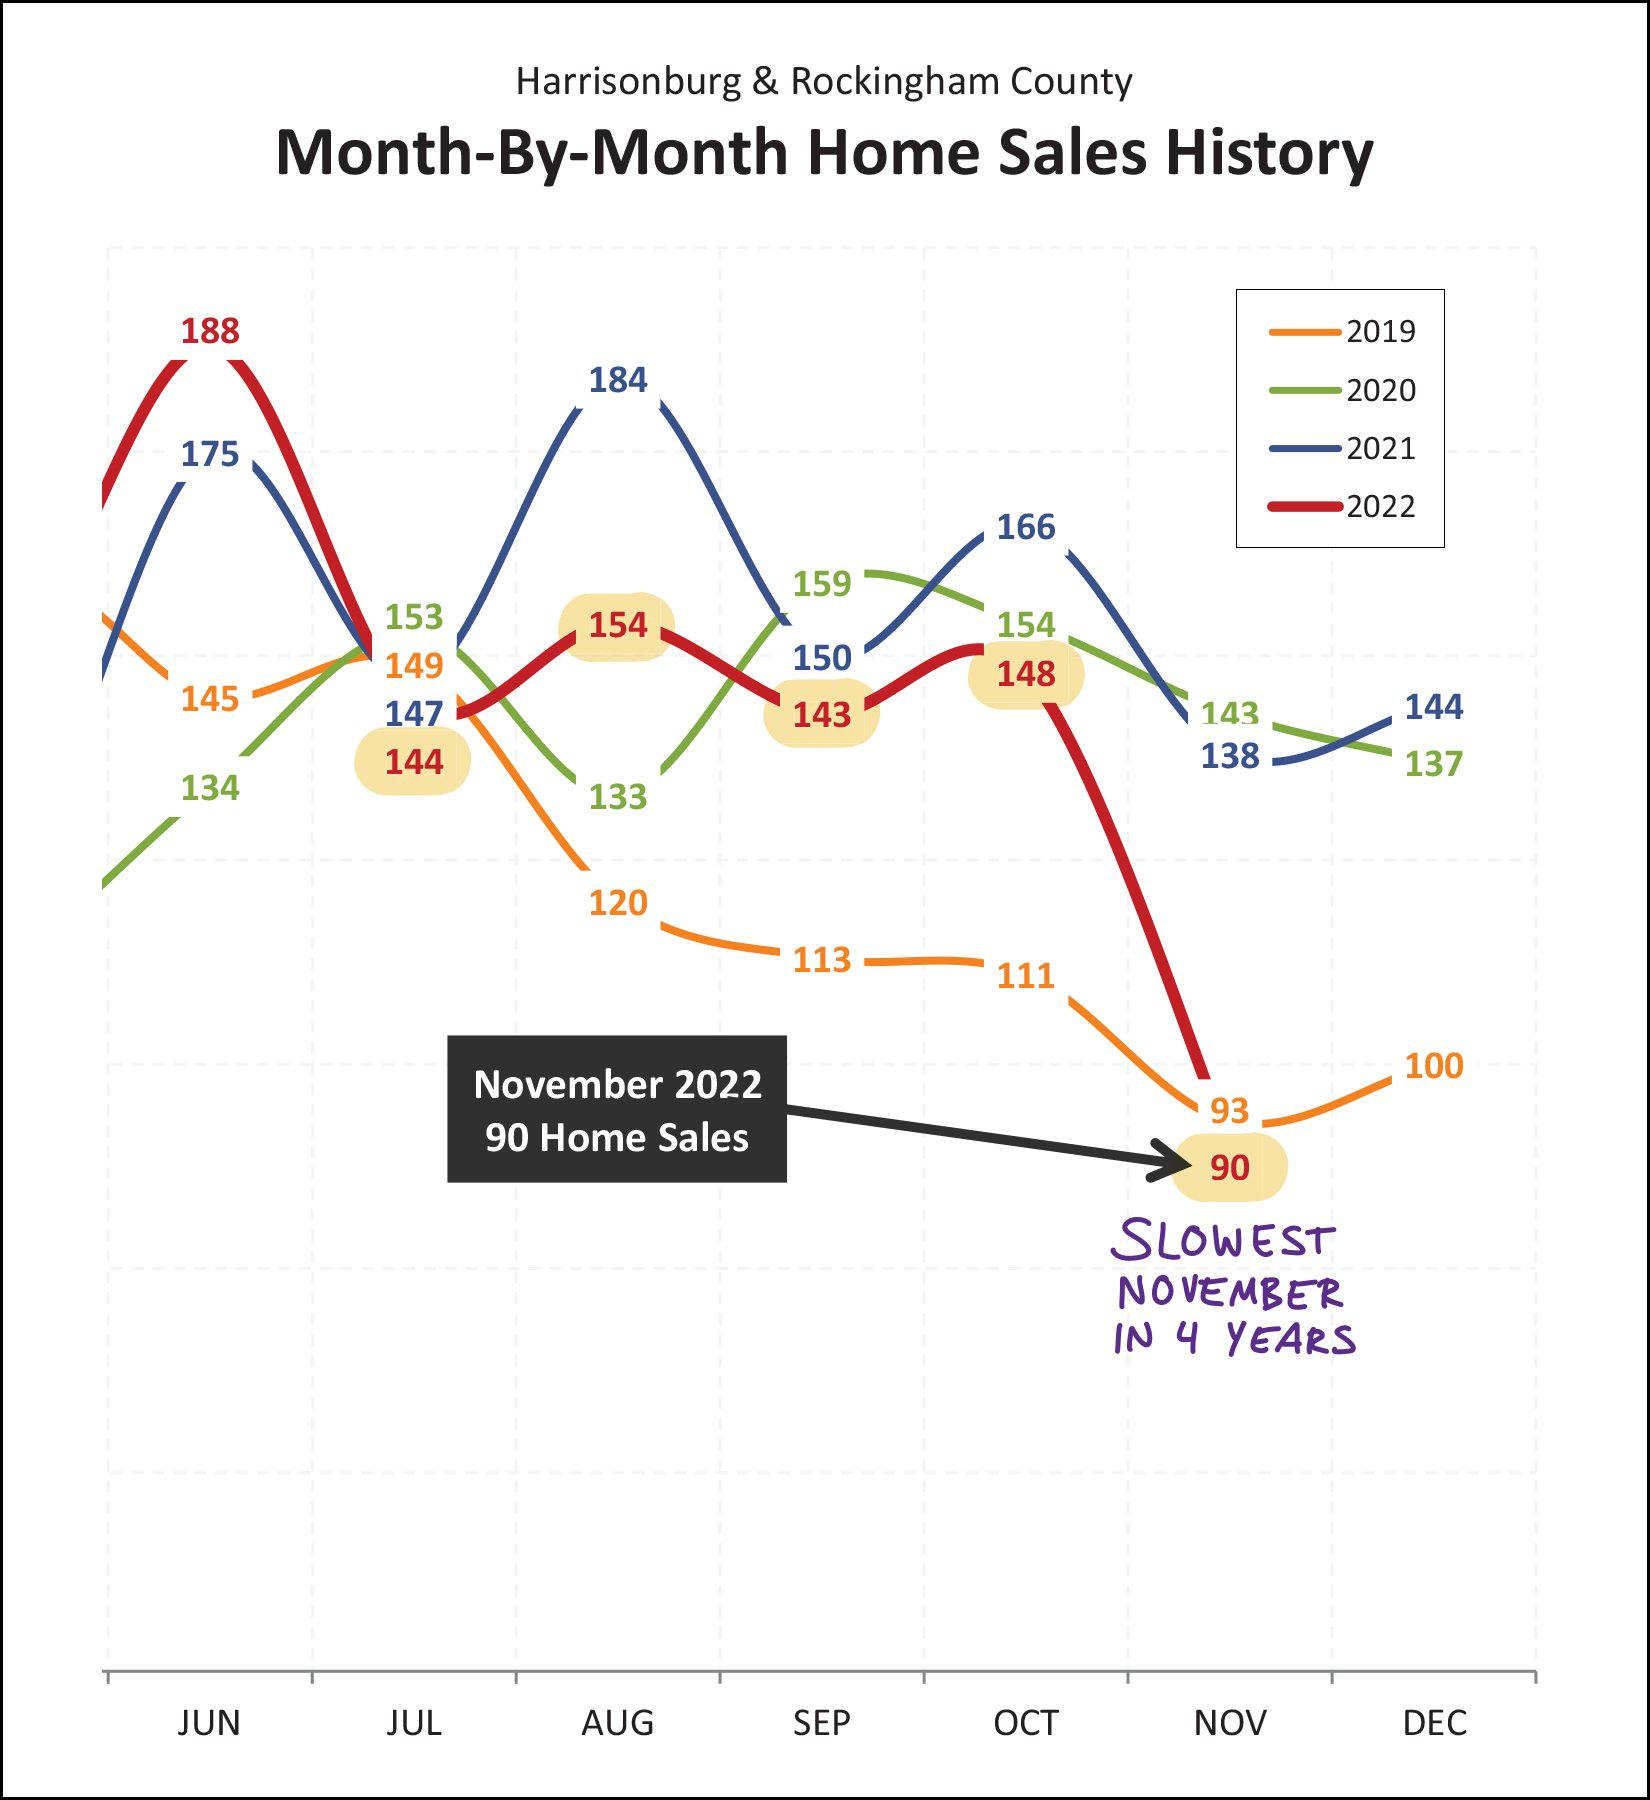 Lots to note regarding the graph above... [1] We saw slower (fewer) home sales in each of the four months leading up to November. This was not altogether surprising, as mortgage interest rates have been steadily rising throughout 2022. [2] Home sales really (!!!) slowed down in November 2022... dipping down to 90 home sales as compared to 138 in the same month last year. [3] The 90 home sales this November is not actually that different than the 93 seen back in November 2019. [4] The past two years (2020 and 2021) may very well be anomalies given that they were during the Covid induced overheating of the local real estate market. If we look at the five Novembers prior to 2020 (thus, 2015-2019) we'll find an average of 94 home sales in November. So... home sales dropped significantly in November 2022. That's somewhat surprising, as it finishes off a long, multi-year, run of a super exuberant local housing market. It's also not that surprising, given rising mortgage interest rates, and given what usually happens in November if we're not in Covid times. As we'll see below, the temporary (crazy) boom in home sales brought on by Covid and super low mortgage interest rates may be coming to an end... 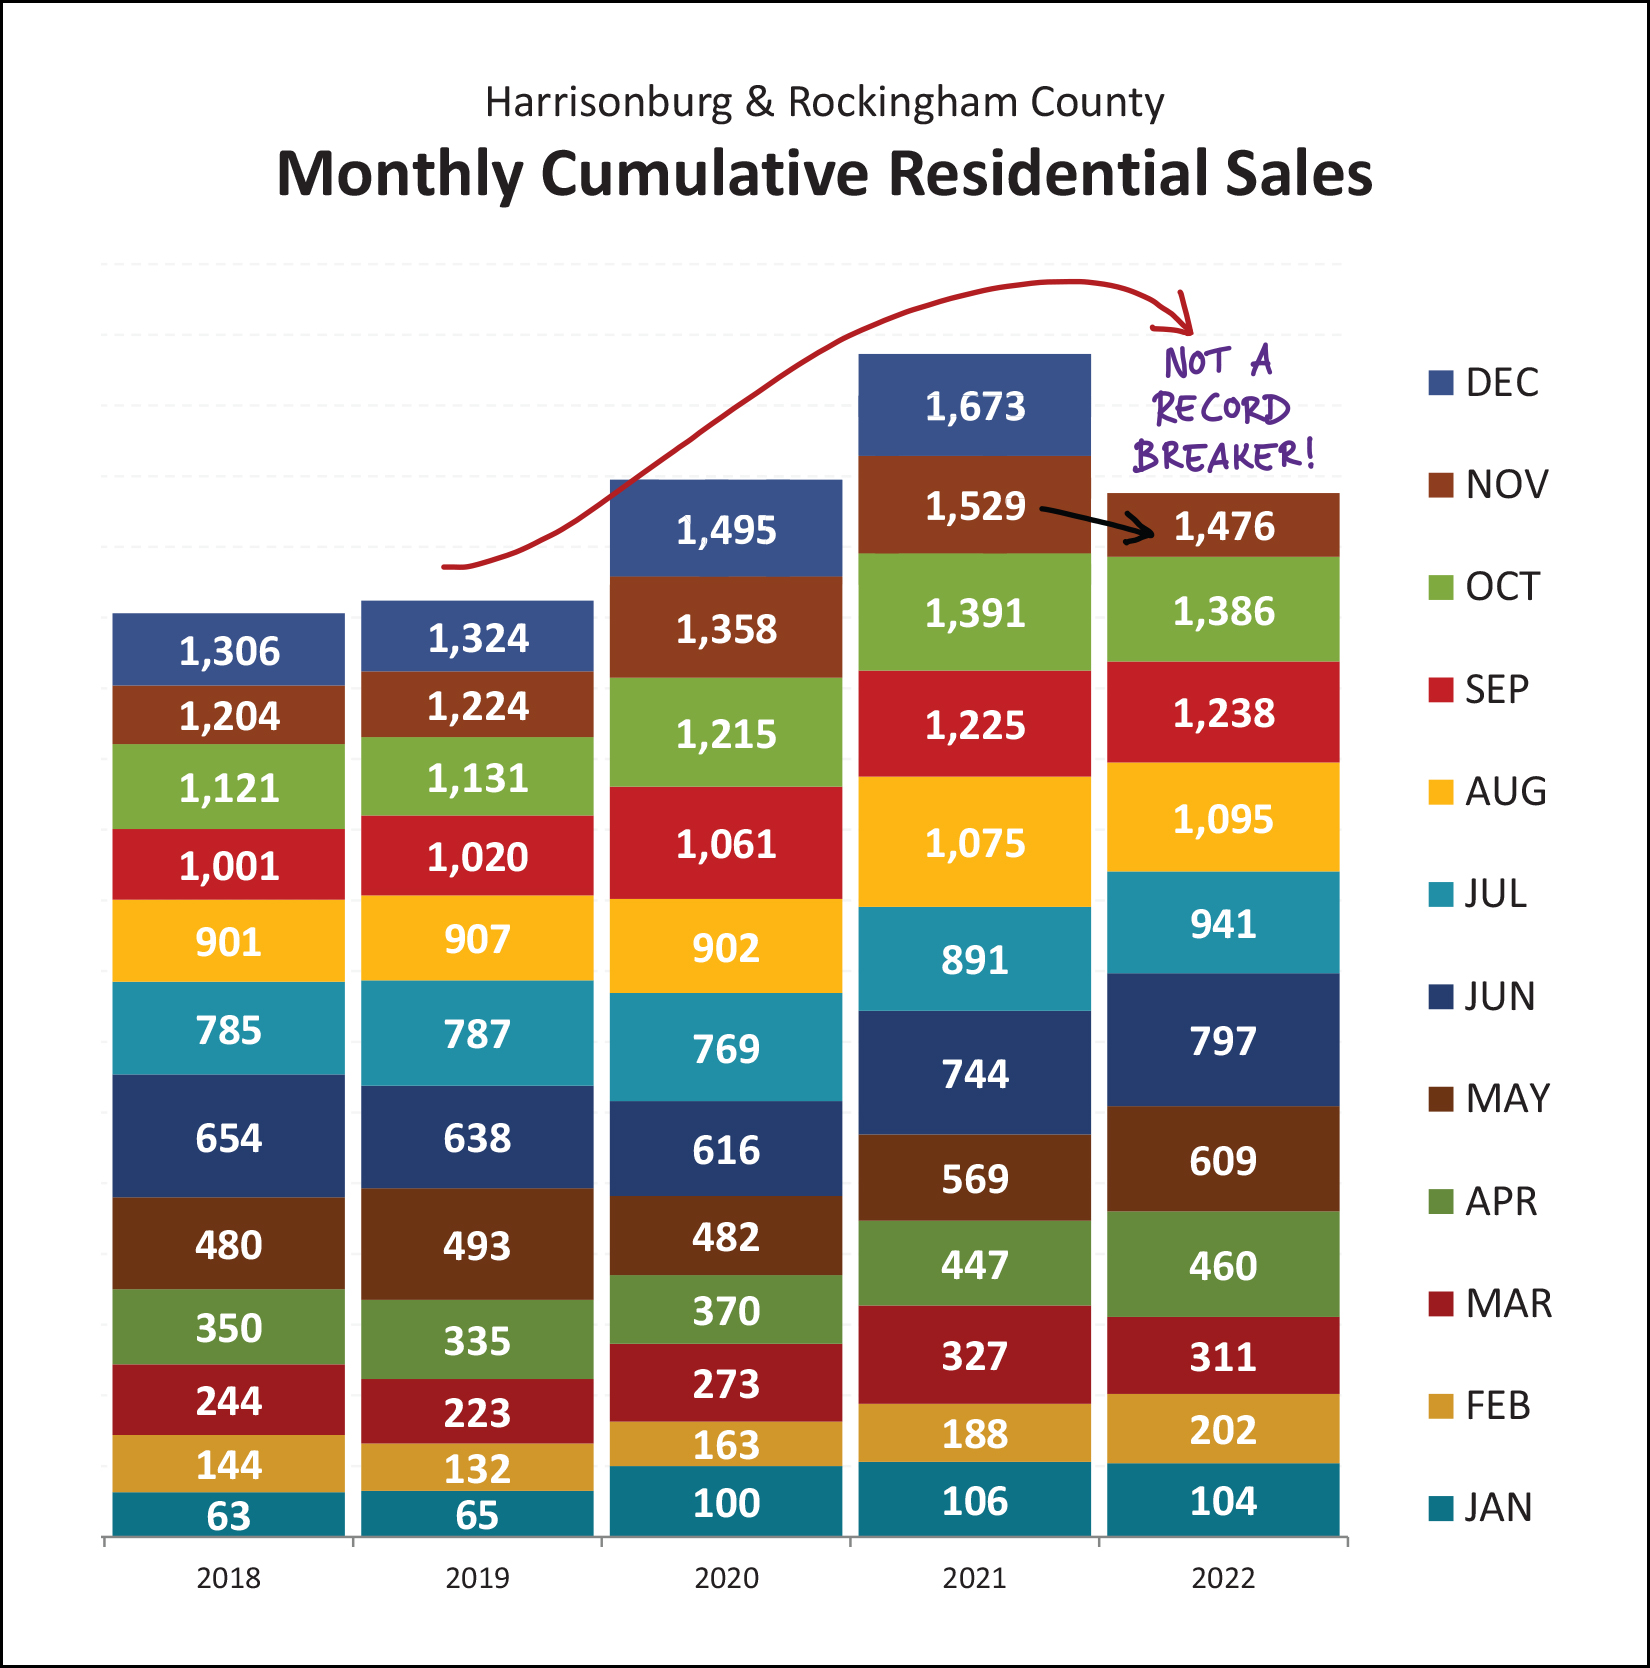 Prior to Covid (2020-2021) we had been seeing a relatively consistent 1300-ish home sales per year. Then, the market went crazy during 2020 and 2021 and home sales approached 1500 sales in a year, and then almost reached 1700 sales in a year. That string of two record breaking years in a row... won't continue in 2022. All the way up through September 2022, it was seeming that we'd have yet another record breaking year this year. But 2022 fell slightly behind in October, and even further behind in November. Looking ahead, it seems likely that 2022 will end up being the second strongest year of home sales ever in Harrisonburg and Rockingham County... just behind 2021. Looking at things from a slightly longer term perspective, we can see yet again how the local real estate market is slowing a bit after having peaked in 2021/2022... 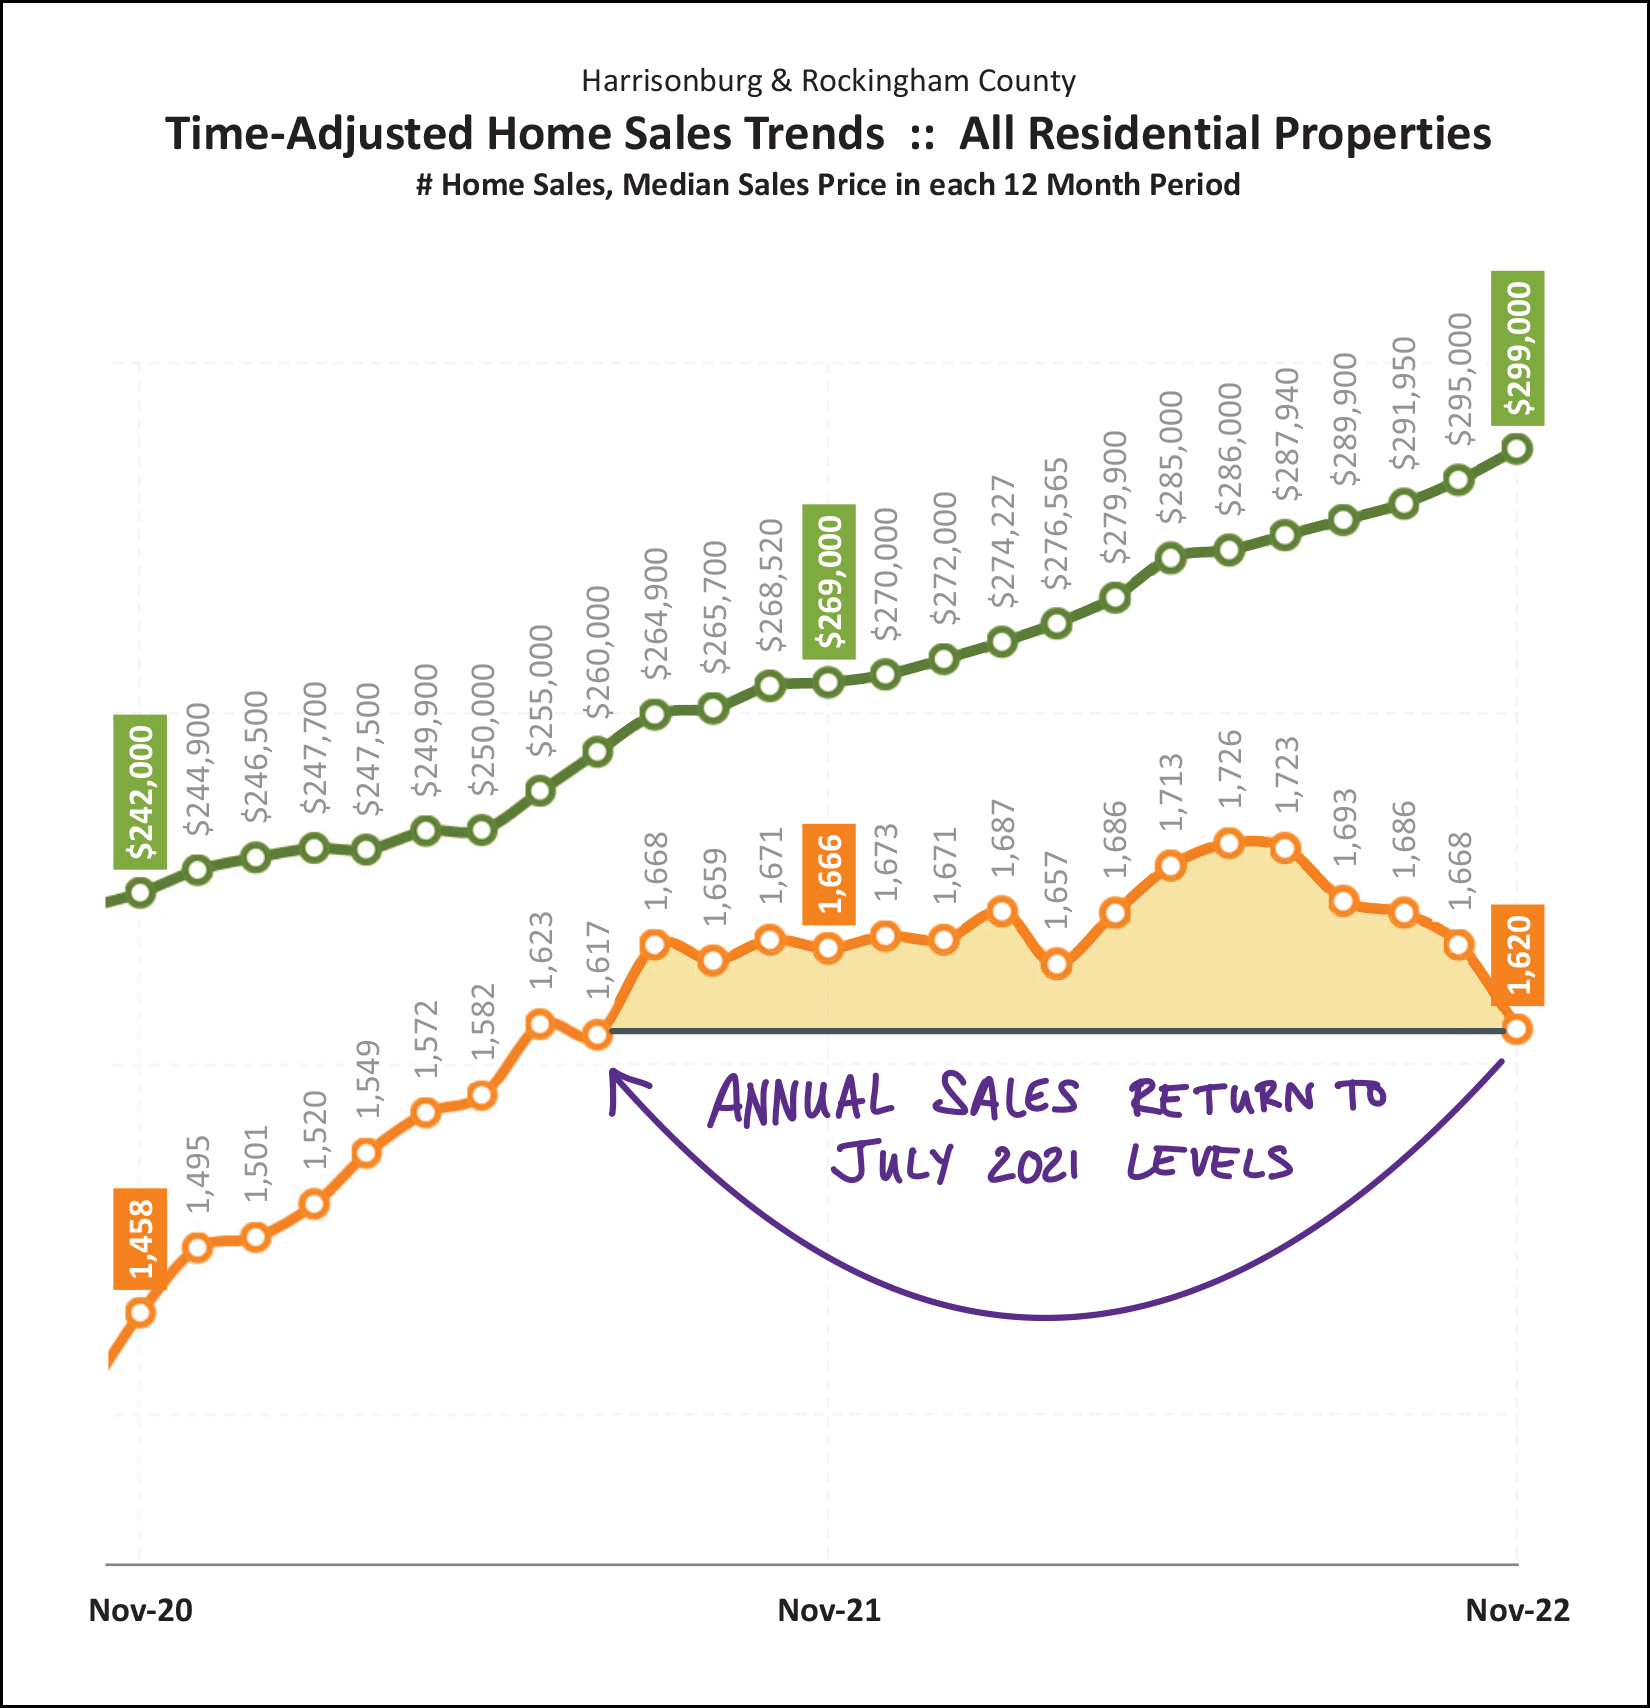 A year and a half ago (ish) we were seeing home sales at an annual pace of 1,617 sales per year... back in July 2021... which included sales from August 2020 through July 2021. Now, we're seeing home sales at an annual pace of 1,620 sales per year... which includes sales from December 2021 through November 2022. So, the market has retreated a bit... with fewer sales per year now than we've seen for the past year and a half-ish. This was highly predictable given rather dramatic increases in mortgage interest rates. It is somewhat surprising, however, that the decline in annual sales has been as small as it has been given how much mortgage interest rates have increased. The pace of annual sales peaked at 1,726 sales... and we have only seen a 6% decline from that peak... to 1,620 sales per year. Now, then, given that home sales are slowing, we're almost certainly seeing inventory levels rising, right? 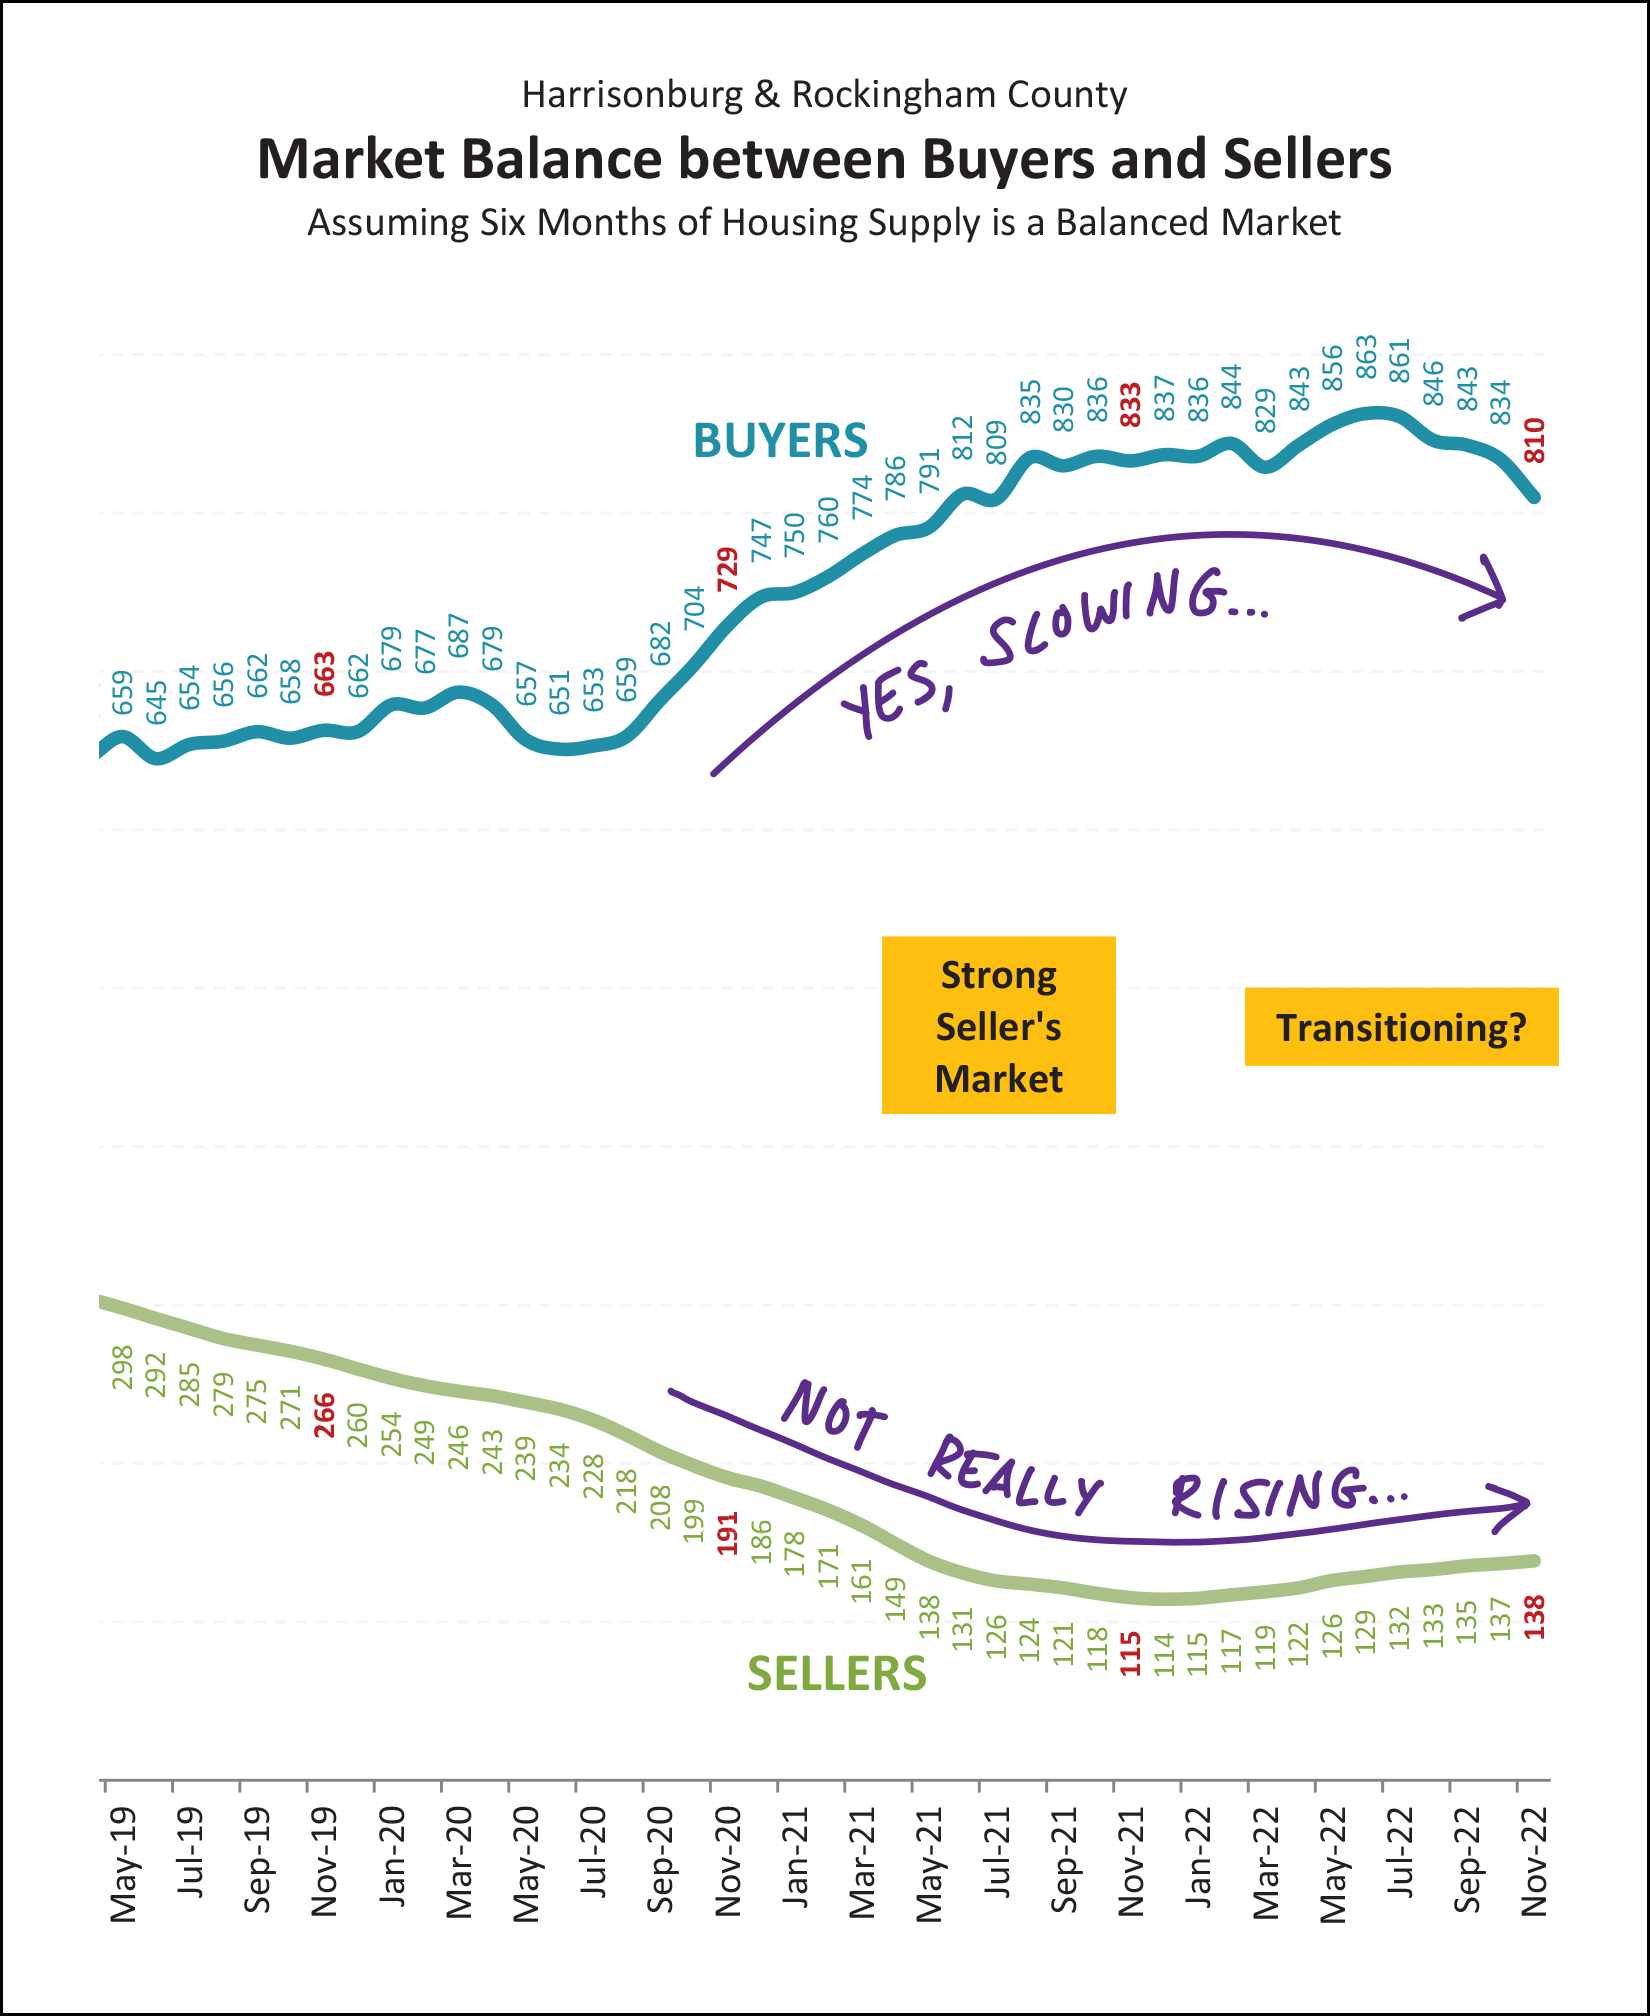 I'll make this point a few more times as we continue through these graphs, but here's your first visual showing that even if the market is starting to transition a bit, it's not doing it very rapidly. Yes, home sales are slowing. The graph above shows how many buyers are buying in a six month timeframe. We have seen a decline over the past year from 833 buyers buying every six months down to 810 buyers buying. So, yes, the pace of buyers committing to buy is certainly slowing. But... we're not seeing as much of an increase in sellers selling (inventory levels) as we might otherwise expect. We've seen an increase over the past year from 115 homes for sale up to 138 homes for sale, but that's still a notable net decline in inventory from two years ago and three years ago. So, is it a slightly less strong seller's market now? Yes. Is it still a strong seller's market now? Yes. Now, looking at contract activity for a moment, to predict where things might be headed from here... 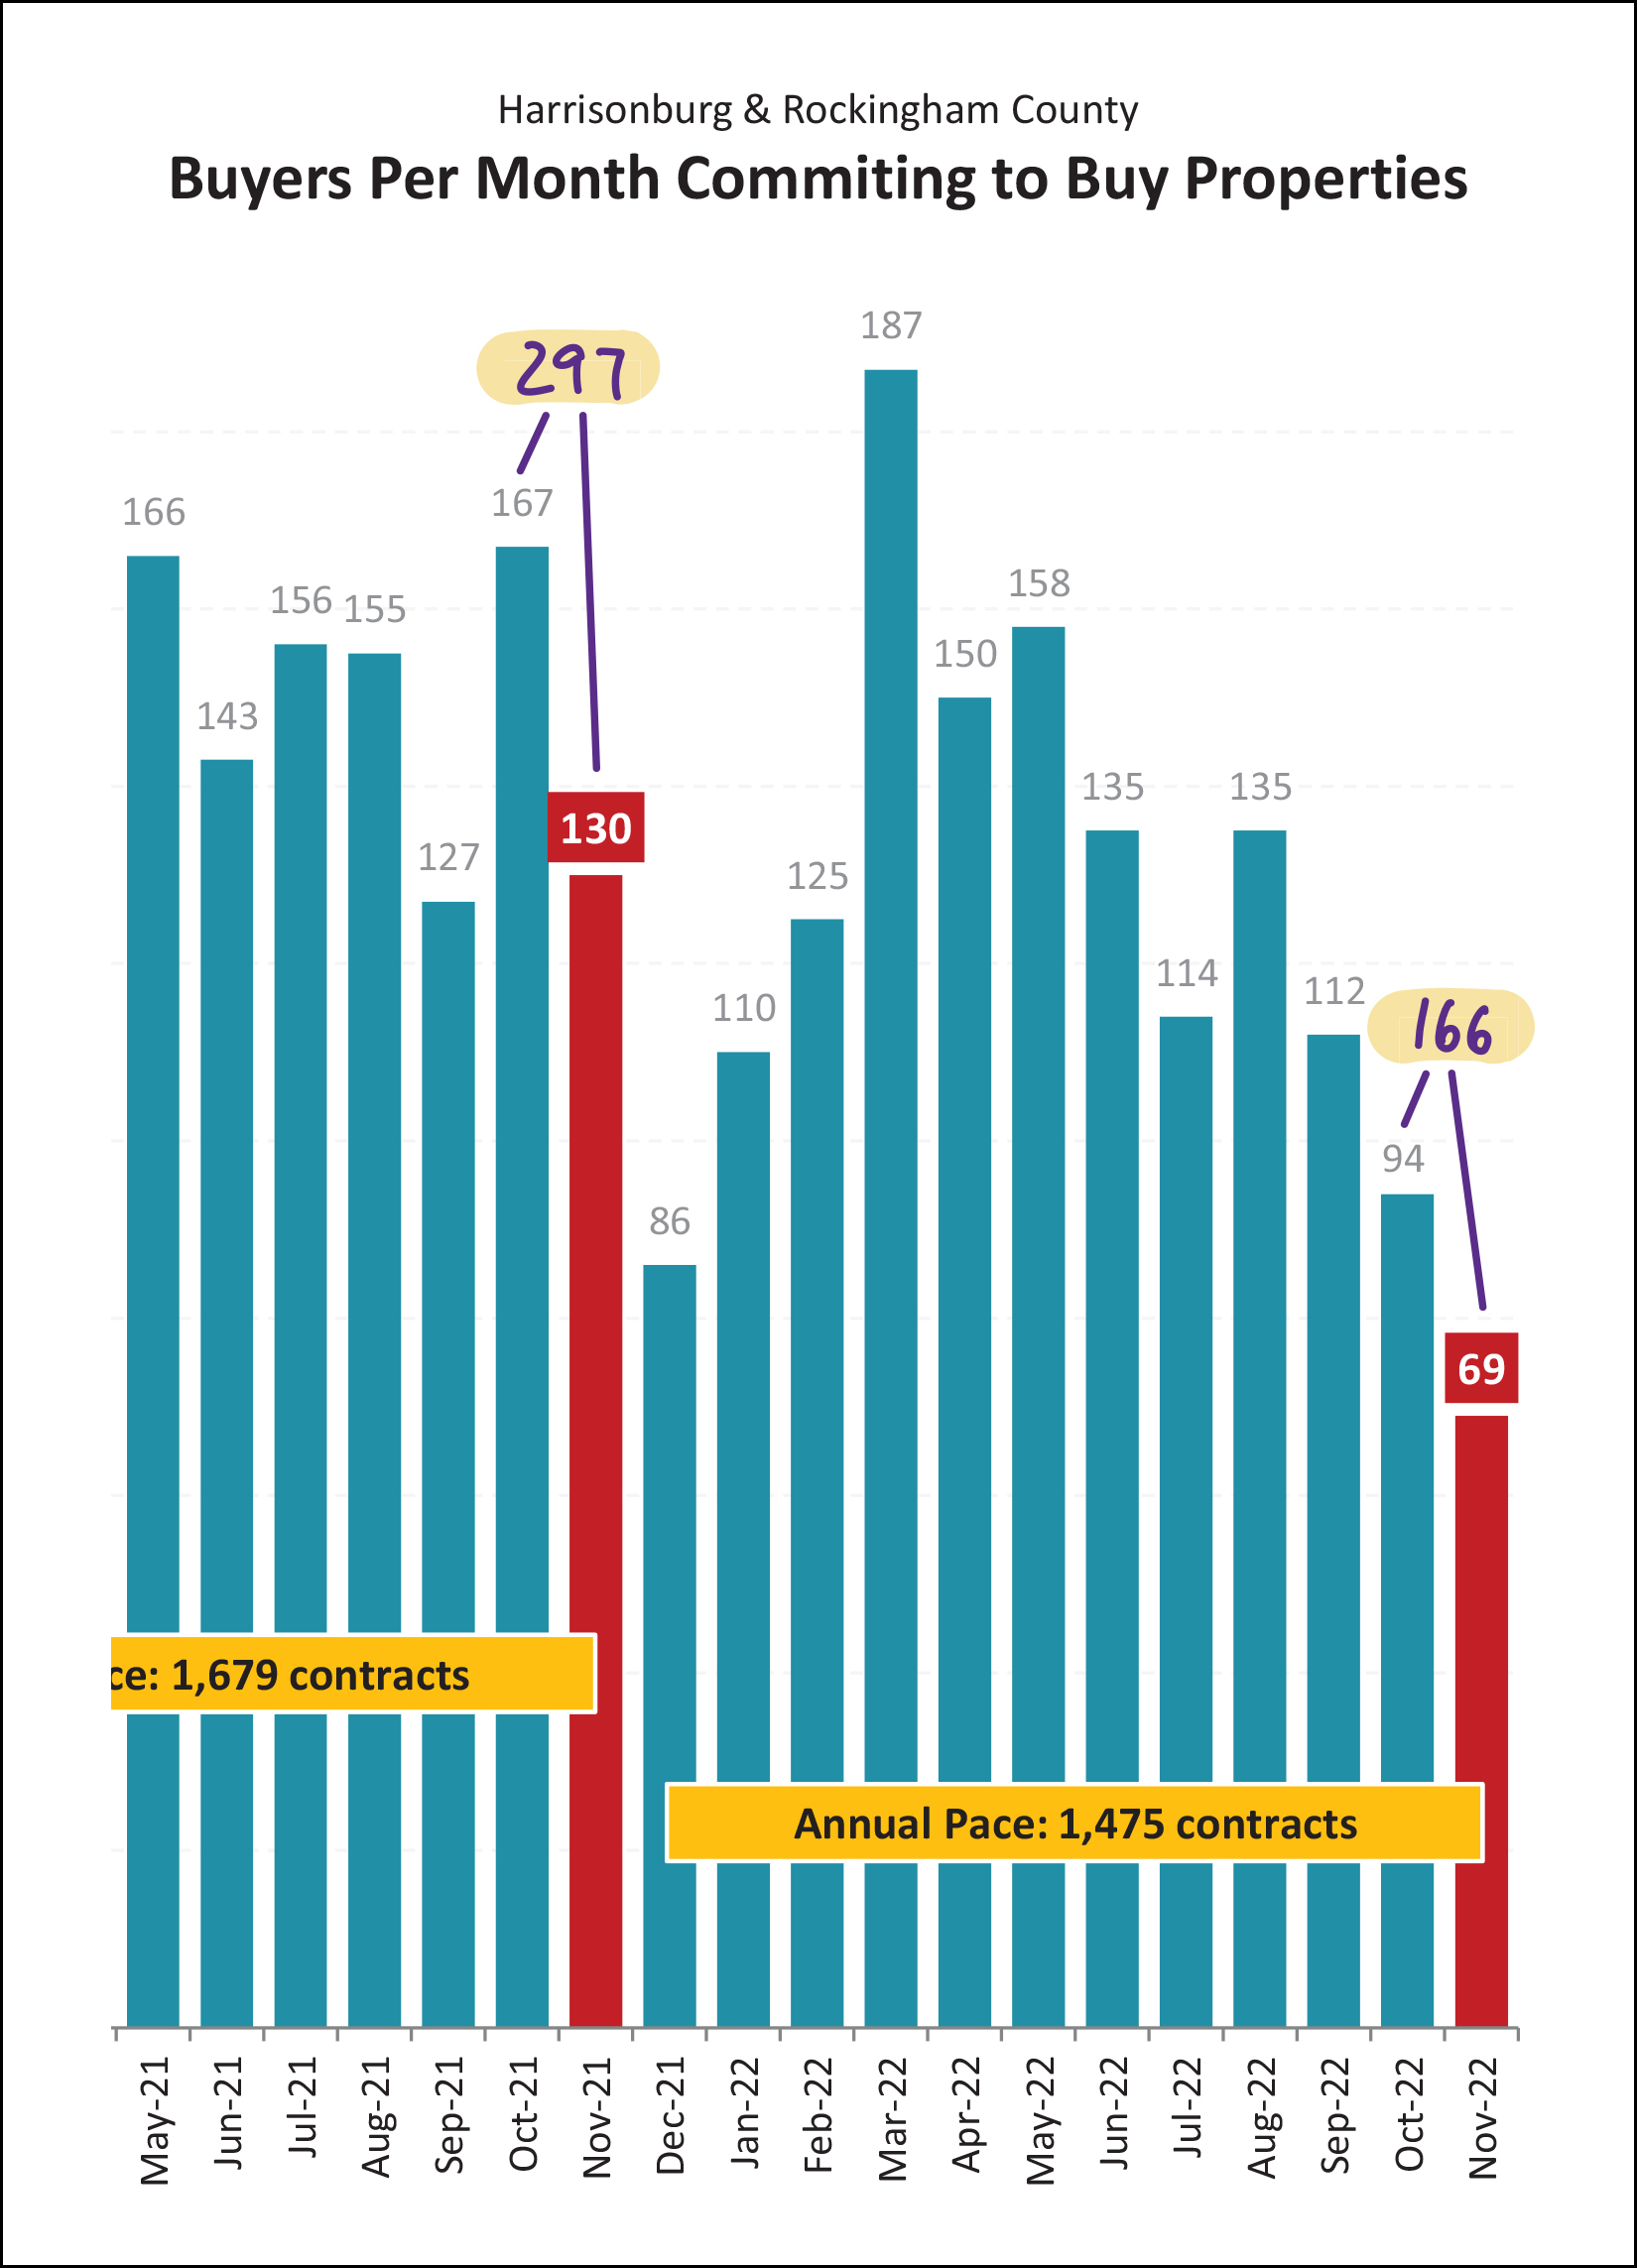 As becomes evident with my handwritten note on the graph above... contract activity this October and November was MUCH slower than last October and November! After a combined total of 297 contracts being signed during that two month period last year... we have seen only 166 contracts signed this October and November, which is a 44% decline! Again, first, not a total surprise. Buyers are a bit less excited to sign contracts to buy homes with interest rates of 6% to 7% (this Oct/Nov) as compared to when interest rates are 2.5% to 3.5% (last Oct/Nov). Second, these lower contract numbers have started to result in lower sales numbers and that is likely to roll into December sales and January sales. Finally, it's important to remember that past two winters (2020, 2021) were a bit abnormal given Covid (lots of buyers wanting to buy a house) and super low interest rates (lots of buyers qualifying to buy a house) and this winter we seem to be returning to what was previously a typical seasonal trend of fewer contracts and sales during winter months. Now, then, back to inventory... certainly it must be rising, given fewer closed sales and fewer contracts being signed, right? 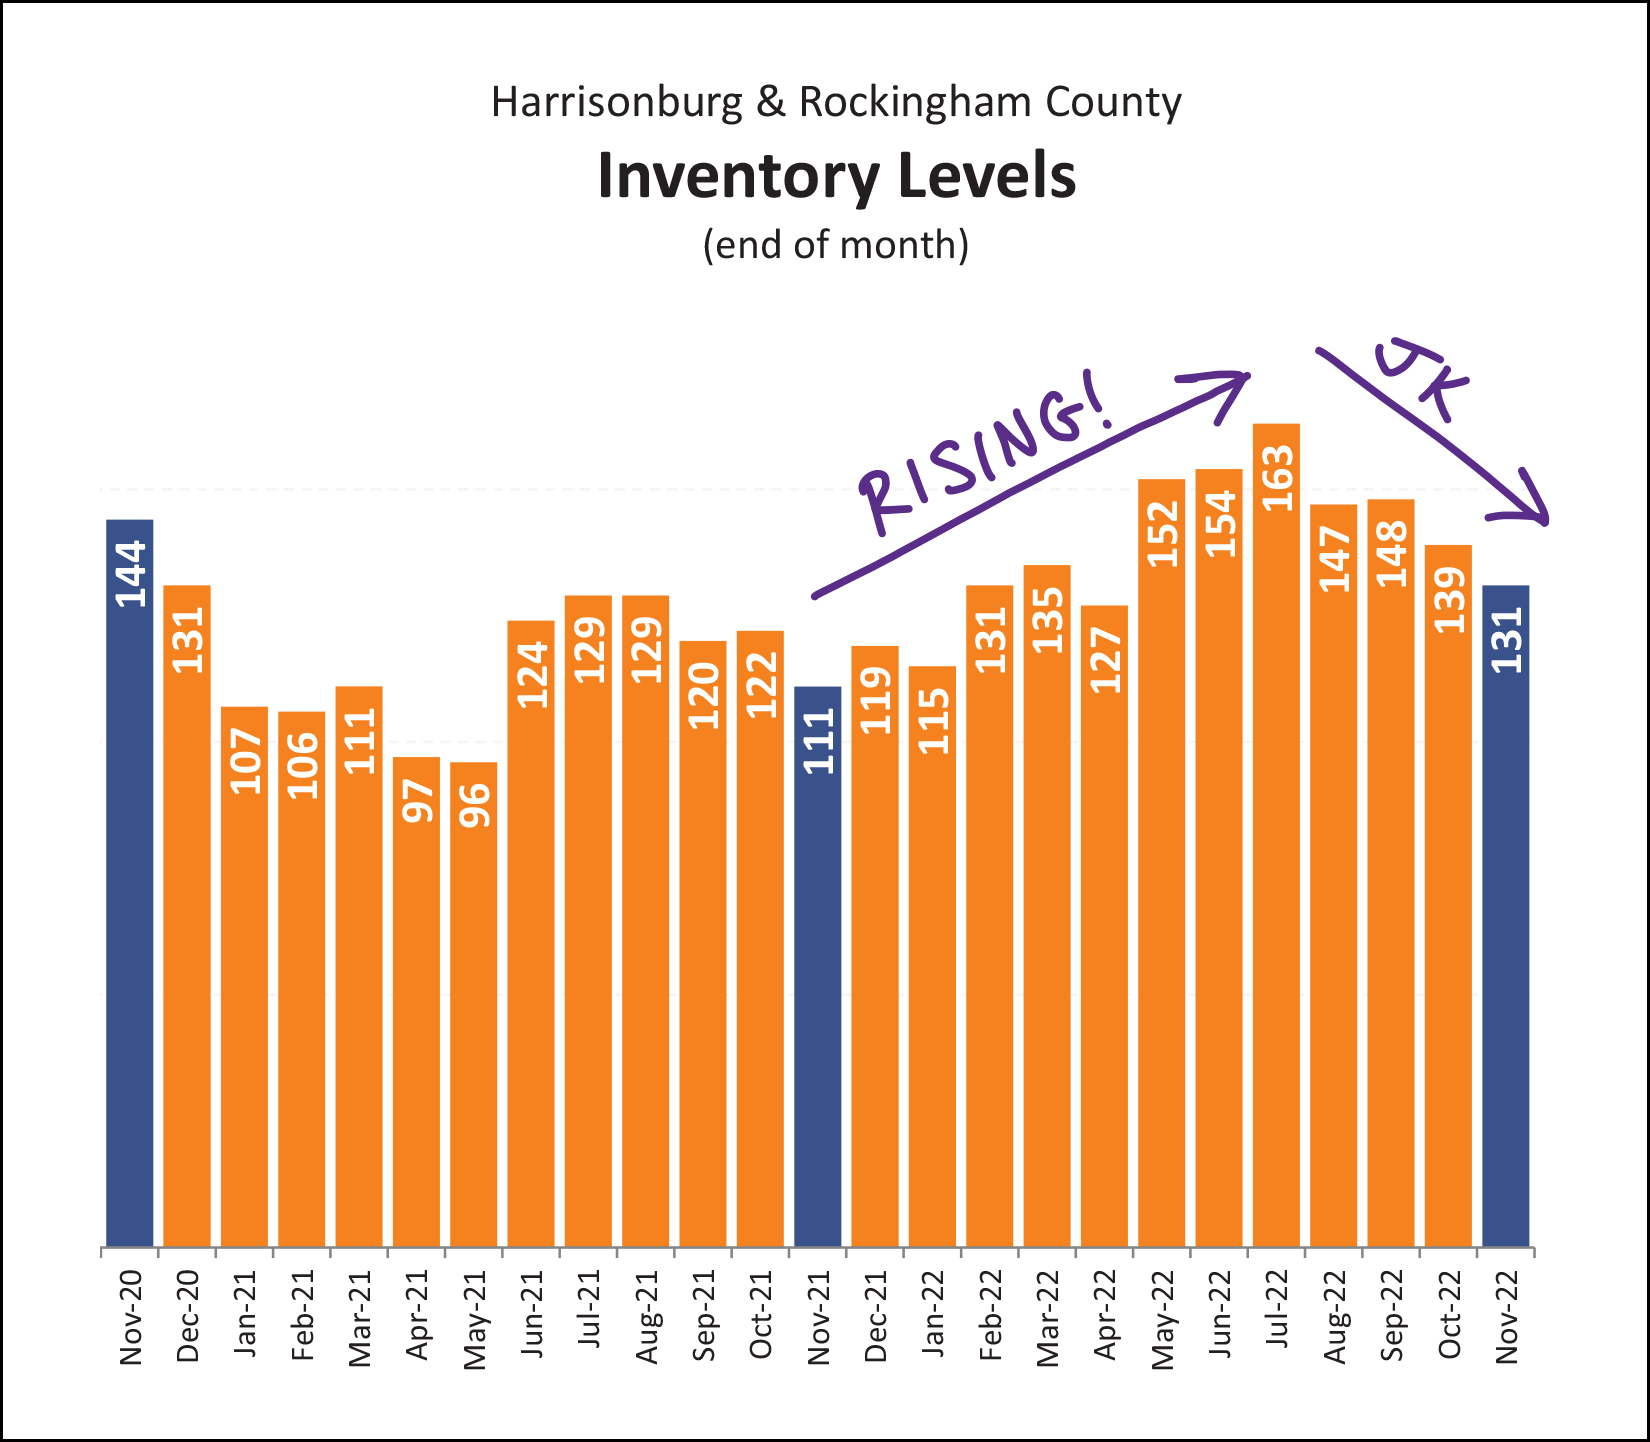 And... nope! Inventory levels rose through much of 2022... but have now been declining for the past four months... as is relatively normal for the fall into winter timeframe. Furthermore, inventory levels are still lower now than they were two years ago. This coming spring will be interesting, depending on how mortgage interest rates look at that time. It's typical to see lower inventory levels in the winter, and that makes the lower contract numbers less consequential. Lots of folks choose to sell in the spring and summer, and if we have lower contract numbers at that time, then we could see inventory levels starting to measurably increase. Driving this point home one more time... 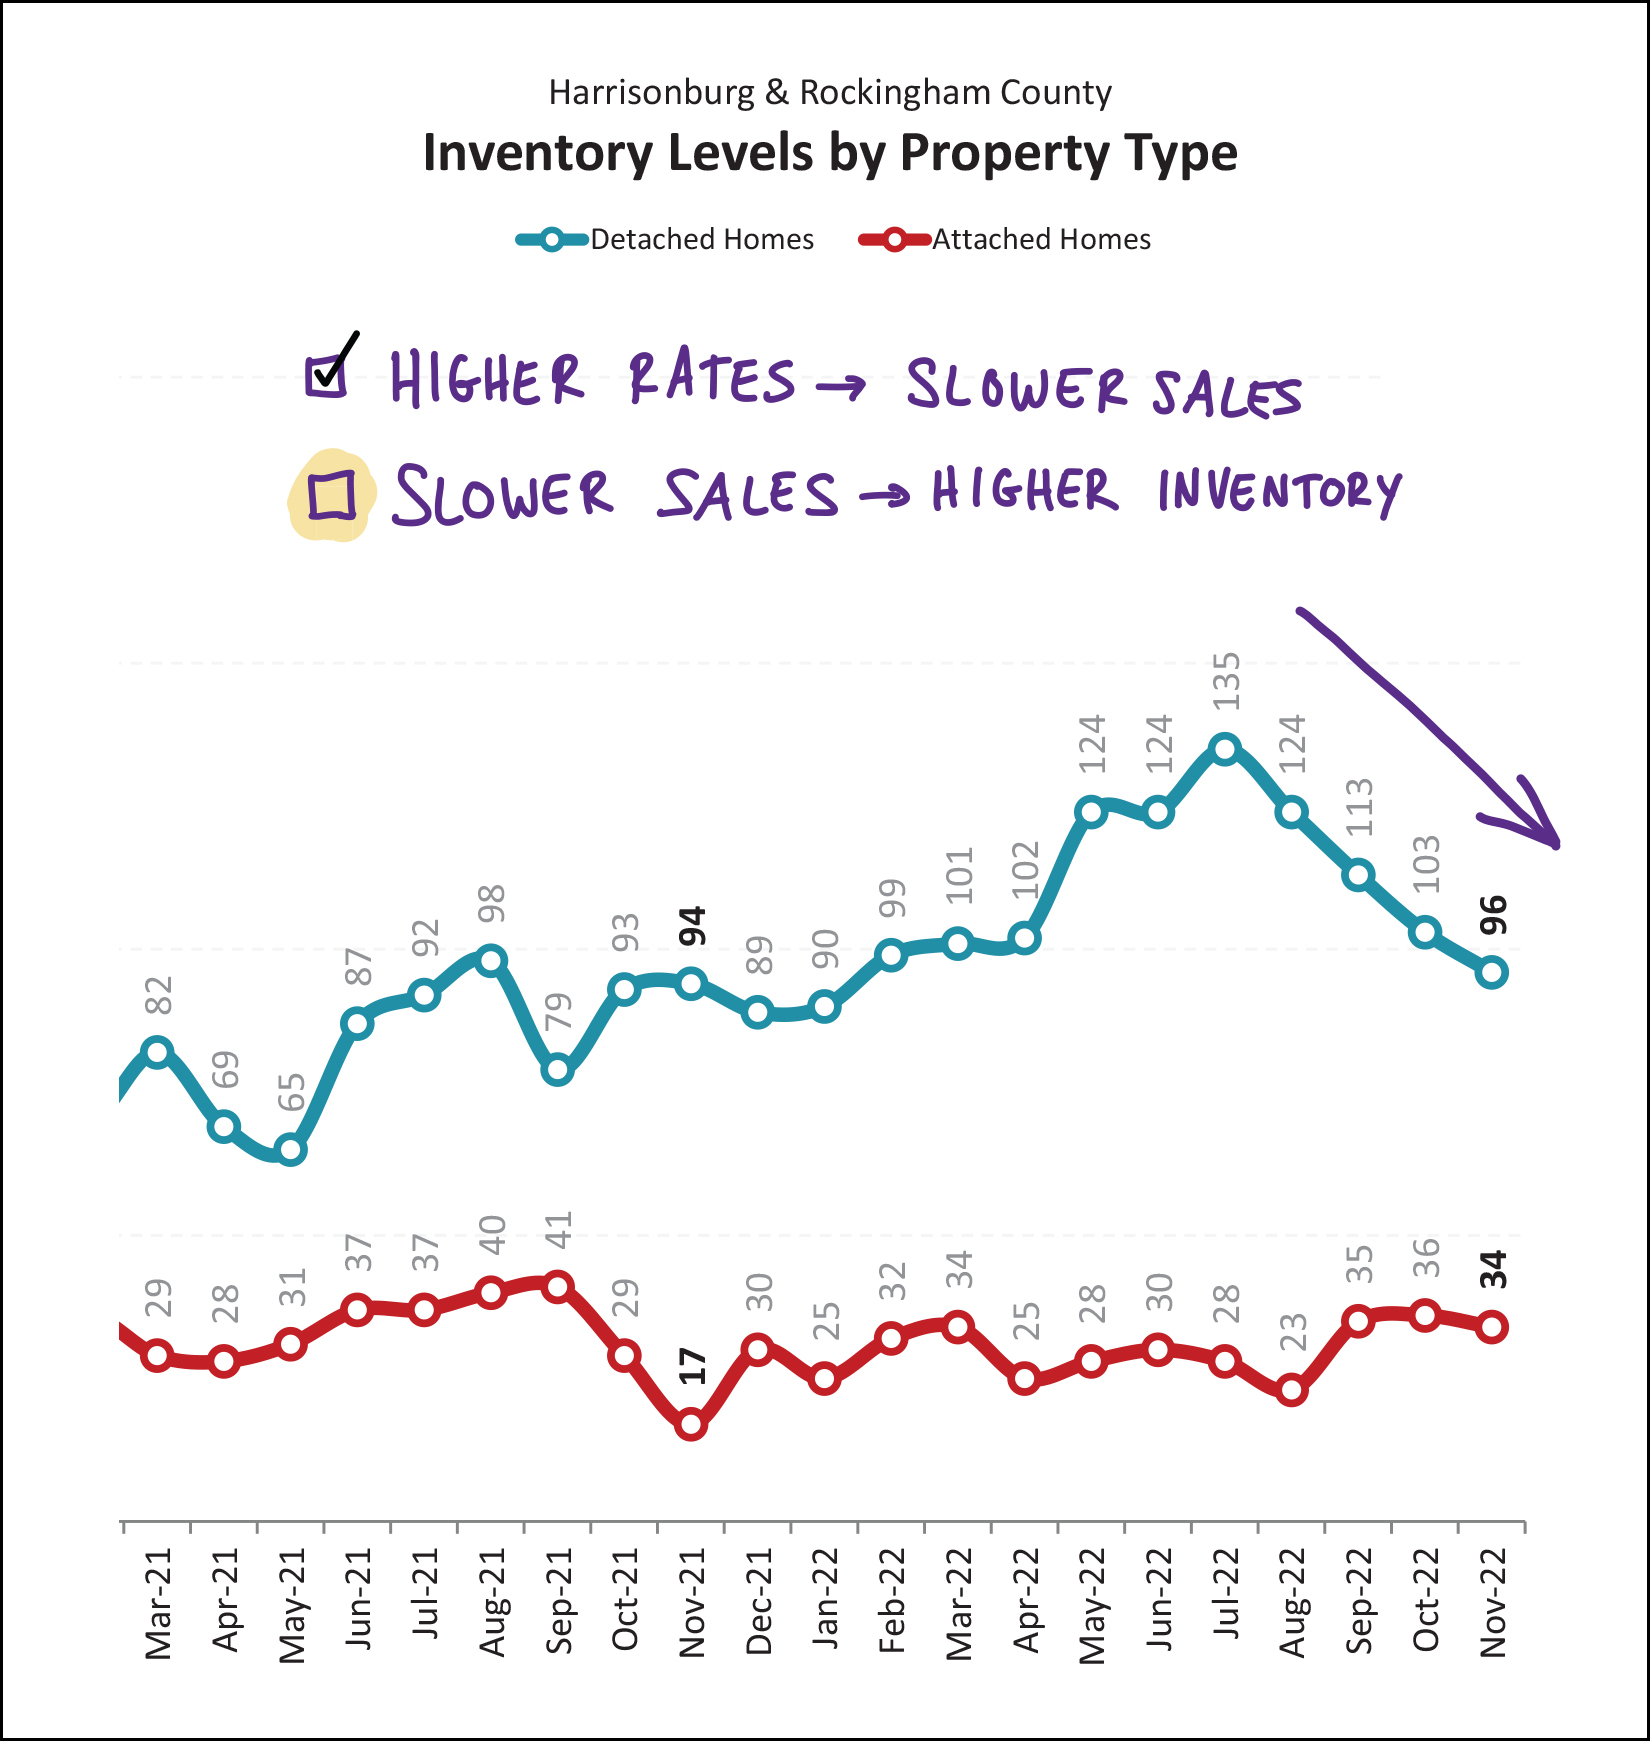 The graph above shows inventory levels by property type. Inventory levels of attached homes (townhomes, duplexes, condos) have stayed relatively consistently between 25 and 40 over the past year and a half. Inventory levels of detached homes were rising between June 2021 and June 2022... but then have declined for the past four months. So, as my notes point out... higher mortgage interest rates did indeed lead to slower sales... but slower sales are not necessarily leading to higher inventory levels. Come spring, we may have new insights as to a potential new trajectory of the market if more sellers want to sell and this lower number of buyers are willing to buy. This next graph has become a bit more complex since I last referenced it... 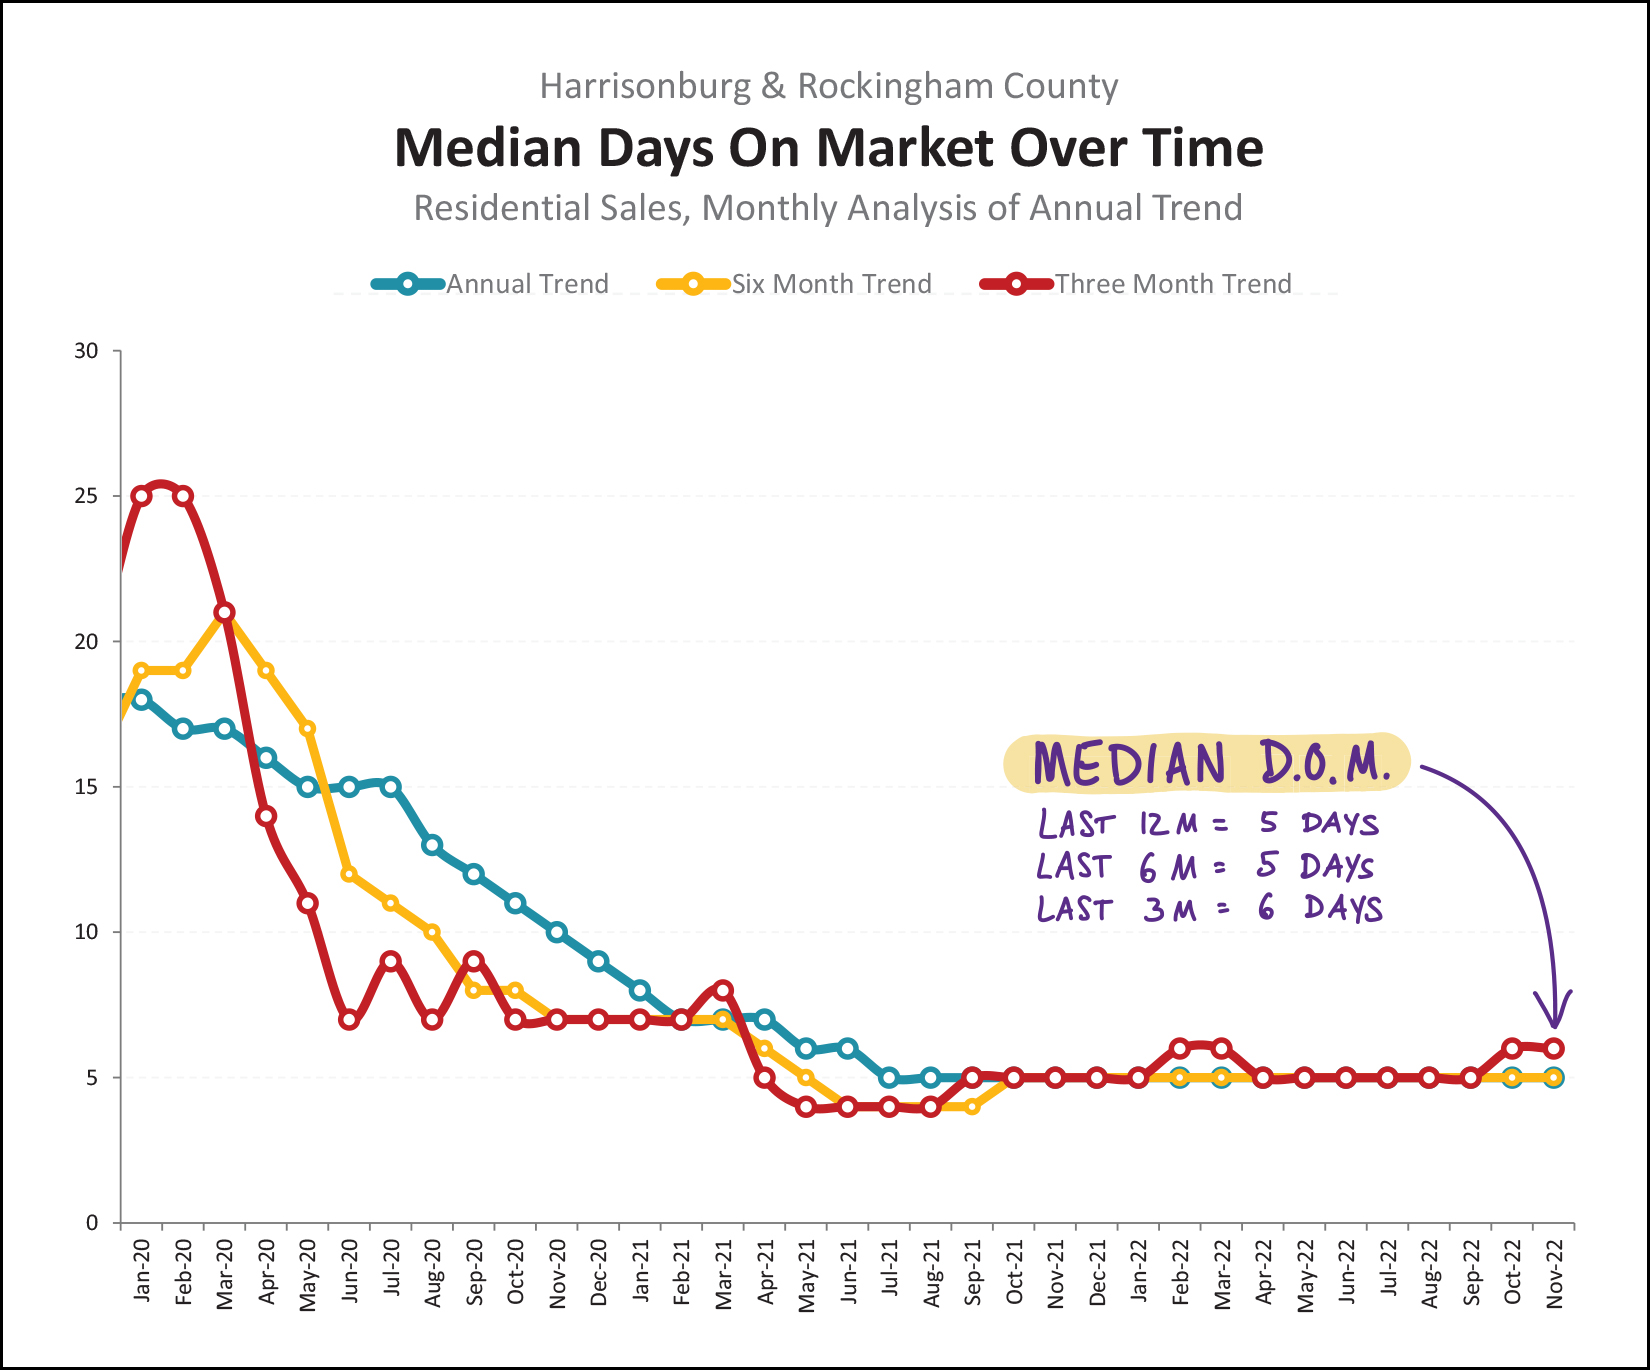 First, conceptually, the timeframe in which homes are going under contract (days on market) is often an excellent indicator of the tone of the local market. As such, for some time I have been tracking the "median days on market" for homes that are selling in Harrisonburg and Rockingham County. The annual median days on market (blue line above) fell to five days (!) back in July 2021 and has remained at that level ever since. As the market has started to feel like it might be transitioning, or as we have though that maybe the market would have to be transitioning, several of you insightful and intelligent readers have asked if this "median days on market" trend looks different if we weren't looking at an entire year of data at a time. Basically asking the question... well, if the median days on market is five days over the past year... certainly it must be (might be?) higher if we looked only at the last few months, right? The new lines on this graph above address this inquiry. The gold/yellow line evaluates median days on market in a six month timeframe... and the red line shows this same metric in a three month timeframe. All that to say... even if we narrow our scope all the way down to the past three months... the median days on market has only risen to... six days instead of five. Half (or more) of the homes that have sold in the past three months were under contract within six days of being listed for sale. If (when?) the market transitions further, we will likely start to see this metric (median days on market) start to trend higher... but we're not seeing it yet. One of the main market impacting factors that I mentioned multiple times throughout this report is the change in mortgage interest rates over the past year... 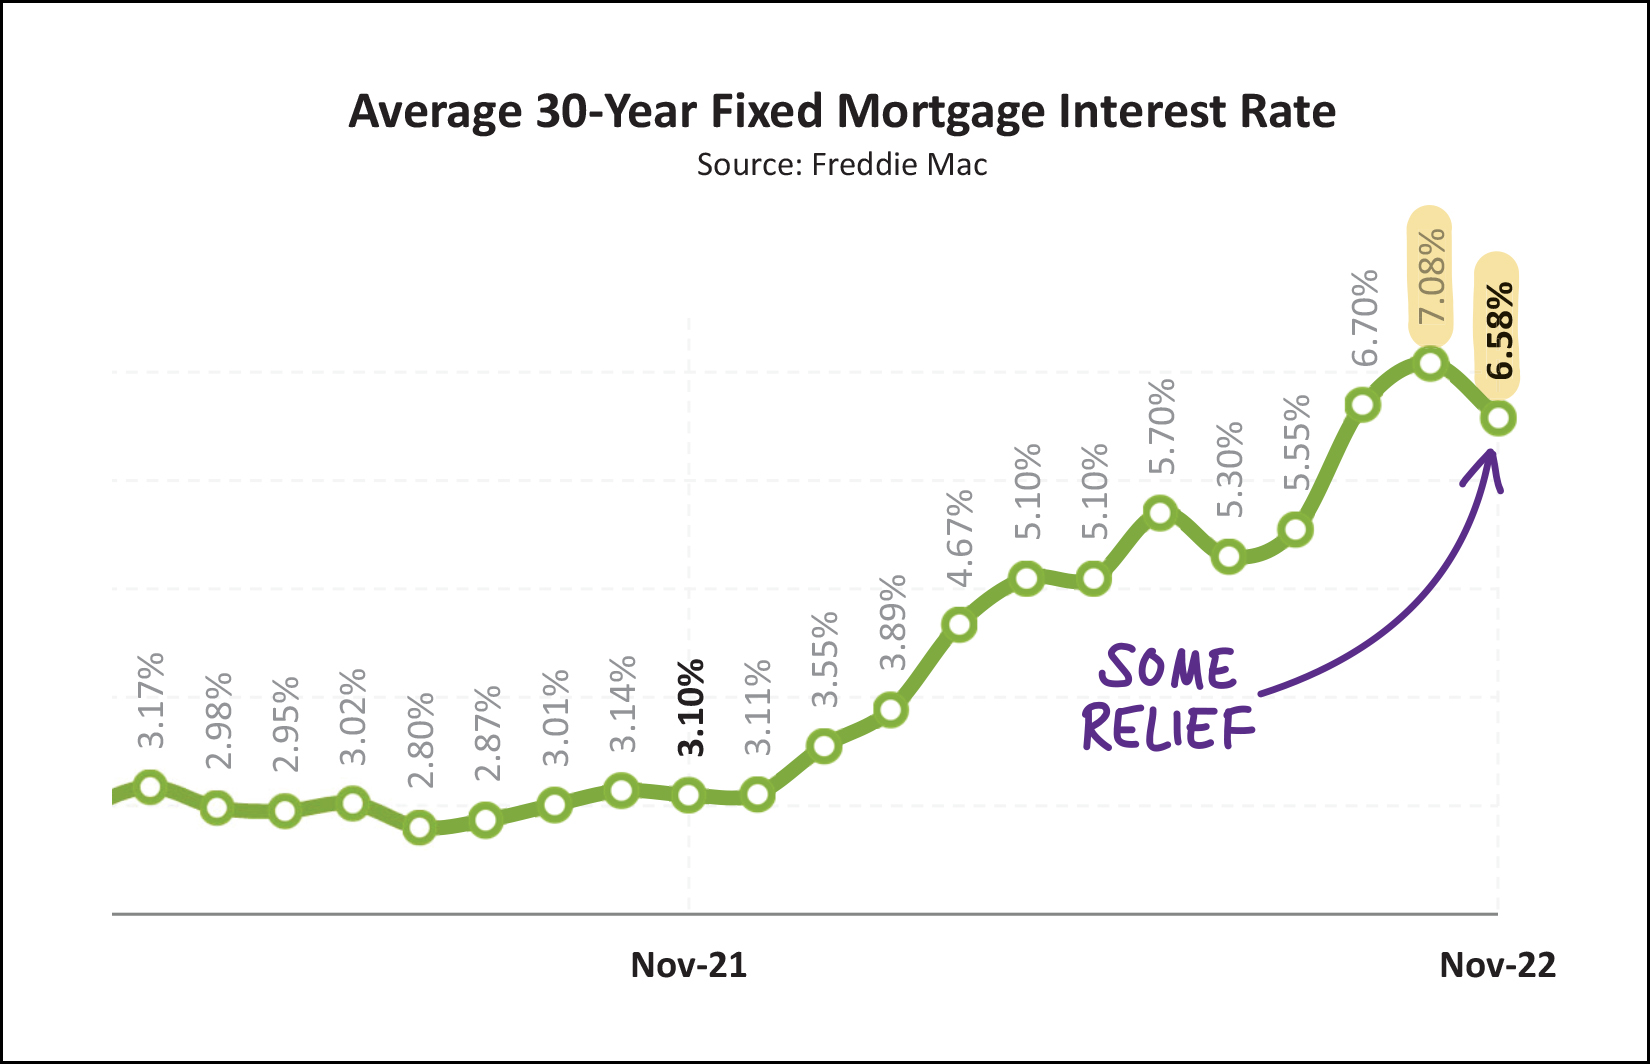 A year ago buyers enjoyed mortgage interest rates right around 3%. Today... rates are twice as high... with an average rate of 6.58% for a 30 year fixed mortgage interest rate as of the end of November. Rates have actually trended down a bit further since that time... with a current average of 6.33% that is not yet shown on the graph above. Will significantly higher mortgage interest rates cause some buyers to not be able to buy? Yes. Will significantly higher mortgage interest rates cause some buyers to not want to buy? Yes. Will significantly higher mortgage interest rates cause a significant (10% or more?) decline in the number of buyers buying homes in our local housing market? Thus far, it seems not. And there you have it... the latest trends in our local housing market as we roll into the last two(ish) weeks of 2022. [1] We're starting to see fewer home sales... though the "fewer" is compared to a "higher" time that we might later conclude was well outside the norm for our local market. [2] We're still seeing higher and higher sales prices in our local market despite (non-cash) buyers financing their home purchase at some of the highest mortgage interest rates we've seen in over 10 years. [3] Despite slightly less buyer activity, inventory levels are remaining stable and may be starting to return to historical seasonal trends of fewer homes on the market in the winter and inventory levels rising again in the spring and summer. As we near the end of 2022, some of you may be considering the sale of your home (or the purchase of a new one) in 2023. If so, we should start chatting sooner rather than later about how all of these market trends potentially impact your plans and the timing of those plans. Feel free to reach out to start that conversation by emailing me or texting or calling me at 540-578-0102. I'll provide another update after the first of the year. Until then, I hope you enjoy the remainder of what is one of my favorite months of the year. December includes Shaena's and my anniversary, Shaena's birthday, and Christmas! Celebrations all month long. ;-) I hope you have an enjoyable, peaceful, fulfilling remainder of 2022 -- and that you find opportunities to spend time with the people you love during this holiday season! | |
Slightly Fewer Homes Are Selling At Ever Higher Prices |
|
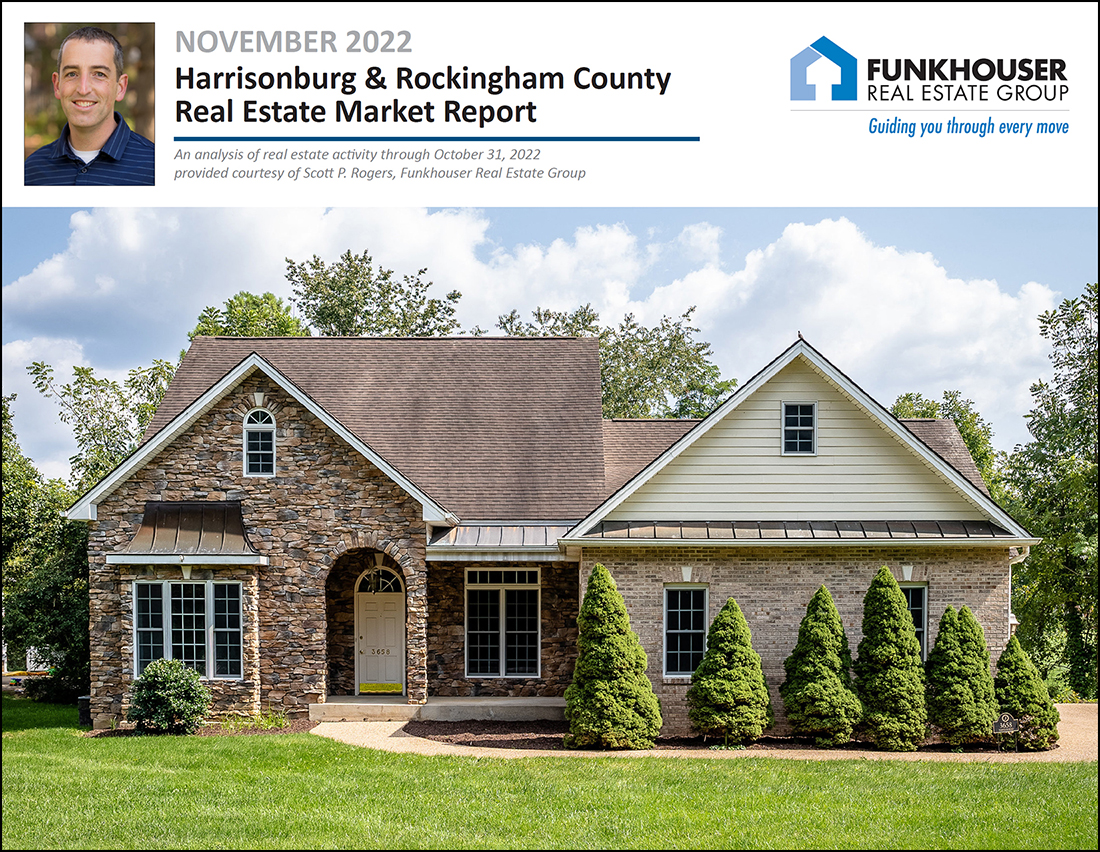 Happy Monday morning, friends! What a delightfully warm fall we had this year! I hope you have taken advantage of the beautiful weather and explored some of the many outdoor adventures the Shenandoah Valley offers us. Late last month, Shaena and I, with several other family members, enjoyed a 30 mile bike ride on the Greenbrier River Trail in West Virginia and took in many beautiful sights along the way. I highly recommend it as a day trip!  Before we get to latest happenings in our local real estate market, each month I offer a giveaway, of sorts, for readers of this market report, highlighting some of my favorite places (or things) in Harrisonburg. Recent highlights have included Bella Gelato, the JMU Forbes Center and the Harrisonburg Half Marathon. This month, I encourage you to go check out Walkabout Outfitter in downtown Harrisonburg where you will find plenty of awesome gear and apparel for your next outdoor adventure! As a bonus, click here to enter to win a $50 gift certificate to Walkabout Outfitter! Also, take a few minutes to check out this month's featured home... a spacious, five bedroom home in Highland Park located at 3658 Traveler Road! Now, then, let's dig into the data. I'll preface it by saying that the trends you might read regarding significant changes in housing markets across the country don't necessarily seem to be showing up in our local housing market at this time. Read on to see what that means from the latest available data... 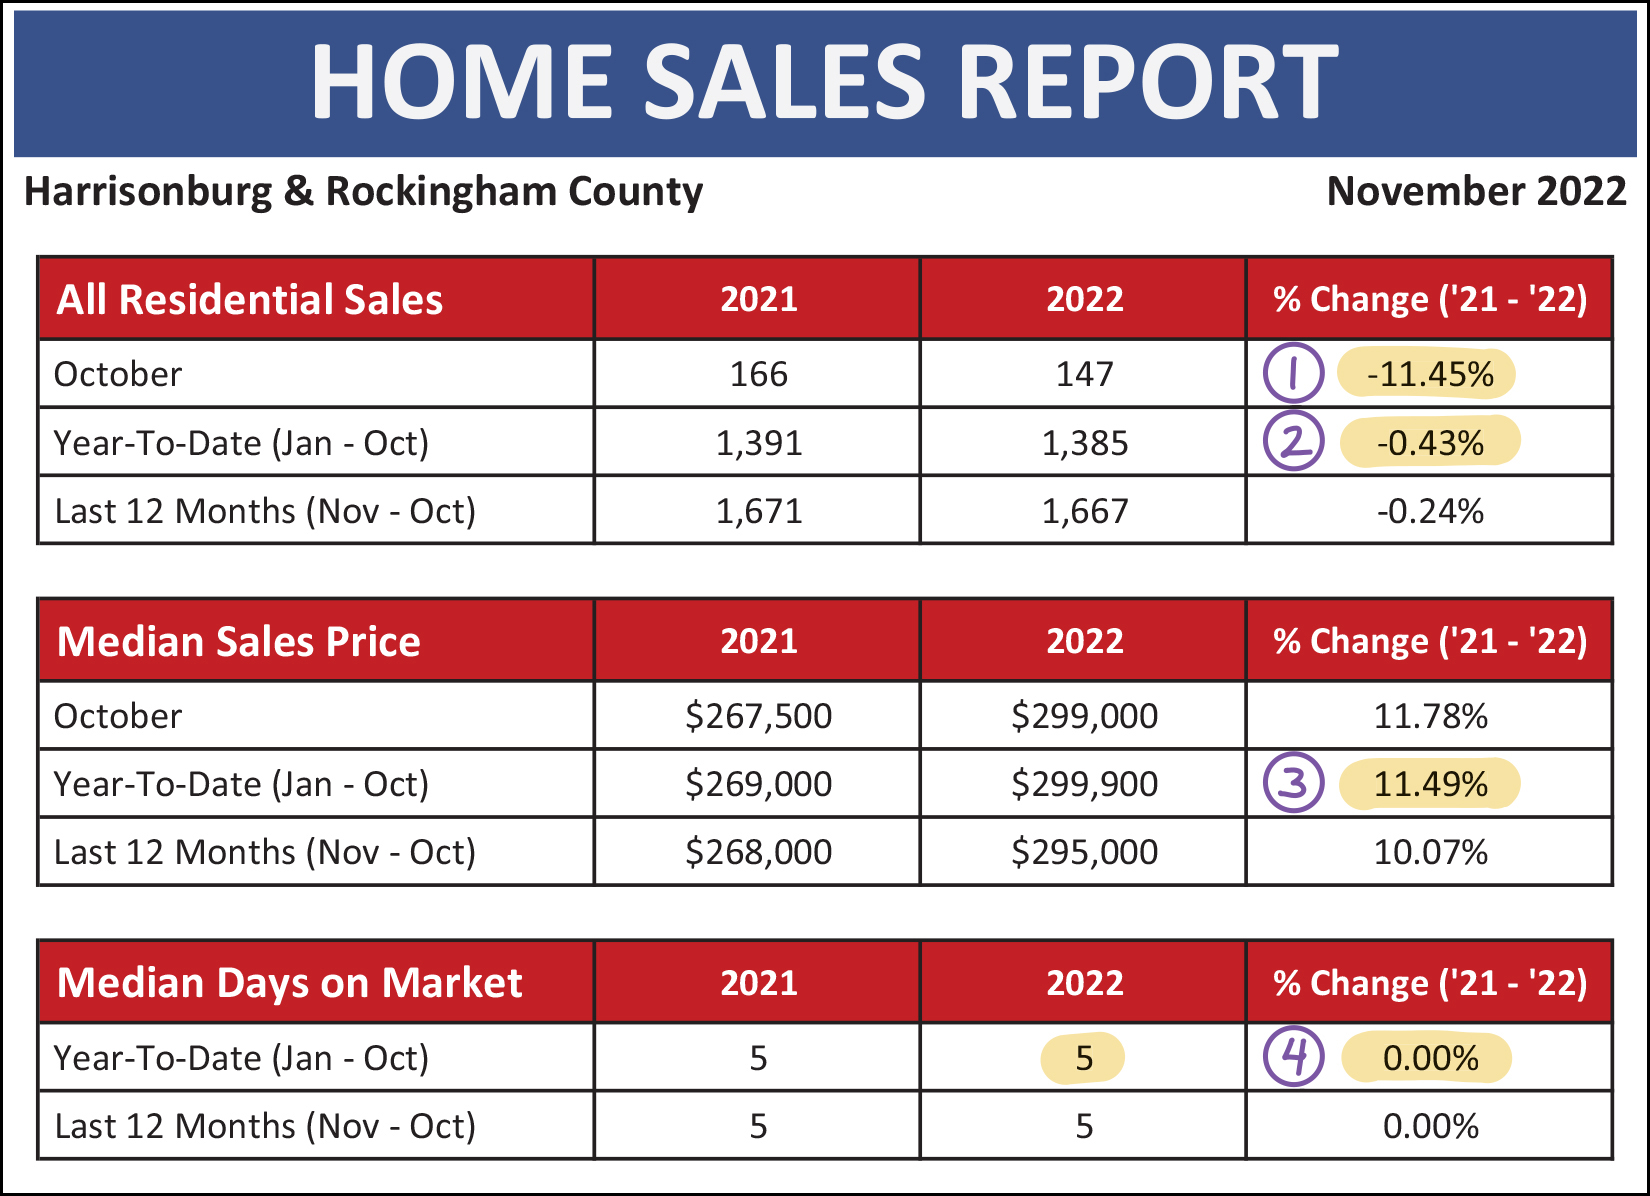 A few things stand out to me as I look at the latest overall numbers in our local housing market above... [1] We saw fewer home sales in October of this year (147) compared to last year (166) which marked an 11% decline in monthly sales activity. [2] This decline in October sales piles onto January through September sales to show a tiny decline in home sales (-0.43%) when looking at the first ten months of this year compared to the first ten months of last year. [3] Homes are still selling for quite a bit more now than they were last year. The median sales price of homes sold thus far in 2022 has been $299,900 -- up 11.5% from last year when the median sales price was $269,000. [4] Homes are still selling (as a whole) just as fast now as they were last year. The current median days on market is five days... just as it was a year ago at this time. This means that half (or more) of homes that sell are under contract within five days of being listed for sale. So... a slower than expected October, but otherwise still quite a strong year of home sales activity. That theme will continue as we work our way through the rest of the data, with only a few exceptions. It is interesting to note the slight difference in performance of detached single family homes compared to attached homes, which includes duplexes, townhouses and condos... 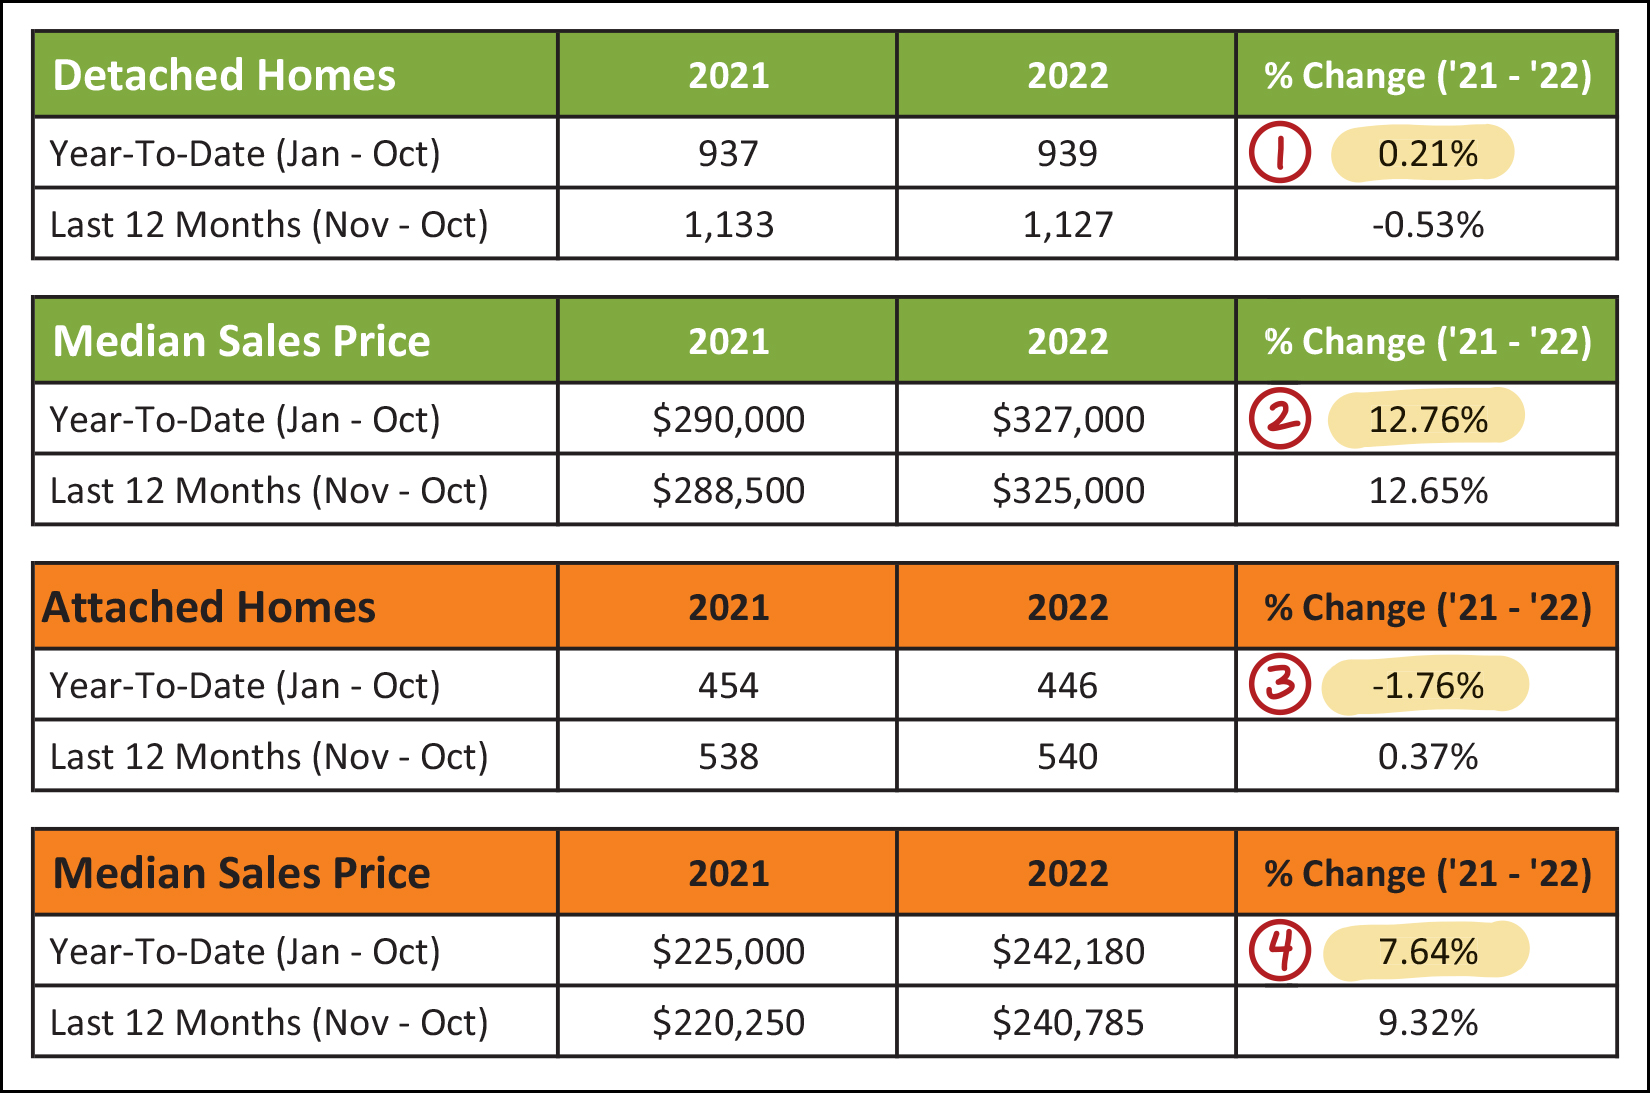 [1&2] Detached single family home sales are shown in the first two green tables above and you'll note that there were just about the same number of sales this year (939) as last year (937) and that the median sales price has increased 13% over the past year. [3&4] In contrast, we have seen a slightly decline (-2%) in attached home sales over the past year and the increase in the median sales price (+8%) is slightly lower than that of single family homes. So, the "detached" portion of our local housing market has outperformed the "attached" portion of the market, but not significantly. Looking at the last few months graphically, it seems the lower month of home sales in October was actually... the fourth month in a row of fewer sales... 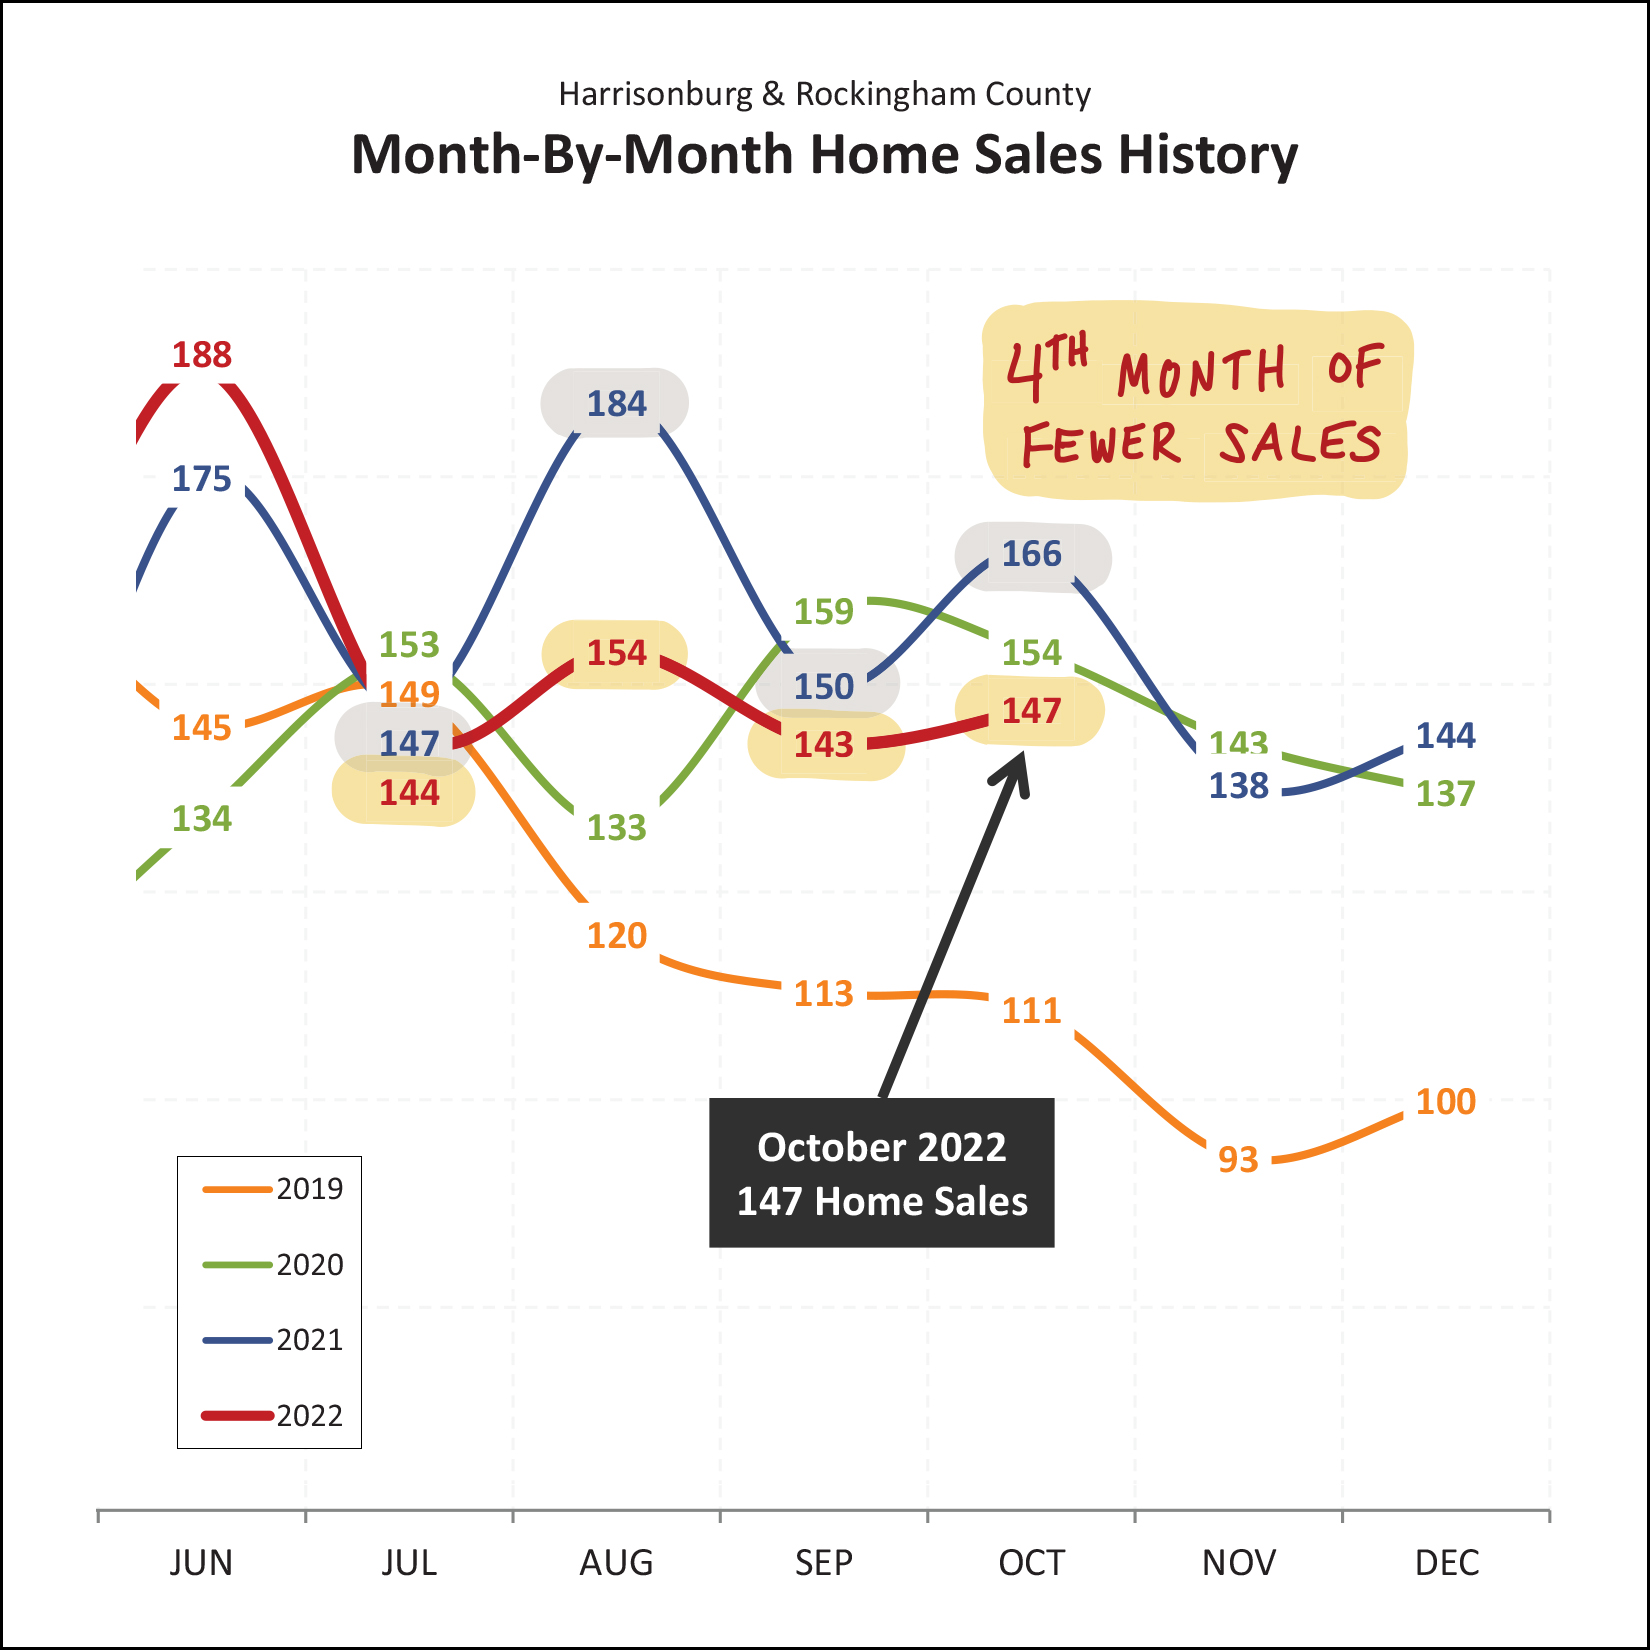 During each of the past four months (Jul, Aug, Sep, Oct) we have seen fewer home sales this year than during the same month last year. Looking ahead, it seems very likely that we will see fewer home sales in November and December as well, especially once we consider the number of contracts signed (or not signed) in October. Read on for more on that... Here, then, for the first month in quite a few years, I am reporting that the pace of home sales (the number selling) is declining... ever so slightly... 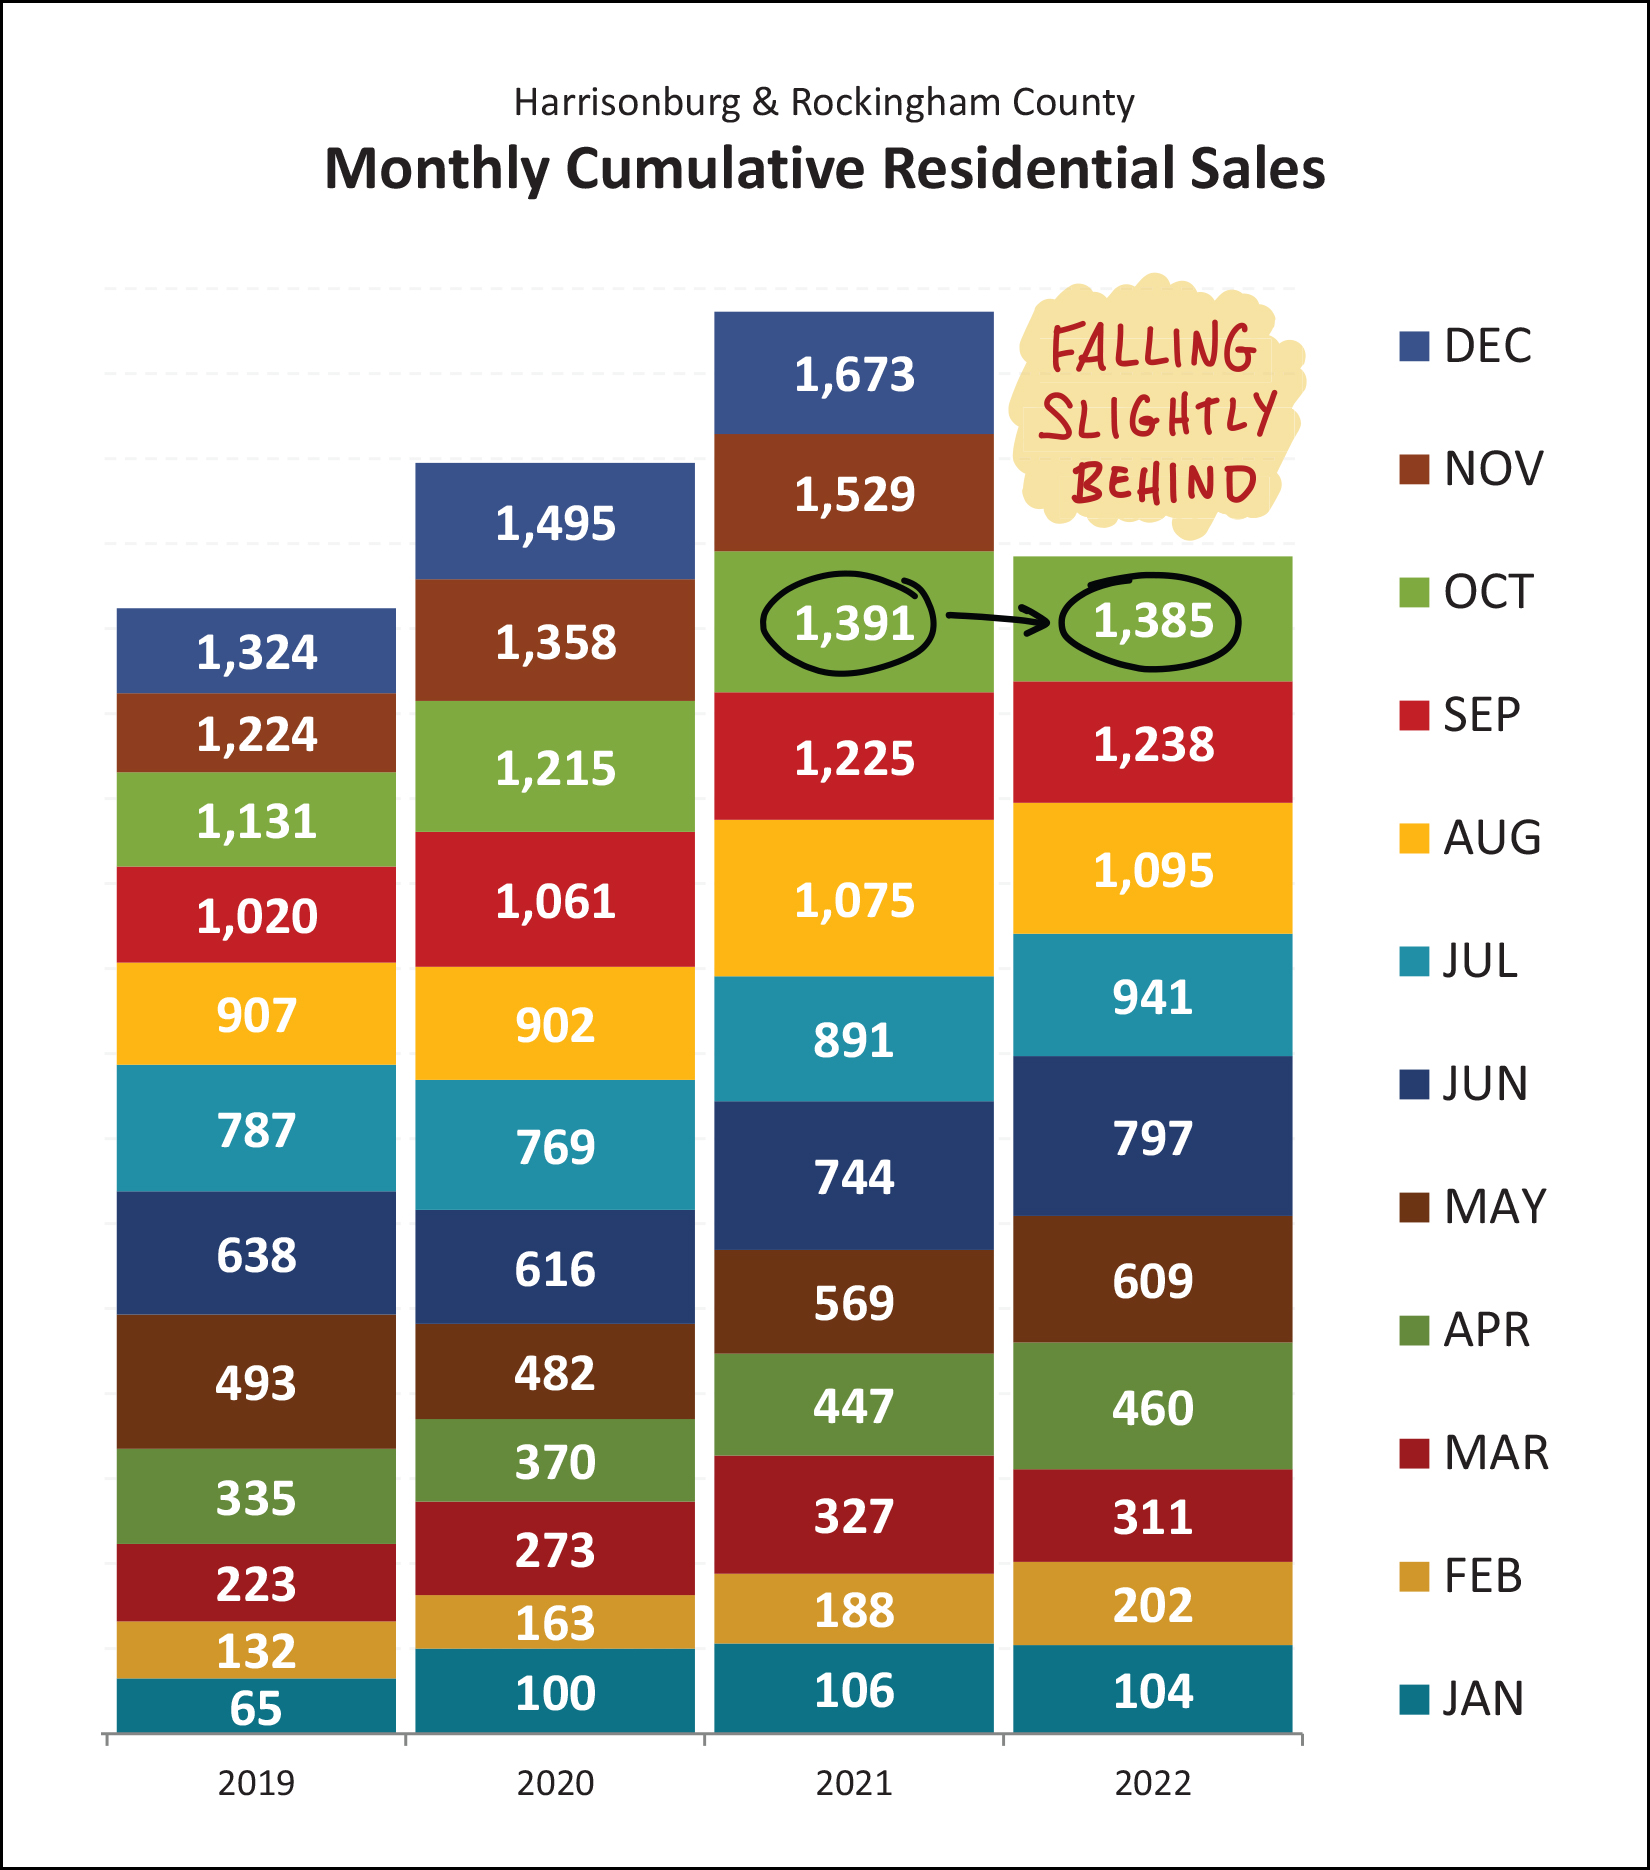 Don't get me wrong, it's been exciting to report each and every month for the past few years that there have been more, and more, and more home sales. But perhaps this rapid increase in the number of homes selling could not go on forever. This year and last are now relatively even when looking at the first ten months of the year, but 2022 is falling slightly behind. At this point, I am predicting that we'll see 2022 fall a bit further behind as we finish out the year. But despite fewer sales, prices are... 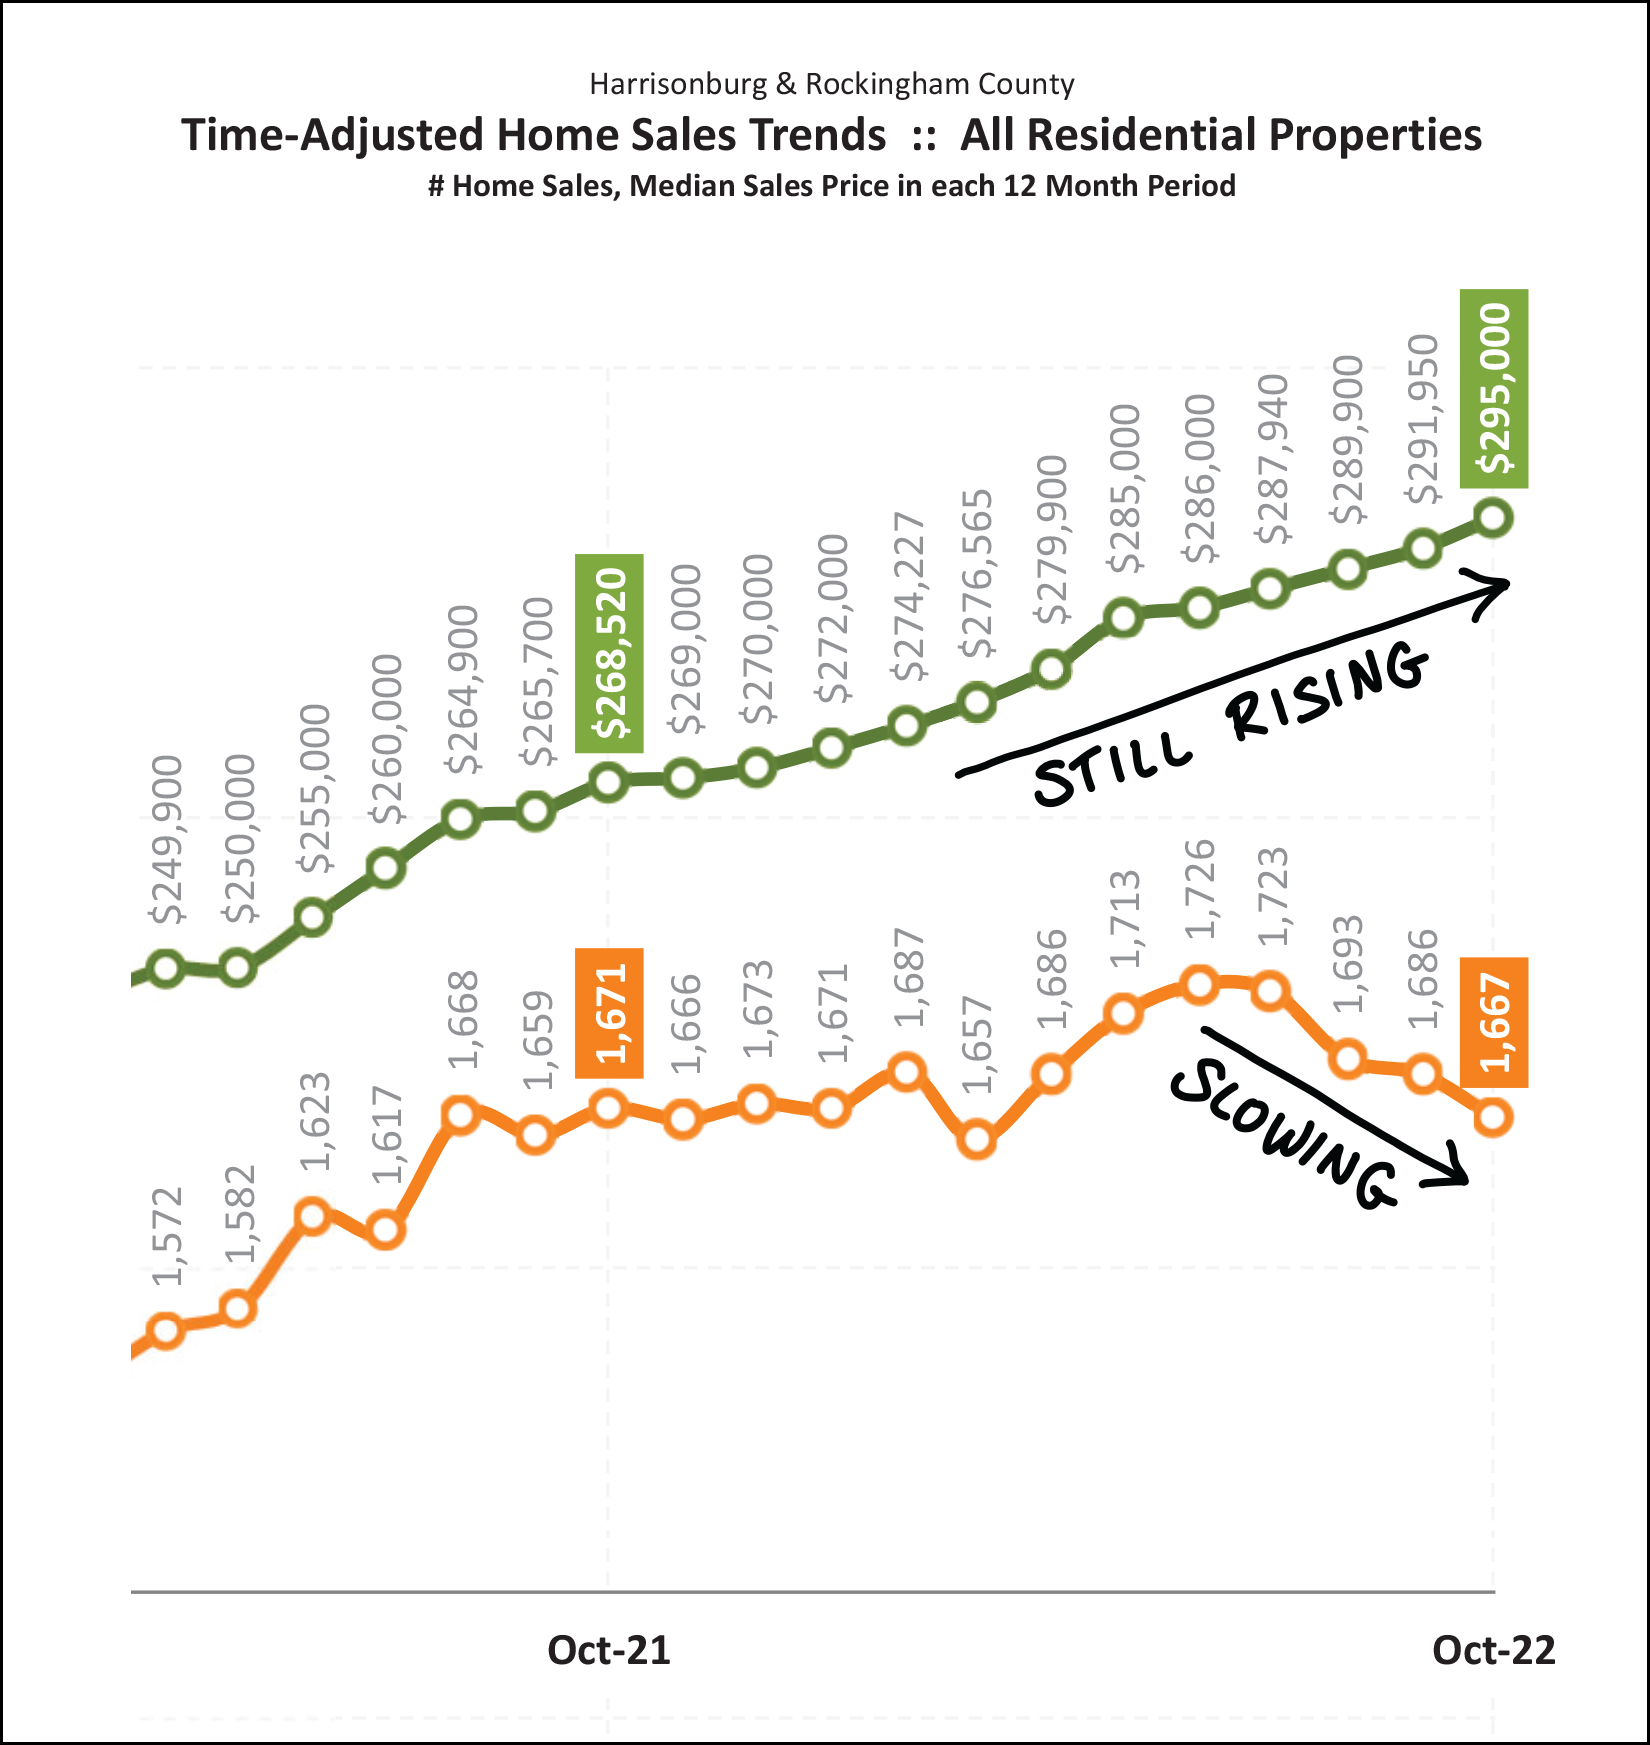 Yes, indeed, home prices are still rising. The orange line above shows the number of homes selling in a year's time. The last four months of declines in the annual pace of sales is a result of those four months of fewer sales shown in the previous graph. We have now seen a decline from a peak of 1,726 sales per year down to 1,667 sales per year. But despite fewer sales... home prices keep on climbing! The median sales price of homes sold in Harrisonburg and Rockingham County over the past year has now risen to $295,000. As one of my past clients once pointed out... most homeowners don't care how many homes are selling... they care about the prices of those homes that are selling. So, from an overall market perspective, things are still looking rather bright in the local housing market as prices seem to still be on the rise, even if we are seeing slightly fewer home sales. Another trend that is interwoven into this equation is housing inventory... how many homes are on the market for sale at any given point... 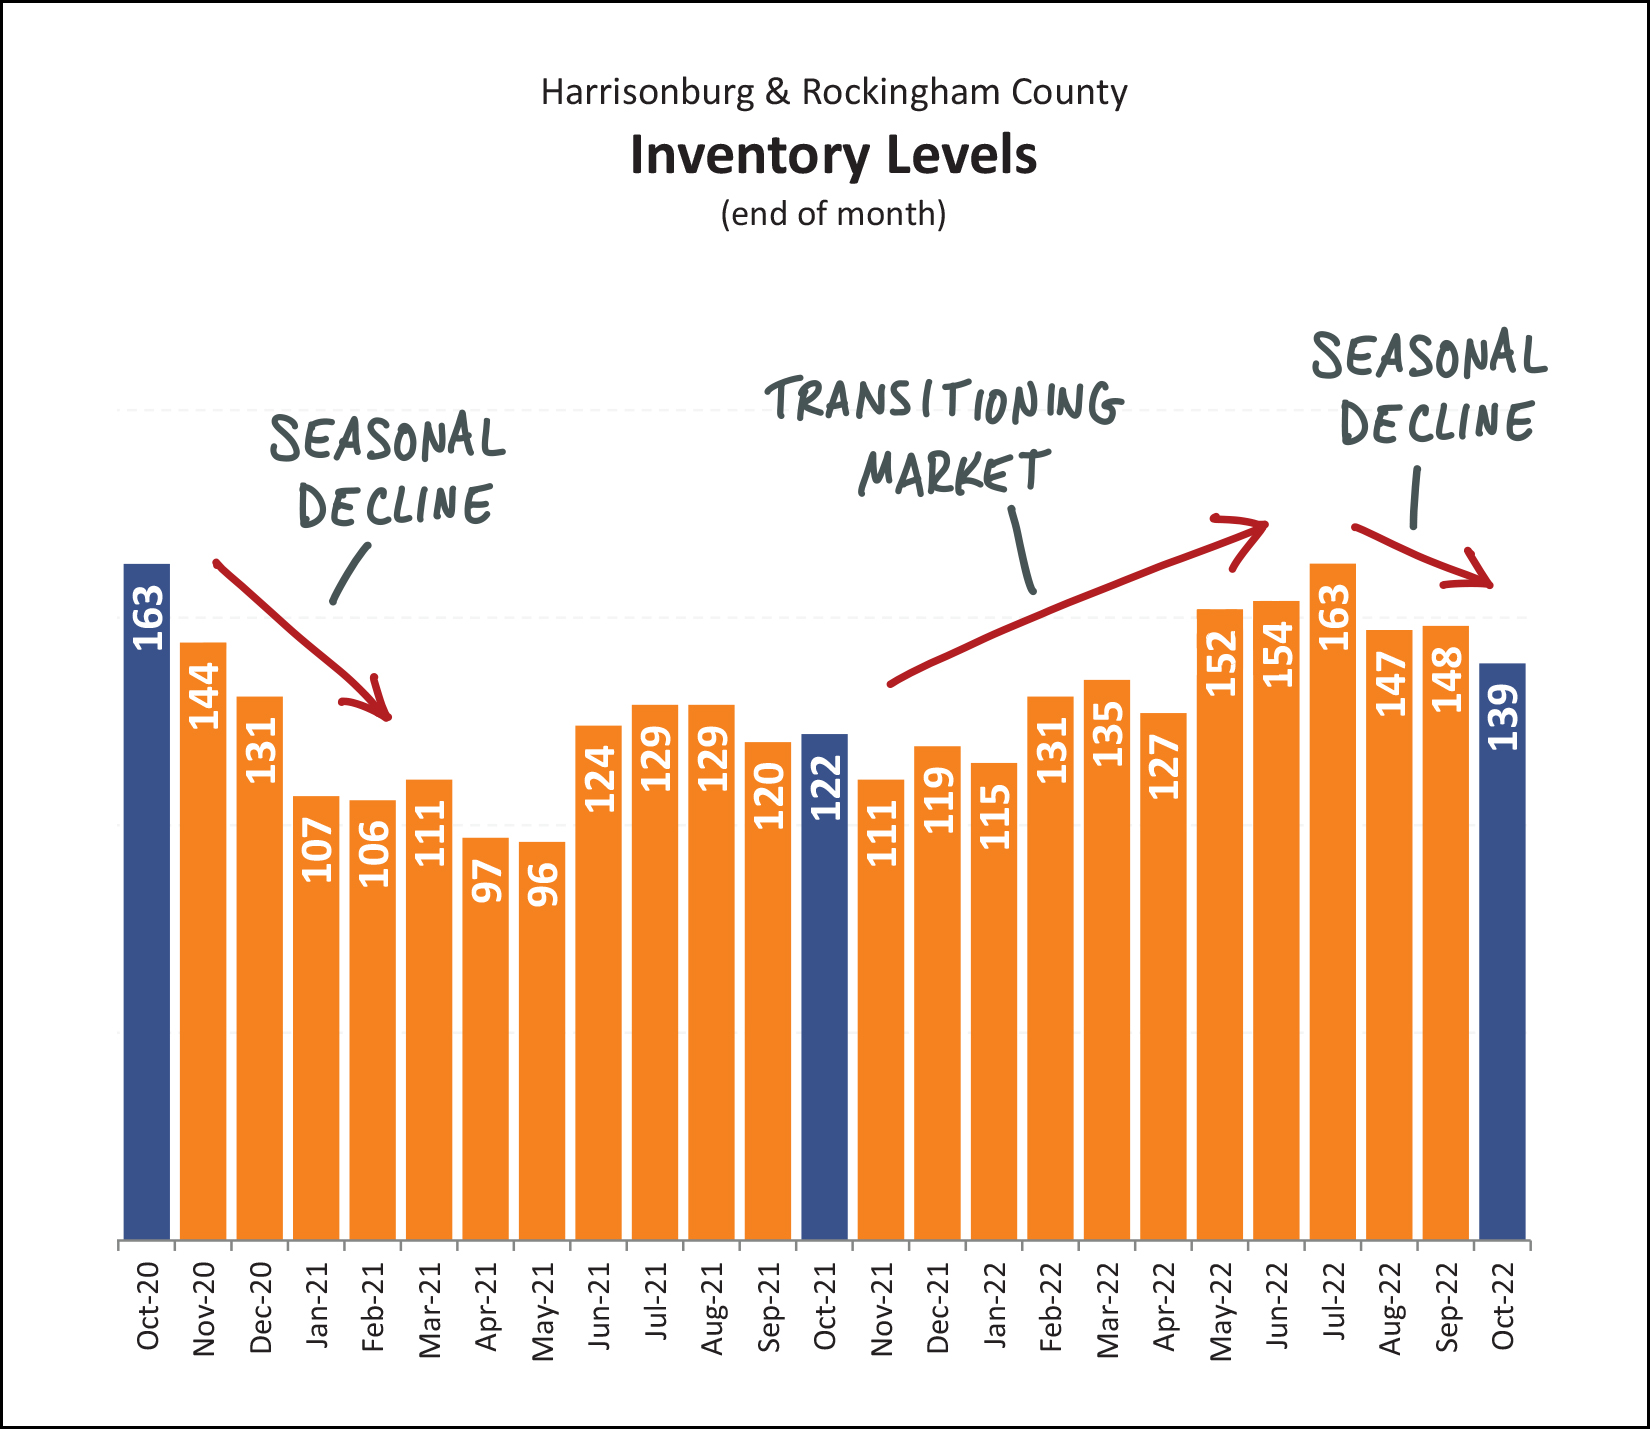 Over the past several years we have seen extremely low inventory levels at any given point in time. Plenty of homes have been listed for sale, but they have gone under contract very quickly given very strong buyer demand in almost all price ranges and locations. During much of 2022 we started to see an increase in the number of homes listed for sale...rising to 163 homes for sale in July... compared to only 129 the previous July. So, yes, the market seems to be transitioning a bit... perhaps we won't see super low inventory levels forever. But despite signs of a slowly transitioning market during the spring and summer of 2022, we are now seeing a normal seasonal decline in inventory levels as we work our way into the fall. The place where the rubber meets the road is when we combine buyer activity (demand) and housing inventory (supply) to see what balance does or does not exist in the market... 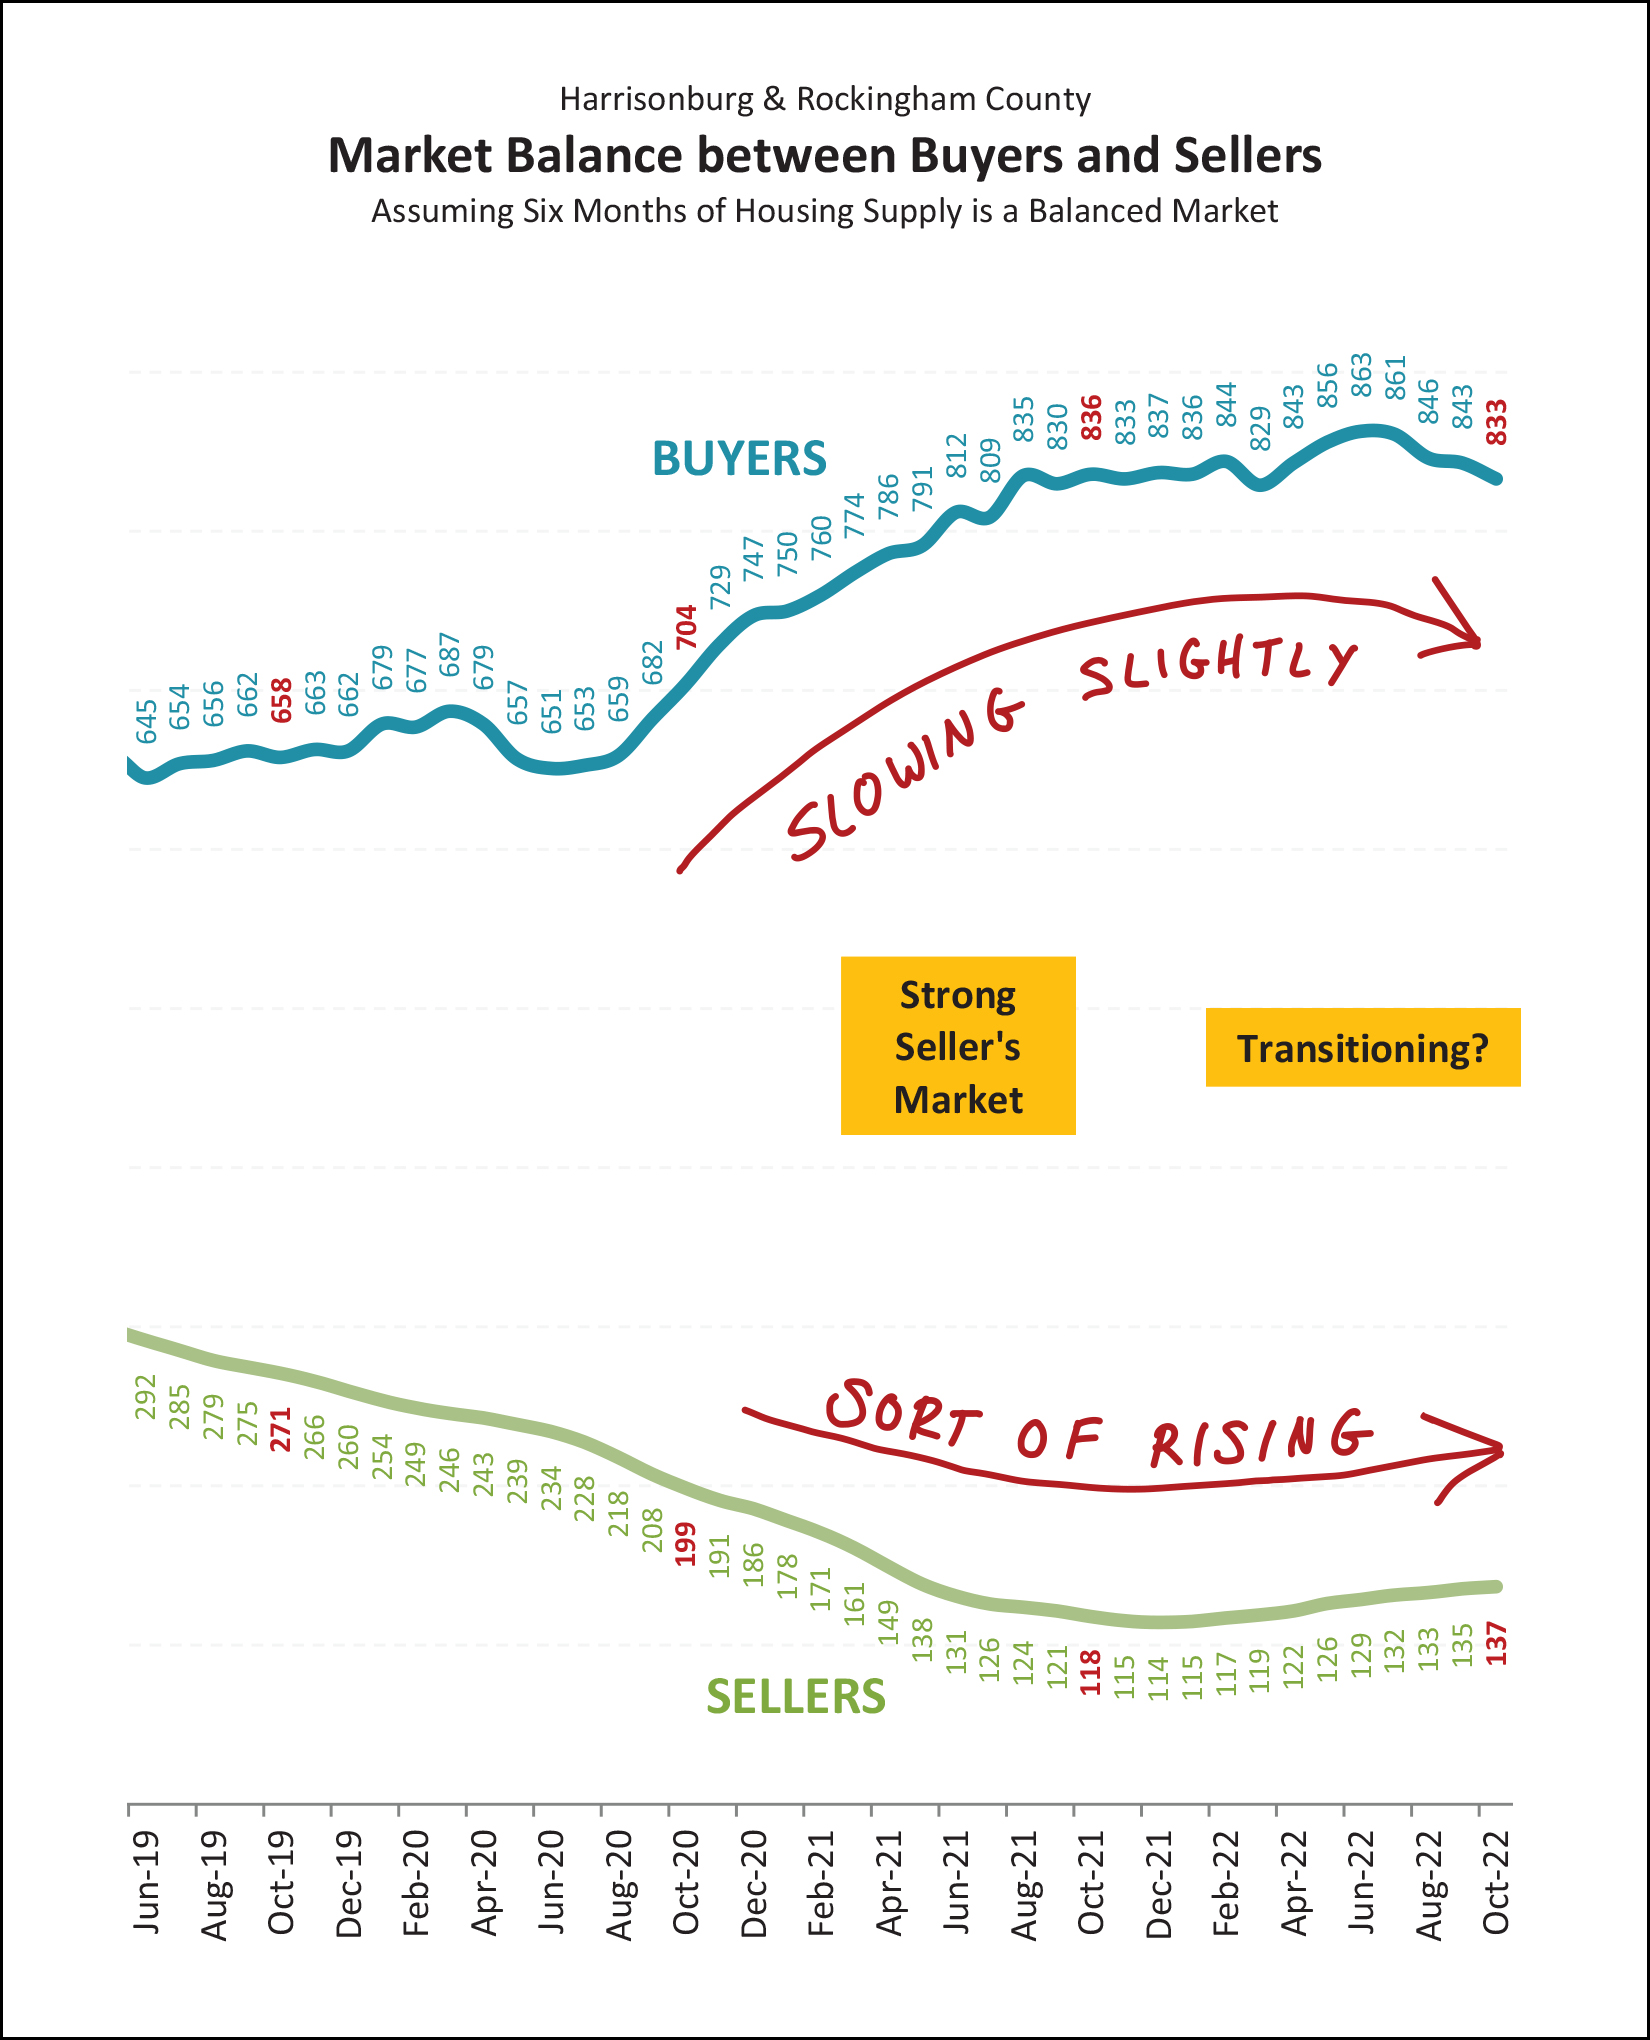 As shown above, we may be starting to see a slight, modest, tiny transition in the balance of the market. We are starting to see buying activity slow... slightly. We are also starting to see inventory levels rise... slightly. Do keep in mind, though, that this is likely a transition from an extremely strong seller's market to a very strong seller's market. There is still very strong demand in the market for most properties at most price points and in most locations. To get anywhere close to being a balanced market we would need to see much more significant declines in buyers who want to buy homes and much more significant increases in sellers who want to sell homes. I'm realizing now that my preceding paragraph might now seem like it was leading up to this next graph. Digest the next graph... don't fall off of your chair... and then keep reading below... 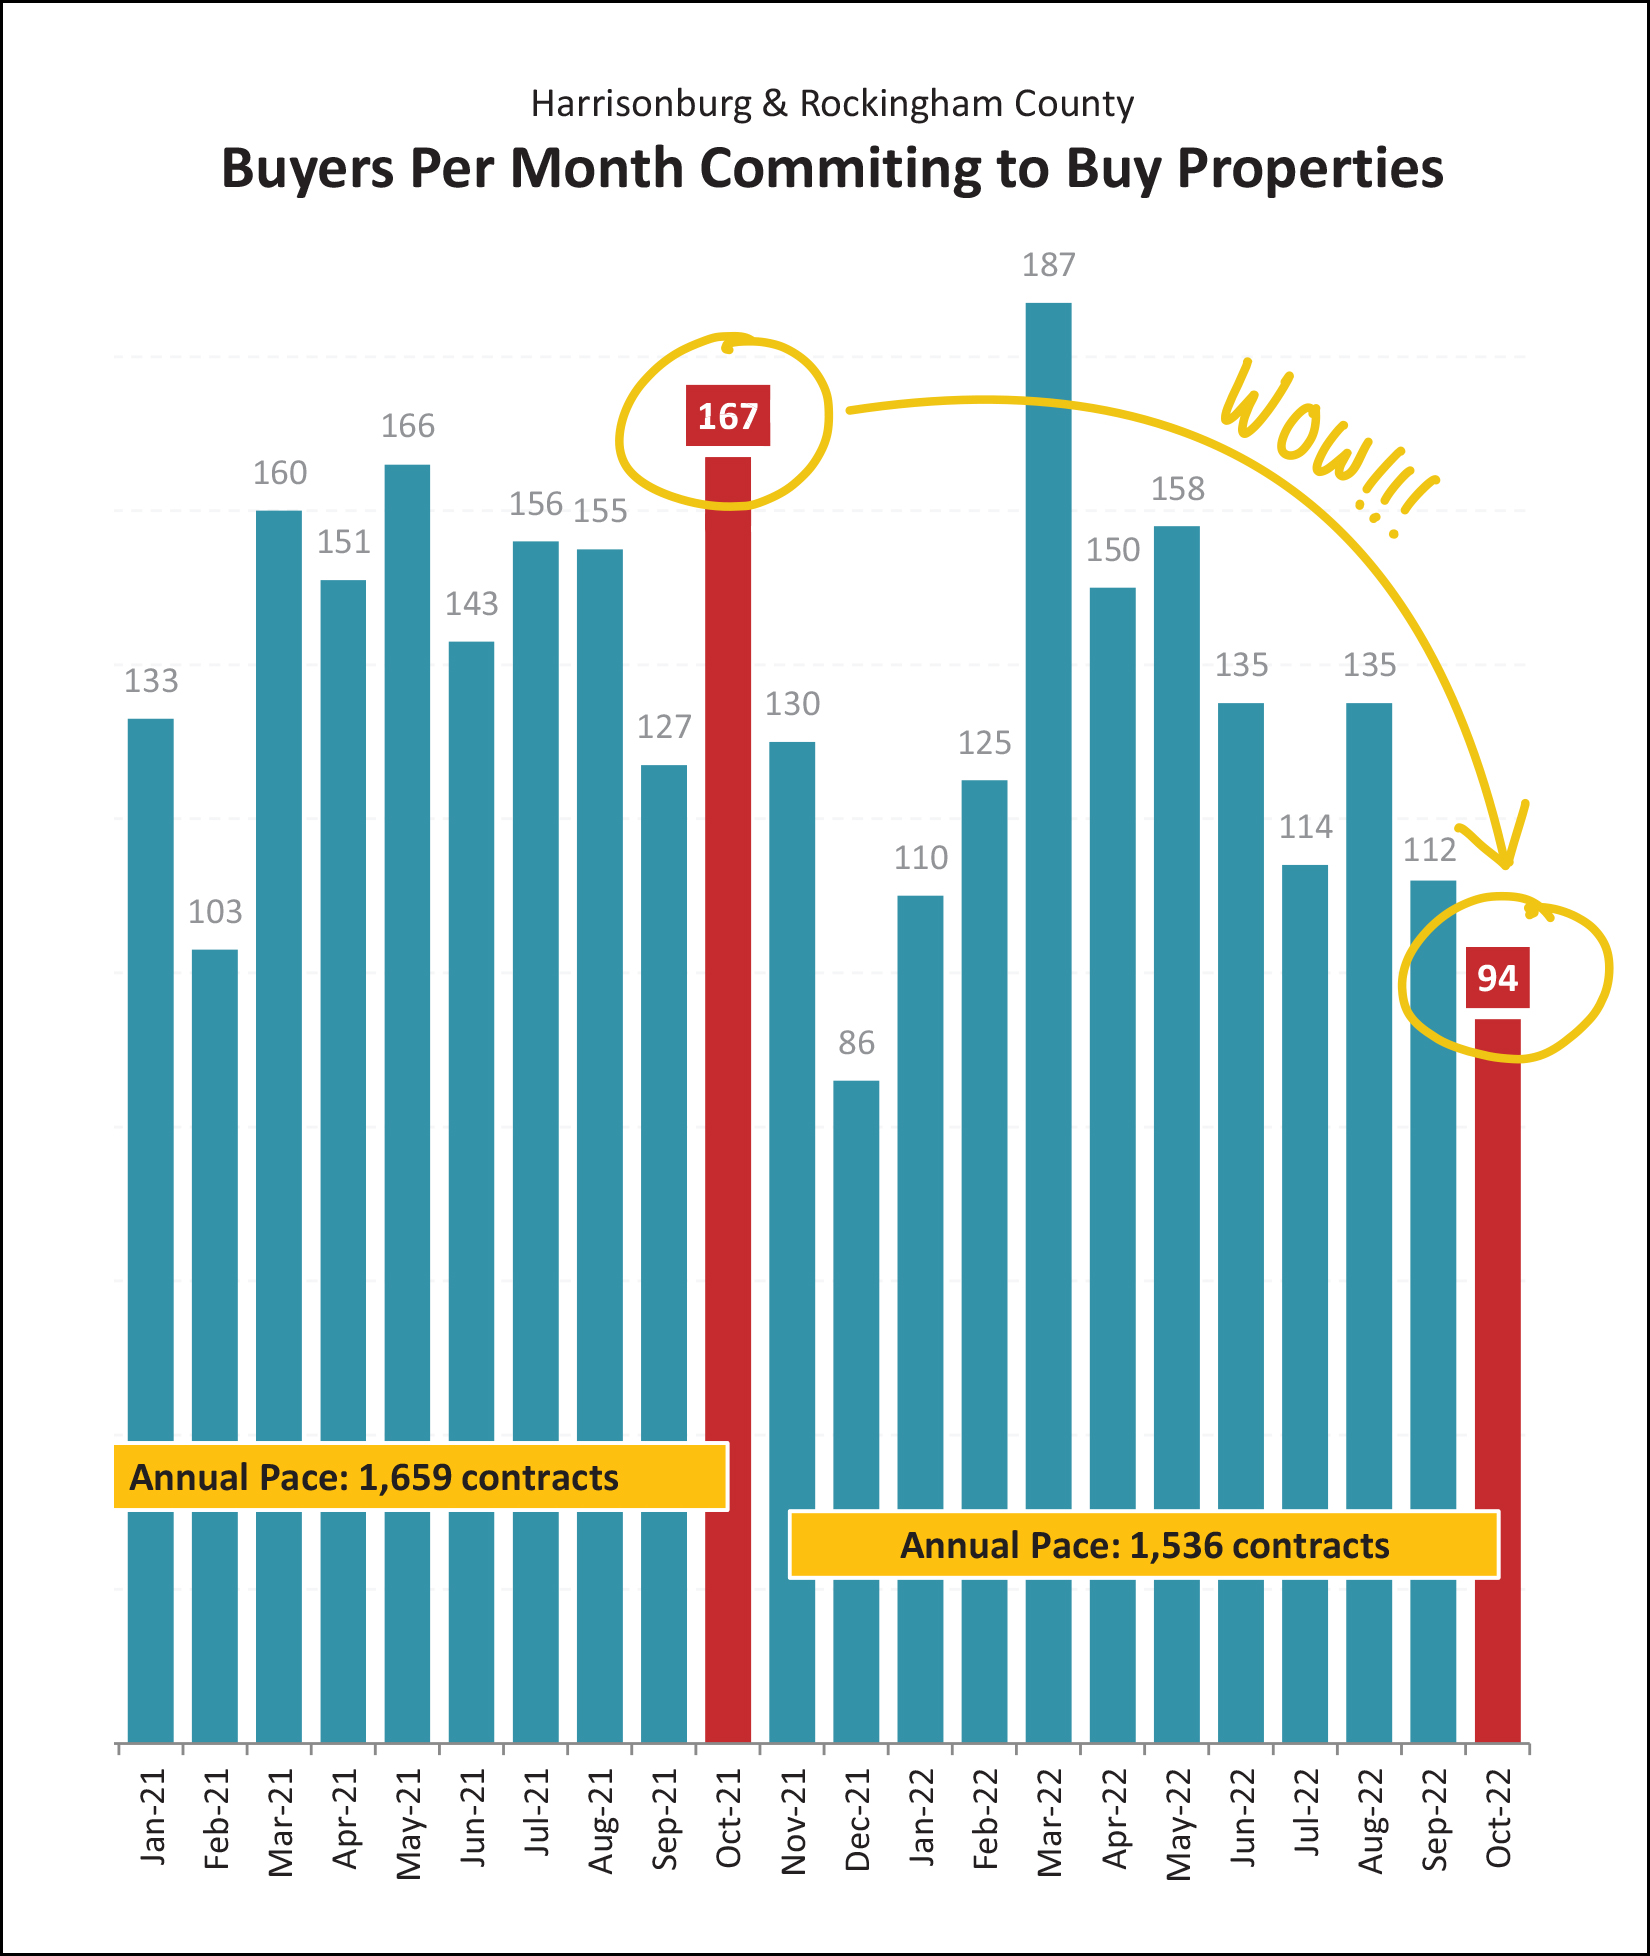 Somewhat surprising, right? There was a significant, large, drastic, huge decline in contracts being signed this October as compared to last October. Why? What happened? Does this mean the market is turning on a dime? Is buyer demand dropping off a cliff overnight? I'd point out a few things... [1] Mortgage interest rates did jump up again, significantly, in September and October - which likely played at least some role in slowing down buyer enthusiasm. Which, side note, was the intended effect -- or at least an understood side effect -- of the interest rate hikes. [2] If we're surprised by the low number of contracts signed this October we should probably be equally (or even more) surprised by the ridiculously high number of contracts signed last October. Last October was the peak of contract signing in all of 2021, which is odd -- that doesn't usually happen in October. All that is to say, the number of contracts signed in October (94) leads me to believe that we will see slightly slower months of home sales in November and December, but it does not cause me to conclude that the market changed drastically sometime in October. Clearly, though, only time will prove me right, wrong, mostly right or mostly wrong. ;-) So... with this big (but perhaps temporary) decline in contracts being signed... and with the slight decline in homes selling... it's probably safe to say that homes are not going under contract as quickly, right? 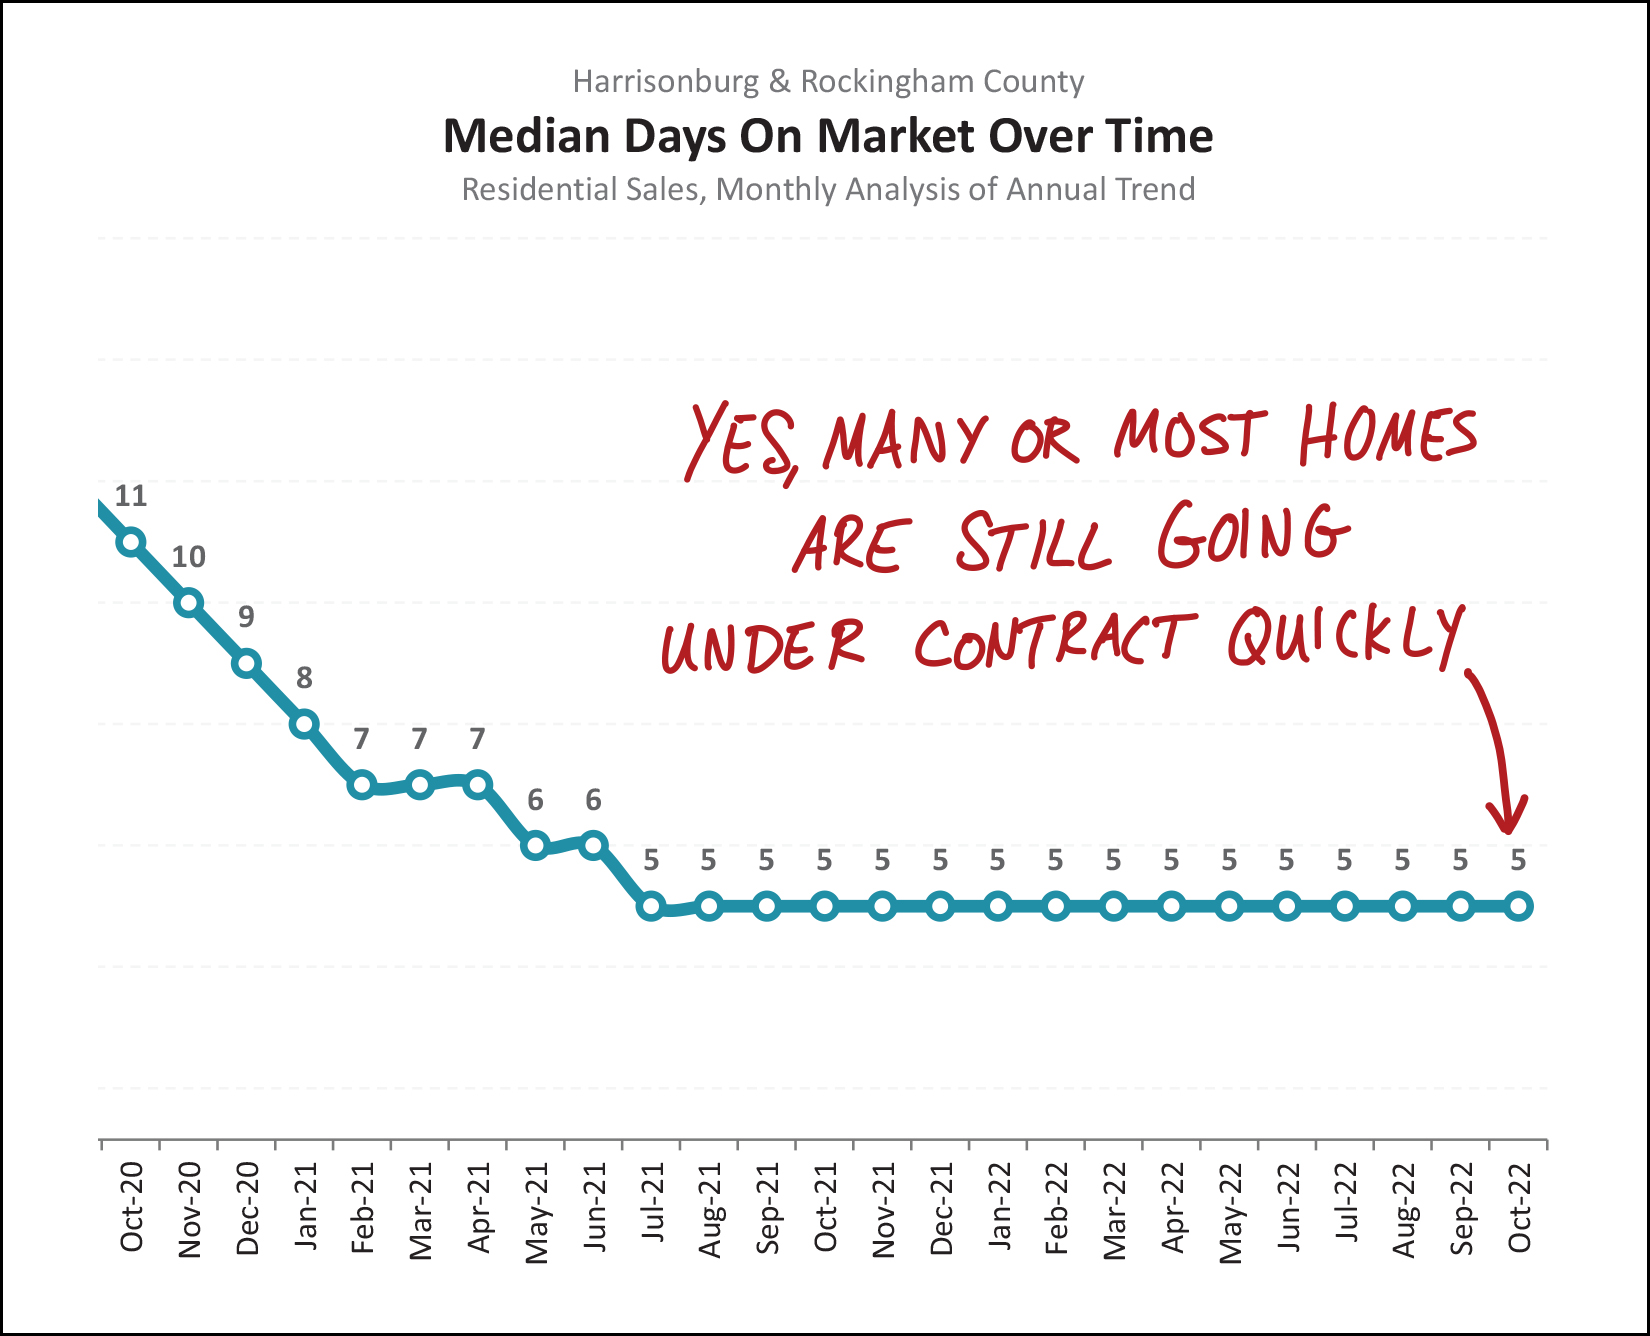 Ummmmm... nope! The "median days on market" metric continues to hover at five days on the market. Homes are still going under contract very quickly. To be clear, this data point above is looking at home sales over the past 12 months to arrive at this "five days" metric. You might then wonder if we would start to see higher "days on market" results if we looked only at the past six months, or three months or one month. Let's take a look... Median Days On Market Past 12 Months = 5 days Past 6 Months = 5 days Past 3 Months = 6 days Past Month = 6 days So, yes, it's taking... one extra day for homes to go under contract. ;-) Now, for our monthly opportunity to point the finger of blame... 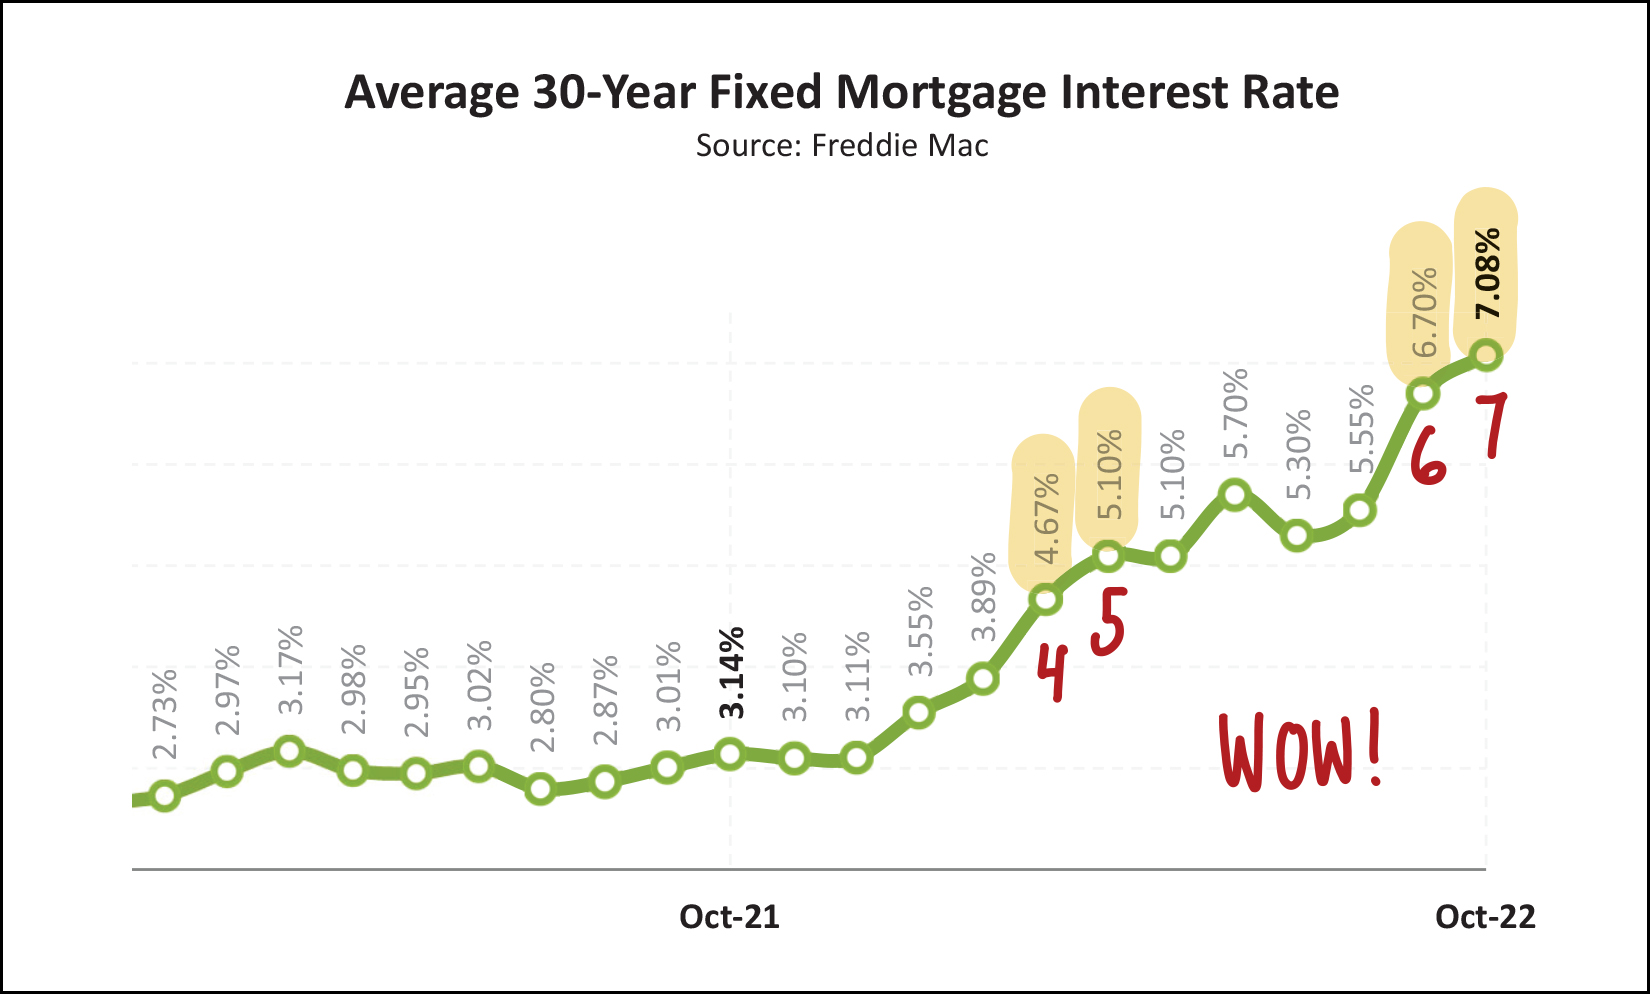 Why oh why are home sales slowing down? Why is contract activity slowing down? What in the world could be causing these changes? ;-) Well, could it be higher mortgage interest rates? We started the year with interest rates below 4% and then proceeded to fly past 4%, 5%, 6% and now 7%. Home buyers will keep on buying as prices rise 10% (or more) per year when mortgage interest rates are between 2% and 4%... but when mortgage interest rates get to 6% or 7% that can start to impact buyer decision making... either because they can no longer afford the monthly mortgage payment... or because they don't want the higher monthly mortgage payment associated with current mortgage interest rates. Just as a bit of context (that is sure to make me sound old) back when Shaena and I bought our first home (a townhouse in Beacon Hill in 2003) our mortgage interest rate was... 6.25%. So, these mortgage interest rates of 6% or 7% aren't absolutely crazy from a long-term context, but after experiencing abnormally low mortgage interest rates for years, and years, and years... a 6% or 7% rate certainly sounds and feels high! Now then, where does all of this leave us? Lots of homes are still selling... rather quickly... at higher prices than ever before... but buyer activity is slowing a bit... at least partially related to high mortgage interest rates. Thus, my advice is as follows, depending on where you fit into our local market... SELLERS - Consider selling sooner rather than later in case mortgage interest rates keep climbing, or in case prices start to level out. BUYERS - Consult with an experienced lender to understand your best mortgage options to make sure you are buying at a reasonable and comfortable price point. HOMEOWNERS - Enjoy your (likely) low mortgage interest rate, and your still-increasing home value. If you're considering buying or selling yet this year... or in early 2023... let's chat sooner rather than later to formulate a game plan. The first step? Email me or text/call me at 540-578-0102. I'll provide another market update next month, but between now and then I hope you have a wonderful Thanksgiving and that you are able to let those dear to you know how thankful you are that they are a part of your life. Happy Thanksgiving! | |
Harrisonburg Area Home Sales Slowing Slightly But Prices Keep Rising |
|
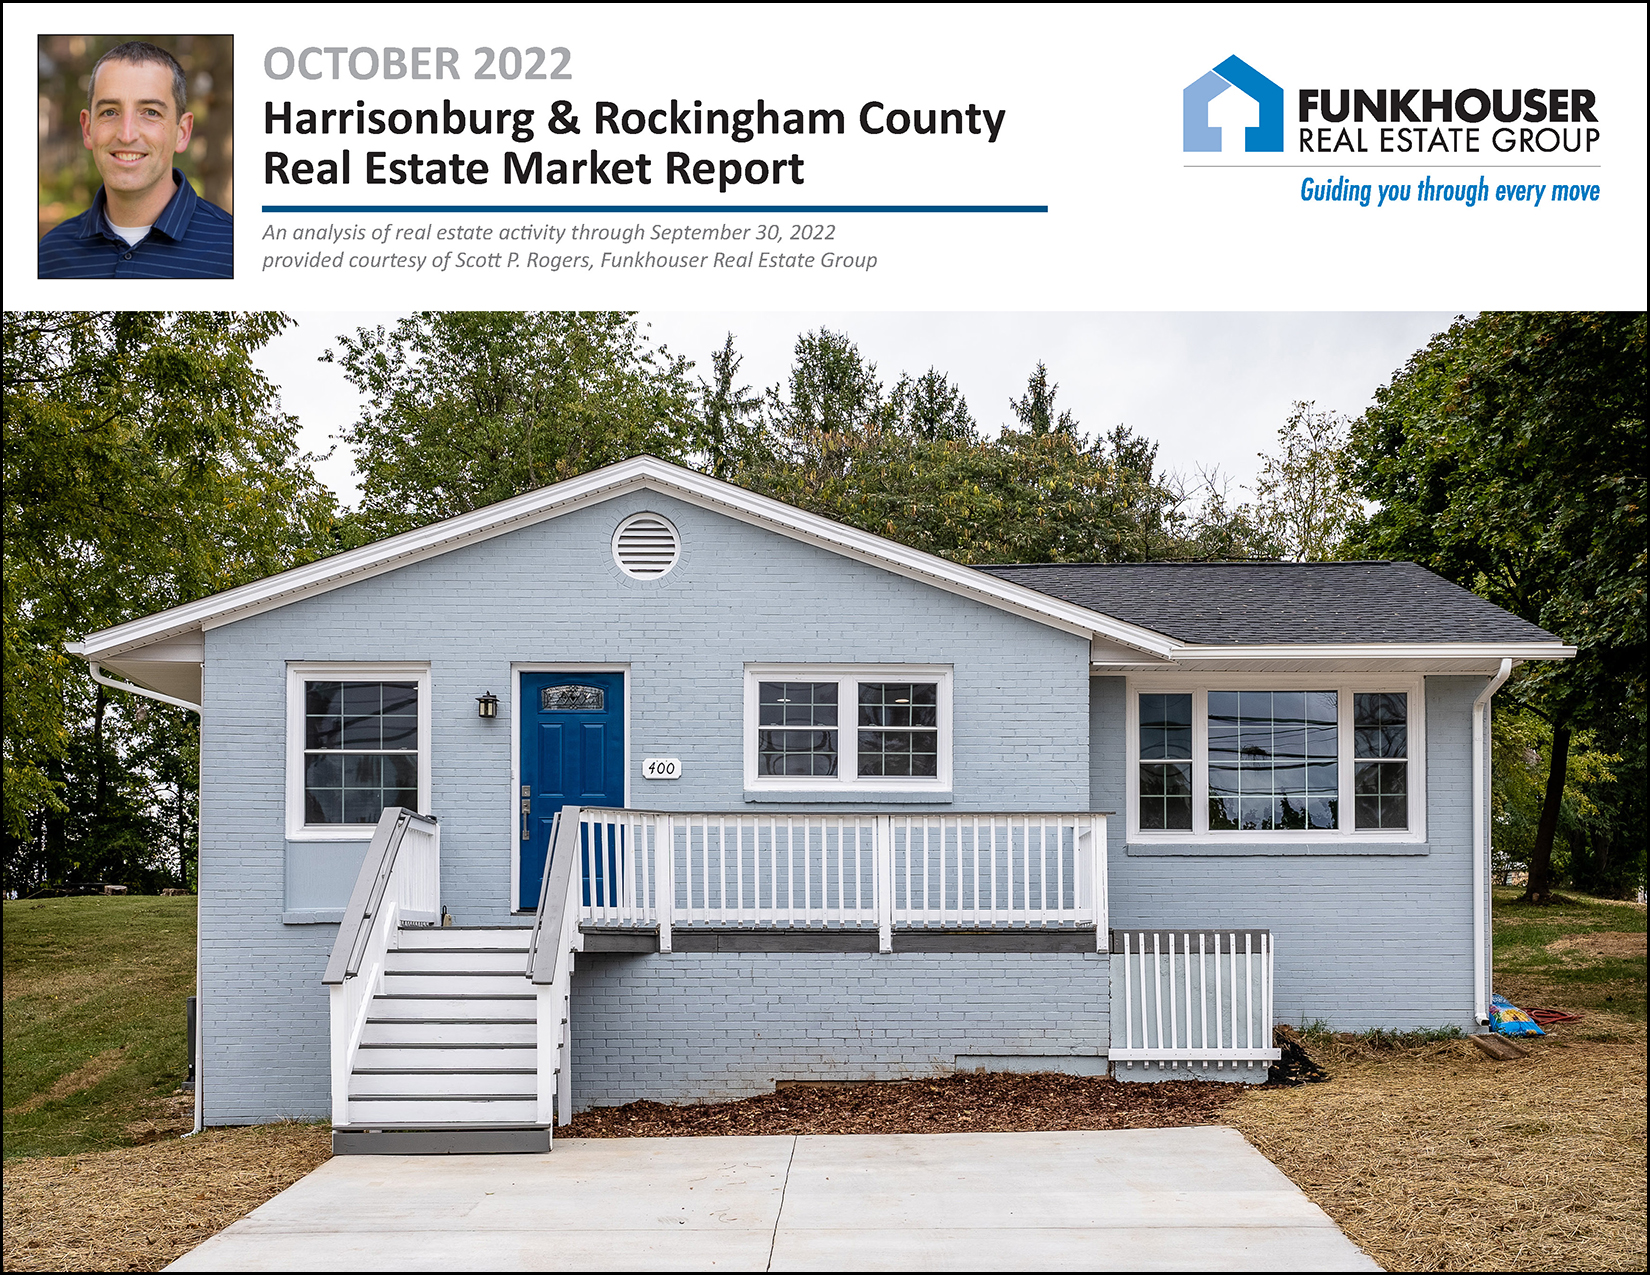 Happy Thursday afternoon, friends! Fall is upon us... with cool mornings and evenings, but often still reaching pleasant afternoon temperatures... and beautiful colors on trees throughout the Valley! Fall is my favorite season for the reasons above, and because it's volleyball season. My daughter plays JV volleyball and I coach middle school volleyball, both of which bring a lot of fun, excitement and joy to my life each fall. I hope that your fall, likewise, is full of fun, excitement and joy! Before we get to real estate... Each month I offer a giveaway, of sorts, for readers of this market report, highlighting some of my favorite places (or things) in Harrisonburg. Recent highlights have included Black Sheep Coffee and the Harrisonburg Half Marathon and the JMU Forbes Center. I'm bouncing back to another of my favorite spots to grab a cup of coffee... Bella Gelato, located on West Water Street in downtown Harrisonburg where you can enjoy delicious gelato that is made by hand on site, plus a pastry case of baked goods, and an espresso and coffee bar where you'll often find me ordering a caramel latte. Interested in checking out Bella Gelato? Click here to enter to win a $50 gift card to Bella Gelato! ...and this month's featured home is... The beautifully renovated home on the cover of this month's market report is located on the corner of Franklin Street and Myers Avenue, just a short walk from the many restaurants and shopping destinations in downtown Harrisonburg... such as Bella Gelato. ;-) Check out 400 Franklin Street here. ...and now, the real estate market update... First, before we get to the numbers, let's start with the big picture...it feels like the local housing market is changing or transitioning in some ways. Mortgage interest rates have increased drastically over the past six months and that seems to be impacting the amount of buyer activity and enthusiasm in our local market. Most sellers are experiencing fewer showings and fewer offers in the first week or two of their homes being on the market. But yet, we are still seeing relative stability in the number of homes selling in this area, combined with continued increases in the prices for which homes are selling. 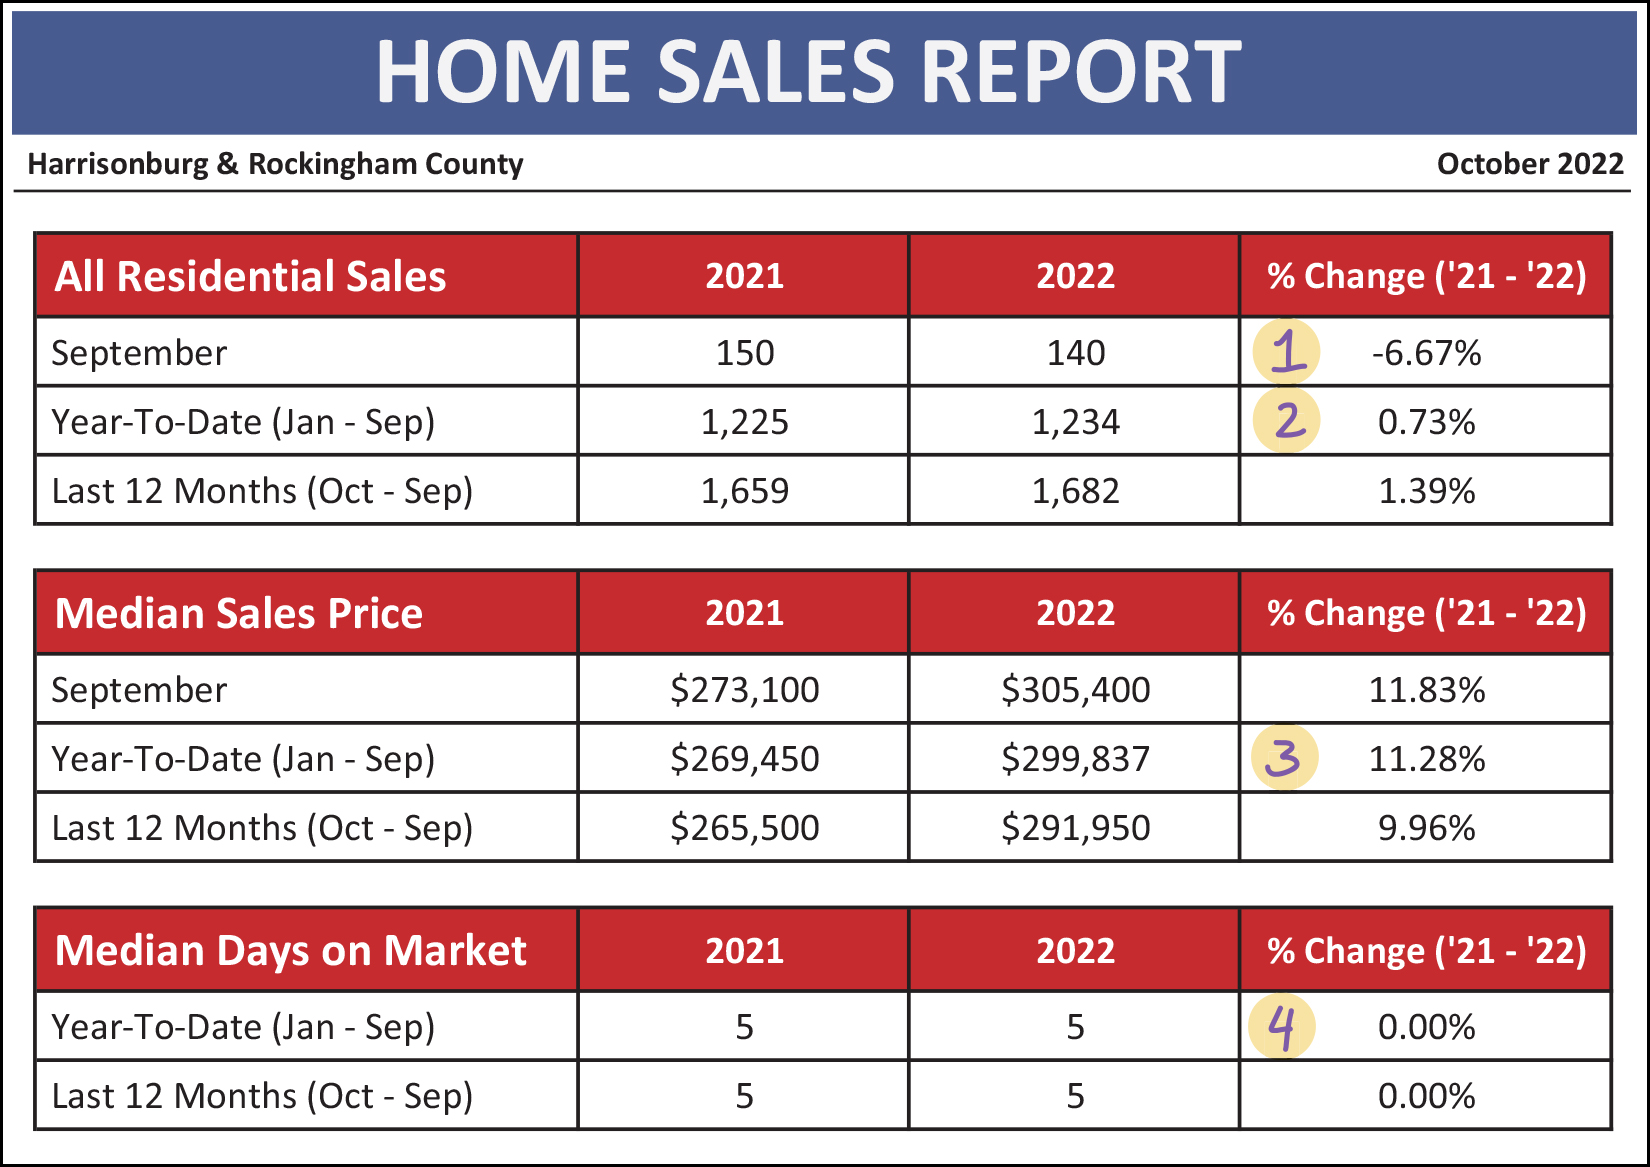 As shown above... [1] Home sales were 7% slower this September than last, with 140 home sales this year compared to 150 home sales last year. [2] Thus far this year we have seen 1,234 home sales in Harrisonburg and Rockingham County, which is 1% more than we saw in the first nine months of last year. [3] The median sales price has increased 11% over the past year in Harrisonburg and Rockingham County, from $269K to $300K. [4] Homes are still selling very quickly, with a median days on market of only five days. More on this later. So if things feel slow lately, how are things still stable? Good question... see below for a month by month breakdown... 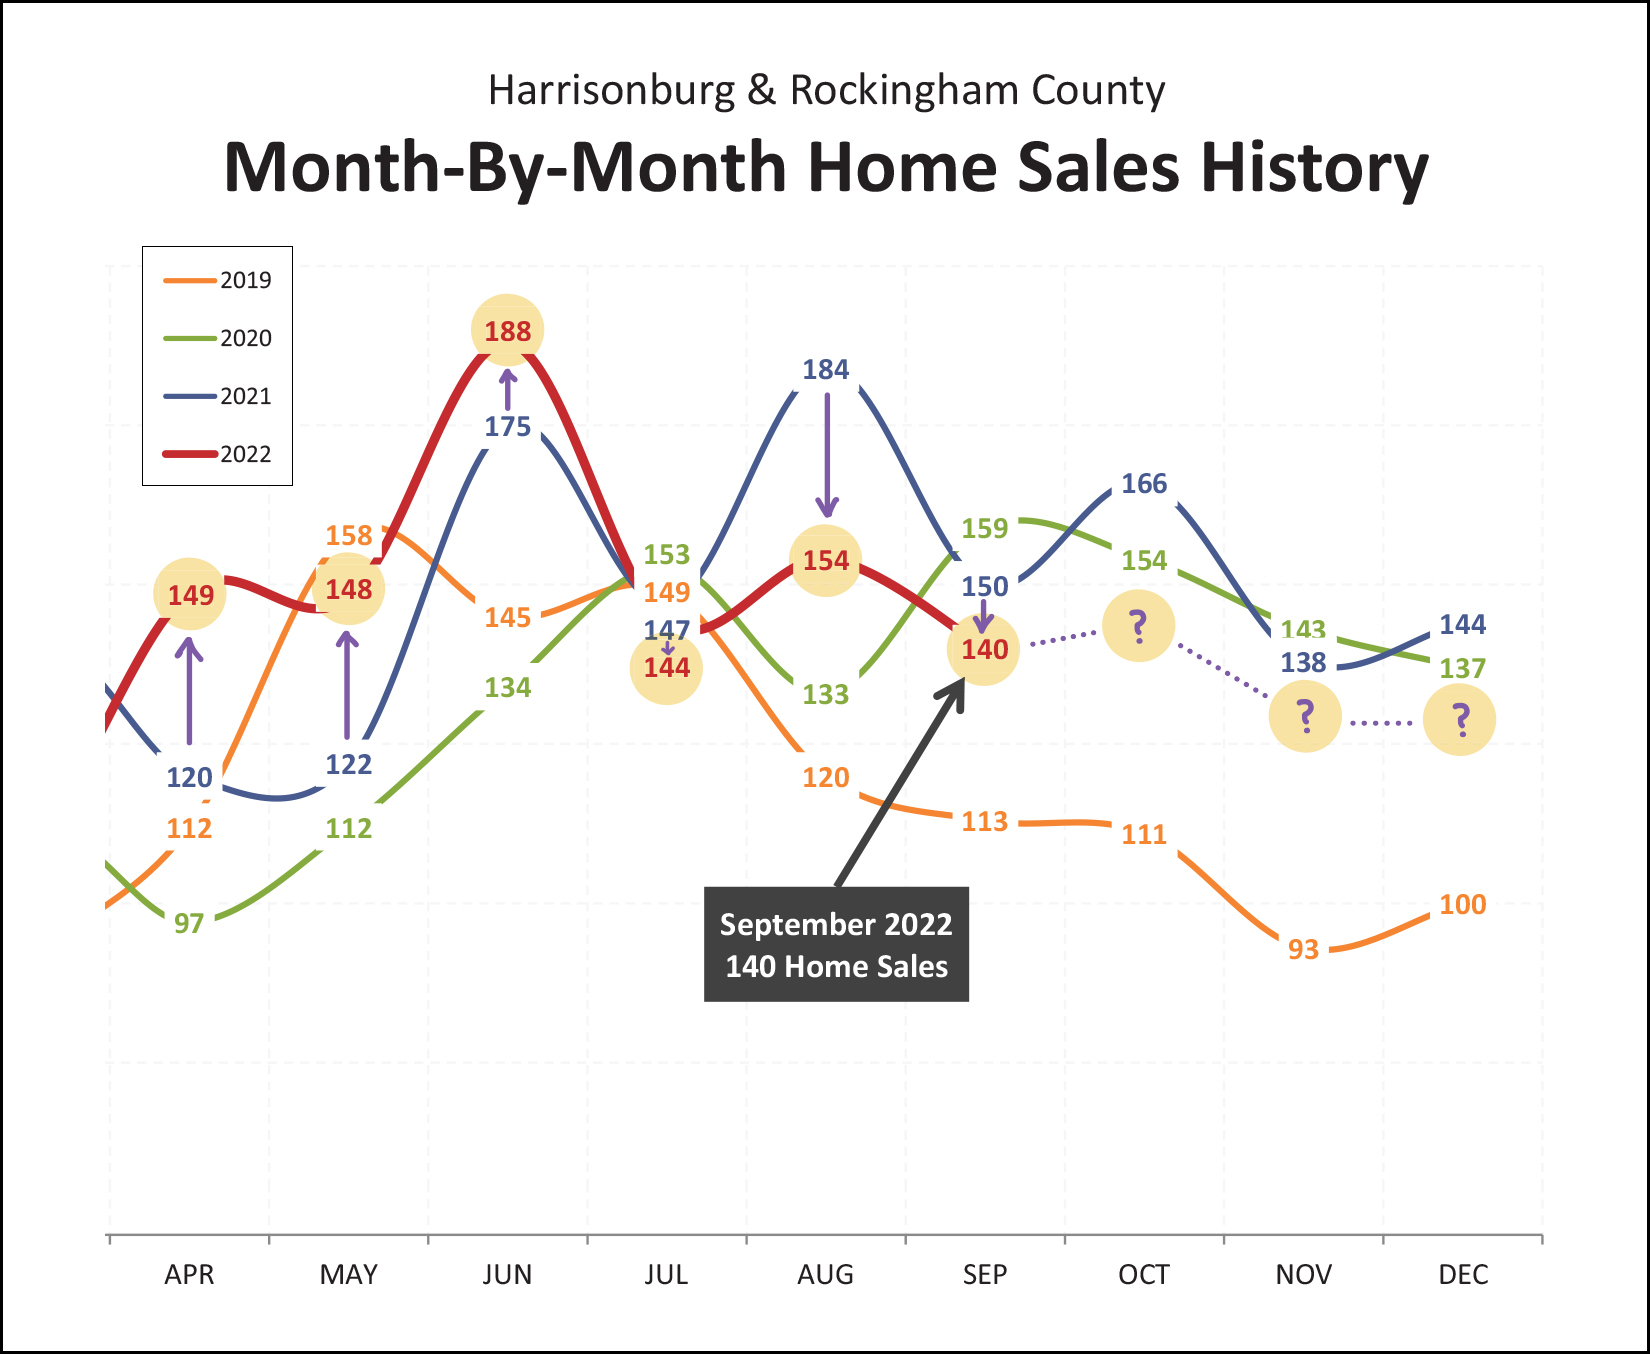 As shown above, we saw much higher numbers of home sales this year during April, May and June, followed by lower numbers of home sales this year during July, August and September. So, we had a very strong second quarter of the year, followed by somewhat weaker third quarter. What, then, will the fourth quarter of the year show? Given that mortgage interest rates keep creeping up higher and higher, I am anticipating that the fourth quarter of this year will show fewer home sales than the fourth quarter of 2021... which would then lead to an overall decline in the number of home sales between 2021 and 2022... if my guess is correct... and I make plenty of guesses that are not correct. ;-) The following graph helps put this year in an even more helpful context... 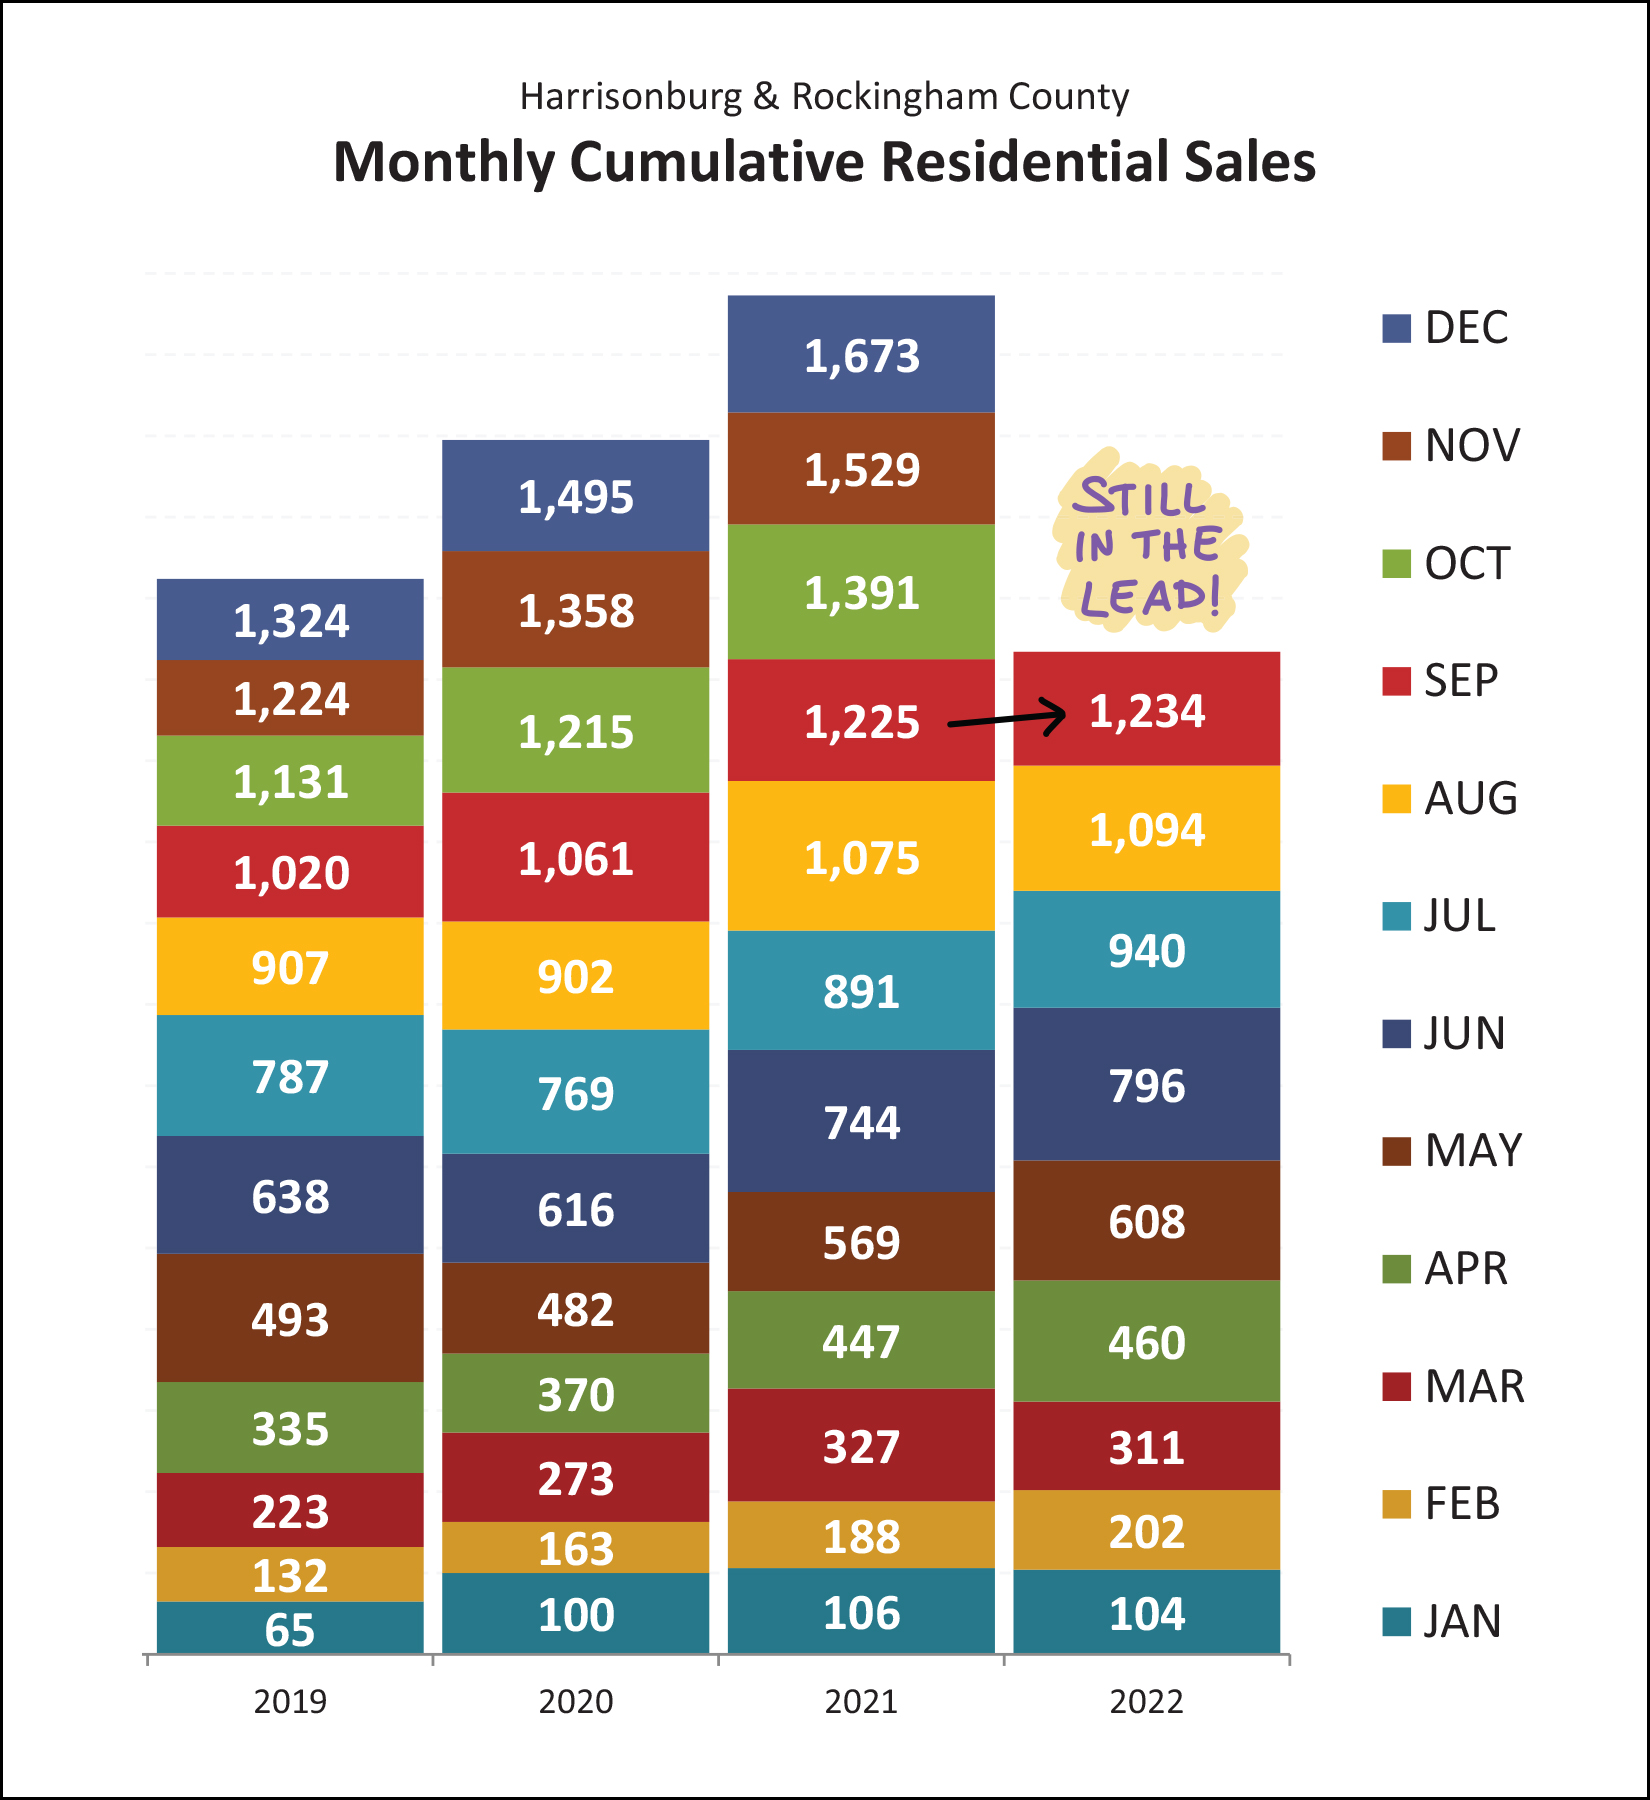 Two few observations about this "stacked up" graph above... [1] Yes, 2022 is still slightly ahead of 2021 through September... but we the gap is much narrower than it was a few months ago. [2] Even if we don't see 1,673 home sales in 2022 to match last year's total count, it seems very likely that we will still eclipse both 2019 and 2022. The following two trends seem to be running counter to each other, at least thus far... 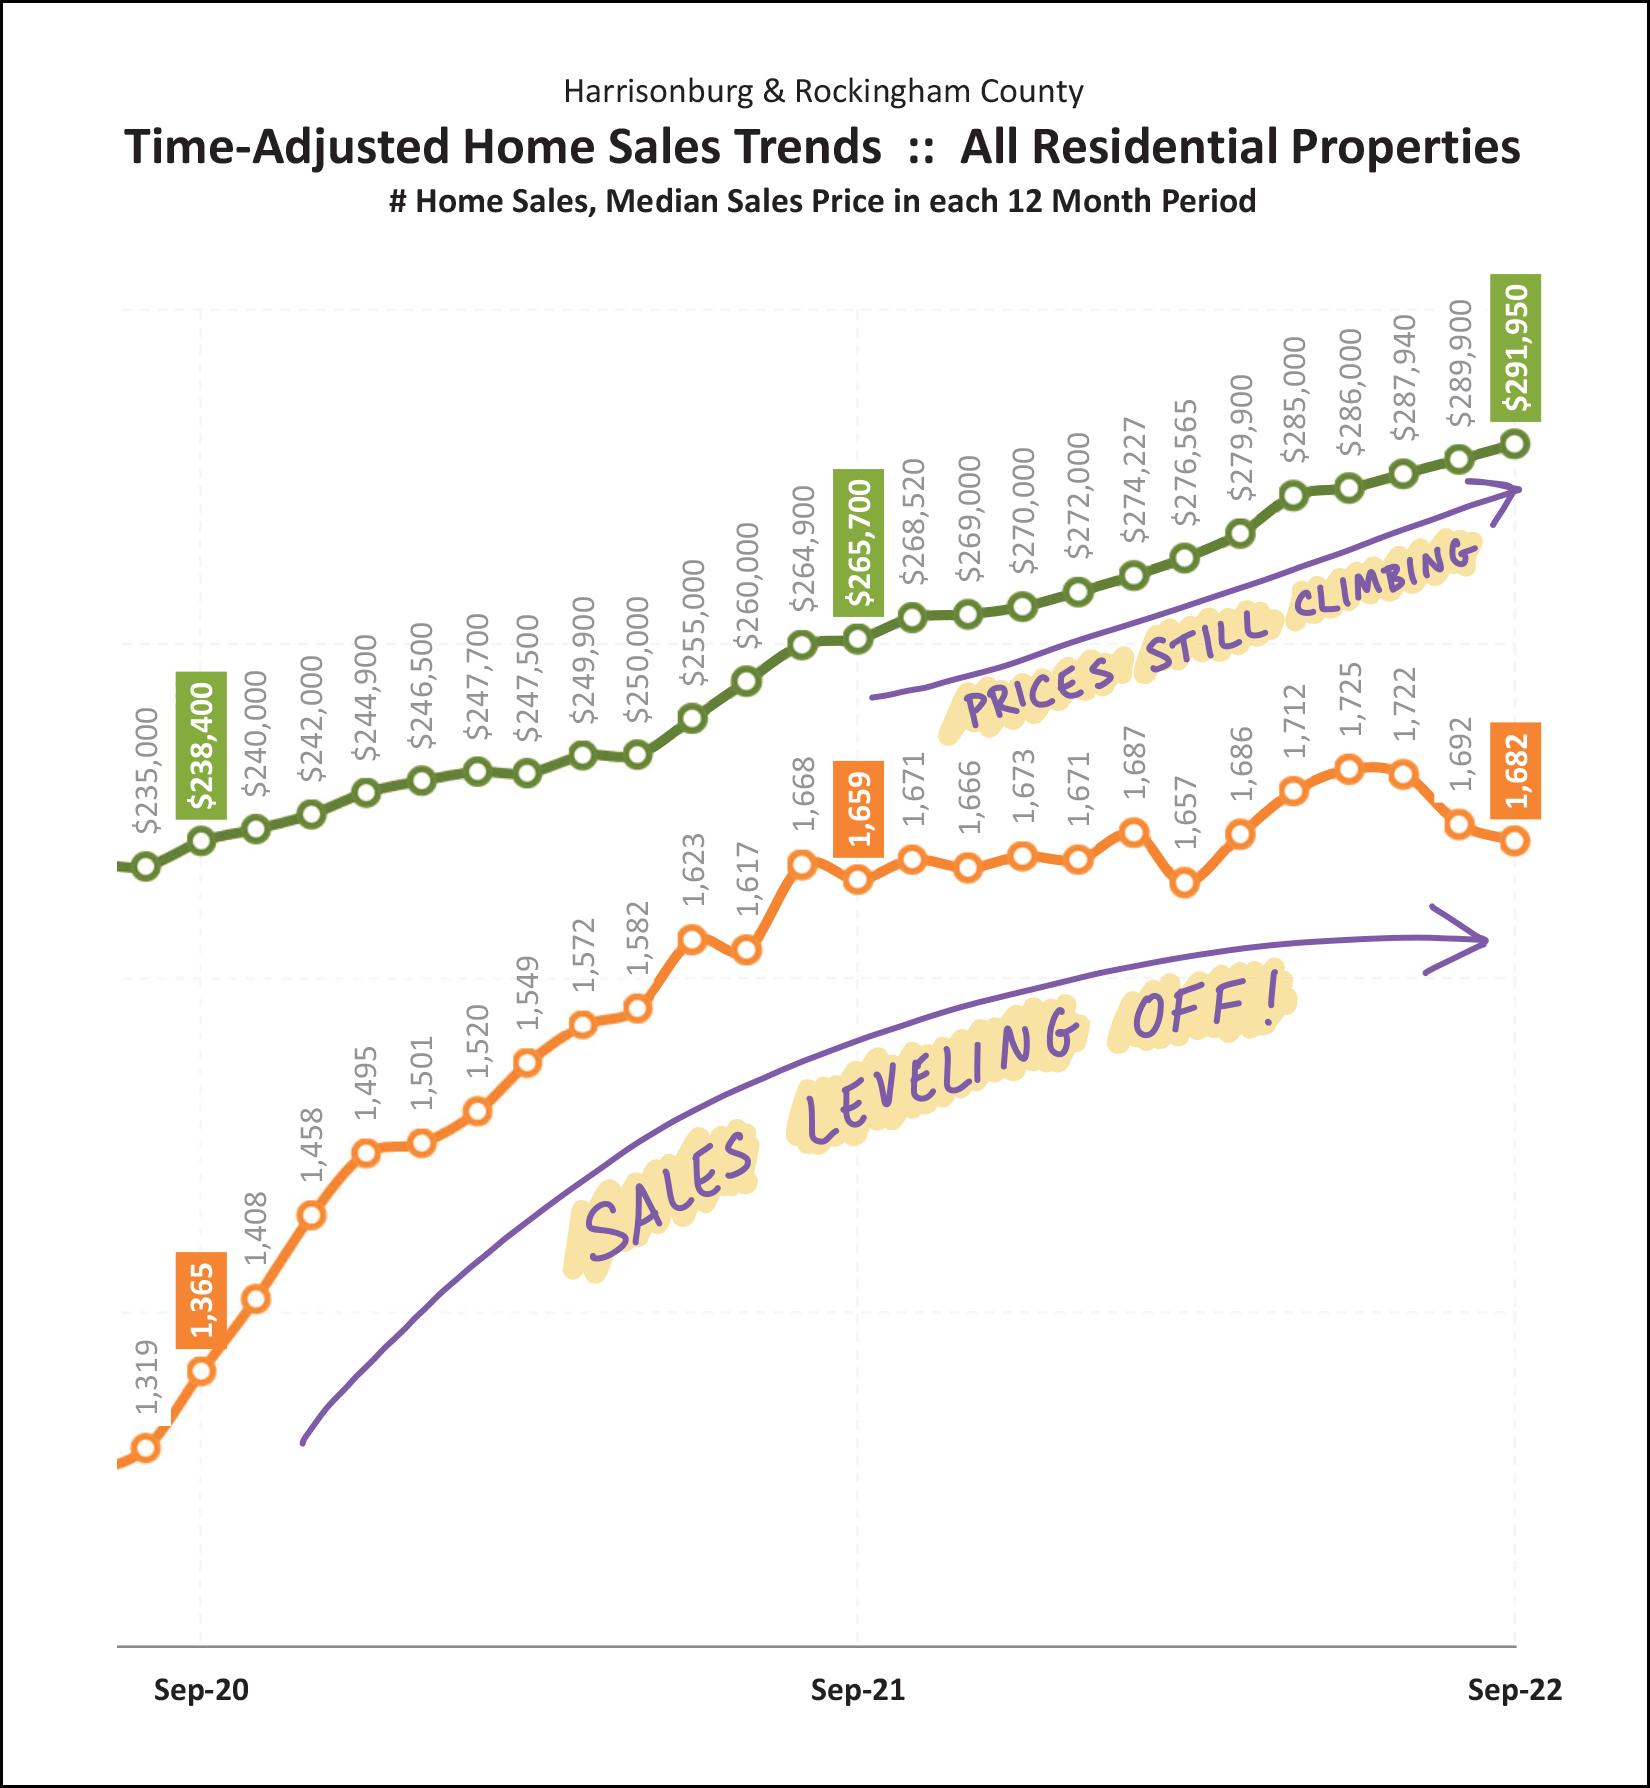 The orange line above shows the number of homes selling on an annual basis in Harrisonburg and Rockingham County. The number of annual sales was climbing quickly through the end of 2021 but has mostly leveled off since the start of 2022. It seems unlikely that the annual pace of home sales will start increasing again anytime soon. The green line above shows the median sales price of homes selling in a 12-month period. As you can see, sales prices keep on rising. The median sales price over the past 12 months has been $292K... which is about $26K higher than the median sales price of $266K just a year ago. Moving forward, I expect we'll see home sales (green line) stay level or decline somewhat... while sales prices (orange line) will likely keep rising or possibly level out a bit. Changes in home prices over time are pretty wild if we scoot back a bit and look at a multi-year picture... 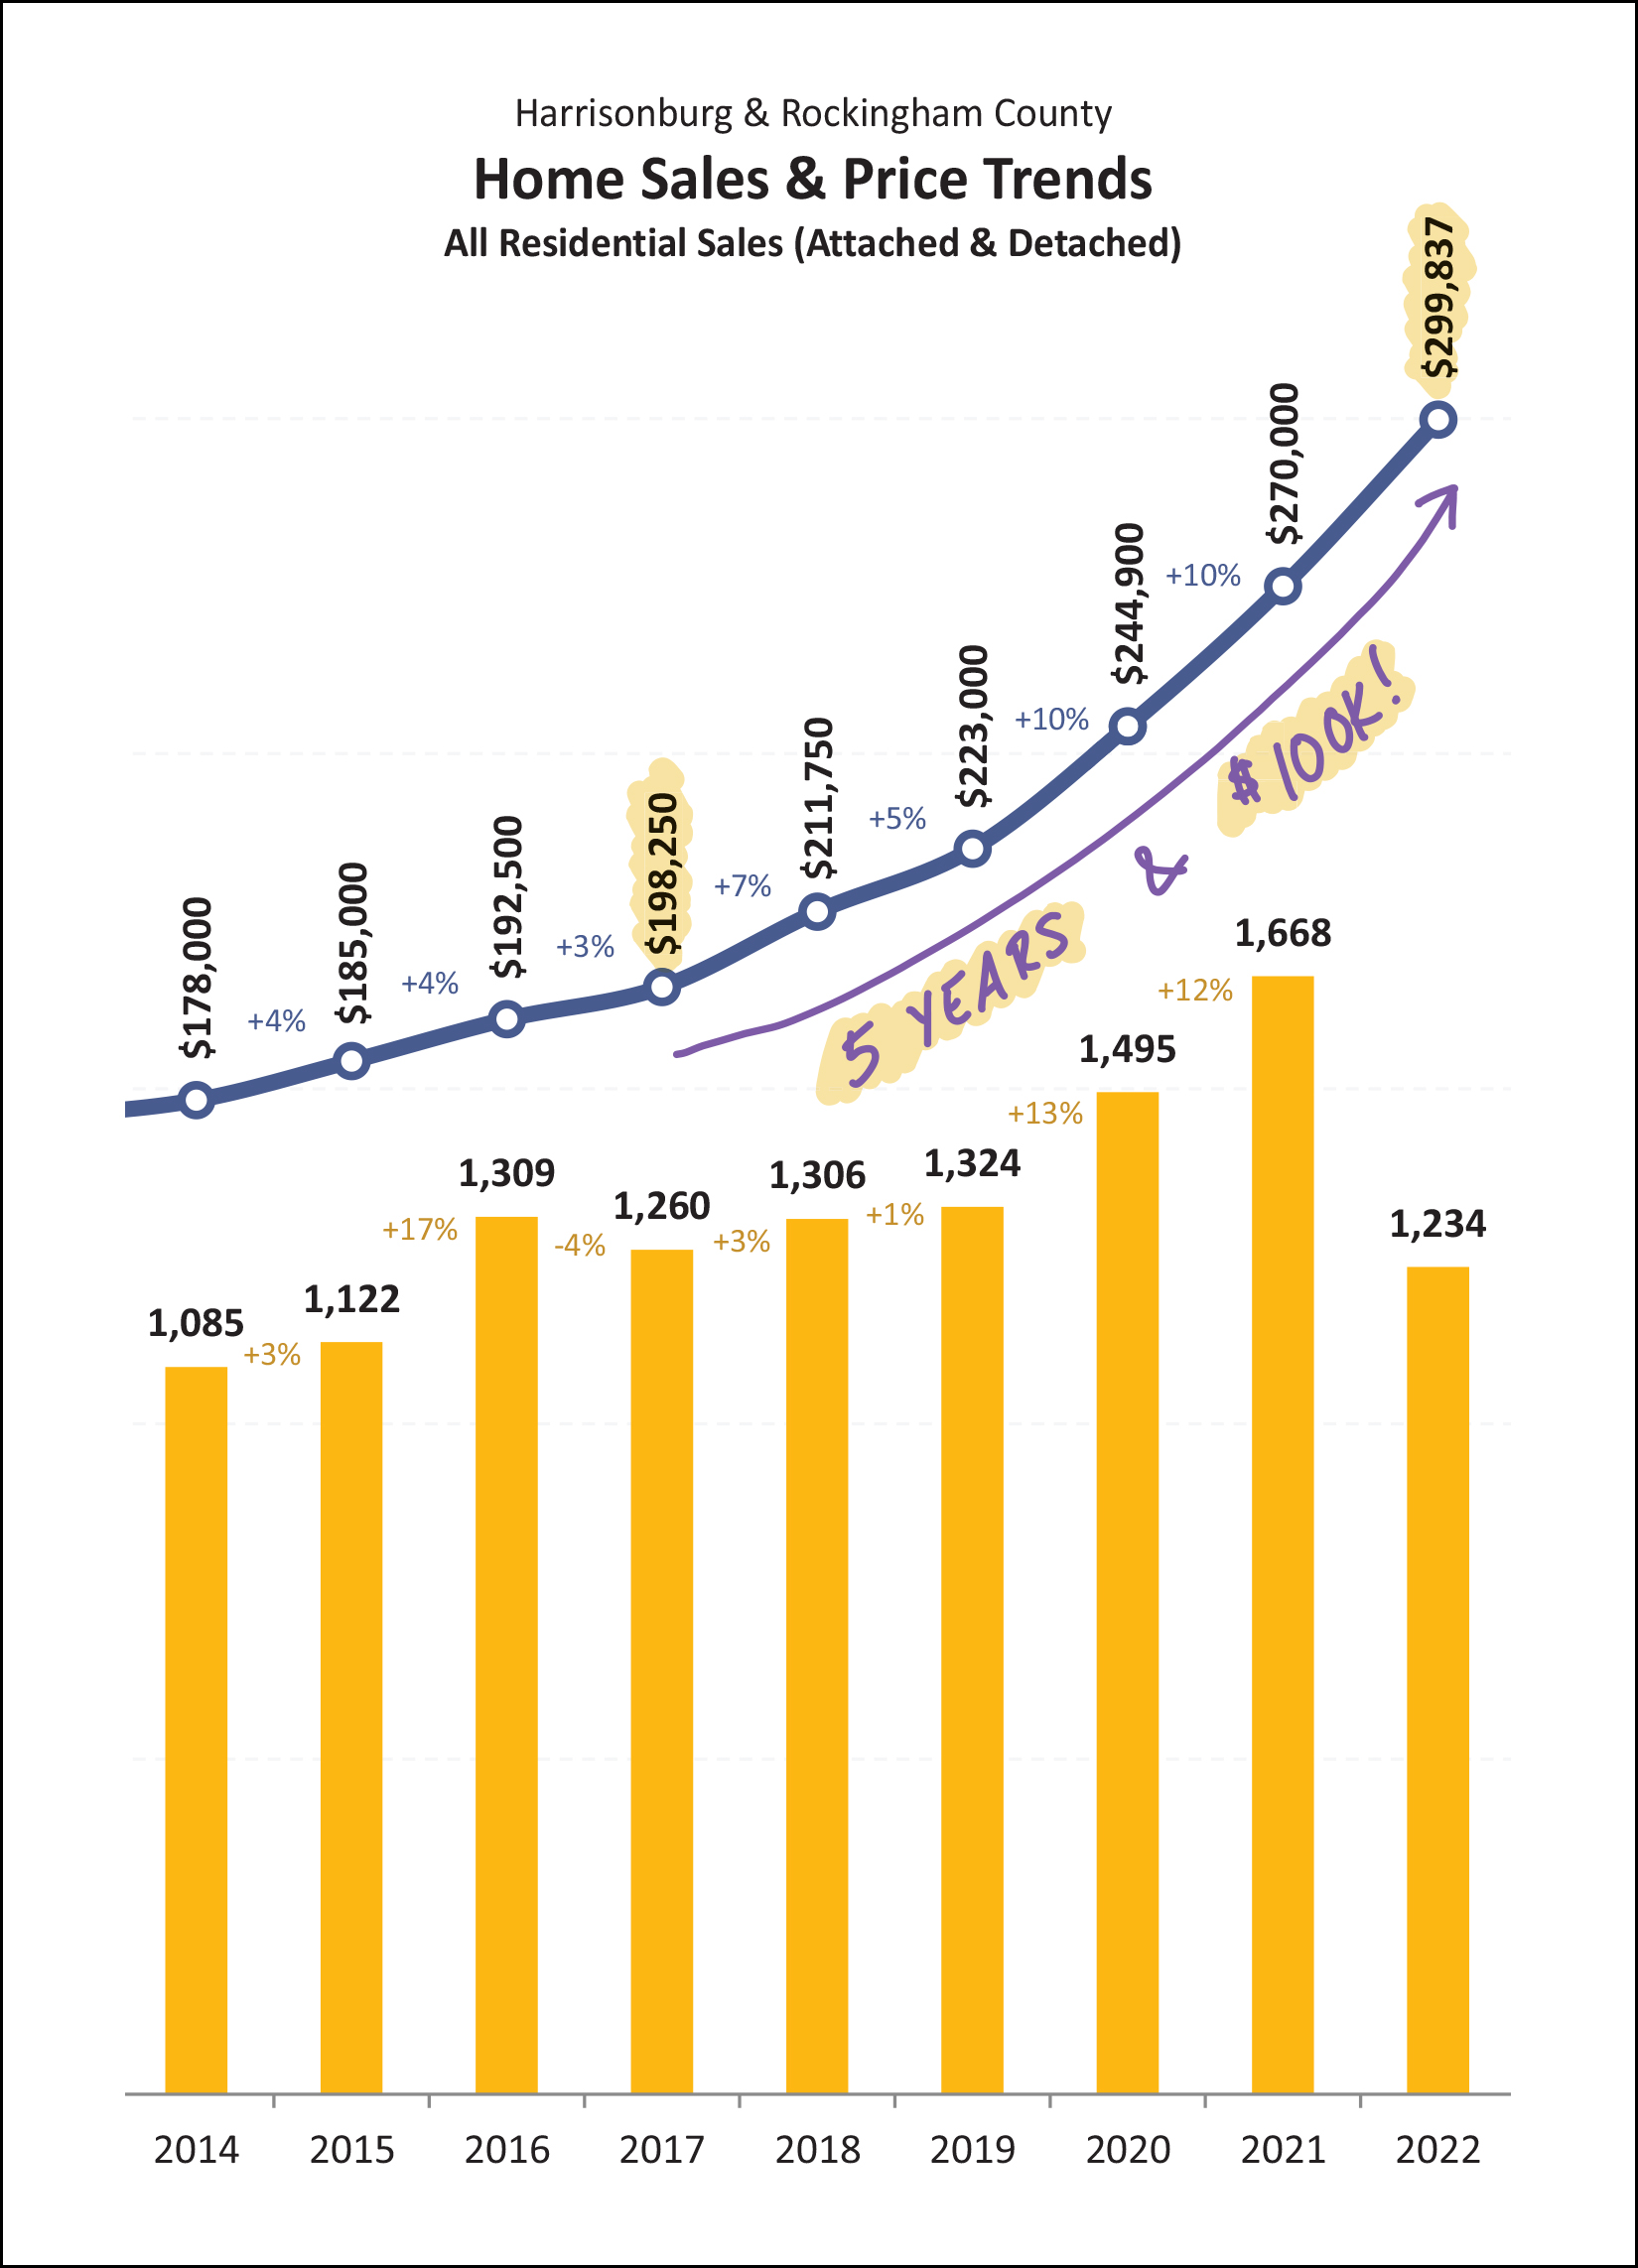 If only everyone had bought a median priced home ($198K) five years ago... then everyone would own a home that is now potentially worth $100,000 more, given the current median sales price of $299,837 in Harrisonburg and Rockingham County. This is a drastic shift in sales prices over a relatively short timeframe, meaning that... [1] Housing is more expensive for anyone who does not currently own a home. [2] Anyone who has owned a home during this time likely saw a significant increase in their home value and net worth. I am simultaneously thrilled for all of my past clients who have bought homes and are feeling good about these trends... and depressed for all of my clients who have not been able to purchase a home and are now faced with much higher purchase prices (and interest rates) in today's market. But back to that leveling off thing... 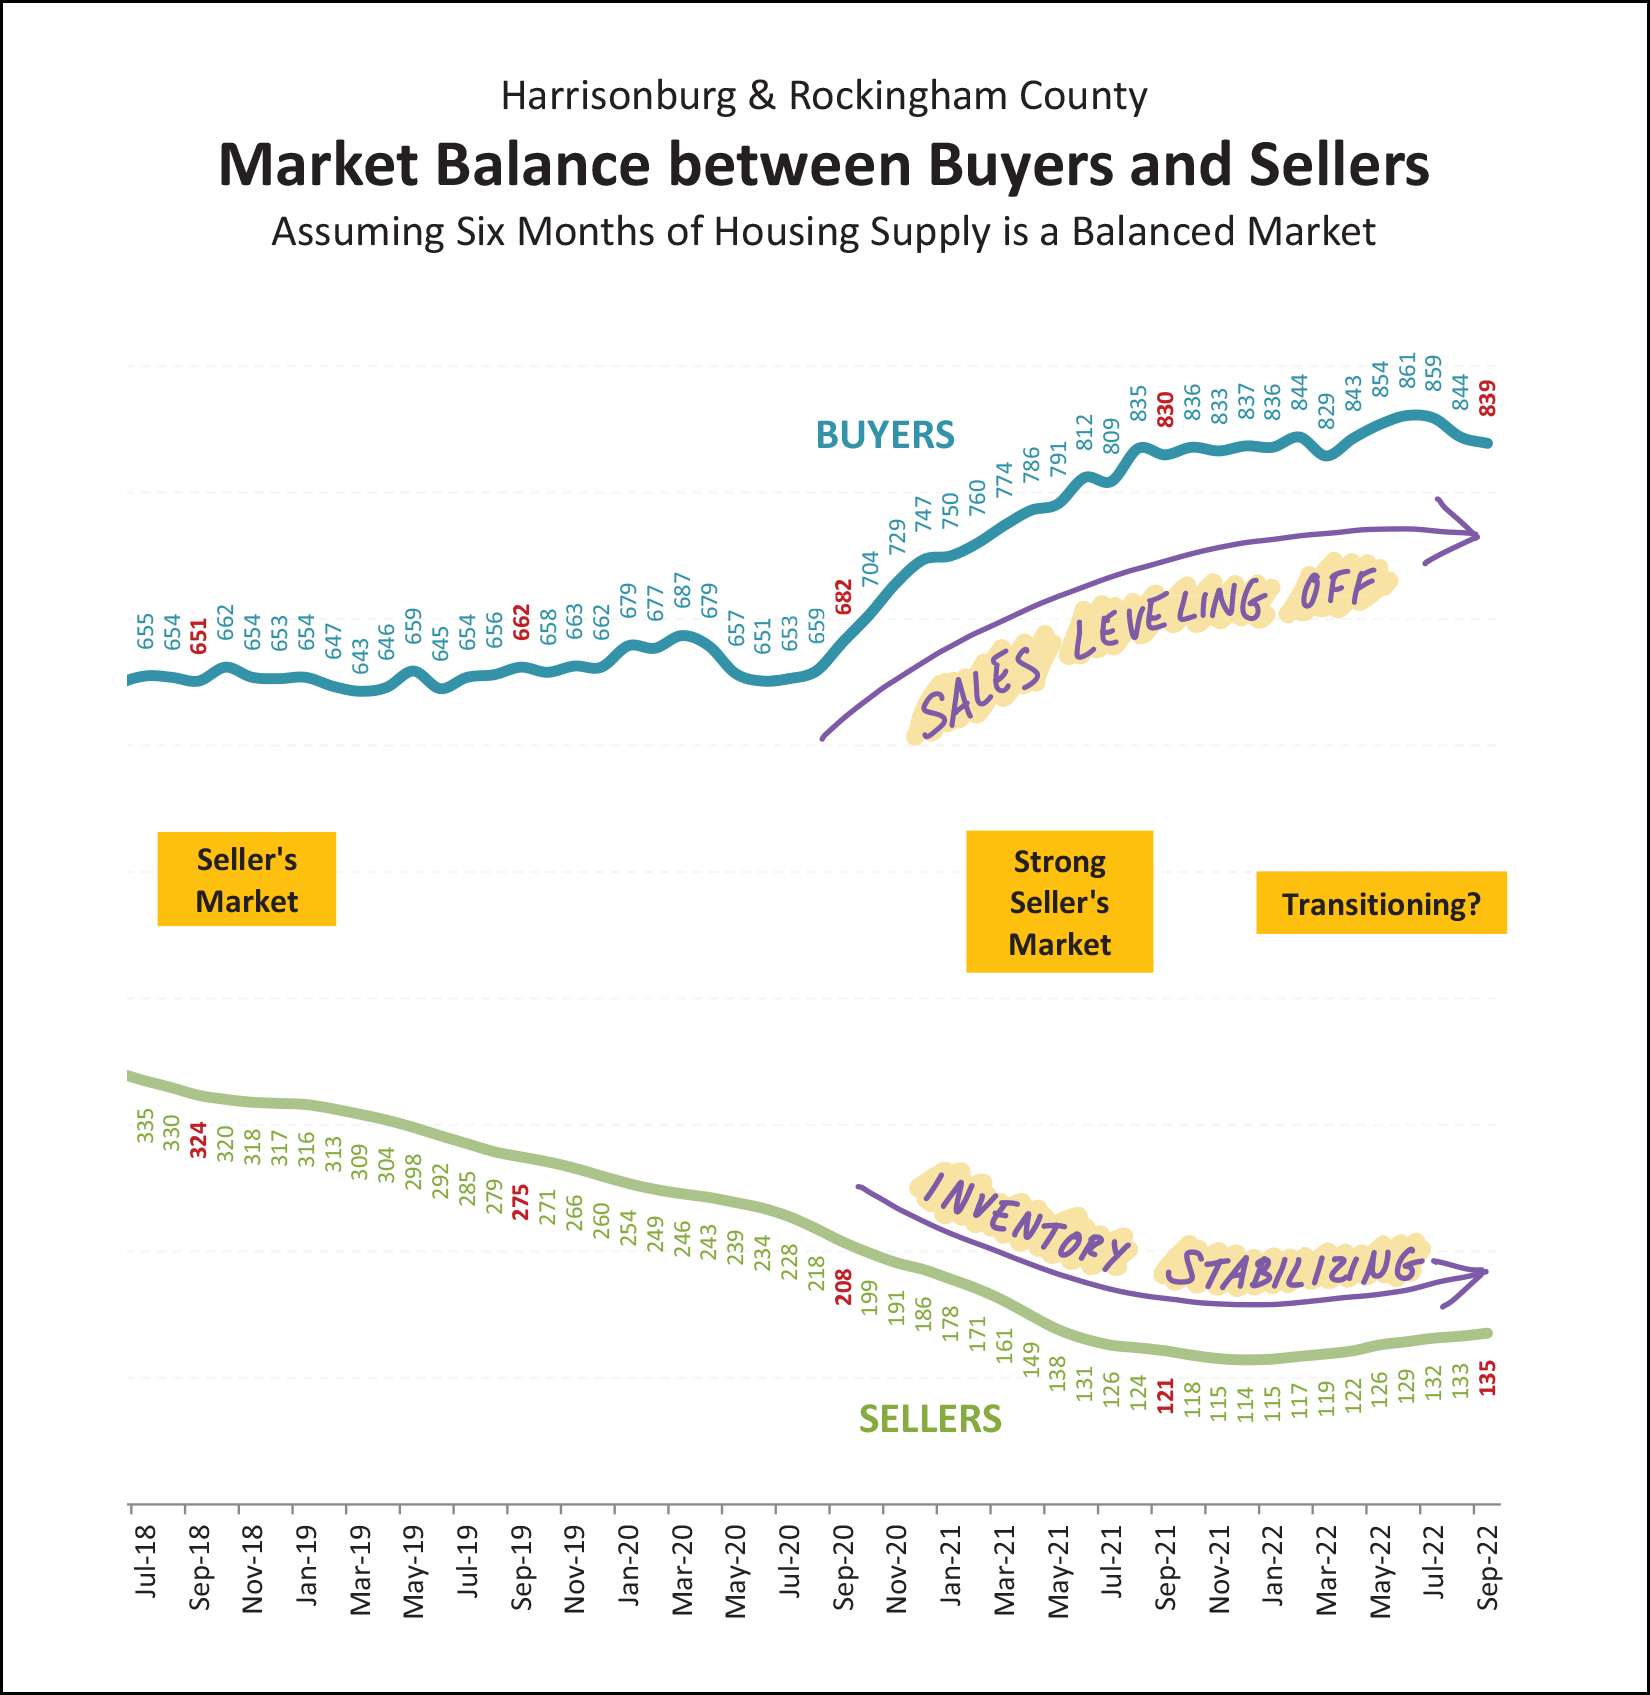 This graph shows that home sales (blue line) are starting to level off and inventory levels (green line) are starting to stabilize and increase a bit. If there continue to be slightly fewer buyers in the market, and slightly more sellers in the market, then... [1] Home buyers might have a slightly easier time securing a contract on a home they hope to purchase. [2] We might see a slightly smaller increase in the price of homes over time. Read that twice, please. I'm not currently anticipating a decline in prices, but rather, a slightly smaller increase in prices. I don't hit on this every month, but it can be helpful to realize that we have seen a pretty good sized increase in the number of new homes being built and sold in this area... 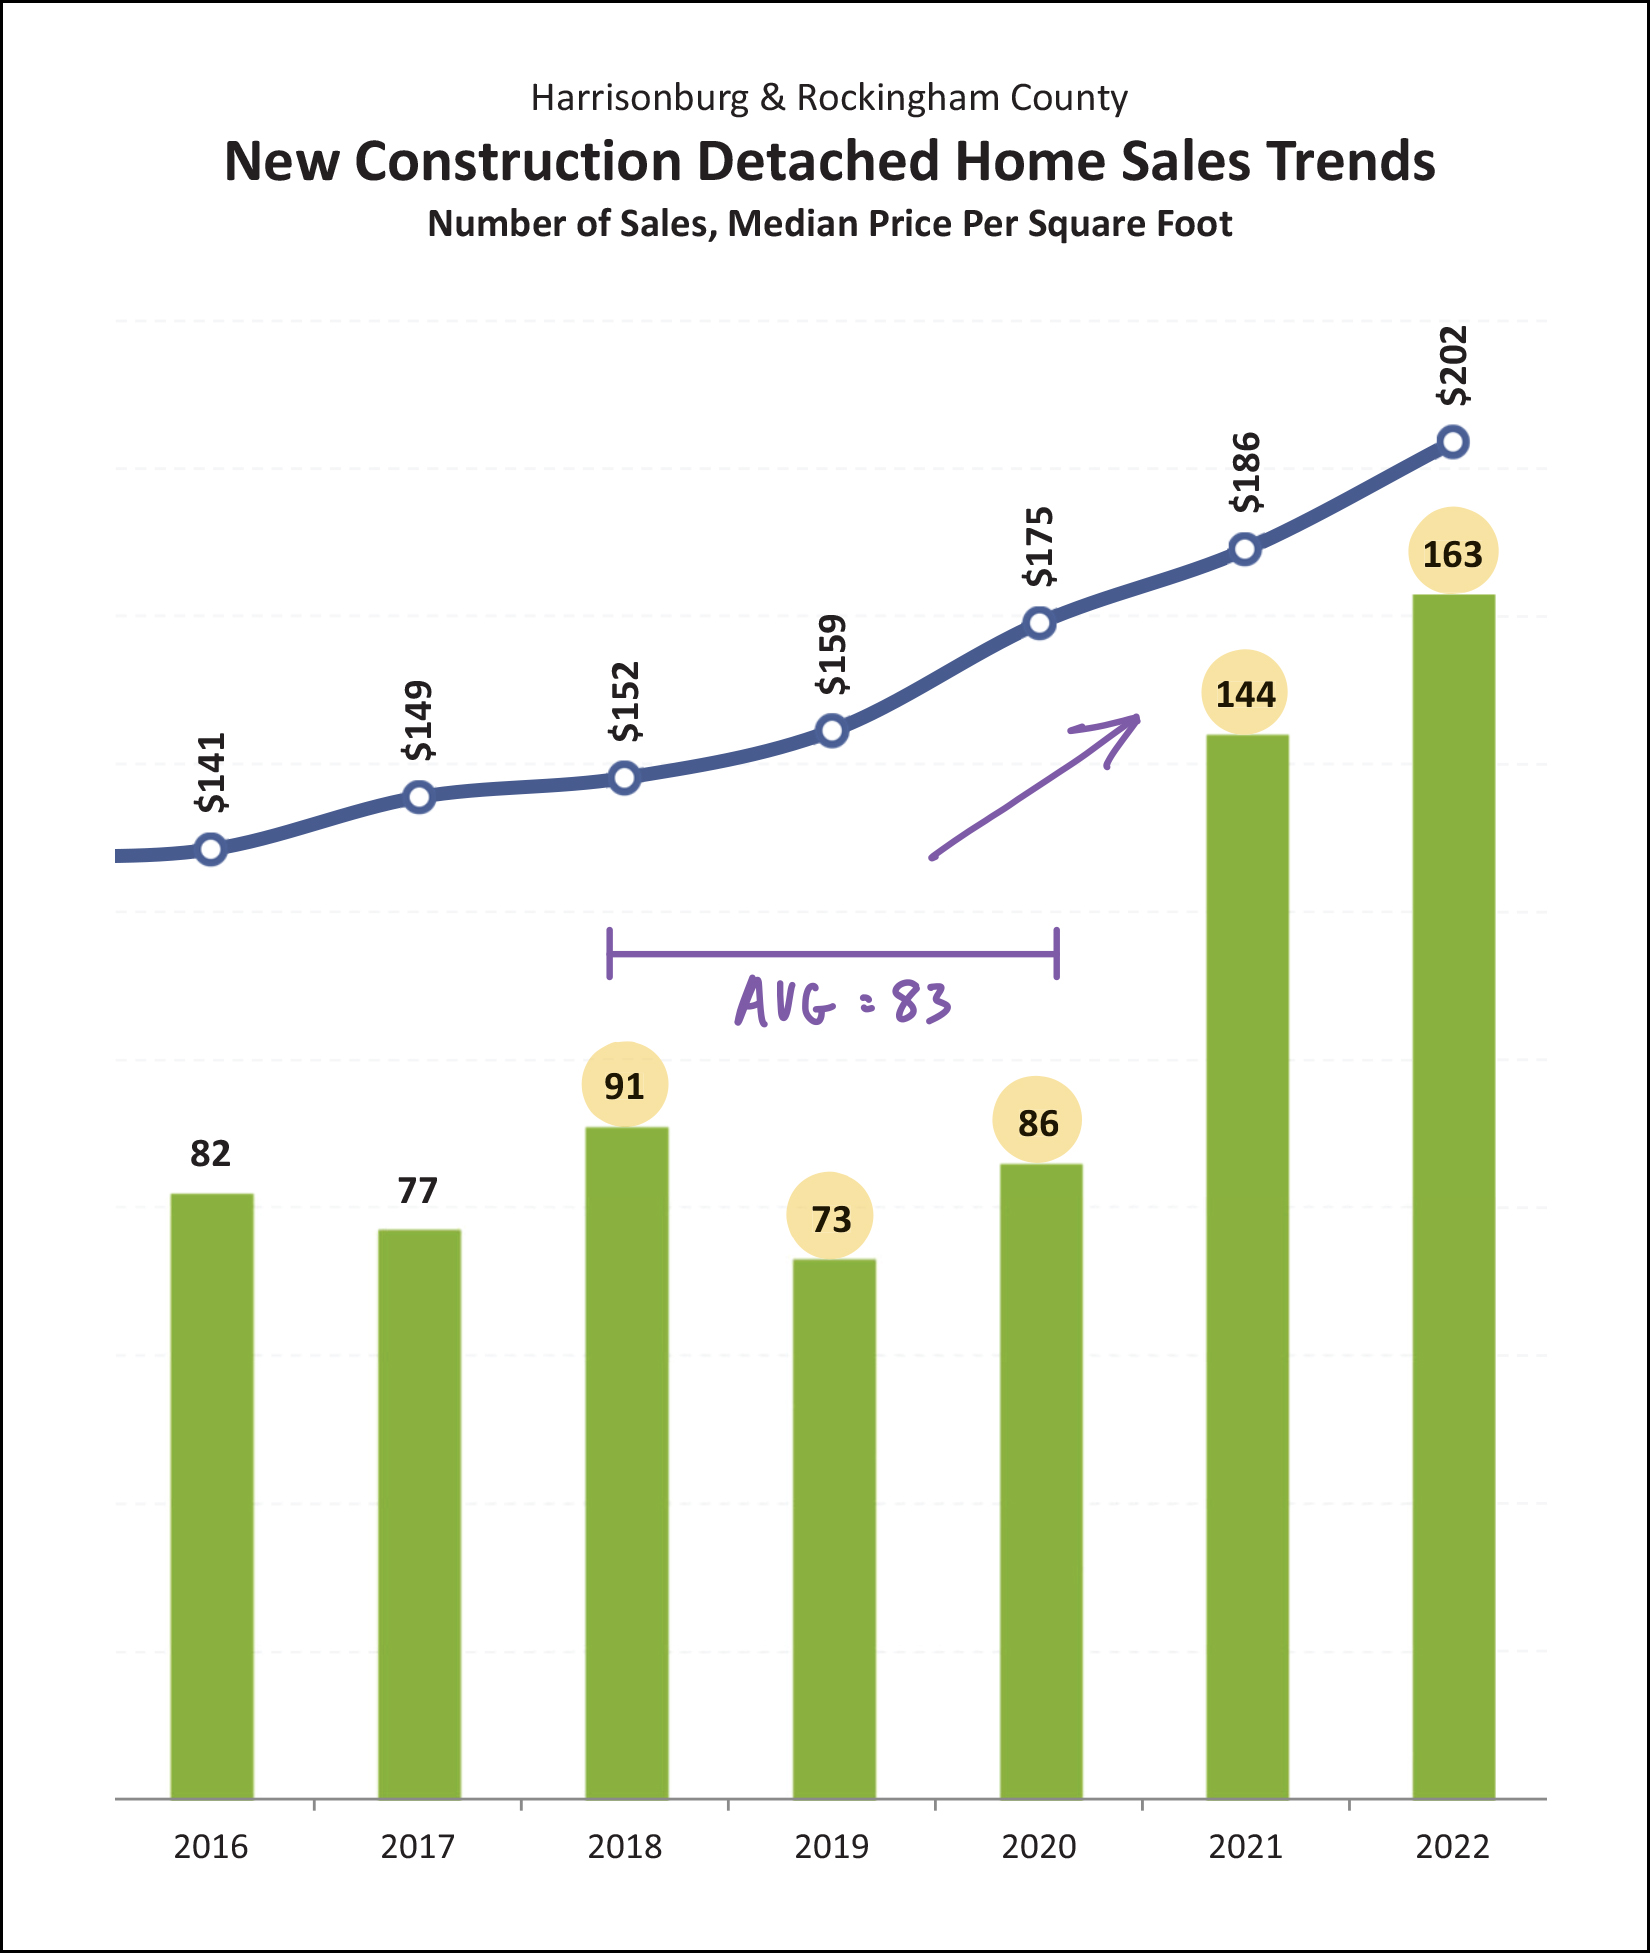 This graph is showing the number of new detached home sales per year in Harrisonburg and Rockingham County. This does not include attached home sales... which would would be duplexes or condos. After averaging 83 new home sales per year between 2018 and 2020, we saw a significant increase in 2021 to 144 new homes... and thus far in 2022, that is a total of 163 new home sales. Many, but not all, of these new detached home sales have been in Ryan Homes communities. It will be interesting to see how new home sales and resale homes track over the next few years especially within the context of higher mortgage interest rates. Now, a peek into the near future... 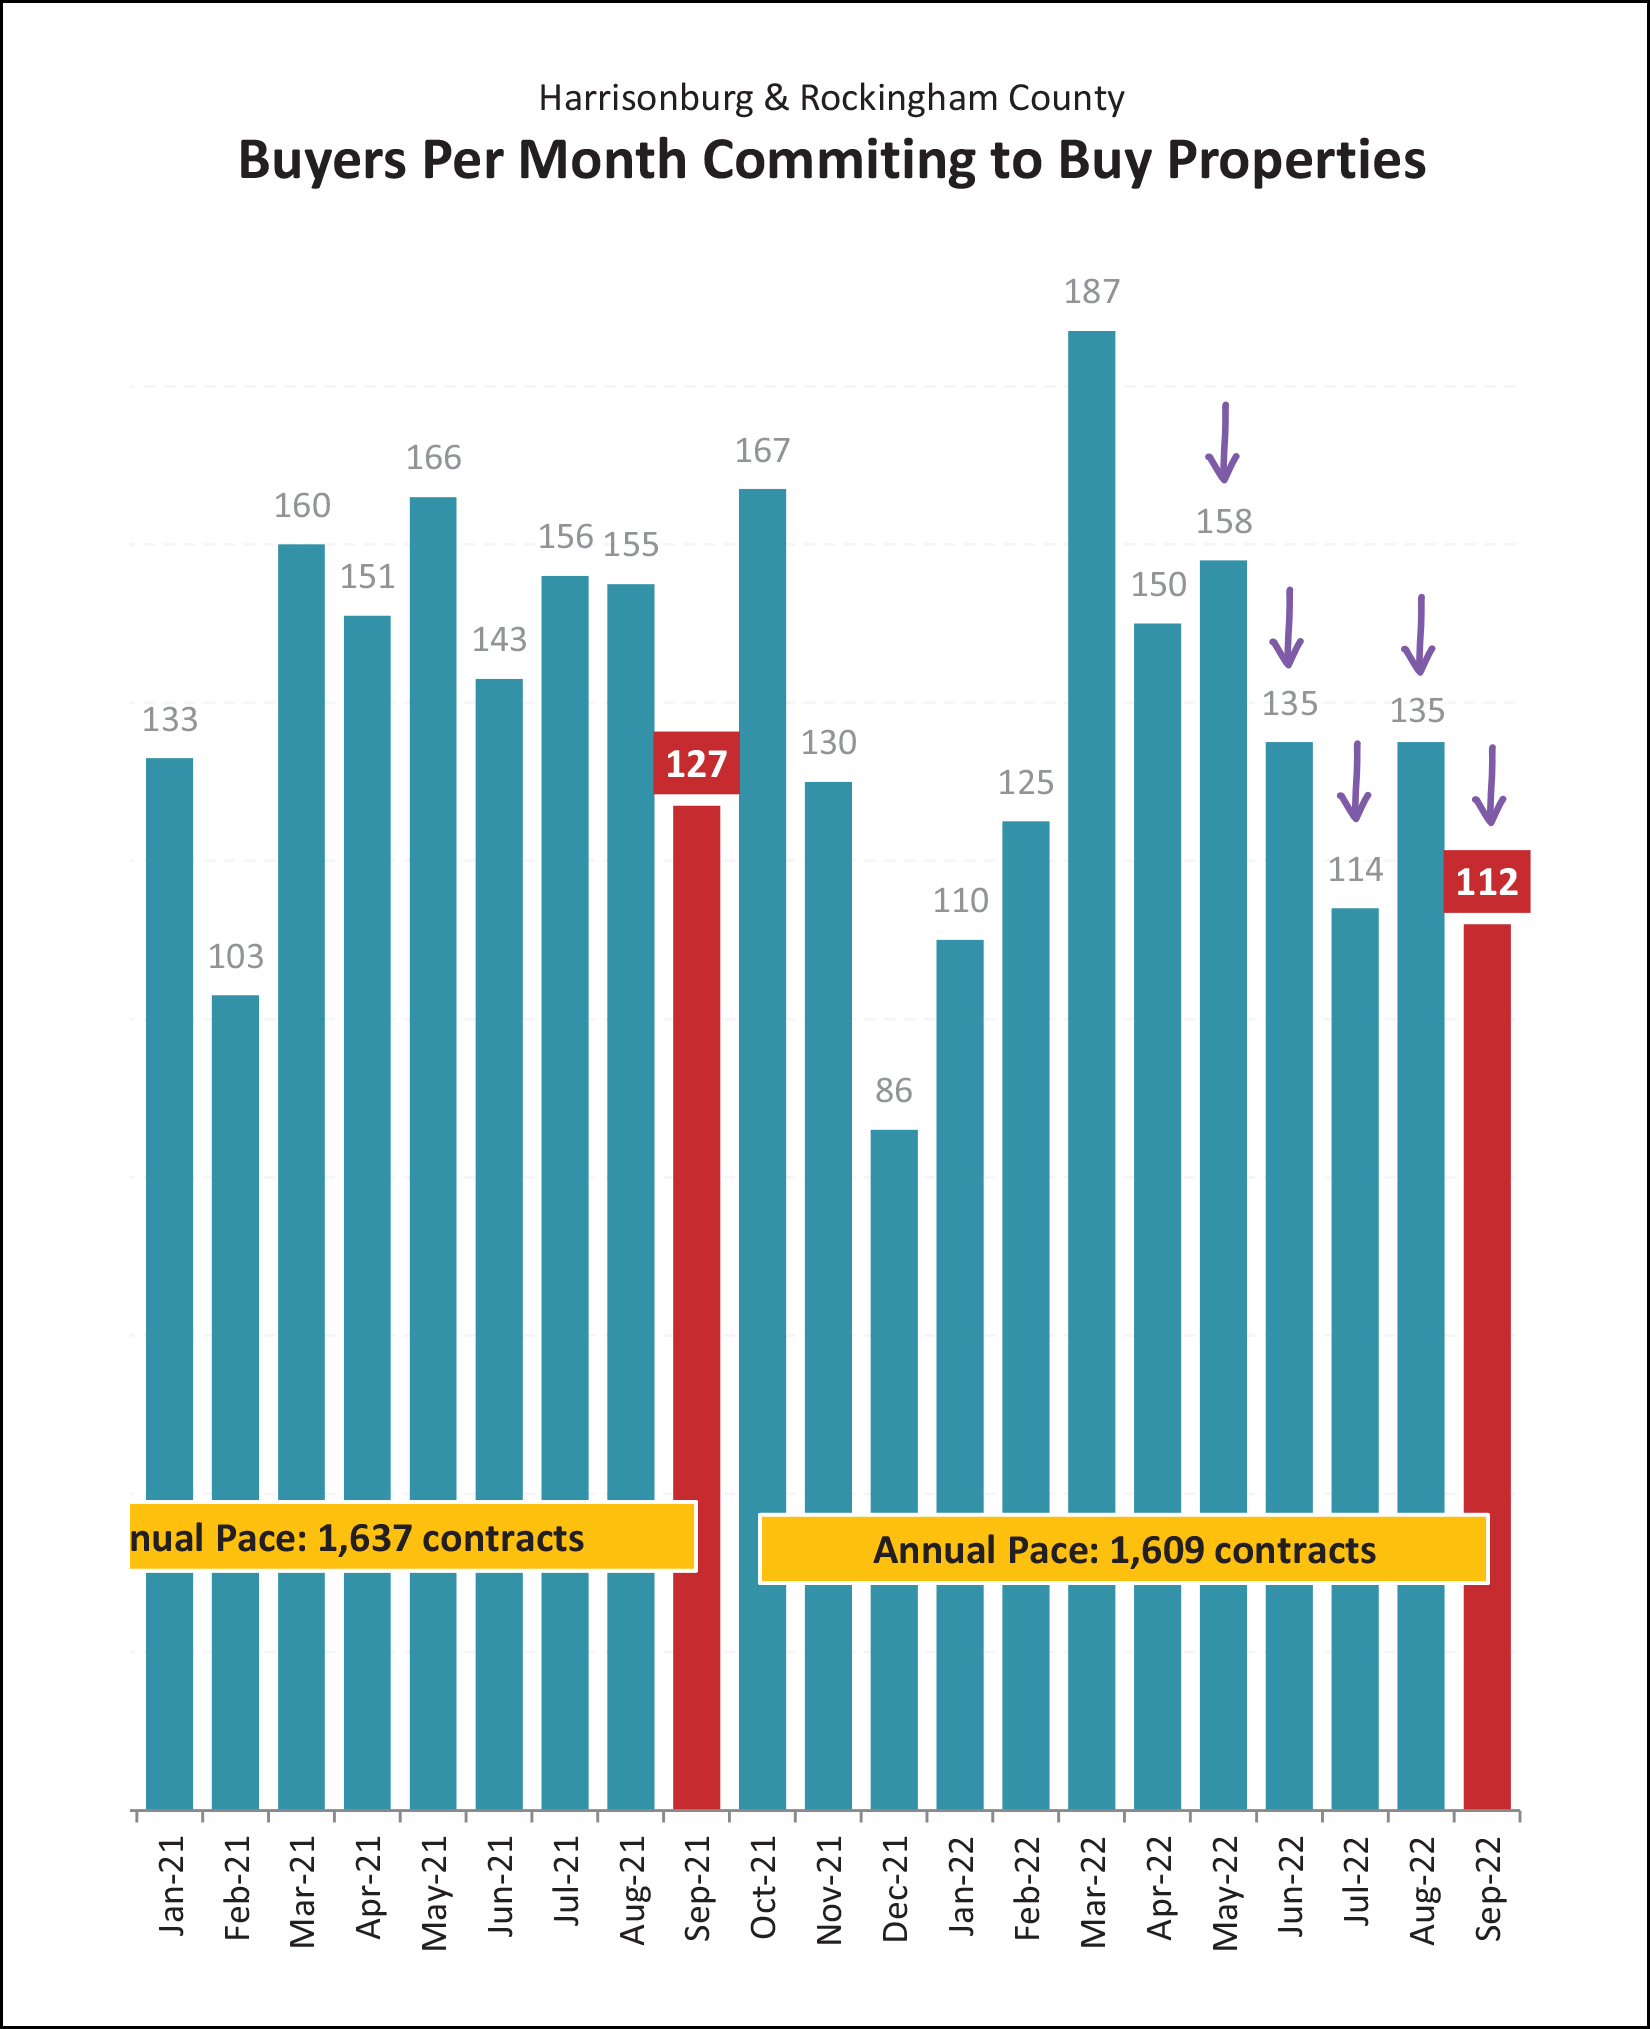 In each of the past five months (purple arrows) we have seen fewer contracts signed than were signed in the same month last year. This probably doesn't surprise anyone who has been paying attention to changes in mortgage interest rates. Ever higher interest rates have changed the potential mortgage payment for buyers, which is definitely impacting how many potential buyers are capable of buying or interested in buying. Multiple (five) months of lower levels of contract activity means that we will continue to see lower levels of closed sales over the next few months... which is why I expect we'll see a slower fourth quarter of home sales this year as compared to last year. And after years of saying inventory levels are down, now we see that... 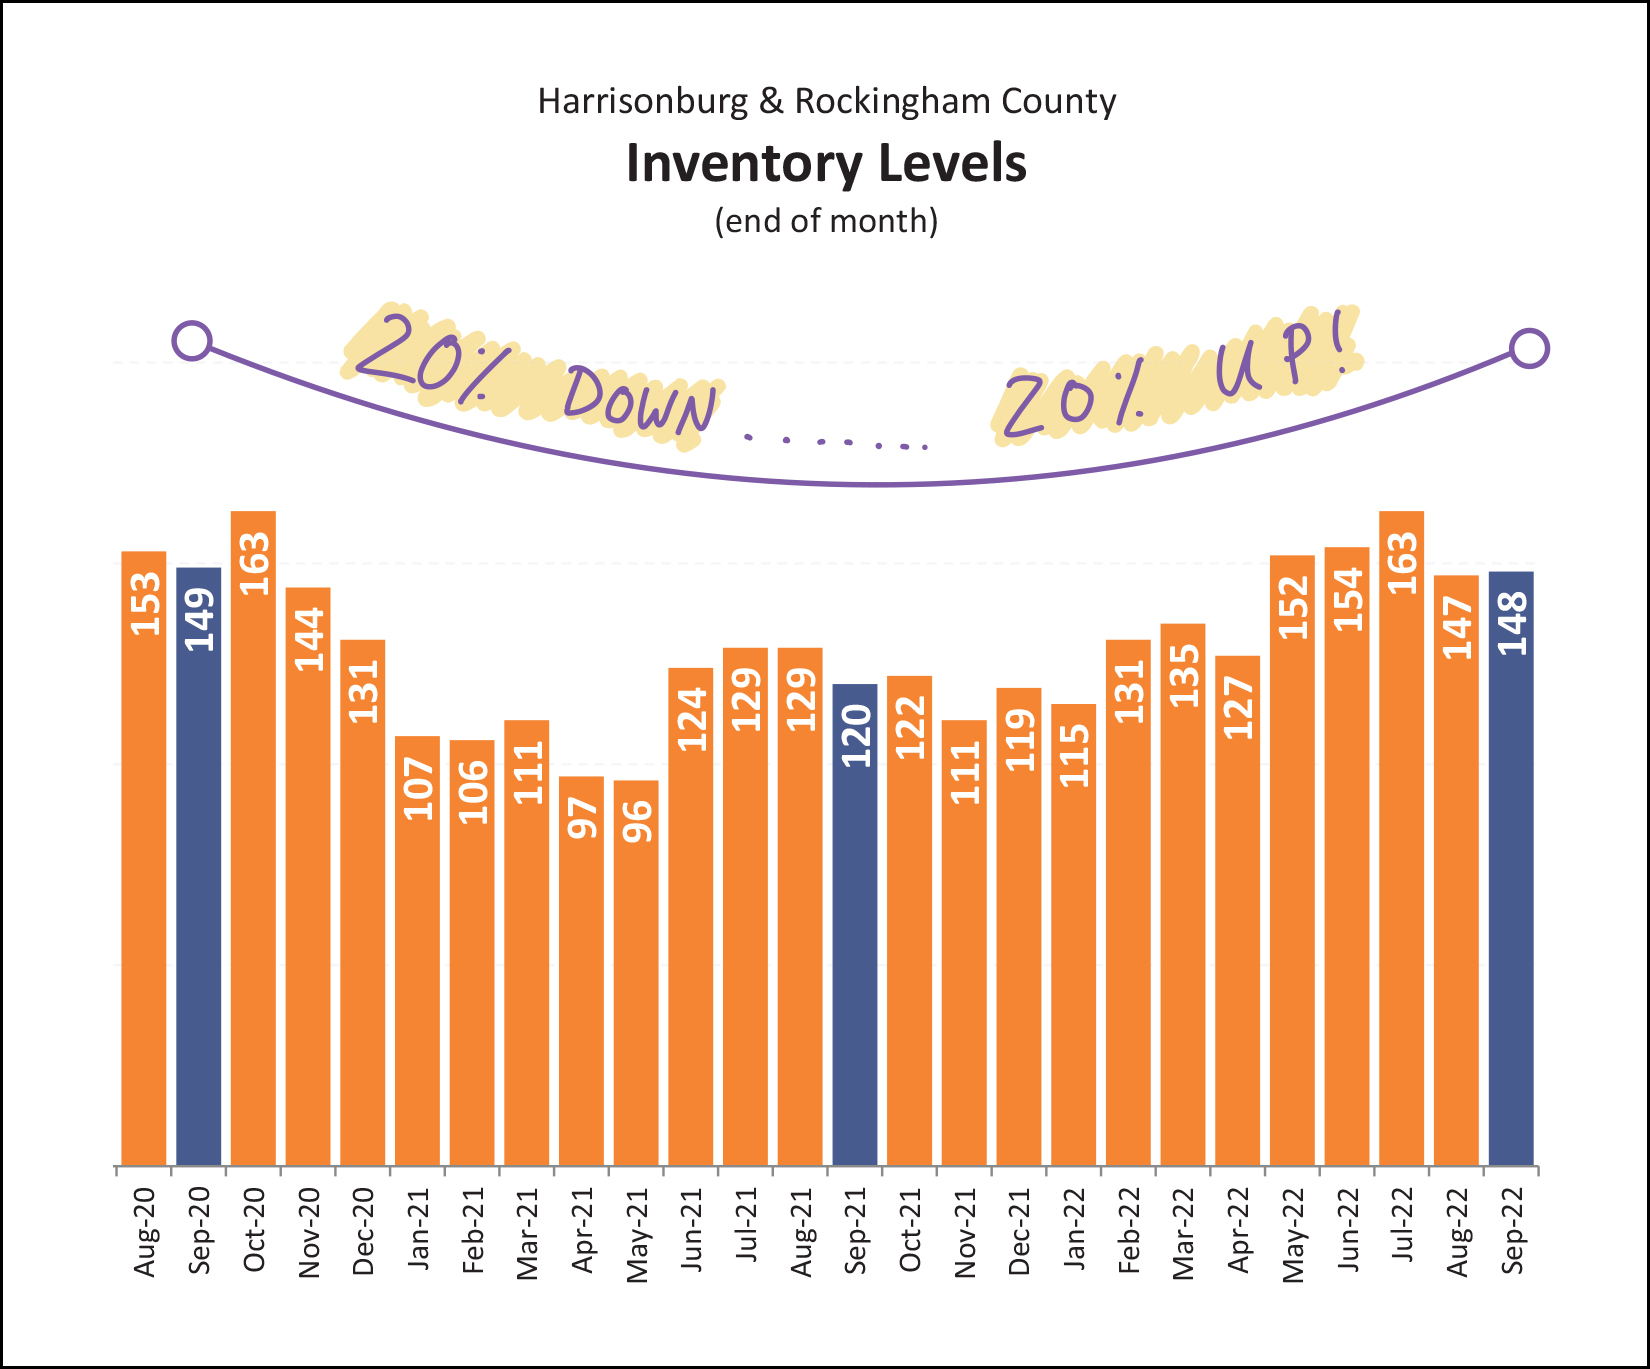 Inventory levels are actually rising a bit. When looking at two years ago compared to one year ago we see about a 20% decline in inventory levels. When looking at one year ago compared to today we see about a 20% increase in inventory levels. Today's inventory levels are still *very* low compared to historical norms, but buyers today seem happy to have slightly more choices of homes for sale, or to see homes sticking around on the market for slightly longer before going under contract. Though... about that time on market trend... 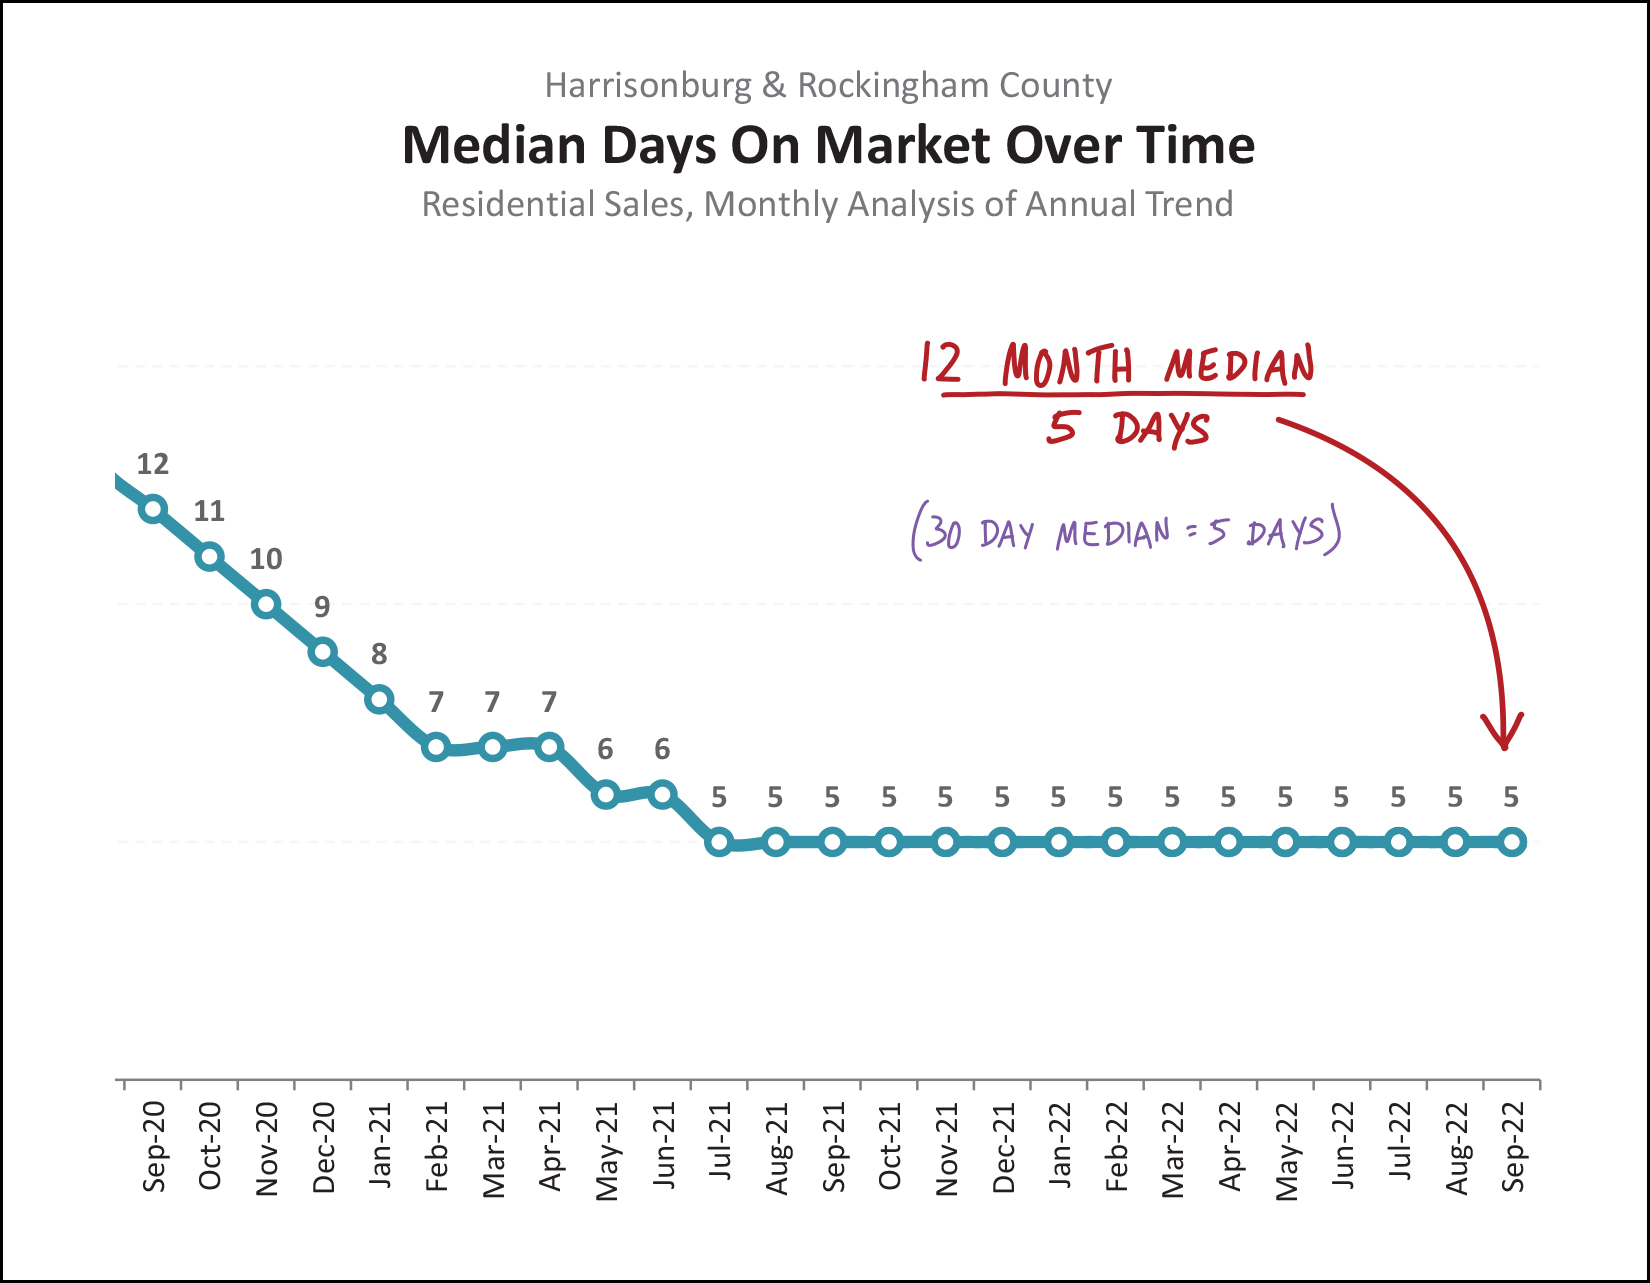 Over the past 12 months, the median number of days it took for homes to go under contract once listed for sale was... five days! We first hit that low (low!) level of a median of five days back in July 2021, and we have been hanging out at that same level ever since. Interestingly, I suspected that if I looked at a shorter, more recent, timeframe that I would find that it is taking homes longer to go under contract. With that theory in mind, I looked at the median days on market over the last 30 days and it was... still five days. So, the market (overall) seems to still be moving very quickly with half of new listings that go under contract doing so in five or fewer days. And finally, a visual to show you how quickly mortgage interests have been rising... 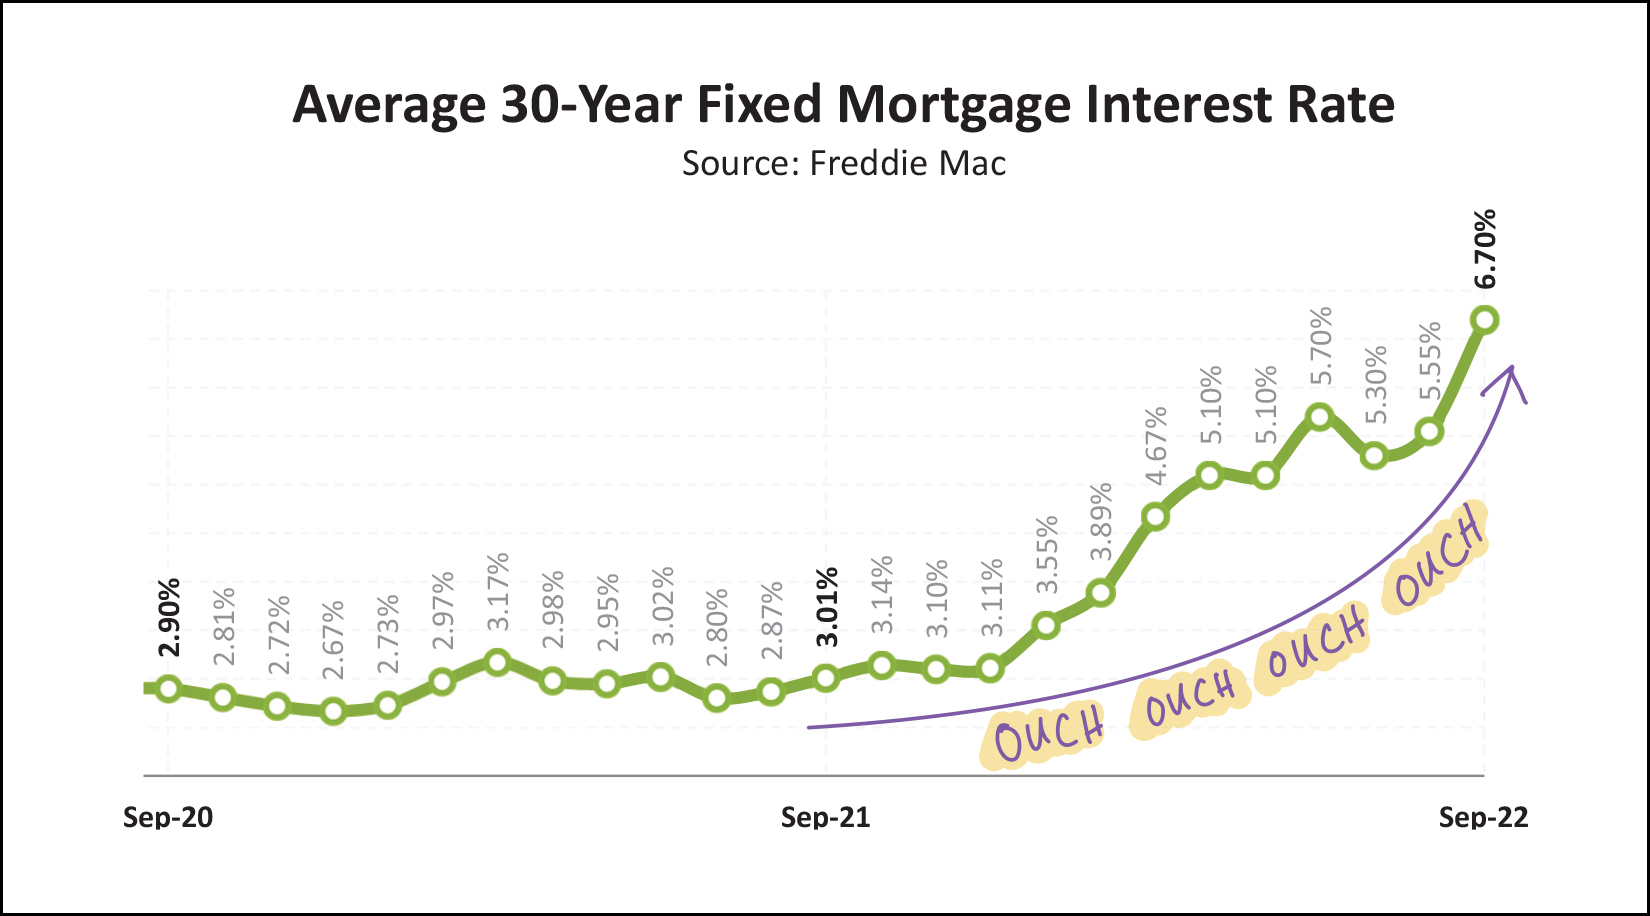 A year ago, mortgage interest rates were right around 3%. Six months ago, mortgage interest rates were right around 4.7%. Now, today, they are all the way up to 6.7%. As you might imagine, this increase in mortgage interest rates significantly affects a buyer's mortgage payment - and potentially their ability to purchase the home they might hope to purchase. So where does all of this leave us? Despite what may be going on in other real estate markets around the state or the country, here's what seems to be true in our local market at this moment in time... [1] Contract activity and home sales has slowed in the second half of 2022, though the highly active first half of 2022 is still keeping us on track with 2021 thus far. [2] Higher mortgage interest rates are affecting buyer behavior which is often resulting in fewer showings and fewer offers. [3] Despite the points mentioned above, homes are still going under contract very quickly and home prices keep on rising. As you look ahead to the remainder of fall, and into the winter months, if you're thinking about buying a home, or selling a home, we should chat about how things are going in your segment of our local market as it relates to the property type, price, size, location and age of your home. I'll check in on the market again in about a month, but until then, enjoy your fall days, and best of luck to anyone else running in the Harrisonburg Half Marathon this Saturday! | |
Home Prices Keep Rising in Harrisonburg, Rockingham County Despite Slightly Fewer Home Sales |
|
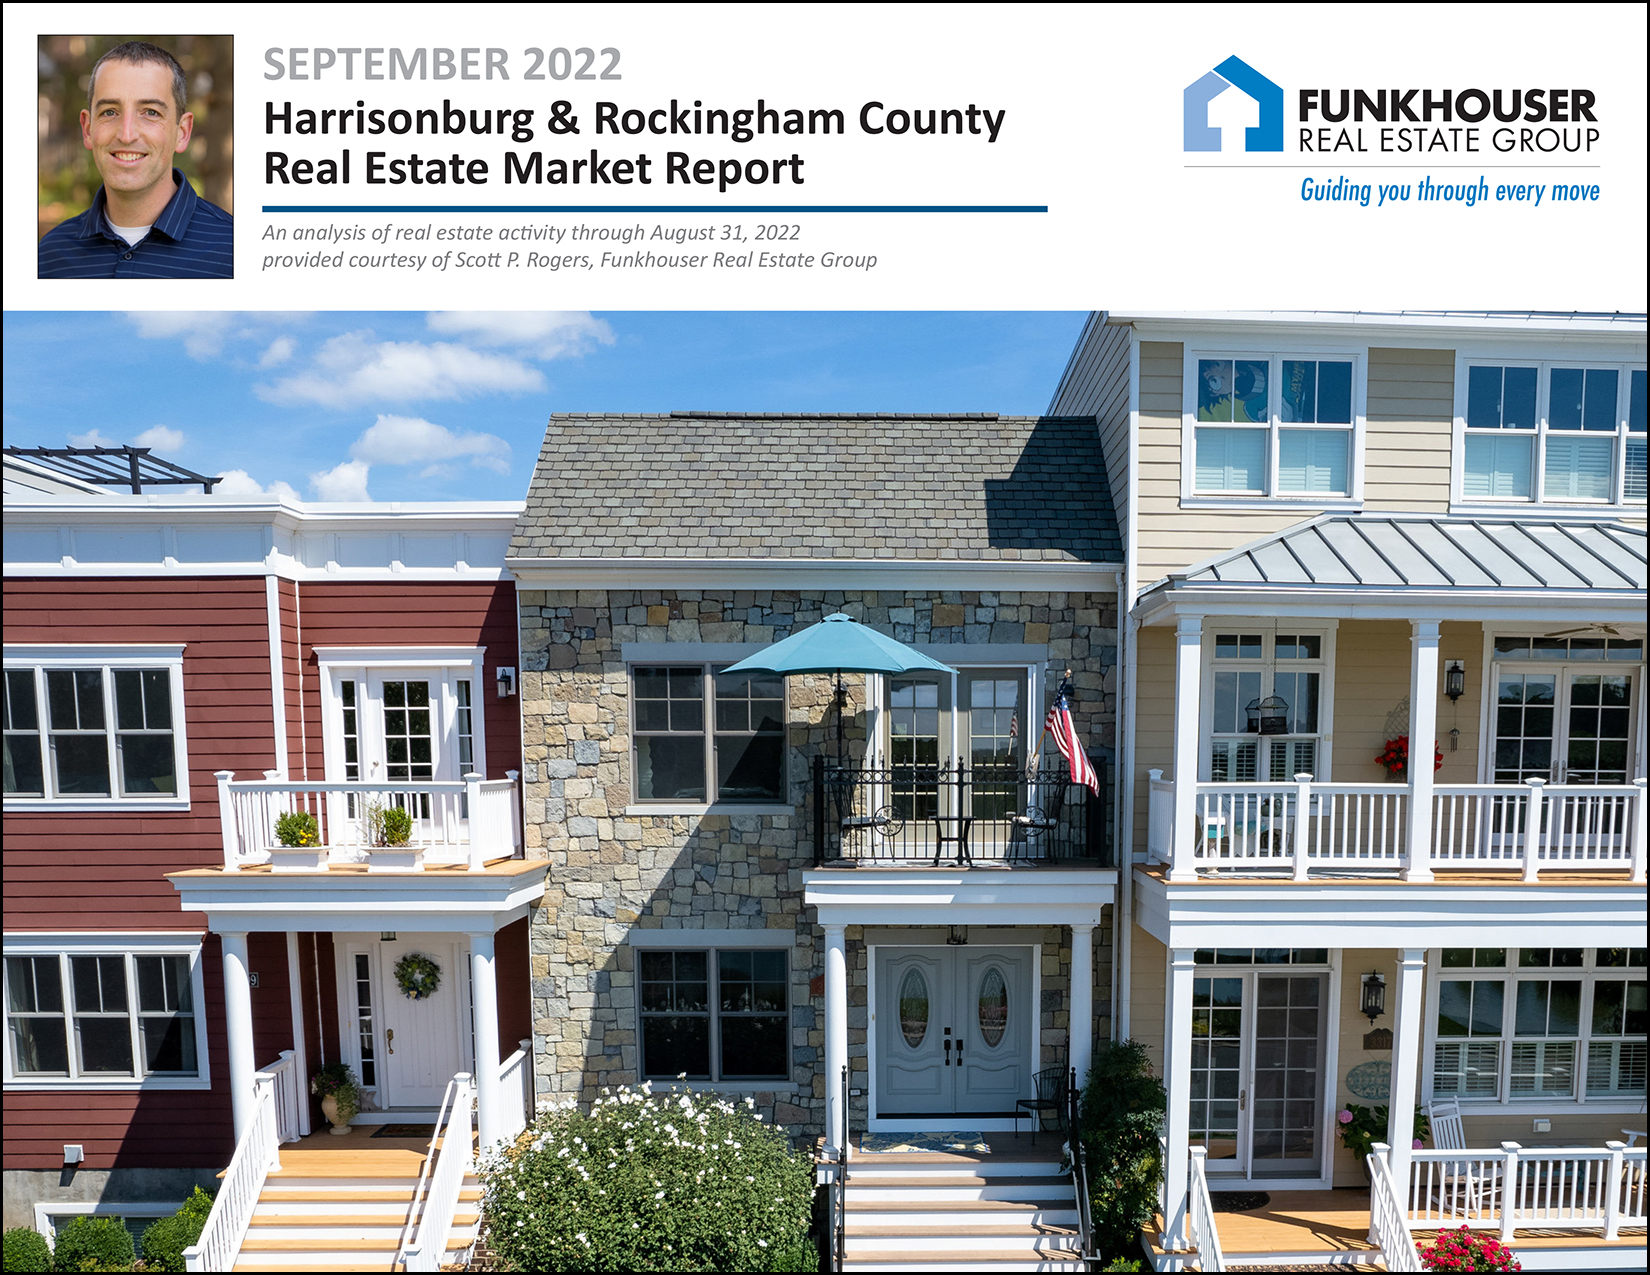 Greetings, and Happy Tuesday morning, friends! Would you believe it if I told you we're 70% of the way through 2022!? It's hard to believe, I know, but indeed, we only have about 30% of the year to go. Would you believe it if I told you I am now old enough to be the dad of an adult!? It's hard to believe, I know, but Luke recently celebrated his 18th birthday. Shaena and I are tremendously proud of the man he is and is becoming and we're excited to see what is in store for him in the coming years. Happy 18th, Luke! :-)  This Month's Featured Home... The upscale rowhouse on the cover of this month's market report is one of the original lakefront rowhouses at Preston Lake, and you can find out more about this beautiful property by visiting 3313PrestonShoreDrive.com. Another of My Favorite Places... Each month I offer a giveaway, of sorts, for readers of this market report, highlighting some of my favorite places (or things) in Harrisonburg. Recent highlights have included Village Juice & Kitchen, Black Sheep Coffee and the Harrisonburg Half Marathon. This month I'm highlighting the JMU Forbes Center for the Performing Arts which is the premier destination for arts in the Shenandoah Valley with countless top notch musical, dance and theatrical performances each year. Have you been to a show at the Forbes Center? Would you like to? I'm giving away a pair of tickets to what is bound to be a hilarious show at the Forbes Center... "Whose Live Anyway?" featuring current cast members of the Emmy-nominated television show "Whose Line Is It Anyway?" for 90 minutes of hilarious improvised comedy and song. The show is on Friday, September 30 at 8:00 PM. Enter here for a chance to win this pair of tickets. And now, let's take a look at the latest news from our local real estate market... 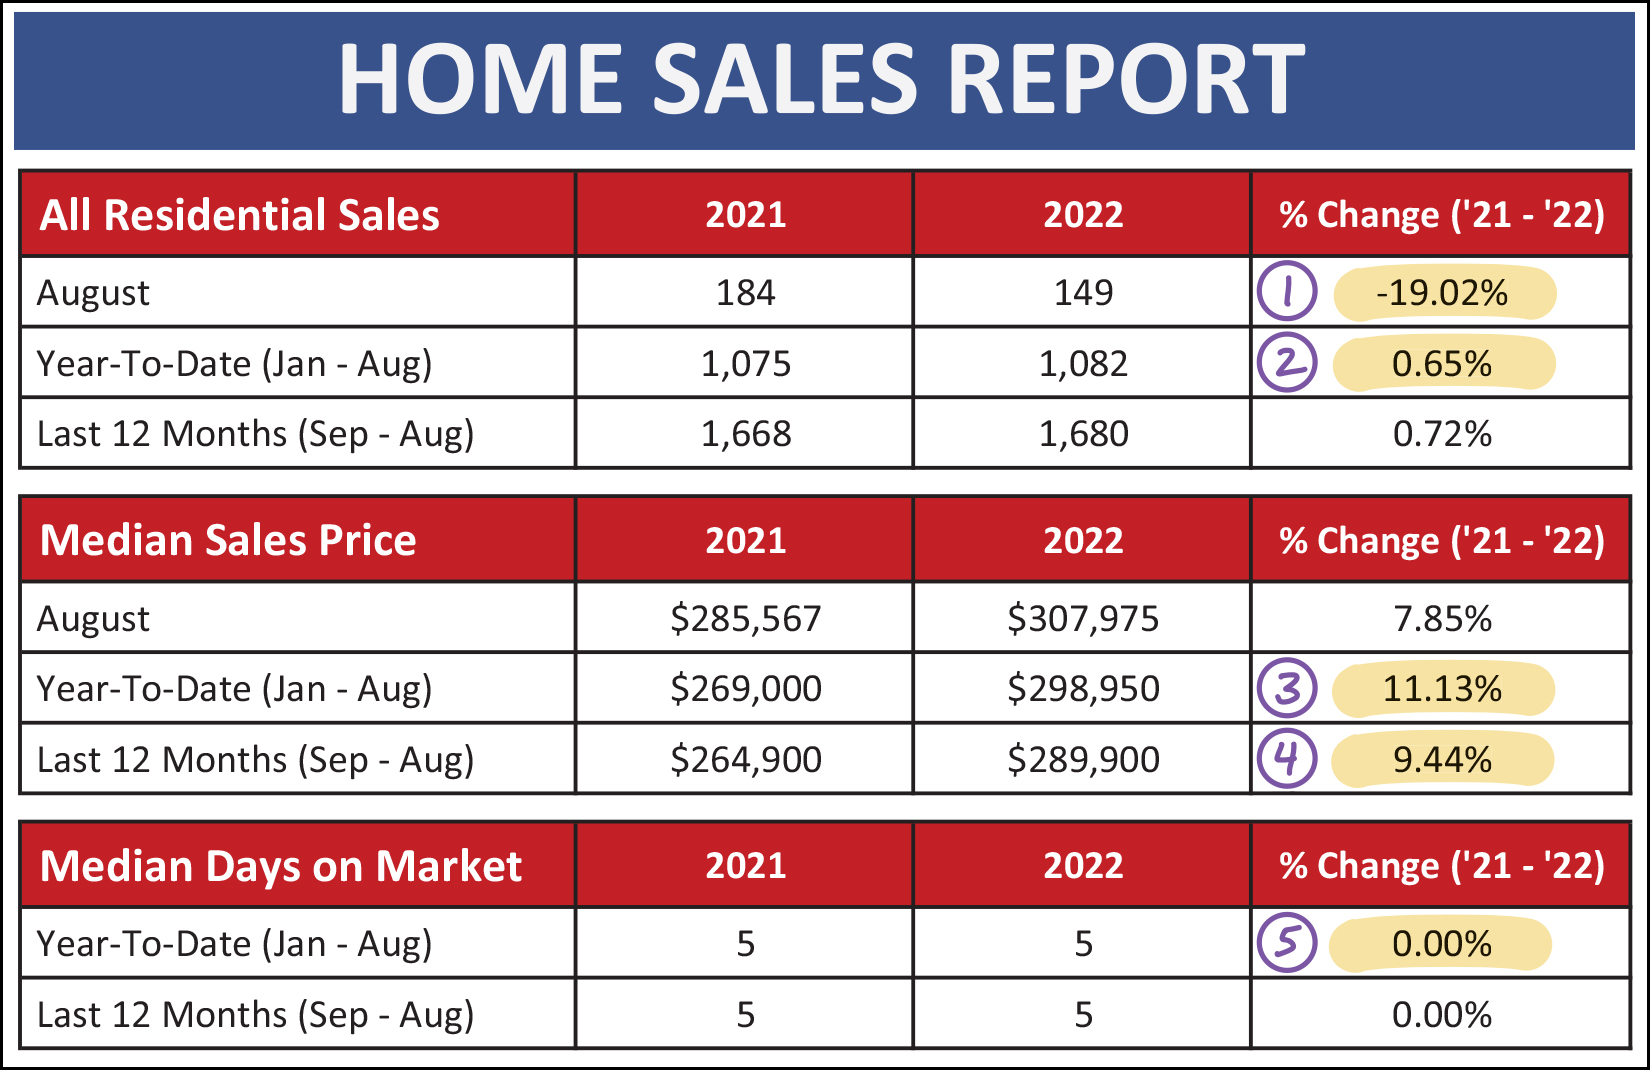 First off, let's get right to it... we saw significantly fewer home sales this August as compared to last August. We've been in "always more, every month more" mode for so long when it comes to home sales that it might seem jarring to see a 19% drop in August home sales, but it is important to realize that we couldn't necessarily always see more and more home sales forever and ever. We have seen an extraordinarily high amount of home sales activity over the past two years. Those home sales levels may have been inflated beyond the norm, so we may see a downward shift in the number of homes selling per year as we finish out 2022 and enter 2023. This isn't a catastrophe and it does not necessarily mean we will see any adjustments in home values and sales price in this area. In fact, in the "this is not a catastrophe" category, when we move beyond #1 above, where we see a 19% decline in August home sales, we'll also find... [2] The pace of home sales during the first eight months of this year are still slightly (0.65%) ahead of last year during those same eight months. Though, if home sales activity continues to be a bit slower through the rest of 2022, we should expect the annual pace of sales in 2022 to eventually fall behind 2021 levels. [3] The median sales price this year in Harrisonburg and Rockingham County ($298,950) is 11% higher than it was last year during the same first eight months of the year when it was $269,000. [4] When looking at a full year of data (September through August) we find that there has been a 9% increase in the median sales price over the past year, from $264,900 up to $289,900. [5] Homes are still selling just as fast as last year... with a median "days on market" of five days. So, while the number of homes selling might be slipping a bit compared to last year, prices are still rising, and homes are still selling very quickly. Now, let's break things up a bit by detached homes (green) and attached homes (orange) below... 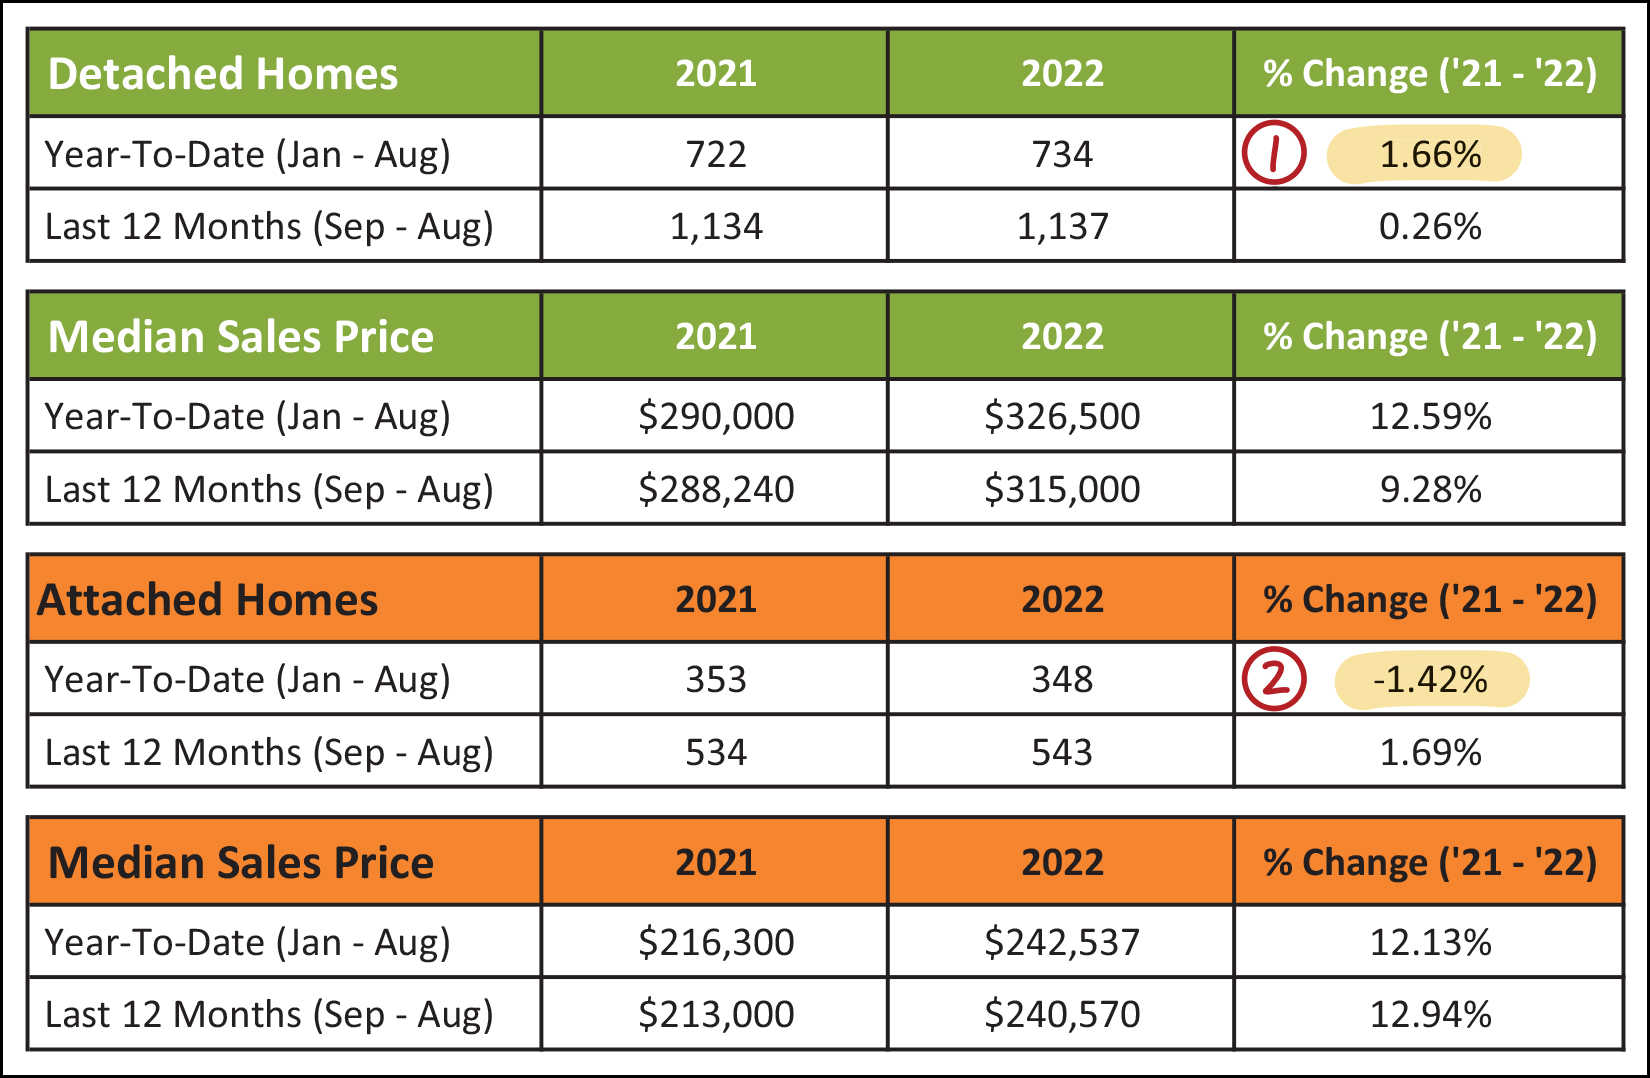 This chart pull a few things out that provide some helpful comparisons... [1] There have been slightly more detached home sales this year (734) as compared to last year (722) for a total increase of 1.66%. This has been accompanied by a year-to-date increase of 12.59% in the median sales price of those detached homes. [2] There has been a slight decline in the number of attached home sales this year (348) as compared to last year (353) for a total decrease of 1.42%. This has been accompanied by a larger, 12.13%, increase in the median sales price of those attached homes. So... we're seeing a slight uptick in single family home sales and a slight downturn in townhouse / duplex / condo sales... though the median prices of both property types are increasing. Finally, slicing and dicing the data one more time to compare the City and County, here's what we find... 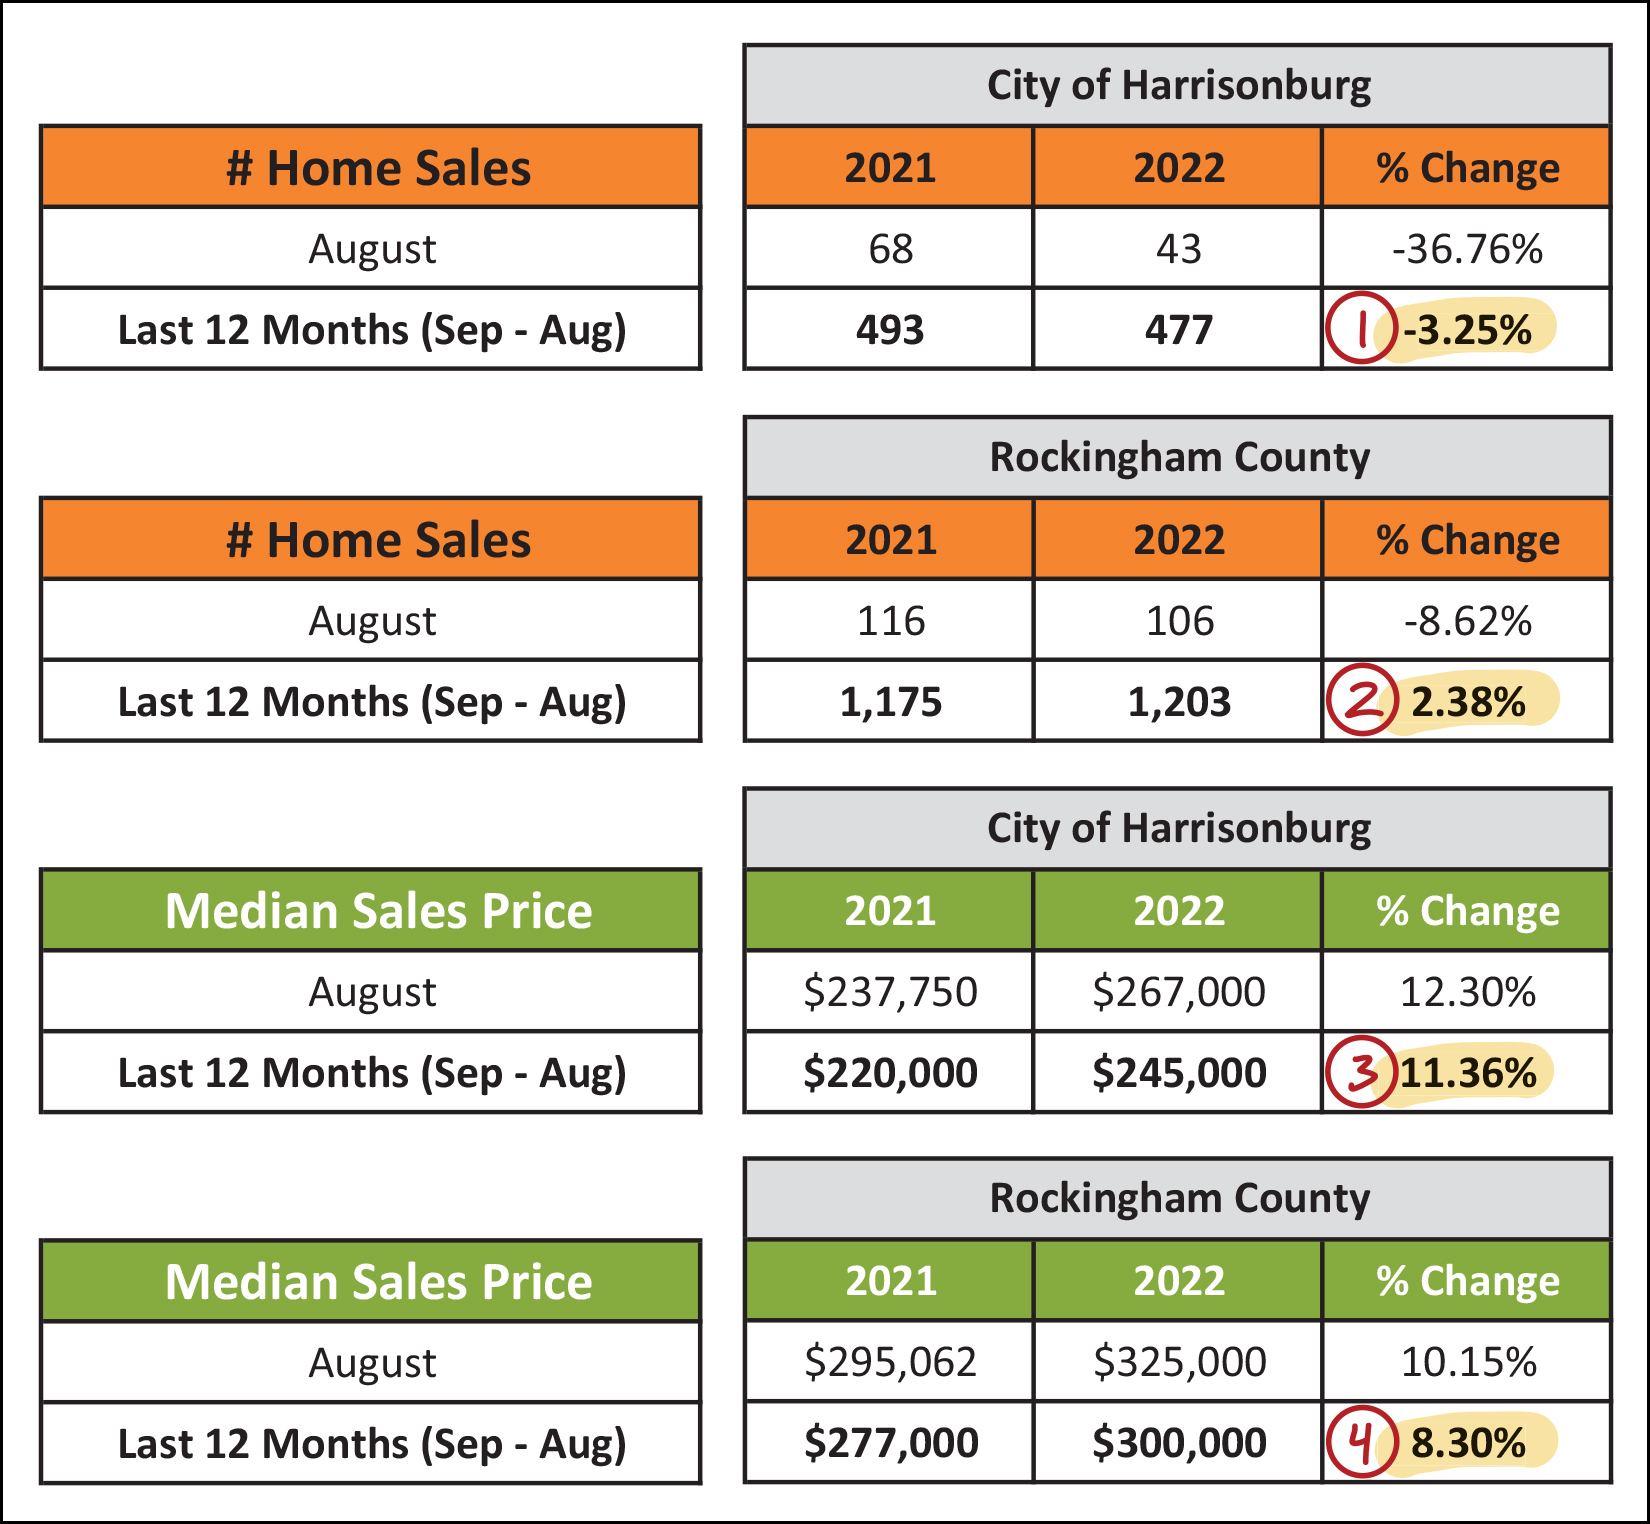 Here's what pops out to me in the chart above, when looking at a full year (Sep - Aug) of data... The pace of home sales has slowed a bit (-3%) in the City (#1) while the pace of County home sales (#2) has increased slightly (+2%). The median sales price has increased by double digits (+11%) in the City (#3) while the median sales price in the County (#4) has increased by a slightly lower amount (8.3%). So, again, lots of home sales at high prices in the City and County... but the pace of sales is slightly more robust in the County, and price increases are slightly higher in the City. Now, the summer that makes you say: Nice! Yikes! Hmmm... 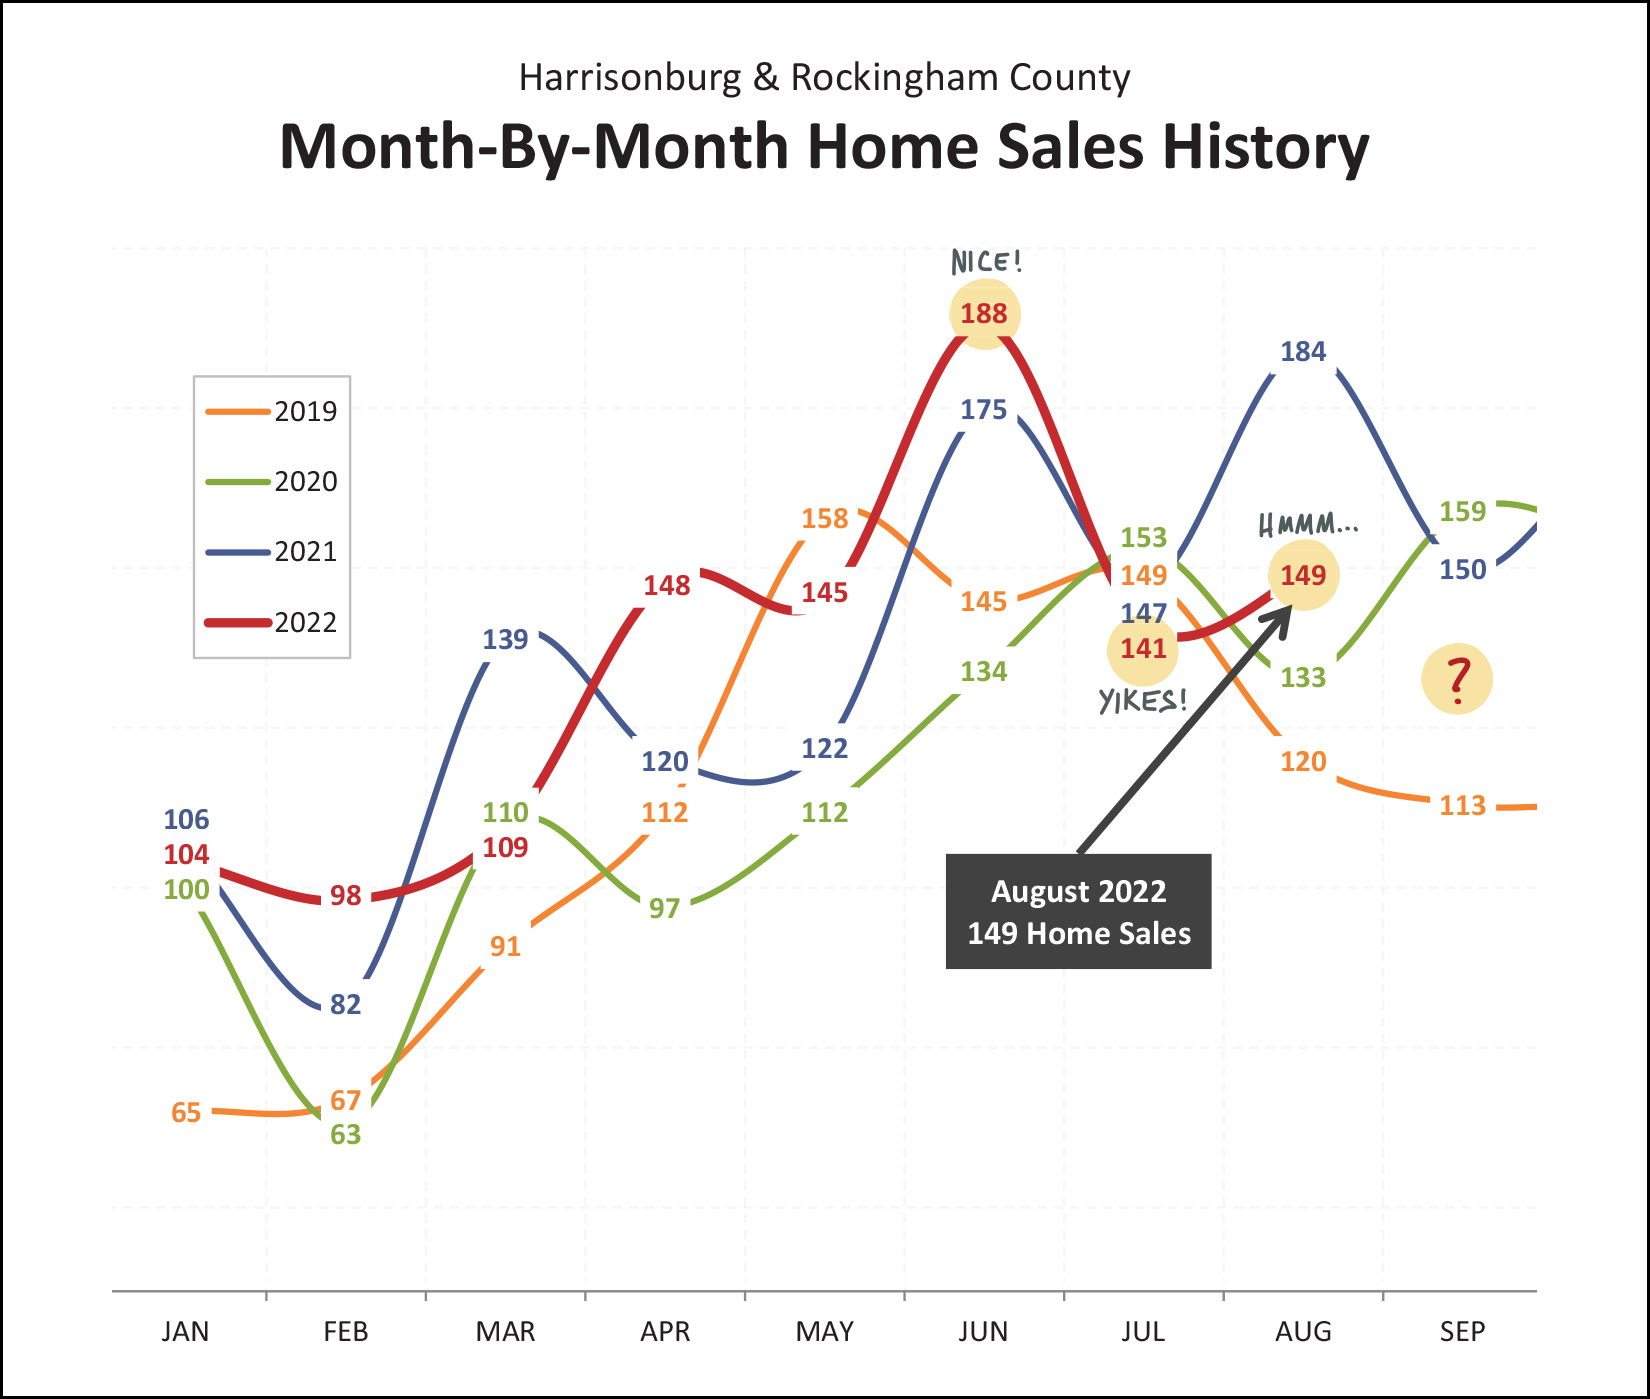 It was a wild summer in the Harrisonburg and Rockingham County real estate market... JUNE = NICE! We saw an incredible number of home sales in June 2022. The 188 home sales this past June was the highest single month of home sales in many, many years! JULY = YIKES! After sky high home sales in June, we saw the slowest month of July home sales in at least three years. July 2022 home sales weren't drastically lower than the previous few years but it was surprising (yikes!) to go from the "best June in 3+ years" to the "worst July in 3 years." AUGUST = HMMM... Home sales this past month were markedly lower than last August, with a 19% decline from 184 home sales to 149 home sales. But... home sales this August were still higher than in August 2019 and 2020. So... were home sales surprisingly slow this August? Or do they just look slow compared to a surprisingly active month last August? At this point it can be helpful to stack all of those months of home sales on top of eachother to look at things from a broader perspective... 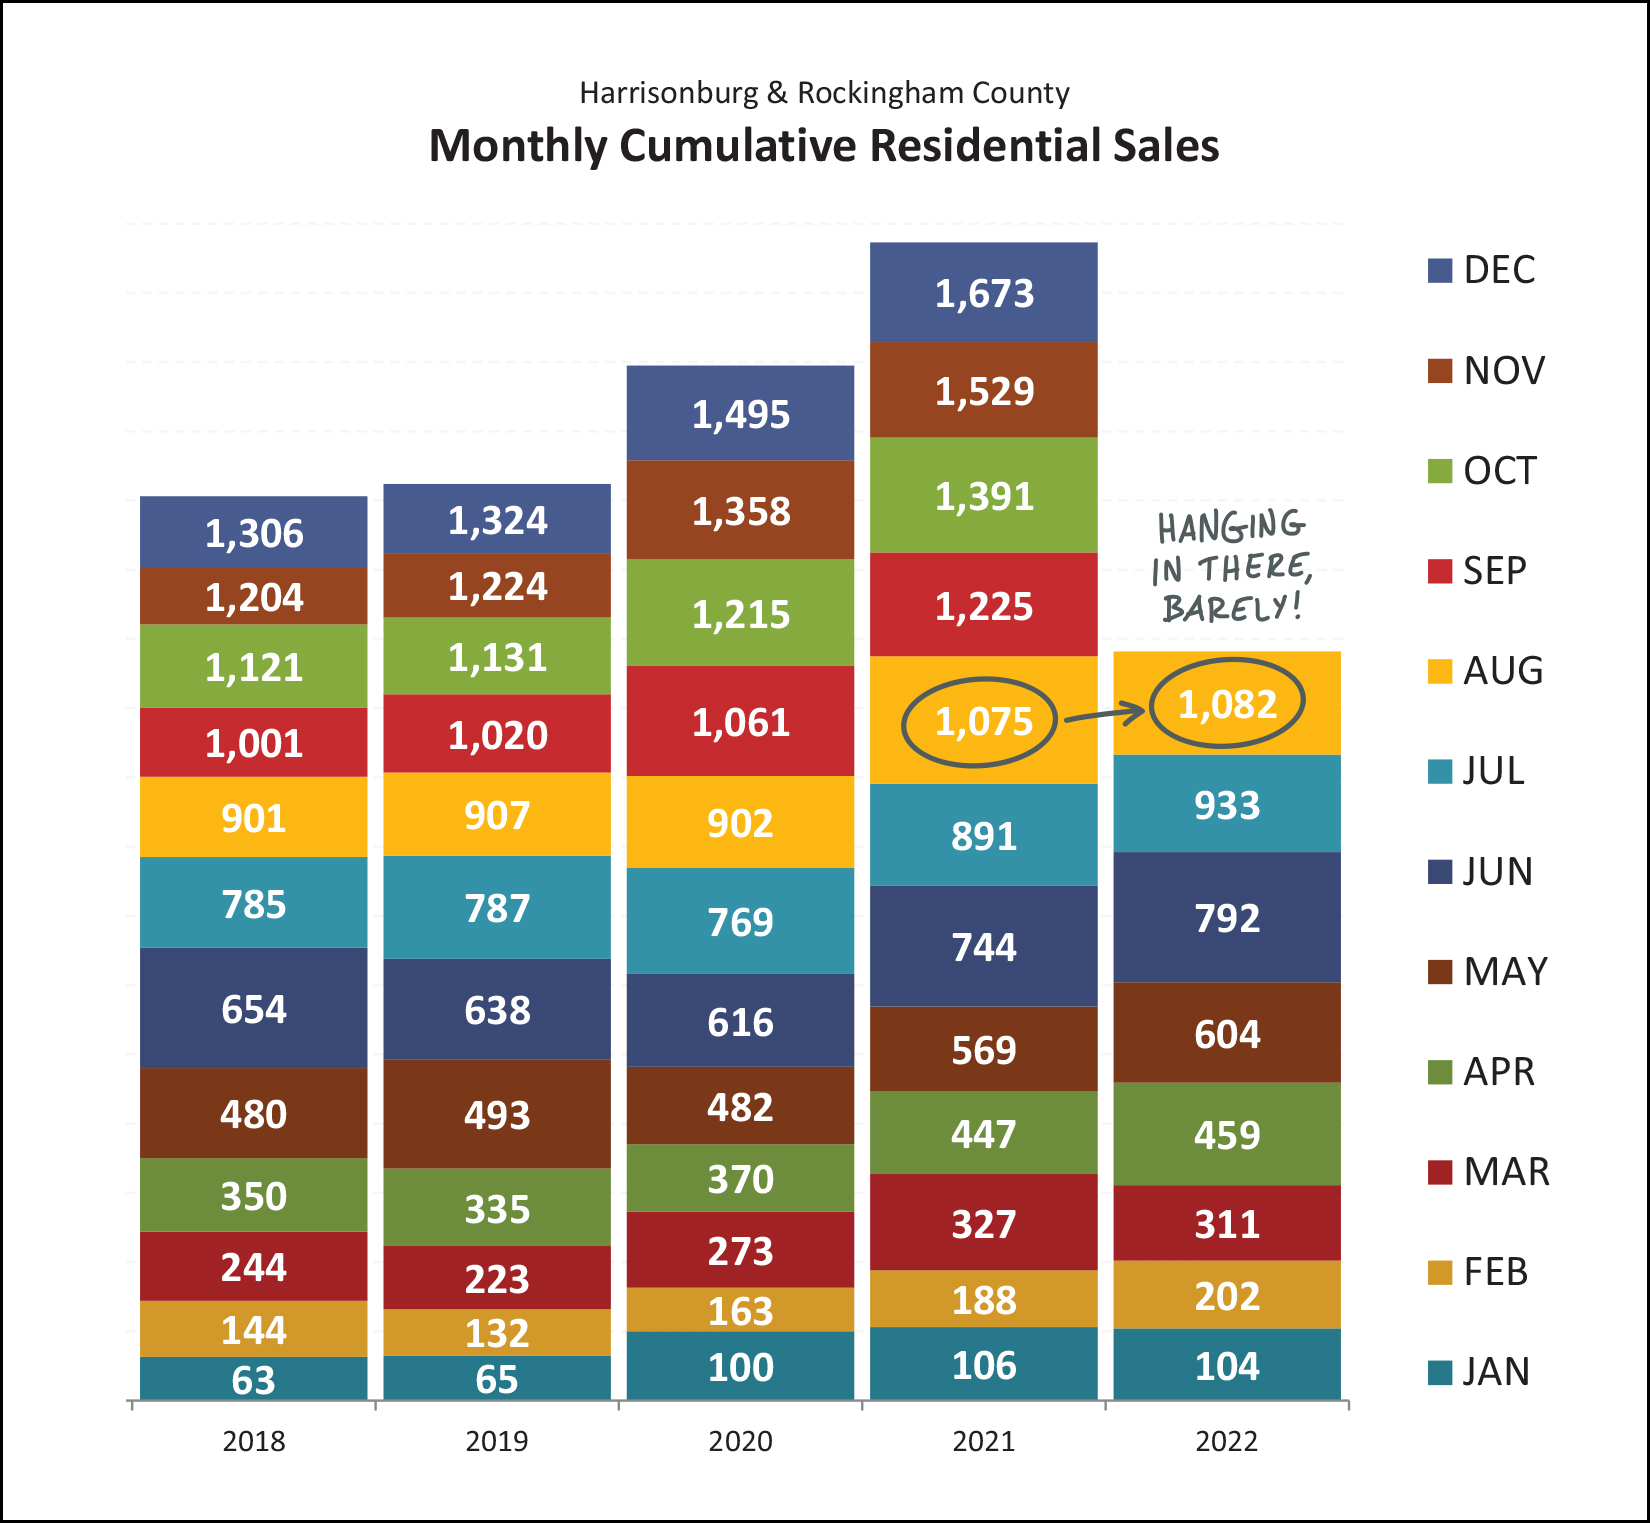 Here you can more clearly see that 2022 year-to-date home sales are barely sticking in the race with 2021. Yes, we have seen slightly more home sales thus far in 2022 than in 2021 (and than in the previous few years) but we're barely ahead now. It seems quite likely that the year-to-date pace of home sales will fall behind as we get through September and October of 2022, especially when we examine contract activity below. So, if you haven't picked up on it yet, it seems the rapid growth in the number of home sales we have been experiencing lately might be starting to... level off... 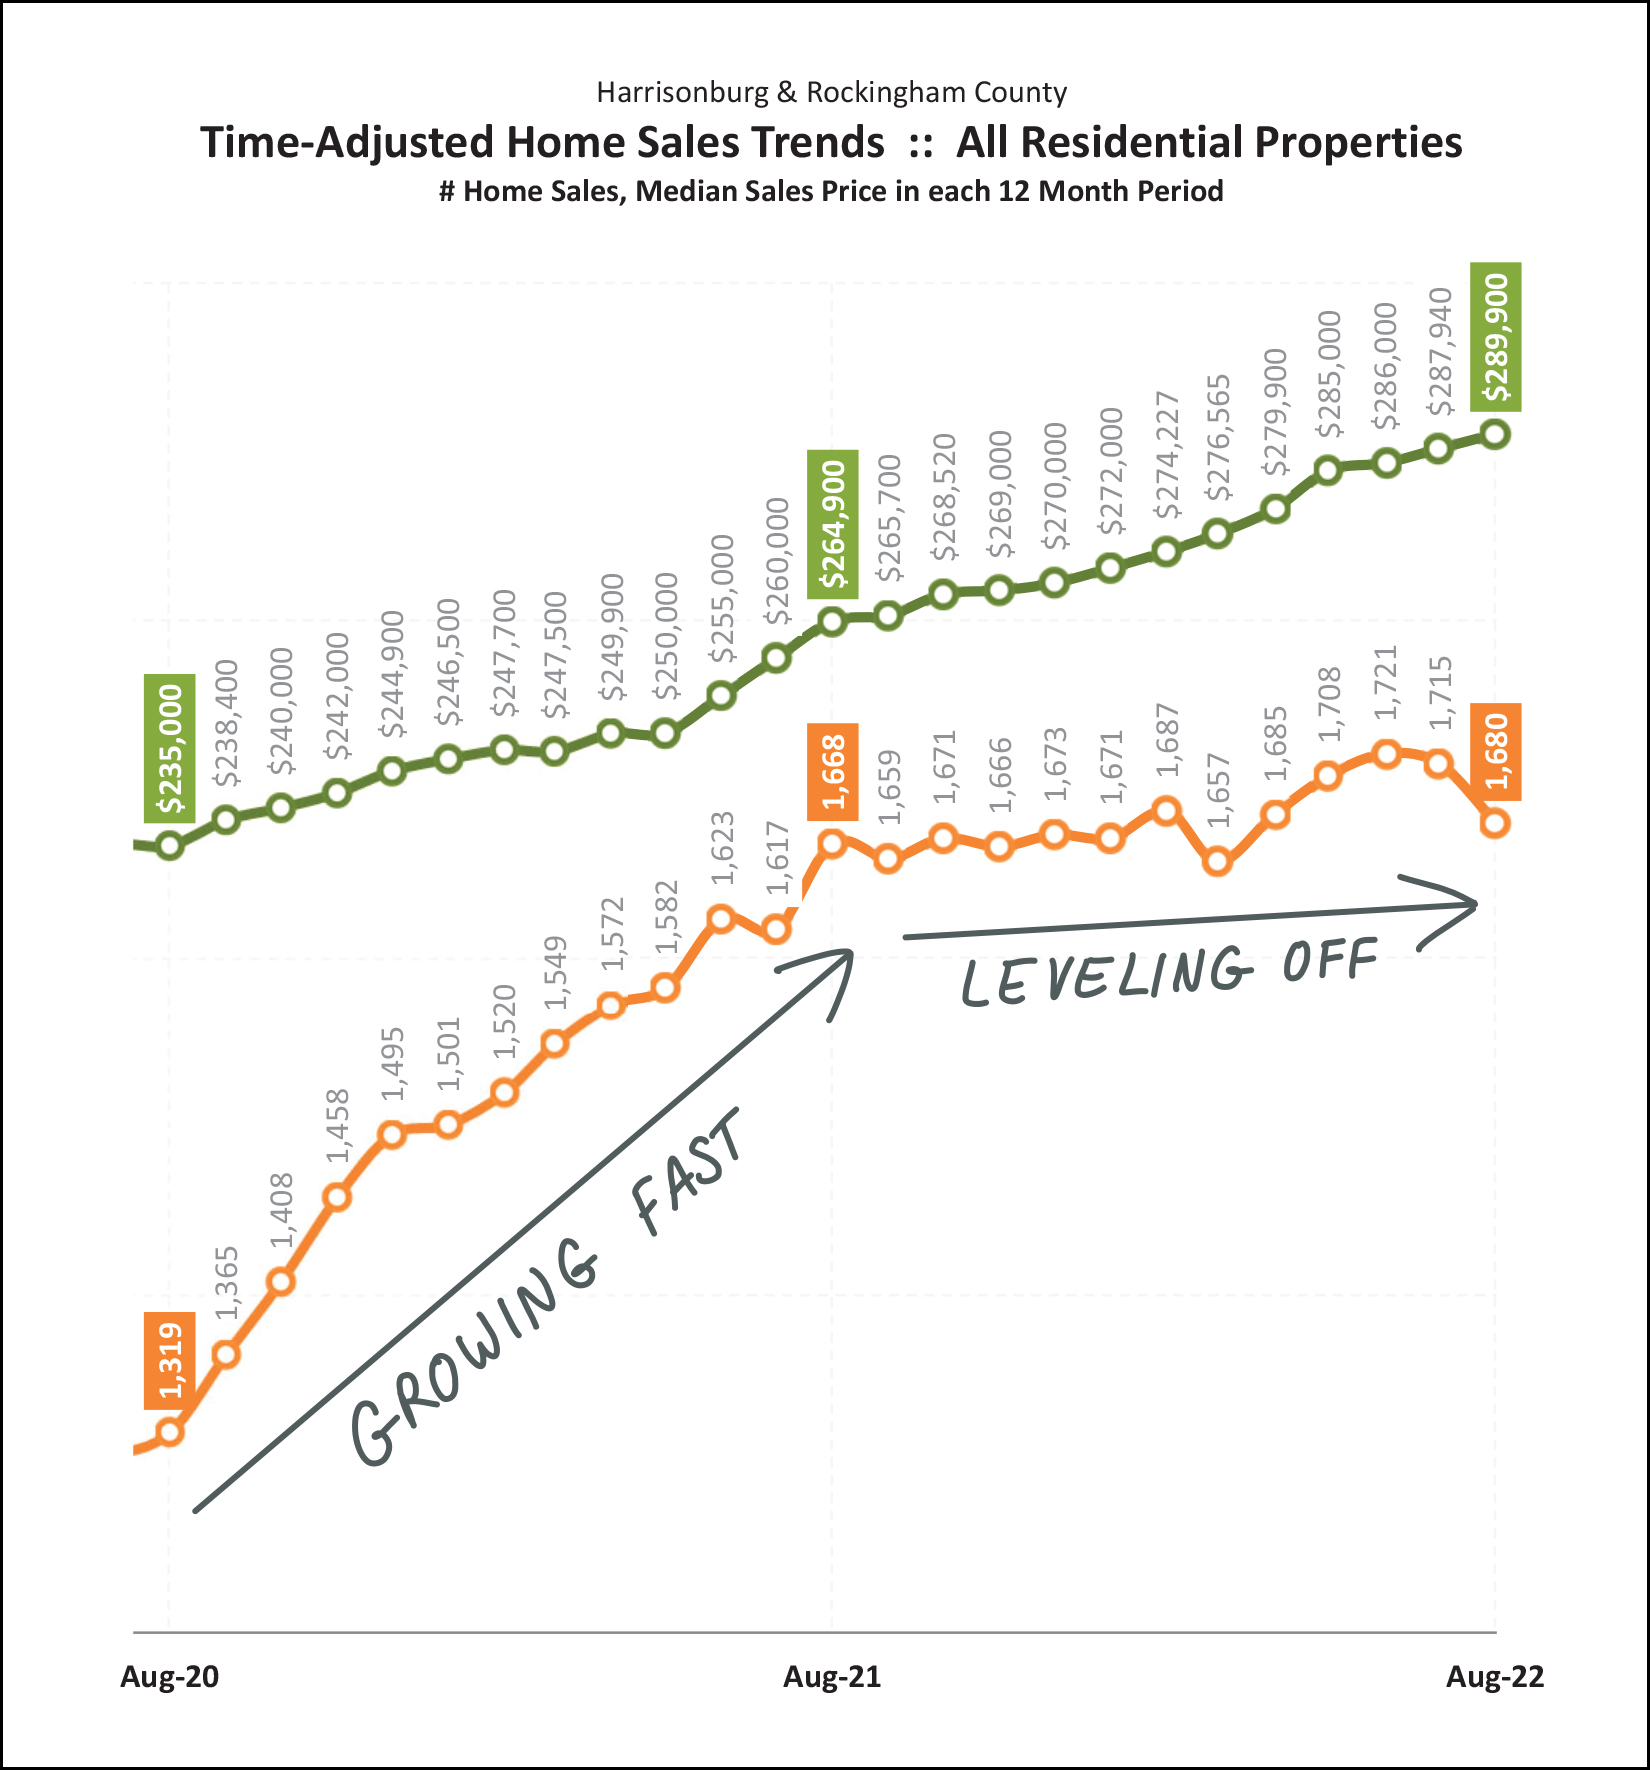 During the height of Covid (2020-21) we saw an ever-increasing number of home sales on an annual basis, seemingly due in large part to the size and shape of "home" being more important than ever as people were spending more time at home during the pandemic... and because of historically low interest rates. Now, however, many of life's patterns (actually going to work, actually going to school) seem to be returning... and mortgage interest rates (if you haven't heard!?) are quite a bit higher than they were a year ago. So, it seems very unlikely that we will continue to see rapid growth in the annual pace of home sales like we saw between August 2020 and August 2021, and it seems more likely that we will see a leveling off, or even a slight slowdown, in the number of homes selling in Harrisonburg and Rockingham County each year. All of this, though, is related to the orange line above... the number of homes selling. Quietly, in the background, the median sales price (green line) just keeps on rising, and rising. The unknown, at this point, is whether we will see home prices start to level out at all. Thus far, they are continuing to rise quite rapidly. Speaking of rising prices, here's a graph that will put these price increases in context pretty quickly... 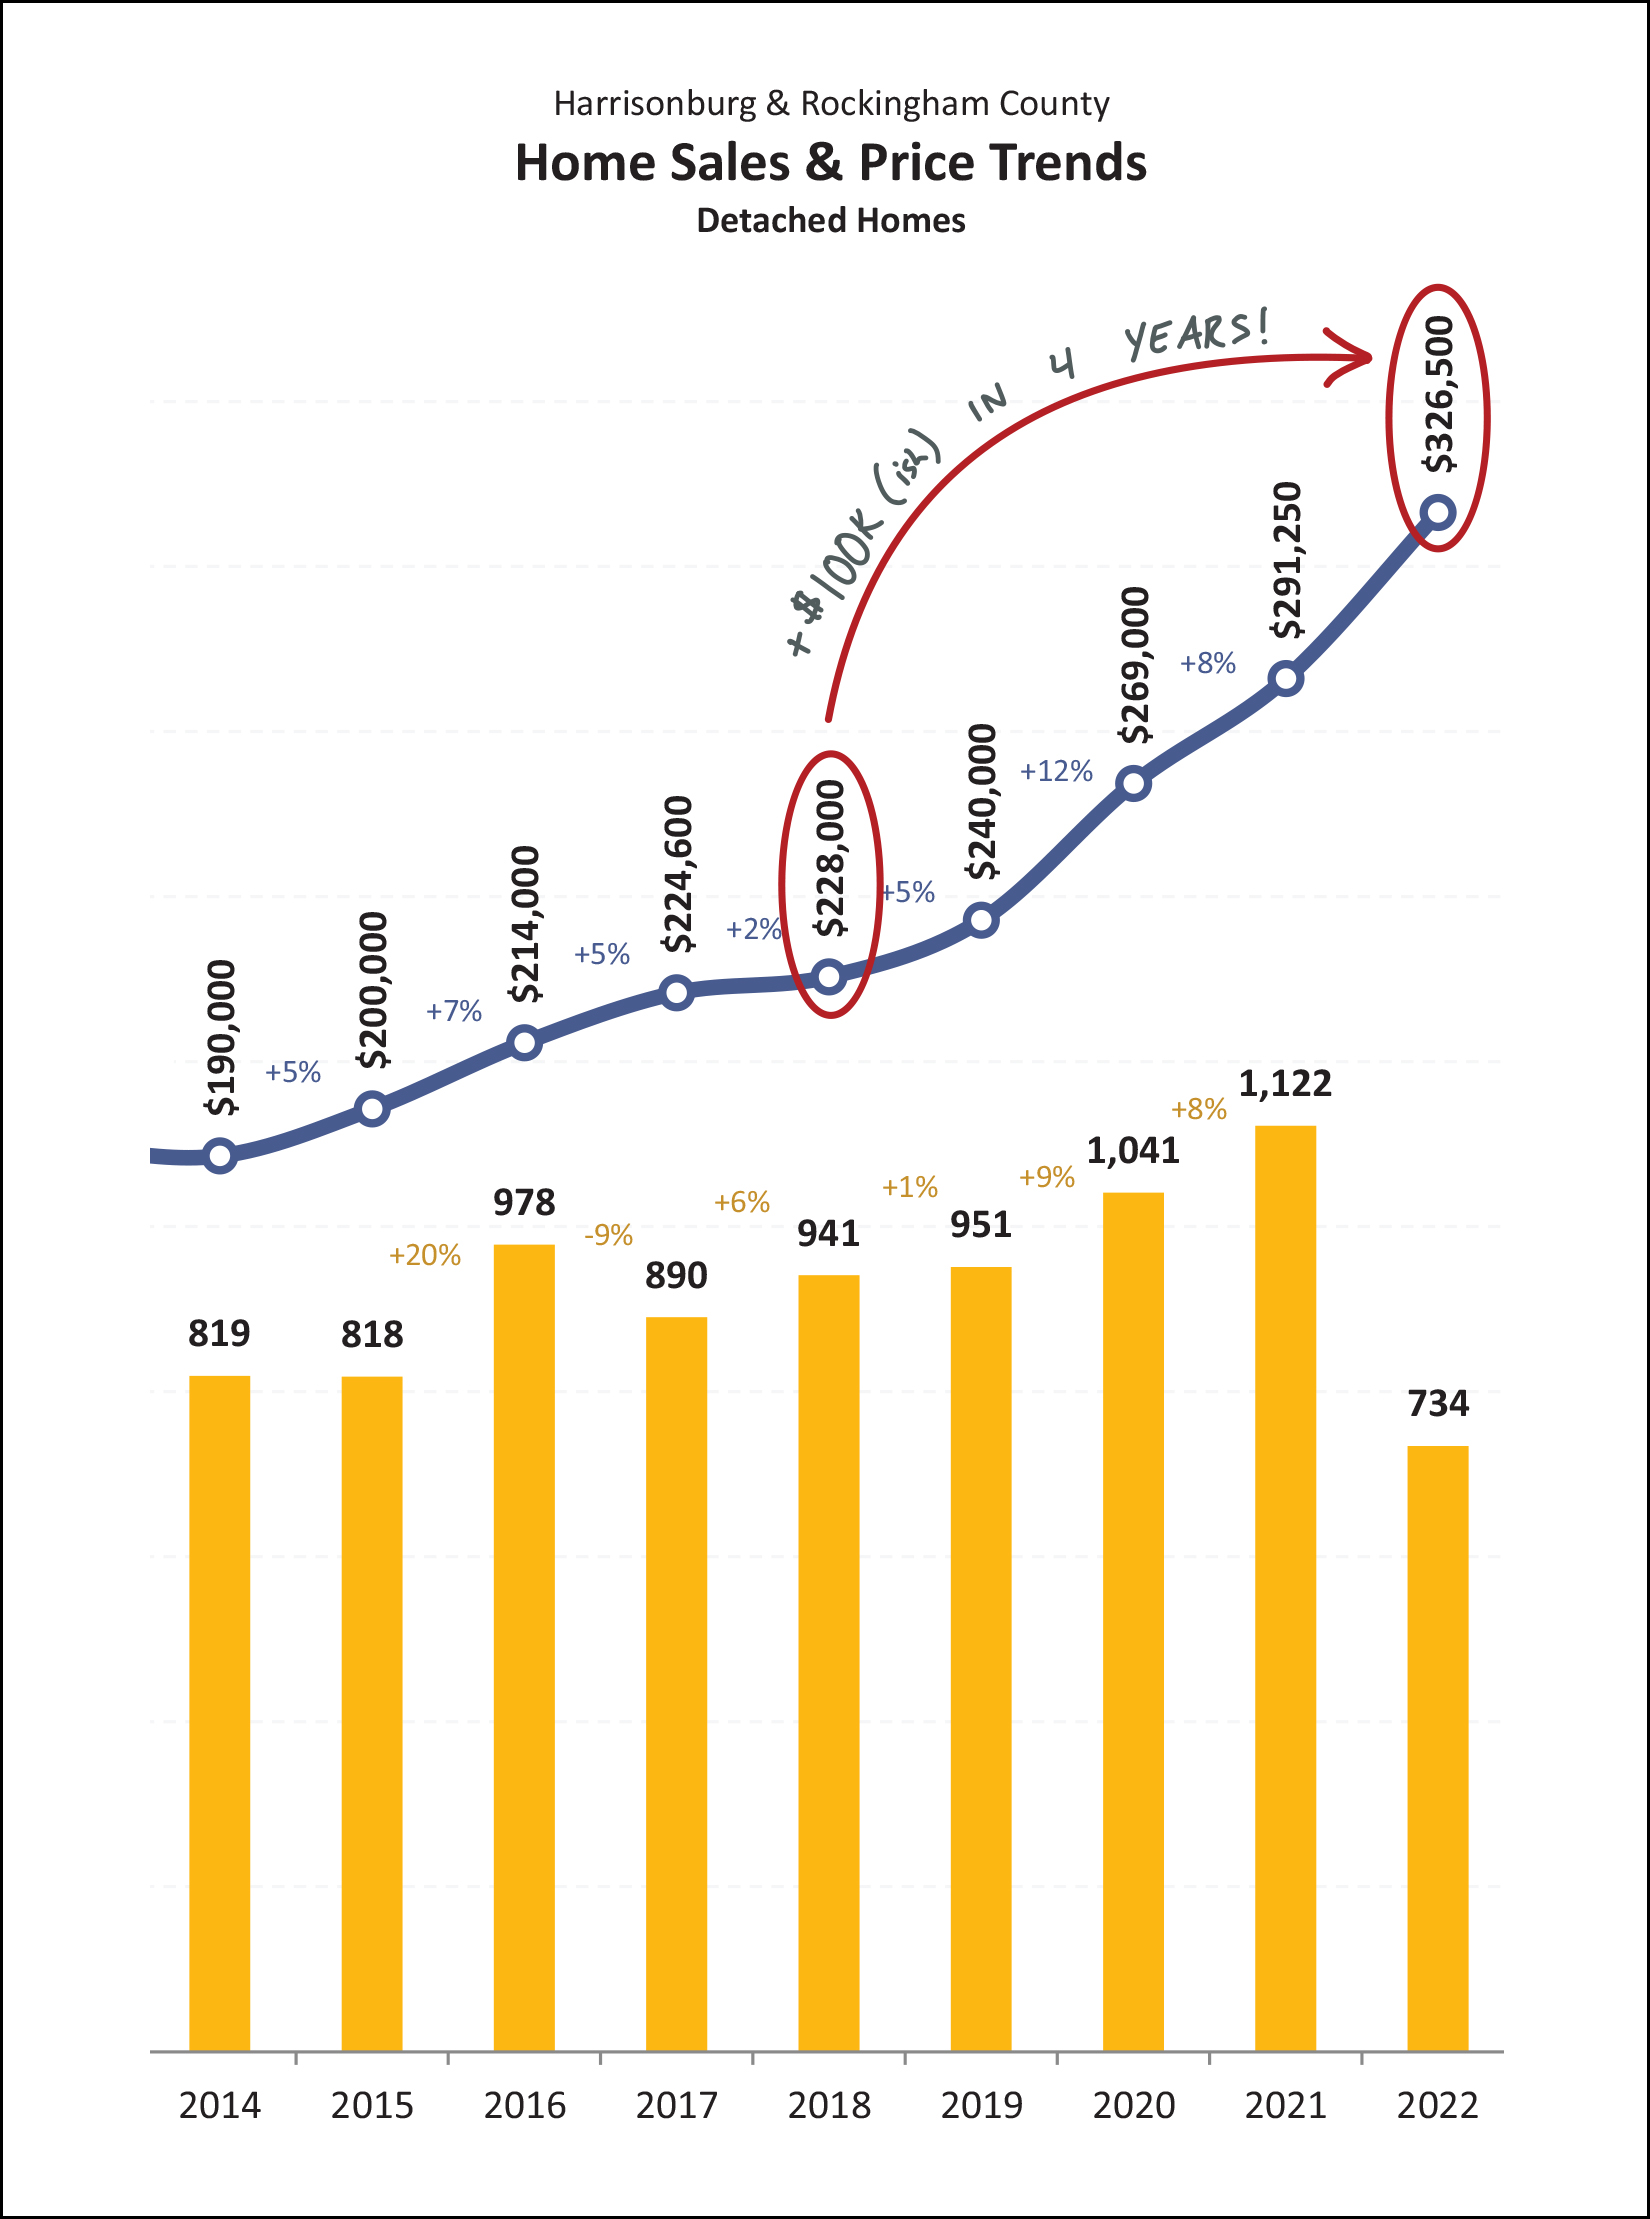 In just four years (2018-2022) the median sales price of a single family home in Harrisonburg and Rockingham County has increased by almost $100,000... from $228,000 to $326,500! What a great time to have owned a home... and what a tough time to buy one now if you haven't owned a home for the past few years to be a part of a joyful ride up the roller coaster of home values. Here's another graph that provides further evidence of the likelihood that we will continue to see the market slow down when it comes to the number of homes selling... 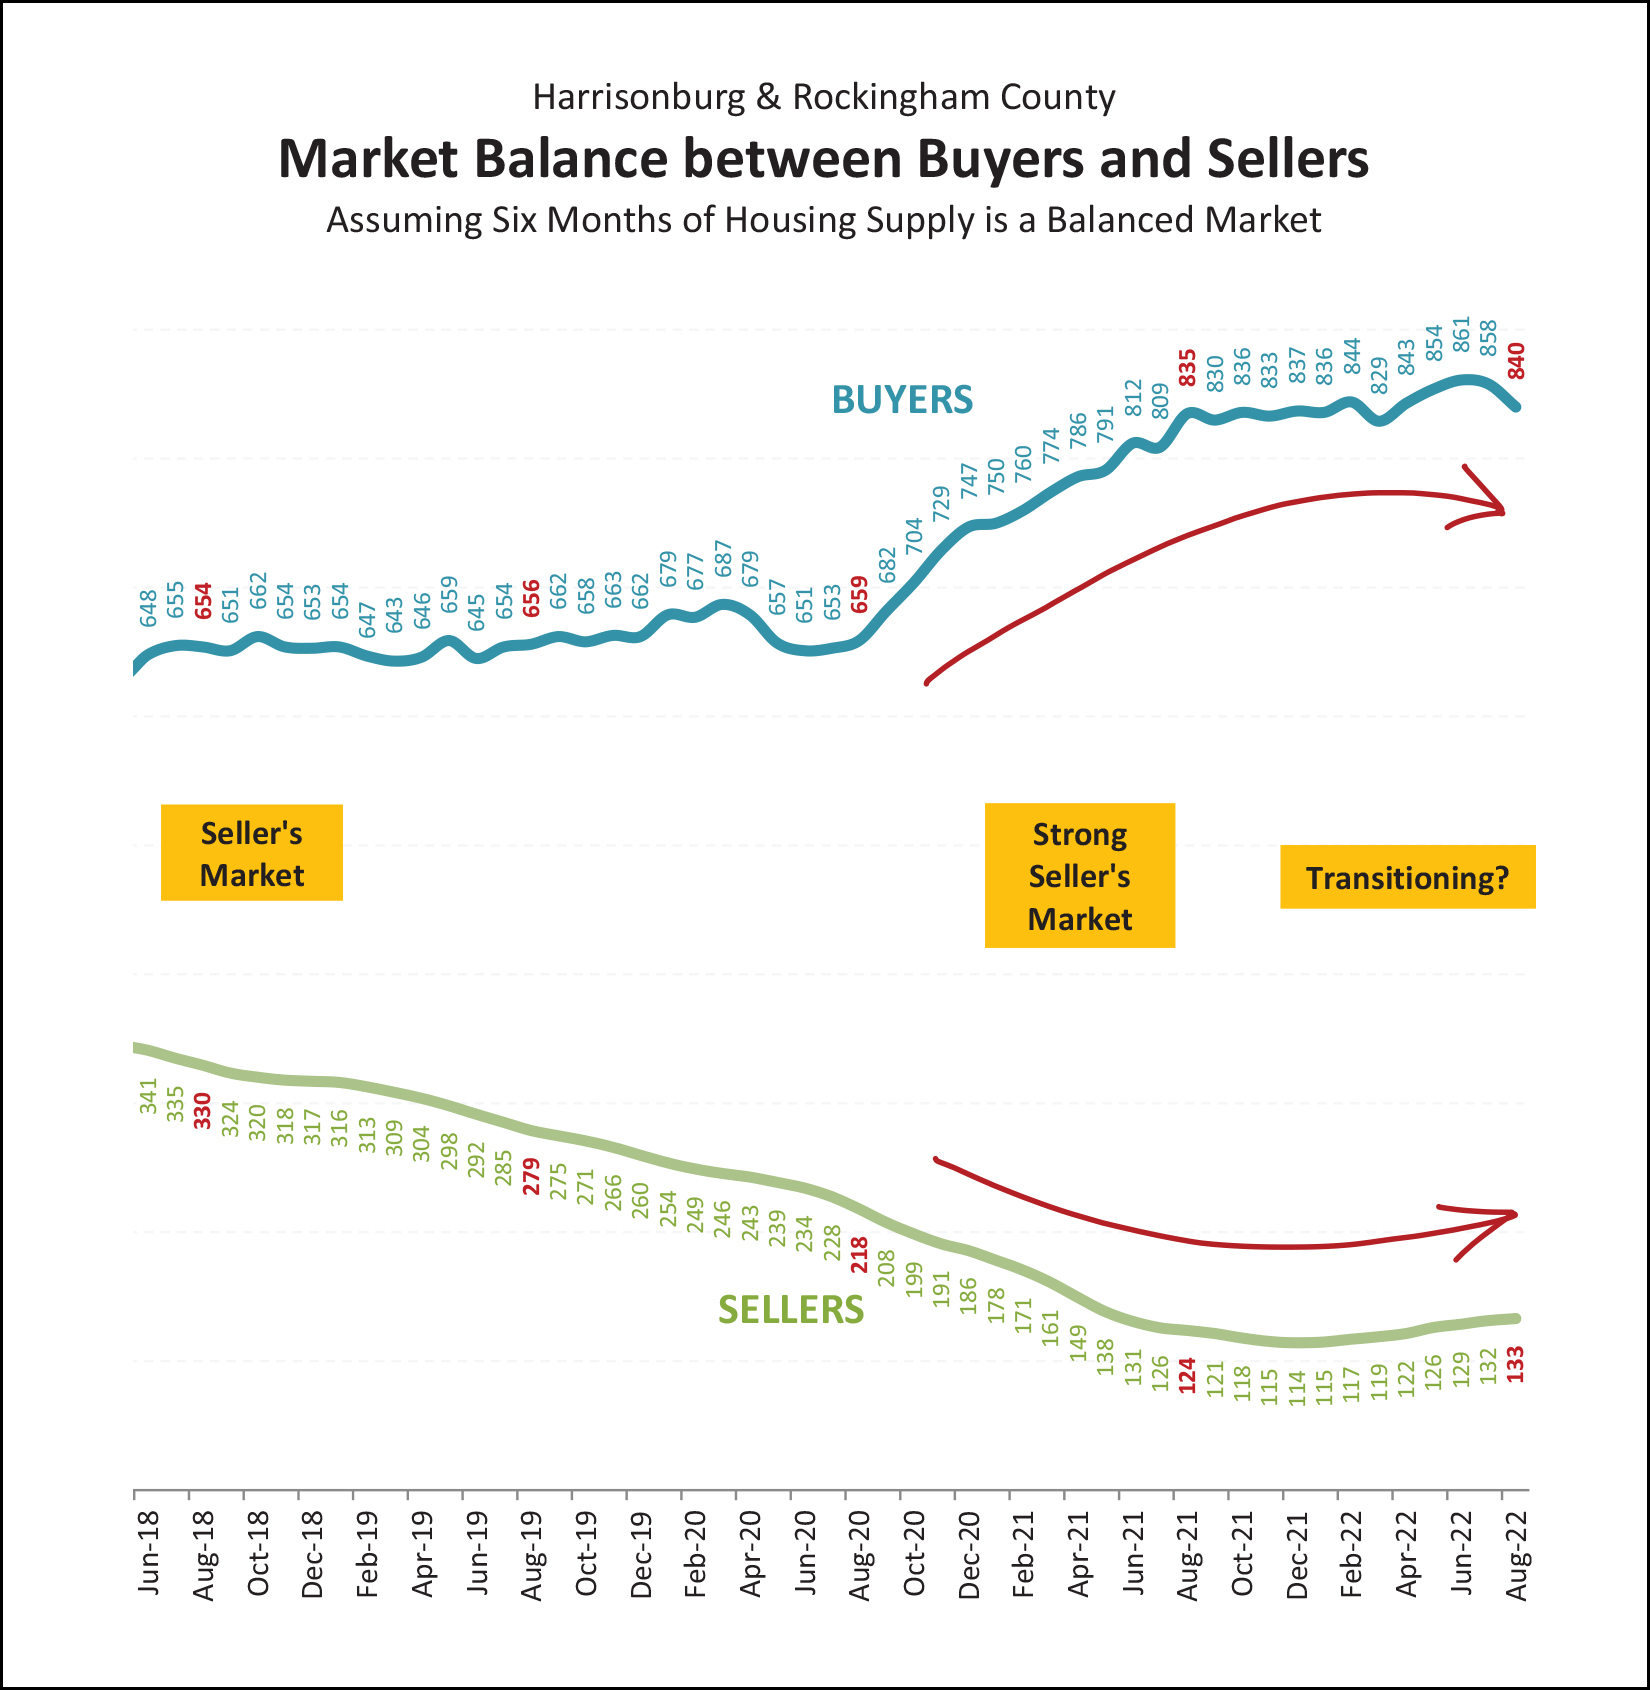 I've drawn the arrows above to show where I think things have been going and are going... Top Arrow = slight, slow, decrease in the number of buyers buying Bottom Arrow = slight, slow, increase in the number of sellers selling as it relates to active inventory at any given time So, indeed, the market may be transitioning a bit. A few fewer buyers are buying and a few more sellers are selling. These dynamics are turning our market, ever so slightly, towards a slightly less strong seller's market. But, yes, still a strong seller's market. Several times in this synopsis I have spoken about home sales slowing and referenced that I anticipate a further slowdown in the next few months. Here's why... 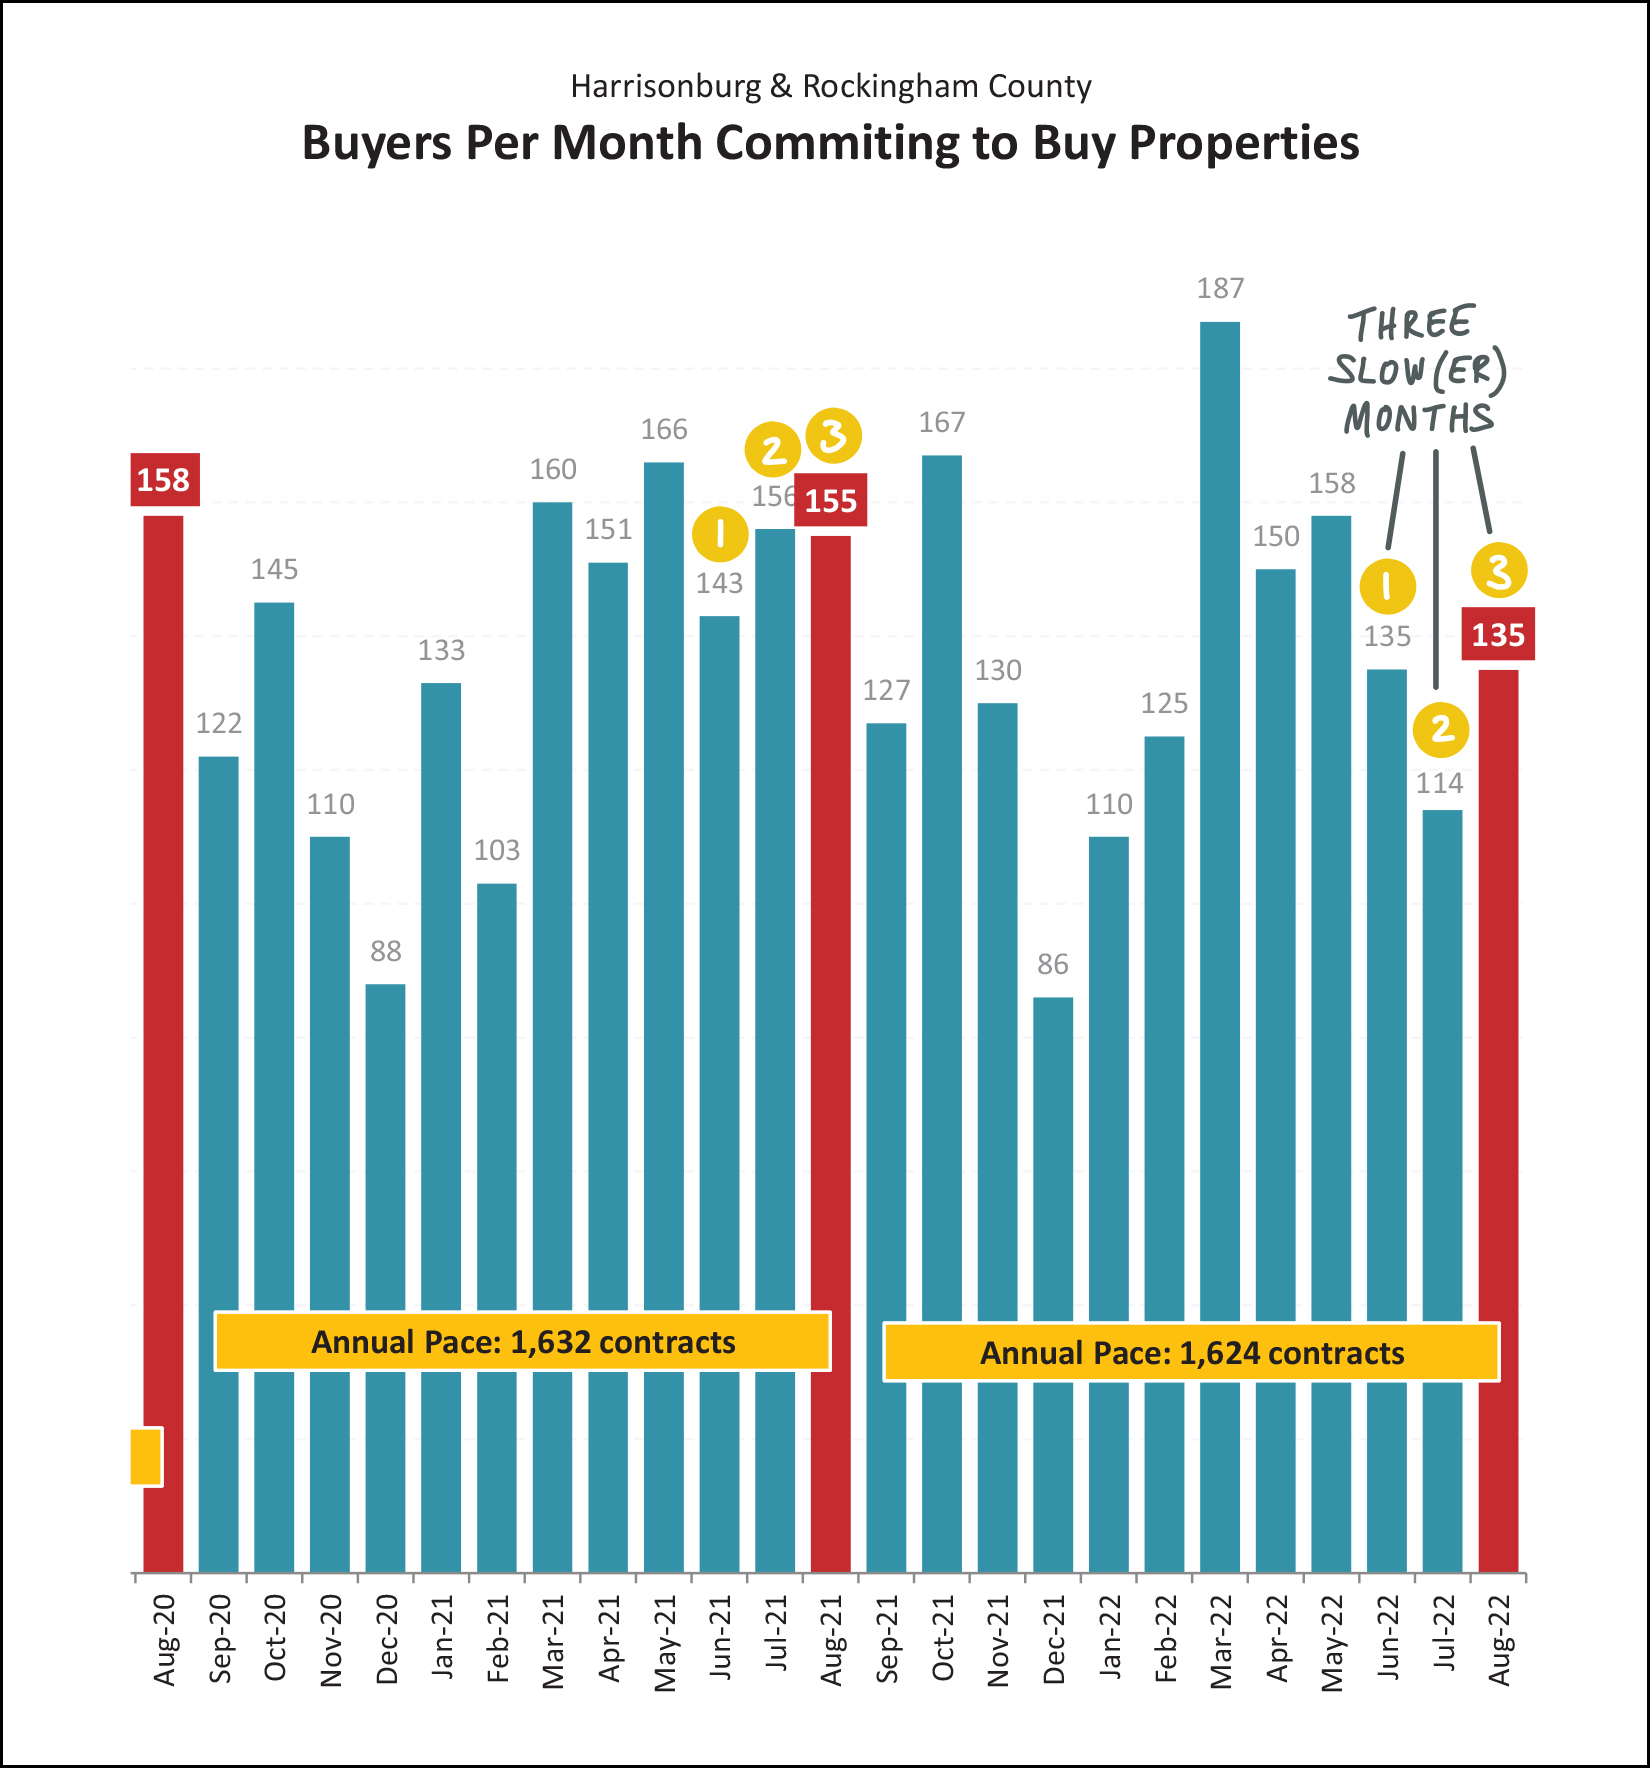 The graph above is showing us contract activity per month in Harrisonburg and Rockingham County... counting how many homes go under contract each month. Last summer (the first set of 1, 2, 3) there were 143, 156 and 155 contracts signed for a total of 454 contracts. This summer (the second set of 1, 2, 30) there were 135, 114 and 135 contracts signed for a total of 384 contracts signed. So, indeed, fewer contracts for several months in a row has already started to translate into fewer home sales, and will continue to do so for at least another month or two in the future. With slightly fewer buyers buying are we seeing inventory levels starting to rise? Slightly... 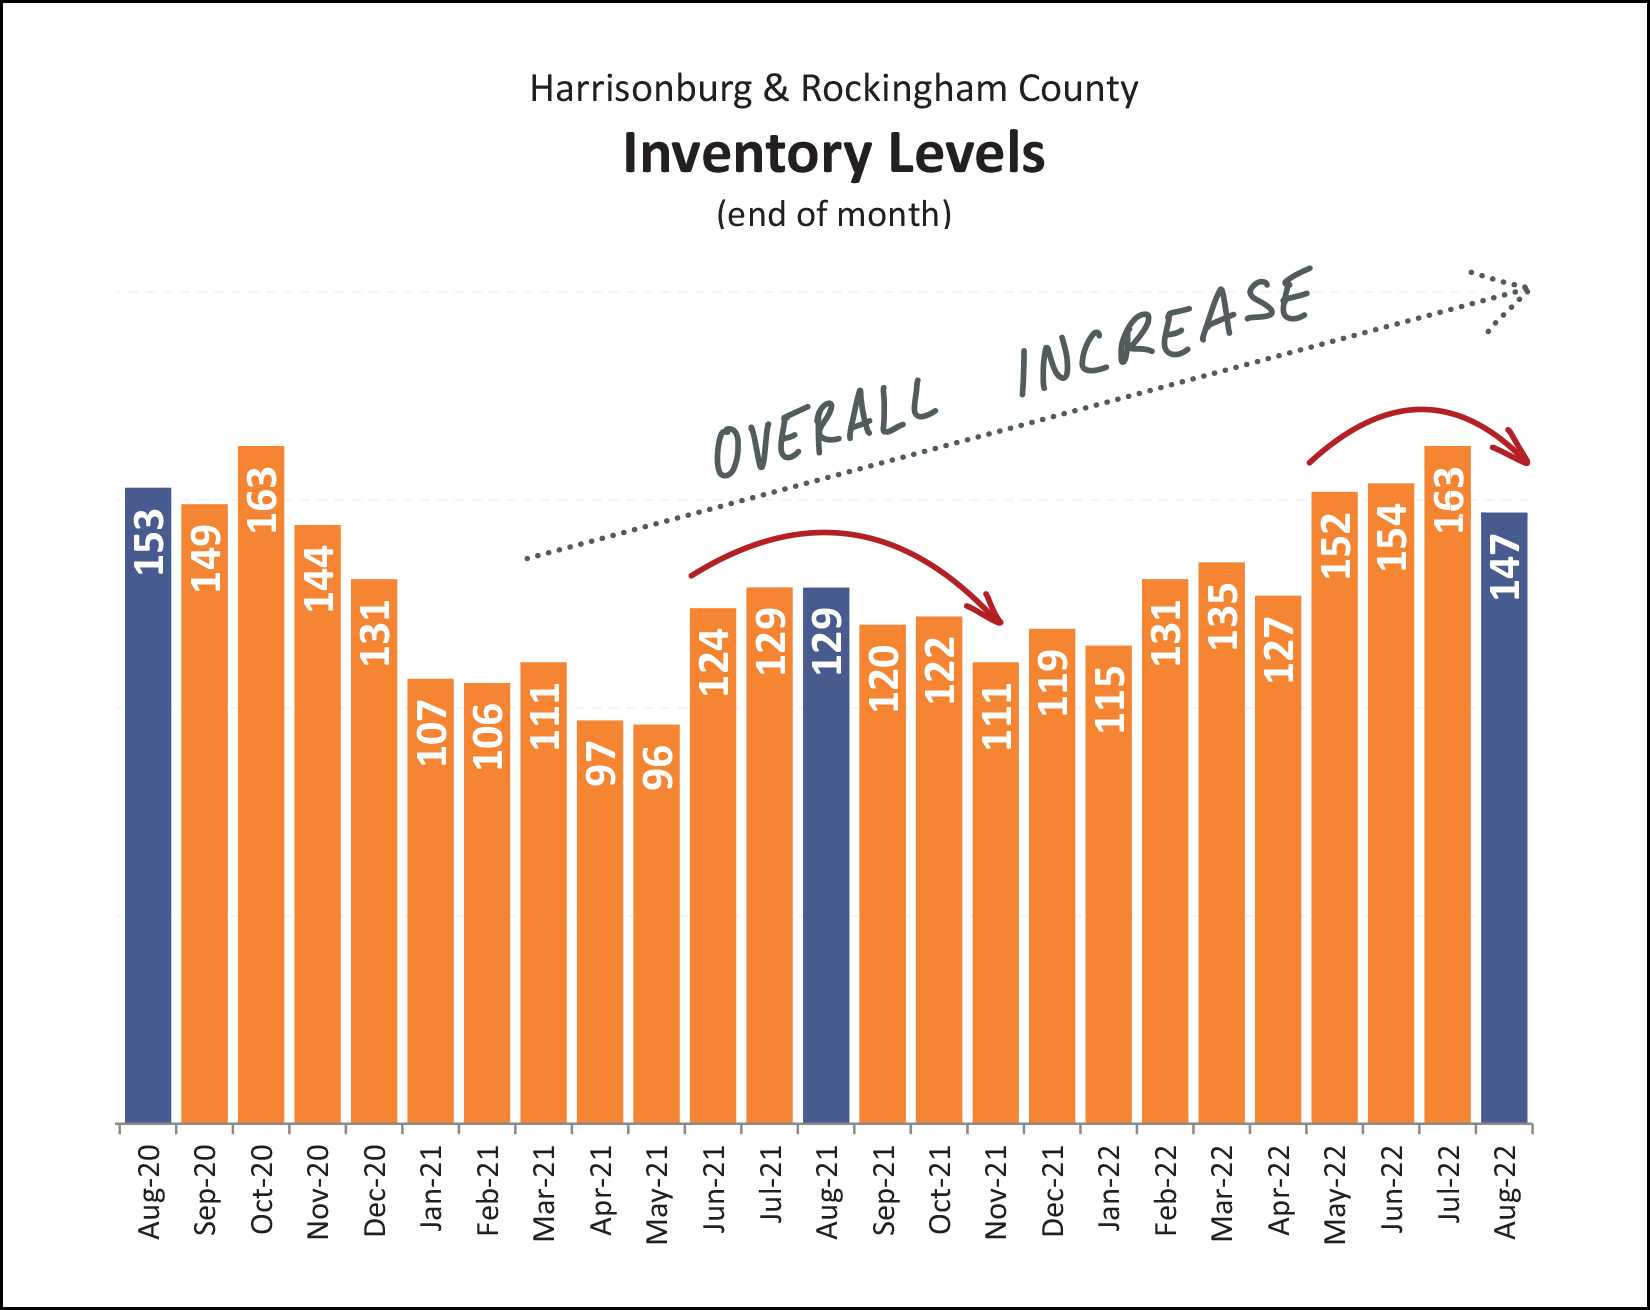 A year ago there were 129 homes on the market for sale at this time... and that has risen, slightly, to 147 homes for sale. So, yes, we are seeing somewhat of an overall increase in the number of homes for sale... but not by that much. And... from a shorter term perspective, inventory levels are currently trending down as they usually do as we move from summer into fall. Finally, one last graph for a bit of AHHHHH and GRRR... 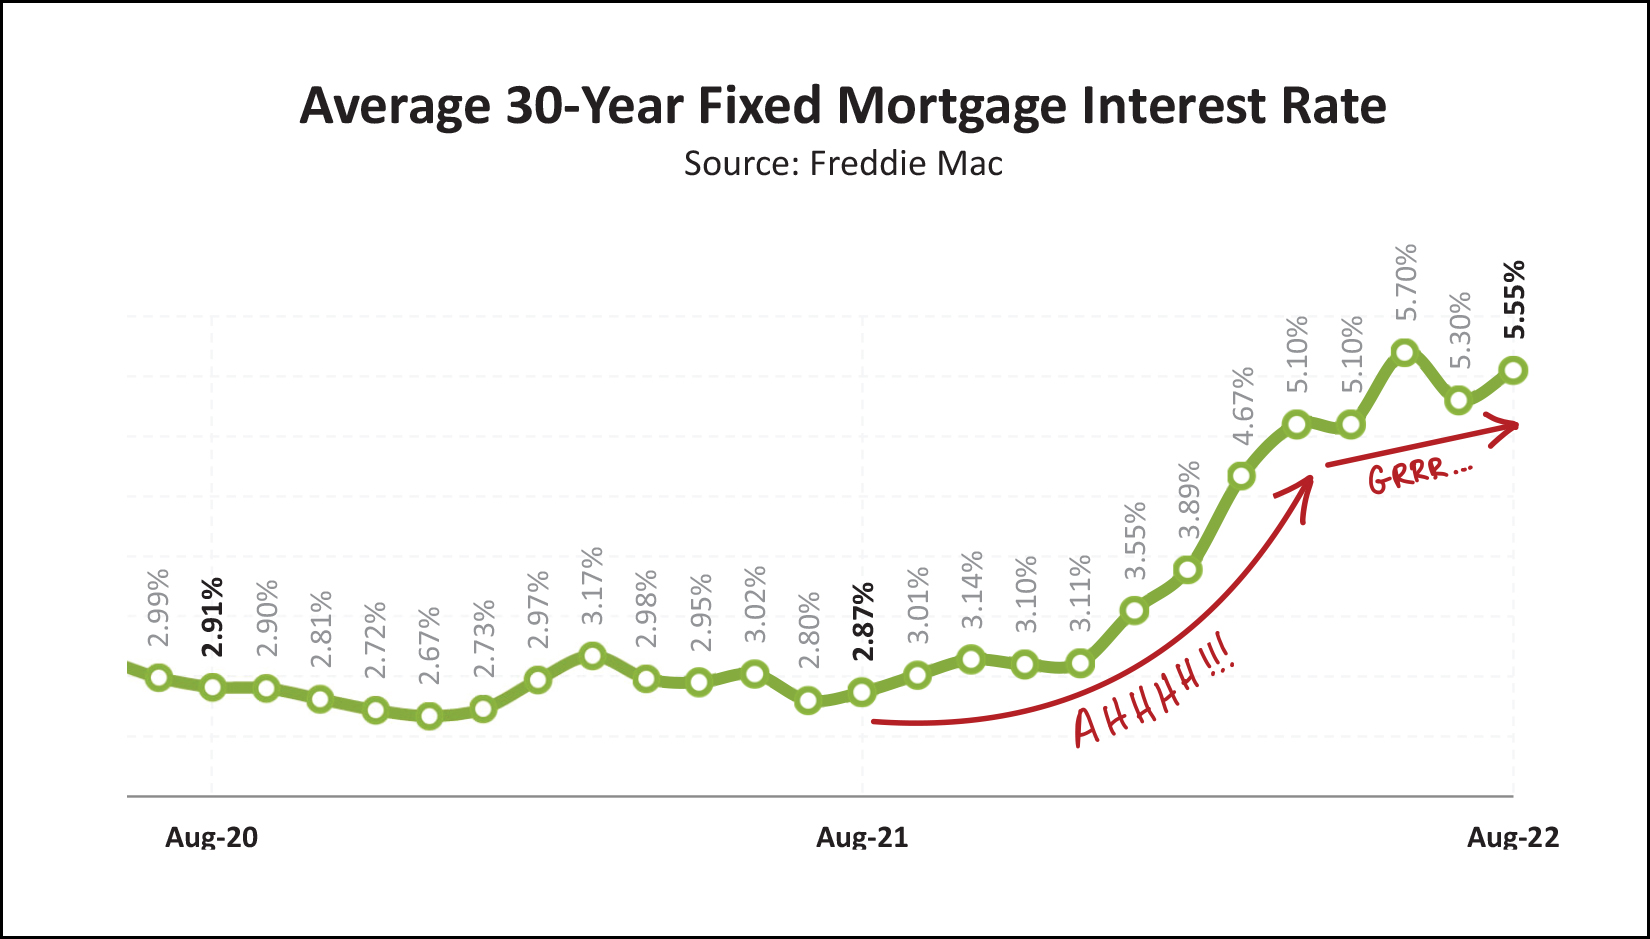 From the end of last summer (Aug 2021) through early 2022 we saw a rapid increase in mortgage interest rates. They rose from less than 3% up to over 5% in only eight months. Ahhhhh!!! Over the past few months, mortgage interest rates have shown they might not get all the way to 6%, but they haven't made their way back down to, or below 5%. Grrr... Comparably higher mortgage interest rates (as compared to the past few years) continue to have an impact on how many buyers are able to, or are willing to, buy a home right now... and it doesn't seem that these higher interest rates will be leaving us as quickly as they showed up. So... in summary... [1] The pace of home sales seem to be slowing, slightly, though 2022 is still ahead of 2021 at this point. [2] Contract activity is slowing, slightly, which means closed sales will also continue to slow. [3] Home prices continue to rise rapidly. [4] Inventory levels are rising, slightly. [5] Mortgage interest rates are still quite high. If you're thinking about buying a home, or selling a home, let's talk about how things are going in your segment of the market as it relates to the price, size, location and age of your home. The first step? Email me or text/call me at 540-578-0102. I'll check in on the market in about a month, but until then, enjoy the slightly shorter, cooler days ahead! | |
Harrisonburg Housing Market Still Showing Strength Despite Some Signs Of Slowing |
|
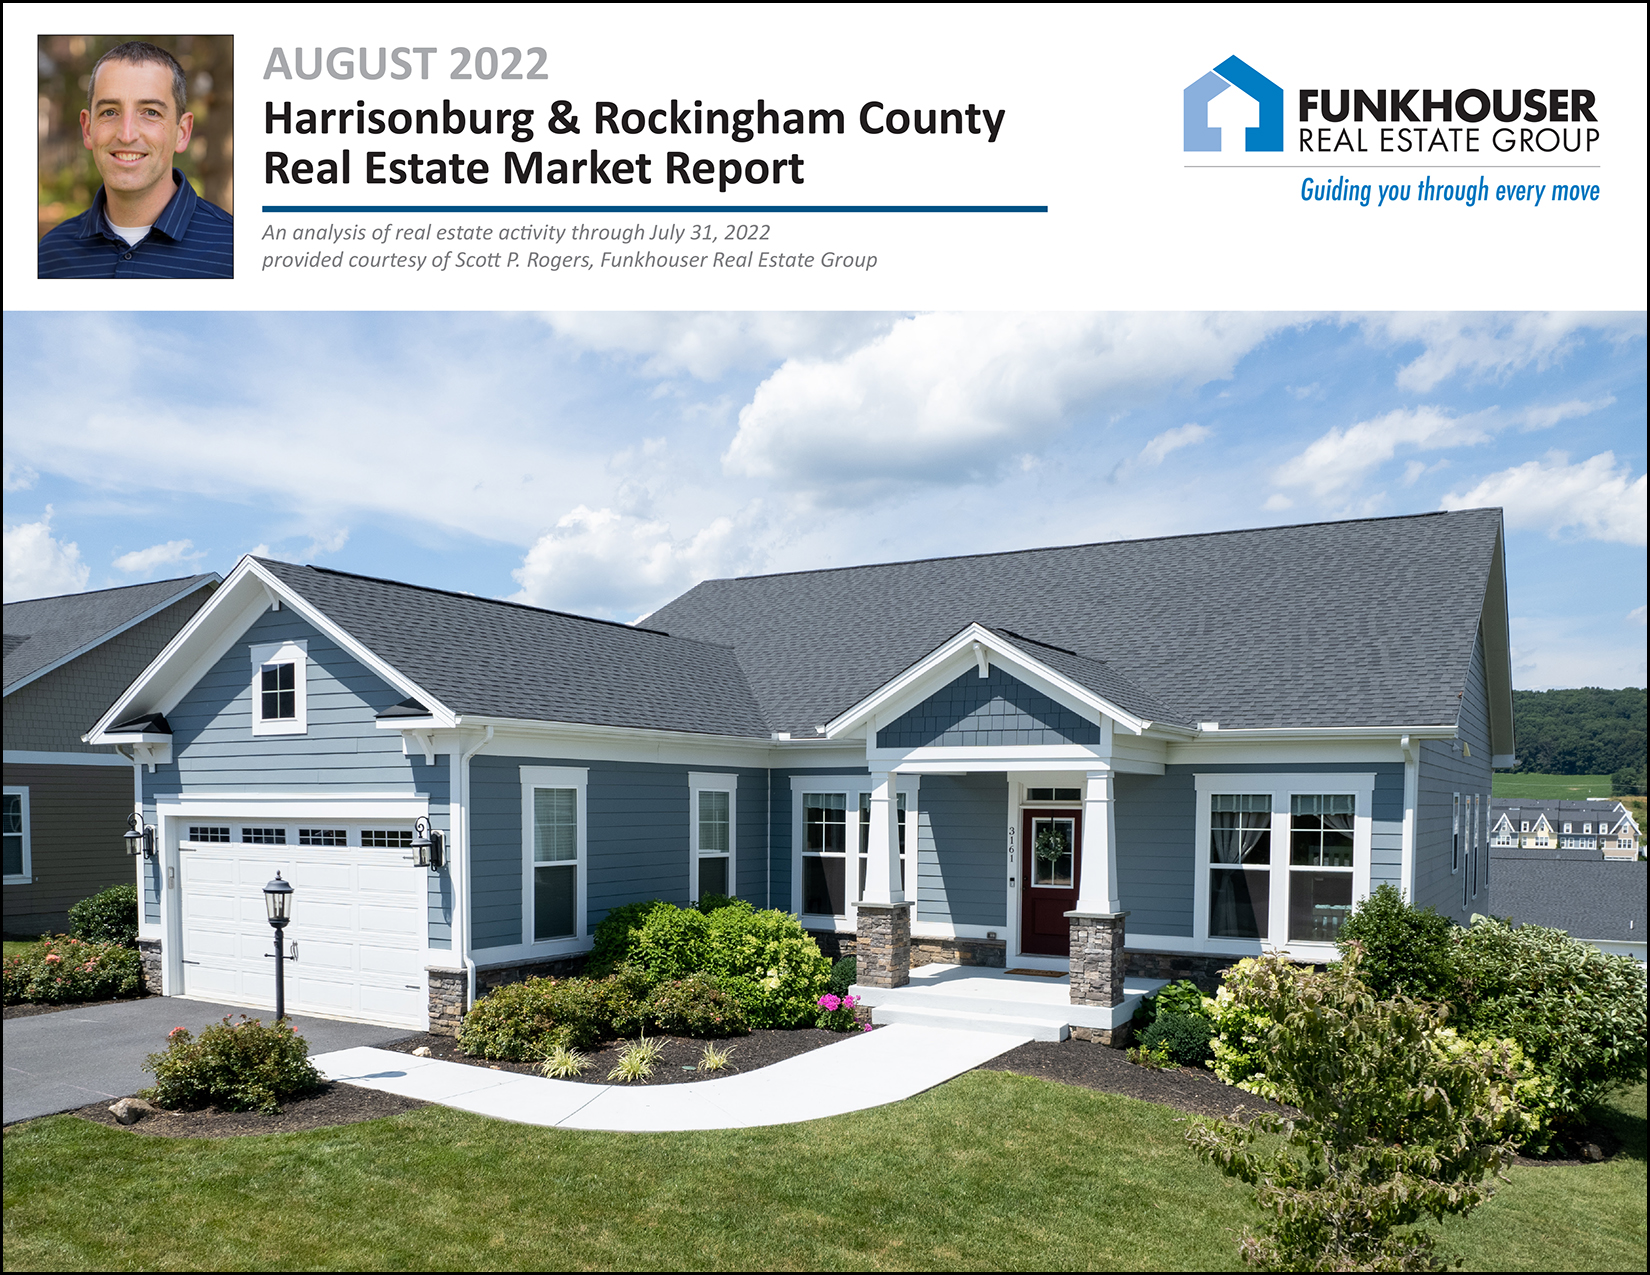 Happy Thursday afternoon, friends! As any student or teacher will tell you, summer is almost over! čśó I hope that you and your family had a wonderful summer and that you had at least one opportunity to sneak away... to the beach, the lake, a tropical island, a music festival, a rural AirBNB, a national forest, a campsite or a new city! One of my favorite spots to sneak away is Deep Creek Lake, MD... 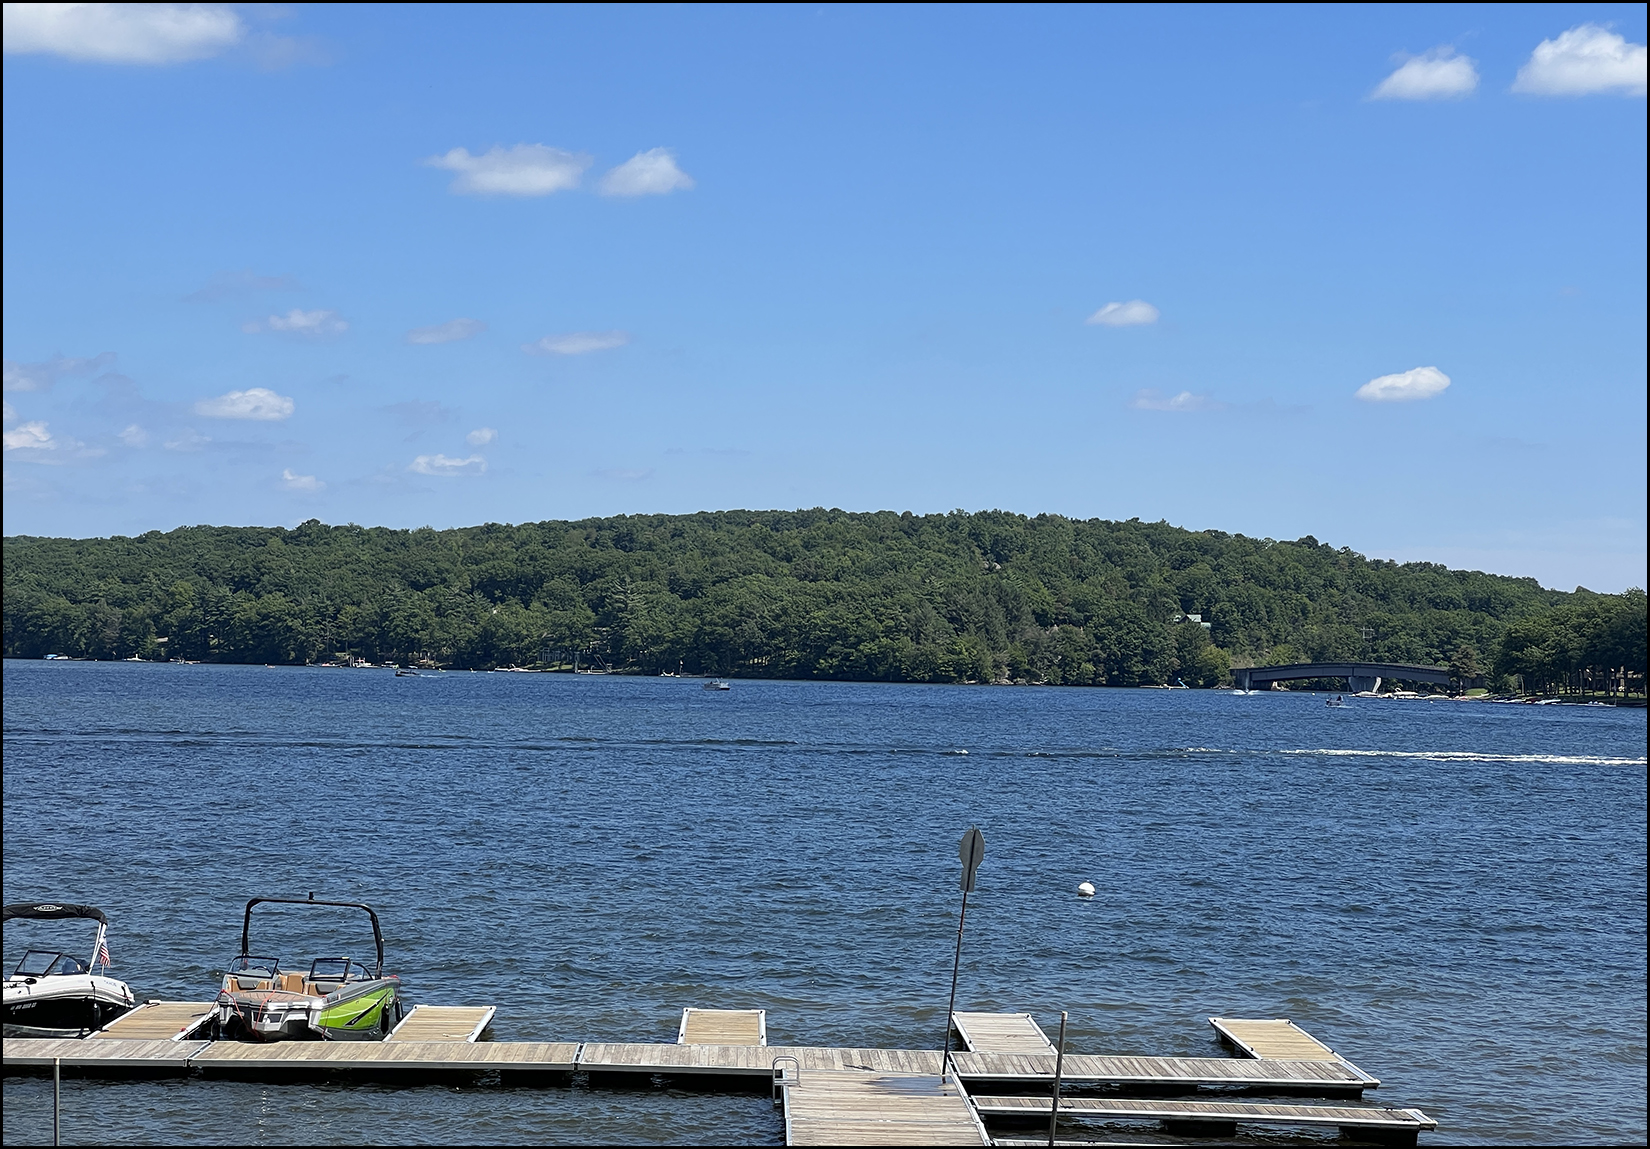 But getting back to business... The beautiful house on the cover of this month's market report is located at 3161 Henry Grant Hill in Preston Lake and you can find out more about this spacious home here. Each month I have a giveaway, of sorts, for readers of this market report. This month's giveaway requires a special sort of market report reader... one who also likes to run... a lot. I enjoy running and frequently participate in races put on by VA Momentum, and thus I was excited to hear they are putting on a half marathon this fall. So... this month, you can enter for a chance to win a free registration to the Harrisonburg Half Marathon, to be held on October 15, 2022! Find out more about the half marathon here. Enter to win the free race registration here. Email me and tell me I'm crazy for thinking you'd run a half marathon here. čśë And now, after all that, let's dig in and see what is happening in our local housing market... 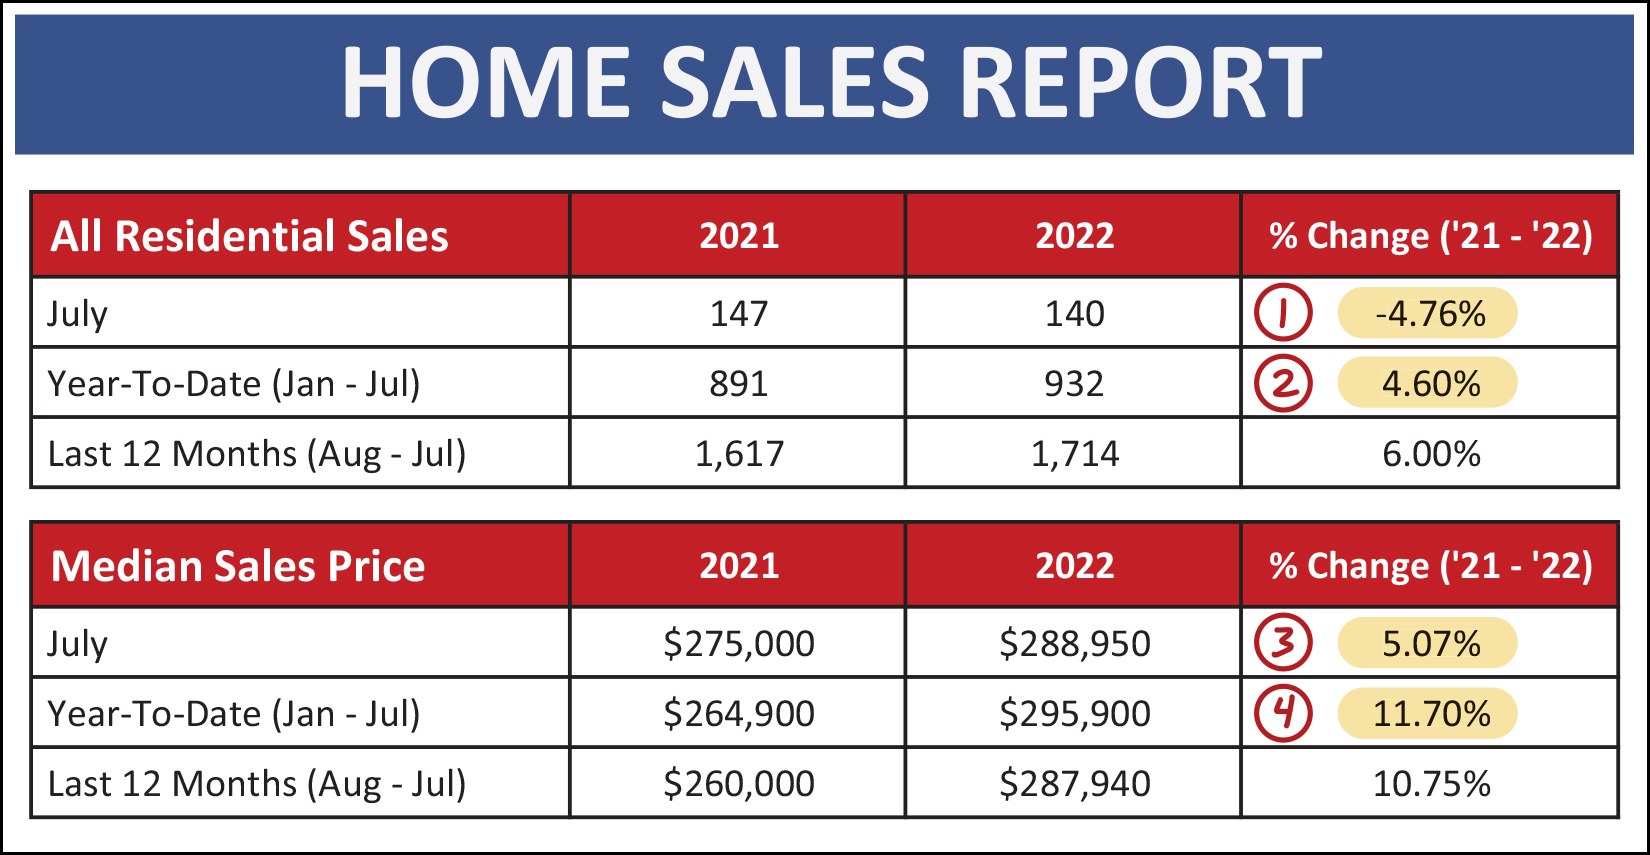 As noted in my headline above, there are some signs that our local real estate market might be slowing down a bit. This very well may mean, though, that it slows down from going 90 MPH in a 60 MPH zone to going 75 MPH in a 60 MPH zone. The latest numbers, as shown above, indicate that... [1] July home sales were slower (140) than last July. We'll see this again on a graph in a moment. [2] Thus far this year we have seen 932 home sales, which is 4.6% more than last year. We had a record number of home sales last year, so a further increase this year is... record breaking. [3] The median sales price in July was 5% higher than last July. [4] When looking at the first seven months of the year, the median sales price has risen 11.7% in Harrisonburg and Rockingham County. So... most of these indicators are quite positive, rosy, exuberant, except the slight slow down in July. This is seen a bit more clearly here... 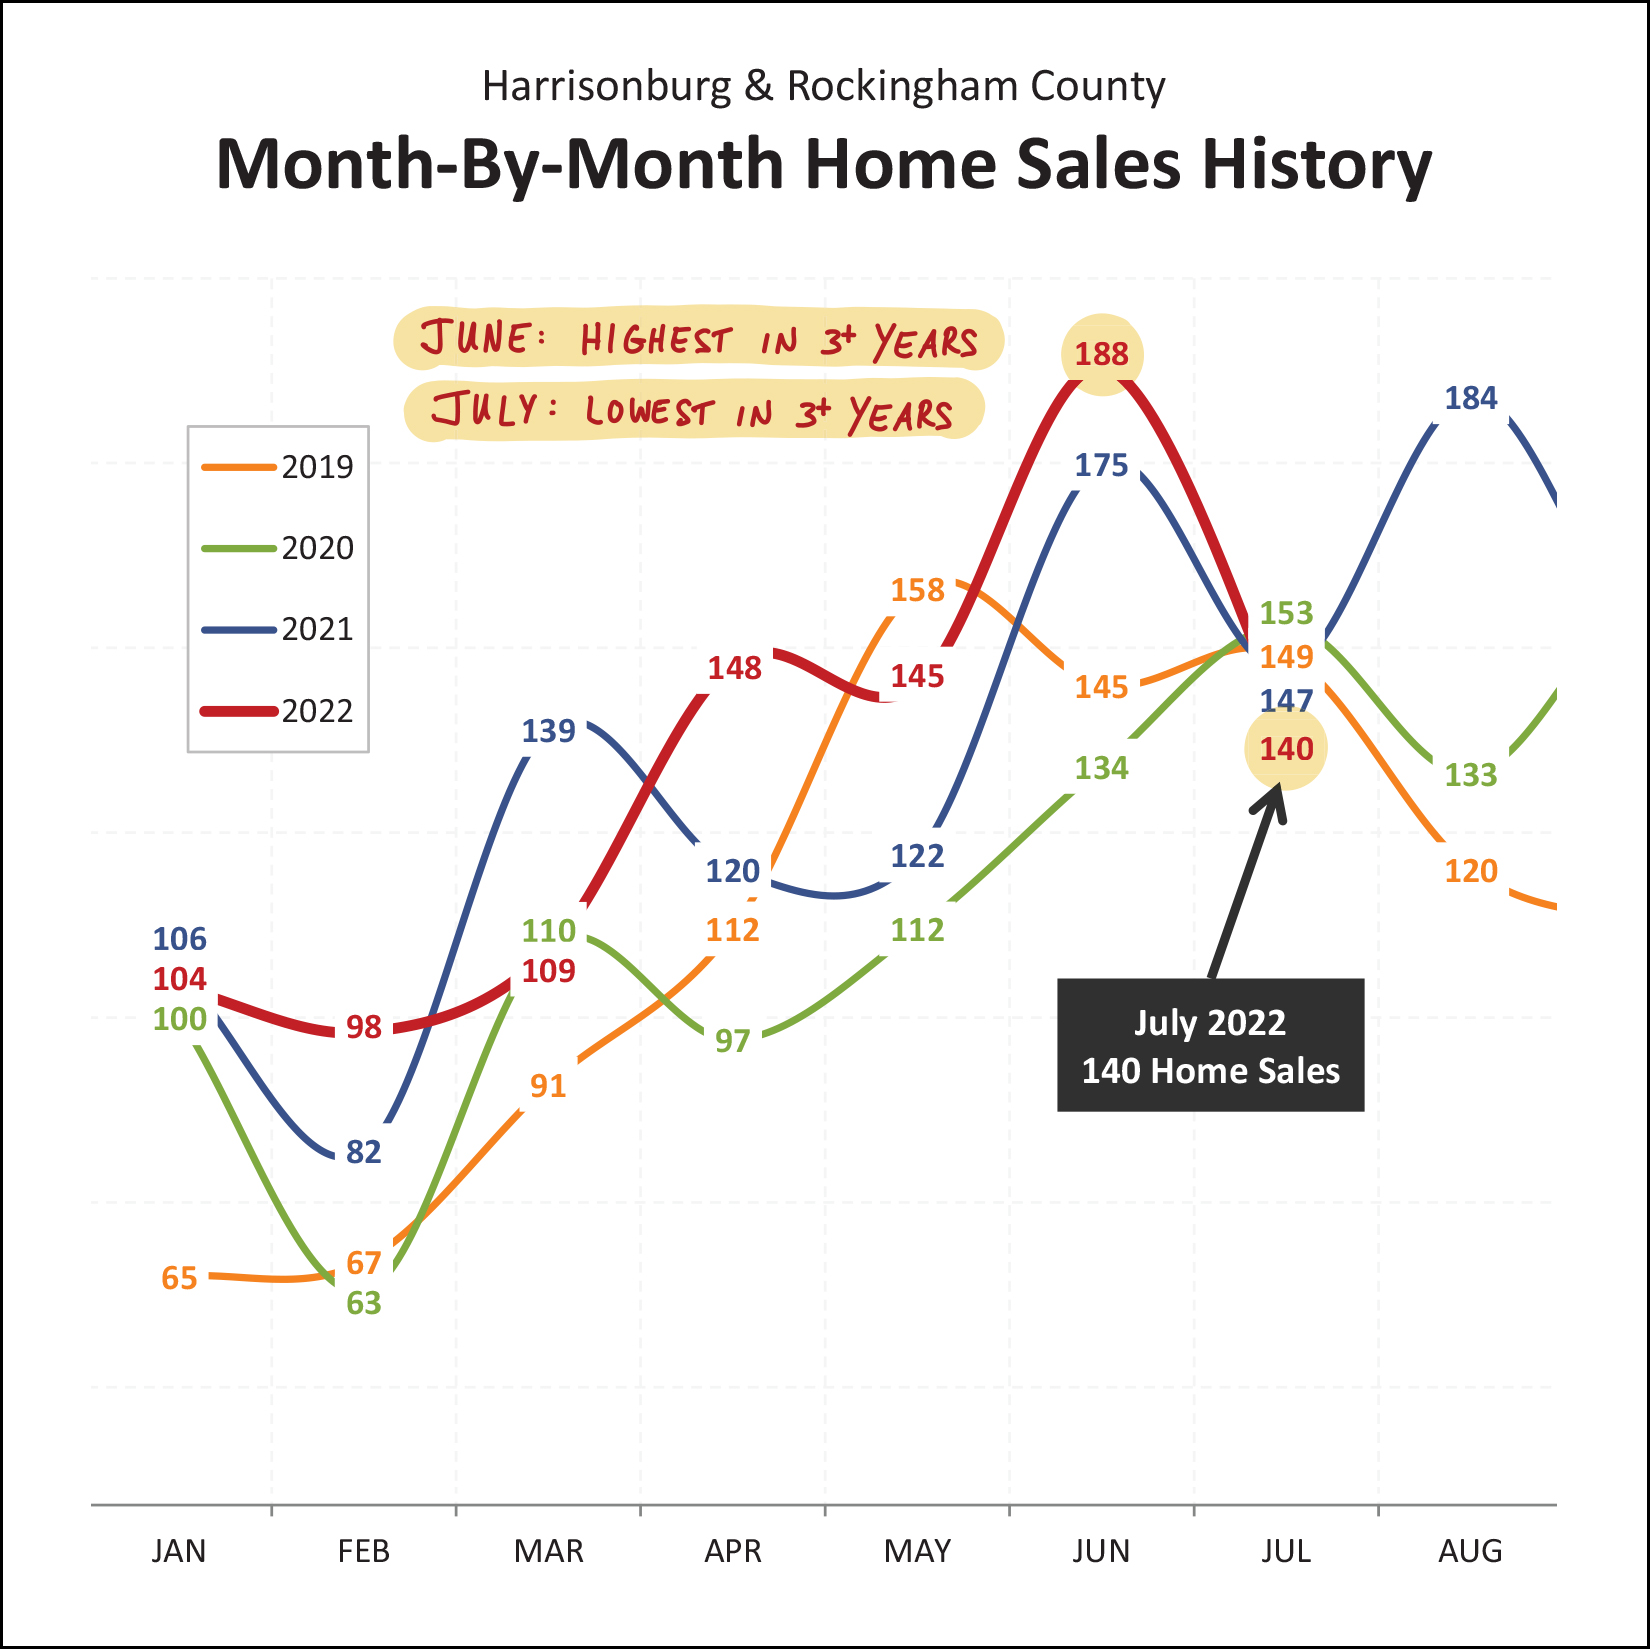 Above, you'll note that in June 2022 we had an astronomical 188 home sales... higher than any of the past three months of June. But, then, July. In July 2022 we only saw 140 home sales, which is less than any of the past three months of July. Some might point out that looking at a single month of housing data, in a small-ish housing market, can make you think something is happening, when nothing is happening. I agree that can happen. If we smash the two months together, we find that there have been 328 home sales this June and July... compared to 322 home sales last June and July. So... maybe things are "just fine" right now, and maybe things are starting to slow, slightly. 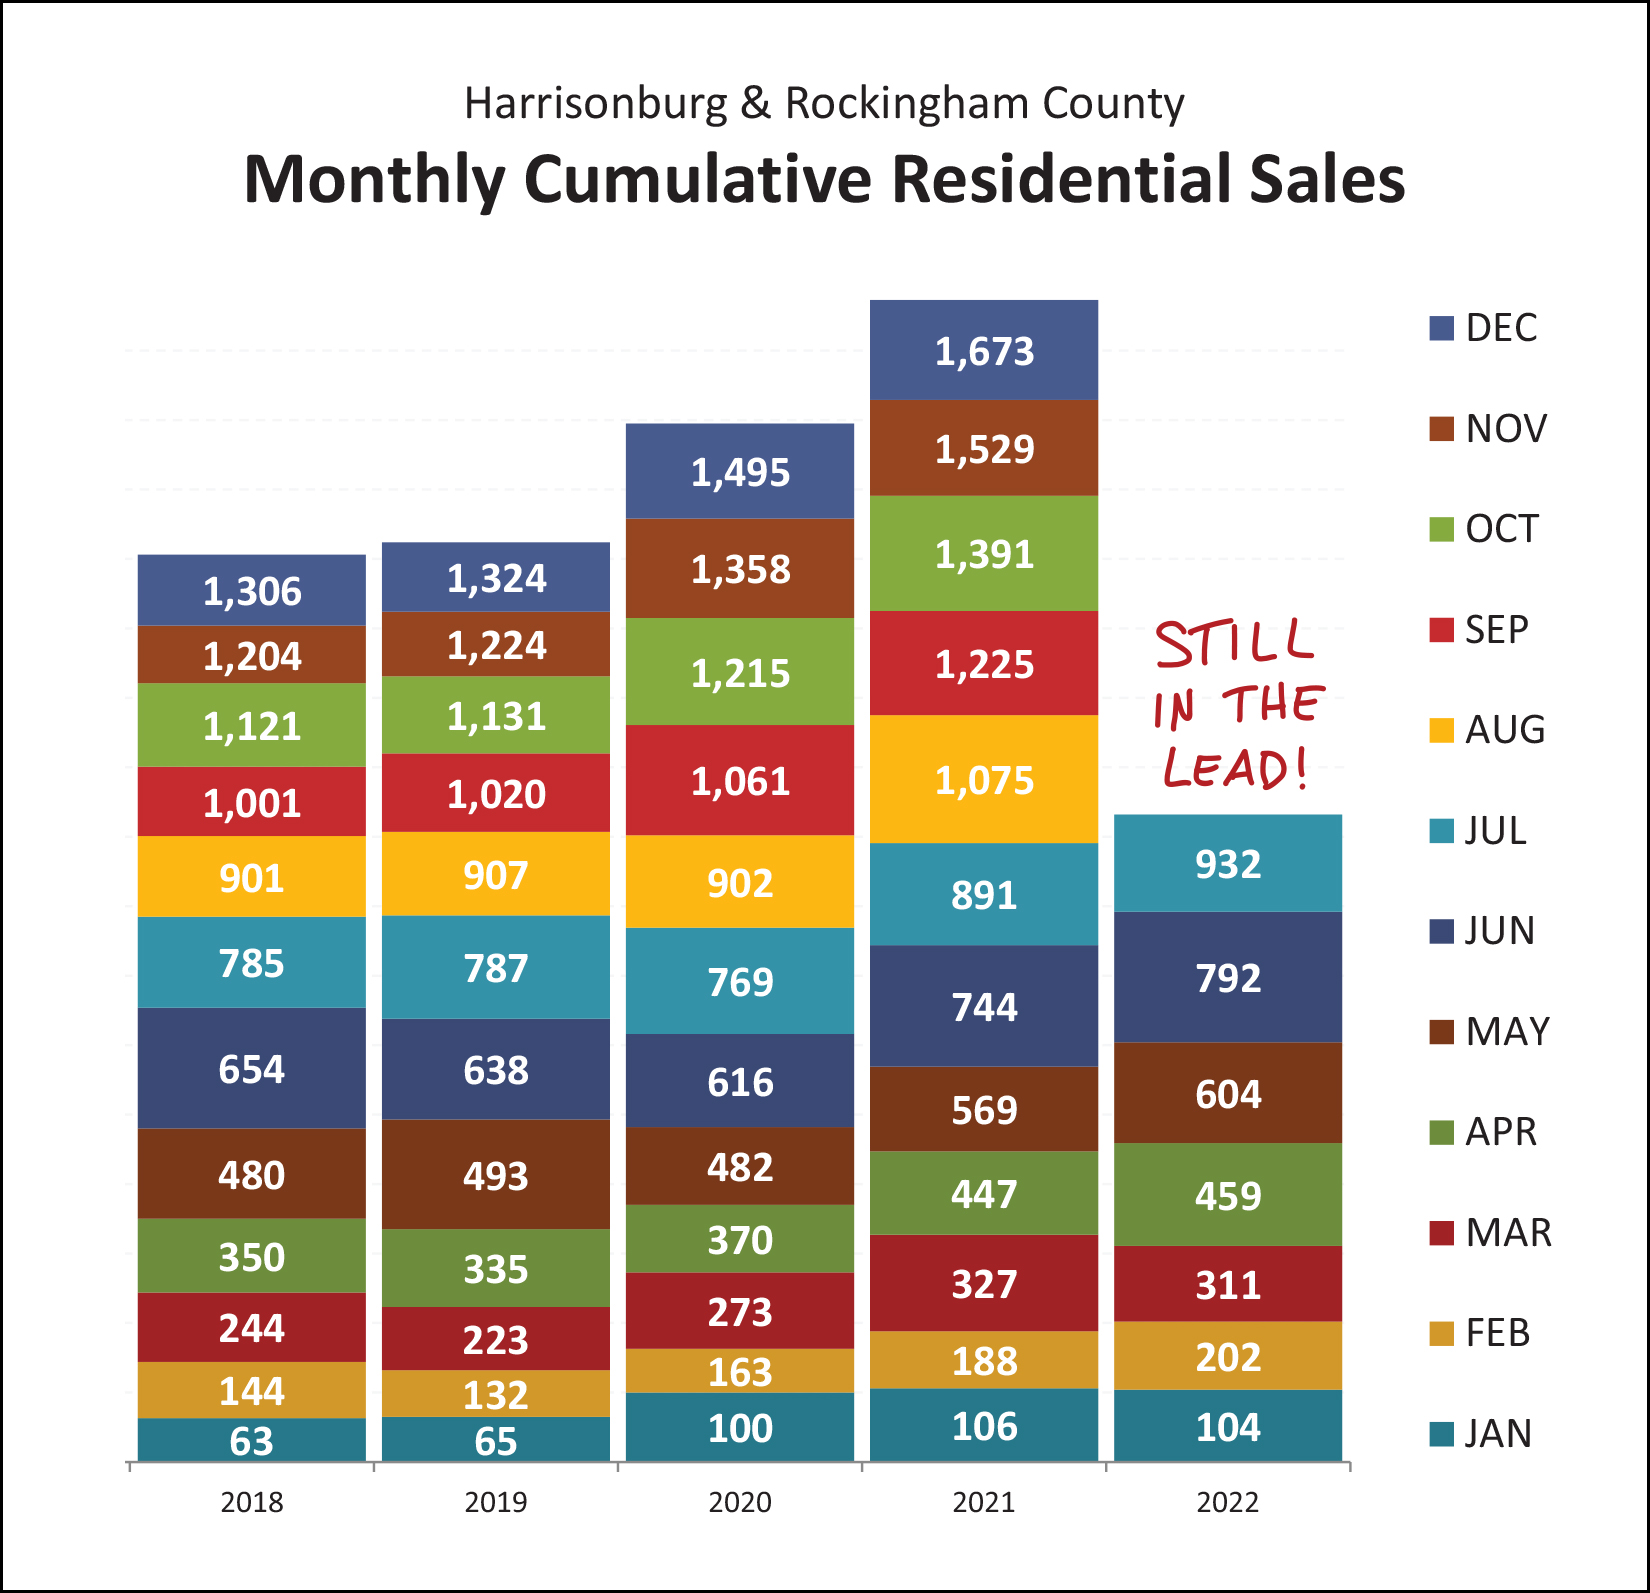 As shown above, if things are starting to slow... they're only just starting to do so, and they're doing so verrrrry slowly. The 932 home sales seen thus far in 2022 is more than we have seen in the first seven months of any of the prior four years. Perhaps when we get another month or two into the year we will see things level out a bit in 2022? 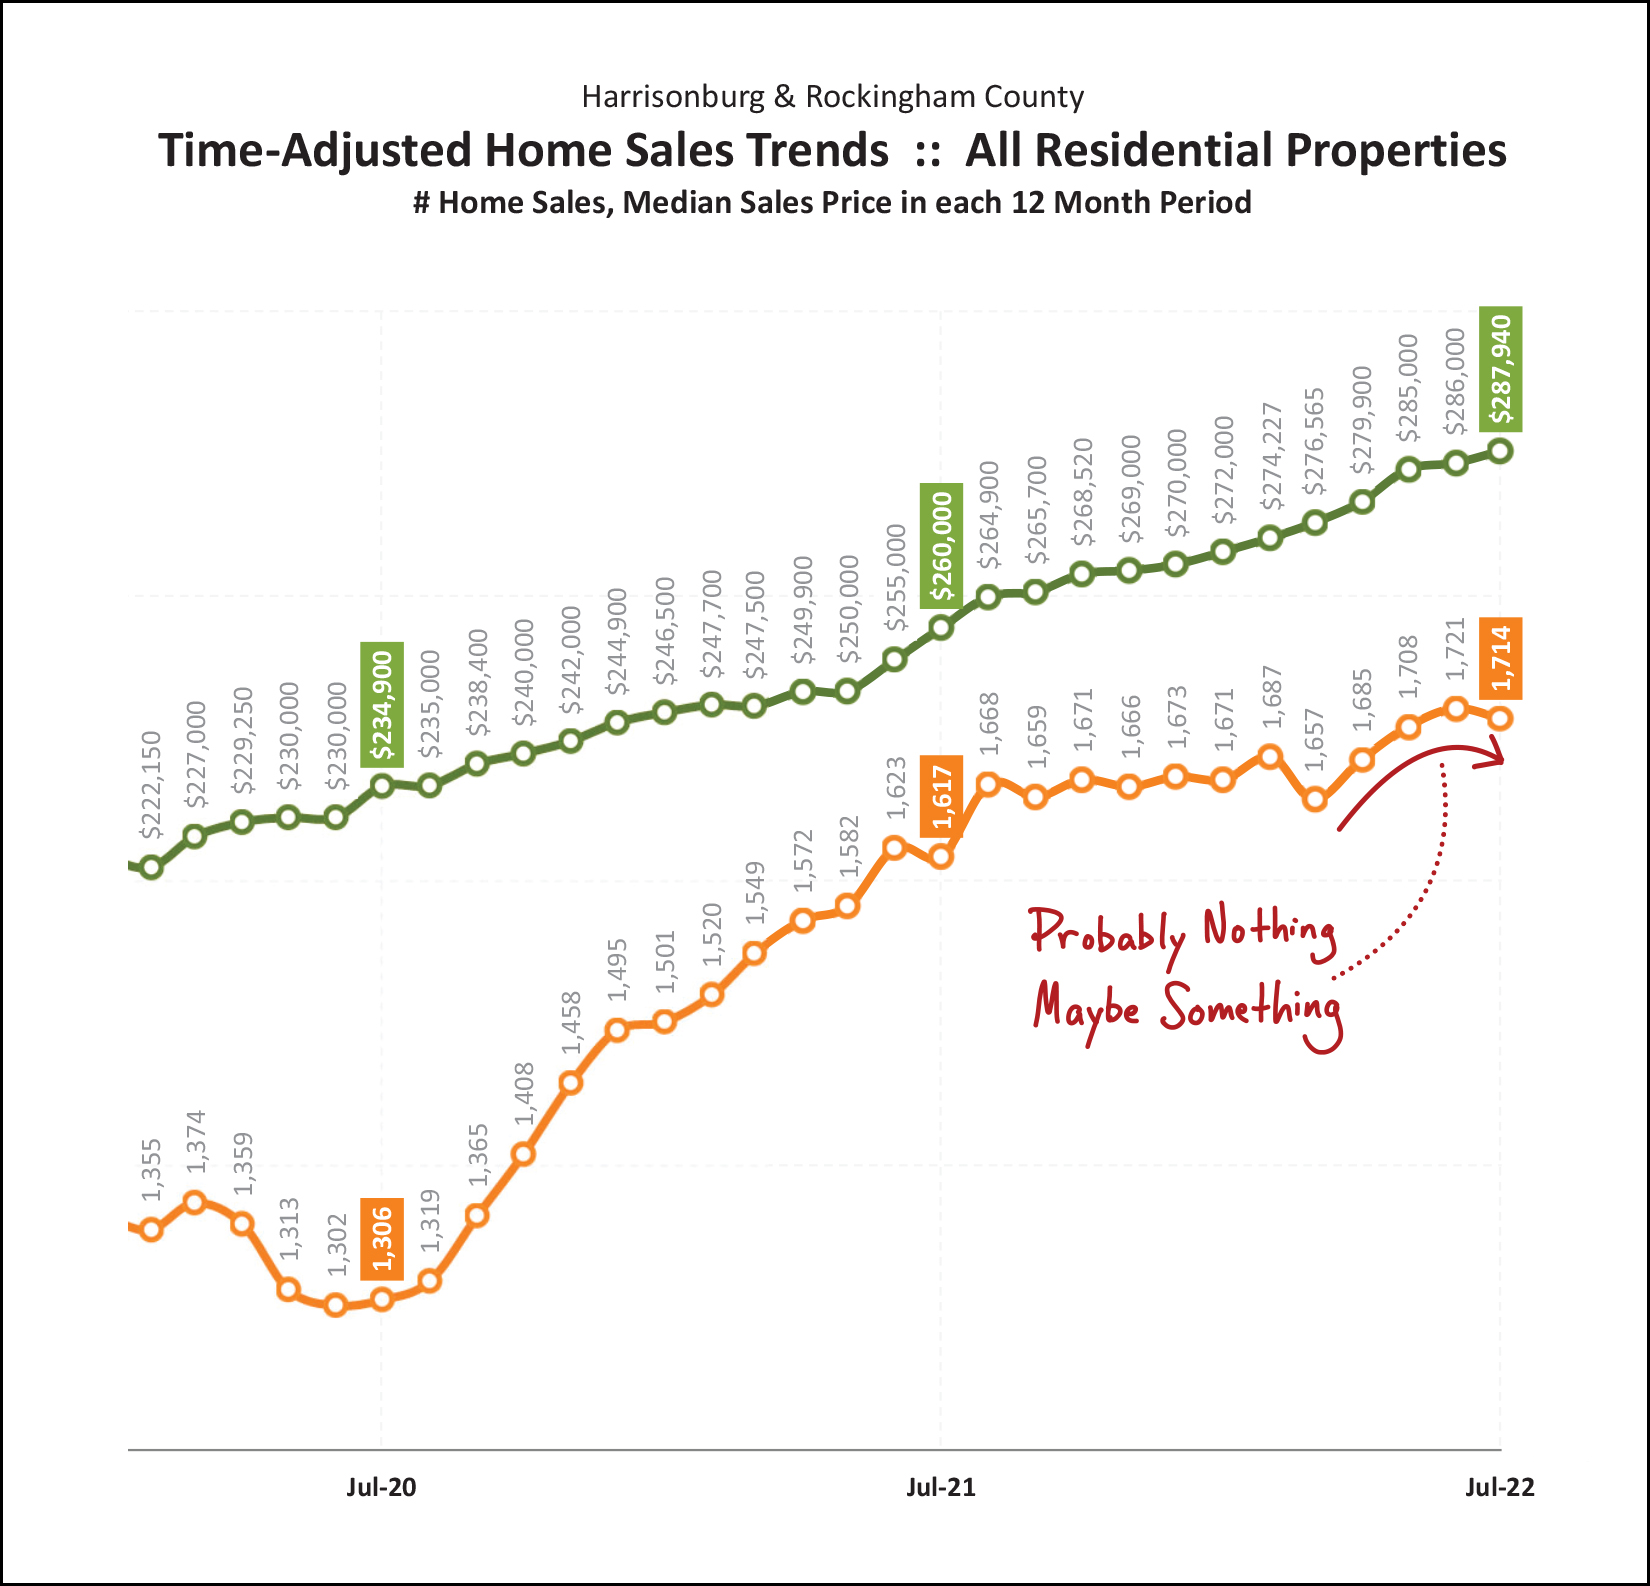 Slicing and dicing the data once more, this graph (above) measures (each month) the number of sales in a 12 month period as shown with an orange line, and the 12-month median sales price (measured each month) shown with the green line. As you can see at the end of the orange line, it's possible that the overall pace of home sales is slowing a bit... but then again, maybe not. We'll need to watch this for a few more months to know for sure. Speaking of the future, our most reliable indicator of future sales is... current contracts... 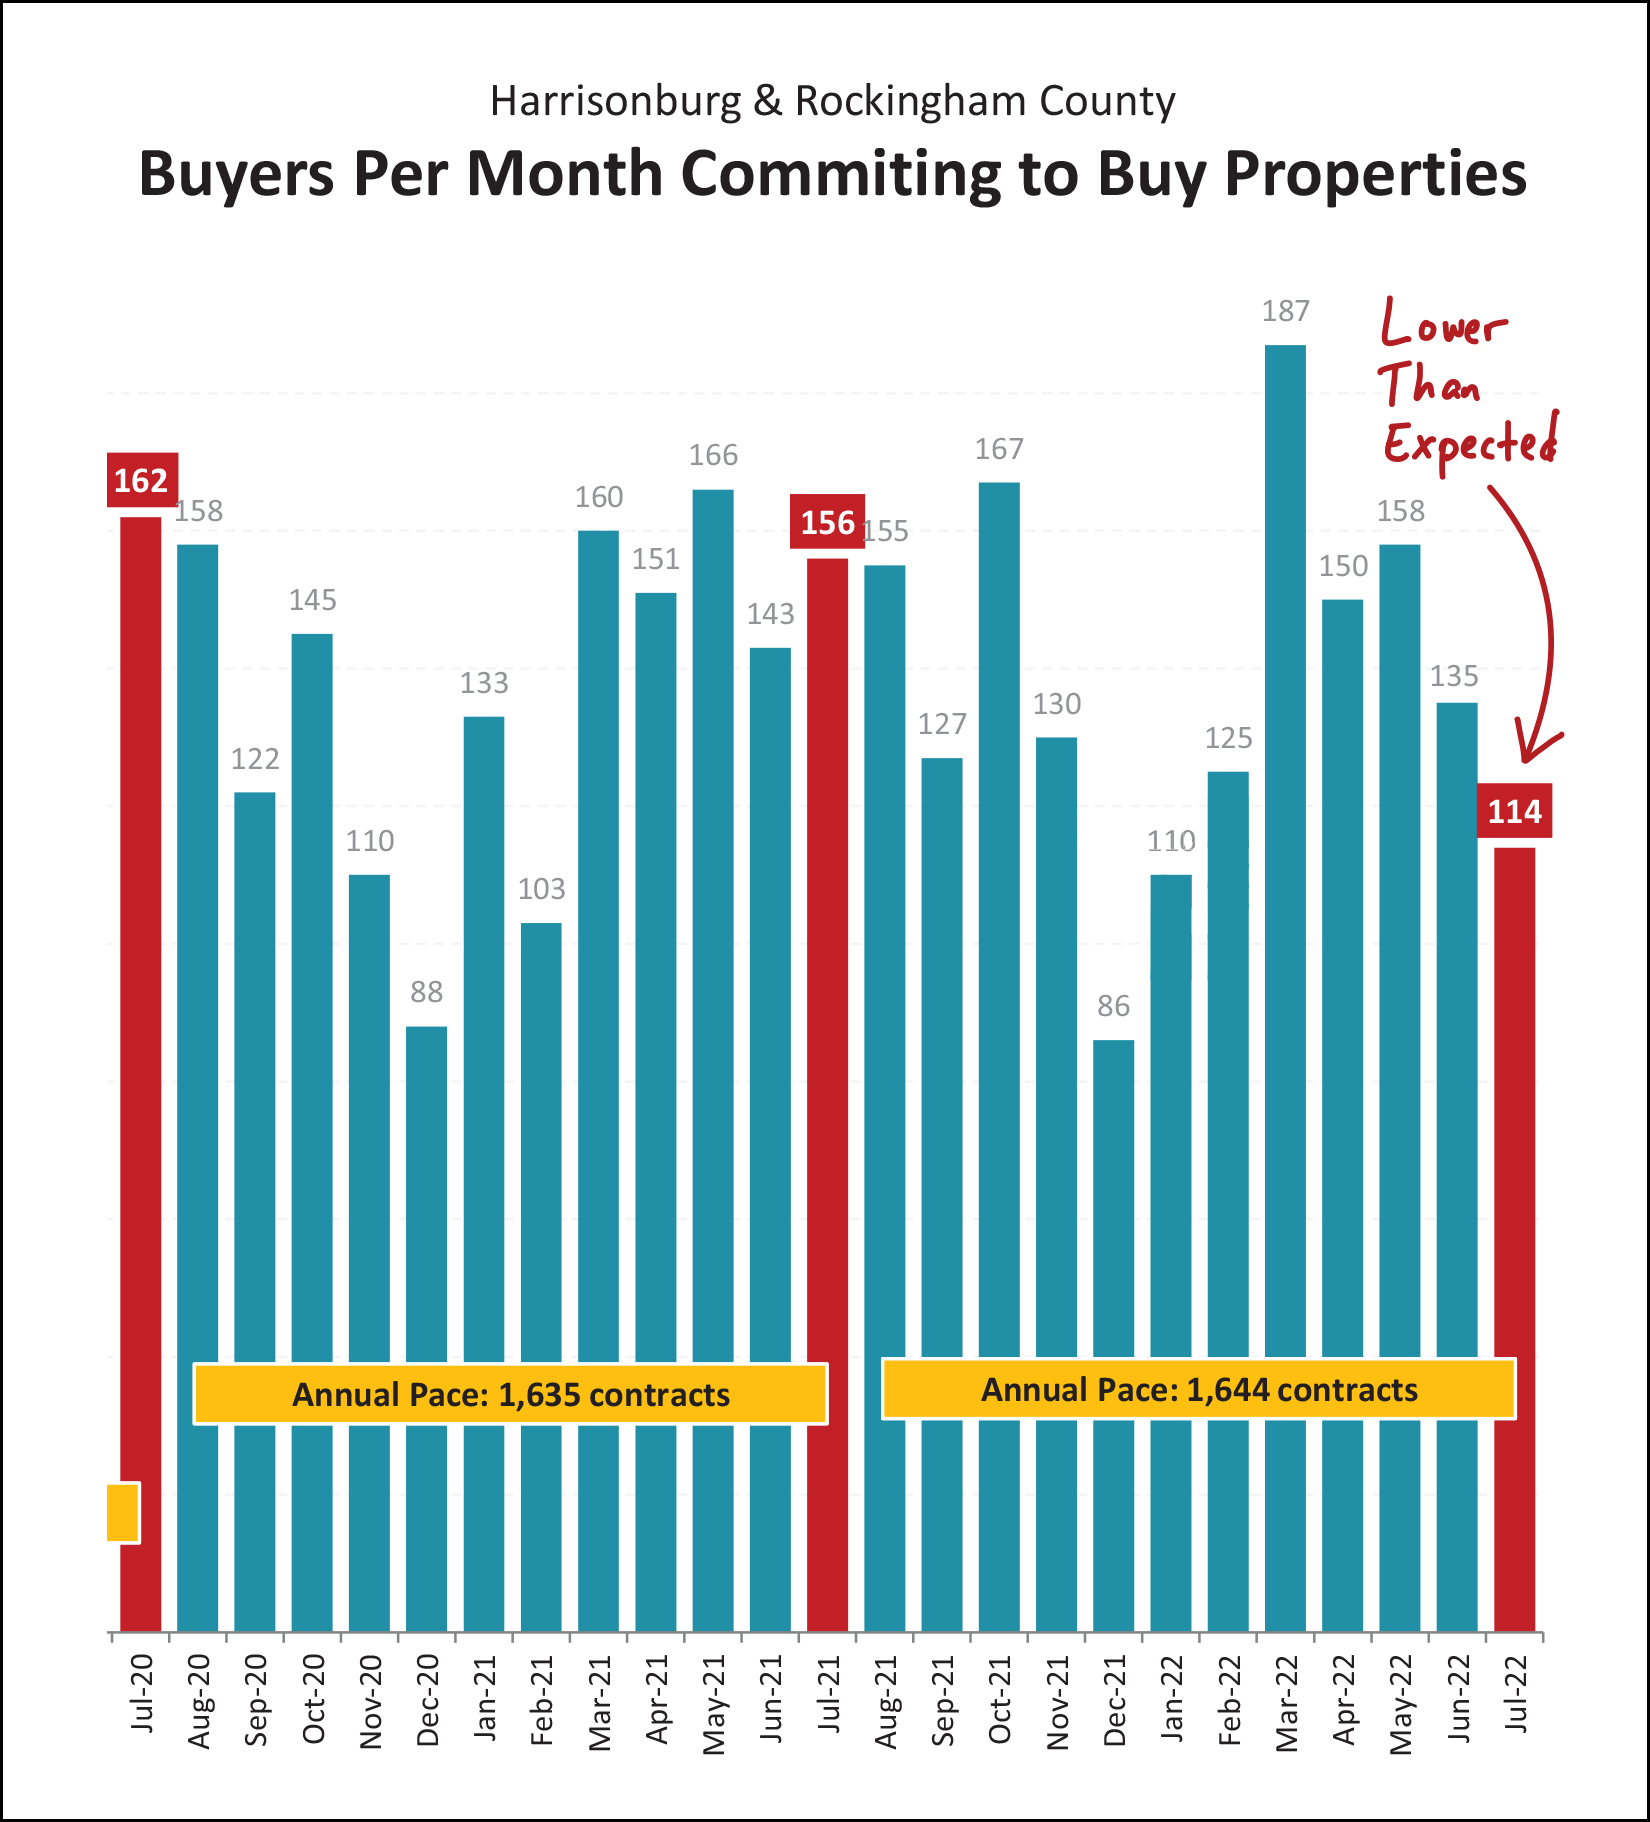 This one surprised me a bit. We usually see around 150 to 160 contracts signed in any given month of July. But... not this July. There were only 114 contracts signed in July 2022, which is much lower than usual, and likely means we will see a lower than usual month of closed sales in August and/or September. This falls to the category of "things that make you say hmmmm...." and this will definitely be a trend we will need to continue to monitor. Somewhat fewer buyers signing contracts might mean that inventory levels would rise a bit... 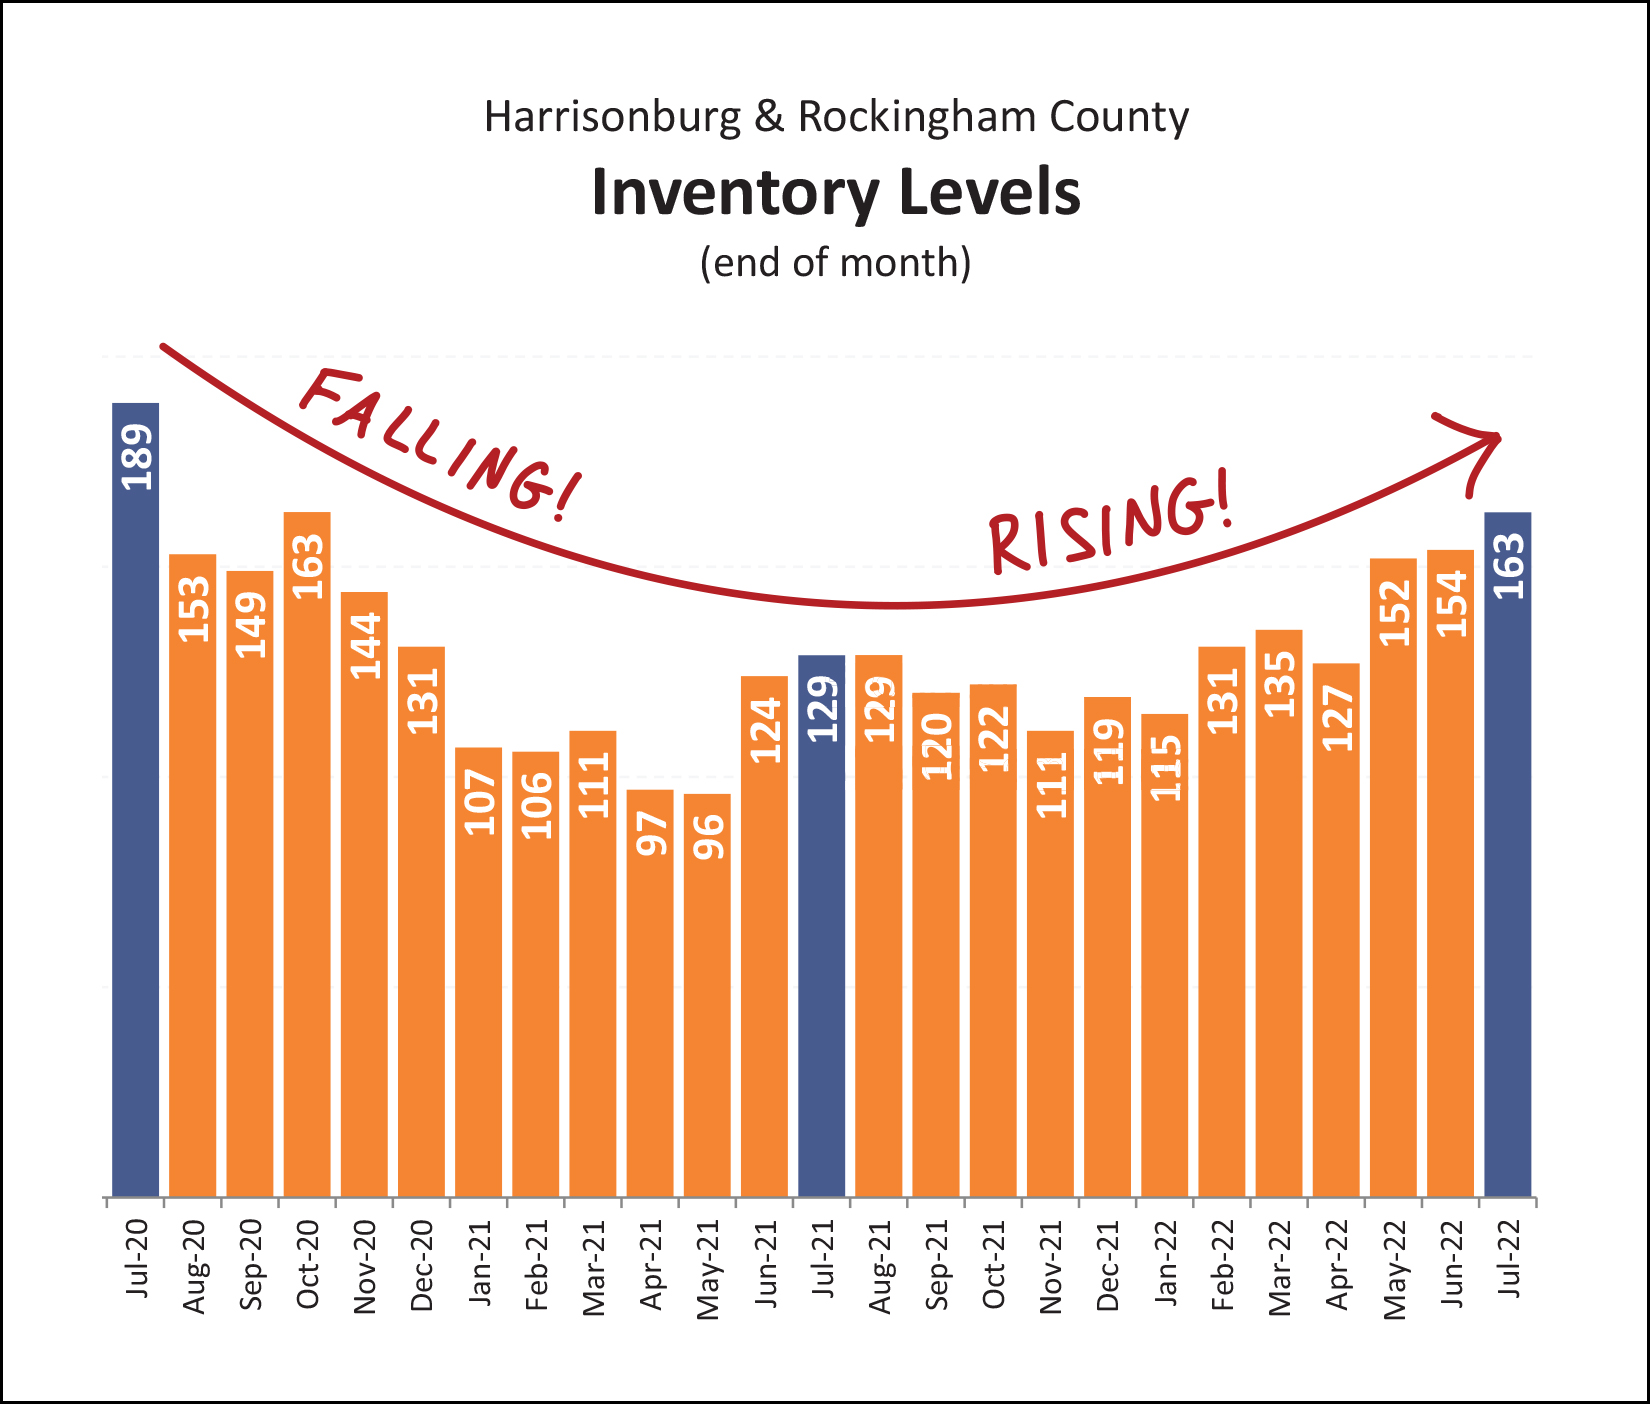 Indeed, we are starting to see inventory levels creep up a bit. There are now 163 homes for sale in Harrisonburg and Rockingham County, which is a bit more than the 129 we saw at this time a year ago. It is important to note, though that these "slightly higher" inventory levels are really still VERY, VERY low. Many or most buyers in most price ranges and locations still have very few options of homes to buy right now. So, yes, inventory levels are creeping up a bit, but don't think that's necessarily giving buyers more choices... or giving buyers more leverage... at least not at this point. So... a few fewer sales... fewer contracts... slightly higher inventory levels... that probably means that homes aren't selling as quickly, right!? Well... 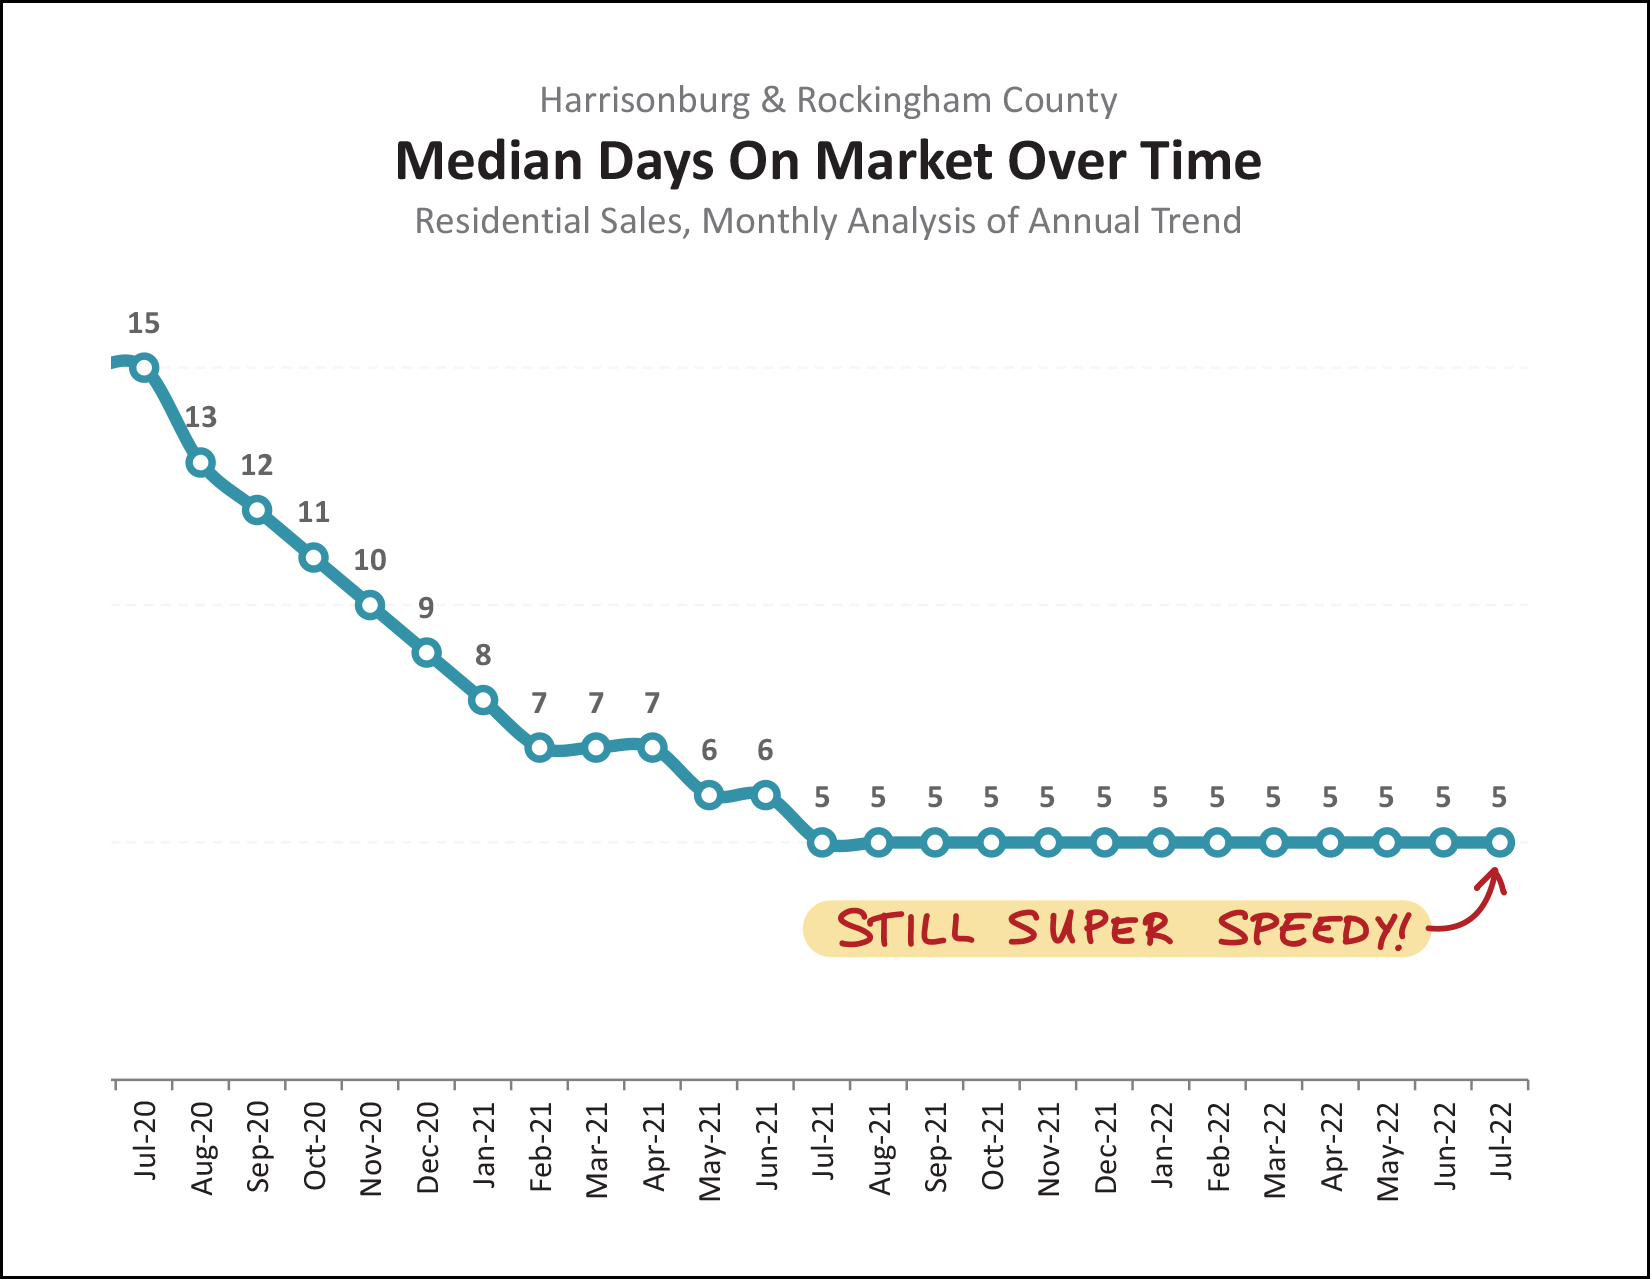 Looking at the 12 months of home sales prior to July 2021 (a year ago) the median "days on market" for those sales was only five days. That metric has remained constant for 13 months now... and today, when looking backwards by a year, the median "days on market" is still just five days. Narrowing the focus even more, to just the 114 properties that went under contract in July 2022, we might expect to see a higher "days on market" -- and we do -- but only barely. The median days on market during July 2022 was... six days. So, homes are still going under contract very, very quickly! Finally, maybe this (below) is a contributing factor to the slight slow down over the past 30 to 45 days? 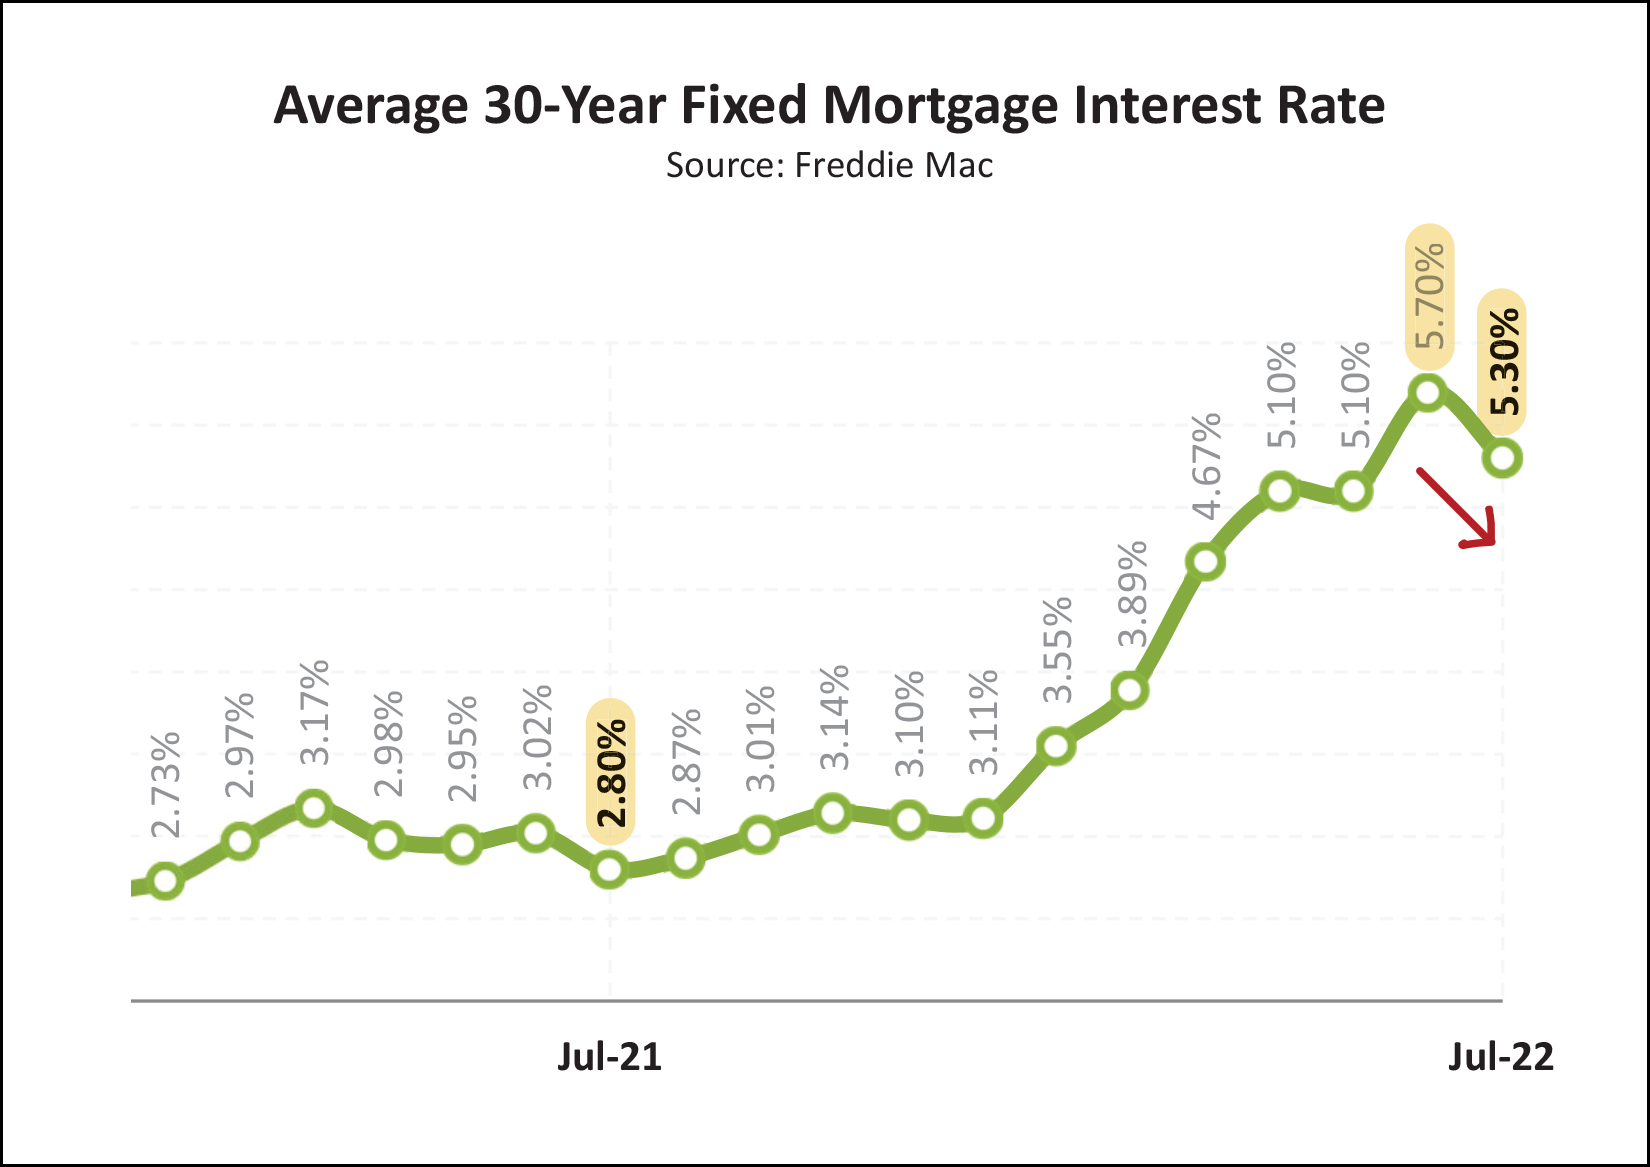 A year ago, the mortgage interest rate was 2.8%. Six months ago it was 3.55%. During June and July it was as high as 5.81%, though it has started to decline now. It is quite possible that these higher mortgage rates have caused some buyers to not be able to buy any longer... or that it has at least partially dampened their enthusiasm. So, there you have it, friends. The housing market in Harrisonburg and Rockingham County is still showing great signs of strength with more sales than ever, at higher prices than ever. But... we might be seeing a slight slow down in home sales (from record high levels) and we might be seeing a slight increase in inventory levels (from record low levels). We'll have to give it a few more months to see how things continue to develop in the local market to know for sure. Until then... If selling a home is on your mind, let's talk sooner rather than later. Before you know it, we'll be halfway through fall and headed into winter. If you are planning to buy a home soon, let's start watching for new listings of interest and going to see them quickly when they hit the market. If I can be of any help with the above (selling, buying) please call/text me at 540-578-0102 or email me here so we can talk about working together to navigate your way through the ever changing Harrisonburg real estate market. | |
Harrisonburg Housing Market Still Speeding Right Along |
|
 Happy Tuesday morning, friends! The starting and ending point of summer likely varies for many of us, but it seems like we're somewhere around the middle of summer. Gasp! As such, I hope the first half (or so) of the summer has treated you well, and that you still have some fun, adventures and relaxation in the works for the second half of summer. Before we get to the real estate news of the day, I'll mention that Red Wing was *fantastic* this year... 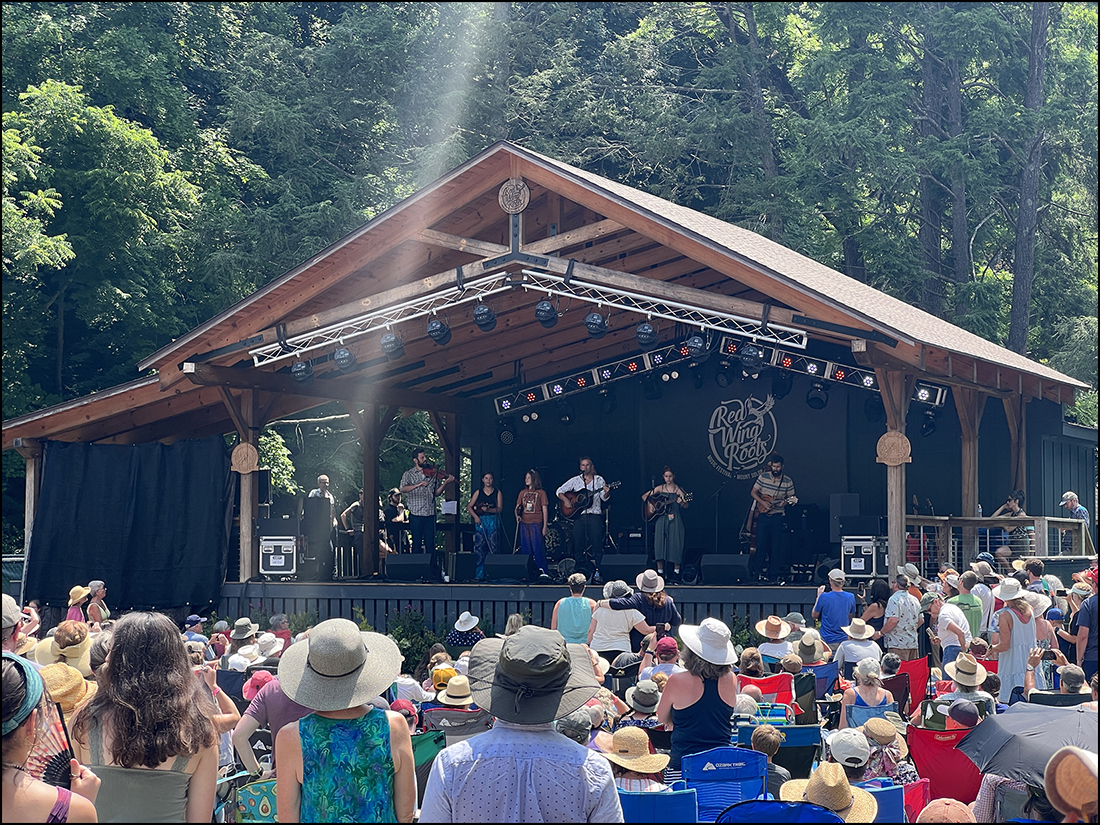 I enjoyed seeing many of you out at Natural Chimneys over that long (but not quite long enough) weekend and I hope the rest of you will consider checking it out next year! Sign up for Red Wing Updates here. Next, I should mention that the beautiful home on the cover of my market report is on the market, for sale, as of this morning! Find out more about 390 Callaway Circle here. Finally, if you're looking for a good cup of coffee (or a caramel latte) one of my favorite coffee spots in the 'burg is Black Sheep Coffee, tucked away over on West Bruce Street. Interested in checking out Black Sheep Coffee? I'm giving away a $50 gift certificate, which you can enter to win here! And now, let's spend a few minutes together exploring the latest news and happenings in our local housing market... 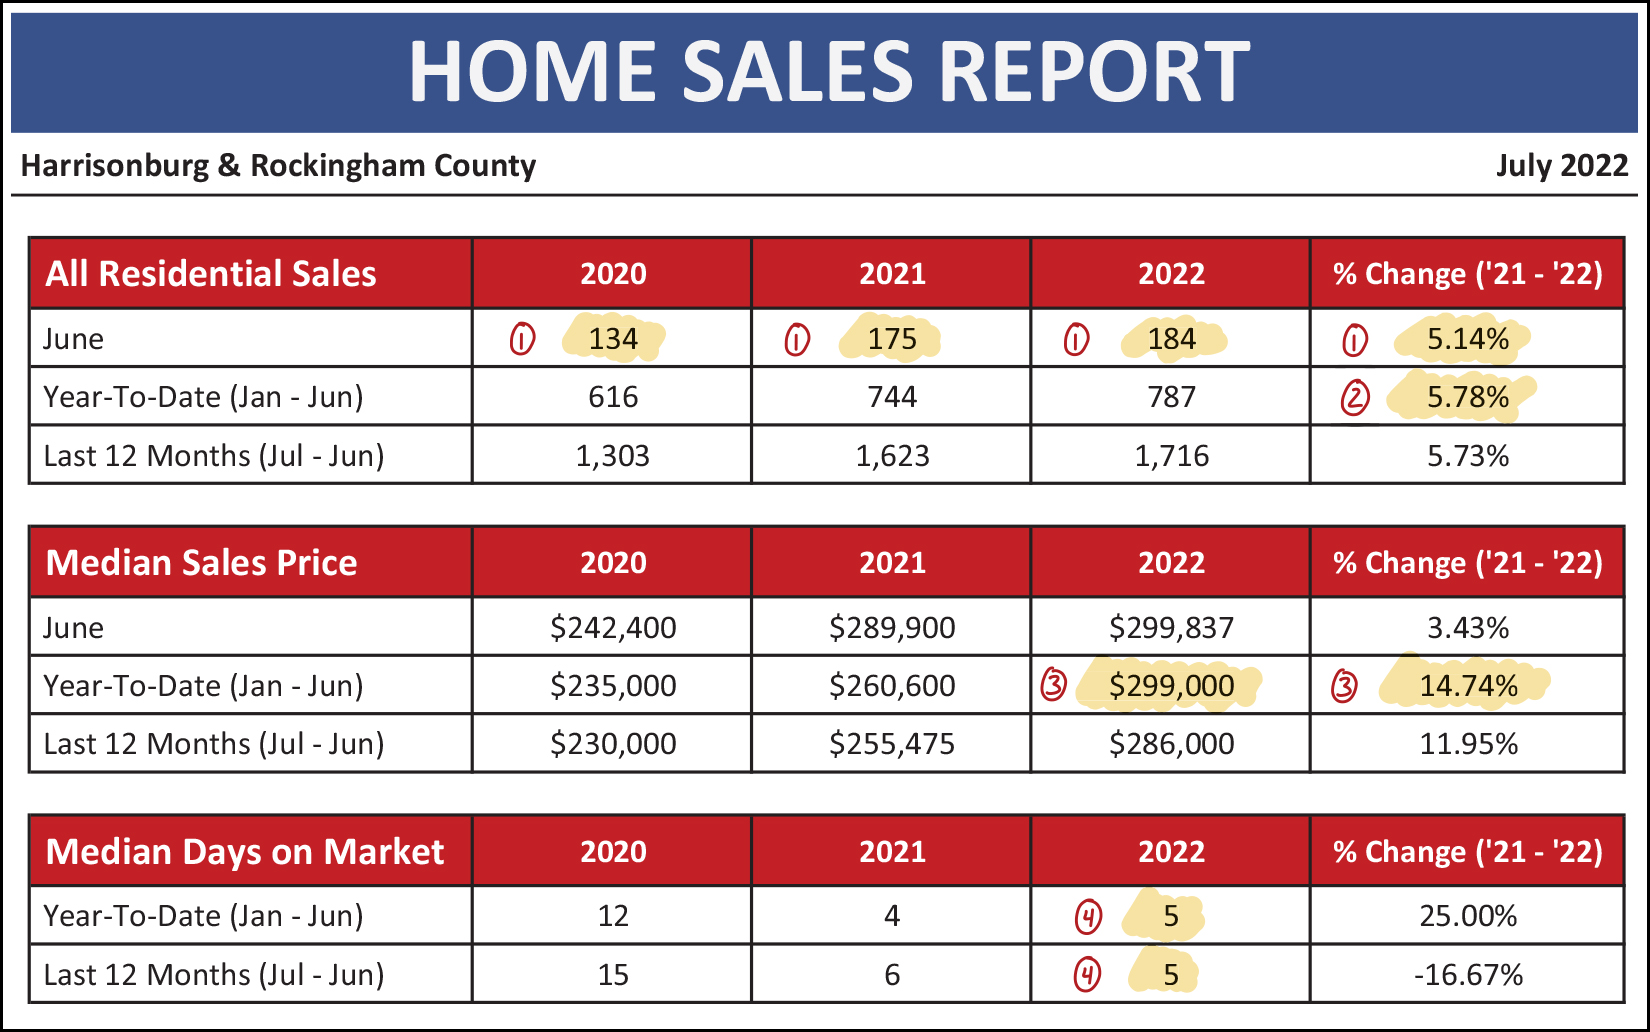 Right off the bat, we get to some rather fascinating updates just checking out the very basic metrics of our local market. As referenced in the tiny red numbers above... [1] A normal June might have around 135 or 145 home sales. Last June (2021) we saw an impressive 175 home sales. I did not think we would clear that high bar this June. But... we did. There were an astonishing 184 home sales in June 2022! [2] The median sales price in the first half of this year was $299,000! That is almost 15% higher than it was in the first half of last year, when it was $260,600. Even with *much* higher mortgage interest rates, homes keep selling at higher and higher prices! [3] Homes are still selling fassssssssst! The median days on the market in Harrisonburg and Rockingham County during the first six months of 2022 was... only five days, just as fast as when we look at the entire past 12 months of data. So... lots of sales, prices that are higher than ever, and homes are going under contract faster than ever. Hmmmm... things don't seem to really be slowing down thus far in 2022!? This fast moving market has been one contributor to the steady increases in home prices seen over the past two years. Take a look at these increases... 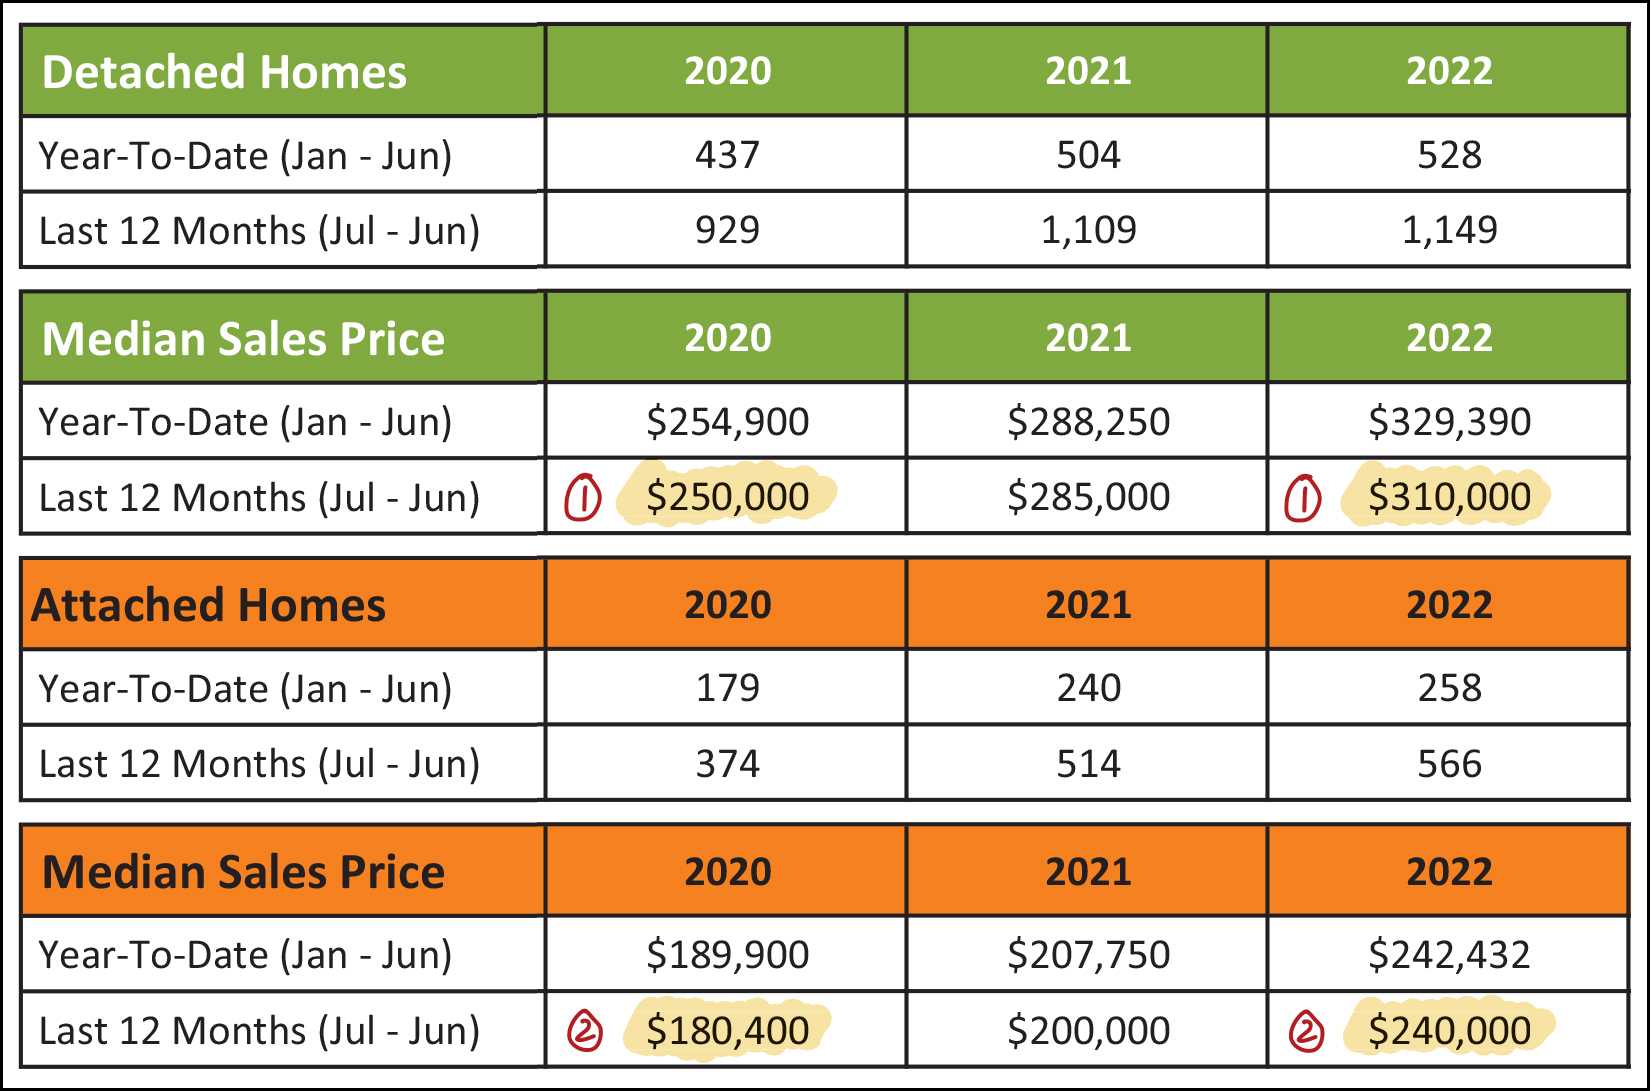 [1] The median sales price of detached homes was only $250,000 just two years ago... but over the past two years that median sales price has risen to $310,000! [2] The median sales price of attached homes (townhomes, duplexes, condos) was only $180,400 just two years ago... but over the past two years that median sales prices has risen to $240,000! Homeowners have been delighted with these increases. Sellers have also been big fans. Buyers... not so much. It can be tough for buyers to get excited about paying a *much* higher price alongside their *much* higher mortgage interest rate... but buyers still seem to be moving forward full steam with their home purchases thus far in 2022. Those home buyers are moving along so steadily that we're breaking (tying) some records... 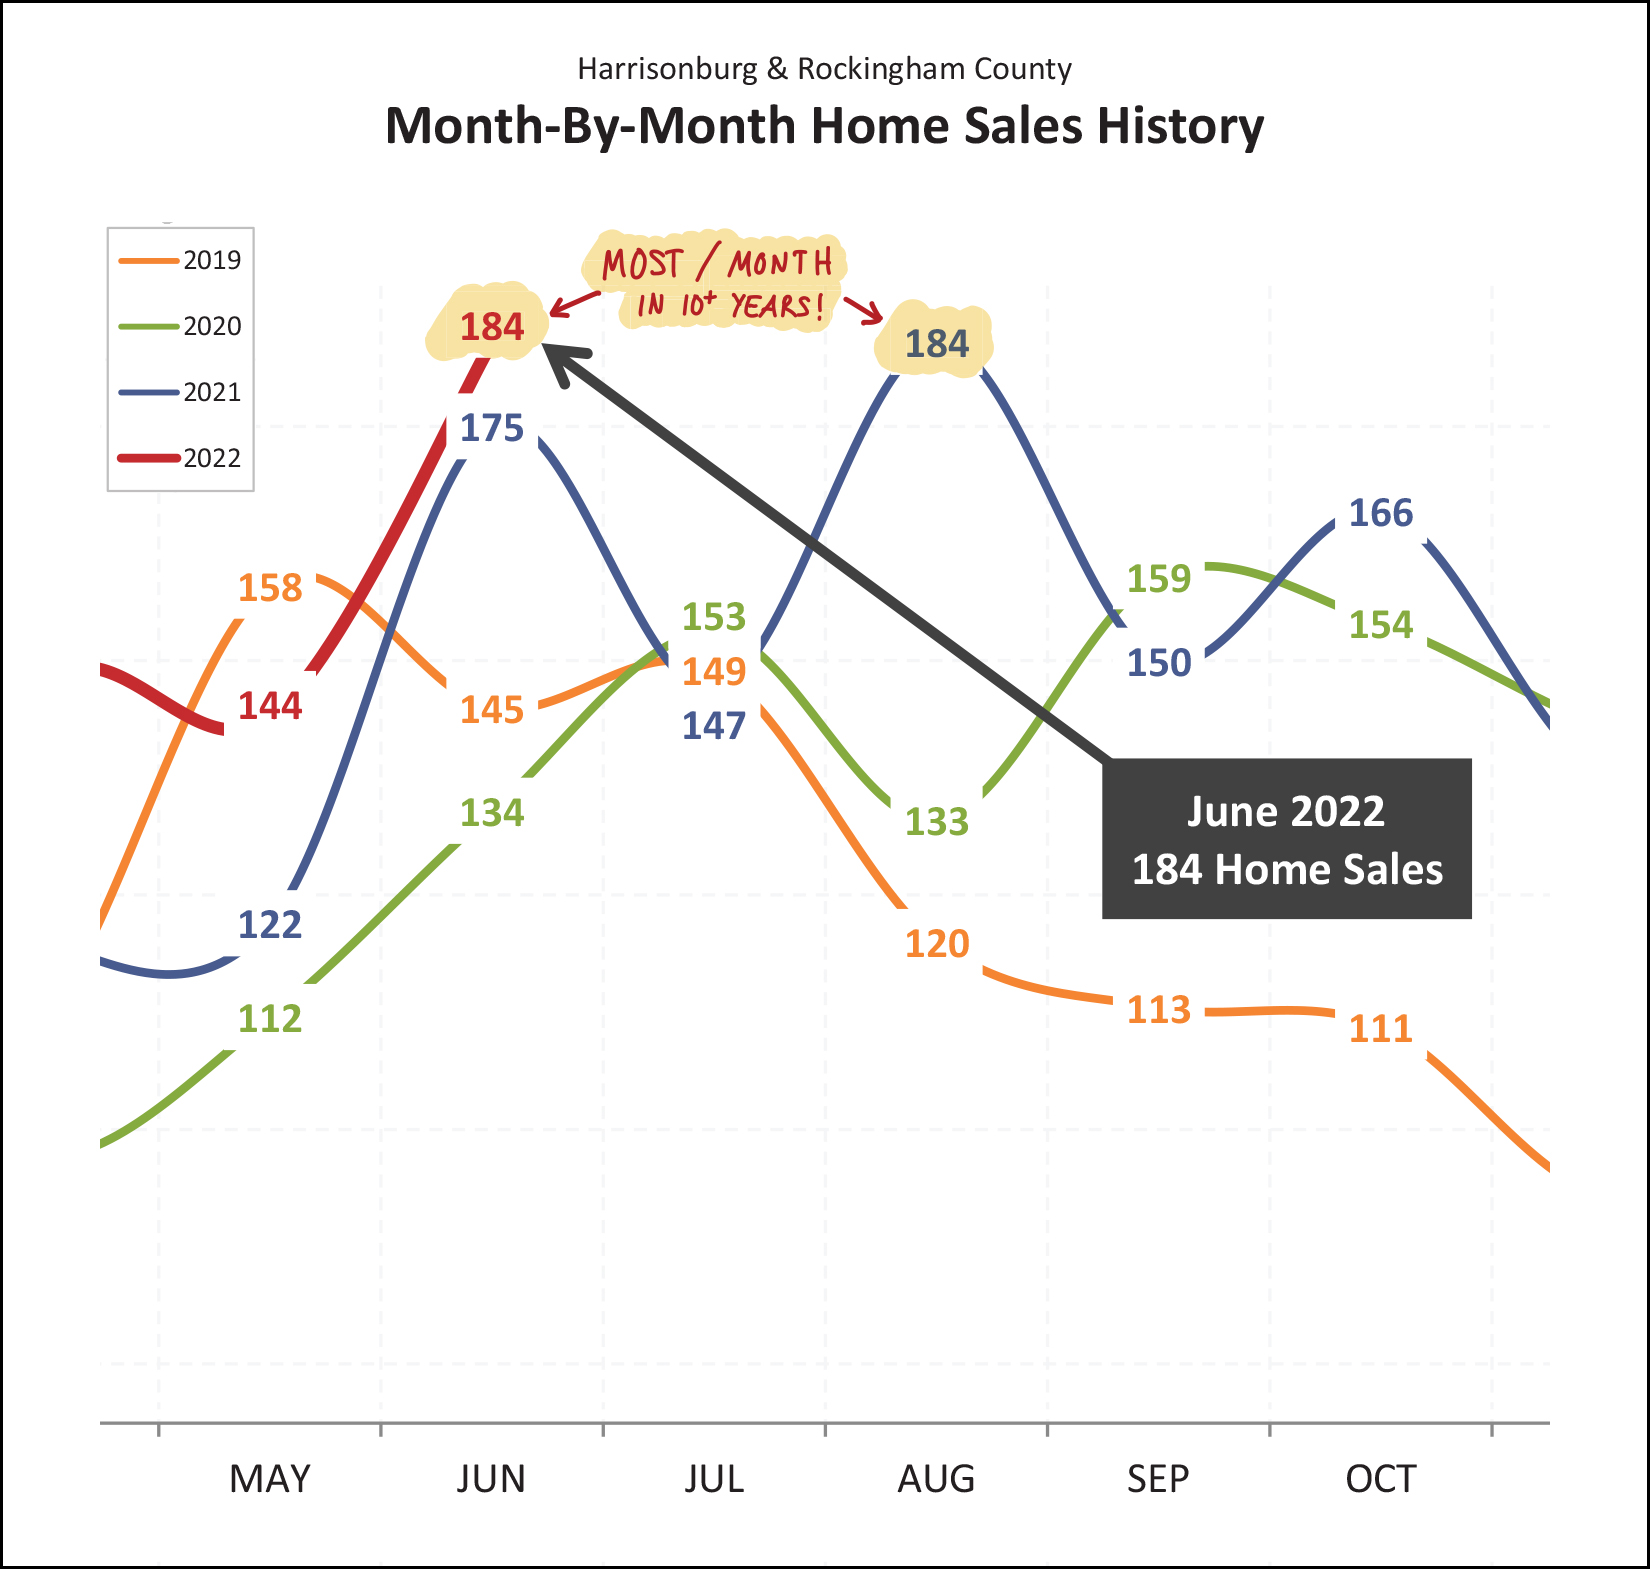 Over the past ten years, the most home sales we have seen in a month has been 184 home sales... which took place last year, in August. Well, what do you know!? This June (last month) we saw... 184 home sales! Looking ahead, what should we expect for July? The past three months of July have been tightly clustered around that 145 - 155 range, so I'm going to play it safe and guess we'll see right around that many home sales in July 2022. Perhaps 150 on the nose!? As I have mentioned to many of you, I fully expected (and still expect) that we'll see a bit of a slow down in home sales activity in 2022 due to higher mortgage interest rates... but... the data just isn't agreeing with me thus far... 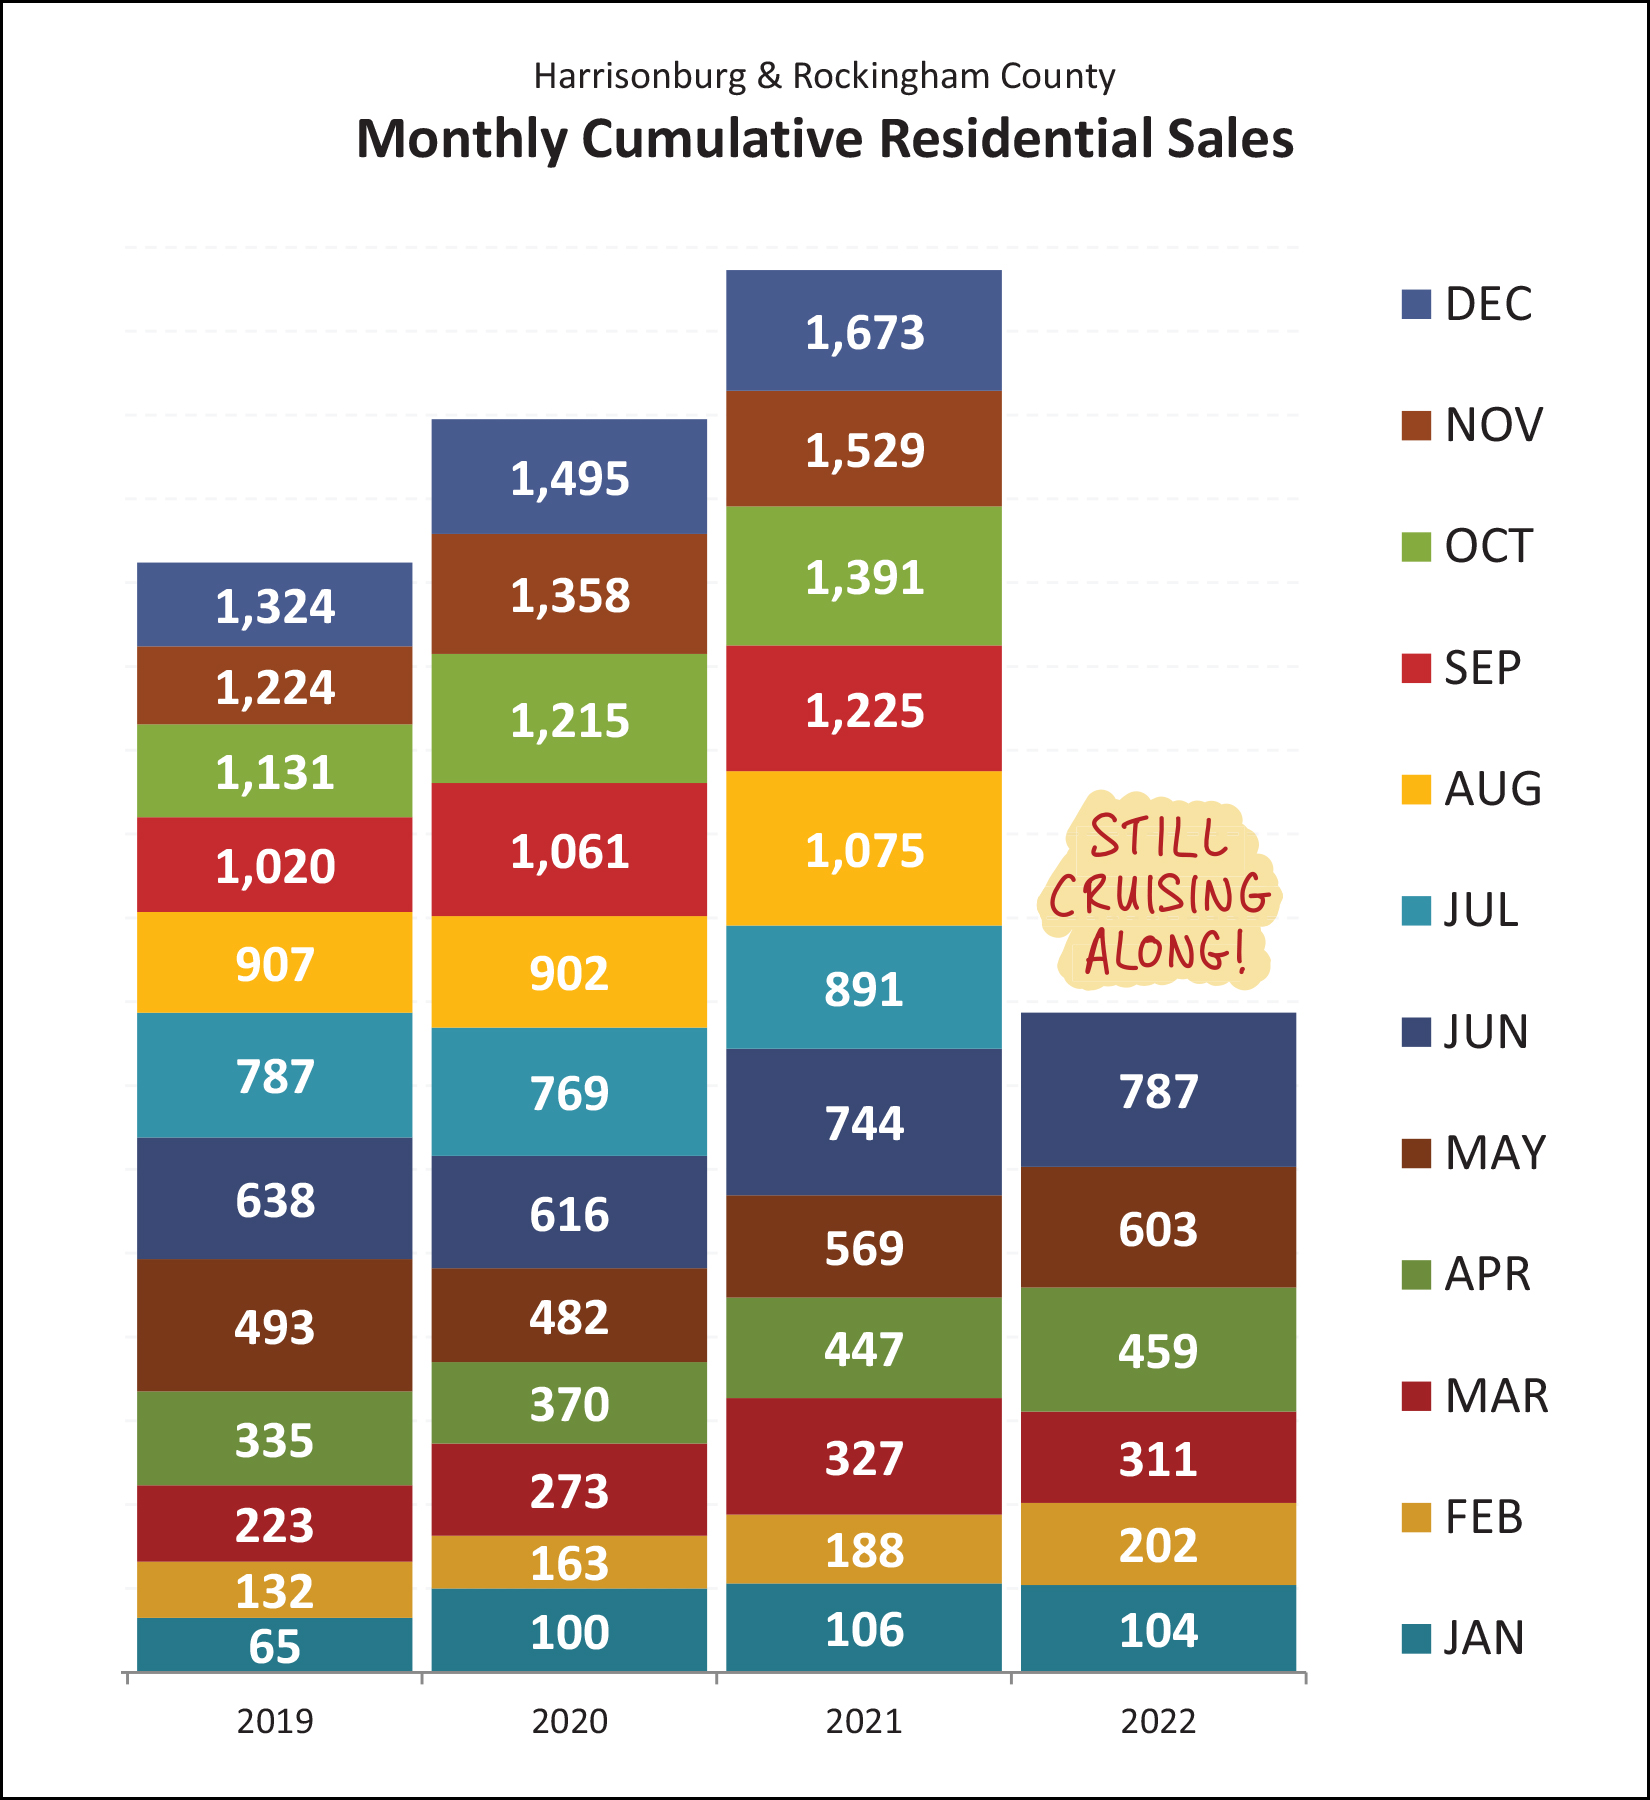 As shown above, the 787 home sales we've seen in the first half of 2022 exceed the number of home sales in the first half of each of the past three years! If I didn't know better, I'd think mortgage interest rates must be *lower* than ever in 2022 to spur on so much buyer activity!? But, no, not so much. More on that later. Looking at these big picture trends in a slightly different way, it's astonishing to see three years in a row of double digit growth in the median sales price in our market... 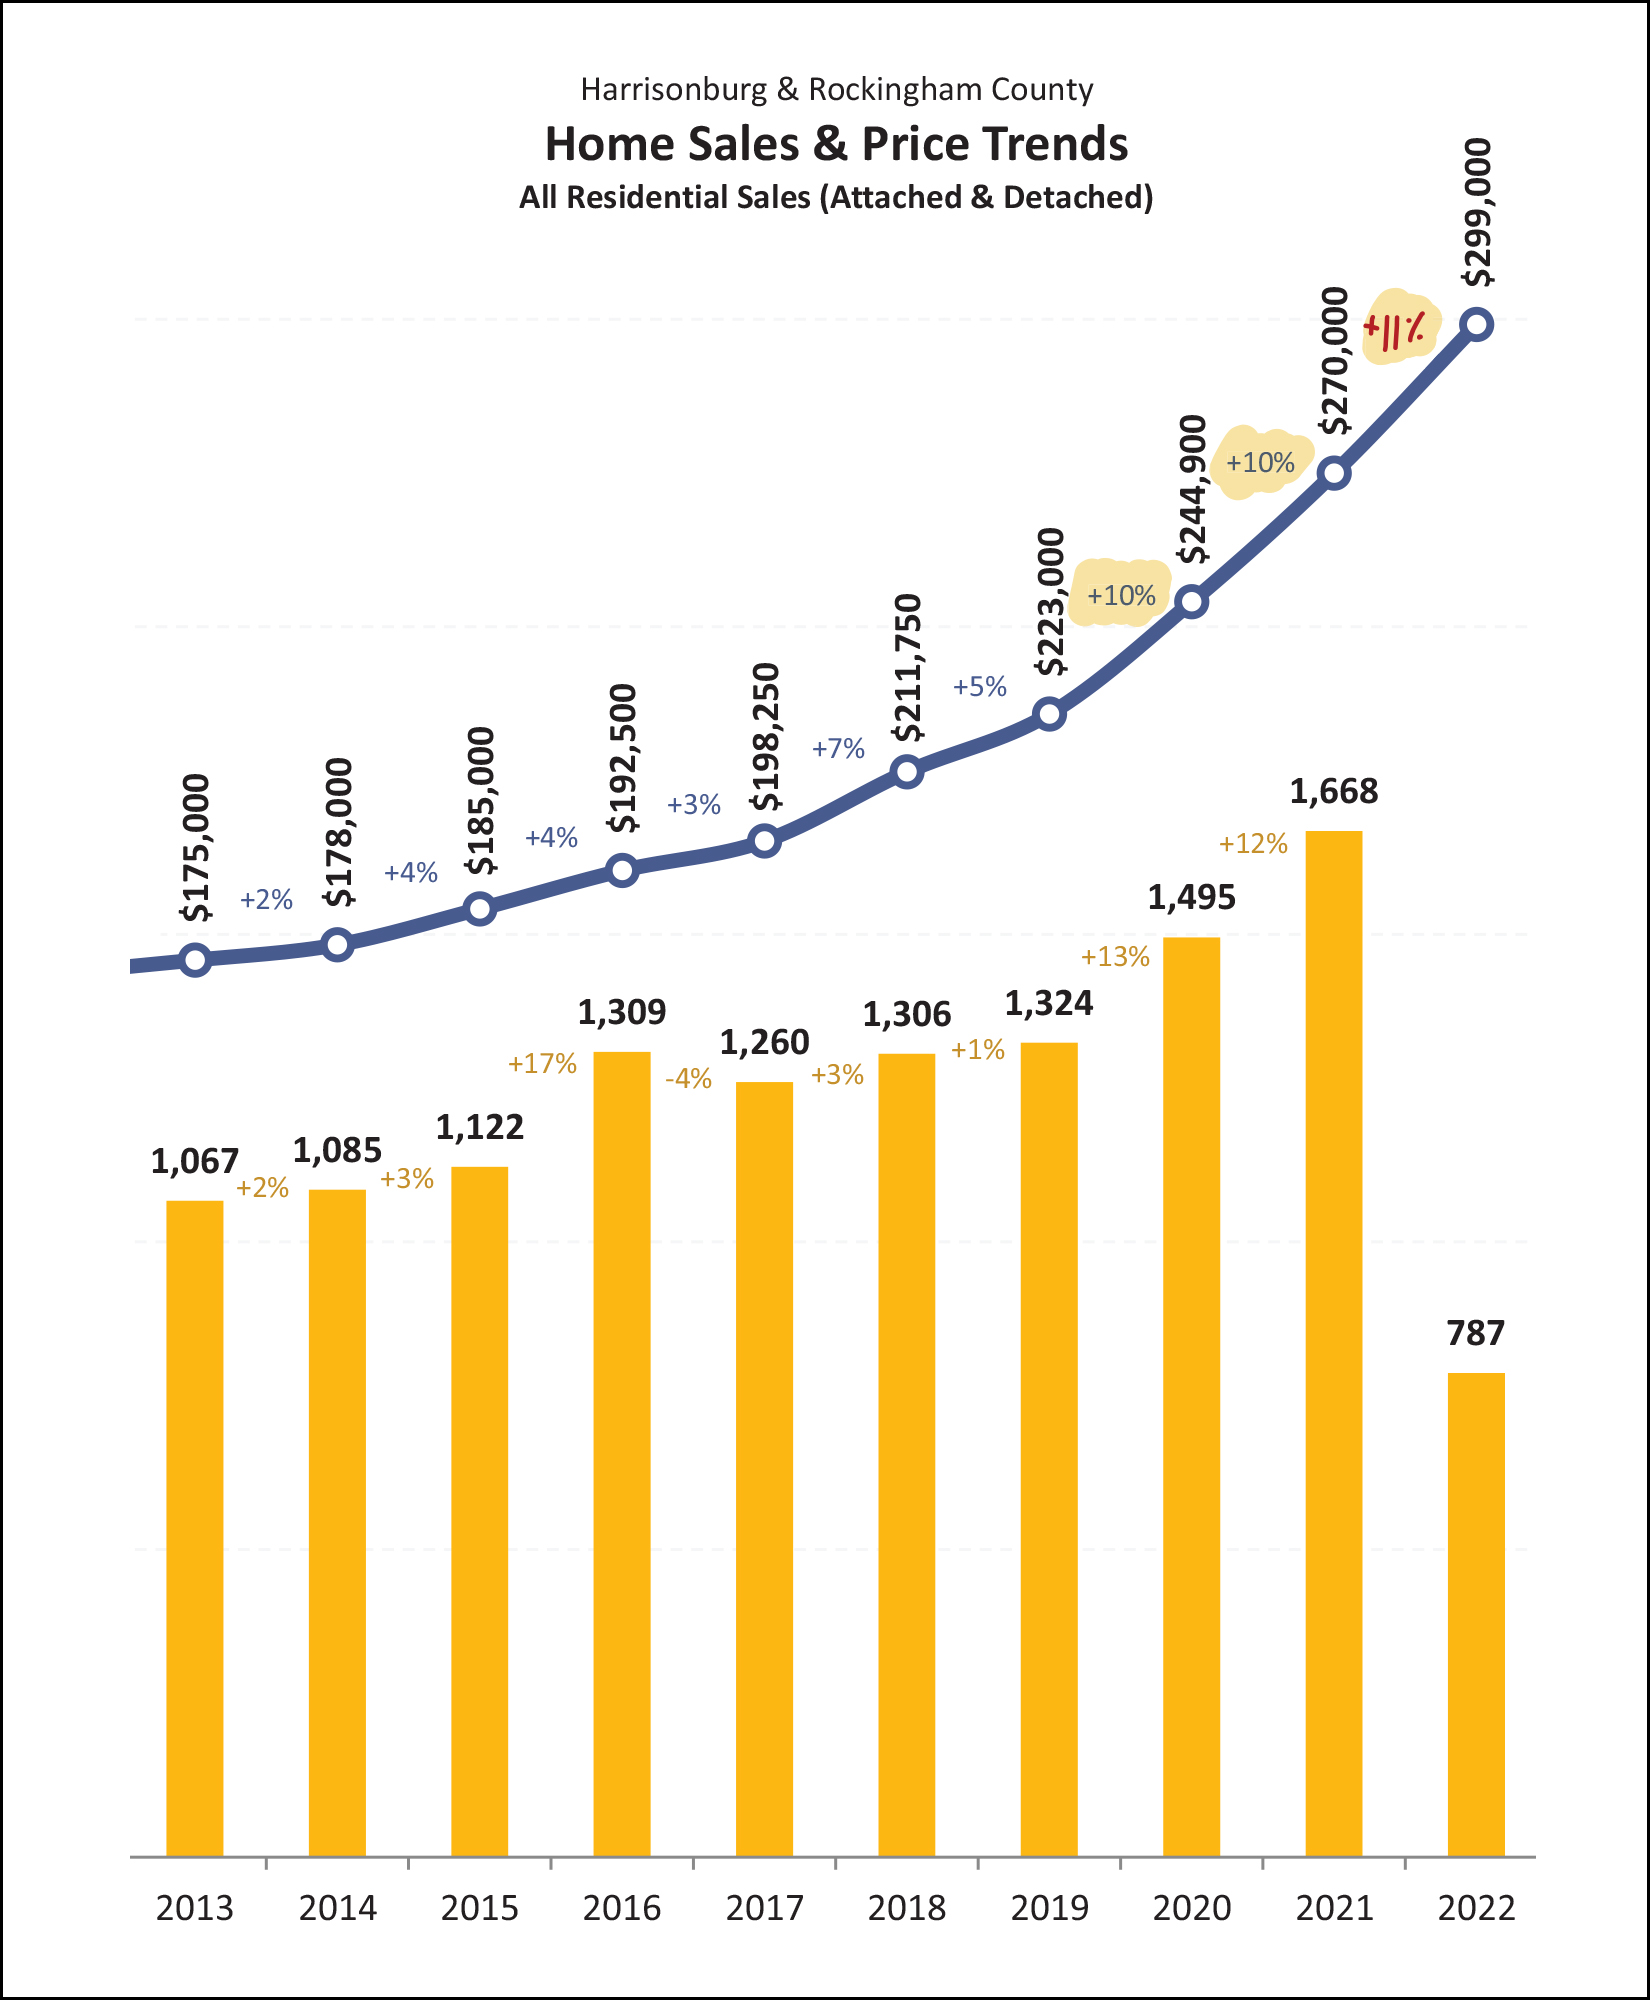 How much did our area's median sales price increase in 2020? 10% How much did our area's median sales price increase in 2021? 10% How much has our area's median sales price increased thus far in 2022? 11% It's been an astonishing few years in our local market to see home values escalating so quickly... without any signs of slowing down. But... to try to reel us back in a bit from cloud nine... 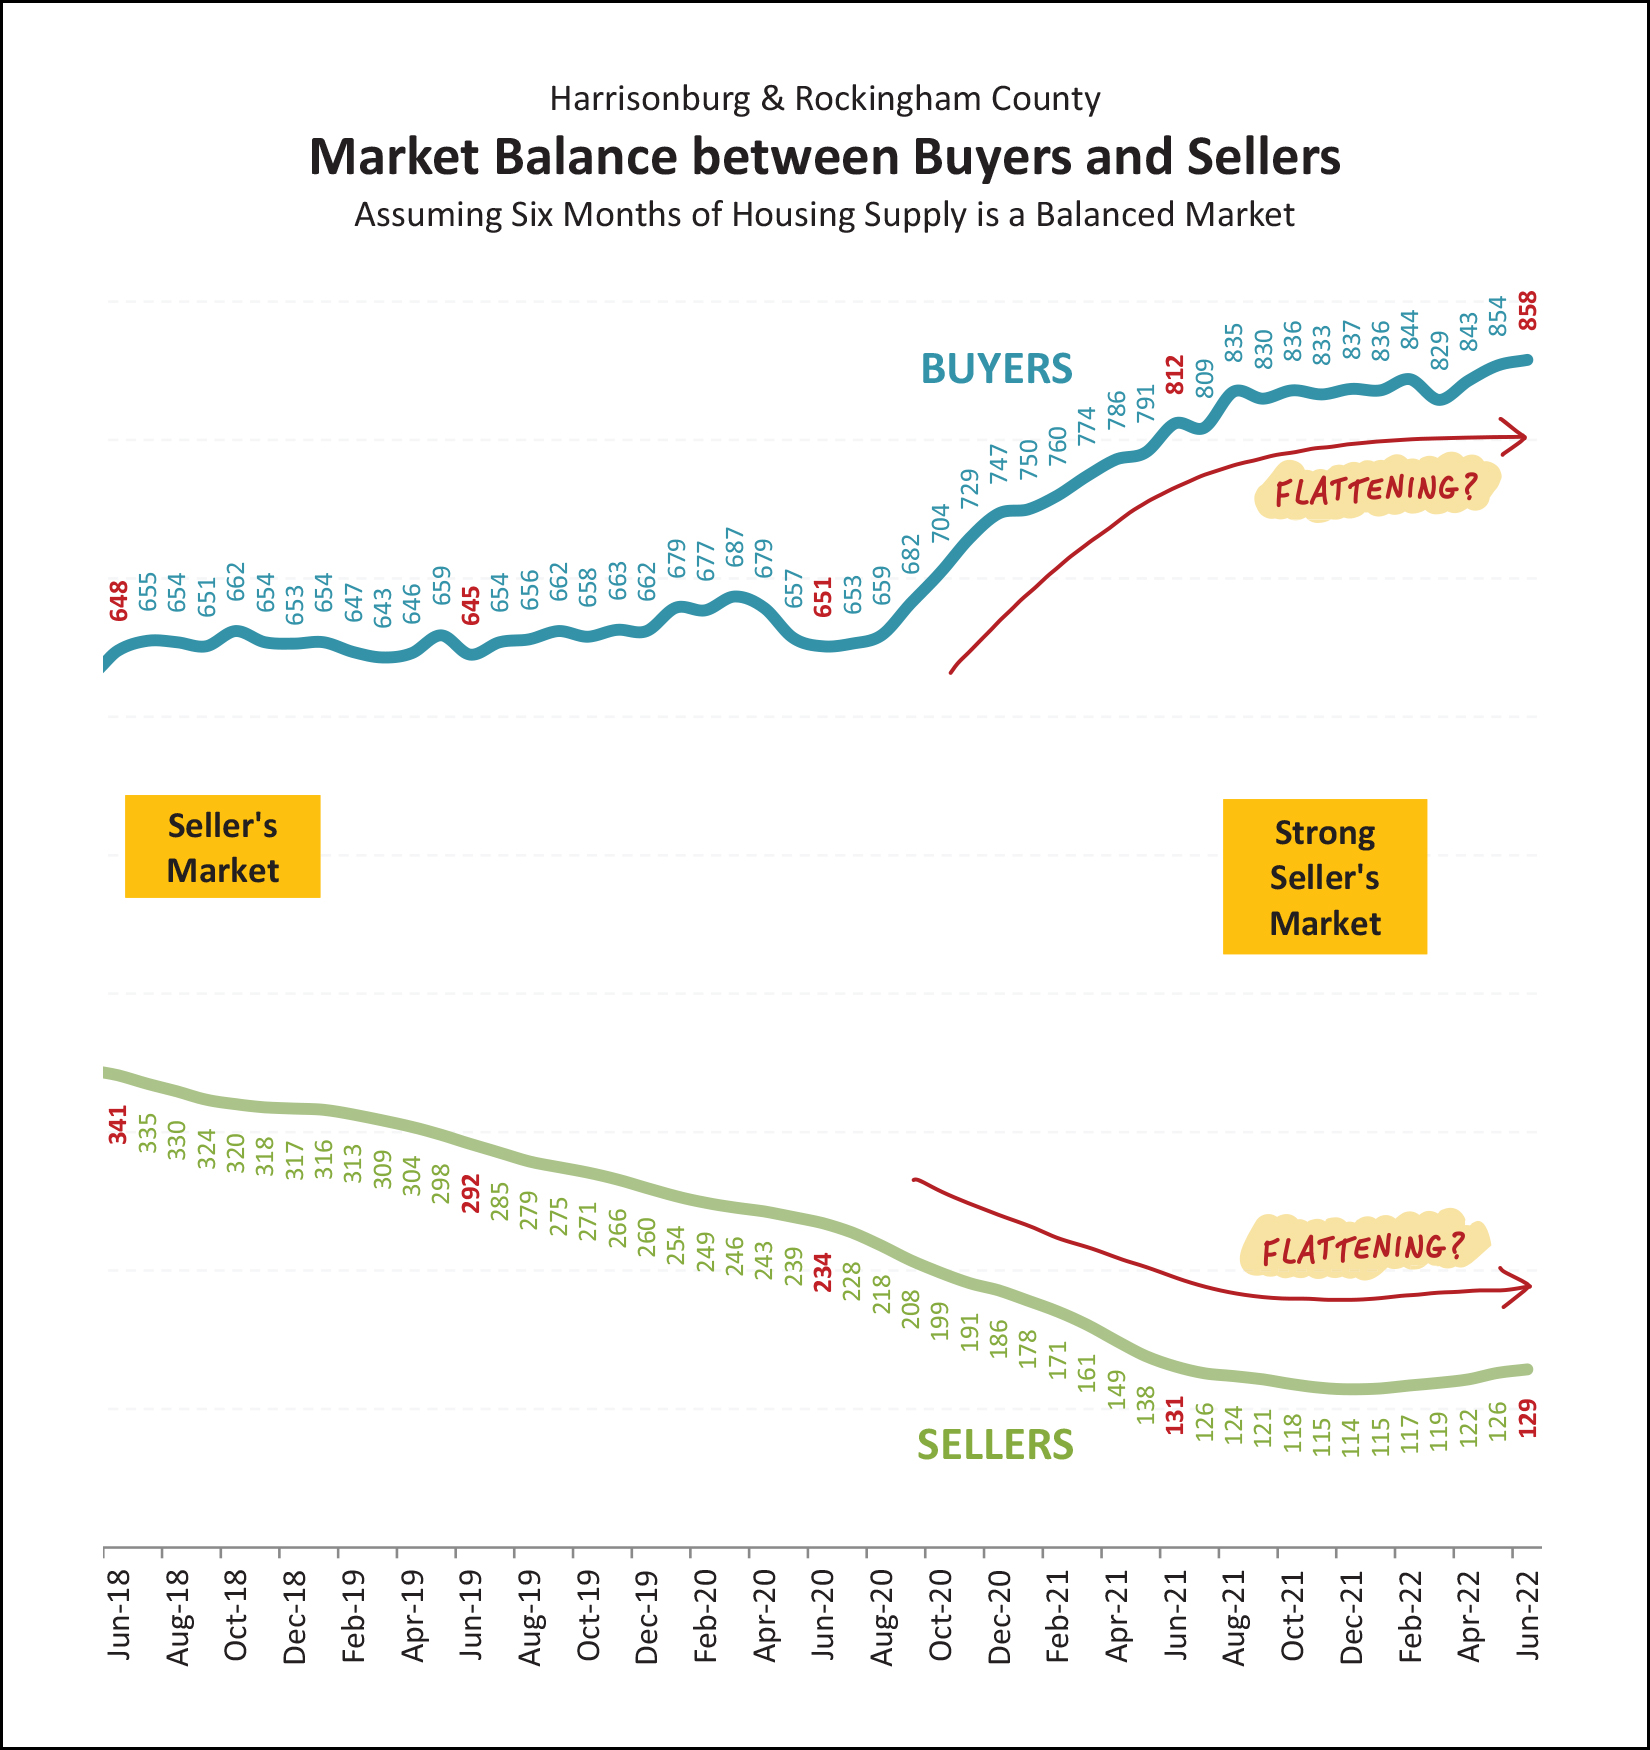 It's hard not to look at the graph above and think that things could be, might be, possibly be changing... [BLUE] The top, blue, line shows the number of buyers buying in a six month period as evaluated over the past four years. This metric has been steadily marching upward over the past two years... but... it seems that the number of buyers buying might be flattening out a bit. Again, not that the amount of buyers buying is decreasing, but buyer activity might not be continuing to increase as quickly as it has for most of the past two years. [GREEN] The bottom, green, line shows the numbers of sellers selling at any given time... the inventory levels at the end(ish) of each month. For most of the past four (plus) years we have seen fewer and fewer (and fewer and fewer) homes on the market, due largely to excessive amounts of buyer demand. But... over the past six months... we're starting to see some modest flattening out of inventory levels in our local area. Inventory levels seem to be steadying themselves. Bear in mind that it is still definitely a strong (strong!) seller's market, but we might be starting to see some early signs that the market might be slowing down a touch... perhaps cooling off from a strong-strong-strong seller's market to a strong-strong seller's market!? Changing gears, slightly, here's an interesting trend to make sure that we recognize... 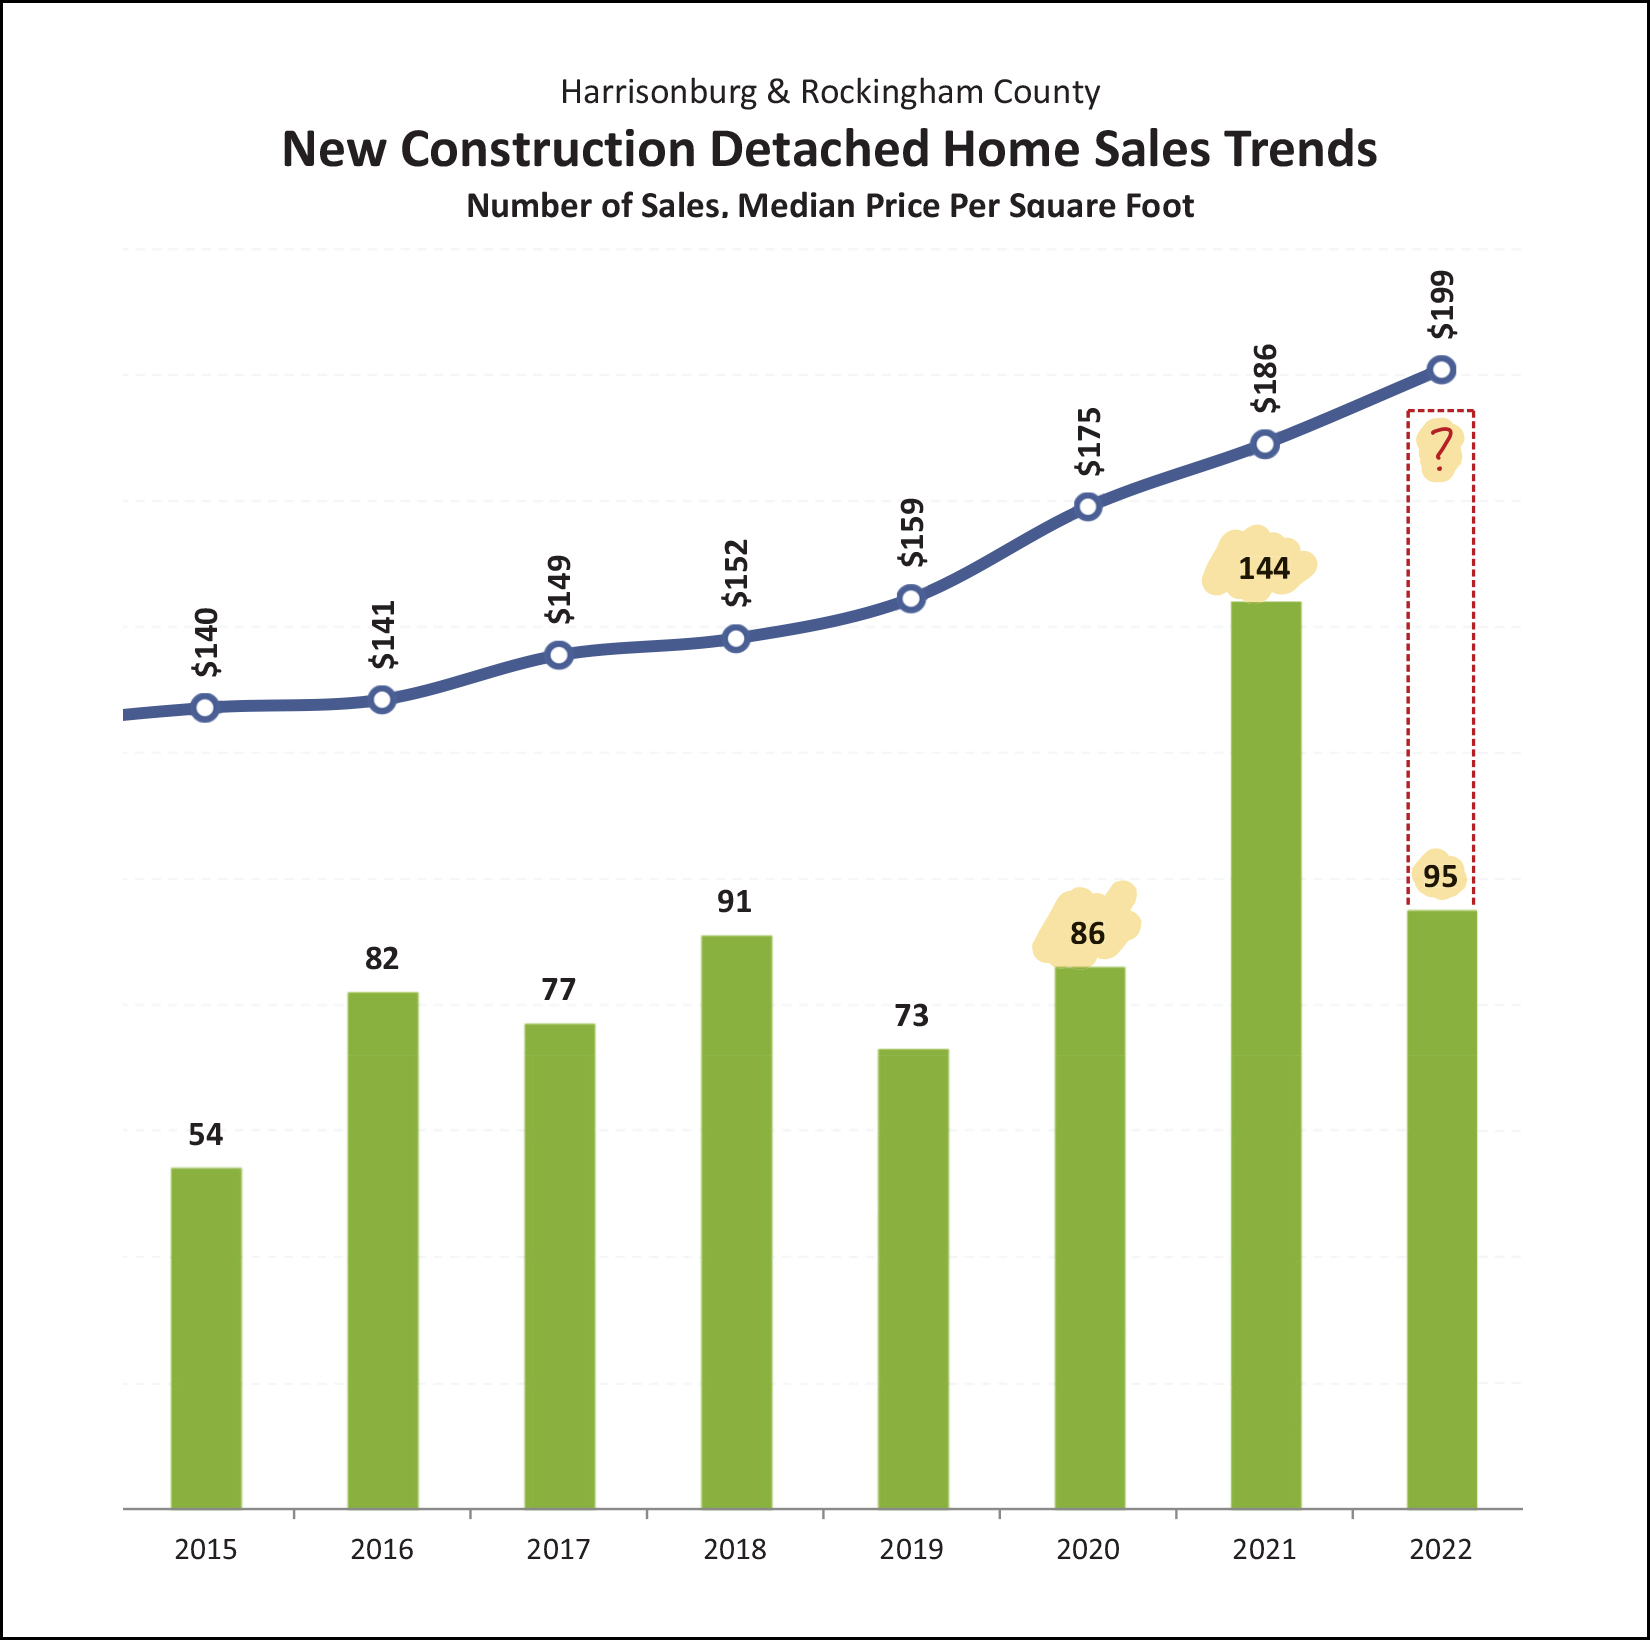 After typically only seeing around 70 - 90 new (detached) home sales per year, we saw a remarkably high 144 such sales last year... and this year we seem to be on track to see around 180 new detached home sales in Harrisonburg and Rockingham County. These recent, steady increases in the number of new homes selling in our market is doing two things... one, allowing the overall number of home sales to increase without relying just on resale homes as inventory... and allowing the median sales price in our market to keep climbing, given that new homes are typically more expensive than resale homes. OK, shifting back to the overall sales market, here's a look at recent months of contract activity... measured by when contracts are signed... 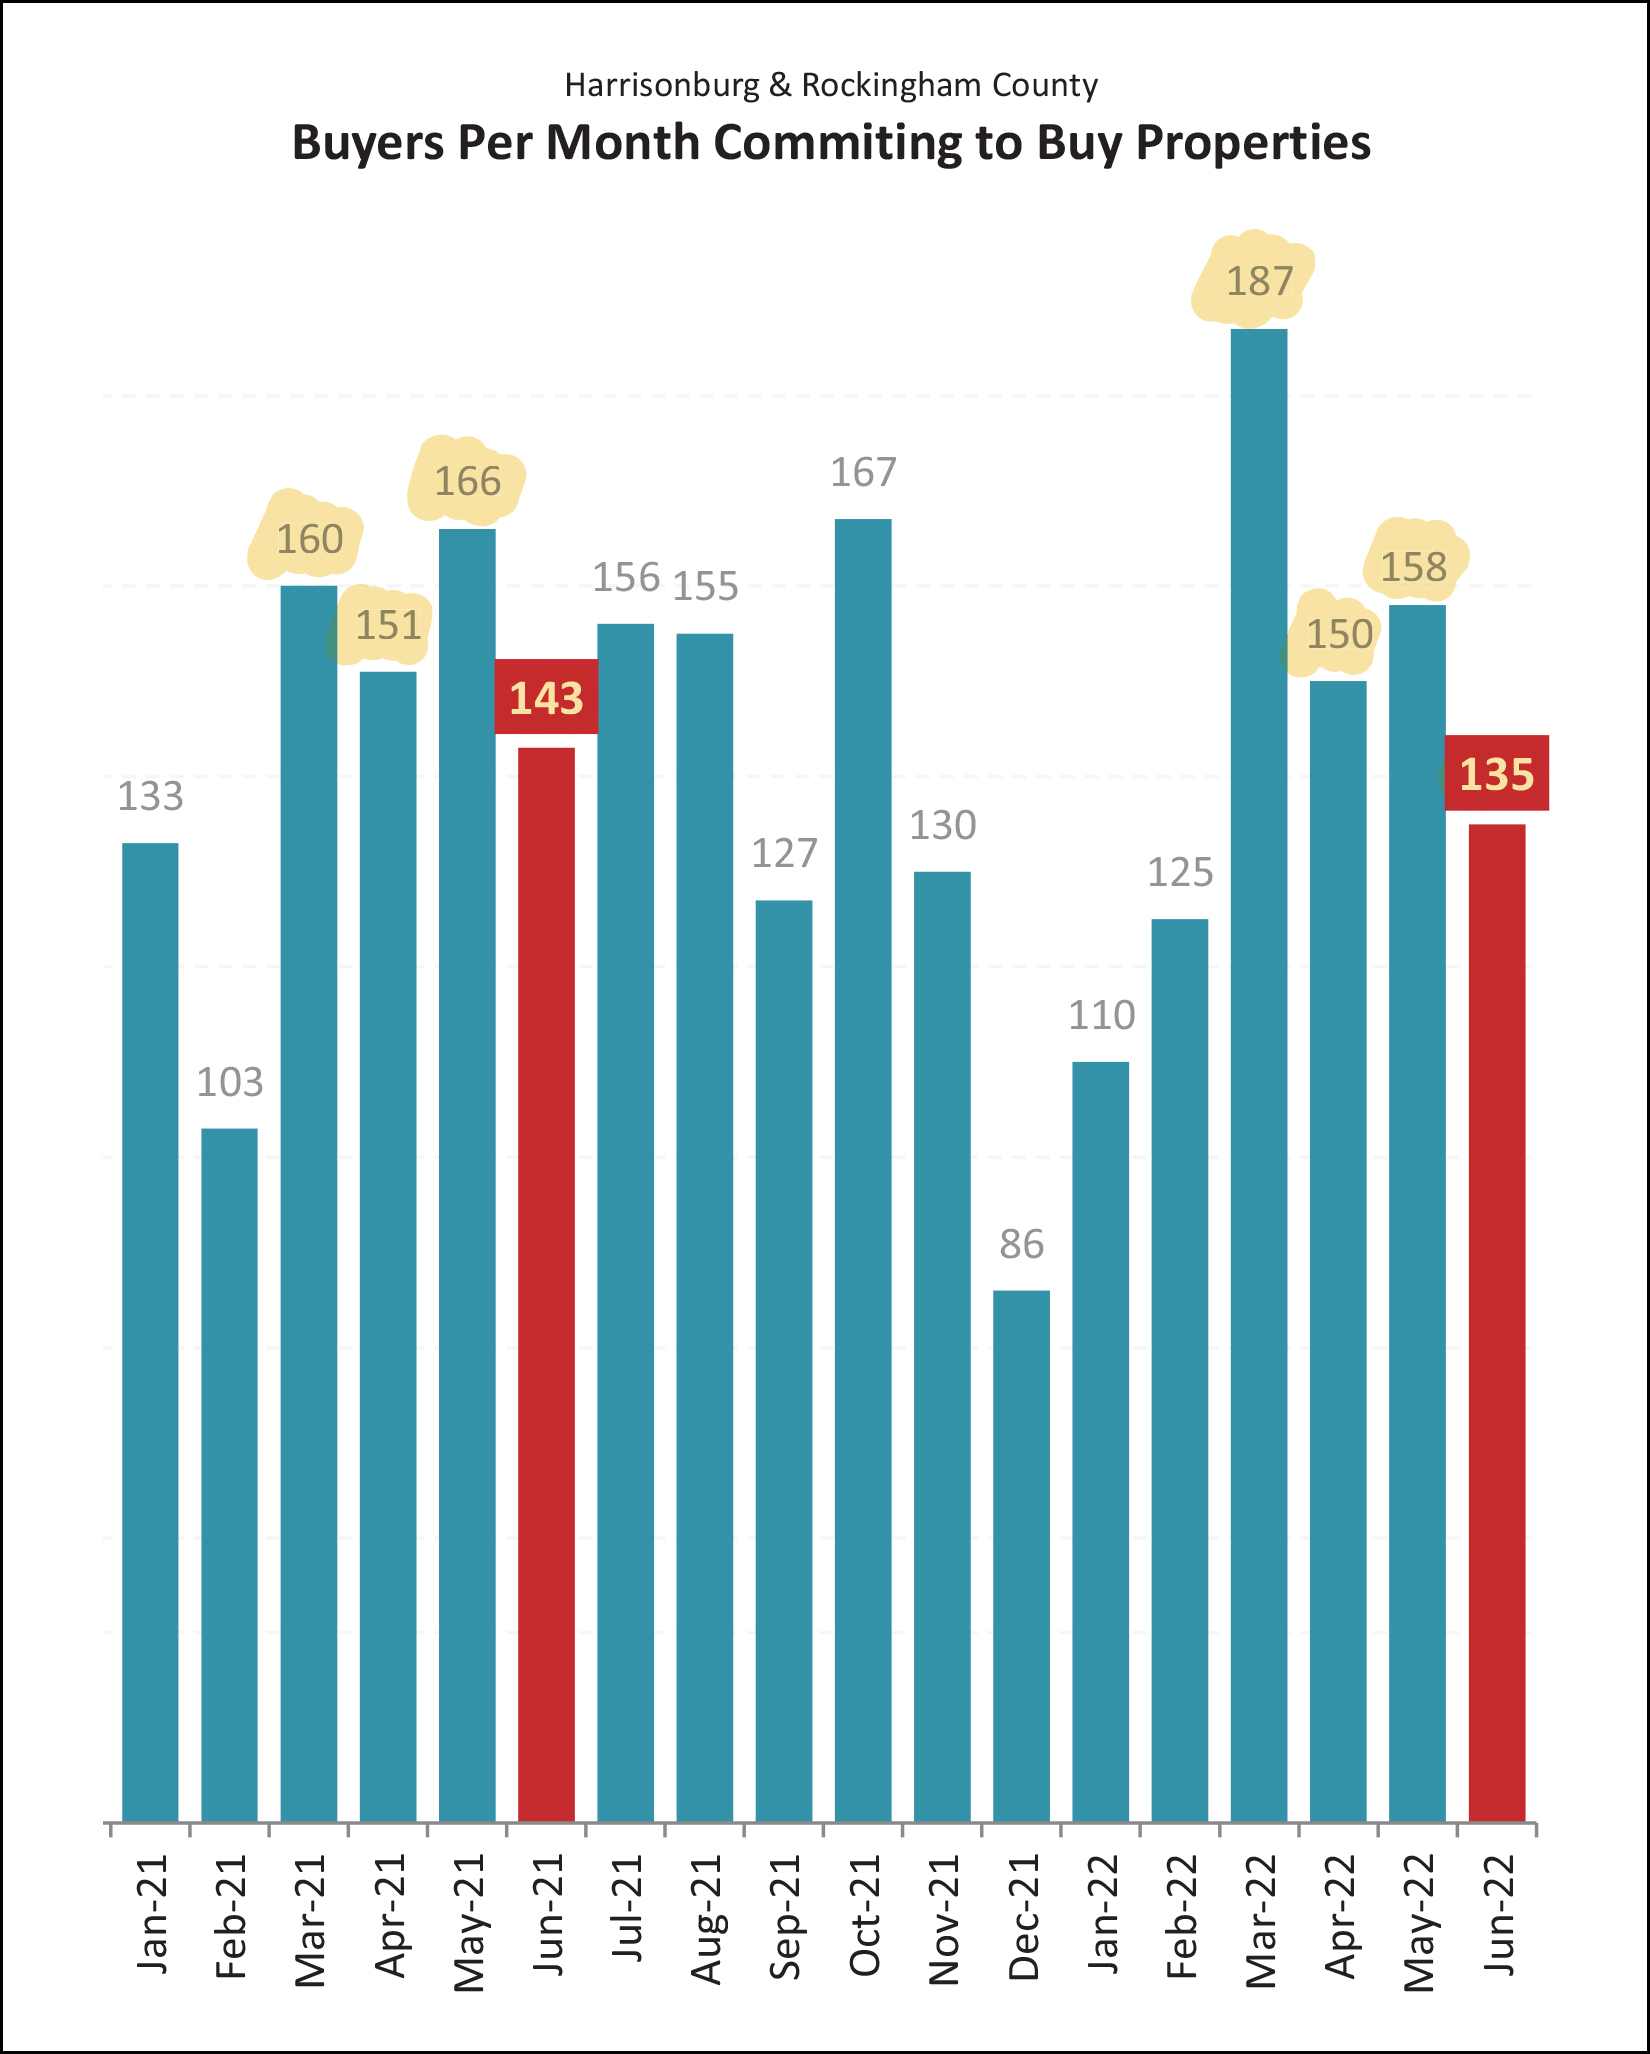 Looking at the highlighted months... [2022] We have seen 630 signed contracts in the past four months. [2021] In the same months last year, we saw 620 signed contracts. So, yes, even with *much* higher mortgage interest rates, we are seeing more buyers sign contracts to buy homes now as compared to a year ago. Is this surprising? Yes, relative to interest rates. No, relative to what seems to be a significant number of buyers who wanted to buy homes in this area in the past two years who have not yet been able to do so. In other words, demand exceeds supply. There are still lots of buyers who want to buy... even if the interest rates are higher than they were previously and higher than they would prefer. So, demand is high. How about supply? Well... 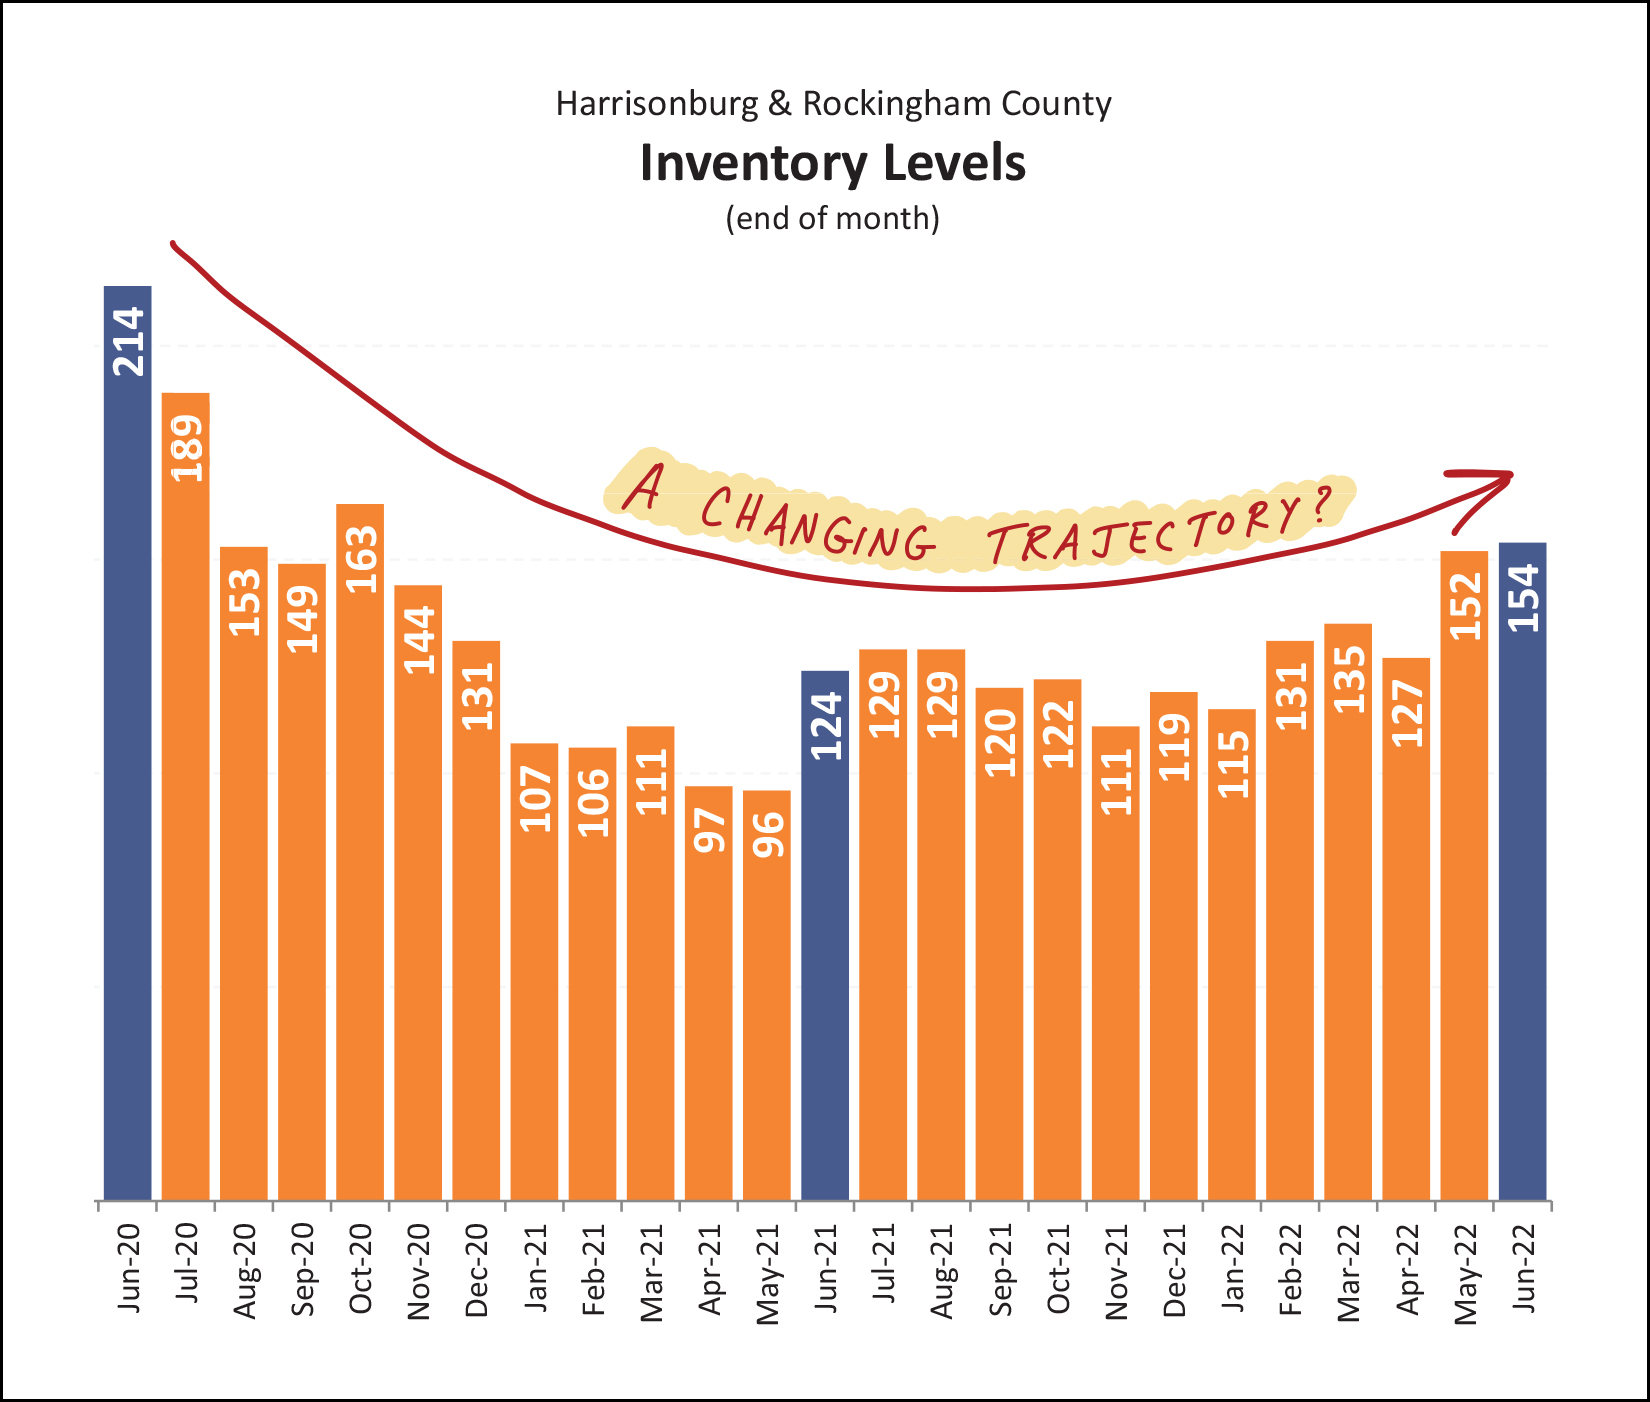 It is possible that our local housing supply is increasing, slightly. After multiple years of constantly declining inventory levels, we now seem to be seeing inventory levels increasing a bit. Sadly, these *slightly* higher inventory levels aren't evenly spread across all property types, locations and prices... so many buyers will still find inventory levels to be *quite* low in their segment of our local market. Because inventory levels are still so low in most segments of the market, we are still seeing homes selling just as quickly has they have for the past year... 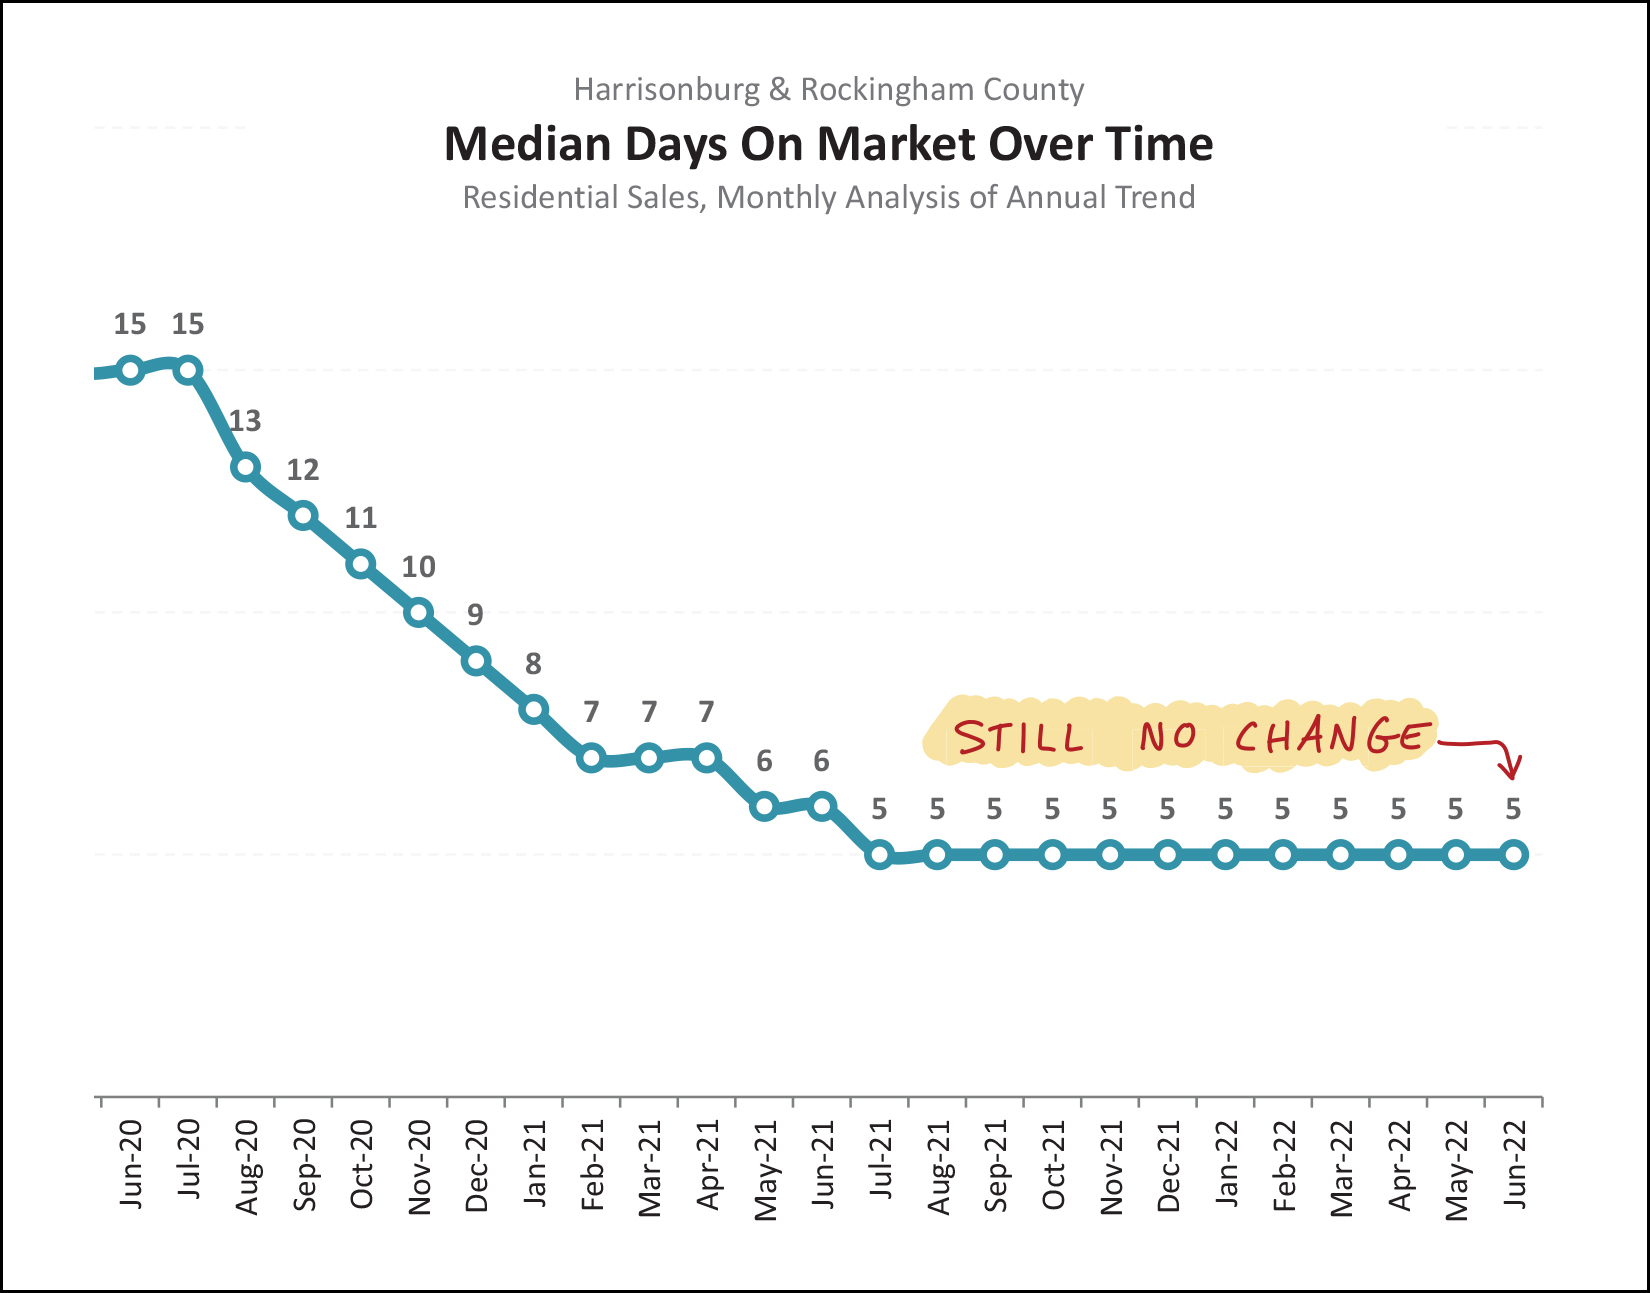 As shown above, the pace at which homes go under contract once listed (days on market) declined steadily through 2020 and 2021 until it seemed to bottom out at a median of five days on the market. That is to say that half of homes go under contract in five or fewer days... and half go under contract in five or more days. This metric hit a median of five days on the market back in July 2021 and has stayed there ever since. If or when the market starts to slow, soften or cool, we'll start to see this metric drift upward again. Finally, that one topic that isn't quite as exciting to talk about... mortgage interest rates... 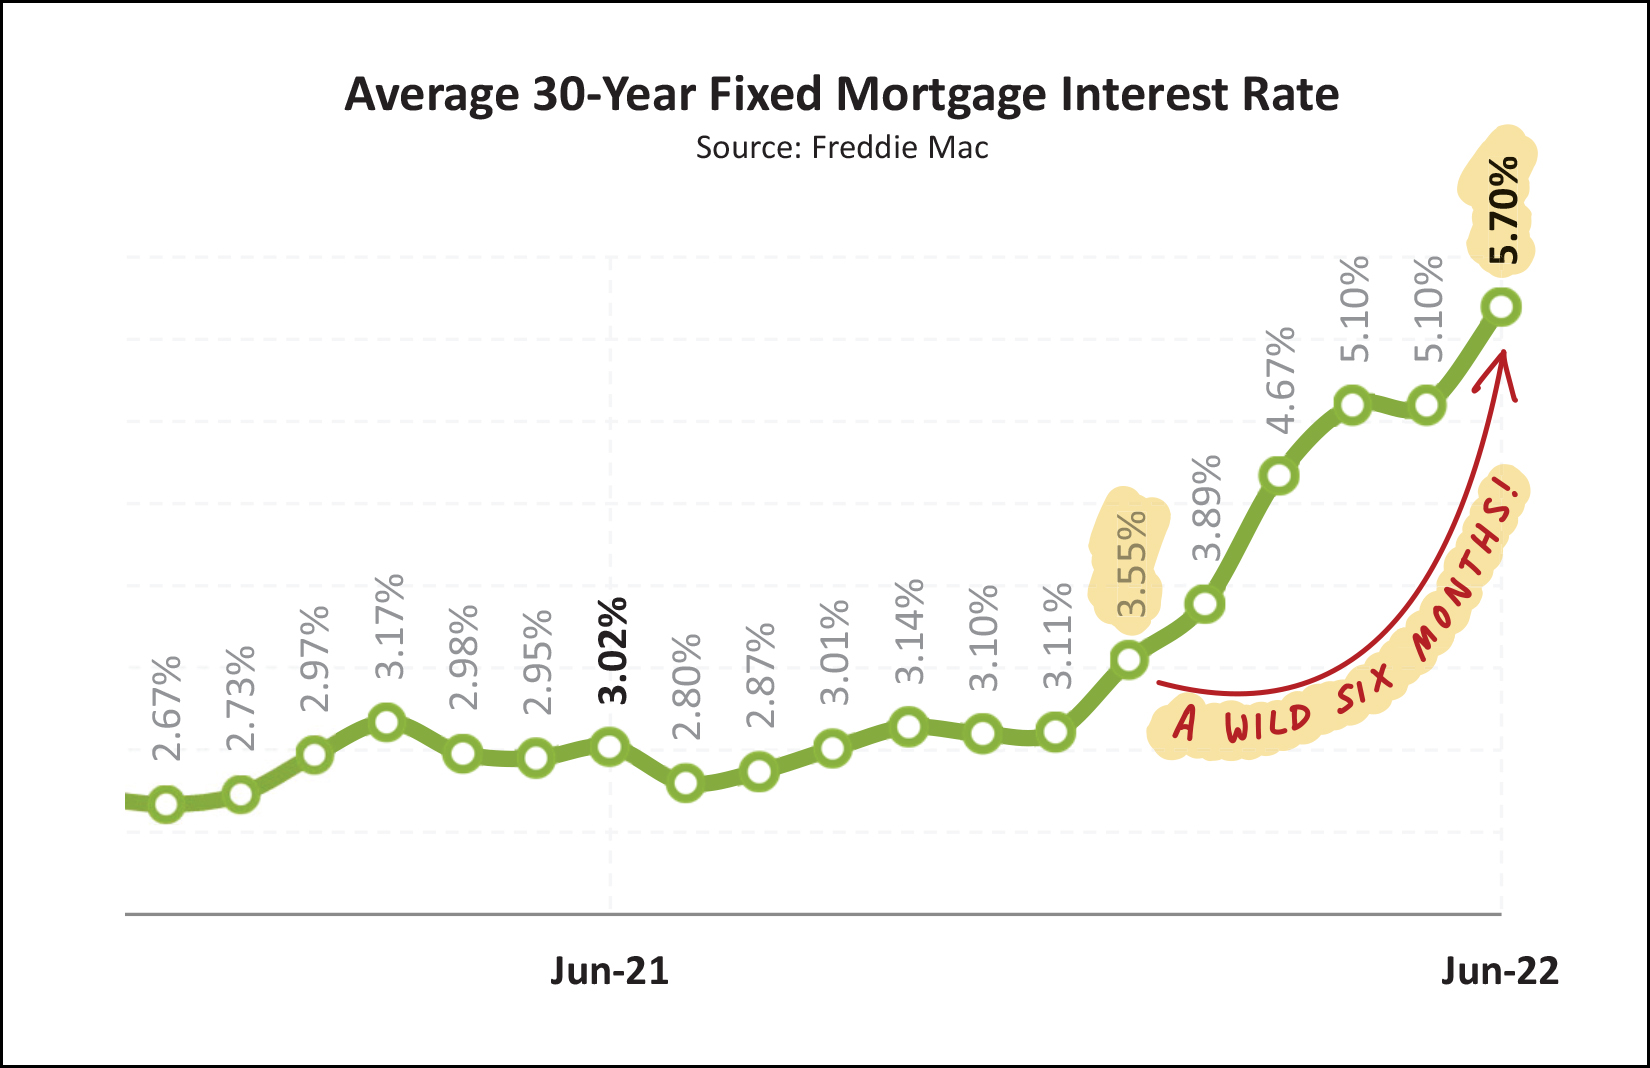 Just six months ago... the average mortgage interest rate for a 30 year fixed rate mortgage was... 3.55%. Now, it has risen all the way up to 5.7% as of the end of June. This drastically affects the monthly payment for buyers in today's market as compared to just six (or twelve, etc.) months ago. I don't think we'll see interest rates rise above 6% but it is definitely possible. If there is one thing that could cool off our local housing market, it's this "cost of money" in the form of the mortgage interest rates. But, again, it hasn't happened yet despite drastic changes in interest rates. And here we find ourselves again, at the close of what seems to be another red hot month of real estate activity in Harrisonburg and Rockingham County. By the headlines... [1] More and more home sales are selling! [2] Homes are selling at higher and higher prices! [3] Homes are selling as fast as ever! [4] Inventory levels are increasing, slightly, in some pockets of the market. [5] Mortgage interest rates are higher than they have been in years! What will we see over the next few months in our local real estate market? Most likely, more of the same... but we won't know for sure until those next few months pass... and I'll pause each month to check the numbers and share some thoughts with you so that we can all have a good sense of where we have been, where we are and where we might be going next. Speaking of next... If you are planning to SELL a house in the next few months, sooner is likely better than later, and I'd be delighted to chat with you about how we might work together. If you are planning to BUY a home in the next few months, you ought to check in with your lender sooner rather than later to get proper expectations of your potential mortgage payments within the context of rising mortgage interest rates... and yes, I'd be delighted to help you with buying as well. Be in touch at any point if I can be of any help to you or your family or friends. You can call/text me at 540-578-0102 or email me here. Until next month... may your summer be as relaxing as this crazy real estate market can be stressful! ;-) | |
Home Sales Slow Slightly, Prices Still Climbing Quickly! |
|
 Happy Tuesday morning, friends! I hope you are enjoying the warmer weather this week, and perhaps some sporting events! We have a baseball player and a runner here in our house and the warmer weather this week is a welcome change for these outdoor sports.  Whether you're watching baseball games, track meets or soccer games these days, I hope your kids are enjoying the sport and their teammates, and you are not freezing in the stands. :-) Before I get started on this month's market report, a few quick notes... Check Out Vito's Italian Kitchen... Each month in this space I highlight one of my favorite spots to enjoy a meal, or a cup of coffee, or maybe a few other surprises in the coming months. This month, it's Vito's Italian Kitchen... a familiar and favorite restaurant on Port Republic Road in Harrisonburg. If you find me enjoying a meal at Vito's, it will likely be their calzone... or of late, I have been partaking of their delicious Coconut Chicken & Fruit salad. If you haven't visited Vito's lately, do so, this week! And... maybe next week you can go back for free! I'm giving away a $50 gift certificate to Vito's... just for fun! Enter your name and email address here and I'll pick a winner in about a week. :-) Congrats to Michael S. who won the Magpie gift card last month! Featured Property... Are you tired of bidding on house after house and not having the seller select your offer? Maybe you should build your next house instead of buying one? ;-) The photo on the cover of this month's market report is a beautiful, flat building lot in McGaheysville, currently offered for sale... and ready for you to build your next home! Find out more here. Download All The Graphs... Finally, for those of you who like to download all the graphs and examine every data point, you can grab those here. Now, then, onto your data fix for the month... 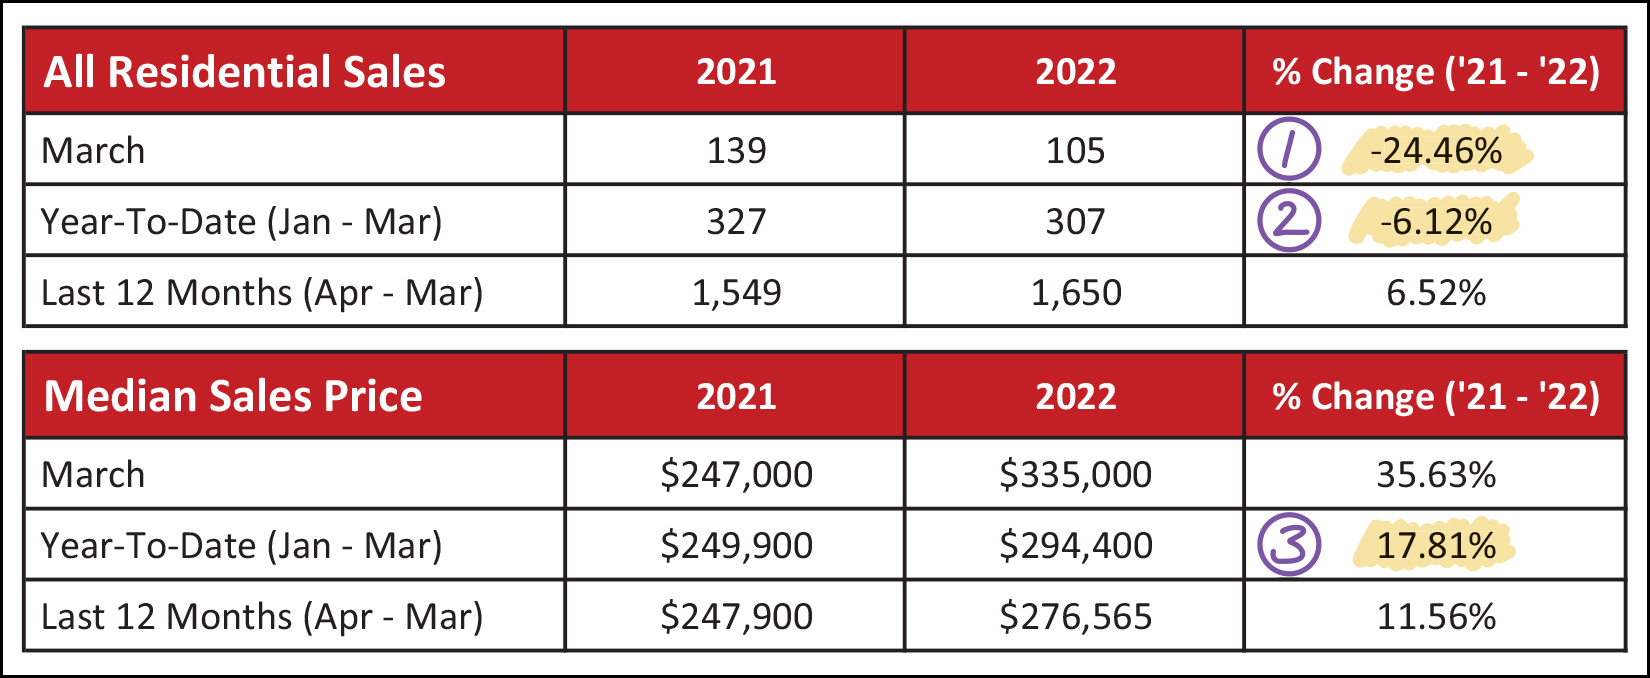 First off, yes, it's really true... after month after month of "more sales" and then "more sales" and then "more sales" -- this month there are a few indicators that are showing "fewer sales" instead. Don't panic. Read the entire market overview below for some analysis, context and commentary. In the chart above you'll note that... [1] There were 24% fewer sales this March than last March. A knee jerk reaction here might be "oh, I knew it, interest rates went up and home sales declined" but keep in mind that buyers that closed on their purchases in March likely contracted on those homes in January and February, before much of the increase in interest rates. A better indicator of whether interest rates are having an effect on buyer activity will be... buyer activity... signed contracts... and we'll get to that a bit further down in the report. The data might surprise you. ;-) [2] That 24% comparative deficit in March contributed to a first quarter of home sales in 2022 that included 6% fewer home sales than the first quarter of last year. [3] Despite a slightly (6%) slower first quarter of the year for home sales, the prices of those homes keeps on increasing. The median sales price in the first quarter of 2022 was $294,400... which is 18% higher than it was in the first quarter of last year. As I do from time to time, let's look at the trends in detached home sales (in green below) compared to attached home sales (in orange below) which includes duplexes, townhouses and condos... 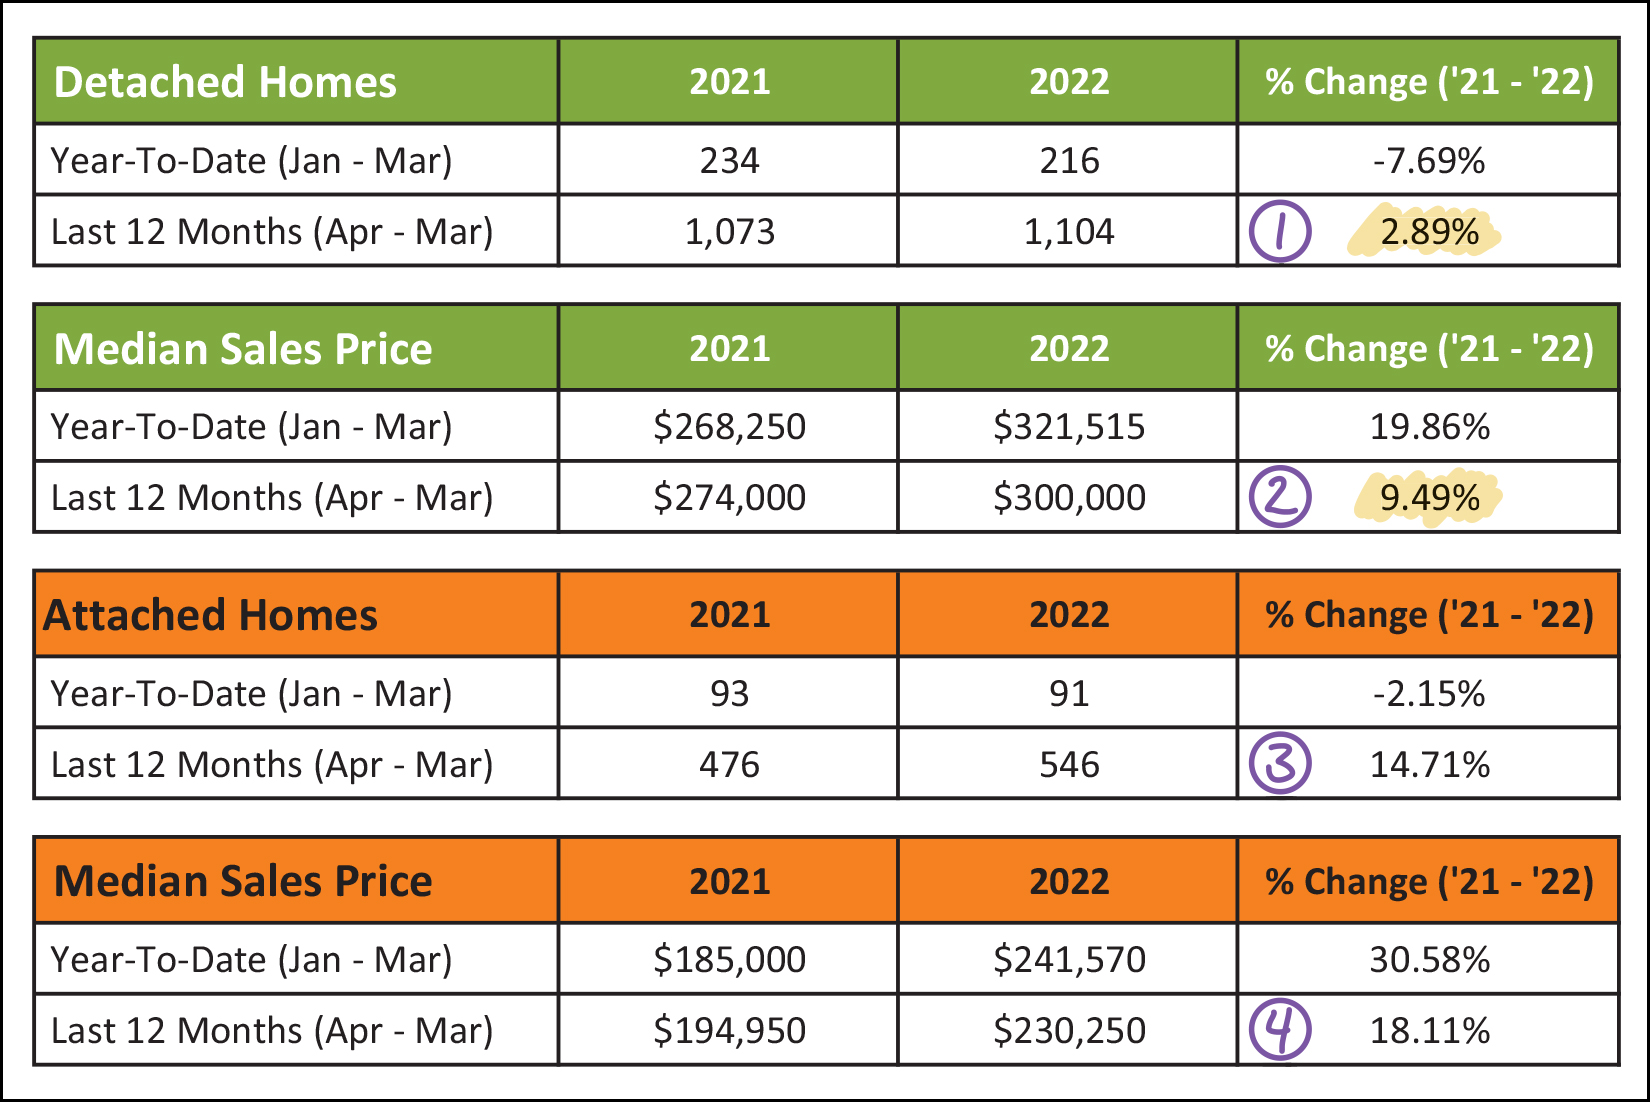 As shown above... [1] We've seen 1,104 detached home sales over the past year... which is 3% more than seen in the 12 months before that. [3] Comparatively, though, the number of attached home sales has increased much more over the past year. We've seen 546 attached home sales in the past 12 months, which is 15% more than in the 12 months before that! And how about prices... [2] The median sales price of a detached home in Harrisonburg and Rockingham County has increased 9% over the past year, to a nice (or not nice, if you're buying) round $300,000. [3] Prices of attached homes has increased at an even faster rate, with an 18% increase over the past year to a median sales price of $230,250! Here's one of my favorite graphs each month, showing monthly sales in our area... 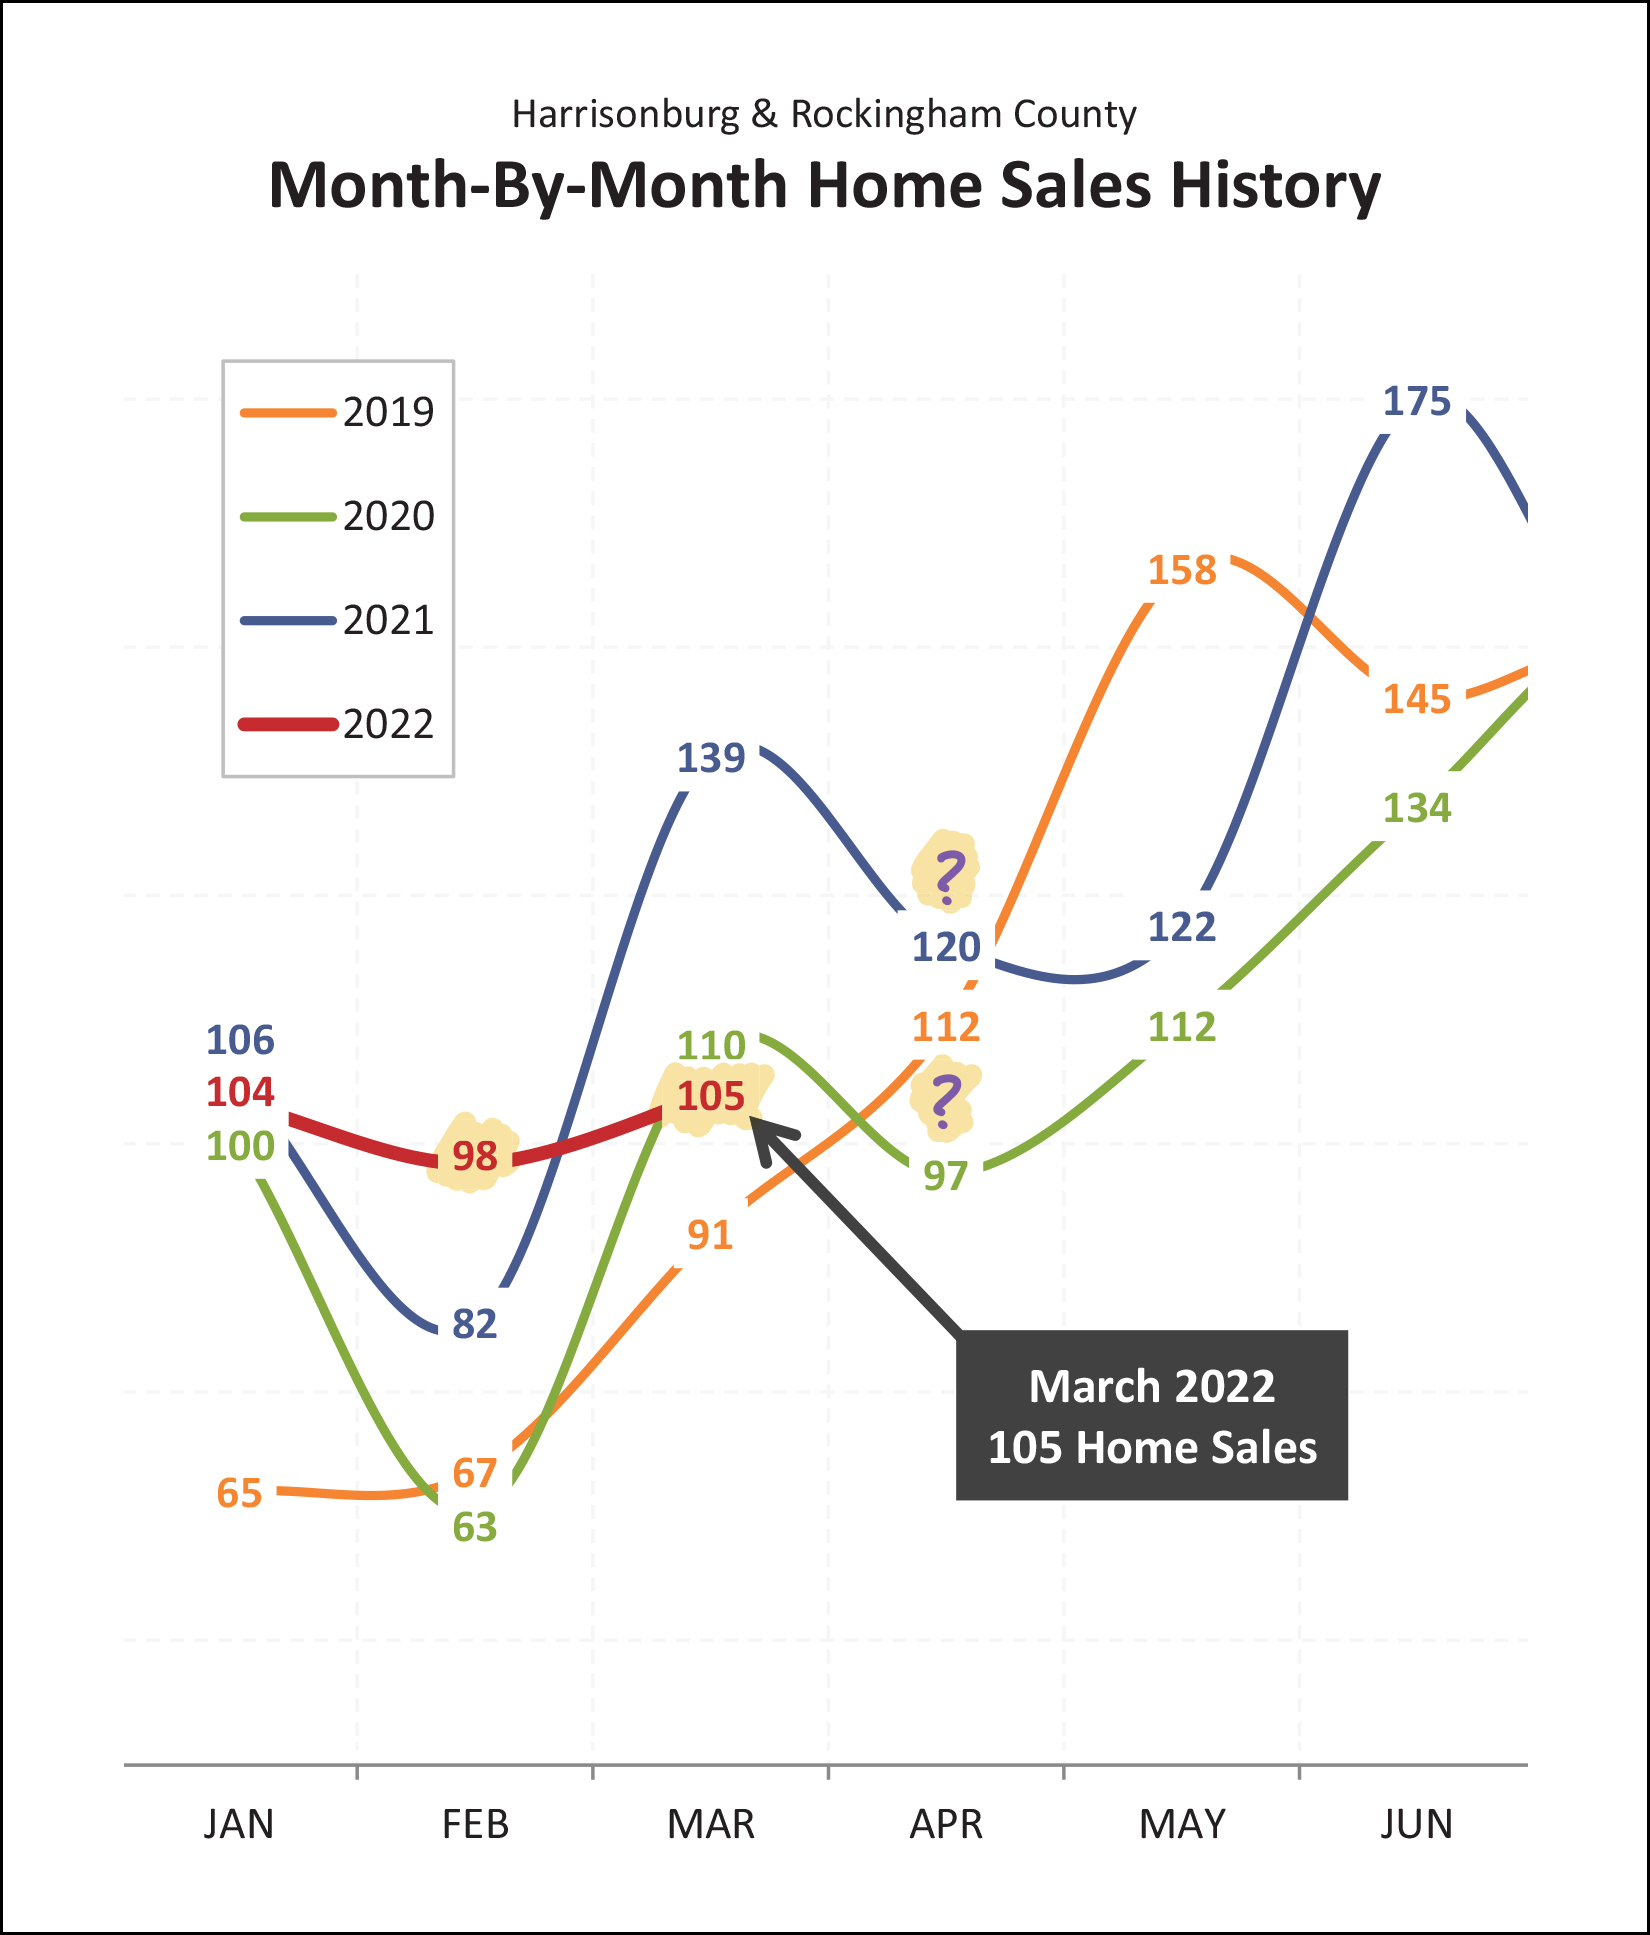 So, plenty going on in the graph above. January 2022 was what we might have expected -- right in the middle of the pack as compared to past months of January. February sales were surprisingly high, easily exceeding previous months of February. But March, hmmm, not as exciting as we might have hoped. Why weren't there more buyers in March? Some of them might have bought in February. But more likely... home buyers didn't buy (close on a purchase) in March because there weren't enough home sellers listing their homes for sale in January and February. Fewer homes available to purchase means... fewer homes will be purchased. All that said, we are certainly seeing a significant shift in mortgage interest rates right now, and that may also affect buyer (and seller) behavior moving forward. It will be helpful to see what happens over the next three to six months to better understand the overall trends in our local housing market... which is a statement that is probably always true. The next six months of data will be the best indicator of what is going on right now. :-) Next up, stack 'em up... 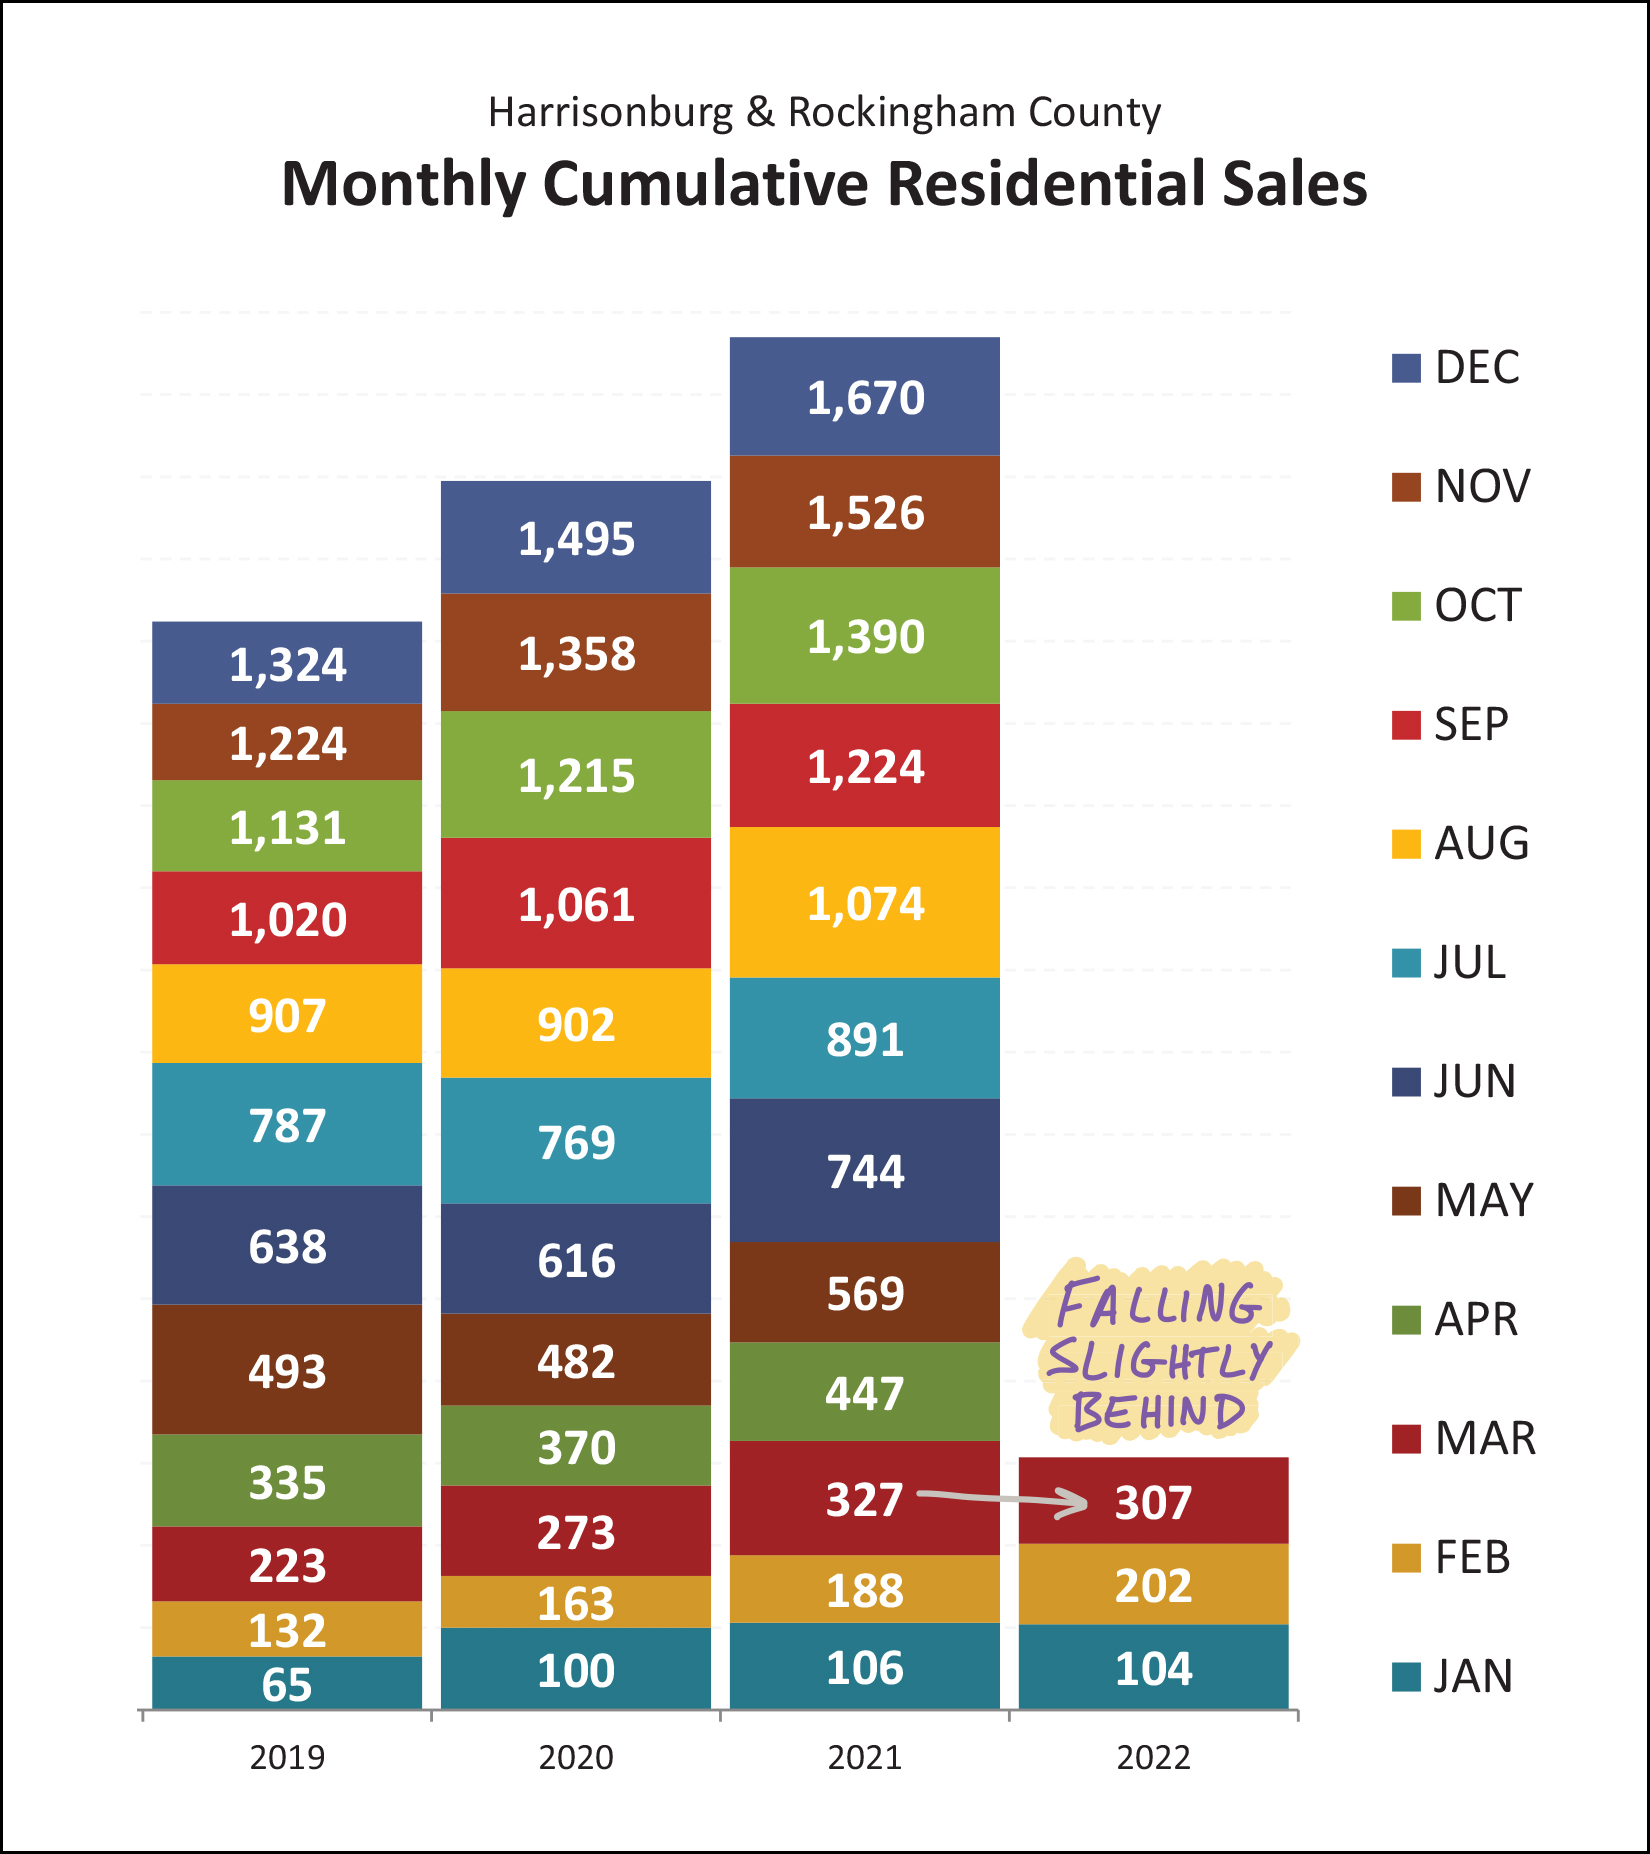 Here's where we'll be able to keep good track of cumulative trends as we go through the year. The first three months of home sales this year (307) is slightly lower than those same three months last year... but higher than the two years before that. Will enough home sales pile on in April to make up that deficit? One indicator that might point to a yes or no will be contract activity in March. Keep reading... Slicing and dicing the data again, we end up reviewing our basic understanding of landforms... 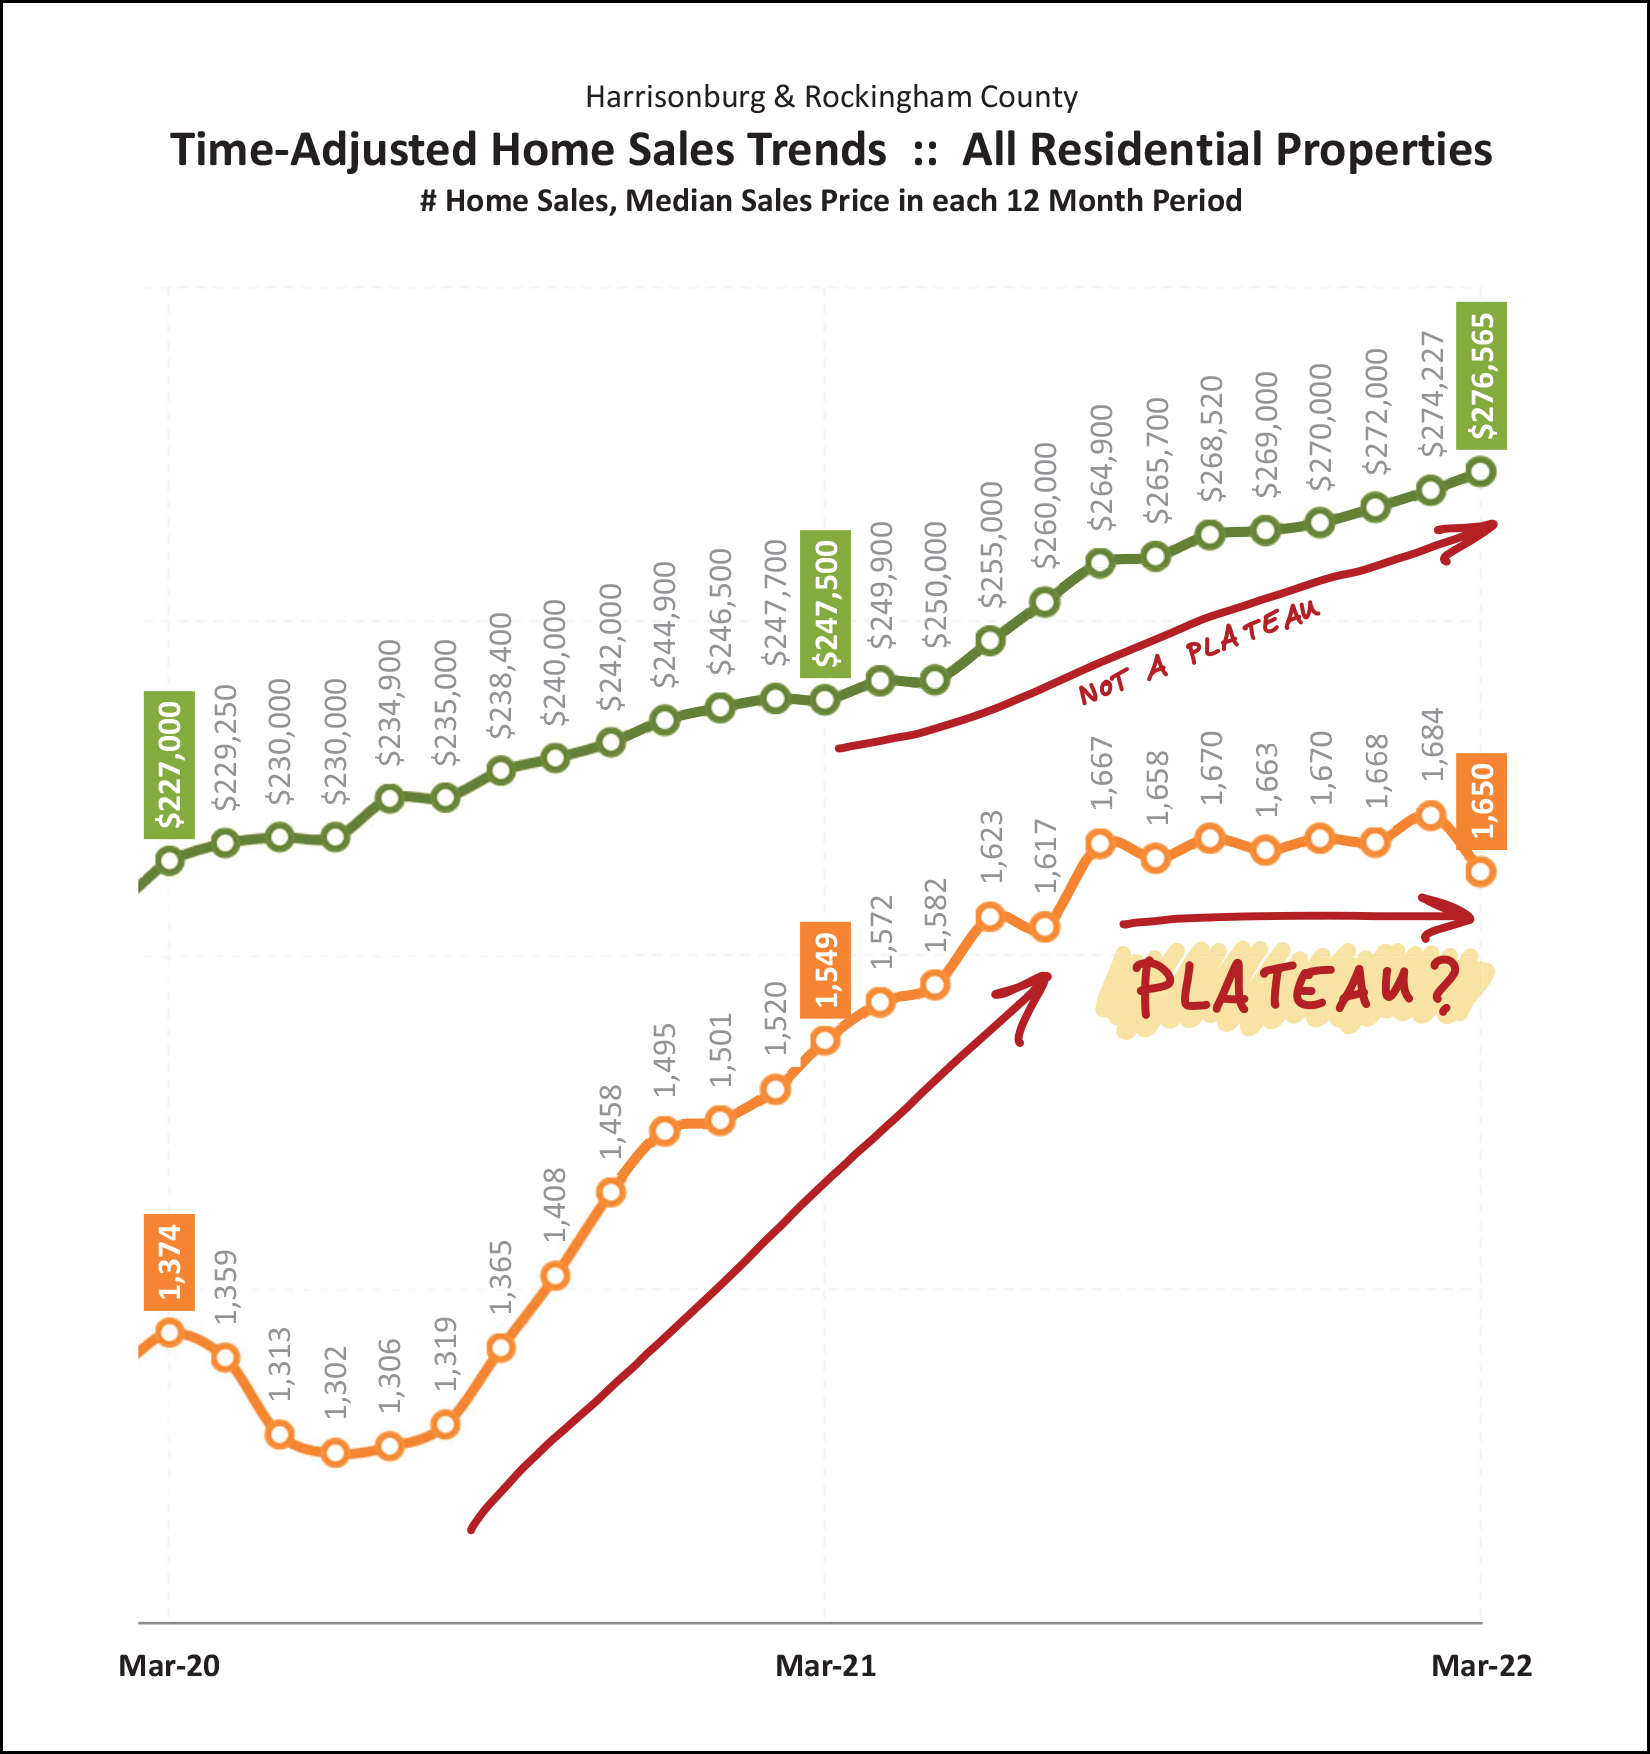 OK, let's see how you did at geography... before you read the captions above... the green line is or is not a plateau? And how about the orange line? Indeed, the green line is definitely not a plateau... sales prices keep on climbing, higher and higher and higher again. But the orange line... might be (?) a plateau? The number of homes selling a year in Harrisonburg and Rockingham County dipped down to around 1300/year in mid 2020 at the start of the pandemic, but then accelerated well past 1600/year by the fourth quarter of 2021. Over the past eight months, however, we have been seeing a relatively steady number of home sales per year. So, lots of home sales, but that number is no longer increasing, at least for now. So, will we see annual home sales ever (even for a month) rise to 1700 sales per year? Maybe not, given the past eight months of hanging out in the 1650 - 1690 range. And below is one more sign of a possible change in a trend in our local housing market... 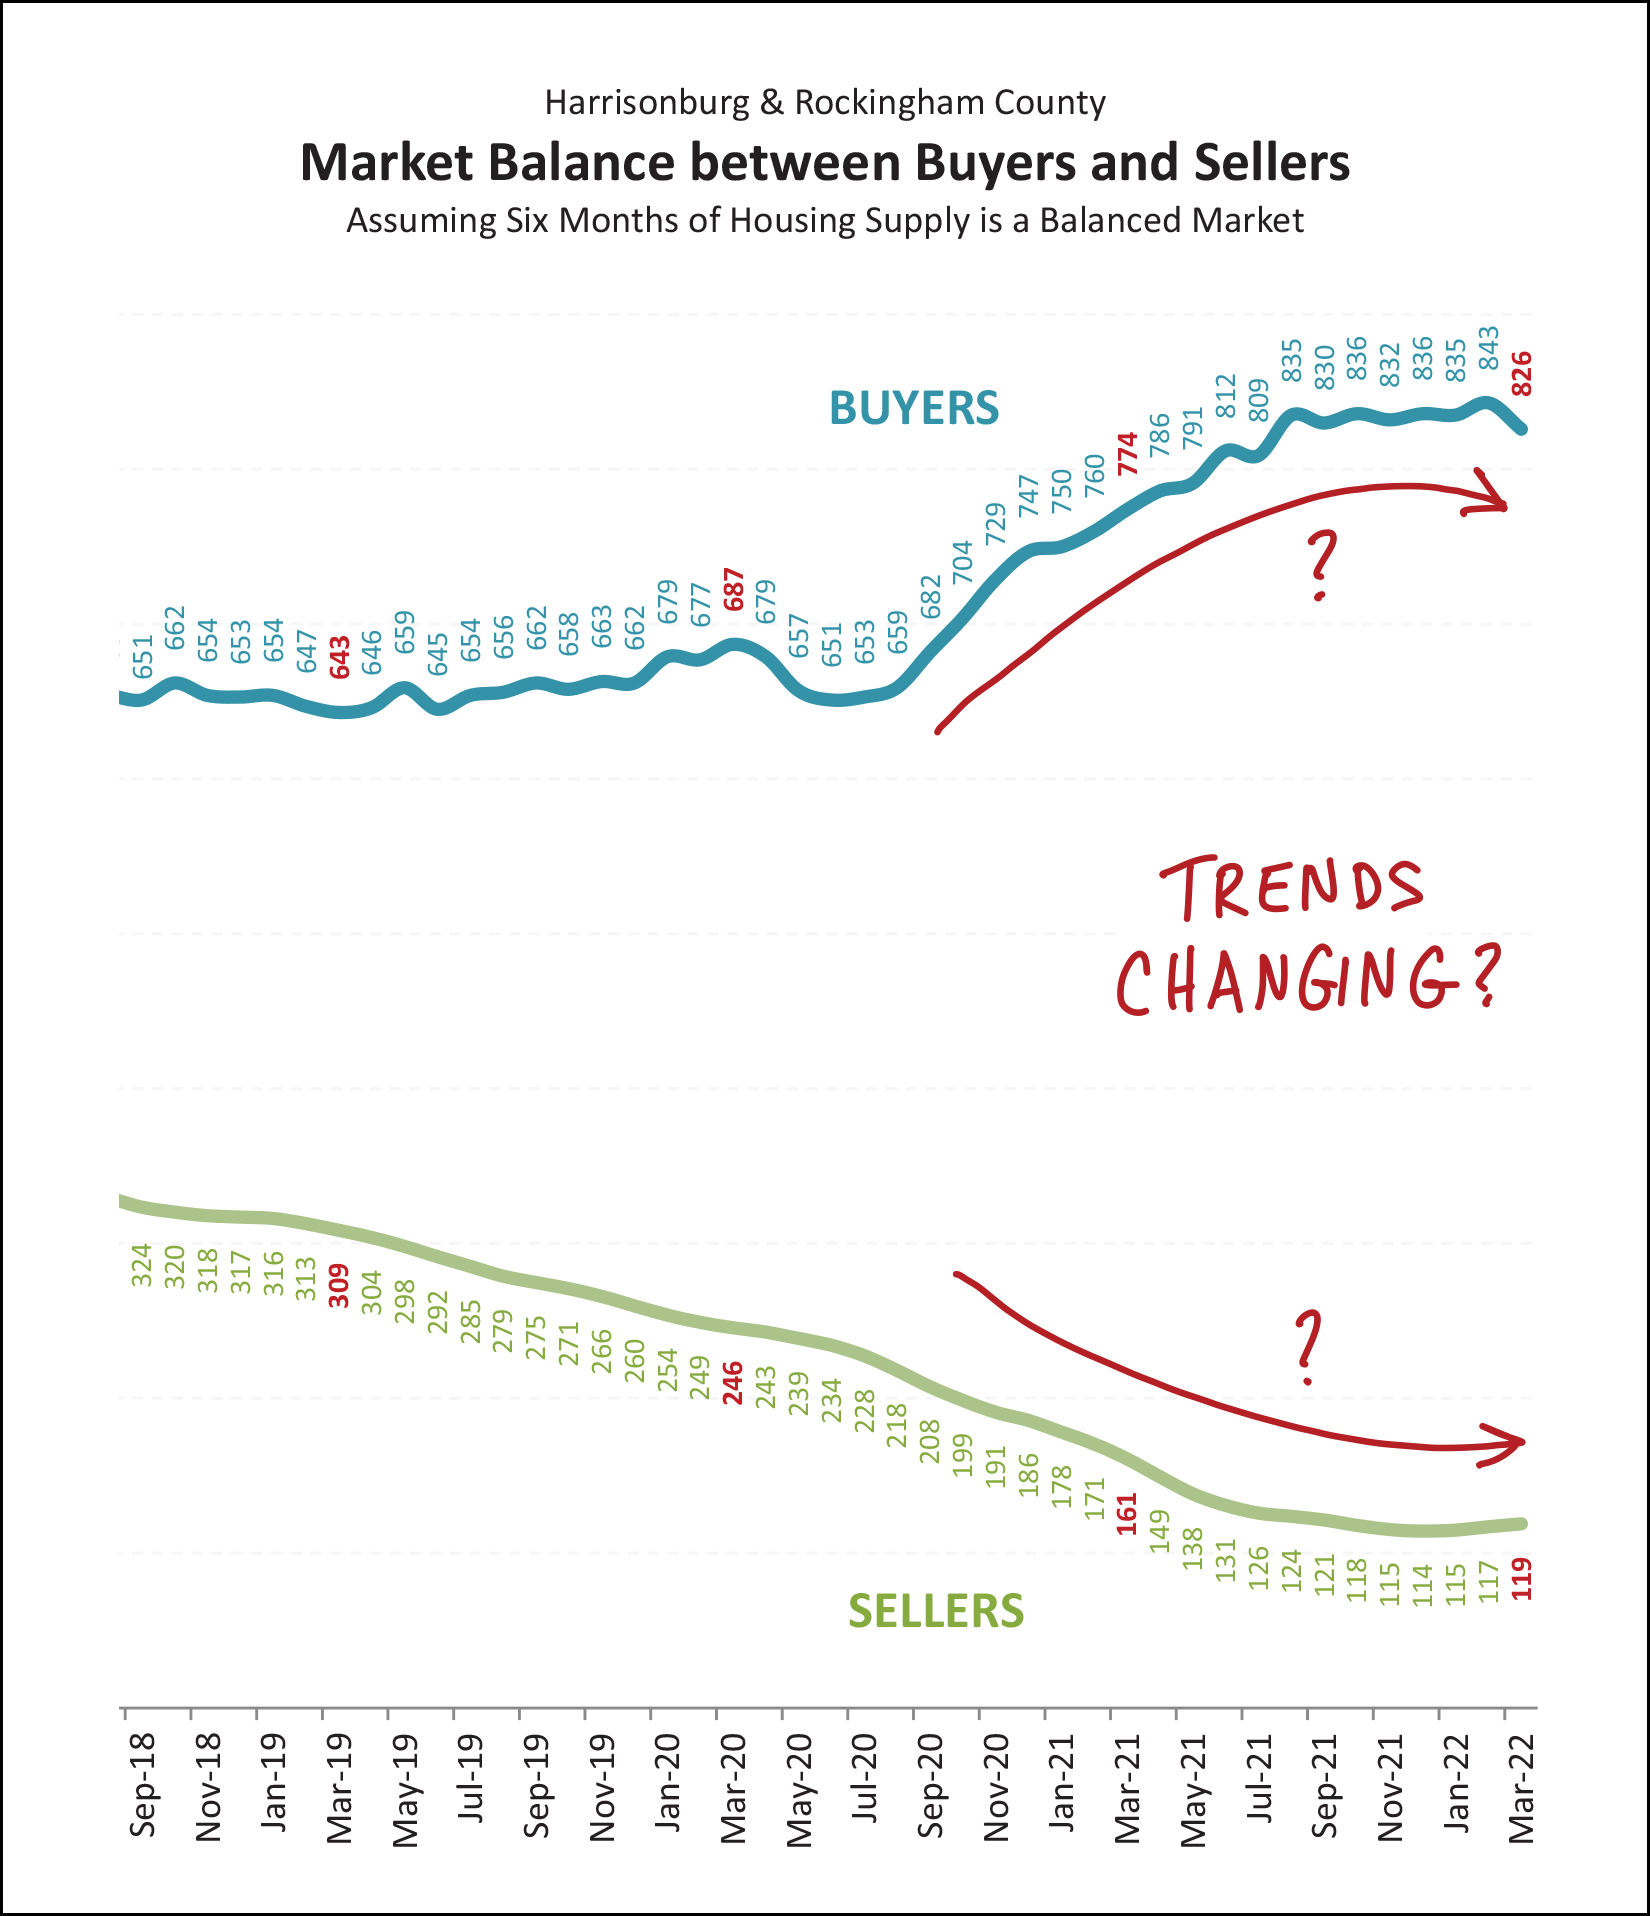 As can be generally observed above, the number of buyers buying has been flattening out over the past six to nine months -- and the number of sellers selling (inventory levels) have been stabilizing (at a really, really low point) during that same time period. So, is something changing in our local real estate market? Maybe? We probably shouldn't and wouldn't conclude that the balance in the market is shifting unless we see a measurable decline in buyer activity AND a corresponding increase in availability in homes offered for sale. Which brings us right back around to needing to remember that in order for a high level of buyer activity to be sustained.... we also need to see a sustained high level of seller activity. No houses to buy... no houses will be bought. But before anyone starts thinking that the balance in the market is changing, let's take a look at how negotiations are going these days... 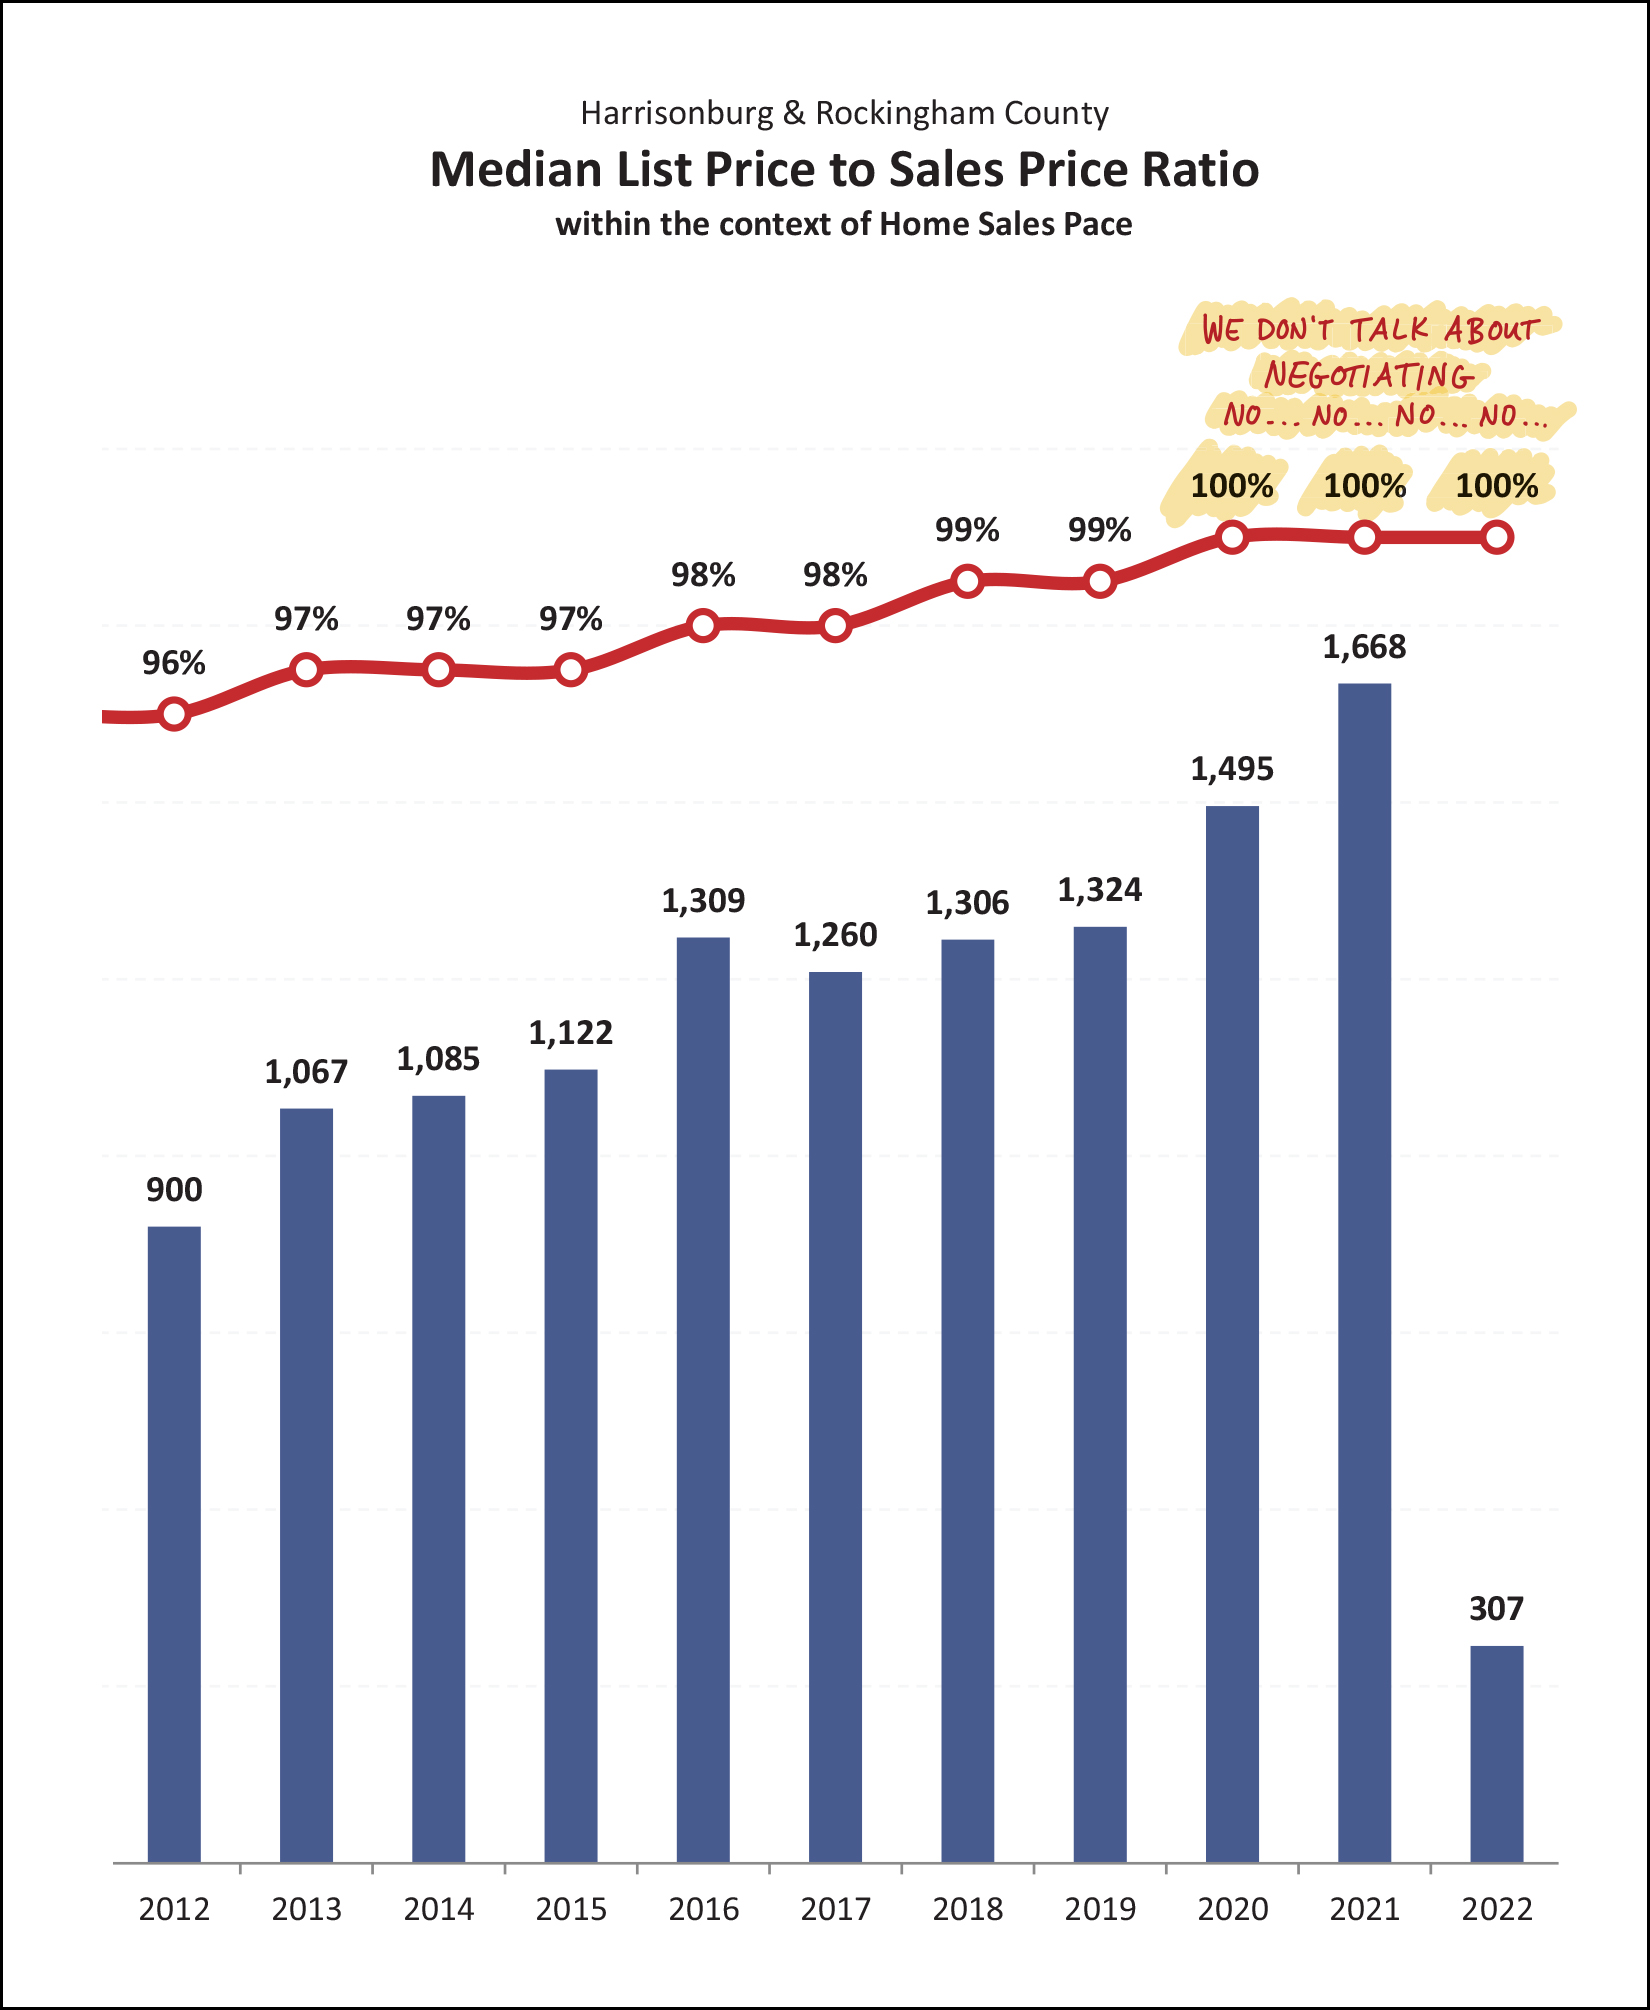 Indeed, buyers and sellers in today's market will tell you that there is very little negotiating happening on price... unless you consider going well above the list price as negotiating. I listed three homes for sale last week... we had three offers on one, three offers on the second, and seven offers on the third. All are selling for more than the list price. So, even if buyer activity in the overall market is declining slightly, that might be simply a result of fewer sellers selling... because the competition for each singular listing is still quite fierce. So, no, Buyer Bruno, we certainly don't talk about negotiating. Nice try, though. OK, this next graph is what I've alluded to a few times earlier... 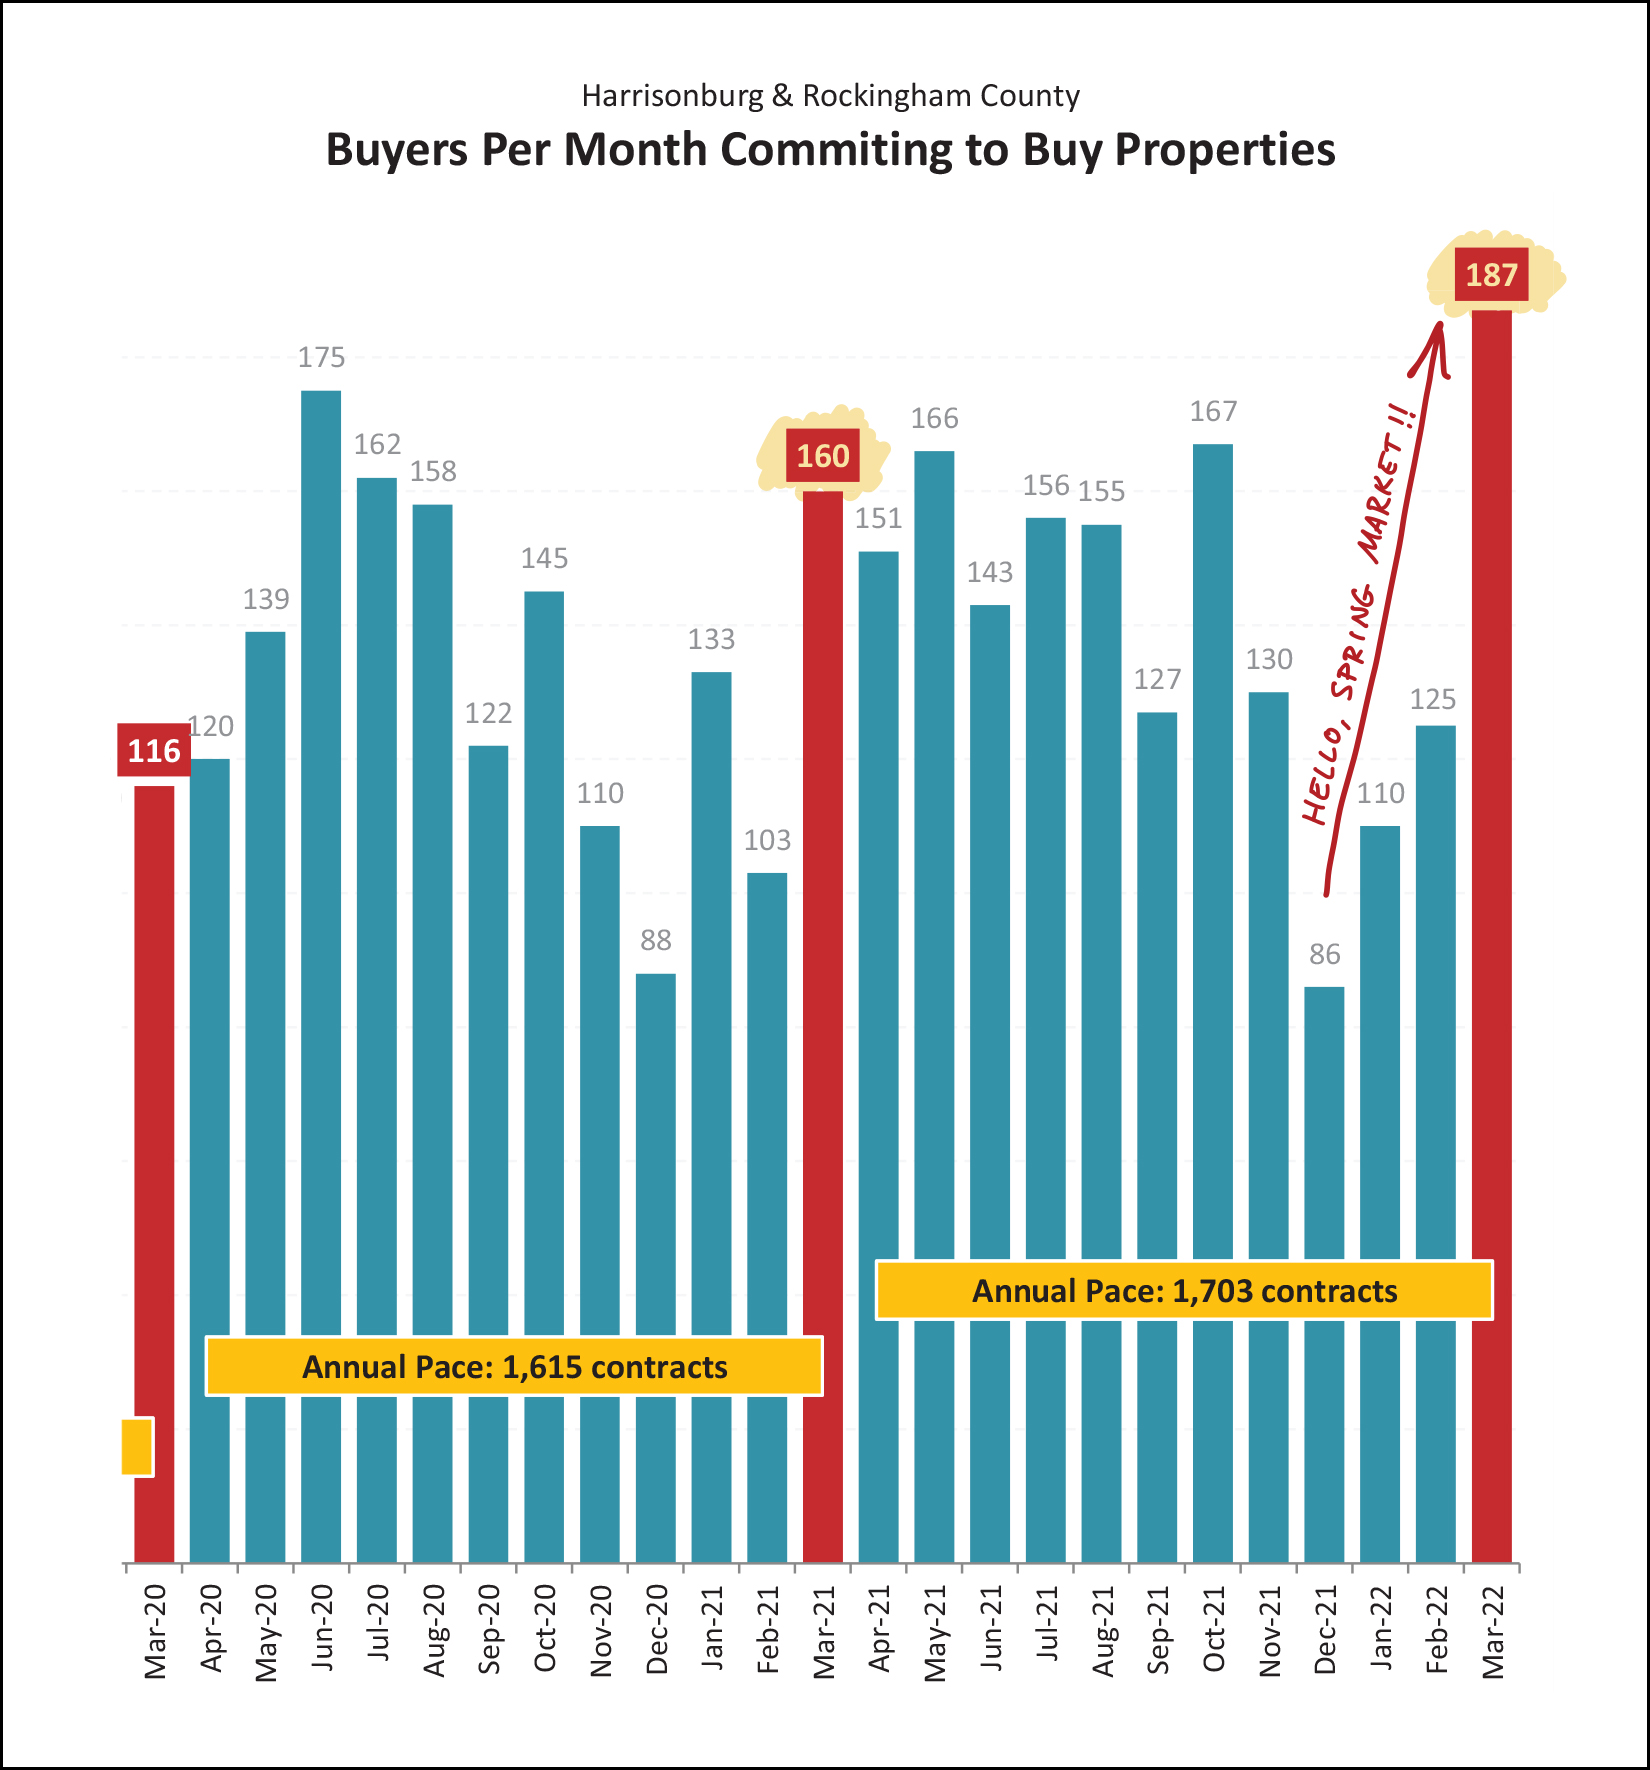 Yowzers! Contract activity was STRONG in March 2022! After a somewhat slow start to the year as far as buyer and sellers signing contracts to buy and sell... things took off in March! There were 187 contracts signed during March 2022, which was well above the 160 seen last March! And yes, as I alluded to a few times, this probably means we're going to see a rather strong month of closed sales in April. If that, indeed, happens, the slower month of March sales will then have quickly become a distant memory. Stay tuned. Maybe more buyers are buying (in March) because more sellers were willing to sell... 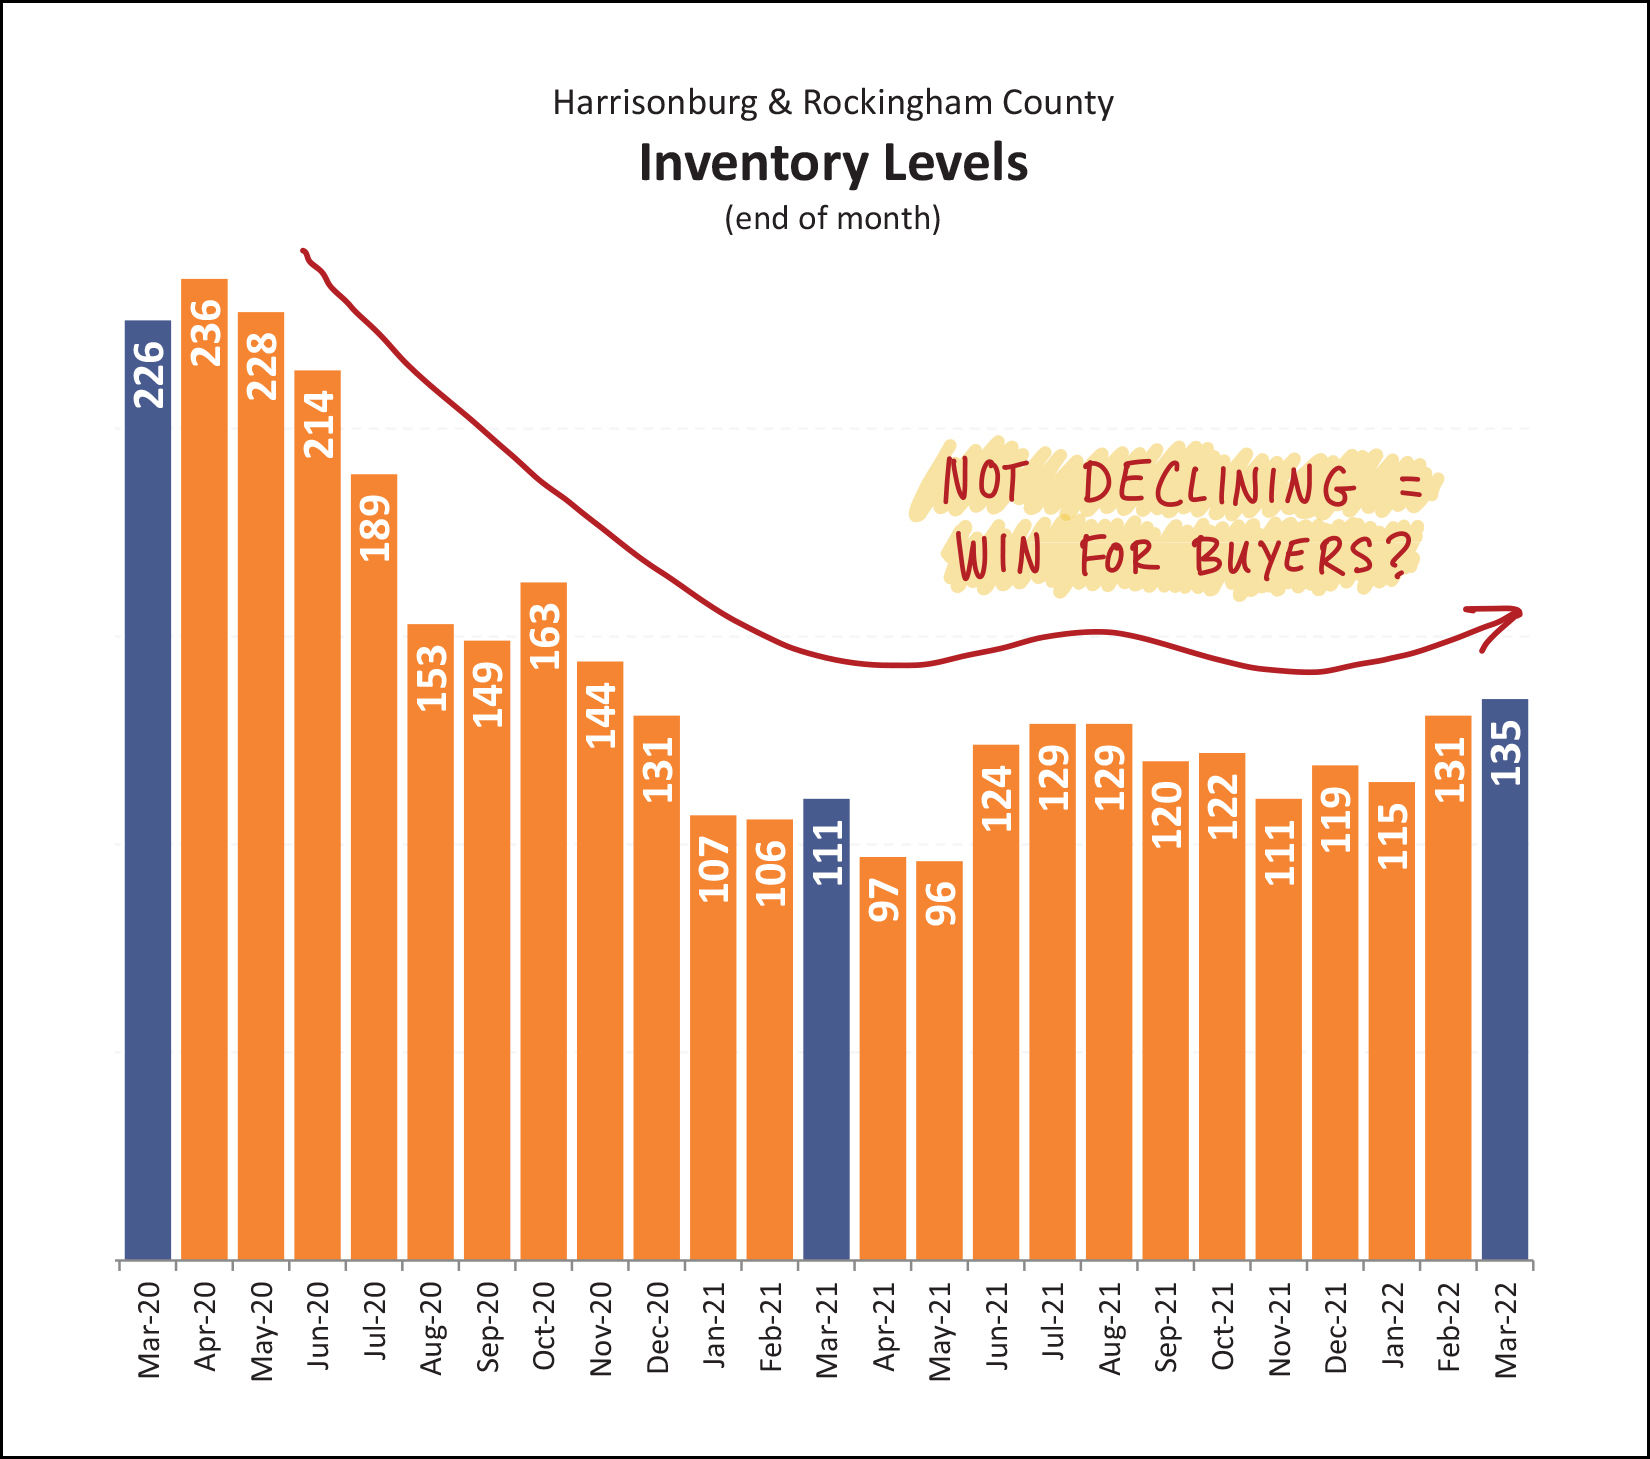 After many, many months of fewer and fewer homes for sale at any given time, we're finally seeing that metric staying stable and increasing ever so slightly. Maybe this is a win for buyers... at least inventory levels didn't drop any further? Whatever we can do to encourage home buyers in this market, let's do it, because it can be a discouraging time to try to buy a home right now! Below is another picture of why it can be discouraging to try to buy right now... and I guess this one is a reverse plateau...oops, a valley!? 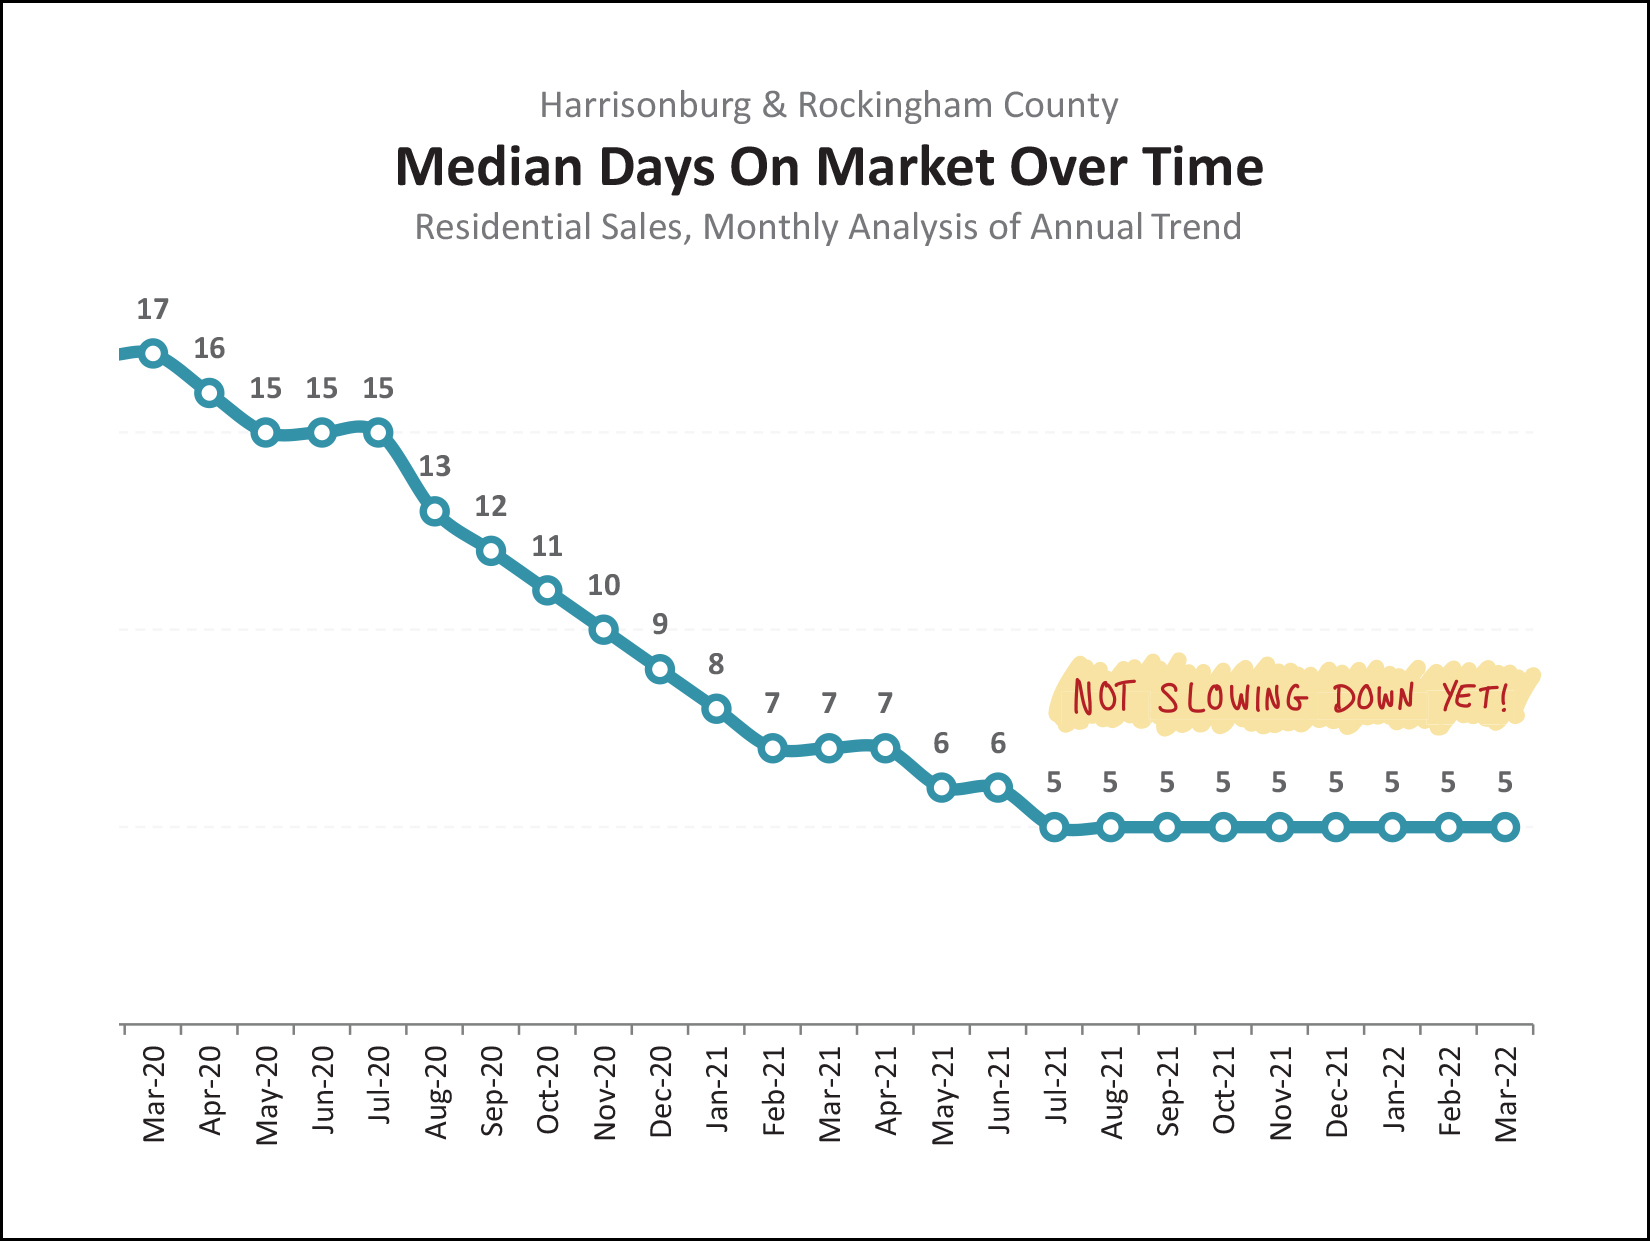 This chart is measuring the annual trend of how long it takes for homes to go under contract once they are listed for sale. That very last data point of "5" means that over the past 12 months the median "days on market" was five days. So, half of the homes that sold went under contract in five or fewer days. So, so fast! This makes it somewhat more difficult to be a thoughtful, intentional, deliberate home buyer, because you are going to need to make a decision quickly!! And one last graph, that even shocked my Apple Pencil as I doodled on this month's graphs for you... 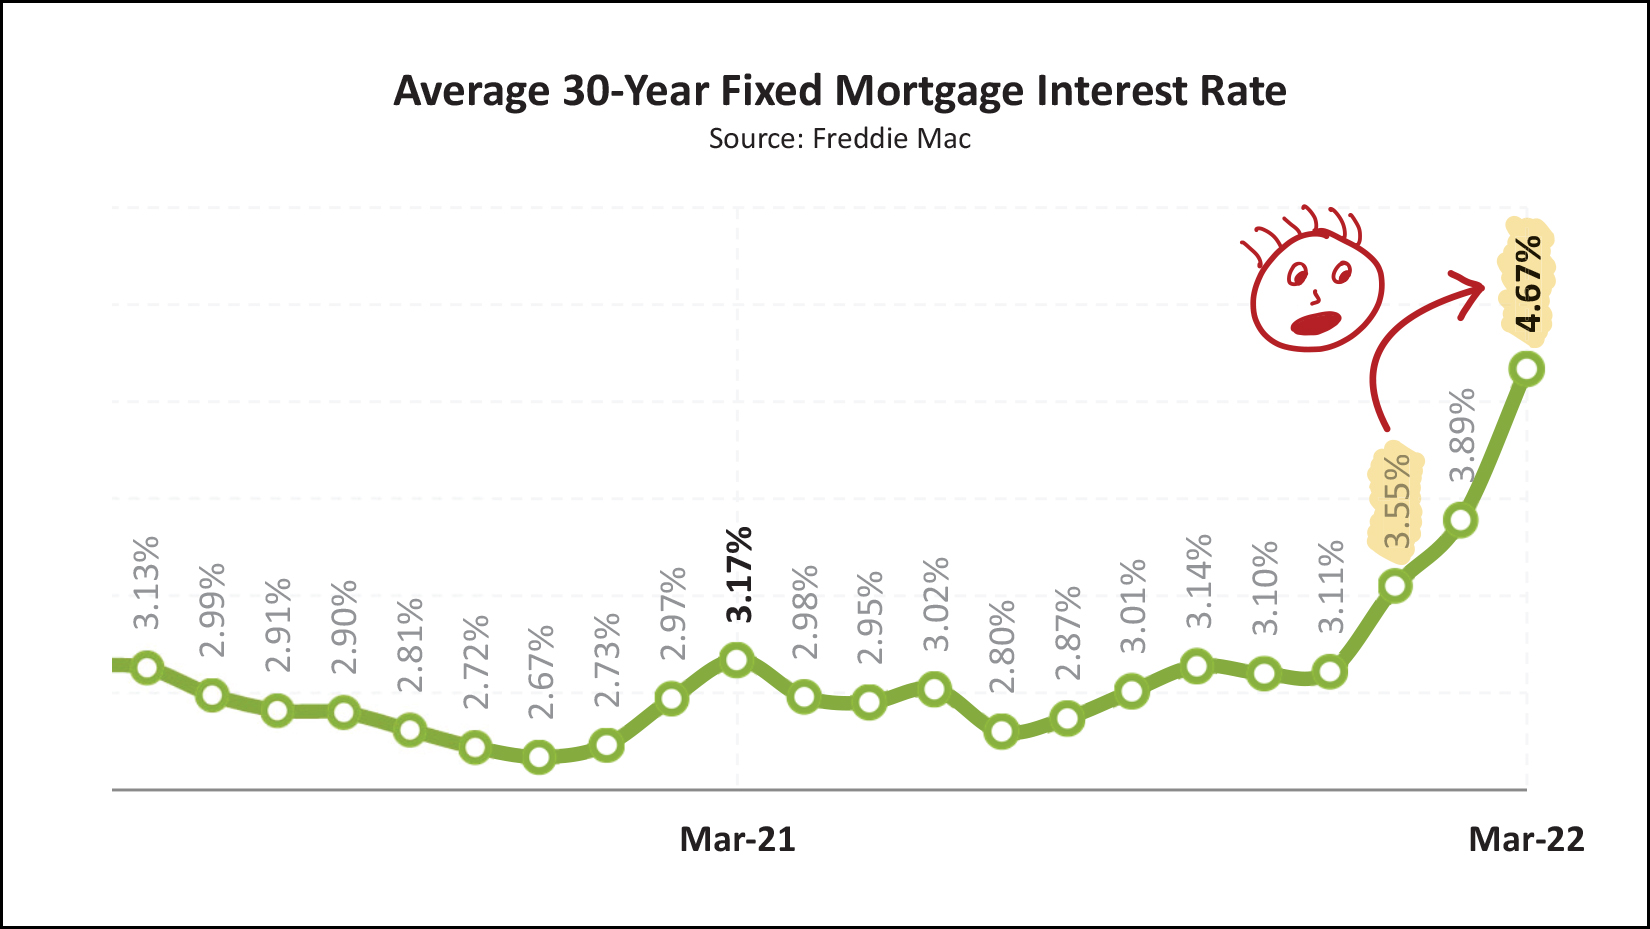 Yes, you are seeing that correctly. You can gasp as well if you'd like. Over the past two months, the average mortgage interest rate has risen from 3.55% to 4.67%. That was fast!?! For years now, I have incorrectly predicted that mortgage interest rates would really start to increase soon. As we entered 2022 it became clear that the time had really could when we would see rates start to increase... but I certainly wasn't expecting it to happen this quickly. Will rates push past 5% as we continue through the year? Will they stabilize between 4.5% and 5%? Any buyers who is hoping to buy in 2022 is carefully watching these rates as it relates to their potential monthly housing costs. OK! That brings us to the end of this month's recap of our local housing market. As you can see, there is a lot going on... home sales are slowing a bit, prices keep climbing, contracts are stronger than ever, interest rates are soaring... so much to watch as we move into the hustle and bustle of the spring market! Finally, some action items for you... [1] Go enjoy a meal at Vito's Italian Kitchen and take a friend, family member, or neighbor with you! [2] Are you preparing to sell your home this spring? Let's set up a time for me to swing by your house to walk through together and talk about house preparations, the market, the process and timing. Email me or call/text me at 540-578-0102 to get that process started. [3] Ready to buy? It can be done! Let's chat about what you hope to buy, and I can connect you with a few of my favorite lenders if you need some recommendations. Signing off now... reach out anytime if you need anything... and if you have a family member, friend, colleague or neighbor that is looking to buy or sell soon, feel free to send them my way. I'd be happy to help. | |
Home Sales Rise Again, Along With Prices, In February 2022 |
|
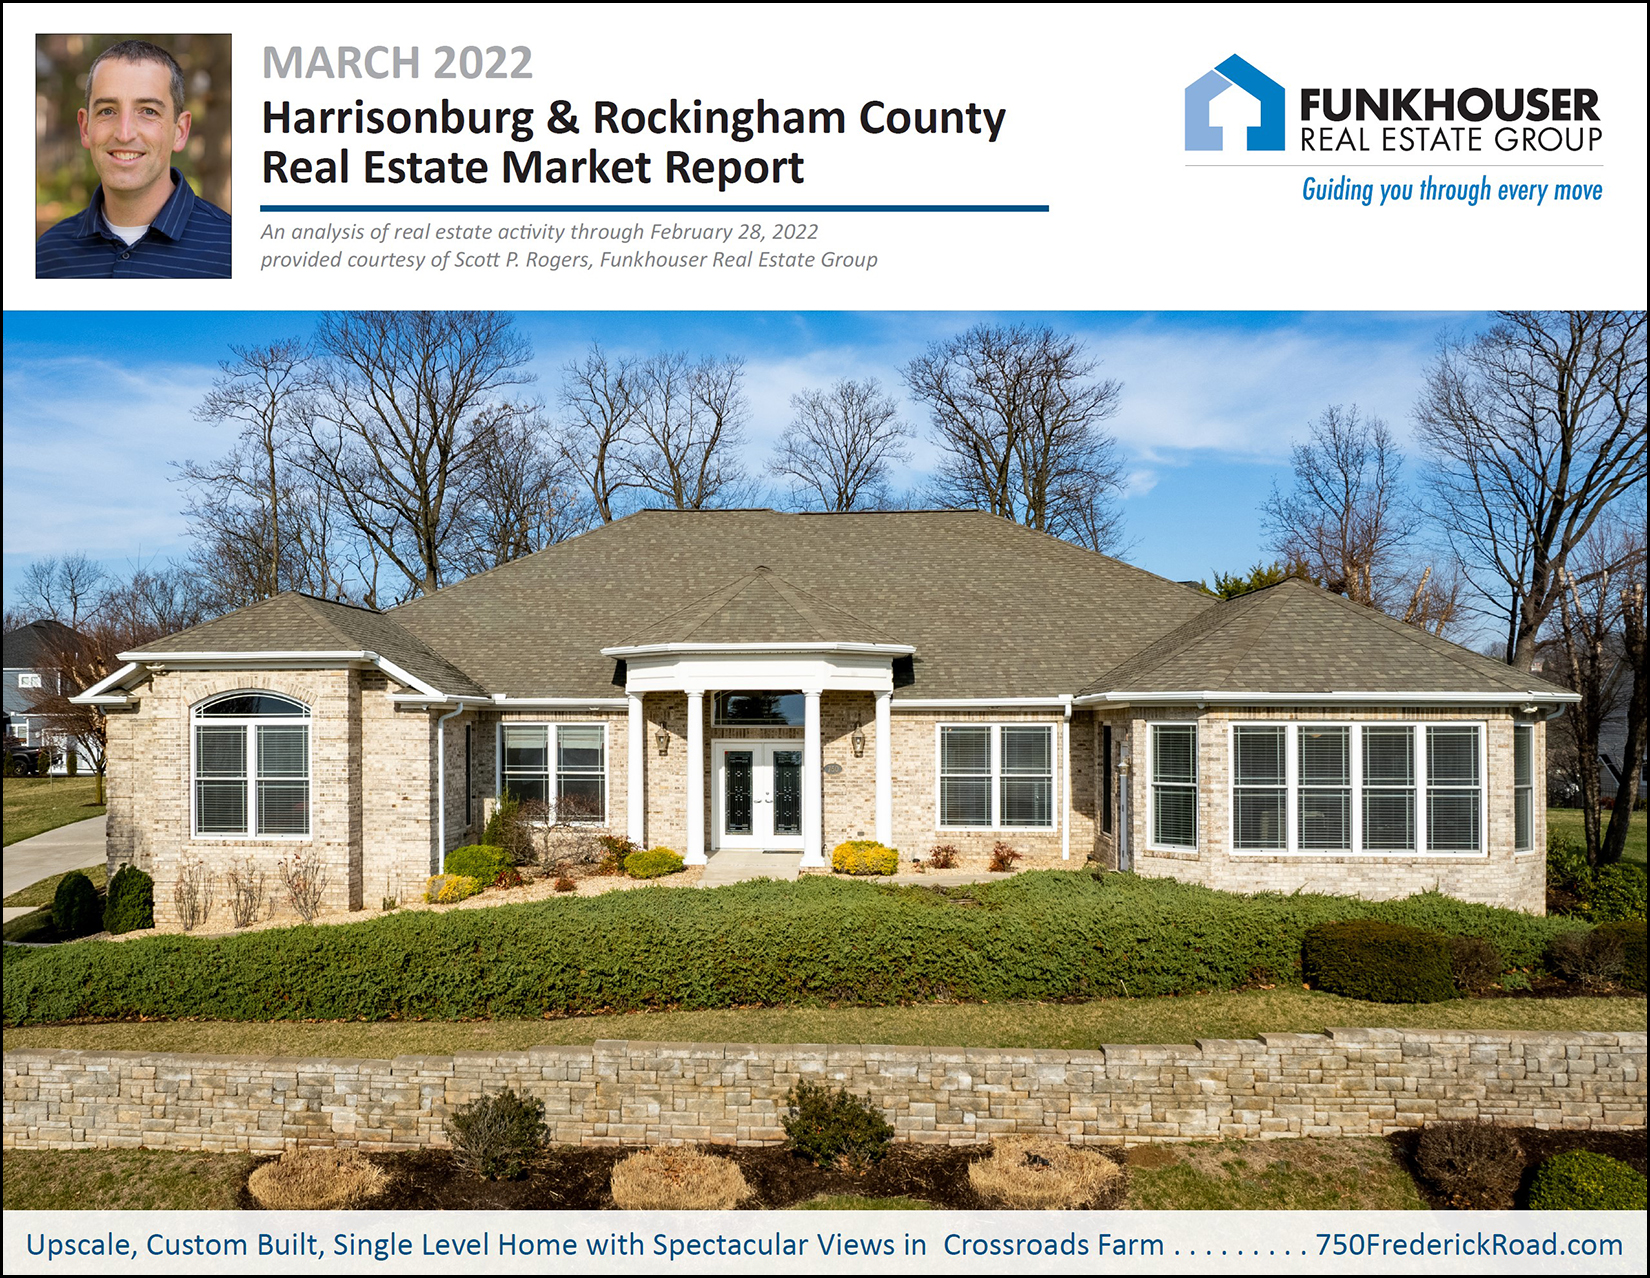 Happy Friday Morning, and for many of you, Happy (end of) Spring Break! I hope your week has gone well, whether you had a break or not. I was able to skip town for part of this week down to Virginia Beach where I was delighted to experience several beautiful sunrises like this one on Monday...  There sure is something relaxing about being near the water... and if the water (and air) were warmer, it probably would have been quite relaxing to be in the water as well! :-) Before I dive into this month's charts and graphs, a few quick notes... Check Out Magpie Diner... Each month in this space I'll be highlighting one of my favorite spots in the 'burg, or surrounding, where I enjoy dining, having a cup of coffee, etc. This month... it's Magpie Diner... a breakfast and lunch restaurant with a diner-inspired menu. If I'm at Magpie, I'll likely be having the french toast of the week with some scrambled eggs and a side of bacon. Yum! Have you checked out Magpie? If not, I highly recommend that you do so sometime this month. To make it even more fun, I'm giving away a $50 gift card to Magpie Diner. Enter your name/email here and I'll pick a winner in about a week. :-) Featured Home... The beautiful home pictured above is a custom built, single level home with amazing views from the top of Crossroads Farm. Check out additional photos and all of the details of this home by visiting 750FrederickRoad.com. Download All The Graphs... Some of you prefer to download the full slide deck of charts and graphs. You can do so here. Now, let's move on to the market data... 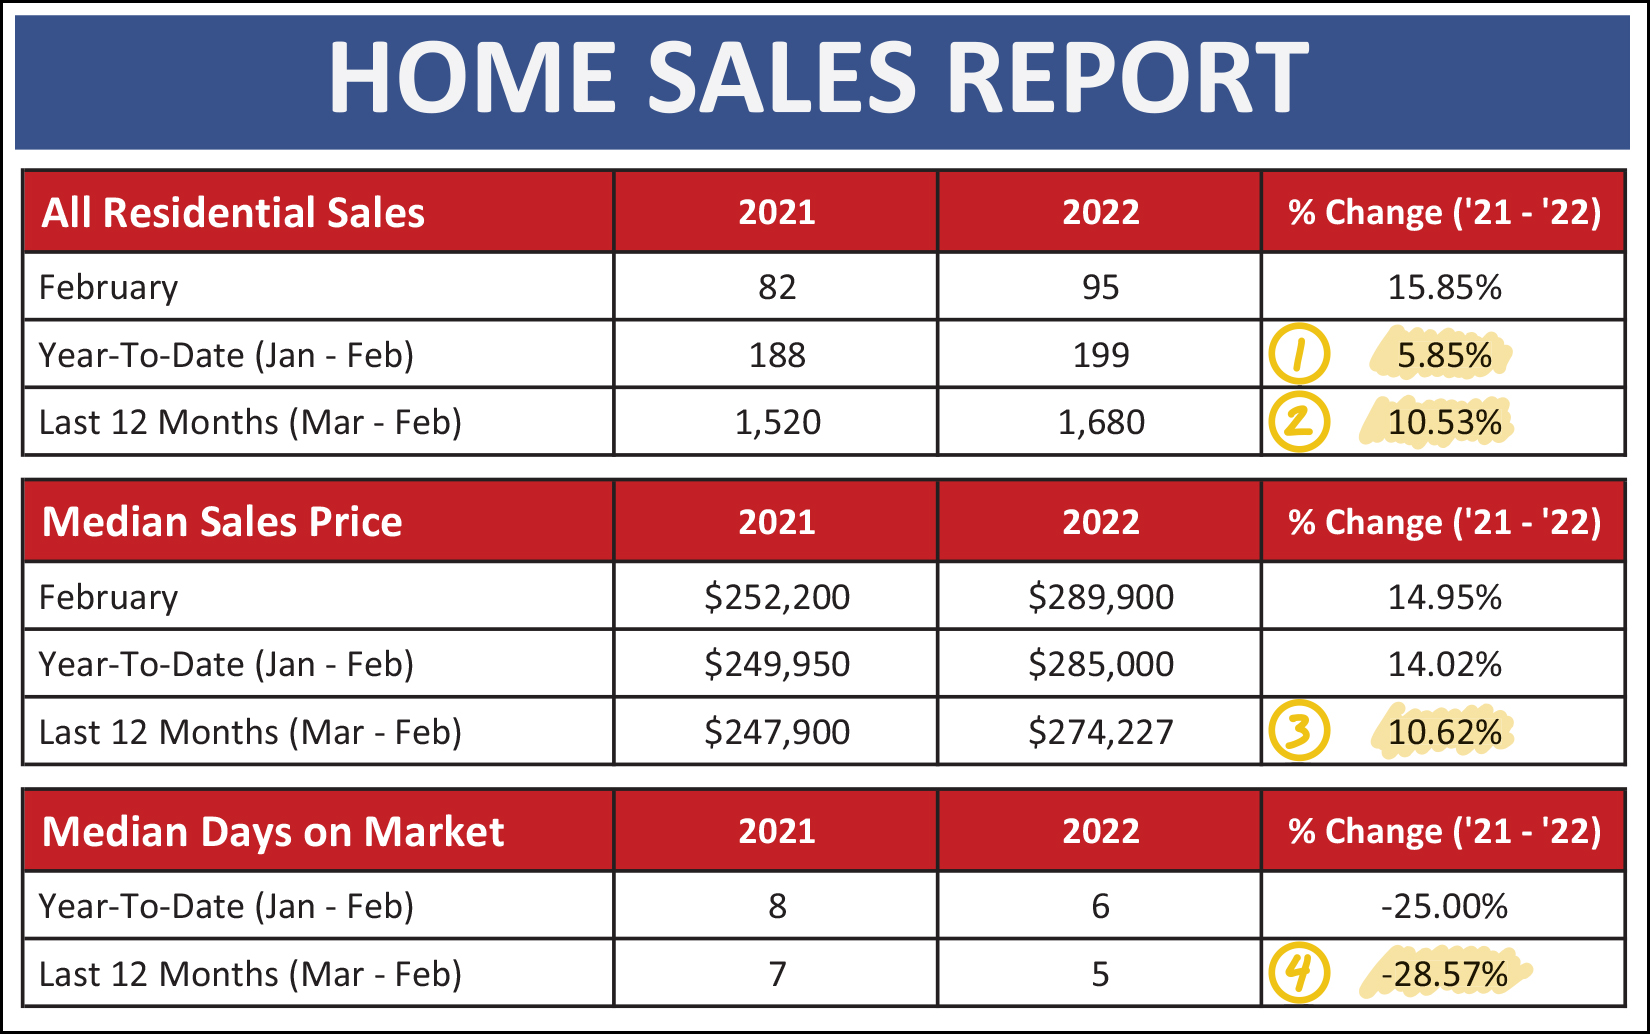 As shown above, things started getting busier in February... [1] There have been 199 home sales in Harrisonburg and Rockingham County thus far in 2022... which is a 5.85% increase from the same timeframe last year. [2] When looking at the past 12 months there have been 1,680 home sales in our local market, which is an even larger (10.53%) increase over the prior 12 months. [3] These increase in the quantity of home sales have been accompanied by an 11% increase in the median sales price over the past year. The median sales price of all homes sold in Harrisonburg and Rockingham County increased from $247,900 up to $274,227 in the last year alone! [4] If you thought homes couldn't sell any faster... you (and I) were wrong. The median "days on market" for Harrisonburg and Rockingham County has fallen 29% over the past year... from a median of seven days to a median of five days! But, despite these strong increases across the board... not all property types have seen the same changes over the past year... 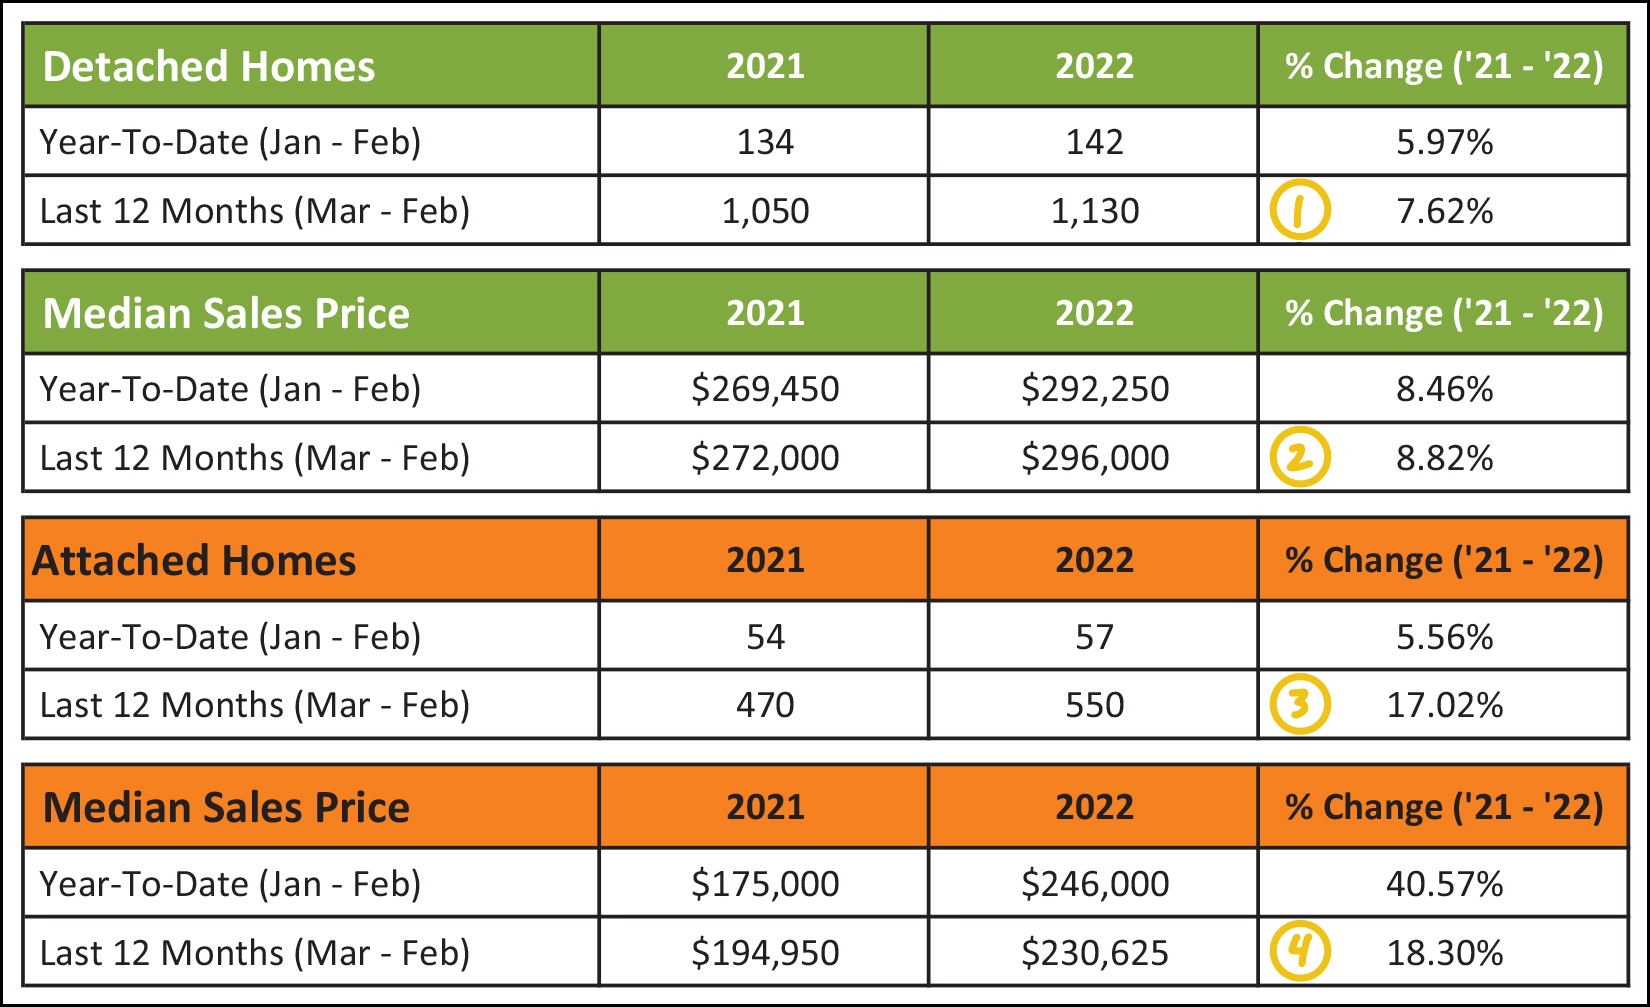 As shown above, the "attached" portion of the local market (townhomes, duplexes and condos) have seen a bigger boom over the past year than detached (single family) homes... [1] We have seen 8% more detached home sales in Harrisonburg and Rockingham County over the past year as compared to the prior year, while... [3] We have seen a much larger 17% increase in attached home sales during that same time. [2] The median sales price of detached homes has increased 9% over the past year, while... [4] The median sales price of attached homes has increased by 18% in a single year! So, it has certainly been a good time to sell (and a tough time to buy) a townhouse or duplex lately! Looking at the monthly "play by play" we can see that things started to get a bit spicy in February... 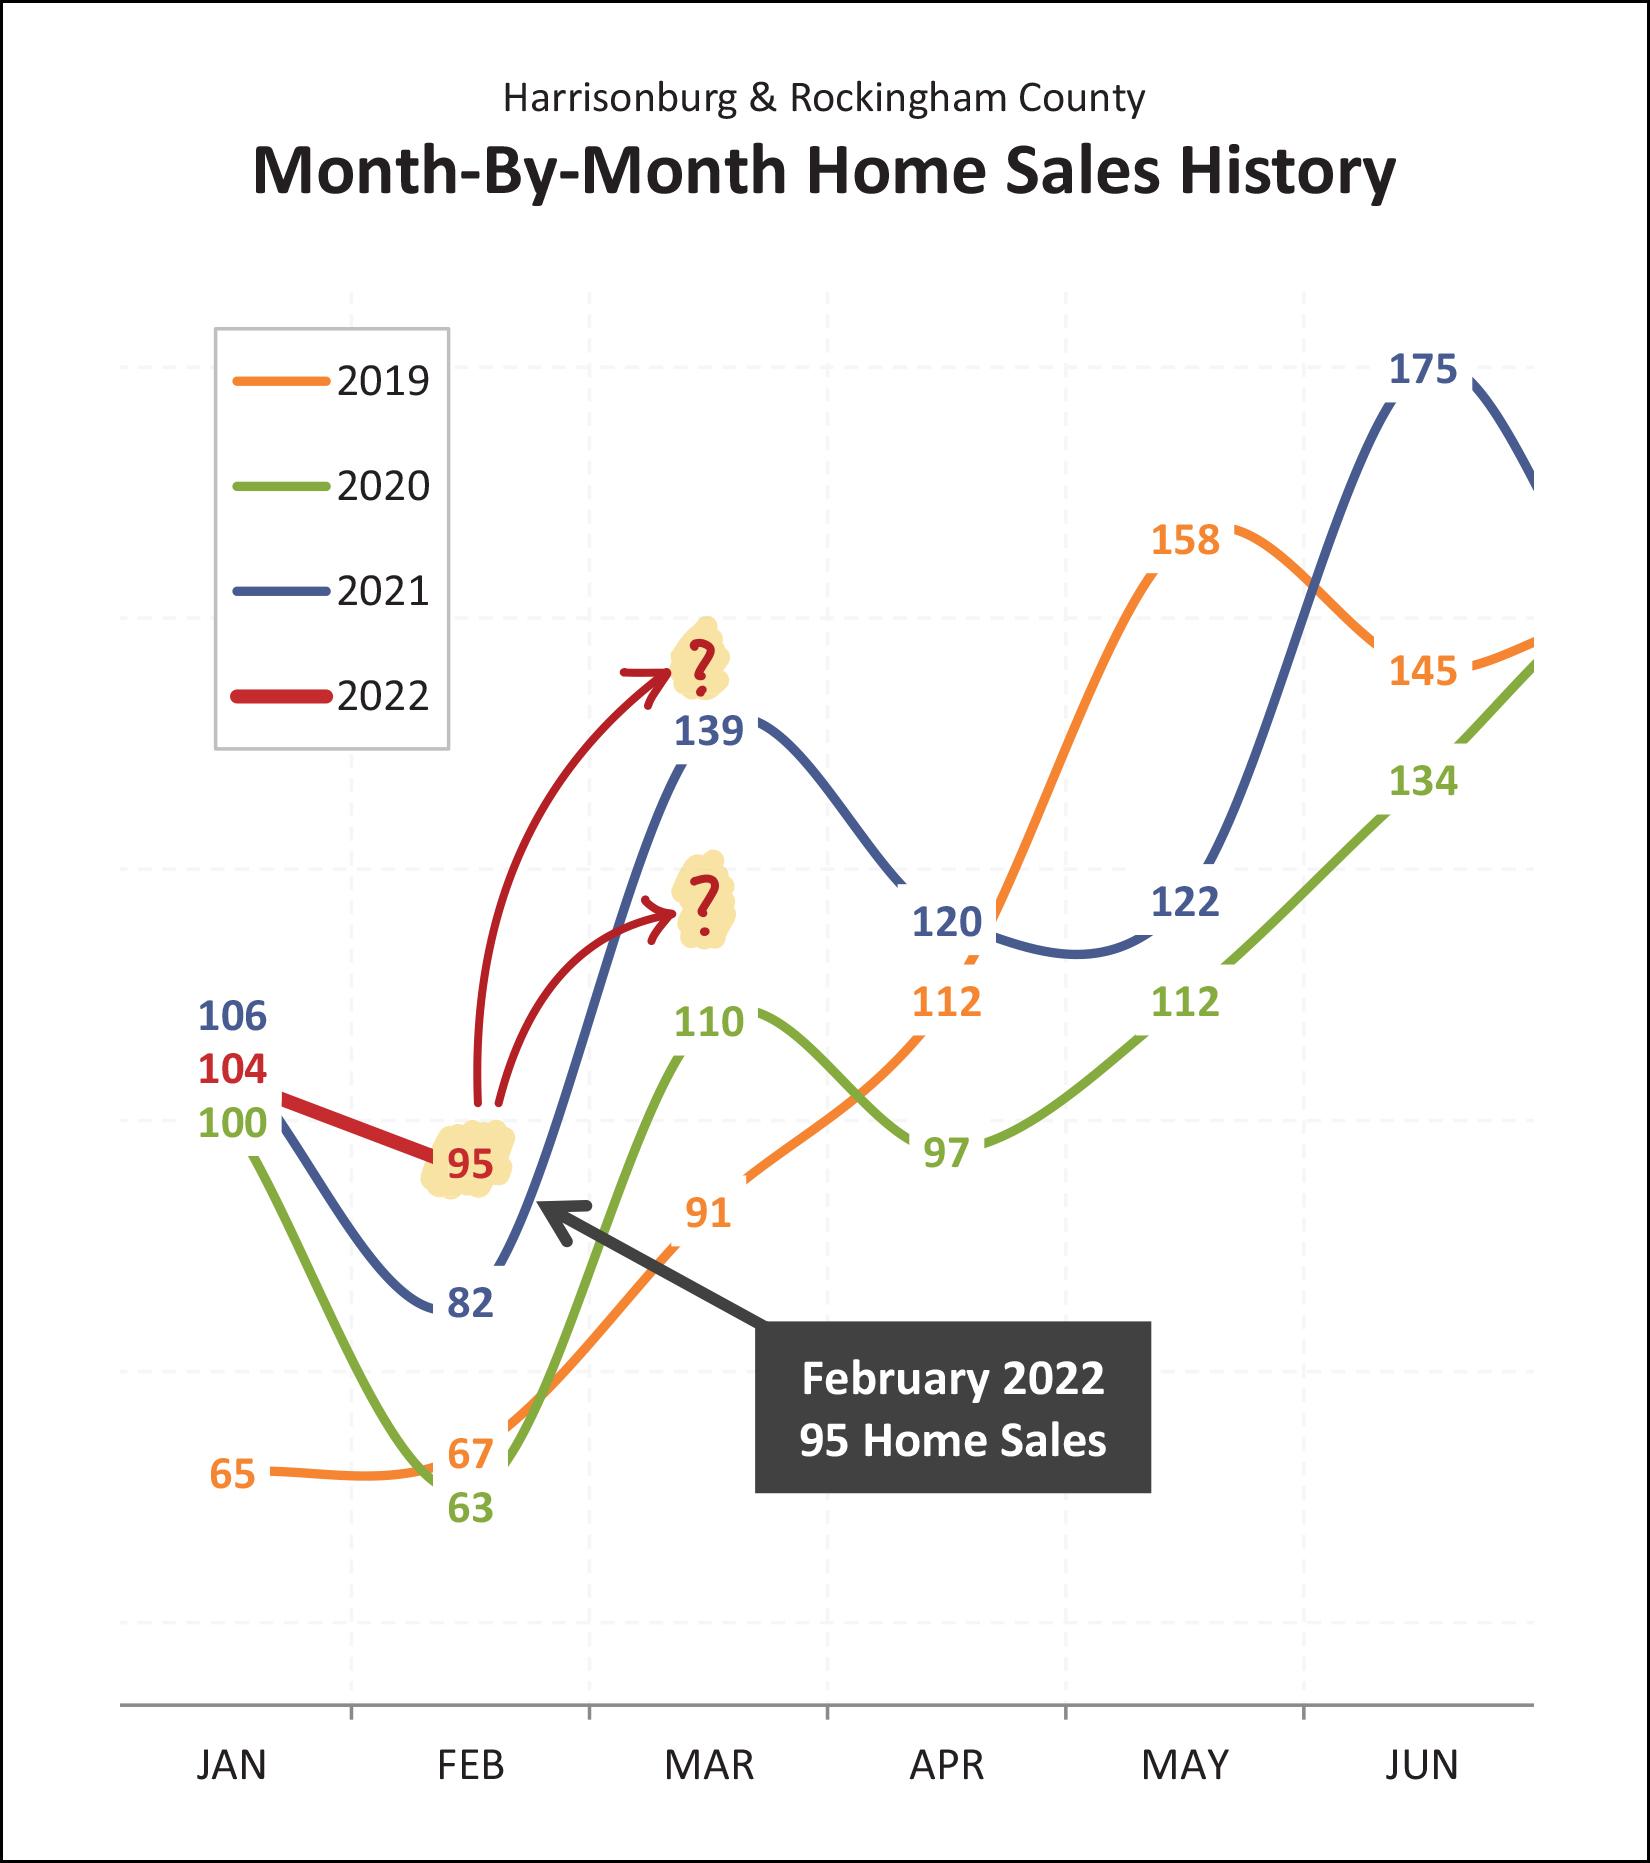 As you might notice, above, the 104 home sales we saw this January fell right in the middle of the pack for what we might have expected in a January. But... February was different. We saw 95 home sales this February which was well and above any other recent month of January. Where do we go from here? We'll know within the next few weeks as we finish out March. Will we be able to surpass last March's very, very active month with 139 home sales? Will we fall somewhere between March 2020 and March 2021? Stay tuned to find out. I know we're only two months into the year, but... 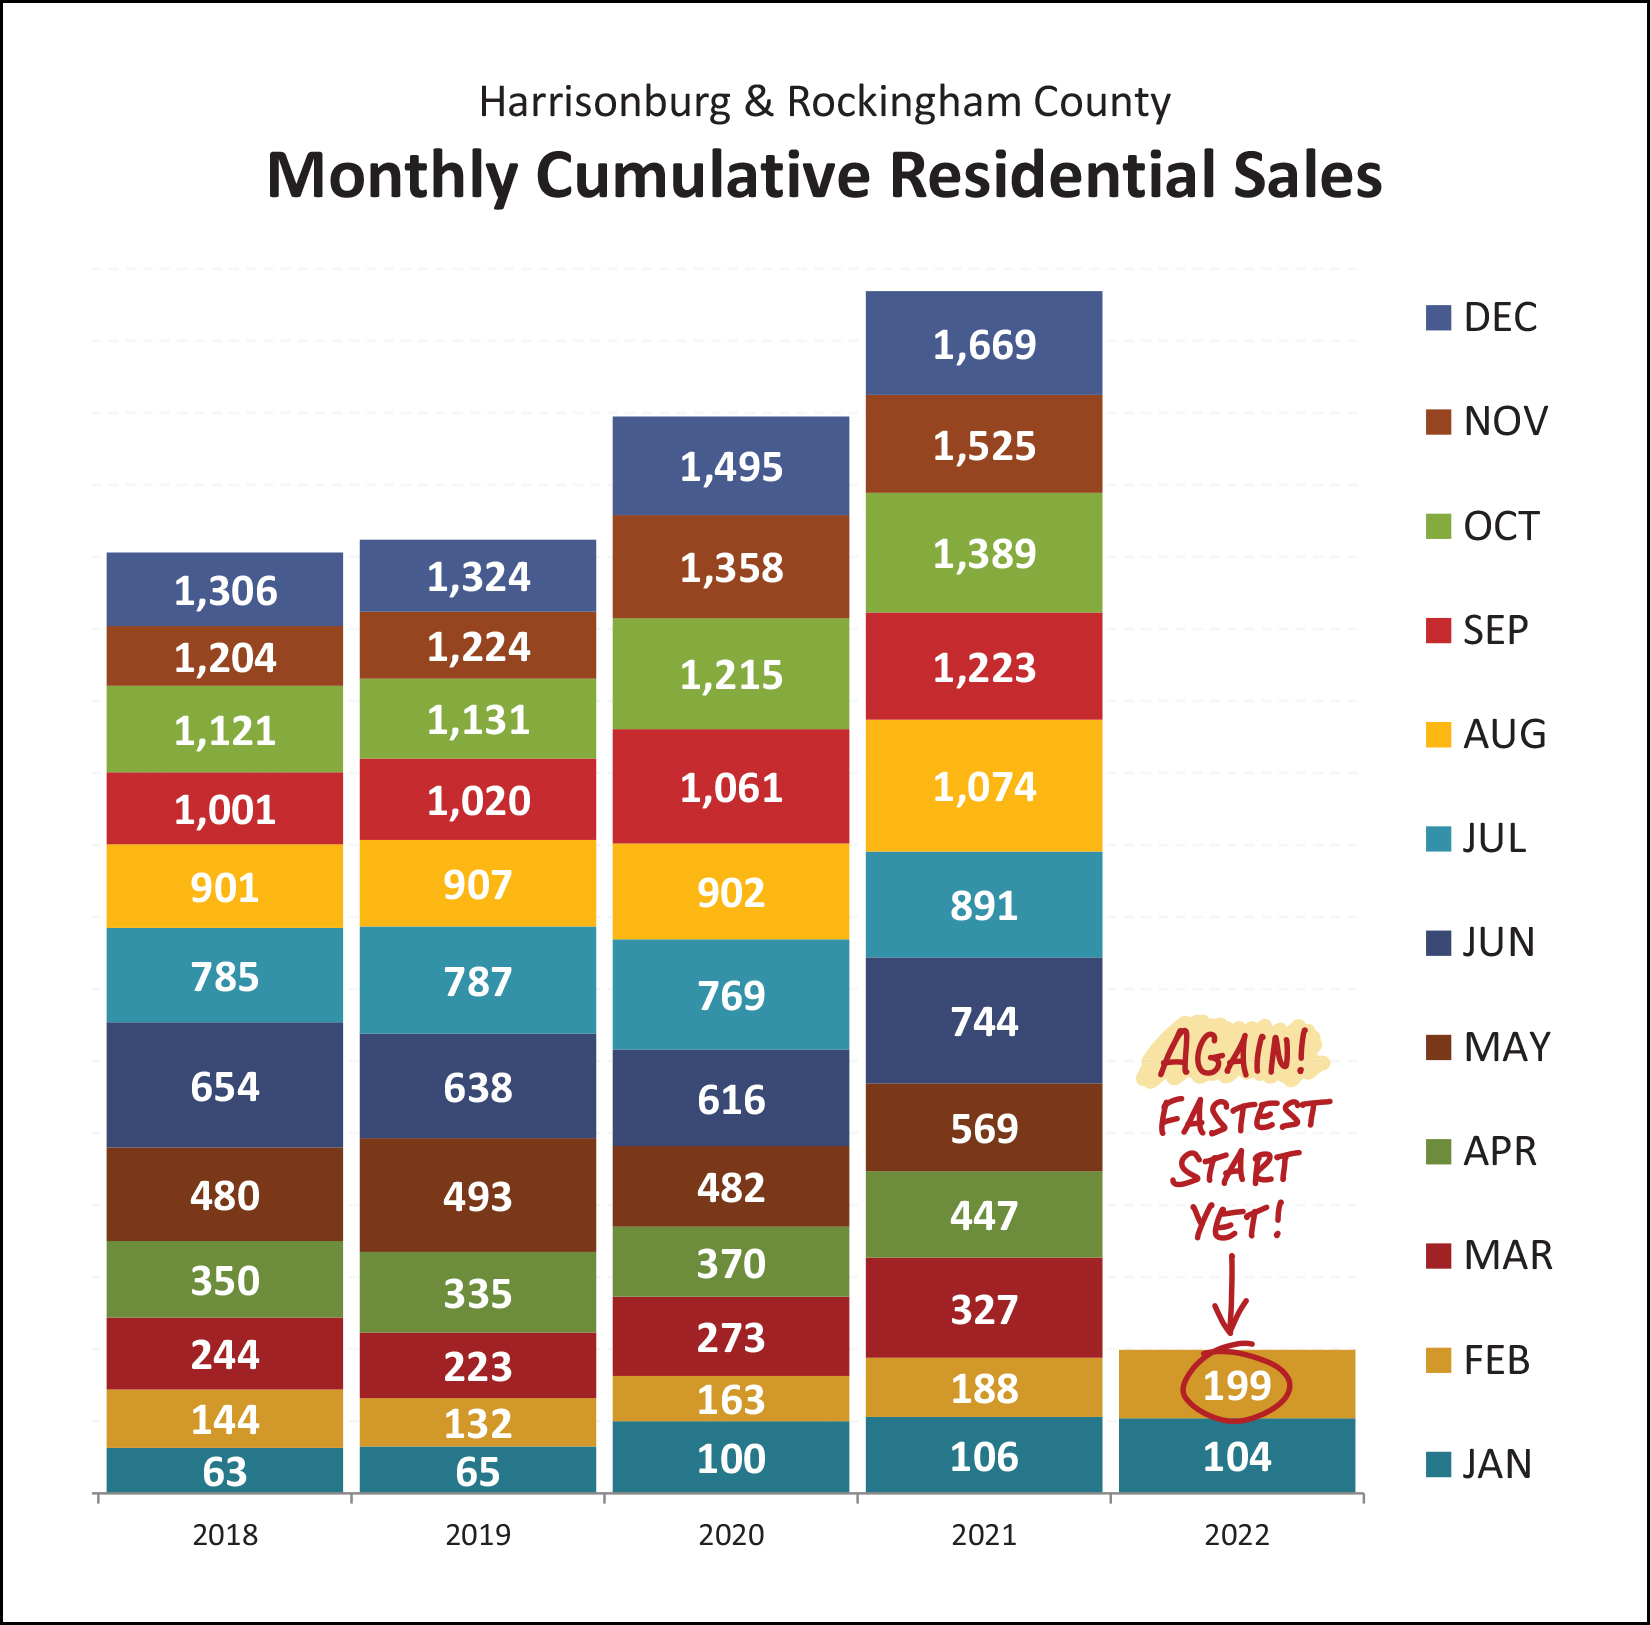 Yes, again, we are setting new records. In 2020, the 163 home sales see in January and February was the fastest start in many years. Then in 2021, I said the same about January and February with 188 home sales. And yet, here we are again, with 199 home sales in the first two months of the year, we seem poised to see another fast paced and highly active year in our local real estate market! Someone asked me recently if Covid had been a real drag on the local housing market. Yes, I said, for a few months... 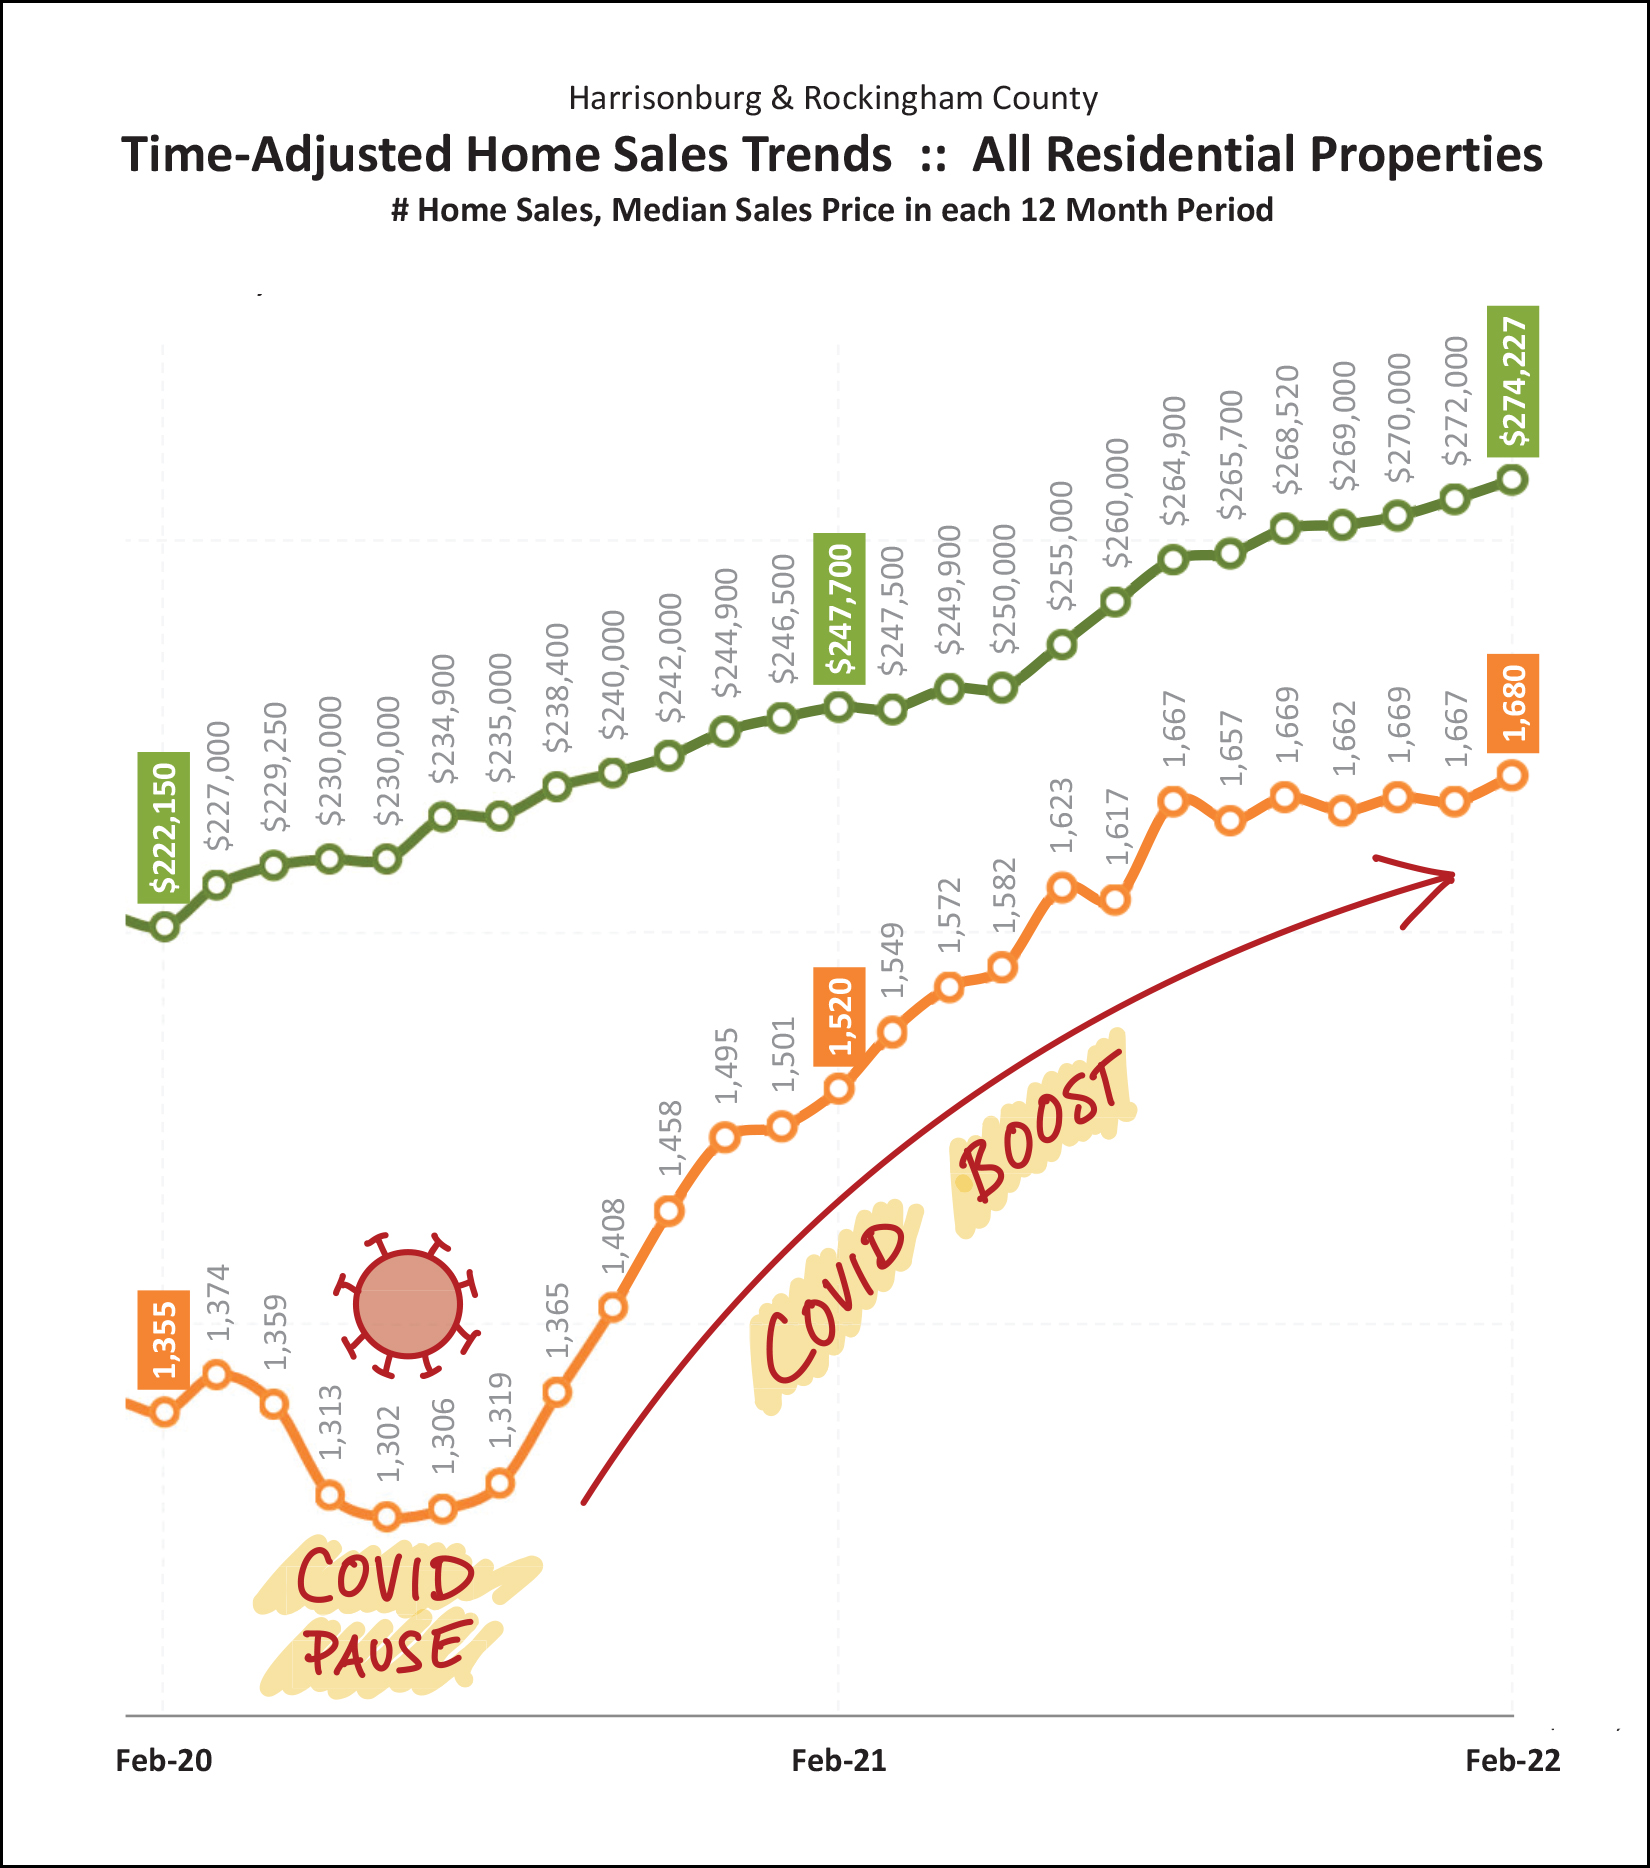 You'll notice on the graph above that Covid did seem to drag down the annual pace of home sales in early 2020... between April 2020 and September 2020. But then as we kept moving through fall 2020, and then into and through 2021, things just wouldn't let up. We saw month after month (with only a few exceptions) of stronger and stronger home sales. What caused this? At least some of it was, really, Covid. The place and space we call home became even more critical during the pandemic, and many folks found themselves living in homes that didn't work that well when all of a sudden they were working from home or had kids learning from home. So, "home" became even more important than ever -- causing plenty of homeowners to move to a new home. That, plus super low interest rates (to try to stabilize the economy), plus less discretionary spending, plus stimulus funds, all put more money in the bank accounts of would-be buyers, allowing many of them to jump on into the real estate market. Finally, an increasing number of people found themselves able to work from home... causing some folks to relocate to the Shenandoah Valley to work from a much more beautiful and relaxing place than they may have lived previously. As we continue to work our way through this pandemic that might eventually be considered an endemic, will we eventually see a flattening out or a decline in the pace of home sales in Harrisonburg and Rockingham County? I'm not convinced that we will. Alongside all of the factors referenced above, the overall population growth in this area persists based on employers expanding, local college graduates staying in the area, parents of local college graduates retiring to the area, and much more. I think it is relatively likely we will continue to see a similarly active local housing market over the next few years. OK... tangent over... back to the numbers. ;-) 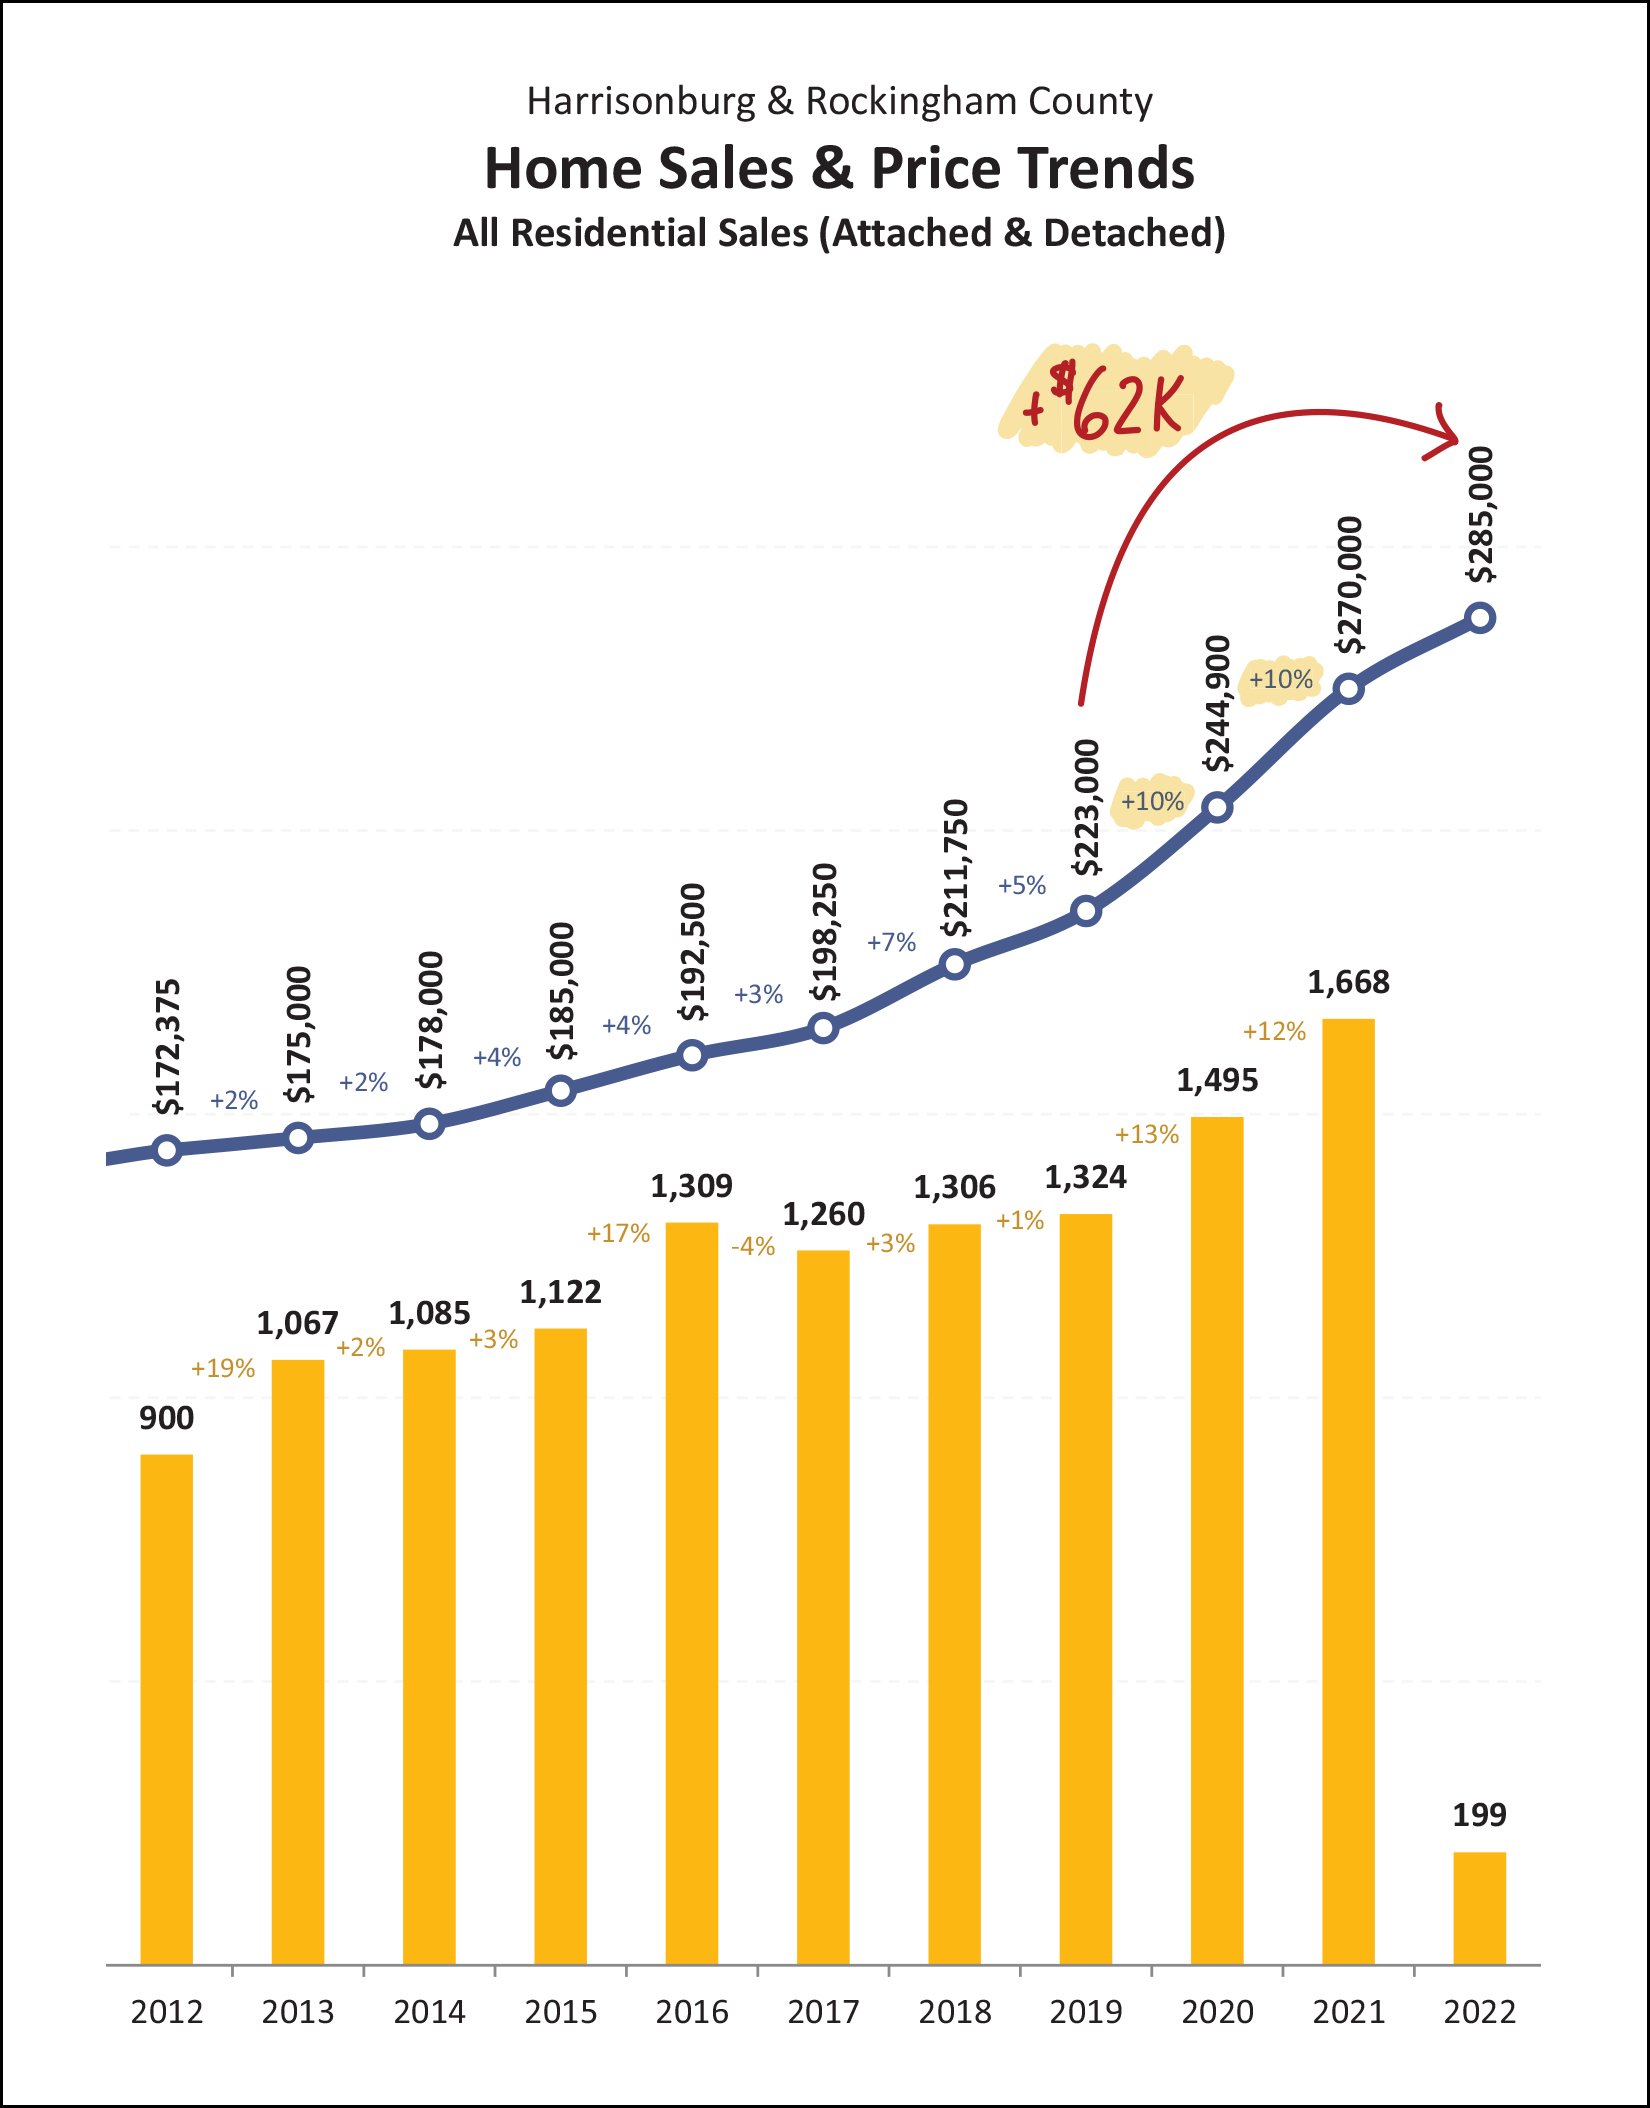 This graph is showing the overall trends in home sales (quantity) and median prices over the past few years. I included it this month to draw out the magnitude of the raw data... we have seen the median sales price increase $62,000 over the past three years! That's great news for sellers, and for homeowners, but certainly is not very welcomed news for home buyers who have not yet bought a home. We saw a 10% increase in the median sales price in 2020 and 2021. I'm not thinking the increase will be as large in 2022, but I do think the median sales price will increase yet again this year. 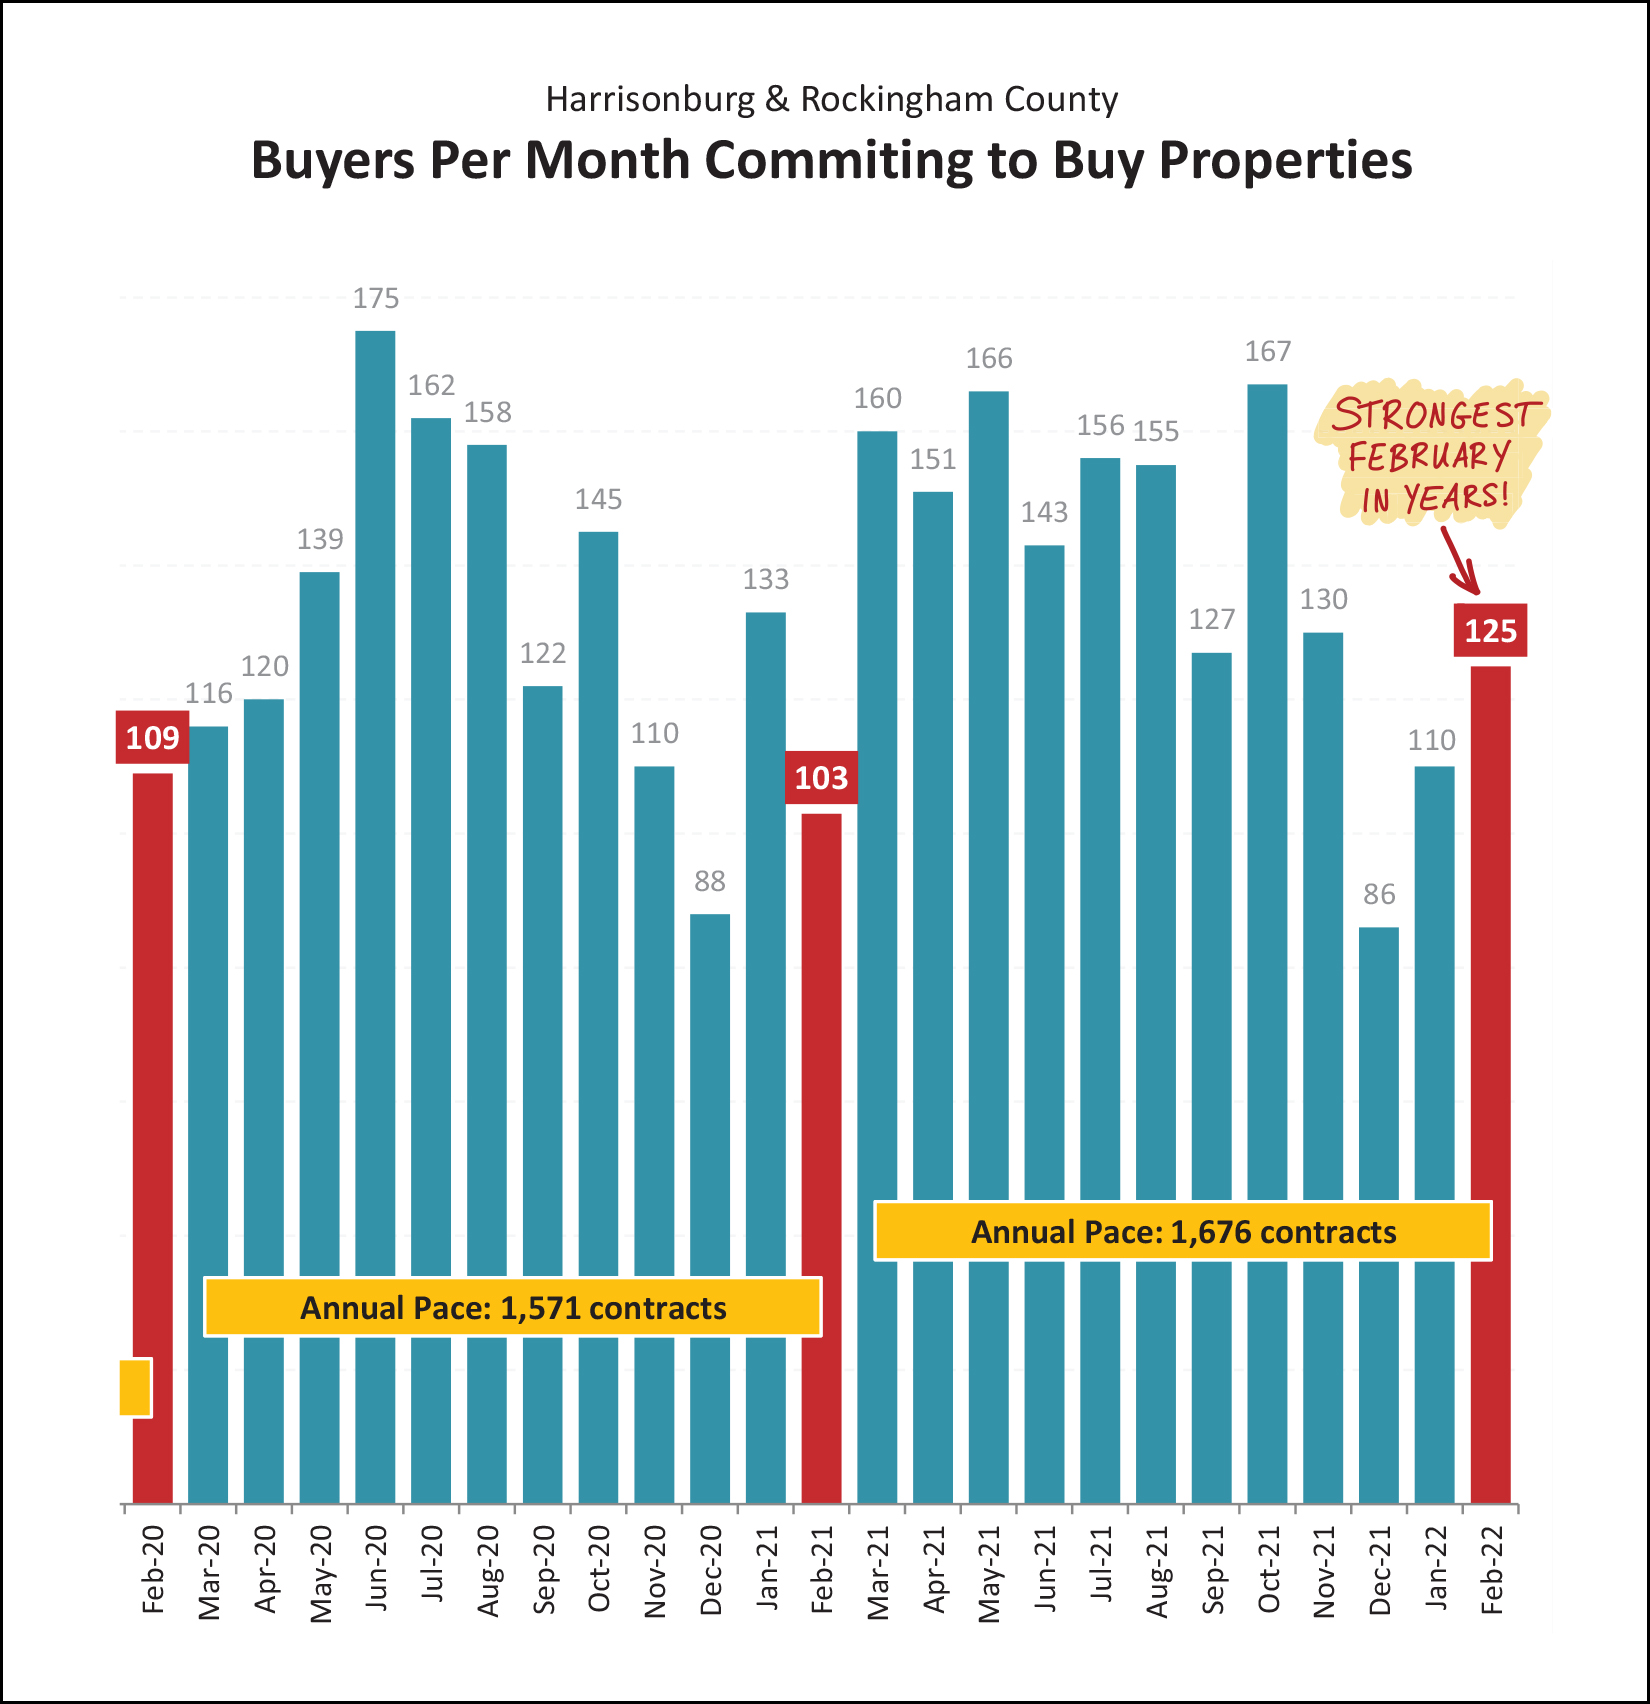 And where might the market be going from here, you might ask? Well... with a very strong month of contract activity in February (see above) it seems very likely that we'll see a strong month of closed sales in March. So, yes, we're about to enter the busiest time of the year... between March and August. Get ready! 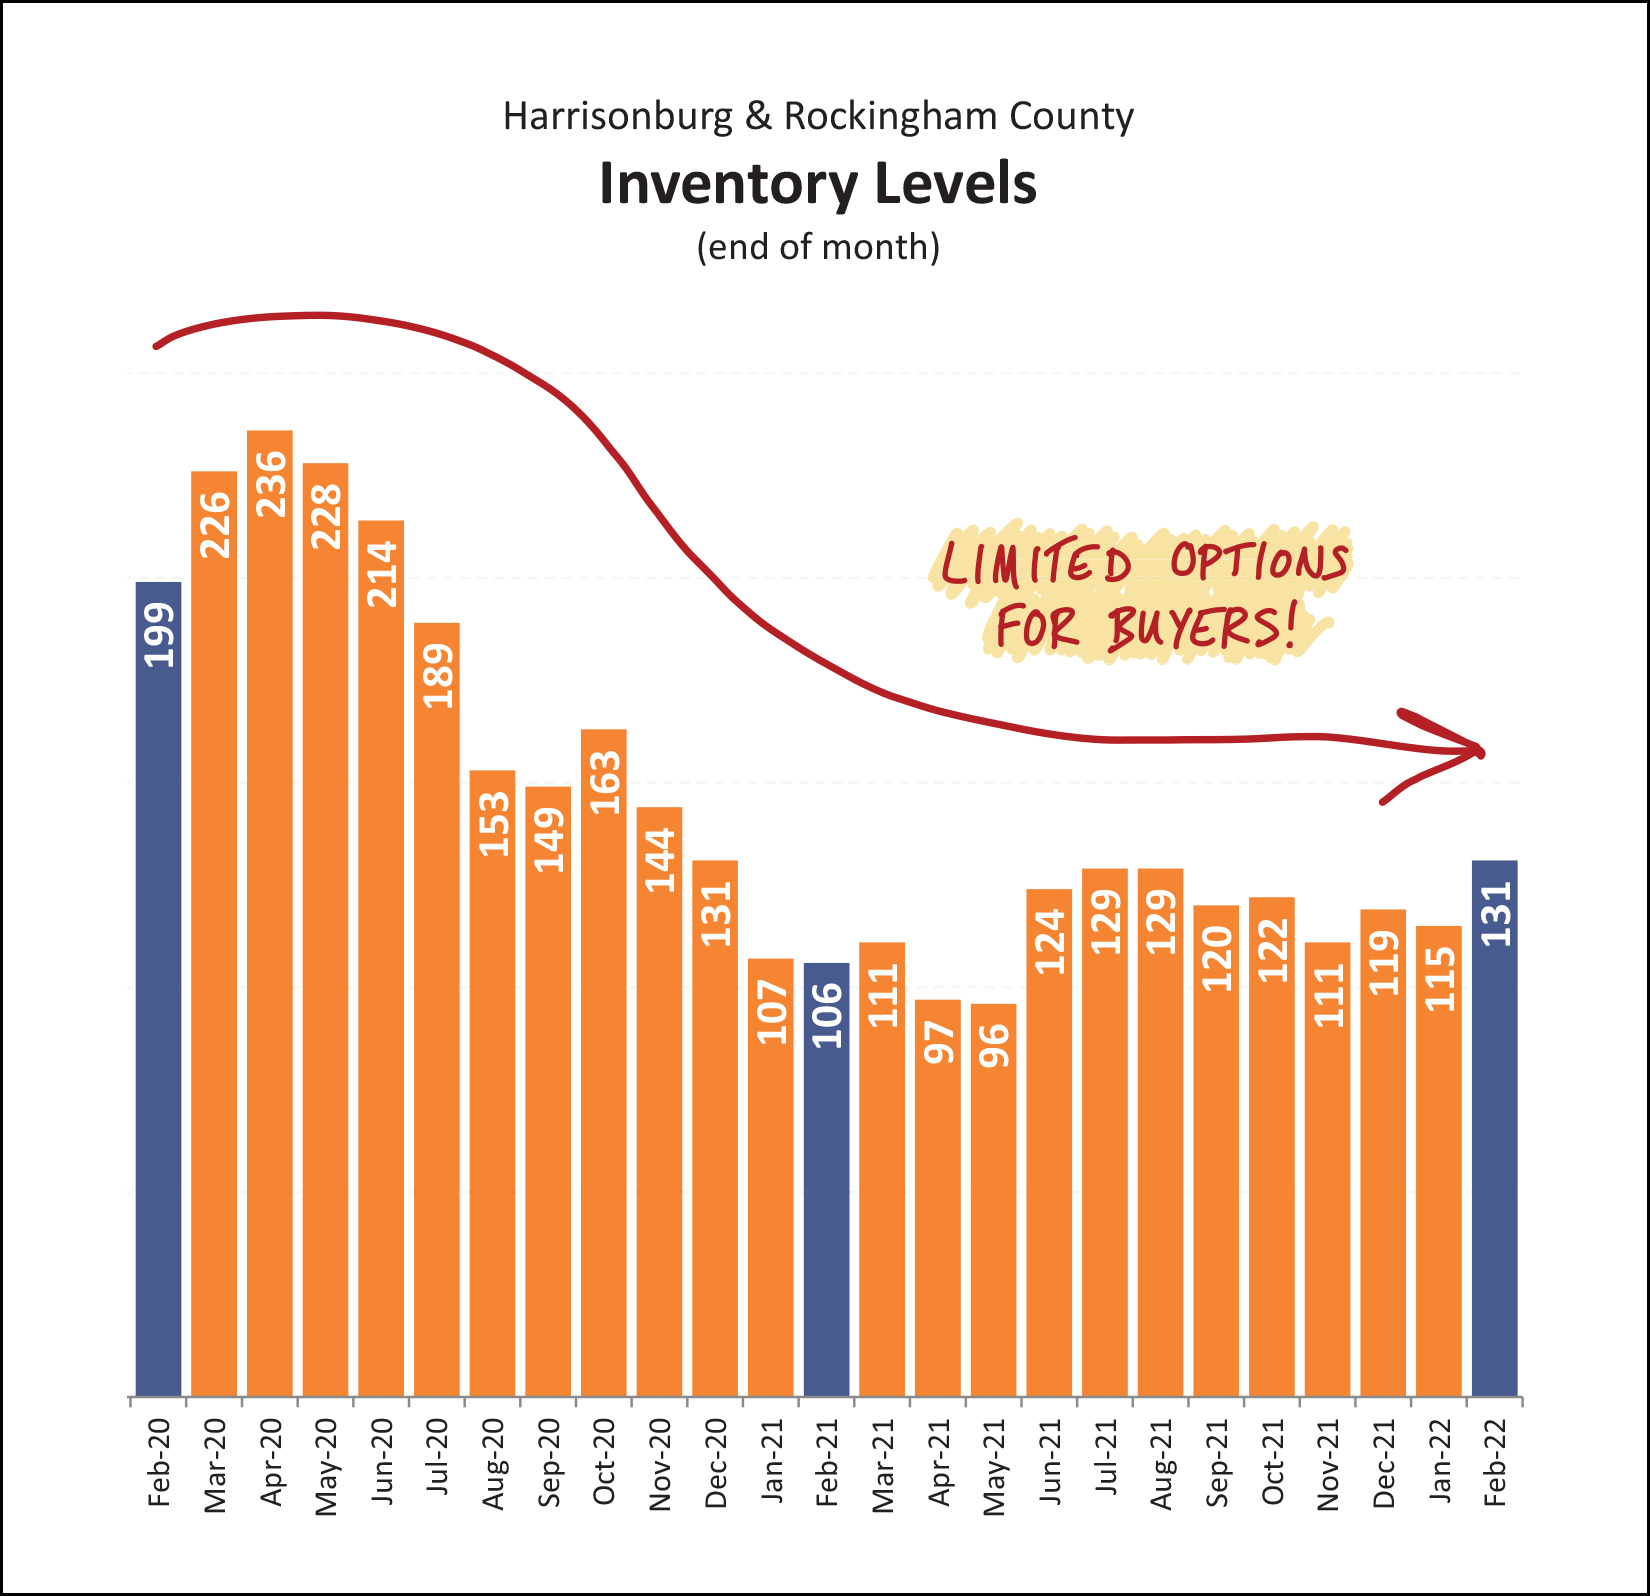 If you are hoping to buy a home soon, you might look at the graph above and get depressed by the low inventory levels. But... scroll back up to the previous graph for a moment and look at all of the contracts we usually see signed between March and August. Those buyers signing contracts (one could be you!) are almost all buyers signing contracts on homes that are listed for sale between March and August. So, while inventory levels at any given moment are not likely to increase over the next six months... there are almost positively going to be lots (and lots) of options of houses for you to buy over the next six months... or at least options of houses for which you can compete against lots of other eager home buyers. :-/ 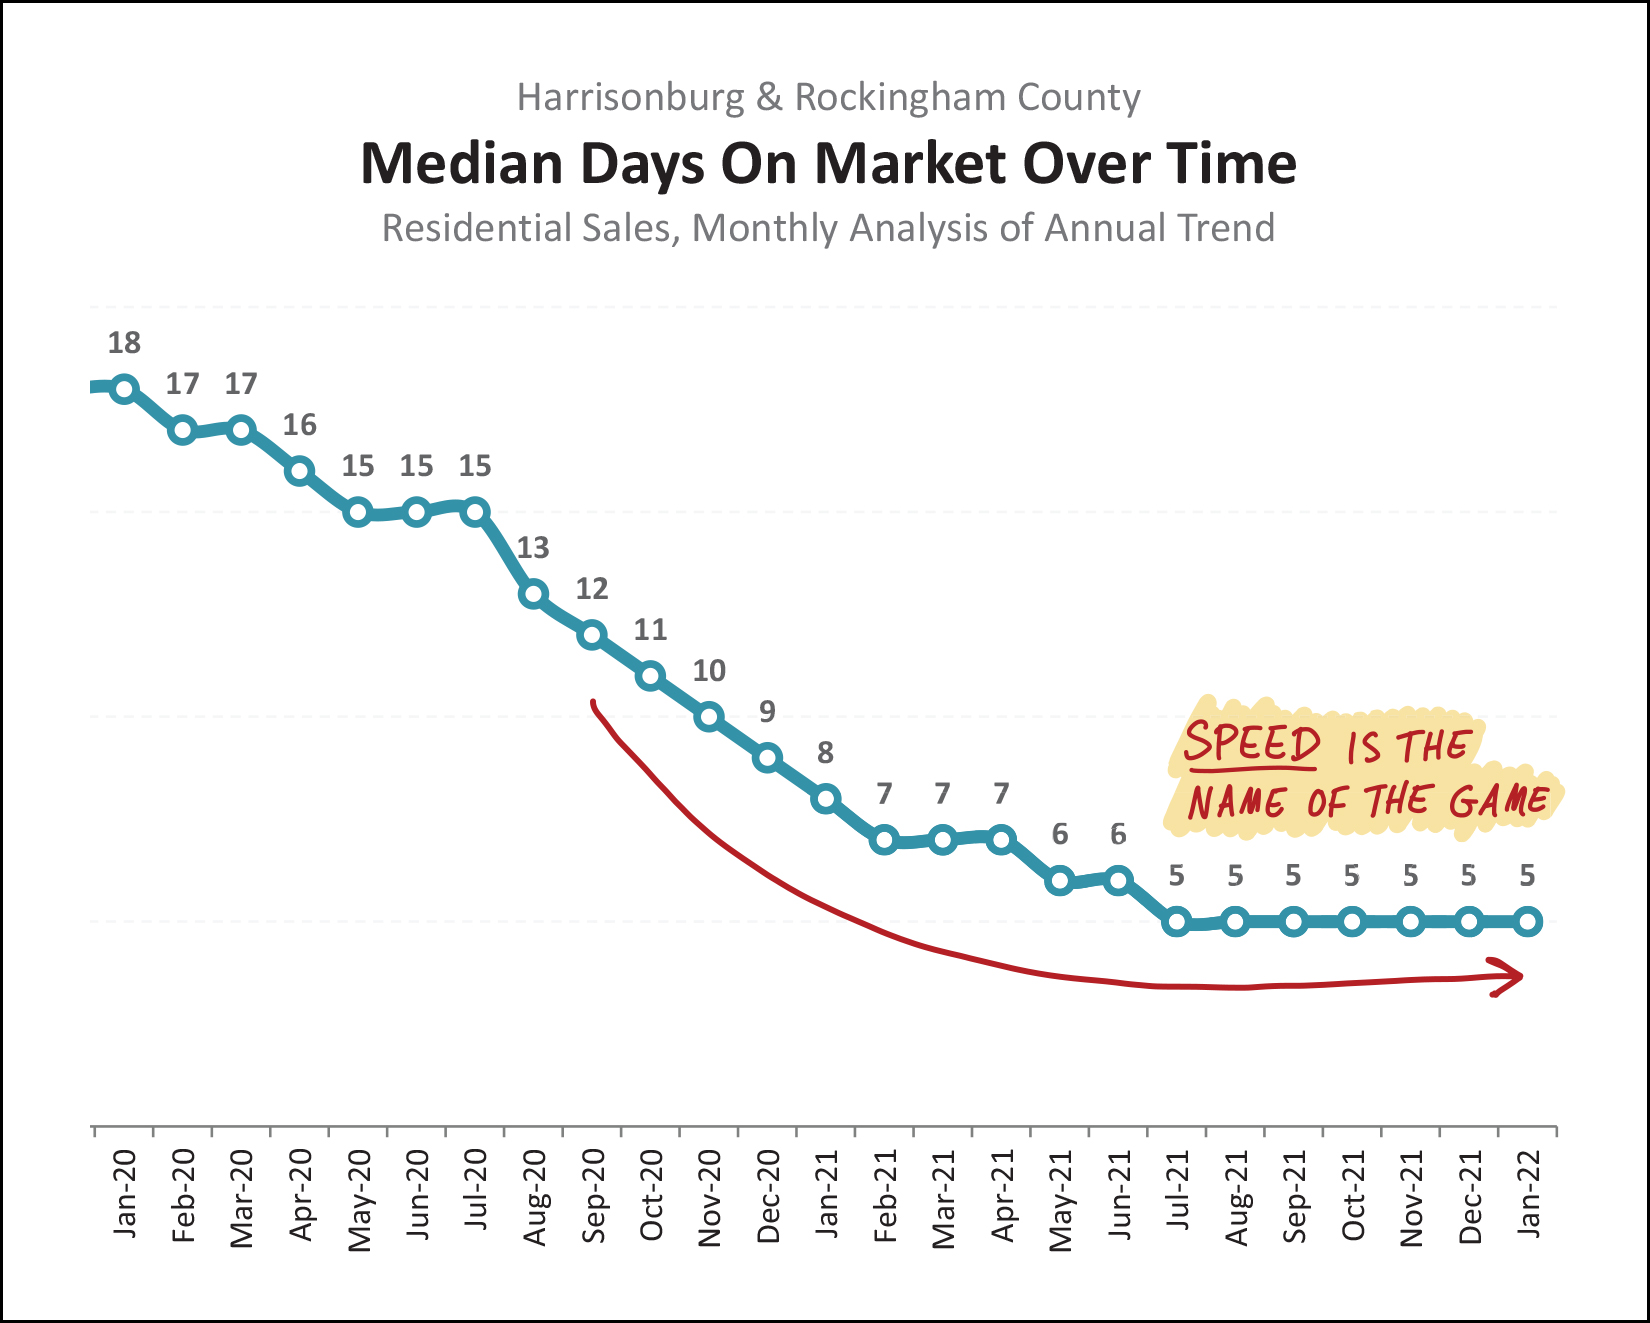 Indeed, the competition is fierce... and the market is moving quickly! The median "days on market" is five days right now... which means you need to go try to see any new listing of interest within the first day or two of when it hits the market for sale -- and you need to be ready to make an offer shortly thereafter if you are interested in buying that exciting new listing. Eventually we might (should?) see this metric start to increase a bit as the market slows... but we are definitely and assuredly not there yet. 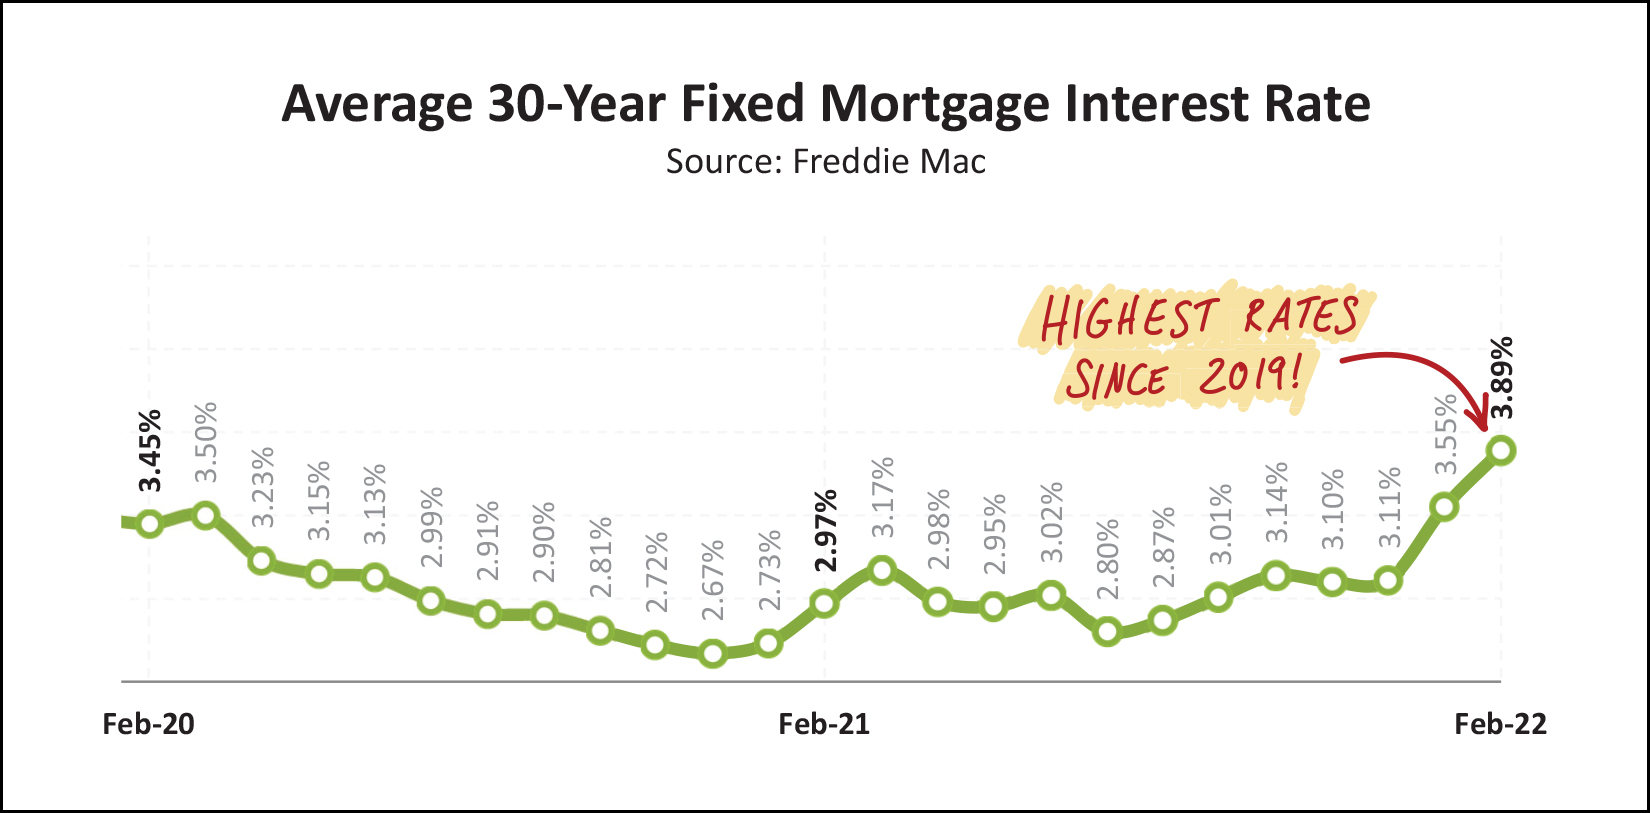 Lastly, how about those interest rates? If there is one external factor that has the highest likelihood of affecting home buying activity in 2022... it is rising mortgage interest rates. Just six months ago, the average mortgage interest rate on a 30 year mortgage was 2.87%... and it has risen more than a full percentage point in the past six months to 3.89% at the end of March. As such, not only are today's home buyers paying a higher purchase price for nearly any home that they might purchase -- but their monthly mortgage payment will also be higher now (than it has been in recent months and years) because of rising interest rates. It seems likely that these rates will either level out near 4% or continue to rise even a bit above 4% as we continue through 2022. OK! That makes it to the end of this month's recap of our local housing market. A few reminders for you... [1] Go eat at Magpie Diner. You're certain to love it! :-) [2] Looking to buy soon? Email me so we can chat about what you'd like to buy, and talk to a lender ASAP. Let me know if you'd like some recommendations. [3] Planning to sell soon? Let's meet to talk about your house, any needed improvements or preparations, pricing, timing, the market and more. Email me to set up a time to meet to talk. That's all for now. Be in touch anytime (email me or call/text 540-578-0102) if I can be of help to you or your family, friends, neighbors or colleagues. Hope to talk to you soon! | |
Slightly Fewer Home Sales, Much Higher Sales Prices In January 2022 |
|
 Happy Snowy Monday Morning! This is my favorite kind of snow... beautiful everywhere... but not sticking to the road...  I hope you stayed warm inside yesterday and that enjoyed the Super Bowl last night. Hopefully your favorite team won... or you enjoyed the commercials... or you enjoyed the half time performance... or you enjoyed spending time with family and friends while partaking in all of the above!? It seems like the year just started, but we're already one eight of the way through the year! Before we get started, two quick links of interest... [1] The beautiful home featured on the cover of this month's market report is located at 471 Flower Drive at the base of Massanutten Resort is and currently for sale. [2] You can download all of the graphs and charts from my monthly report here. Now, onto the data... 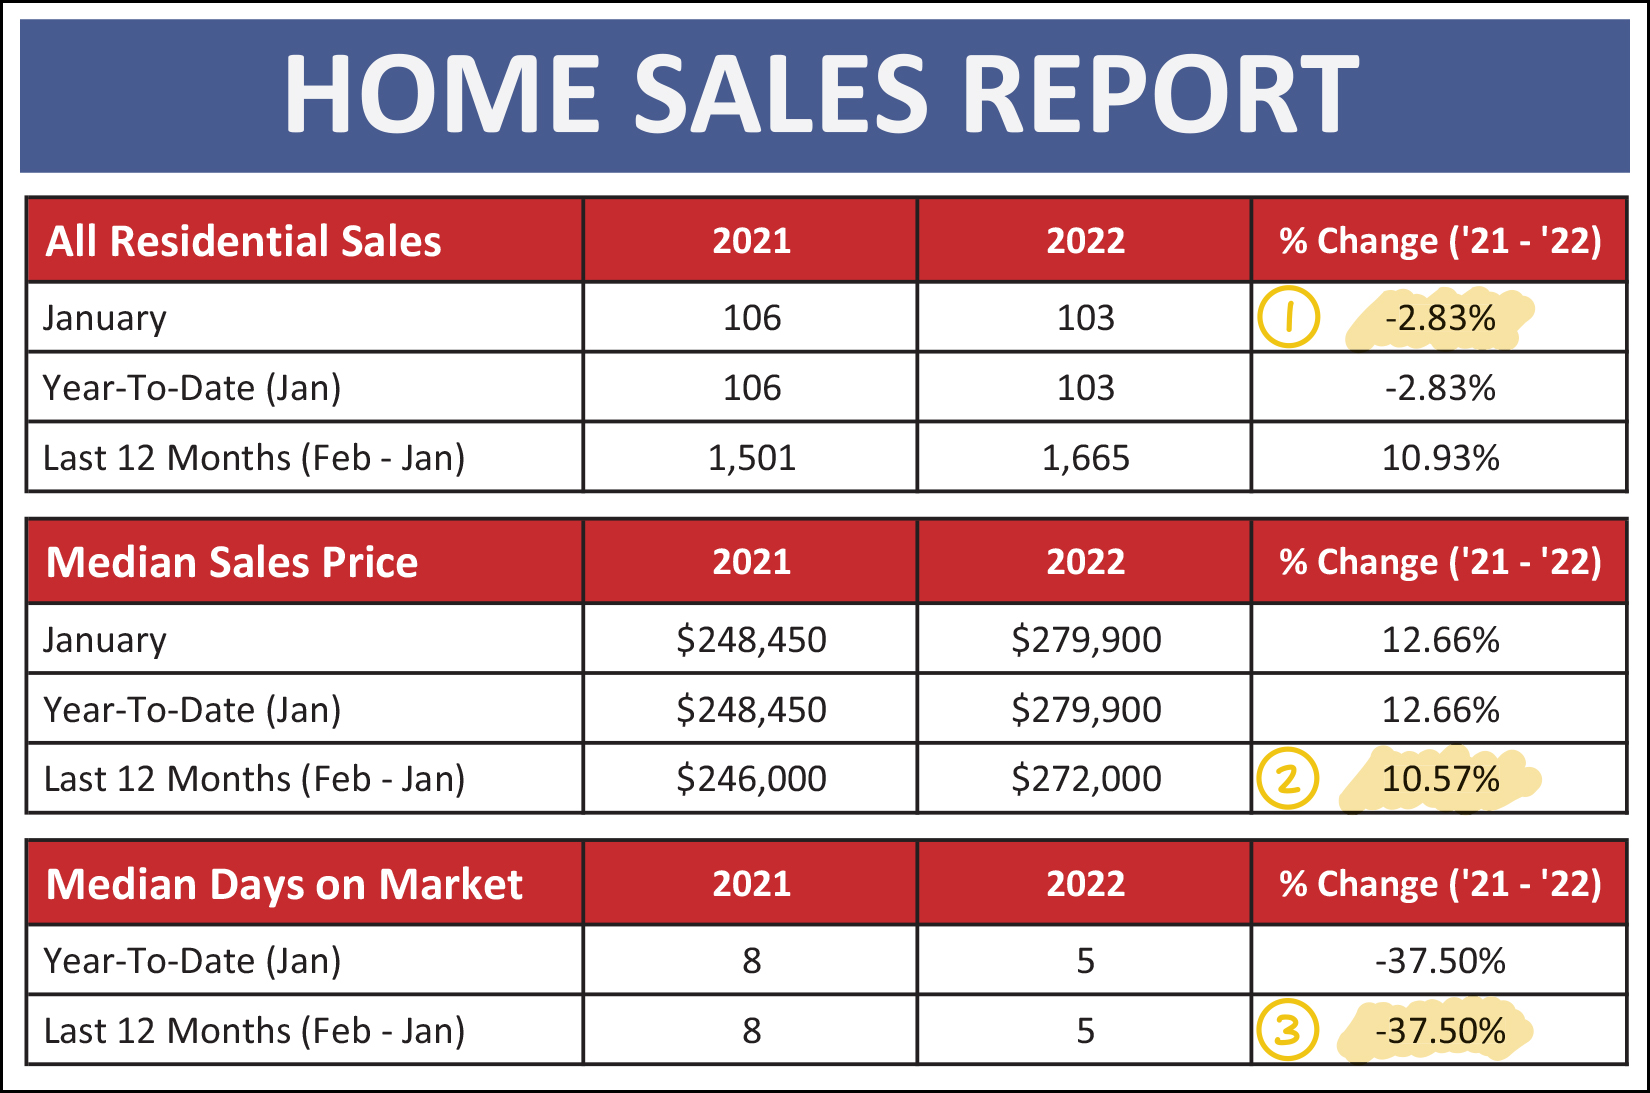 We're only looking at data for one month - and the slowest month of the year, so it's hard to draw many conclusions thus far, but here are a few things I am noticing... [1] There were slightly fewer home sales this year (103) than last year (106) during the month of January. [2] The median sales price over the past 12 months was $272,000 which is nearly 11% higher than the median sales price of $246,000 during the 12 months before that. [3] Homes are currently selling (going under contract) very quickly with a median of five days on the market - which is a 37.5% decline from the eight day pace a year ago. It is likely helpful to put this January in the context of other months of January, and other months, generally... 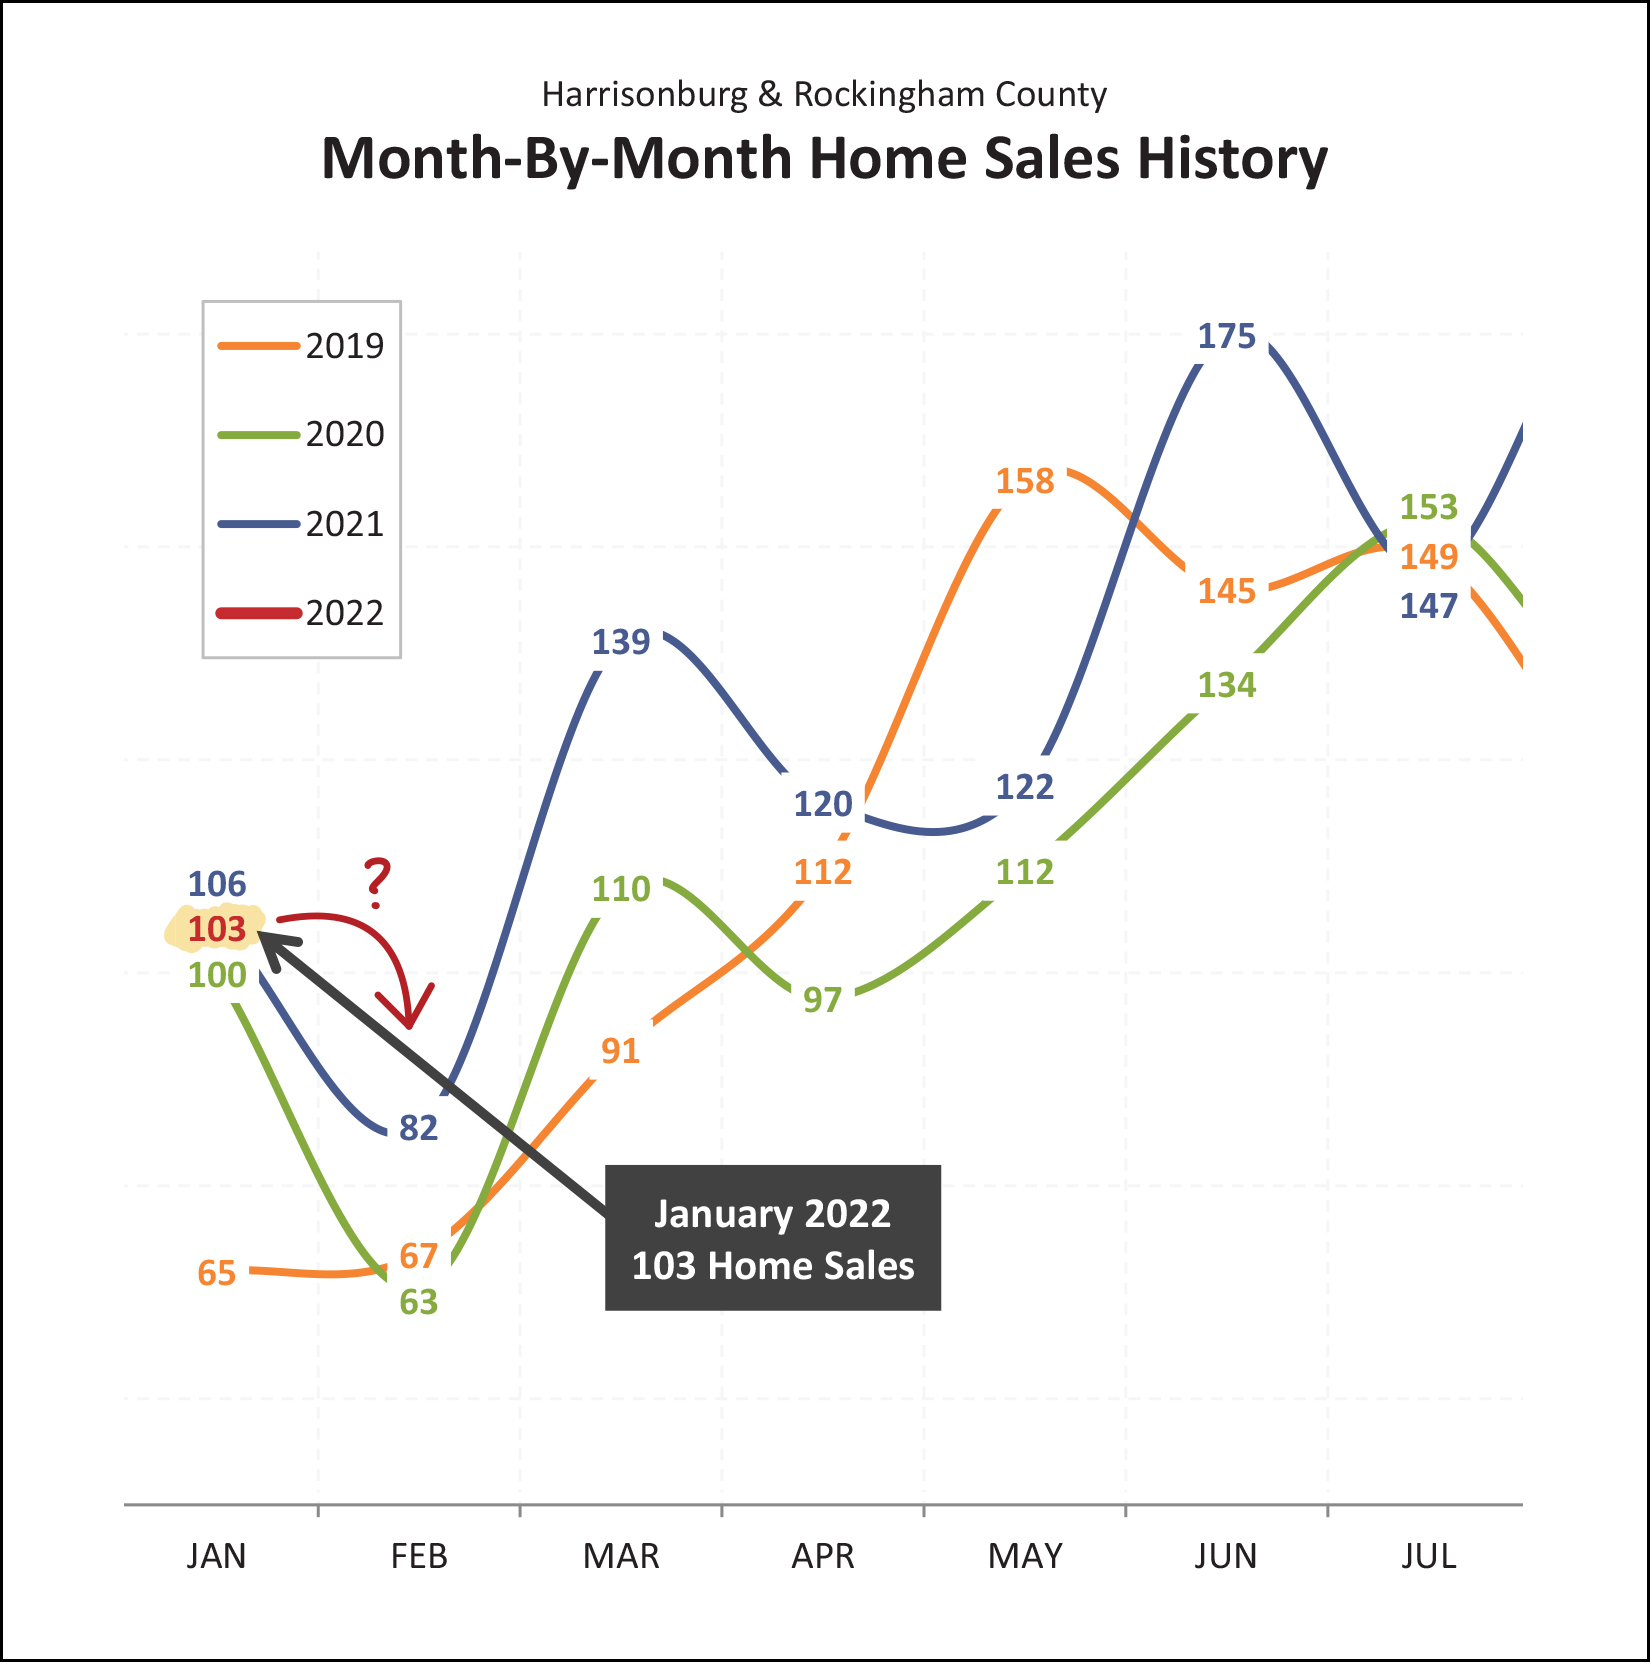 As you can now see, the 103 home sales this January landed right between the 100 sales in January 2020 and the 106 sales in January 2022. So, it was a typical January based on the past few years - though well above the 65 home sales seen in January 2019. Furthermore, we should likely expect to see sales drop in February as they have each of the past two years. January tends to be the second slowest month of the year for home sales with February leading the pack. Once we then head into March we should start to see a steady increase in the monthly pace of home sales. Now, a historical observation that I hadn't noticed until now... 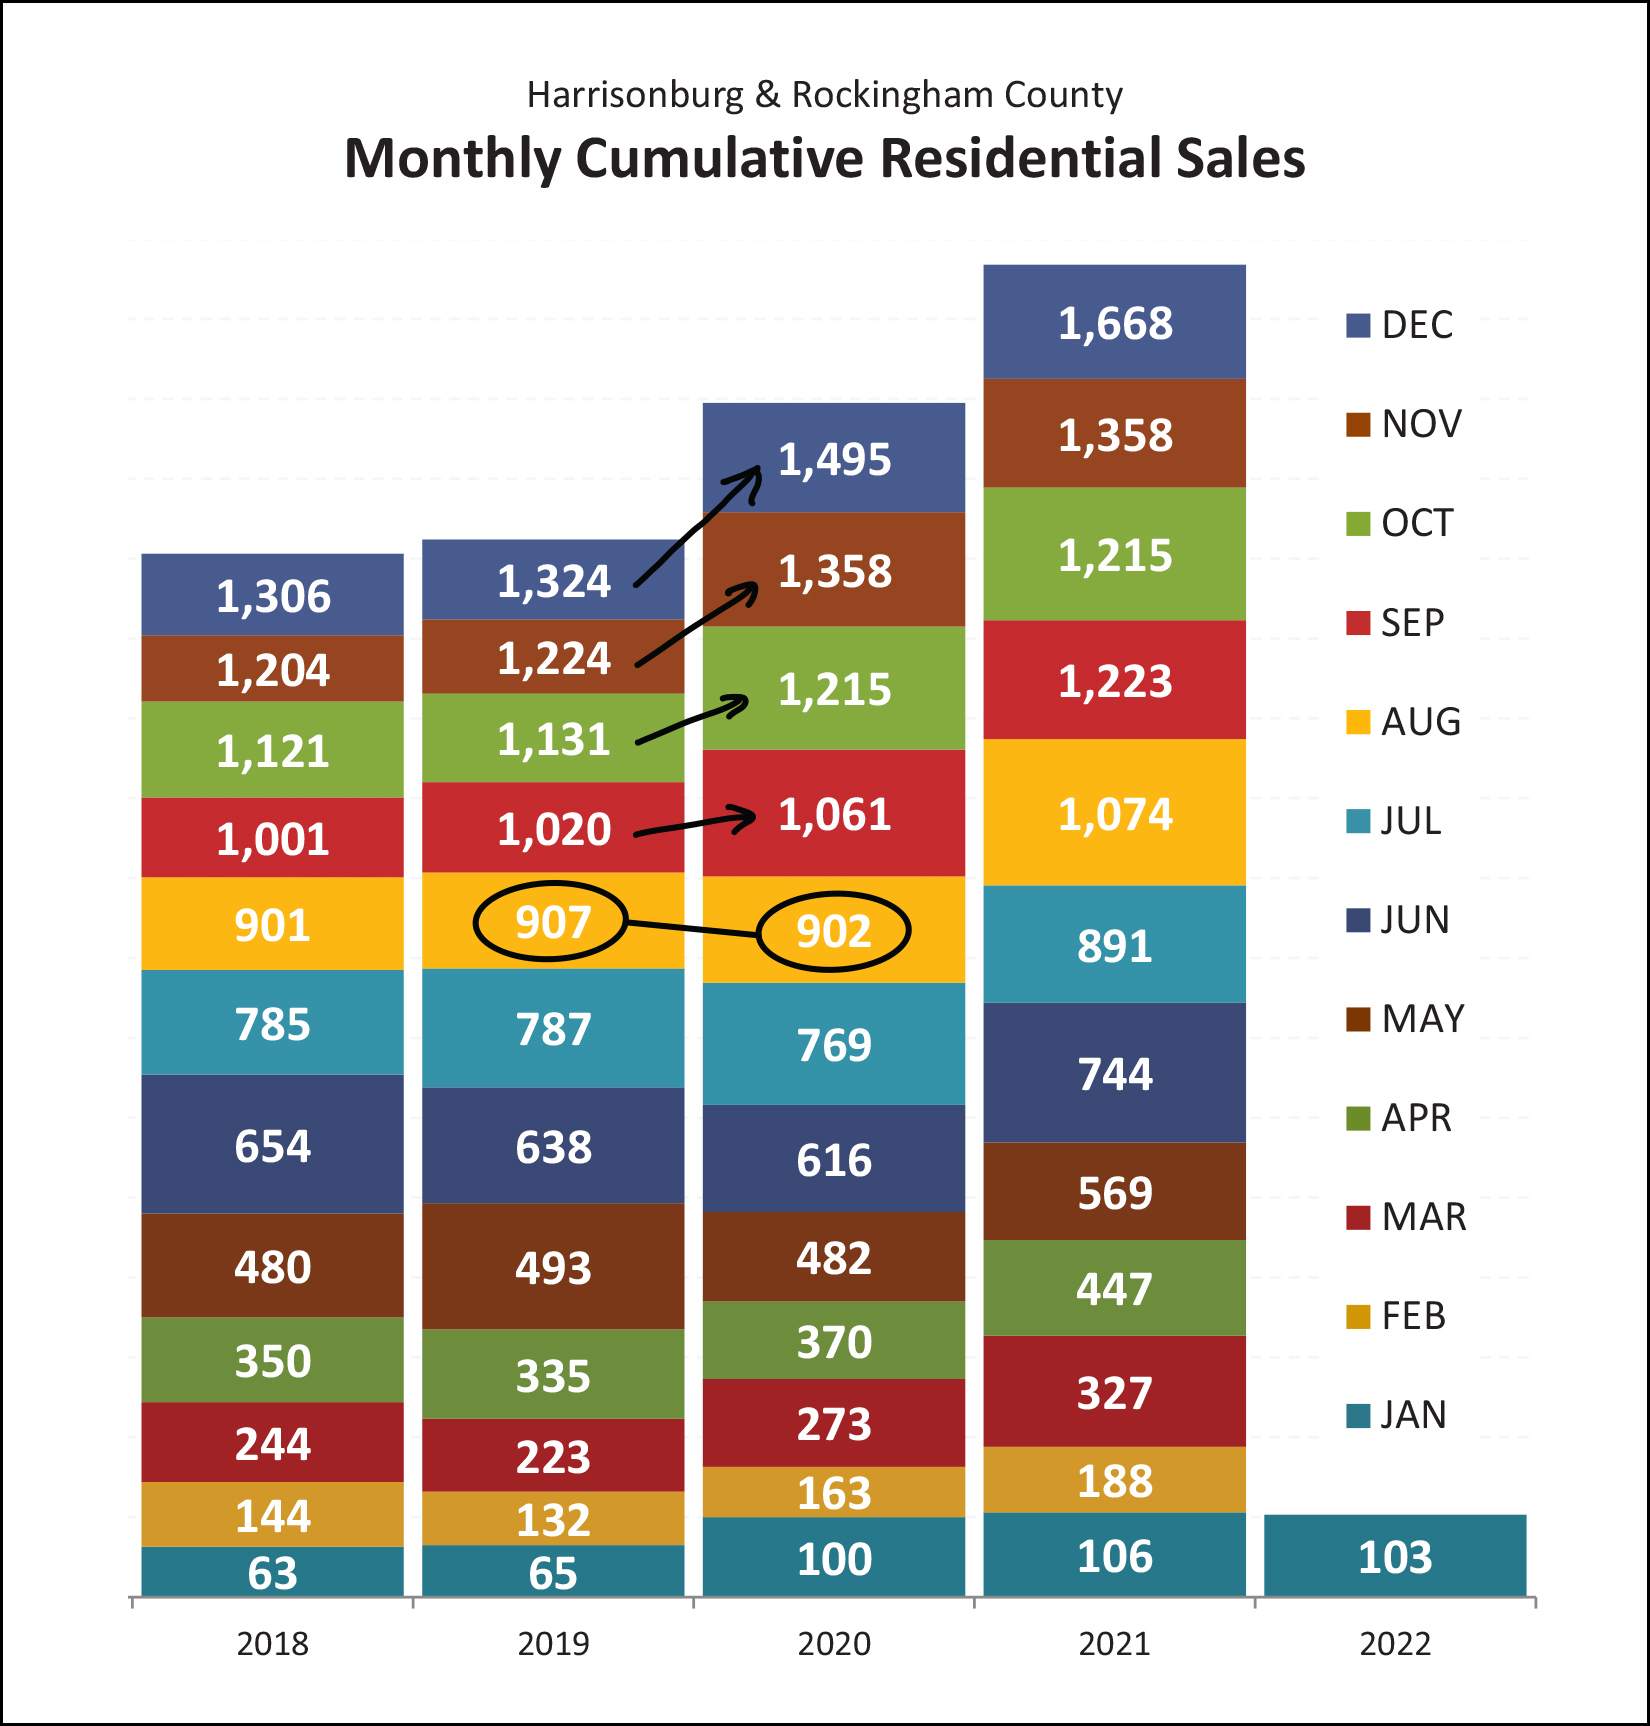 This is one of the graphs I show you most months that allows us to look at how monthly home sales each year are stacking up compared to prior years. It seems the local housing market in 2020 was on par with 2019 all the way through August 2020 -- and then, the pace of home sales took off in the last four months of 2020, and have been accelerating ever since that time! But... maybe the pace of sales is leveling off a bit? 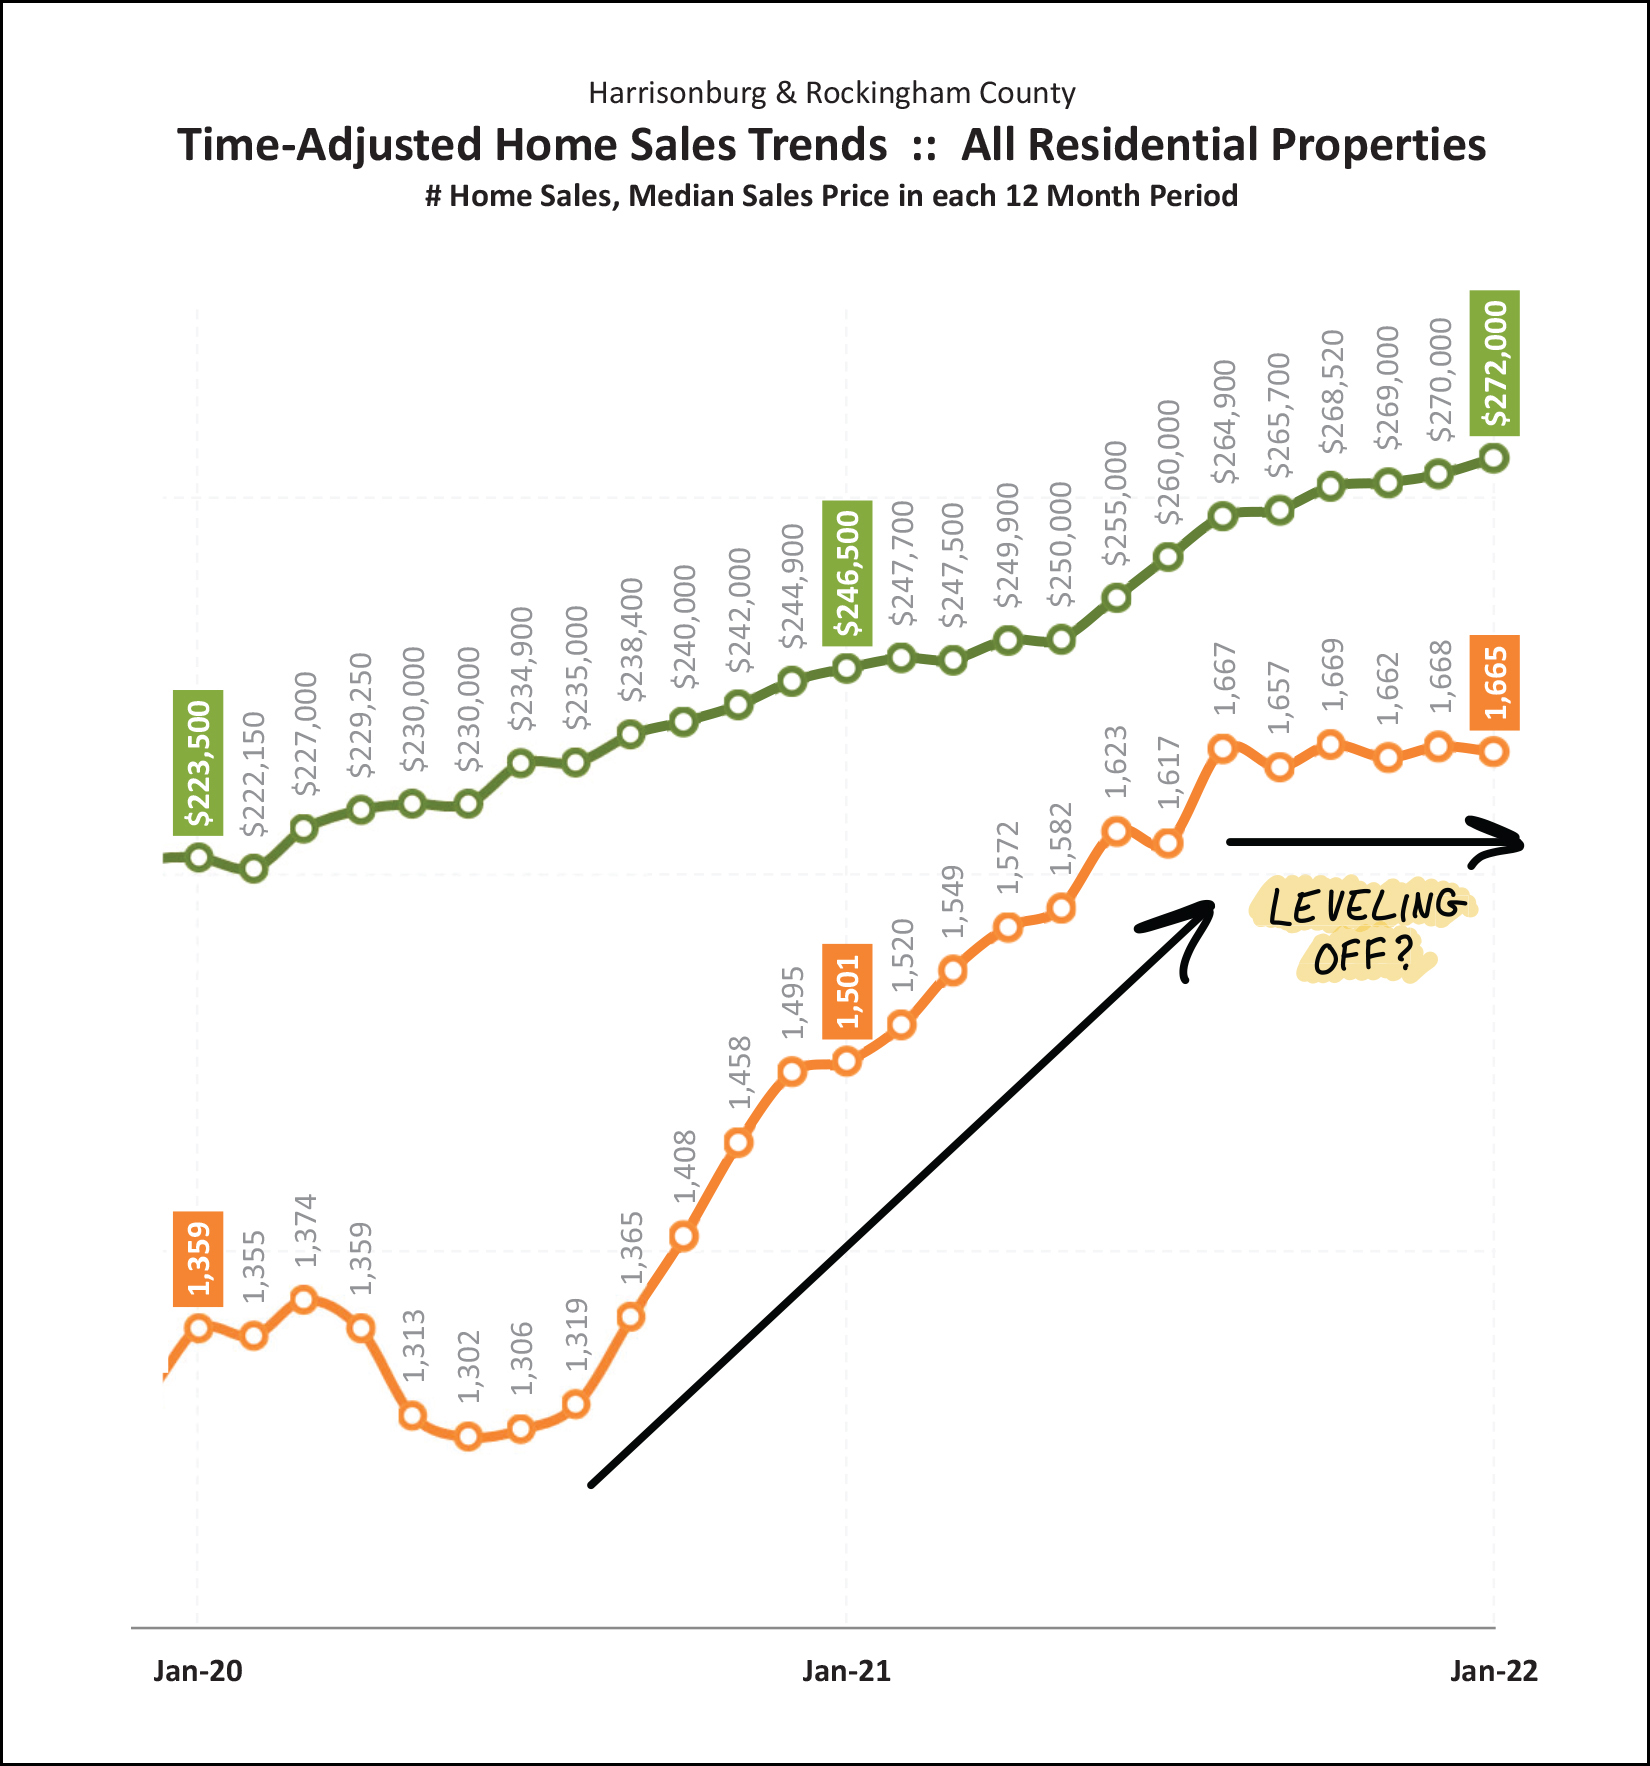 As you can see, the annual pace of home sales accelerated quickly from 1,300 sales per year up to 1,600 sales per year between mid 2020 and mid 2021. Over the past six months, however, the annual pace of home sales seems to have stabilized right around 1,650 sales per year. It will be interesting to see whether this trend continues as we continue through 2022. Now, then, looking at contract activity - which typically precedes the closing of a home sales by 30 to 60 days... 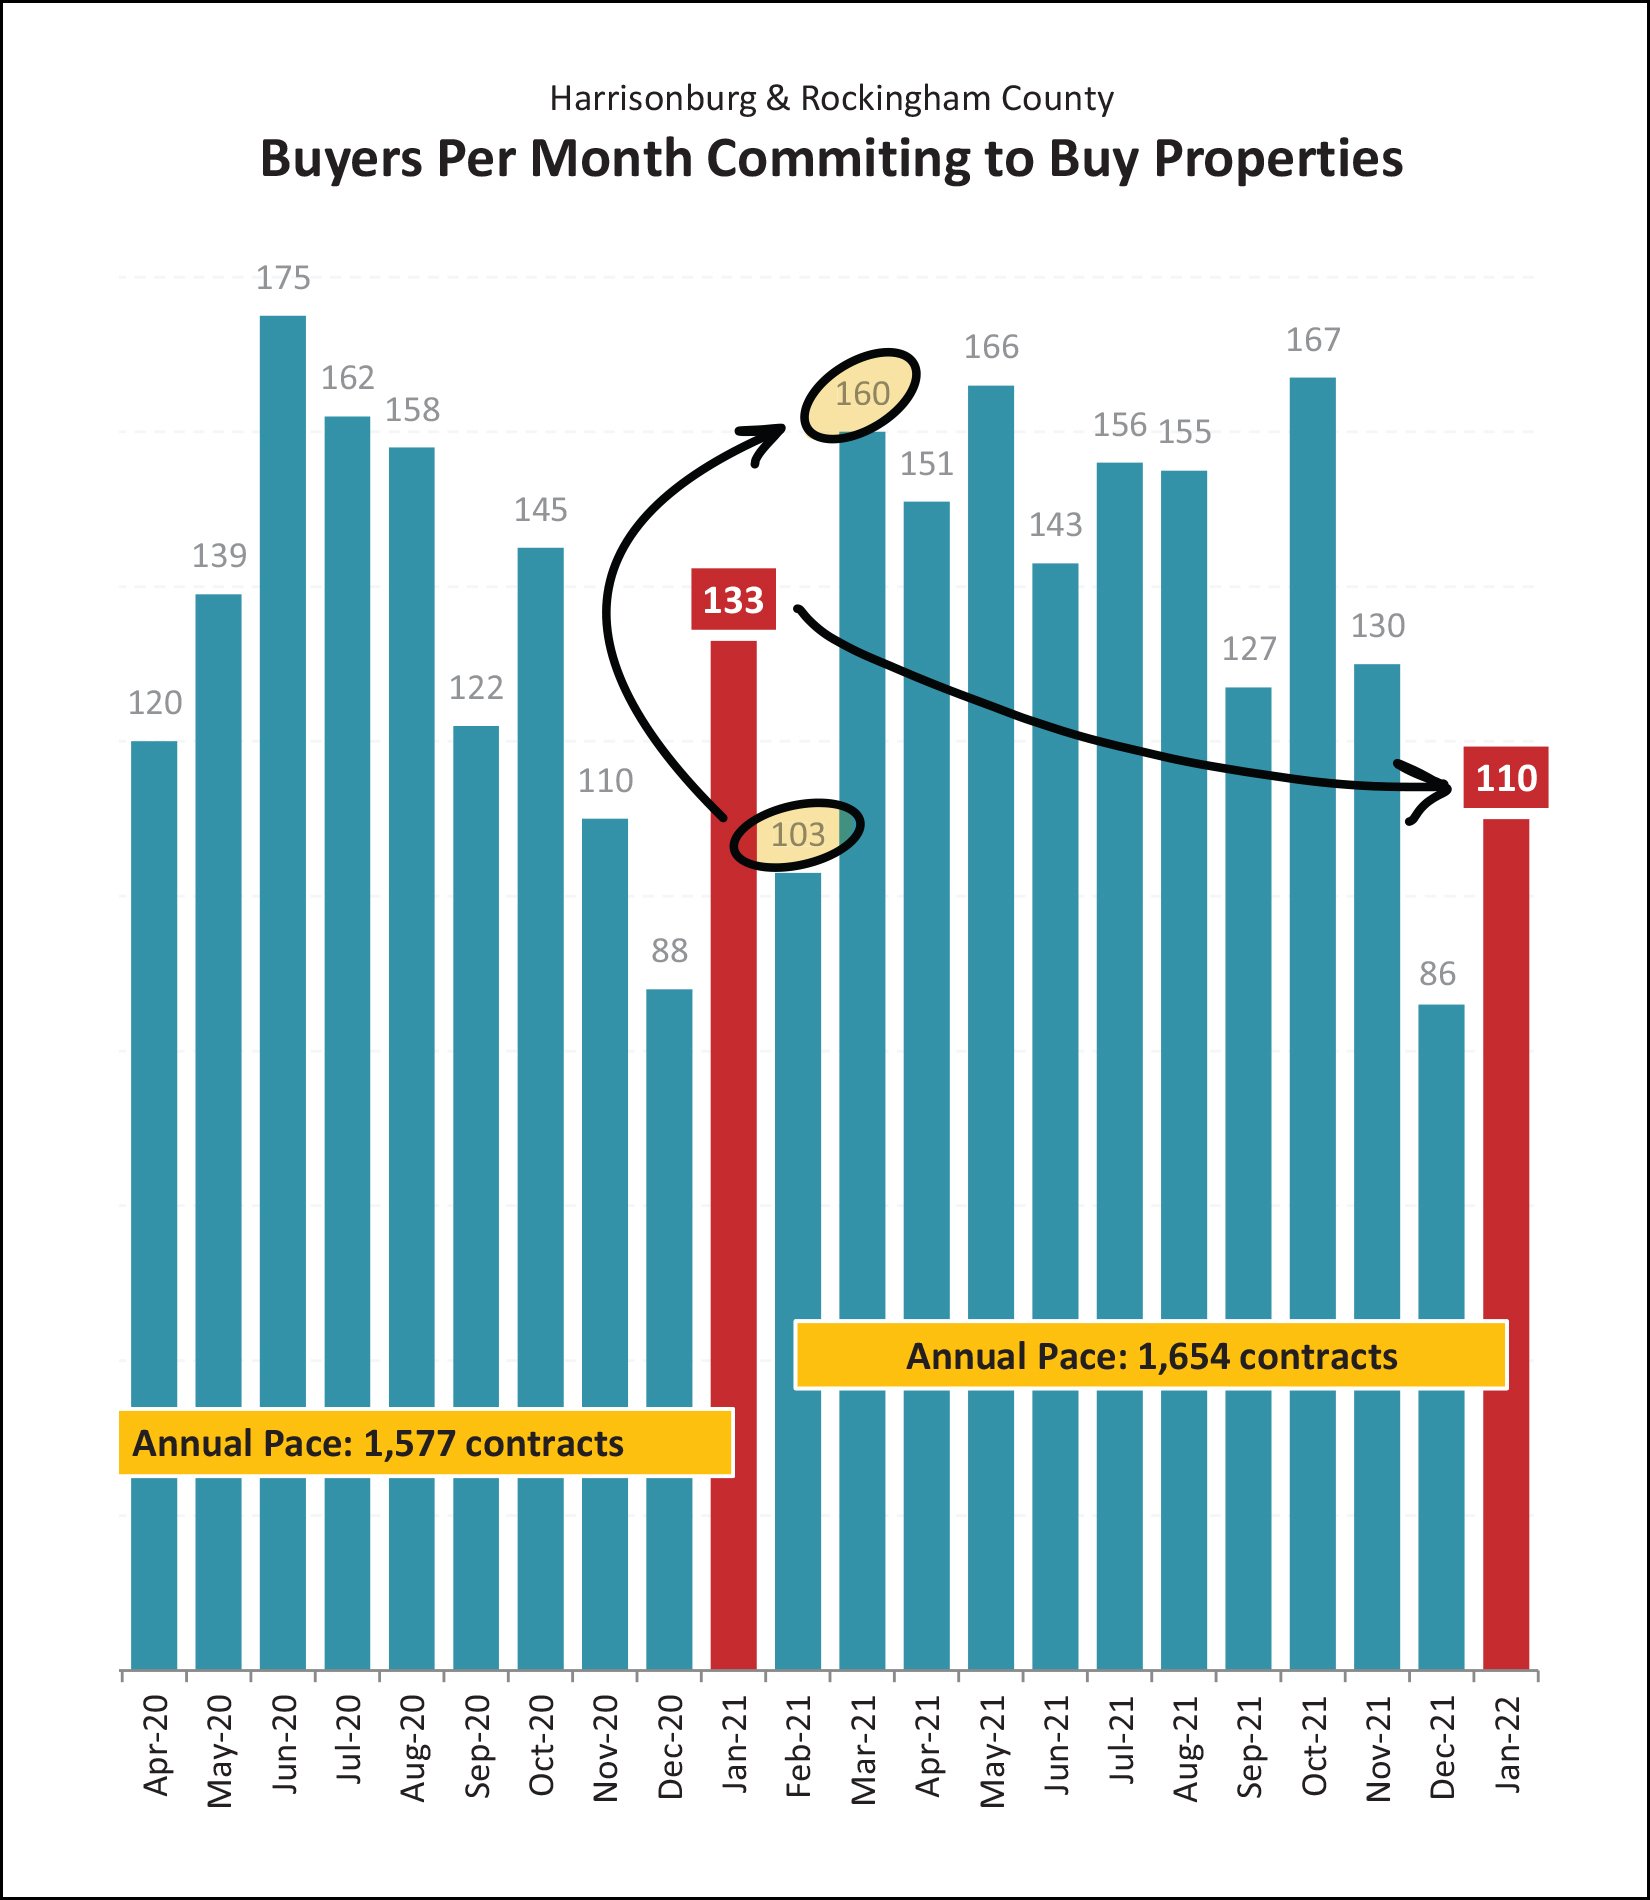 Two things to note about contract activity... [1] Last January we saw 133 buyers and sellers sign contracts to buy and sell houses in Harrisonburg and Rockingham County. This January, only 110 contracts were signed. This means that we will likely see a bit of a drop off in closed sales come February. [2] Looking back at last February and March we should note that we will likely also see a decline in contract activity between January and February before we see a large increase in March. So, expect a continued "slower" pace of market activity for at least the next few weeks before things potentially start accelerating in early or mid March. Another story line to be watching in 2022 is what happens with inventory levels... 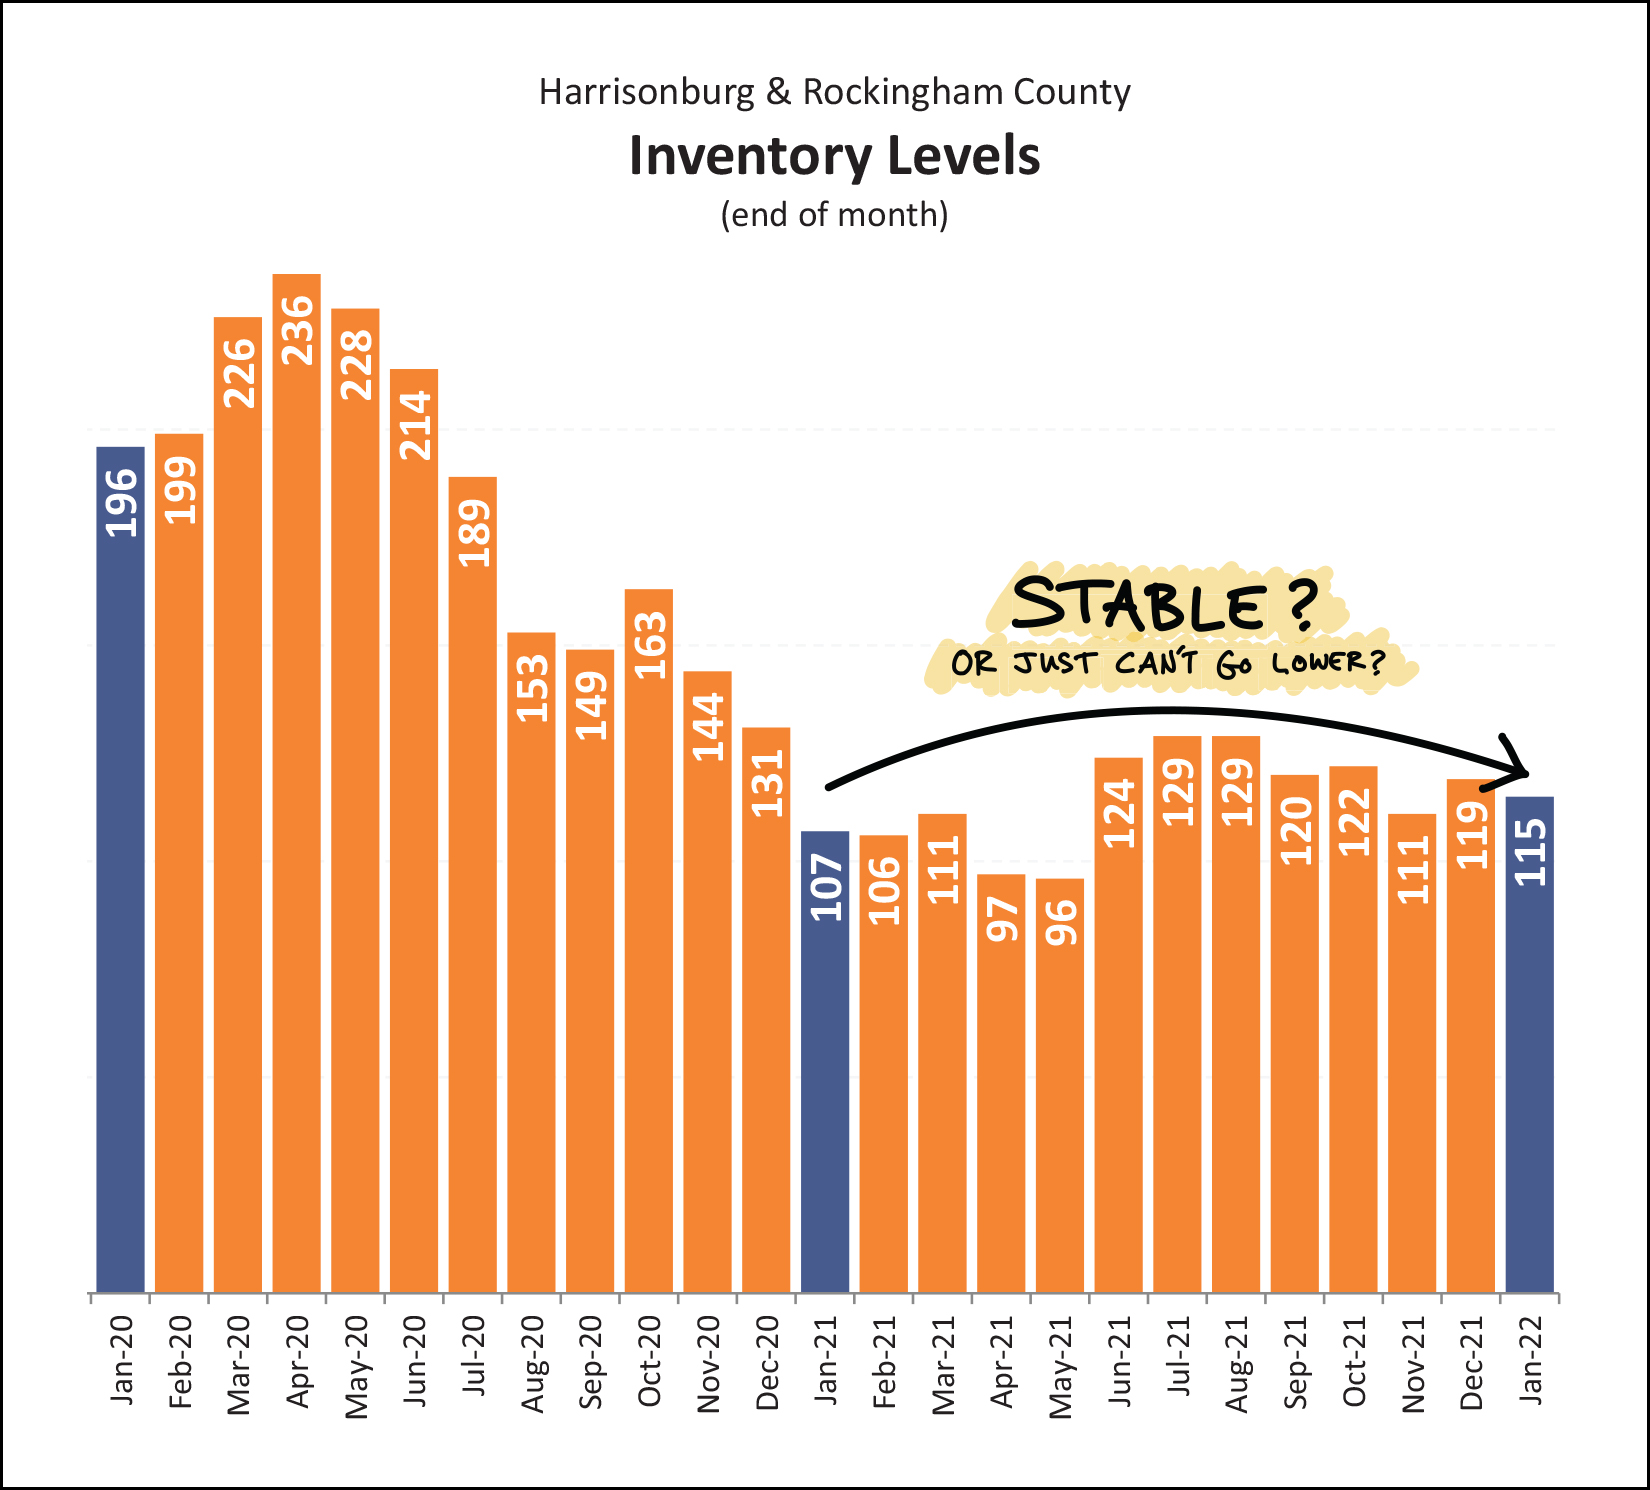 Inventory levels have been declining for several years, most notably above through all of 2020. But during 2021, inventory levels remained relatively stable, and did not decline further. Maybe because they can't? There will always be some homes on the market as I don't think we'll get down to only five or ten or twenty five homes for sale. The floor, in this case, might be right around 100 homes for sale. It will be interesting to see whether we continue to see a range of around 95 to 130 homes for sale all year this year like we did last year. Part of the reason why inventory levels don't seem to be able to increase is because homes are going under contract so quickly... 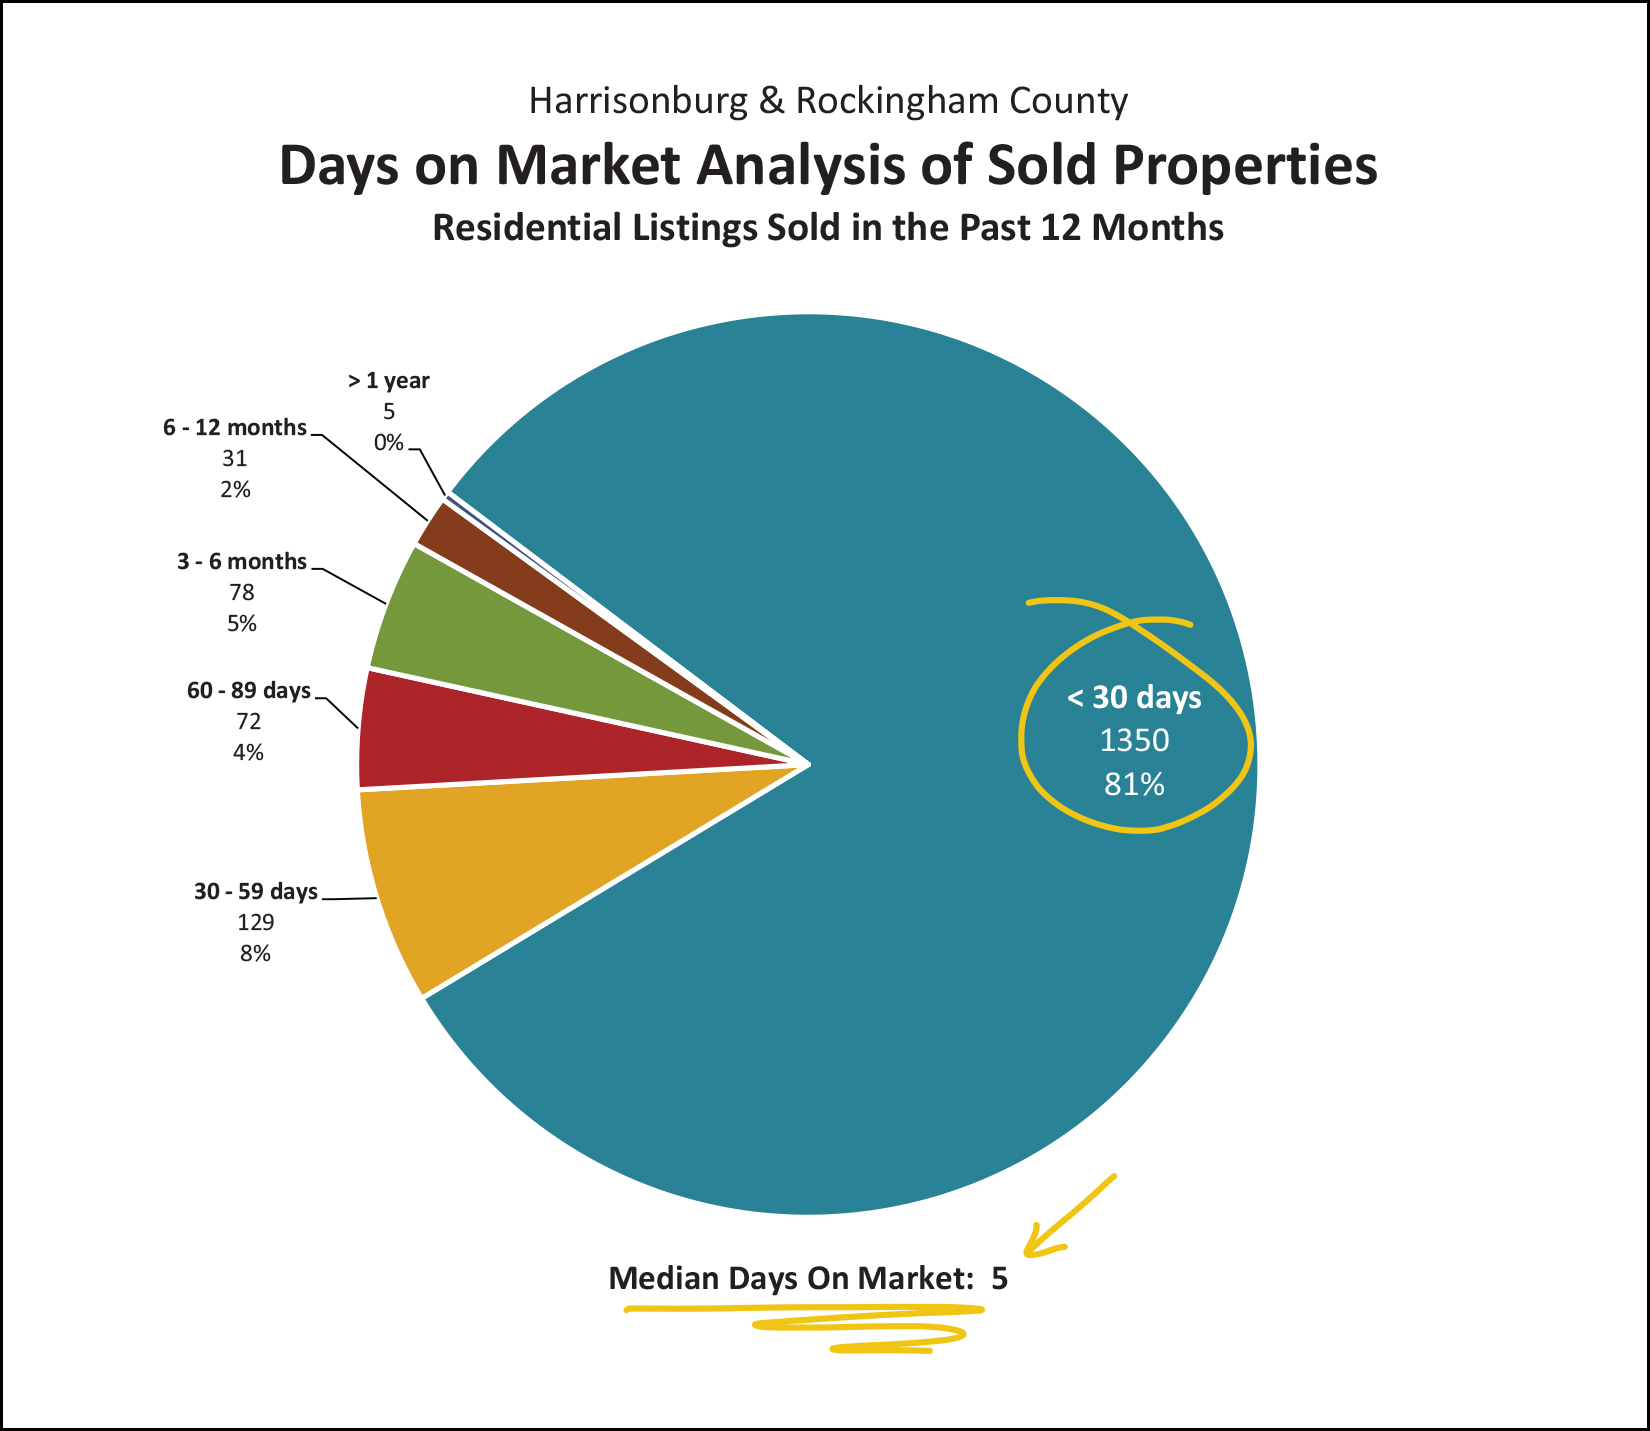 As shown above, 81% of homes that sold in the past year went under contract within 30 days of being listed for sale. Going a bit further, we also see that half of the homes that sold last year went under contract within only FIVE days of being listed for sale given the median of five days on the market. With homes going under contract so quickly, it is not surprising that inventory levels did not manage to increase much through 2021. Here, then, is another visualization of the speed at which homes are going under contract... 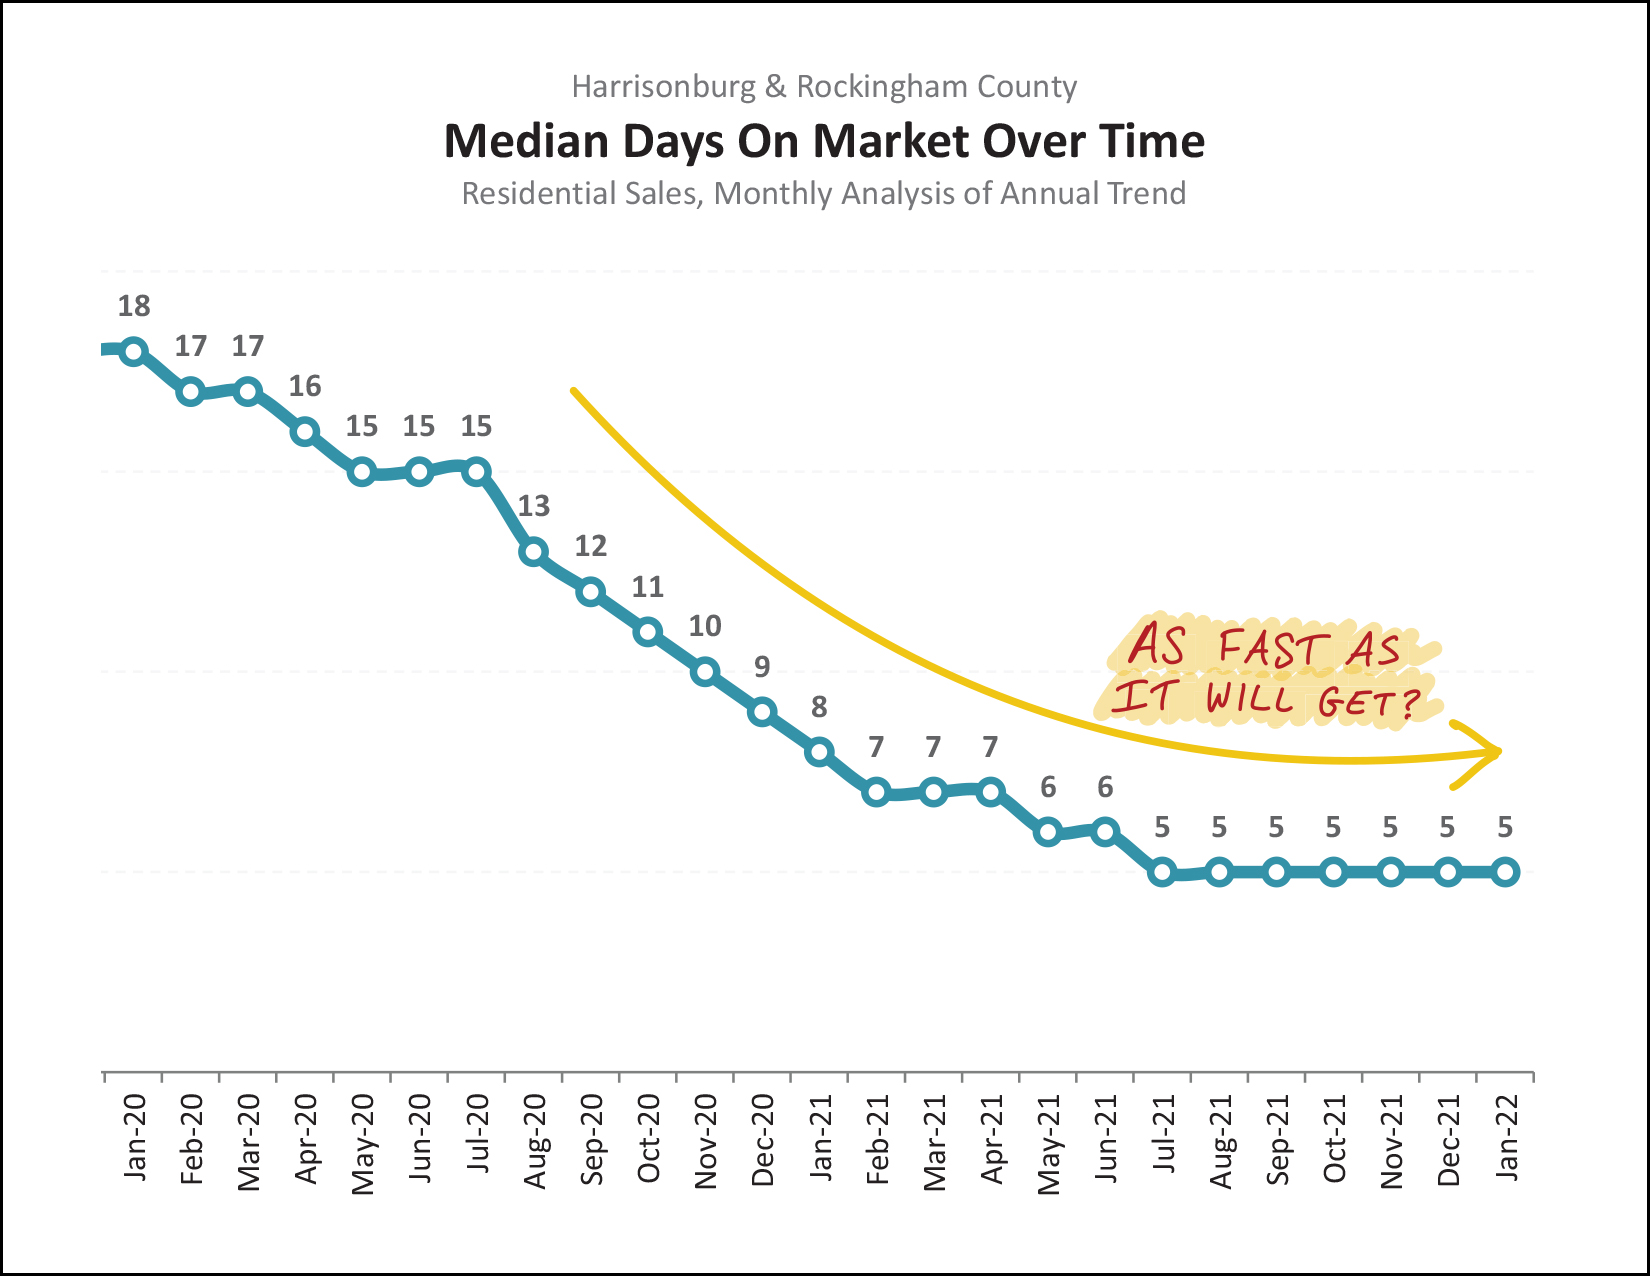 As you can see, two years ago the median days on market was 18 days. That median days on market figure then speedily declined through summer 2021 when it hit just five days on the market. Since that time, it has leveled off at five days on the market, calling into question whether it could actually get any faster. As we continue through 2022 I will be monitoring this trend to see if the market seems to be slowing at all. Thus far, it is not. And, yet another story line to be following in 2022... 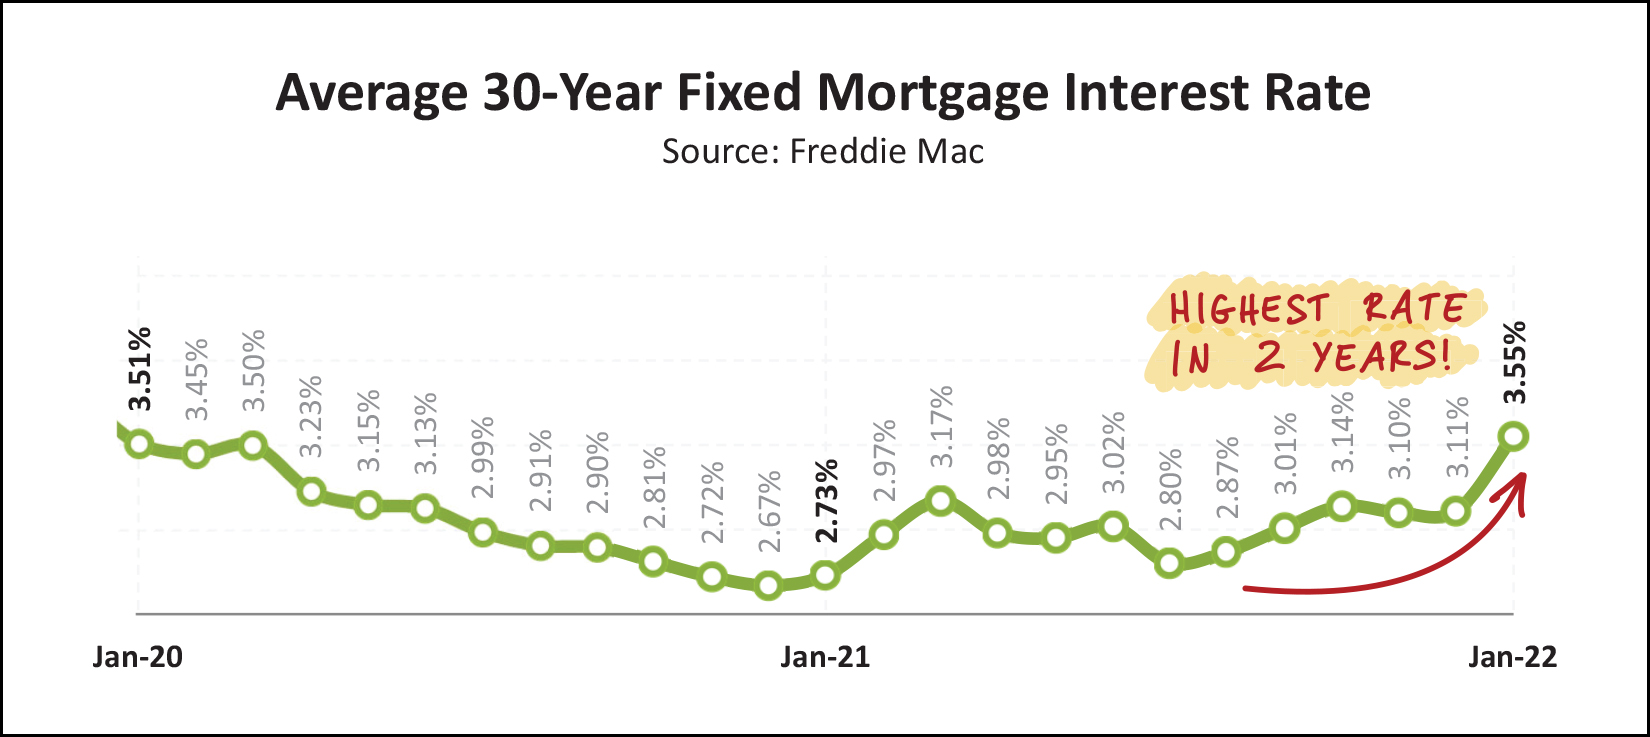 The average 30 year mortgage interest rate hit an all time low in late 2020 of 2.65%. Average rates closed out 2021 just above 3%, but have now climbed, within a month, to above 3.5% and they have continued to climb during February 2022. As rates increase, a buyer's mortgage payment increases depending on how much of a purchase price they are financing. At some point, rising interest rates will affect housing affordability -- for some buyers buying some houses. We will have to continue to observe this trend through 2022 to see if rising interest rates seem to be affecting the local housing market. So, as described above, there are plenty of possible developing trends in our local housing market. Stay tuned through 2022 to see if the market can and will stay just as strong in 2022 as it was in 2021. If so, it will continue to be a thrilling time for home sellers, and a bit of a challenging time for home buyers. If you are planning to buy a home, or sell a home, in 2022 let's connect soon to start talking about the process, the market and your goals and timing. Just reach out by email, phone or text (540-578-0102) and we can set up a time to meet. Until next time, enjoy the beautiful snow while it lasts -- it looks like temperatures will be starting to warm up come Wednesday! P.S. Happy Valentine's Day! | |
2021 Harrisonburg Area Home Sales Were Amazingly High, But Not Quite Record Breaking! |
|
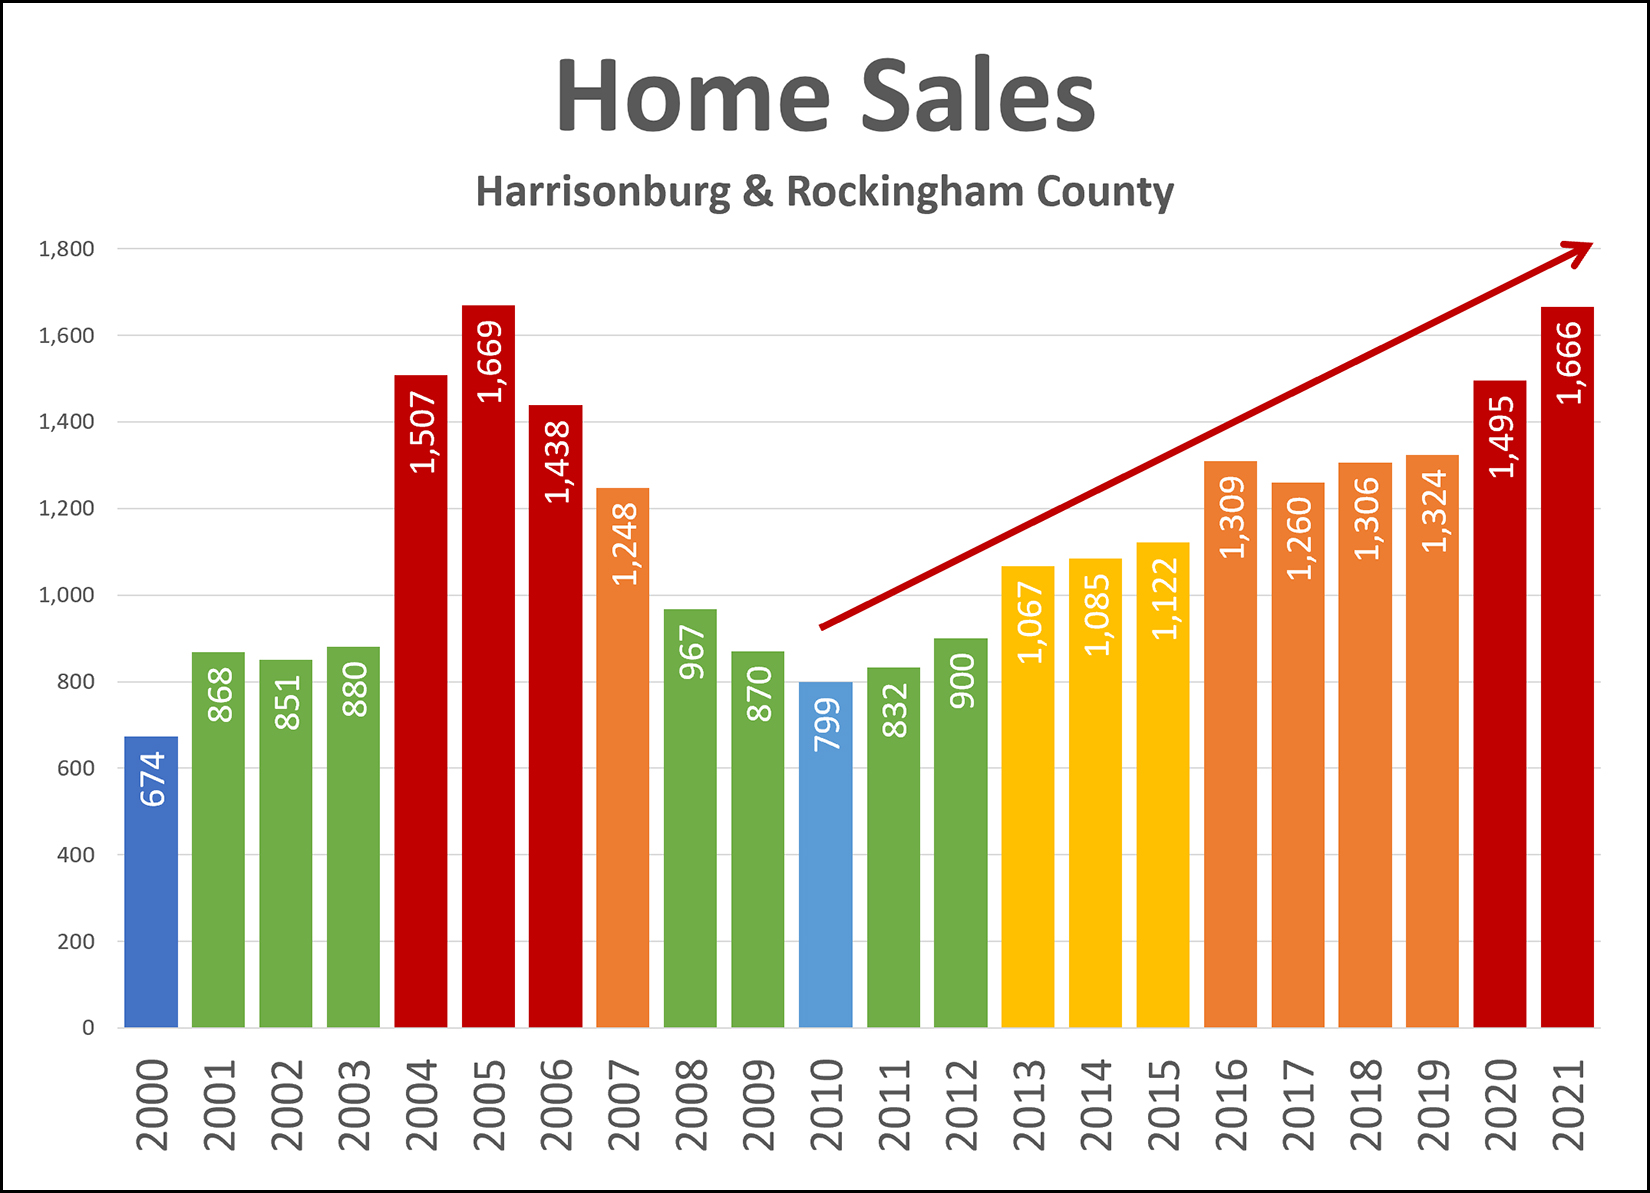 Nice try, 2021, but you didn't quite set a new record after all... Home sales have been on a roll for the past decade, increasing in pace almost every year between 2010 and 2021, and more than doubling in that timeframe. Way back in 2010 there were only 799 home sales in Harrisonburg and Rockingham County, and last year (2021) there were 1,666 home sales! But... that shocking 1,666 sales in a year was not quite a record. :-) Back in 2005, there were... 1,669 home sales! So, nice try, 2021... should have tried just a little bit harder. Will we see an actual all time record in 2022? Could we really see 1,670 home sales (or more) in Harrisonburg and Rockingham County? Stay tuned to find out. ;-) | |
2021 Year In Review in the Harrisonburg Area Real Estate Market |
|
 Happy New Year, Friends! I hope you had a delightful, relaxing, fun and healthy holiday season and New Year celebration. Today I am coming to you with a "year in review" of the Harrisonburg area real estate market in 2021. Before we get started, though, I'll introduce you to the sponsor of this month's market update. ;-) This month's market update is brought to you by... cookies!!!  A delicious part of our family's holiday celebration is the annual Christmas Cookie Contest and this year there were some fantastic entries! The photo above actually only shows six of the ten cookies from this year's 19th Annual Christmas Cookie Contest - and it does not show the winning cookie - congrats, Aiden! As you reflect back on your holiday celebrations, I hope you are reminded (as I am) of plenty of delicious food, and even better... wonderful, cherished time with family near and far! Now, though, let's dive into some real estate data to better understand how exactly the year wrapped up in the Harrisonburg and Rockingham County real estate market. For those that like to check out every graph, even those not in this narrative summary, download the PDF with all the graphs here. 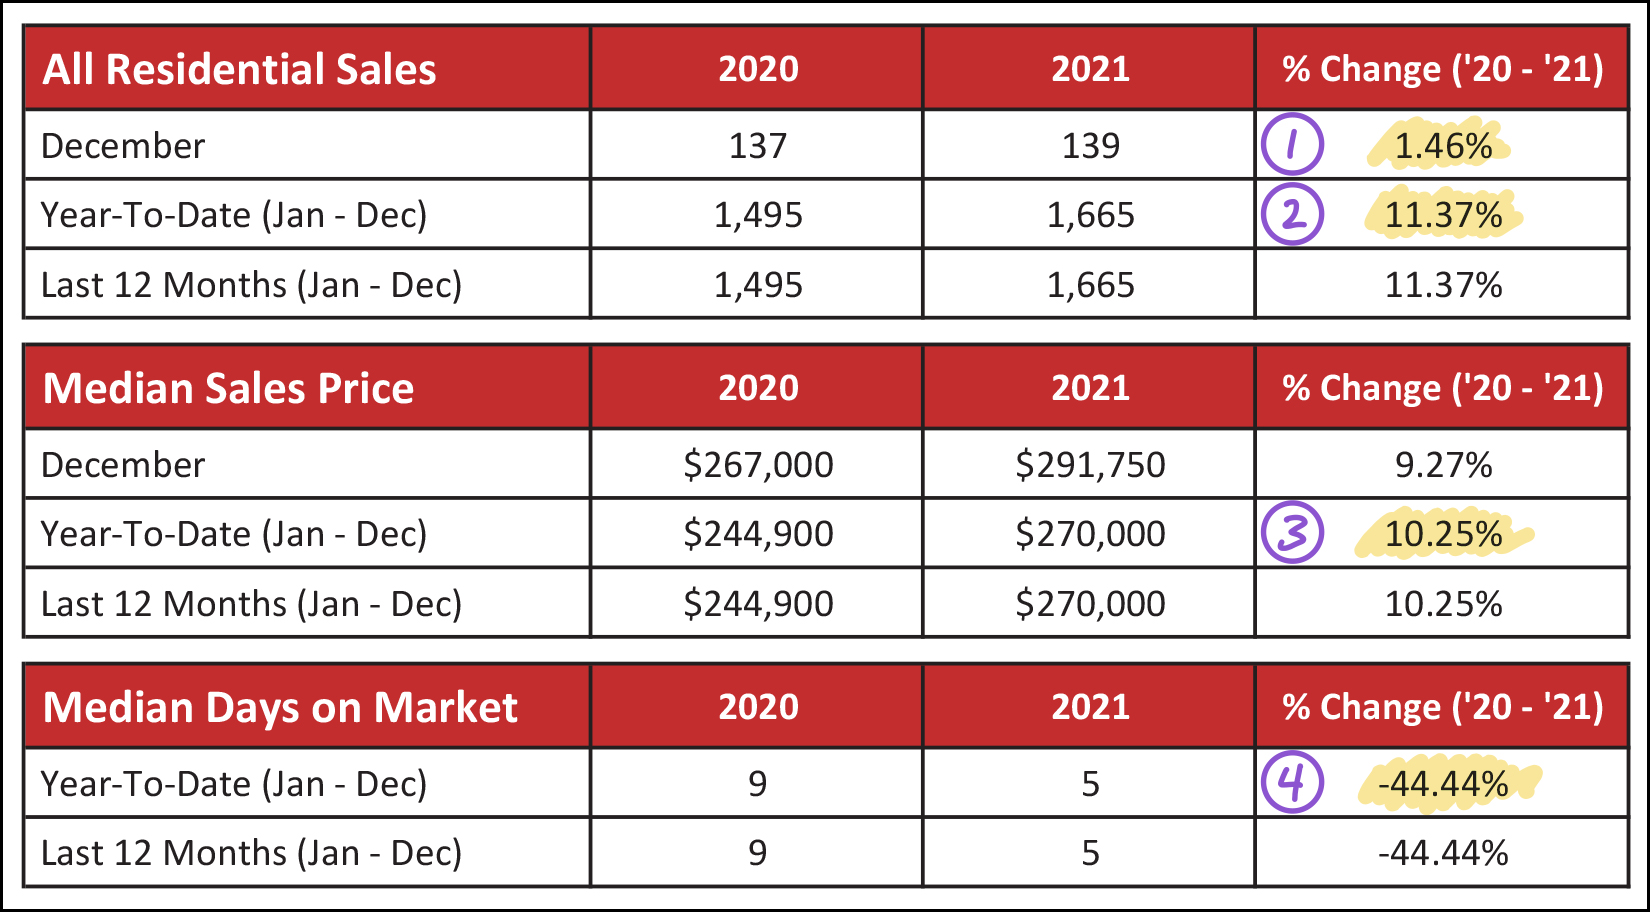 The chart above quickly gets us into the big picture for our real estate market. First (1) you'll see that home sales ticked upwards a bit in December with a 1.46% increase over December 2020. But the numbers you've all been waiting for are shown as 2, 3 and 4 above... Home Sales Increased 11% in 2021. Sales Prices Increased 10% in 2021. Time On The Market Decreased 44% in 2021. So, a rather strong year for our local housing market! It was a fast paced market, with homes usually going under contract in less than a week. We saw more sales than in 2020, and prices were (as noted above) 10% higher in 2021 than 2020. I do think, however, that slicing and dicing this overall data a bit can be helpful. Let's first break it down by detached vs. attached, and then by City vs. County. Here is a summary of 2021 sales of detached homes...  As shown above, there was an almost 8% increase in the pace of detached home sales in Harrisonburg and Rockingham County in 2021. This increase (8%) is slightly less than the overall market-wide 11% increase, meaning that a greater share of the increase home sales were of attached homes. The median sales price of detached homes in 2021 was $291,500... up 8% over the median of $269,000 in 2020. A few thoughts here... first, the 8% increase in the median sales price of detached homes is less than the overall market-wide 10% increase, meaning that the sales prices of attached homes must have *really* increased in 2021. Stay tuned for that. Secondly, it is pretty wild to see the median sales price of a detached home now approaching $300,000. That means that in 2021, only slightly fewer than half of home sales were over $300,000! Now, then, about those attached homes, which includes townhouses, duplexes and condos...  Indeed, as predicted above... The pace of attached home sales increased more than that of detached home sales and more than the market as a whole. There were 20% more detached home sales in 2021 than we saw in 2020! The increase in the median sales price of these attached homes also increased much more in 2021 than the median price of detached homes. The median sales price of an attached home increased 17% from $193,000 to $225,000 in all of Harrisonburg and Rockingham County! So, half of buyers paid more than $225K for a duplex, townhouse or condo in 2021! Now, looking a bit more closely at the City vs. the County... 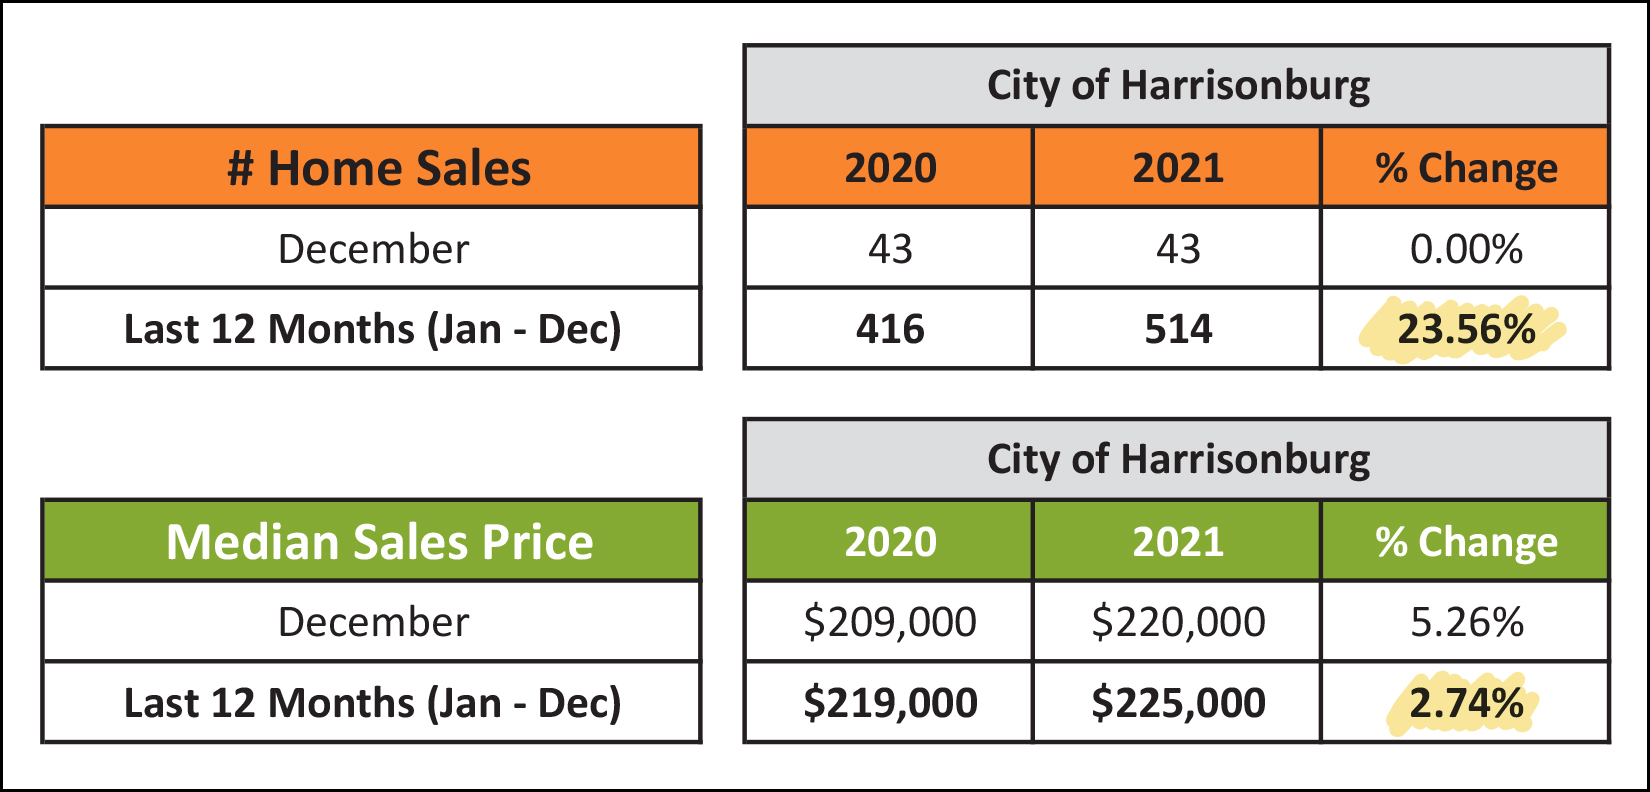 Despite seeing very few homes on the market for sale in the City at any given time through most of 2021, we managed to see a rather large (!) increase in the number of City homes selling in 2021. After only seeing 416 City home sales take place in 2020, there were 24% more in 2021... with a total of 514 home sales. Despite this significant increase in the number of City homes that sold in 2021, we actually only saw a 3% increase in their median sales price. The median sales price of City homes selling in 2021 was only $225,000. This is somewhat striking in comparison to the market-wide (City + County) median sales price of $270,000. So, then, how about the County? 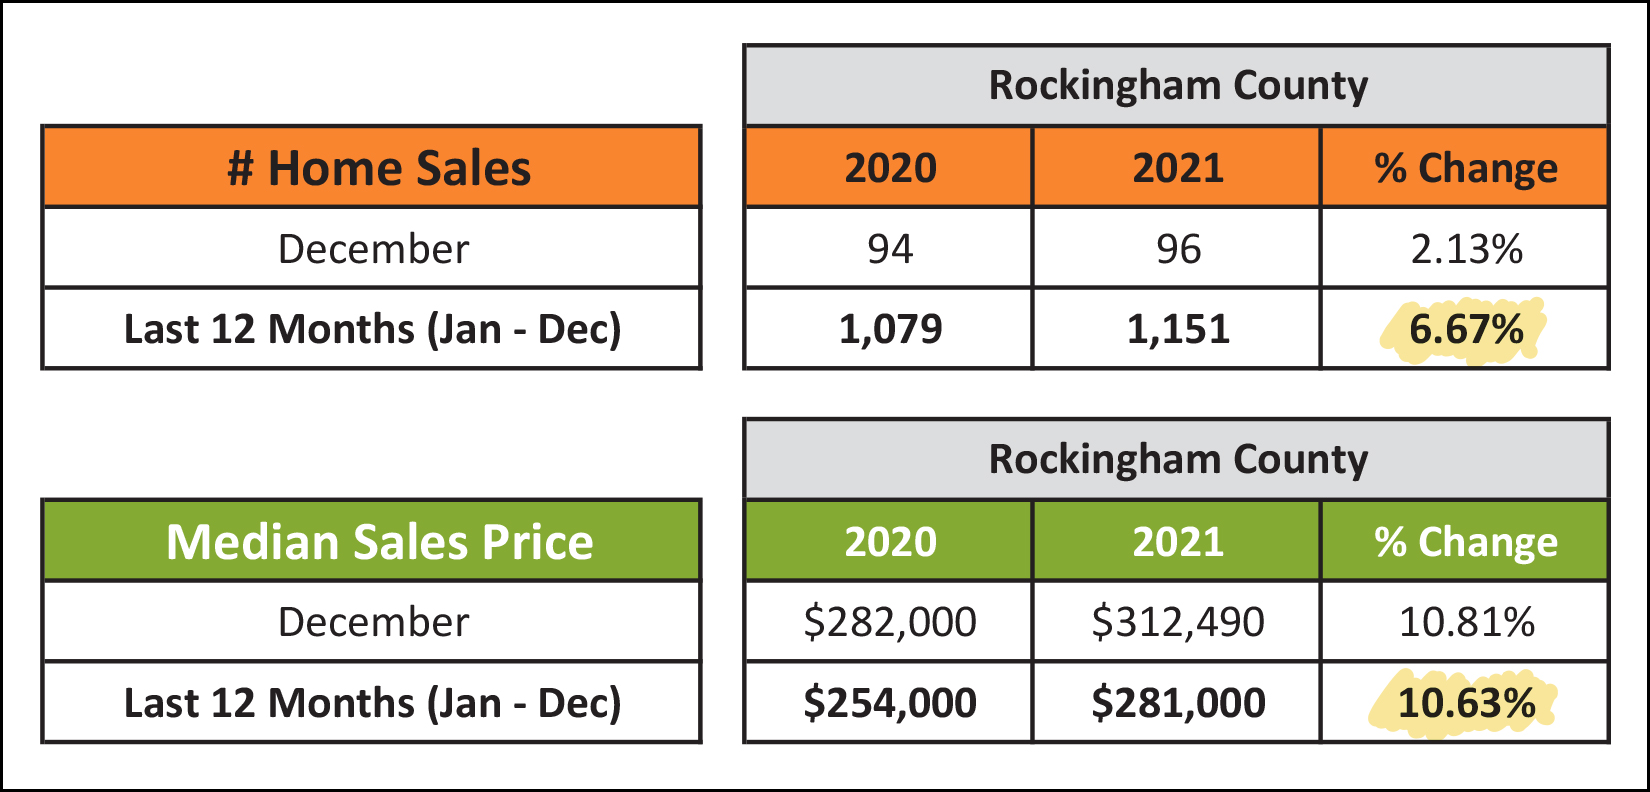 Over the past year we actually saw a smaller increase in the pace of home sales, with only 7% more home sales in 2021 than in 2020. The median sales price of those County homes increased quite a bit more, though, with an 11% increase in the median sales price -- which moved up from $254,000 in 2020 to $281,000 in 2021! So, the pace of home sales increased more in the City than the County -- but the median price of those home sales was higher in the County than the City -- and that median price increased more, year-over-year, in the County than the City. Do what you will with that newfound comparative understanding of our local housing market. ;-) Next, looking at one of my favorite monthly graphs, the pace of monthly sales seemed to be just as chaotic as many of the other constant changes in our lives in 2021... 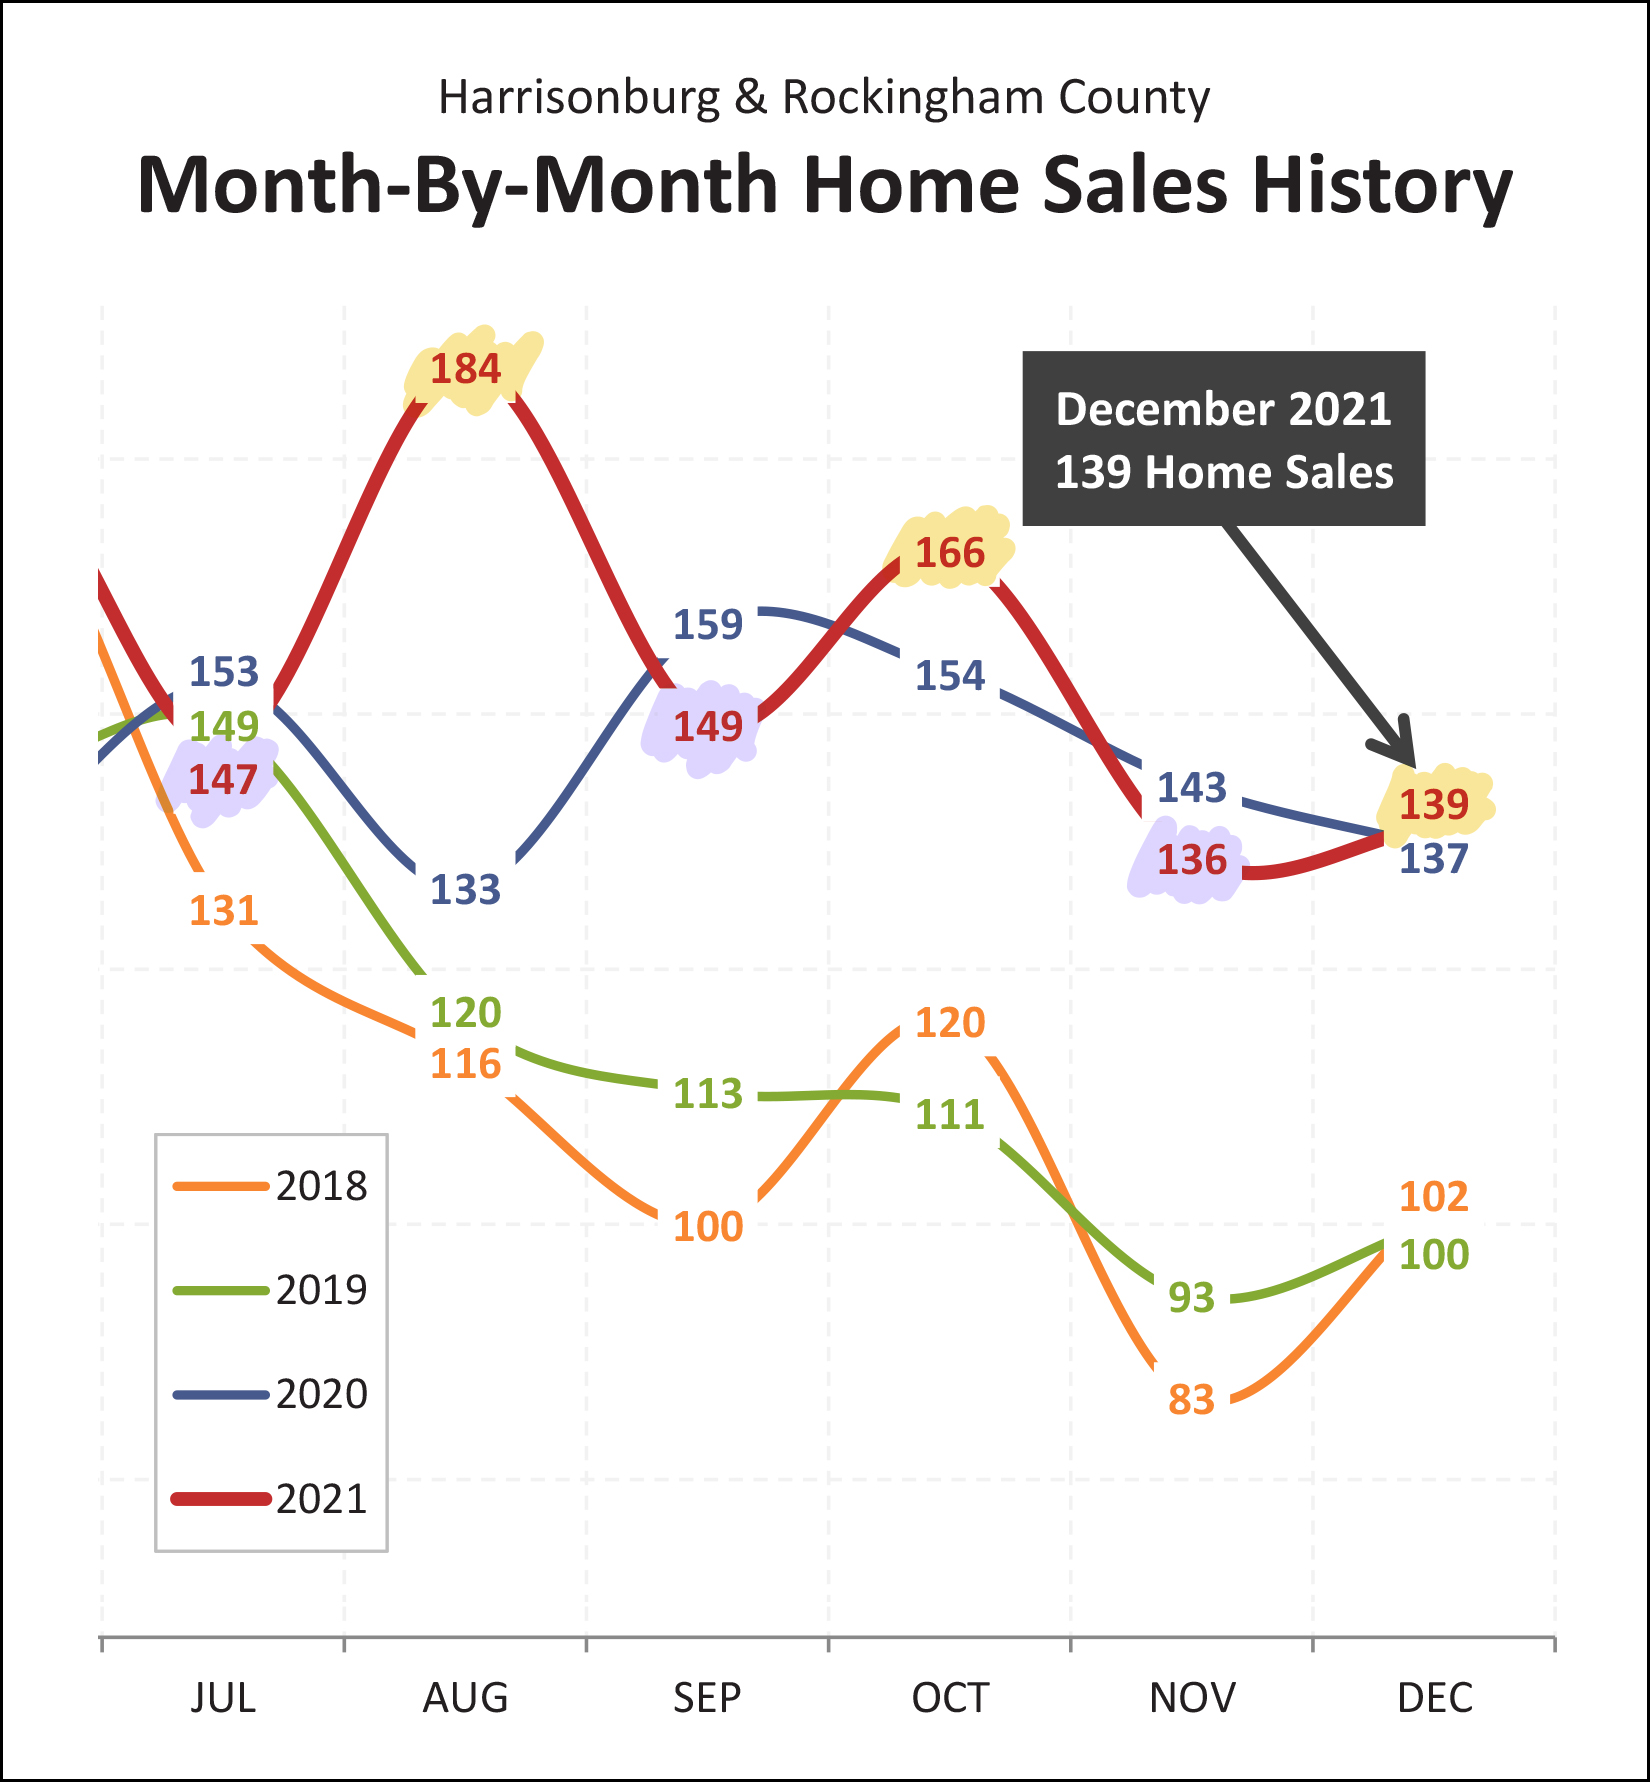 Monthly home sales were *anything* but predictable in 2021. They bounced all around, jumping to record new highs, usually followed immediately thereafter by surprising lows. The market seemed to want to take an "every other month things will be crazy" approach to the timing of sales through out the year!? And what if I told you that the market "slowed down" in 2021? 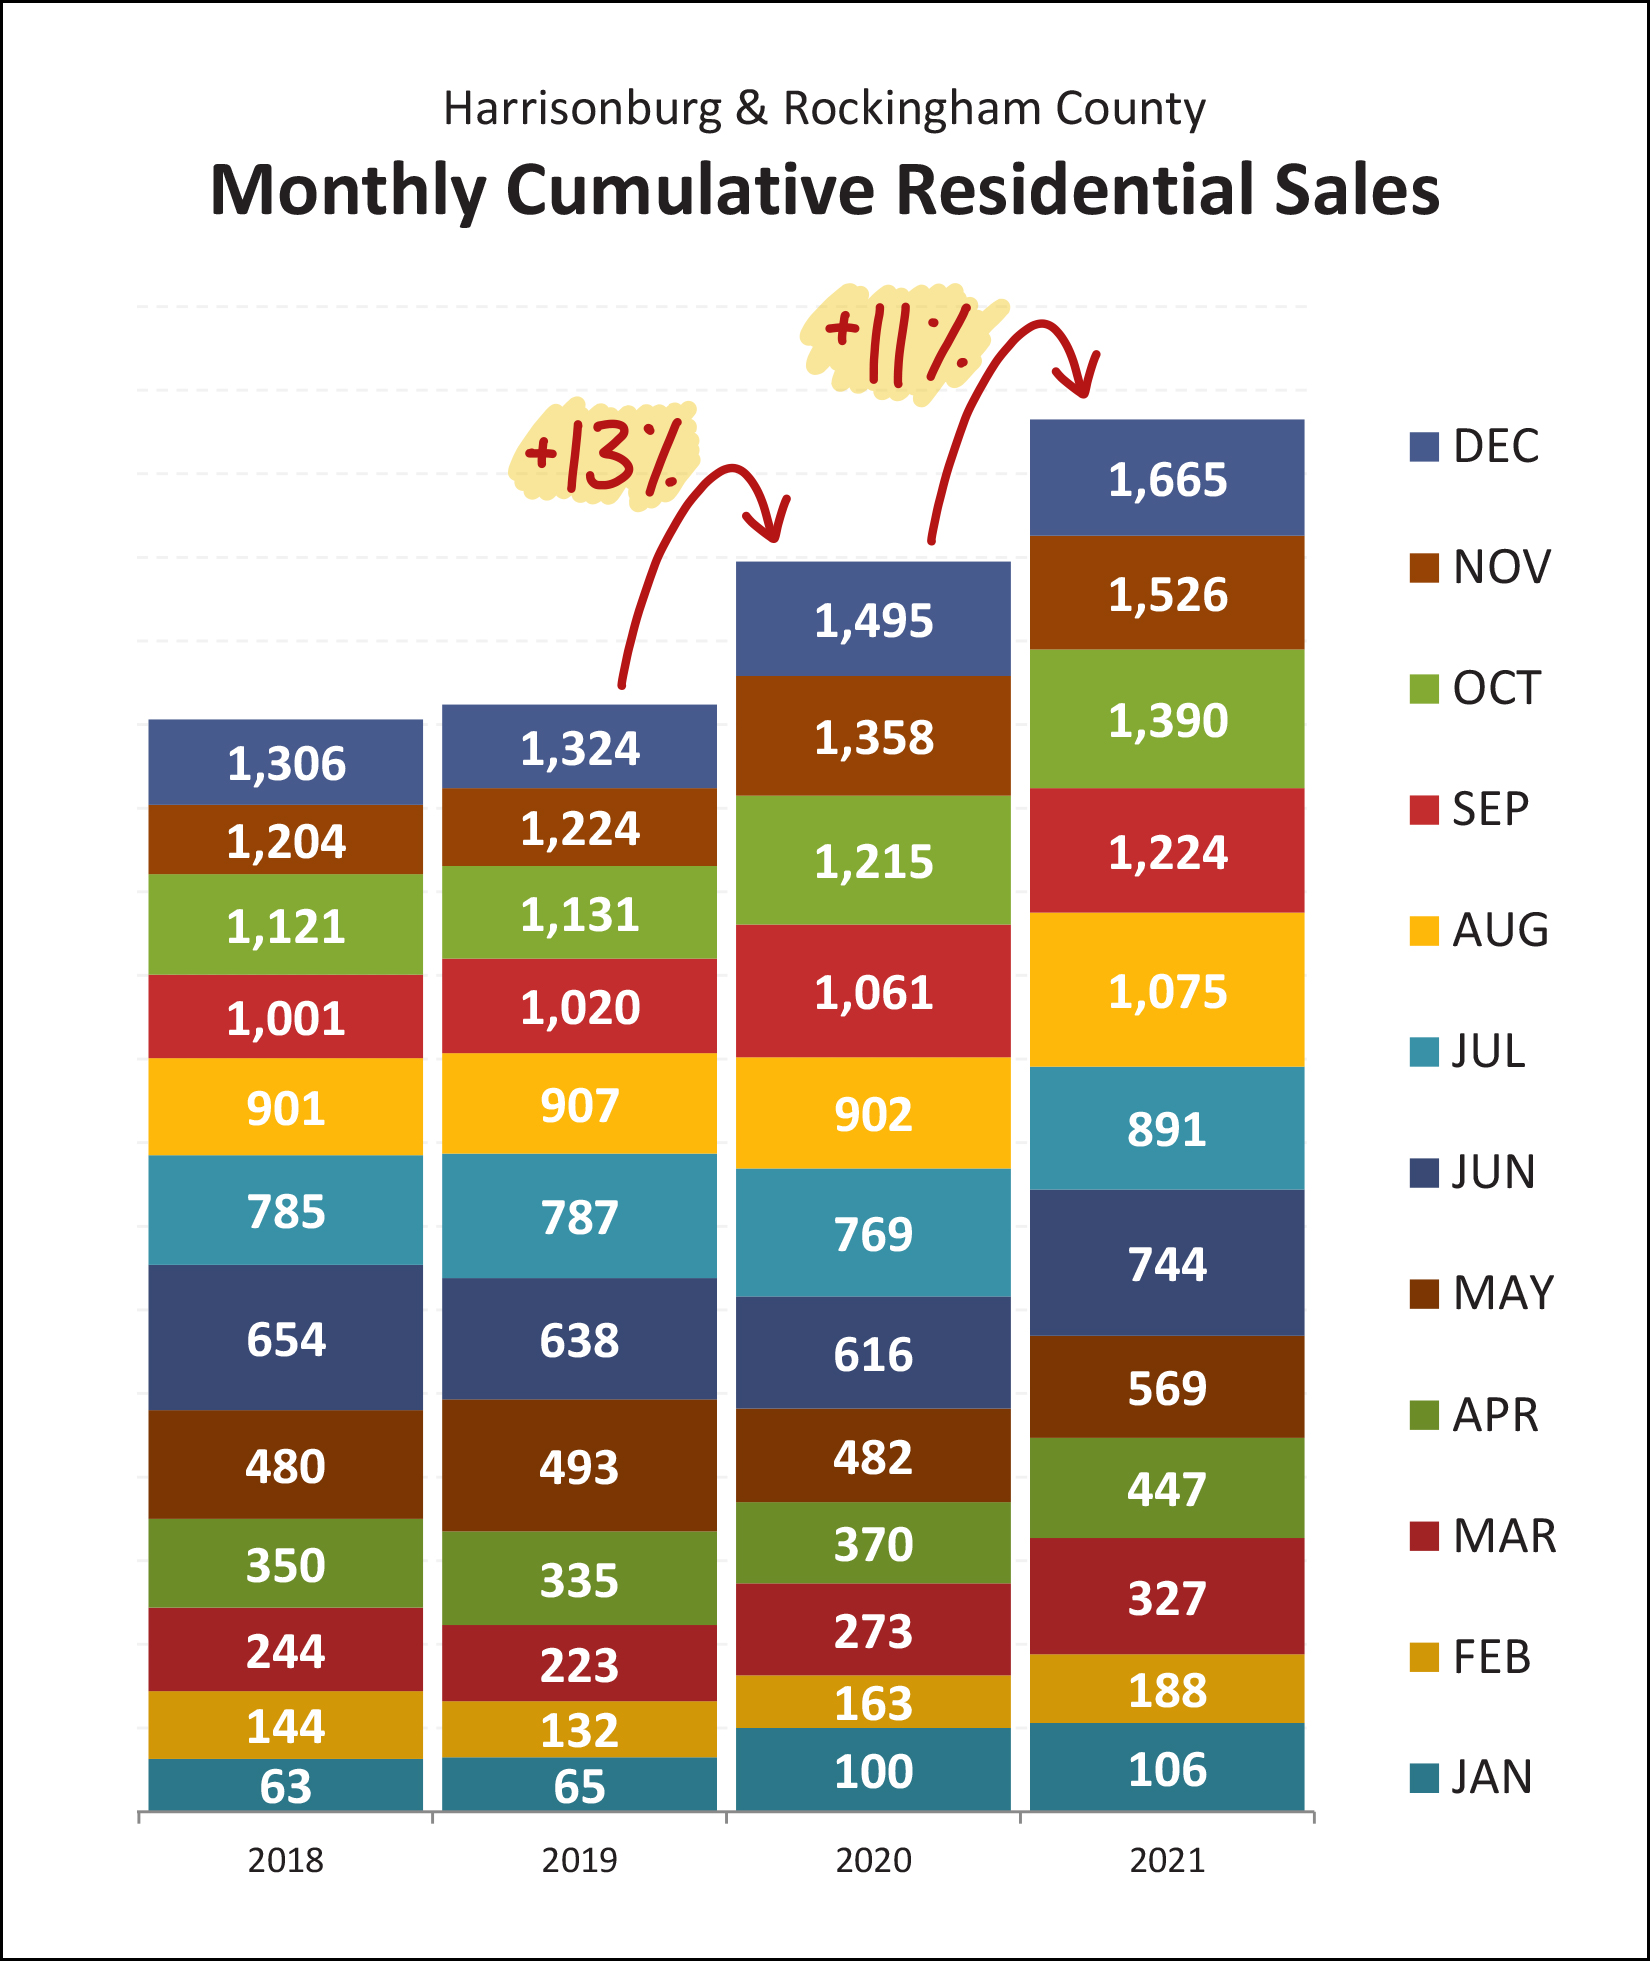 Yes, yes, I know, it's a bit of a stretch. Home sales rose 11% in 2021, so that's not really slowing down, right? Right. But... home sales increased 13% in 2020... and only 11% in 2021... soooo... slowing down, right? ;-) That's probably not an objective characterization of the market. By all accounts, the market sped up in 2021, even if the definitely-faster-than-normal acceleration was slightly slower than in 2020. We'll go with that. Looking now, at detached home sales trends on a graph... 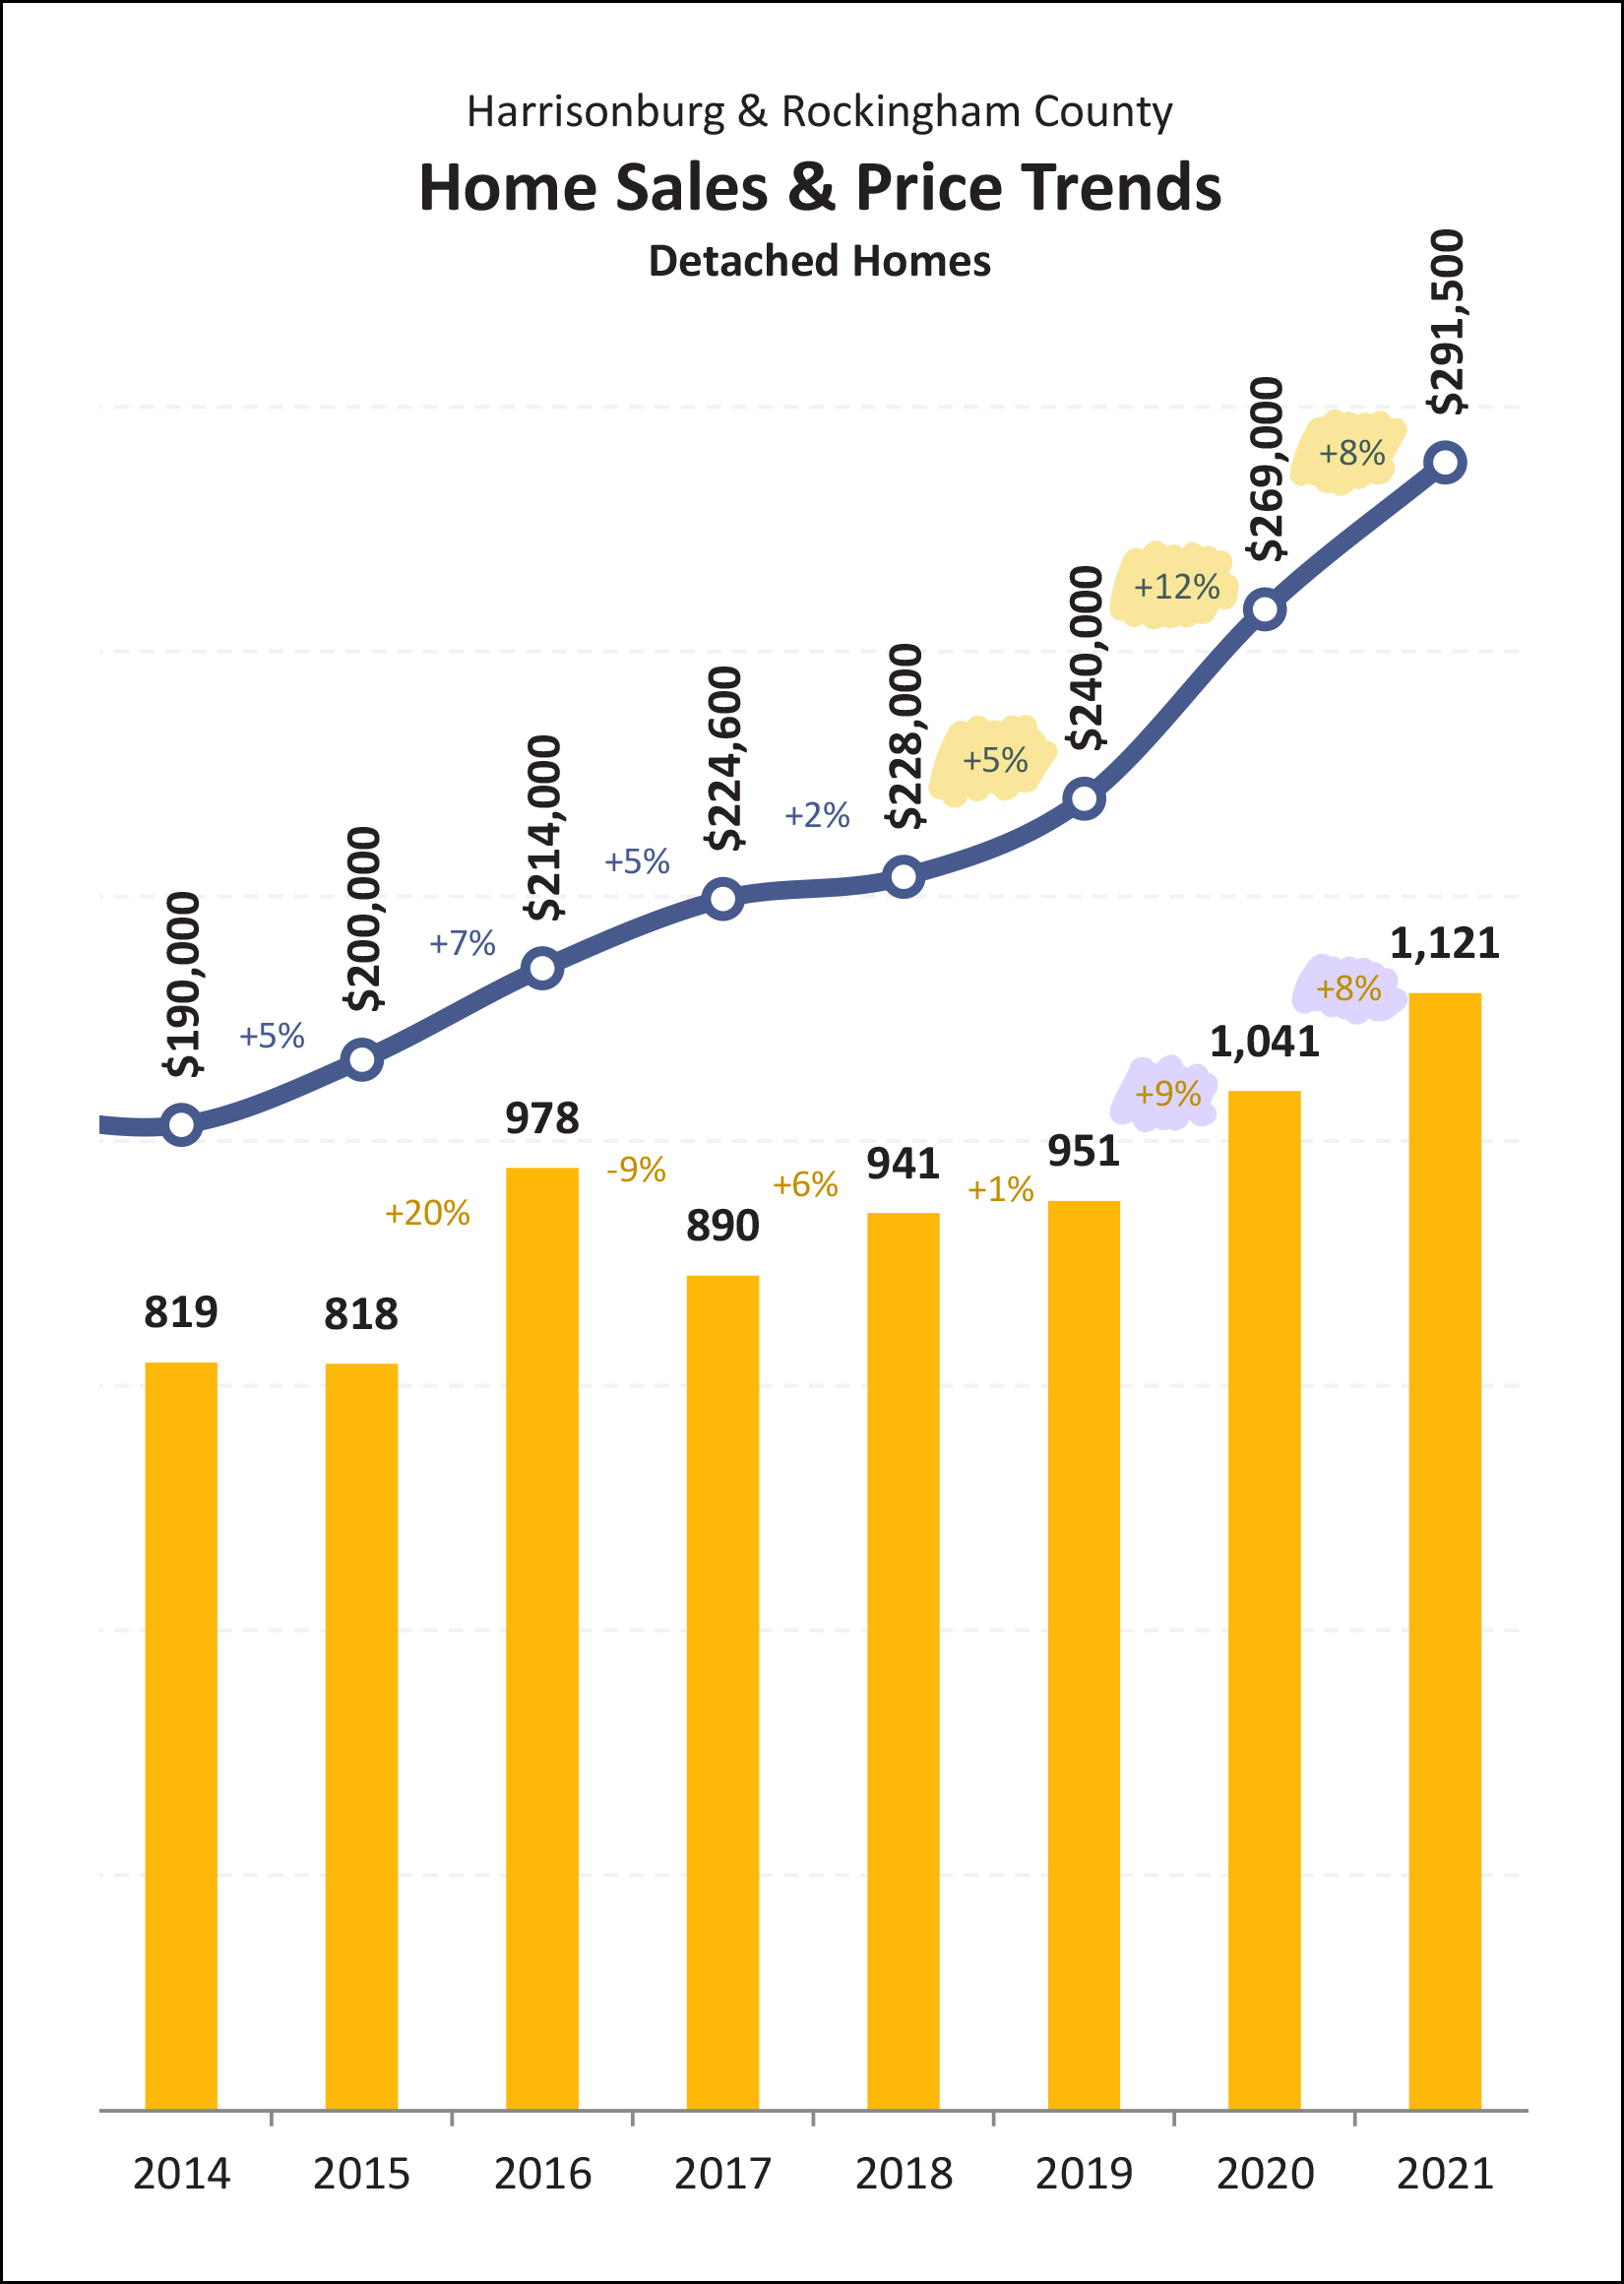 When looking at detached home sales only: The pace of detached home sales increased 8% in 2021... after having increased 9% in 2020. The median price of detached home sales increased 8% in 2021... after having increased 12% in 2020. So, maybe flattening out, barely, slightly, slowly? Or maybe not. And how about the attached home sales market? 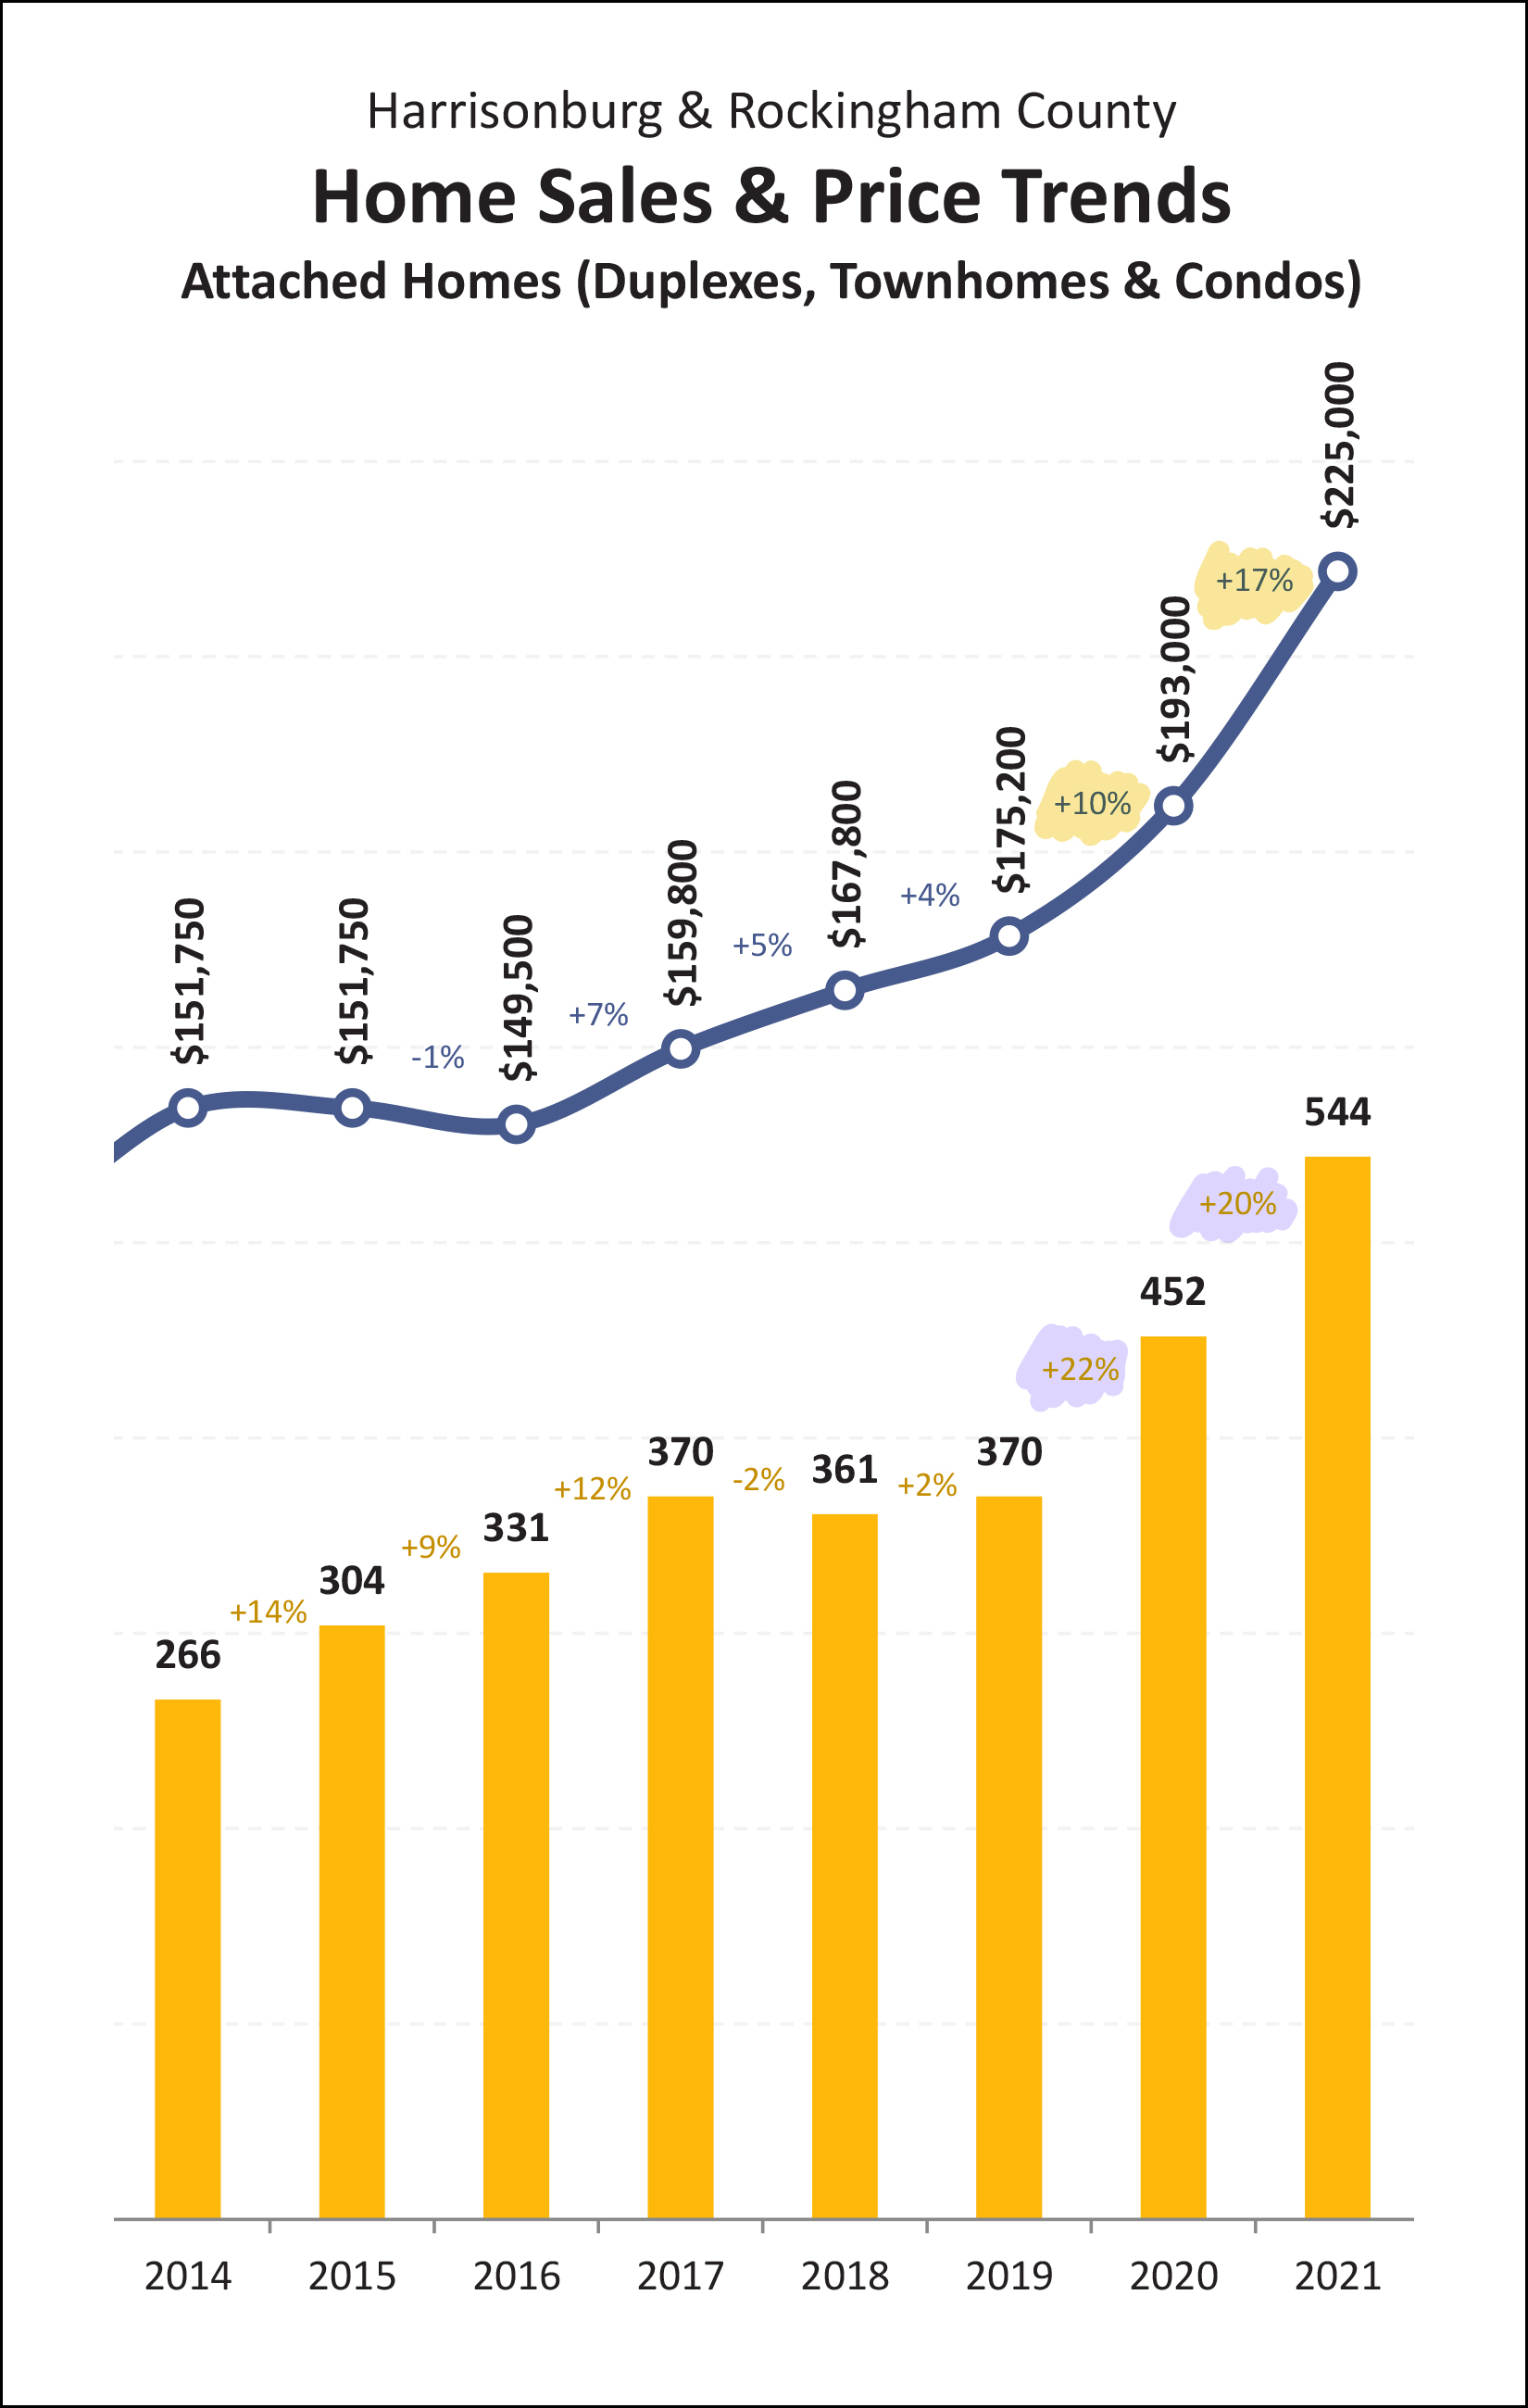 When looking at attached home sales only: The pace of attached home sales increased 20% in 2021... after having increased 22% in 2020. The median price of attached home sales increased 17% in 2021... after having increased 10% in 2020. Right, so, in such a strong seller's market are sellers having to negotiate much? 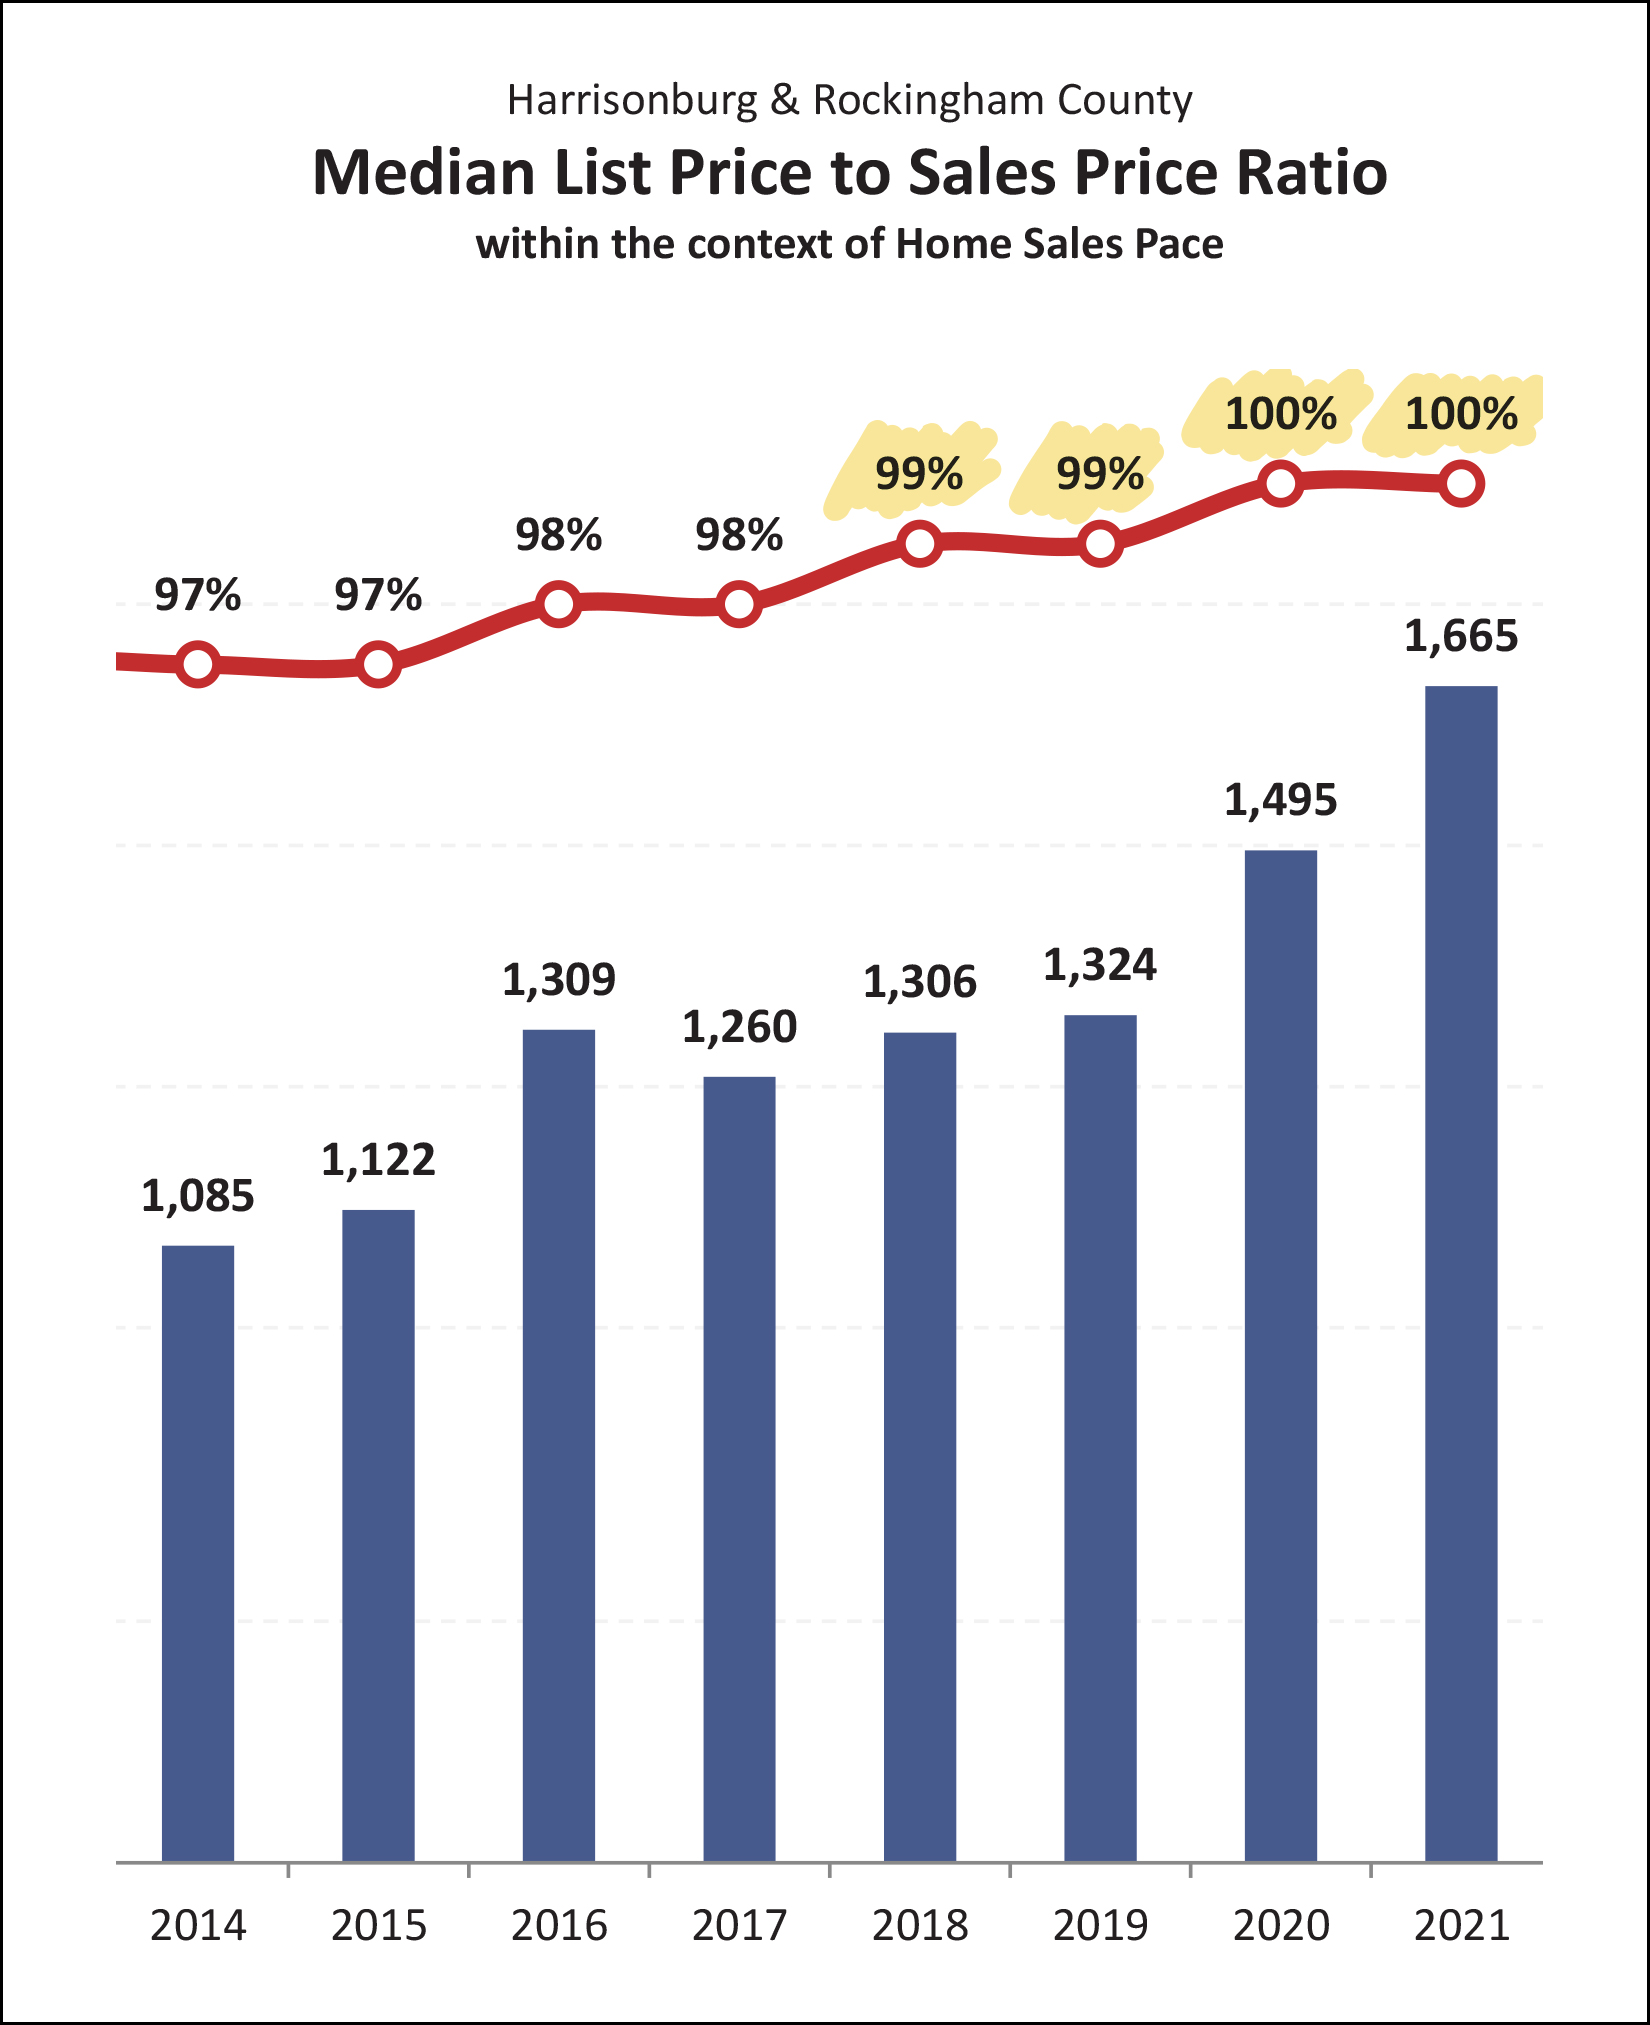 We'll say "nope" -- sellers are decidedly NOT negotiating much, at all! Half of buyers paid 100% or more of the list price of the house that they purchased in 2021... following the same trend as in 2020! So, unless a house is obviously overpriced, and perhaps has been on the market for weeks or months, you likely won't be negotiating much if any as a buyer. Sooooo much buyer interest and activity has lead to inventory levels falling, and falling and falling... 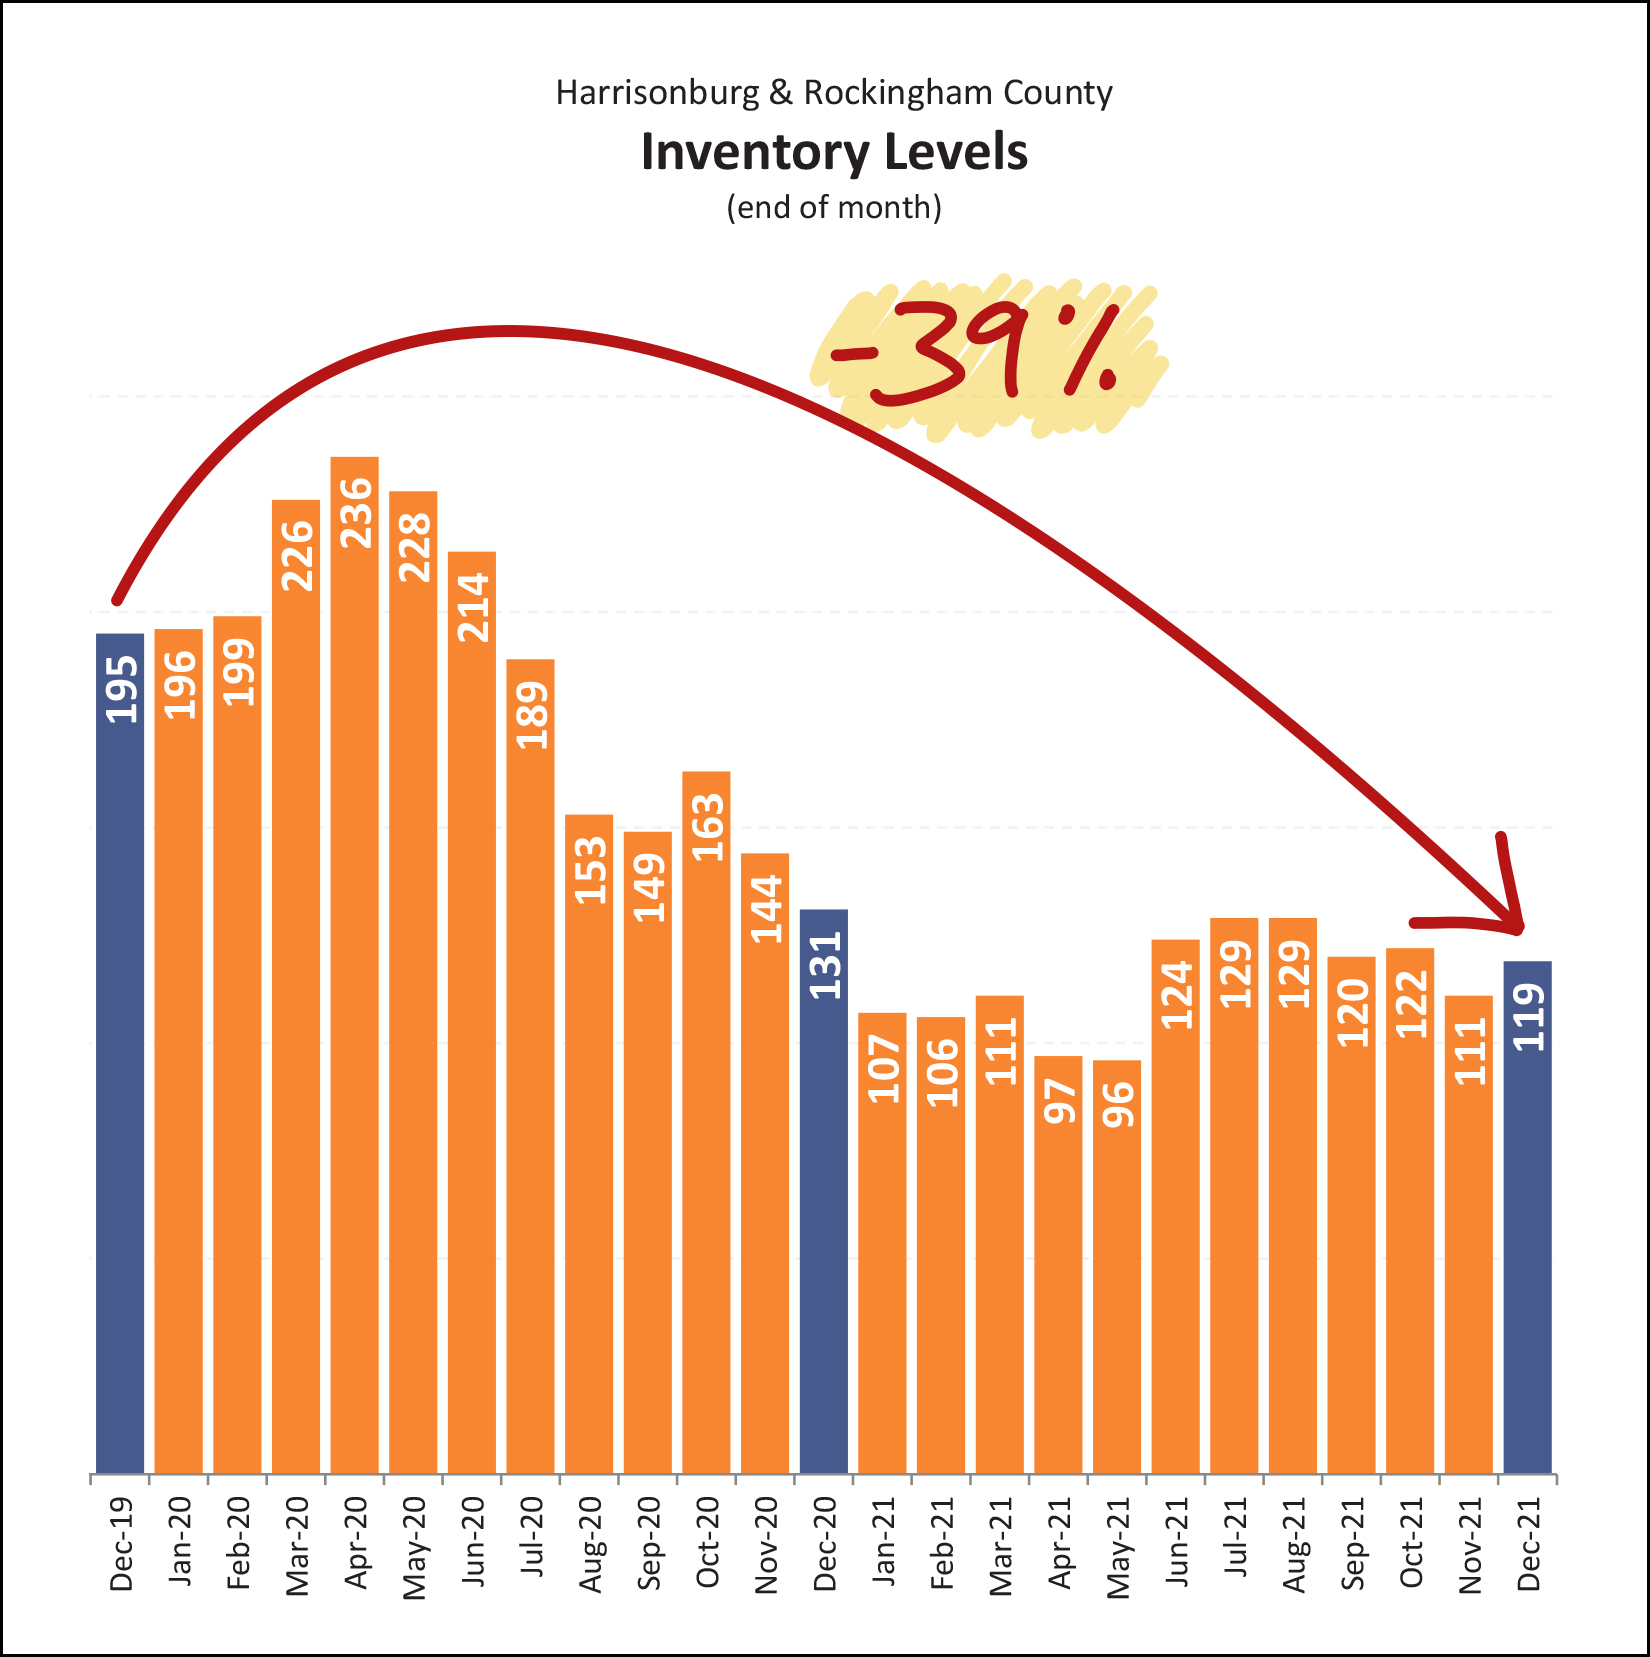 We are now experiencing (and have been for the past year) the lowest inventory levels I've ever seen. There are currently only 119 homes on the market in all of Harrisonburg and Rockingham County, which is 39% fewer options for buyers (at any given time) than where we were just two years ago! Which is probably why listings are going under contract SO quickly... 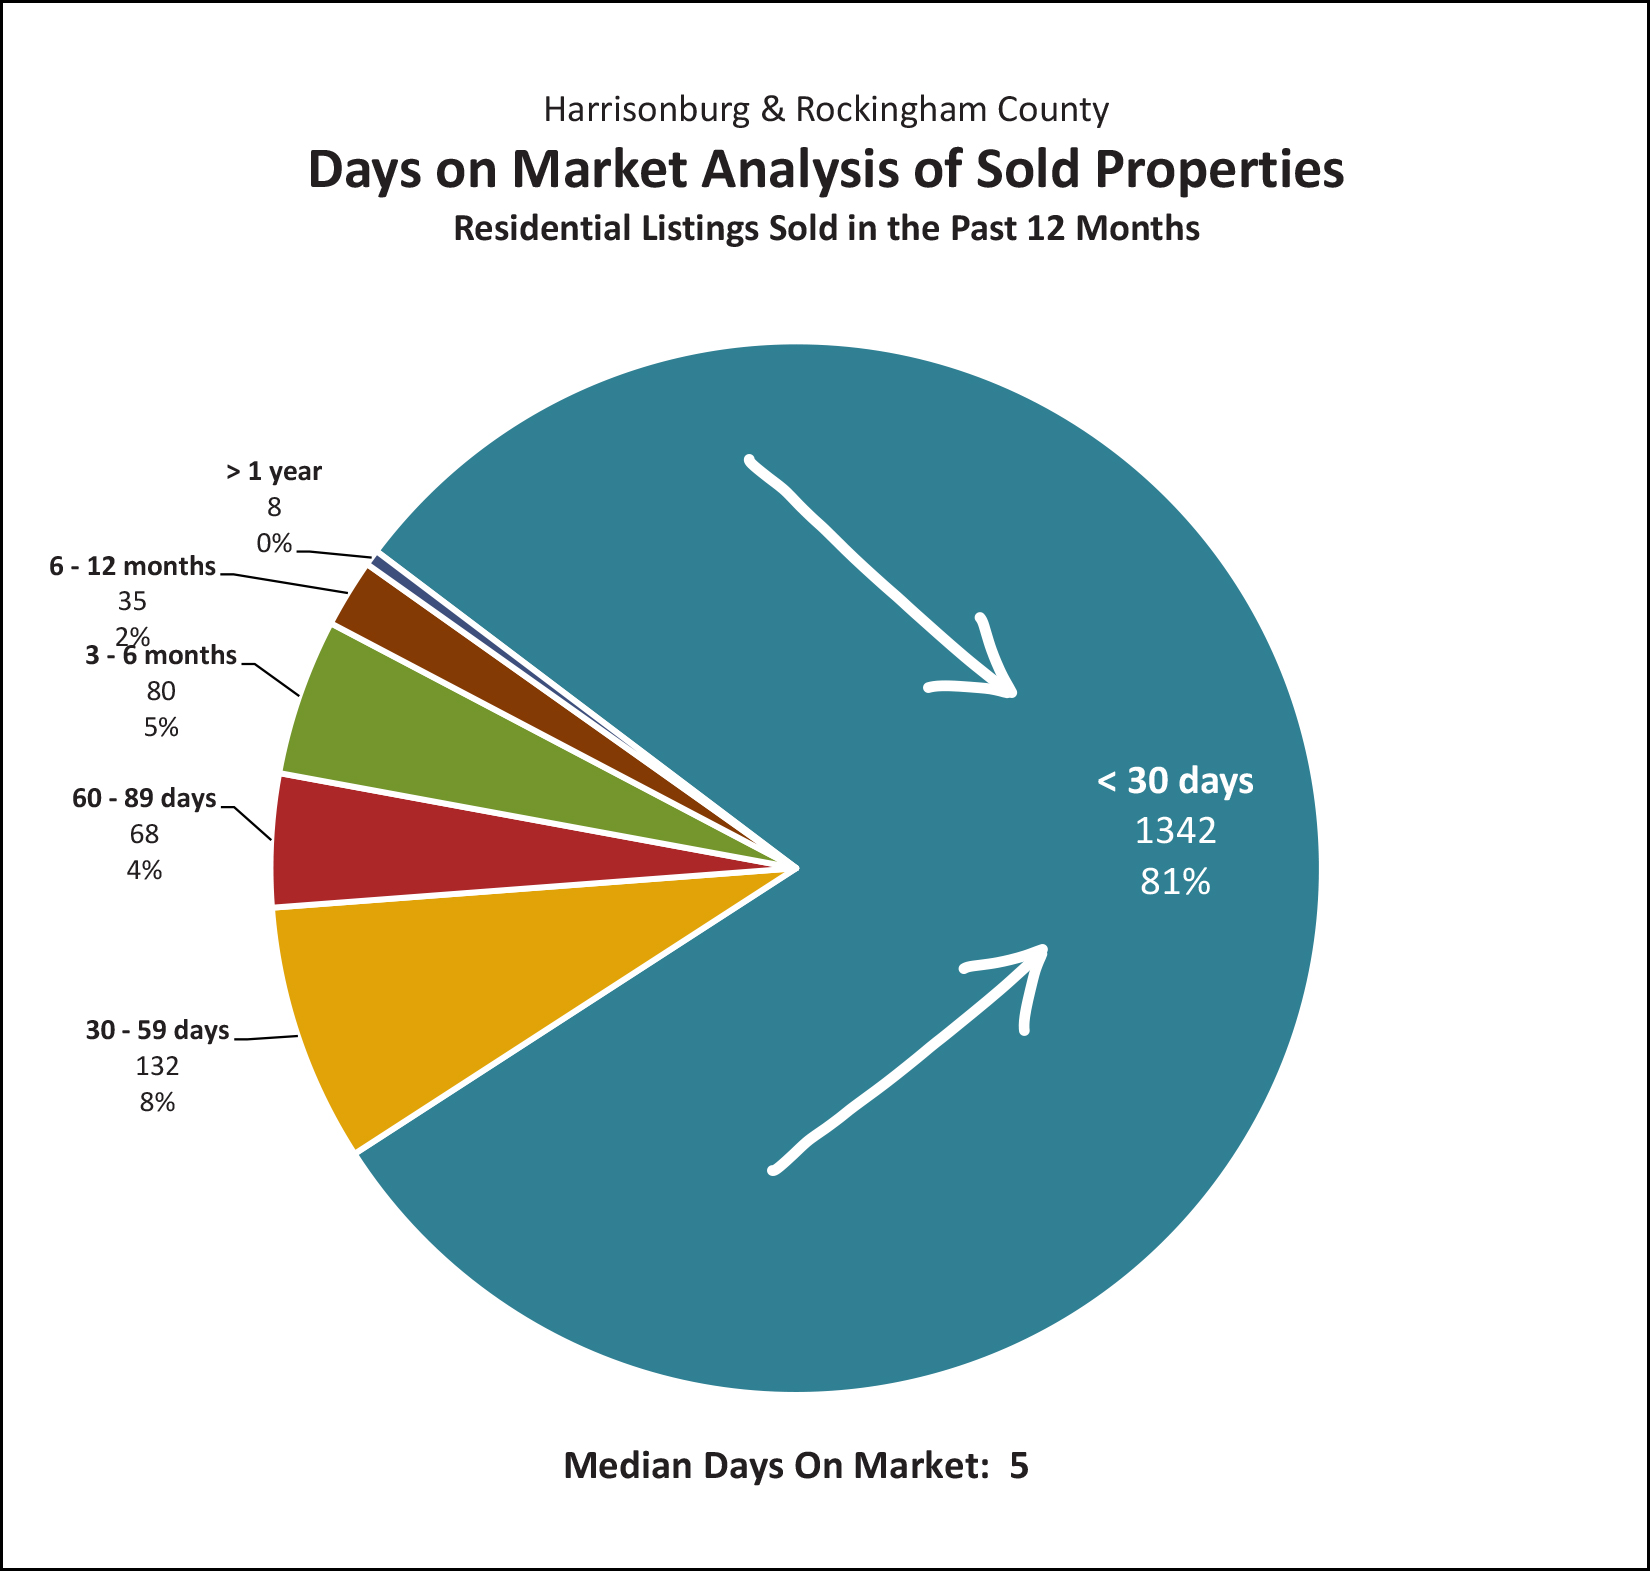 A whopping 81% of all houses that sold in 2021 went under contract in the first 30 days of being listed for sale. And as mentioned earlier, the median is five days... so half of properties sold are going under contract in five or fewer days. Speedy! 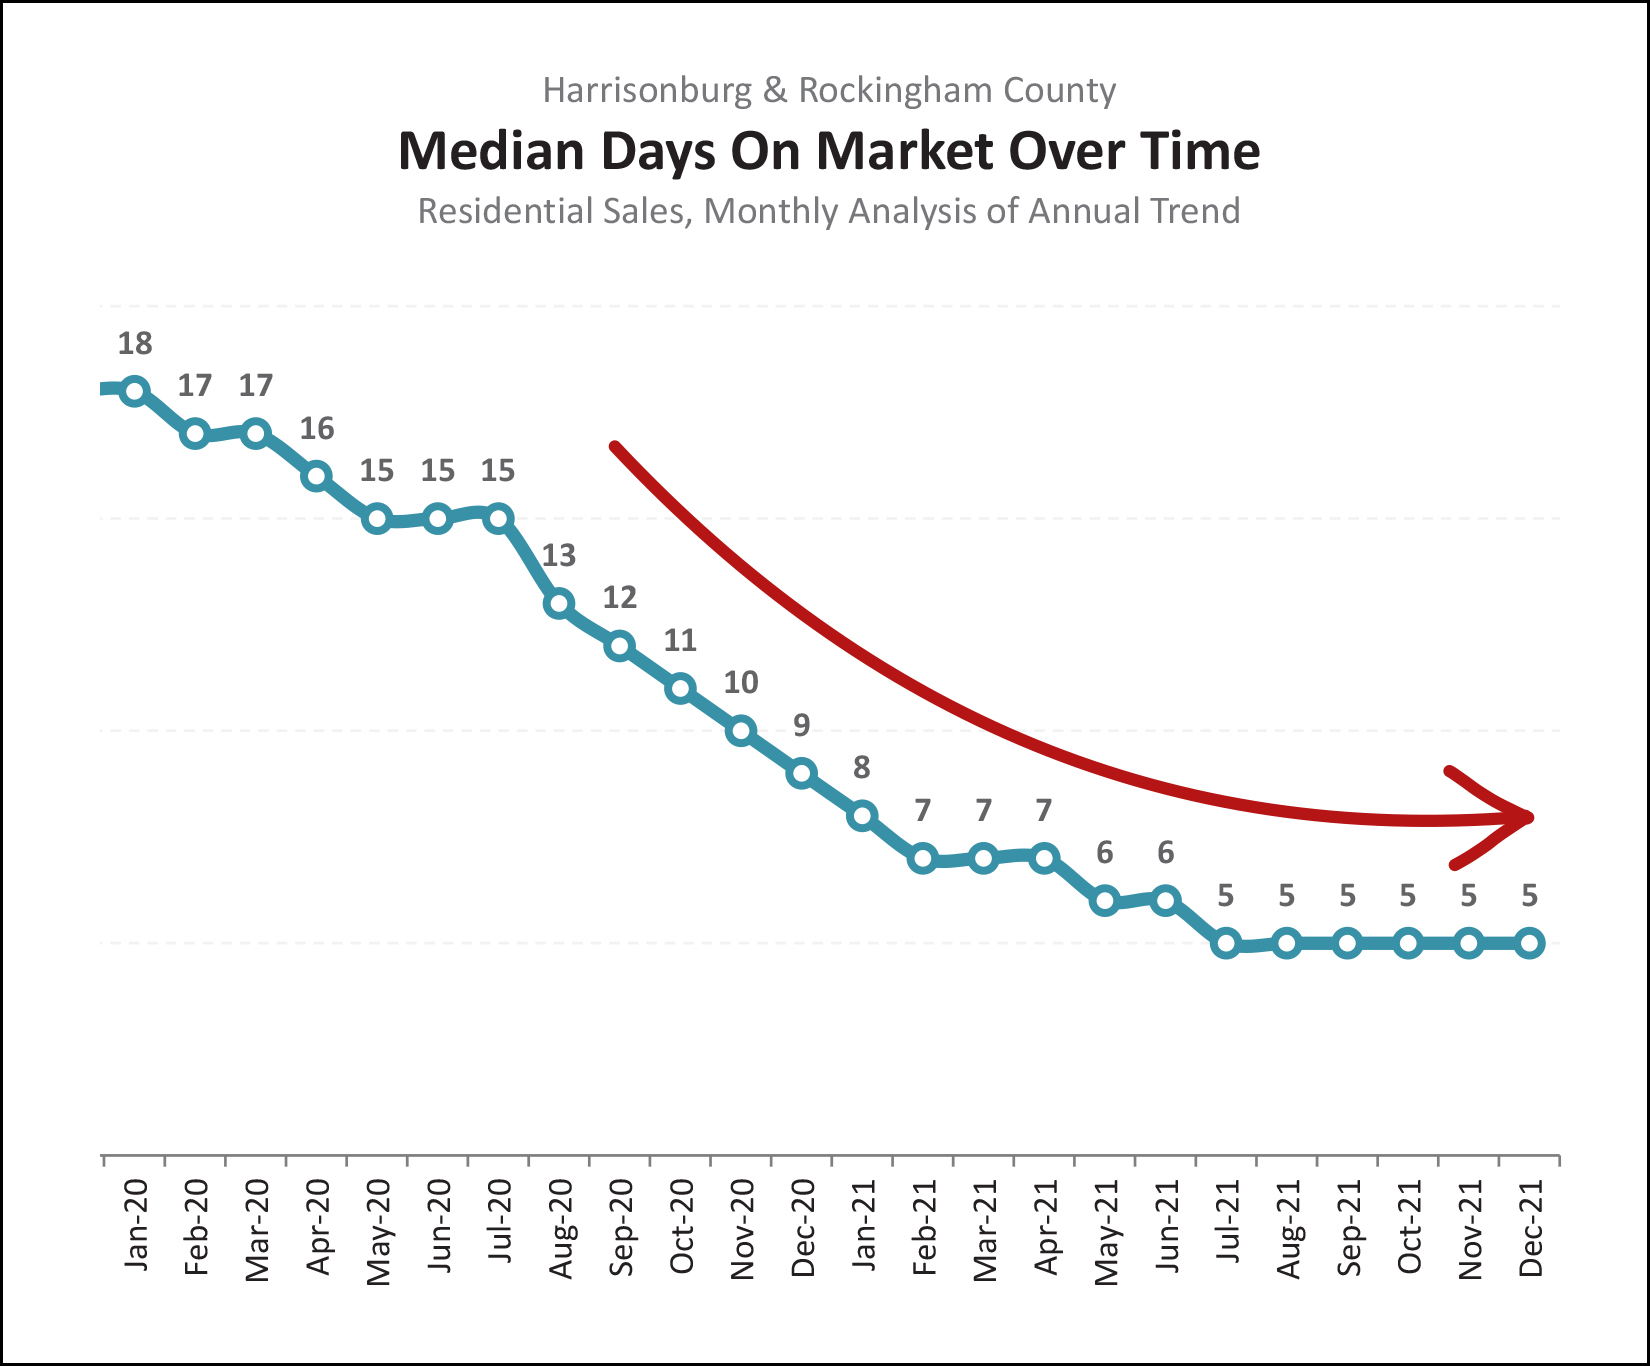 Visualized slightly differently, the graph above shows the annual trend in median days on market... so... homes have been going under contract faster and faster and faster over the past year and a half. It doesn't actually seem that they can go under contract any faster than they are now. If or when the market starts to slow down, we'll likely see it first in a change in this metric of how quickly homes are selling. Finally, did you hear mortgage interest rates are rising? 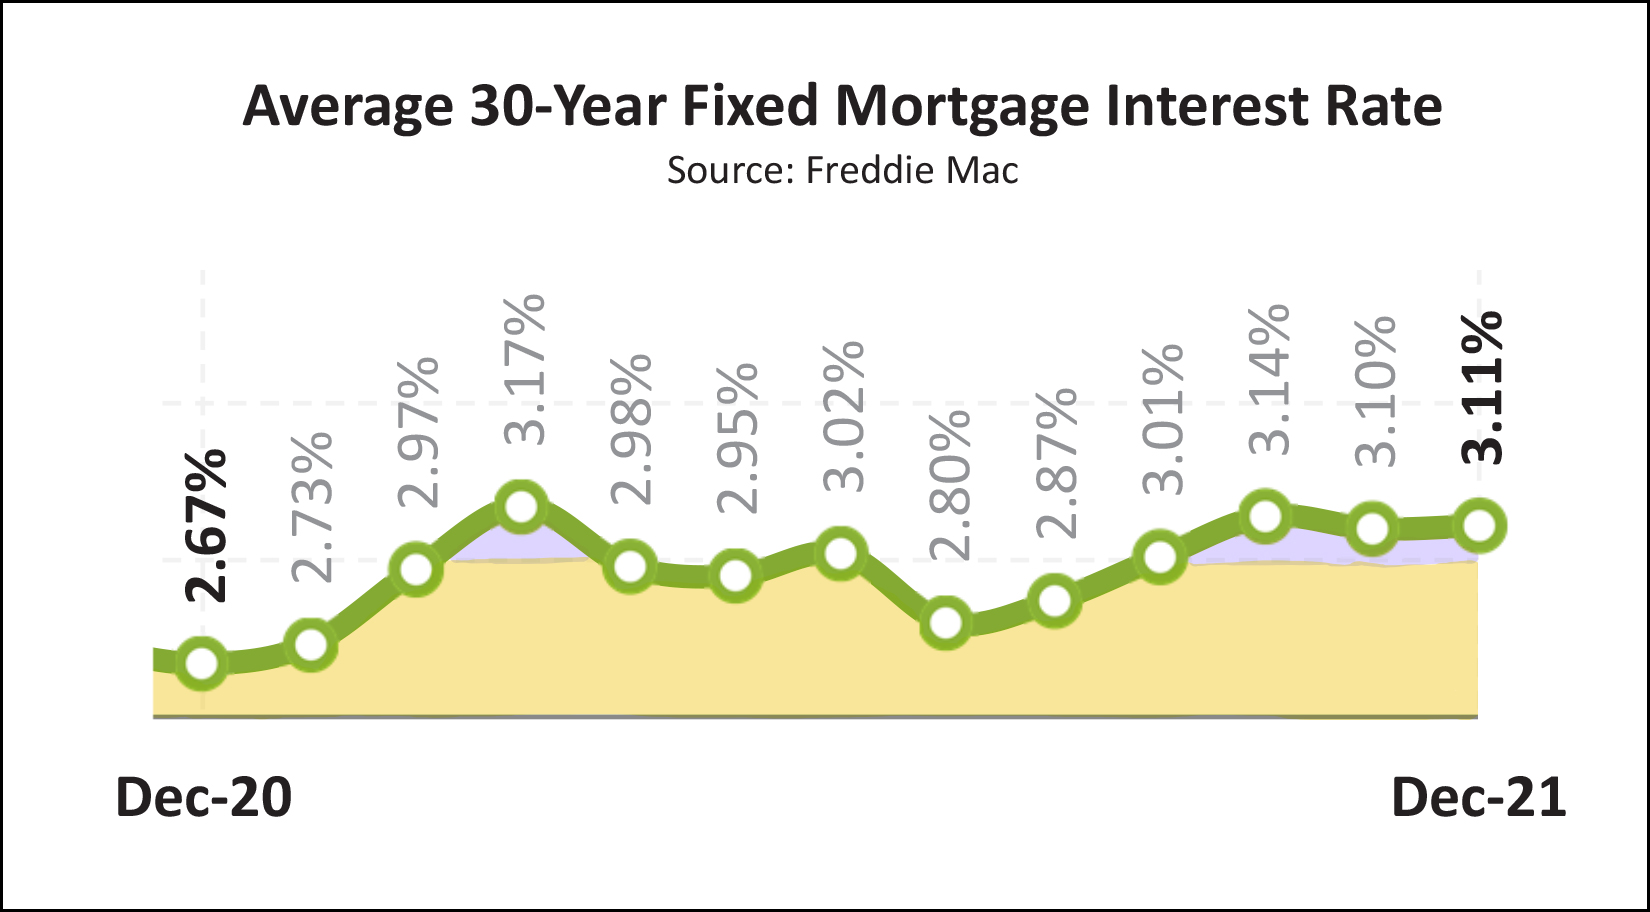 Ha ha, sort of, kind of, but not meaningfully. Mortgage interest rates stayed below 3.25% for the entirety of 2021! This is so low in any historical context, that an increase over the past six months from 2.8% to 3.1% is not overwhelming or concerning to most buyers. As shown above, the average mortgage interest rate was actually at or below 3% (!) for most of the year! And... just like that... we have reached the end of my recap of the 2021 housing market in Harrisonburg and Rockingham County. Do you have questions about this data or these graphs? Or do you have questions that this data and these graphs did not answer? Ask away... just reply to this email! Finally, if 2022 will be the year that you hope to buy or sell a home, let me know if I can be of help to you with that process. I'd be delighted to work to help you accomplish your goals of buying or selling this year. Just reach out by email, phone or text (540-578-0102) and we can set up a time to meet to discuss your dreams, goals and timing! Now, go find that snow shovel and start doing some stretches to prepare for some extended shoveling time... they're now calling for 11 inches of snow for the Harrisonburg area on Sunday! | |
My Predictions for the 2022 Real Estate Market in Harrisonburg and Rockingham County |
|
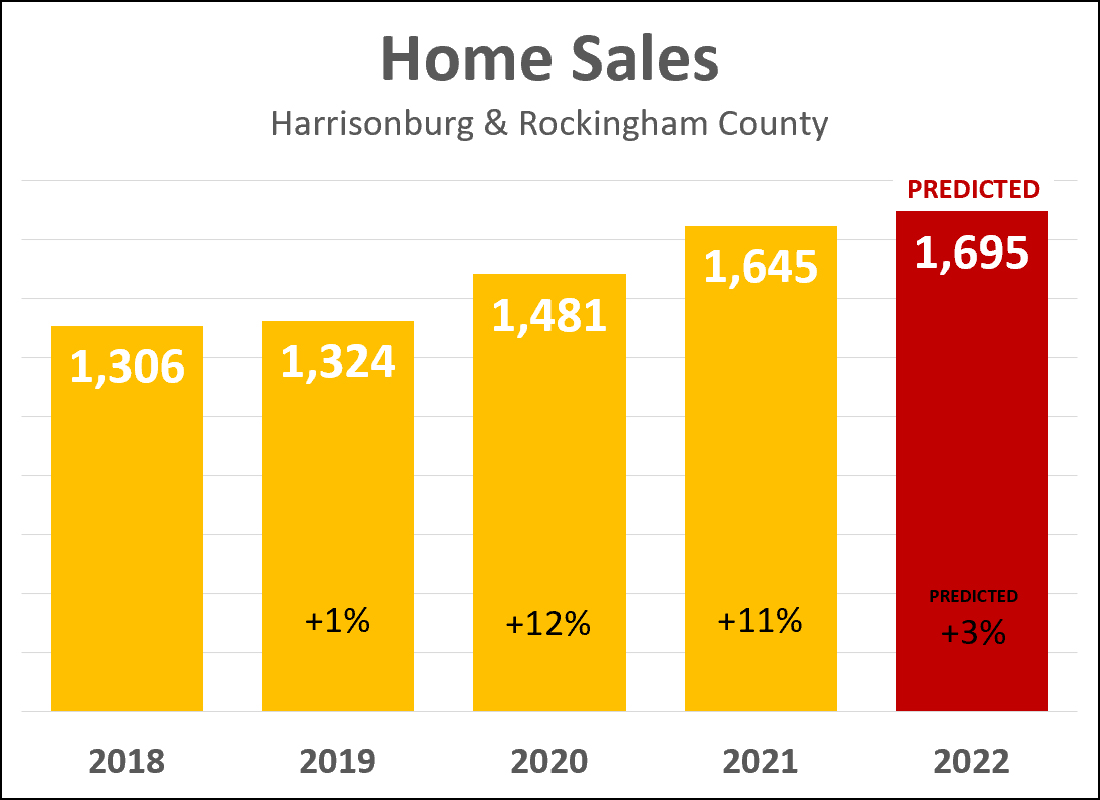 Keep in mind as you read this that I was horrendously off target with my 2021 predictions for our local housing market. :-) But, that being said, here's what I'm predicting and why... As shown above, there have been big gains in the number of home sales per year over the past few years in Harrisonburg and Rockingham County.
Why, then, am I being so conservative and predicting that we'll only see a 3% increase in the amount of homes selling in this area in 2022?
The usual disclaimer applies - I am very comfortable in saying that I might be completely wrong with this prediction...
Now, then, where will prices be headed in 2022? 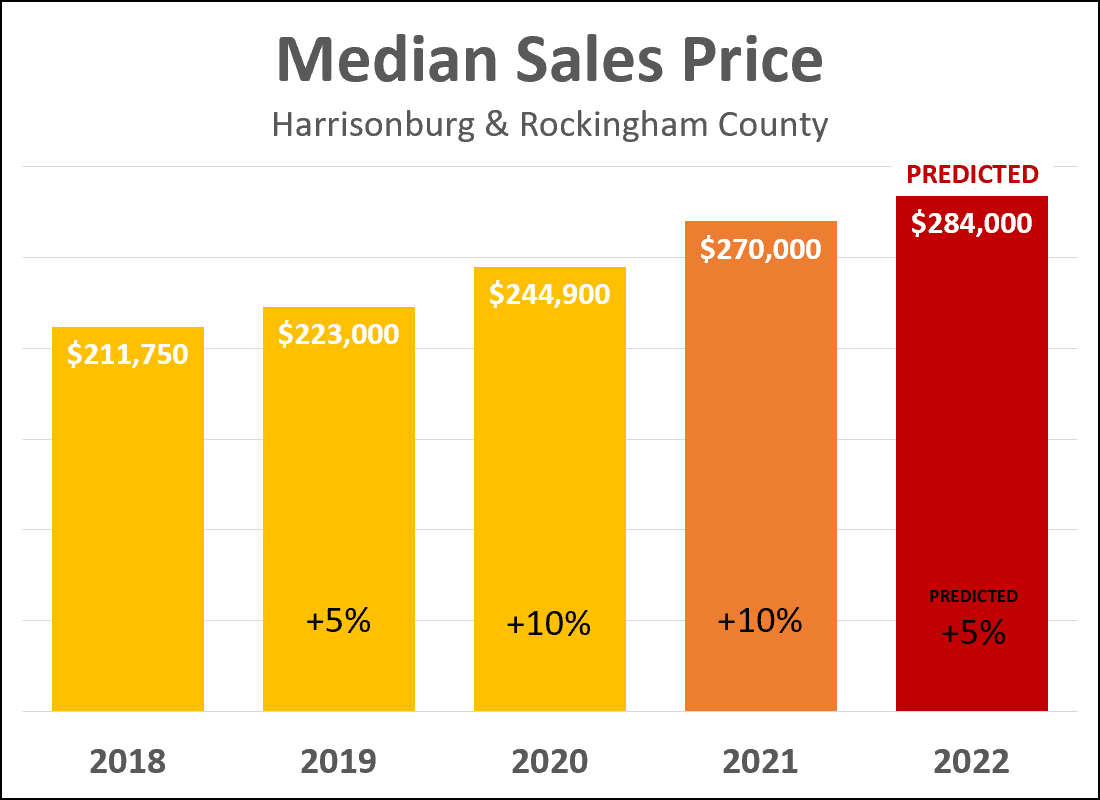 Sales prices of homes in Harrisonburg and Rockingham County increased dramatically over the past two years...
You'll note above that I am predicting a 5% increase in the median sales price over the next year. I'm actually split between two theories, and I ended up averaging them out for my prediction. :-)
So, which of these changes will we see this year in the median sales price? Will it be 0% or 2% or 5% or 10%? You'll note that I am not predicting a decline in the median sales price. Some (not many) home buyers seem to be thinking or hoping or theorizing that home prices will eventually come back down if they wait long enough. That seems relatively unlikely -- so I am not including declining sales prices as one of my predictions for 2022. Well, that about sums it up... I think we'll see 3% more home sales in 2022 at prices 5% higher than in 2021. But I'm ready to be wrong... quite wrong! What do you think? Where will sales and prices head as we move into 2022? | |
Harrisonburg Housing Market Is Hot, Hot, Hot In 2021 |
|
 Happy Tuesday Morning, and welcome to day two of another surprisingly warm December week in the Shenandoah Valley! This month's market report is brought to you by... fire...  Why fire, you ask? Partly because the local real estate market is... on fire! ;-) OK, perhaps that one was too obvious. Secondly, though, because it's a great time of year to gather around a fire in the evening and spending time talking about the important things in life. Be that around the fireplace in your home... or huddling around a fire pit, barely staying warm as an evening stretches on. The fire above is in our recently built fire pit in our backyard... where I recently gathered with several friends and we talked and laughed well into the night. However you spend your evenings in the coming weeks... around a fire, or otherwise... I hope it is a time of conversation and connection with those who matter most in your life. But now, back to that local real estate market... which, yes, is on fire... The photo on the cover of this month's market report is an aerial view of Congers Creek where new townhomes are being built and offered for sale near Sentara RMH Medical Center. Also, before I start into the charts and graphs, you can also download a full PDF of my market report here. Now, let's throw another log on the fire and sort through this month's data... 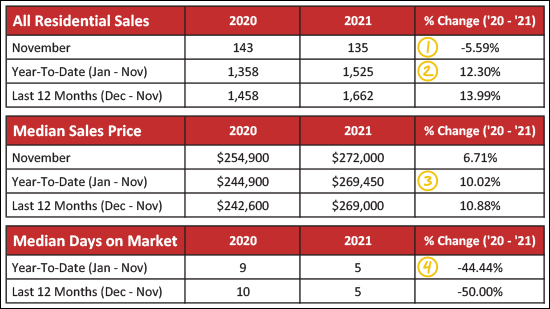 A few things to point out in the data table above... [1] Home sales were actually a bit slower this November than last. We saw 135 home sales this past month -- compared to 143 last November. [2] Despite a slightly slower November, we have seen quite a few more home sales in the first 11 months of this year than last. There were only 1,358 home sales in the first 11 months of last year and we've seen 1,525 home sales in the same timeframe this year. [3] The median sales price of homes sold in Harrisonburg and Rockingham County is 10% higher this year (Jan-Nov) than last year... having risen from $244,900 to $269,450! [4] Homes are selling almost twice as fast this year (5 days) as last year (9 days) as per the change in the median days on market. Now, just to point out a few differences in the market for detached homes and attached homes, which includes townhouses, duplexes and condos... 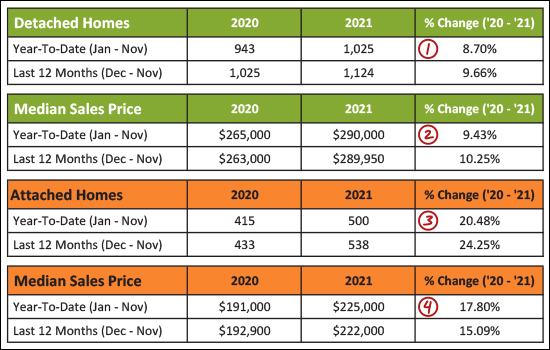 As shown above... [1&3] We've seen almost a 9% increase in the number of detached home sales selling this year as compared to last year -- but a much more significant 20% increase in the number of attached homes that have sold. [2&4] The median sales price of detached homes has risen 9% this year -- but -- wait for it -- the median sales price of attached homes has risen 18% over the past year. This is a significant increase for attached homes, from a median sales price of $191,000 up to $225,000. When we start looking at month to month sales data, things get a bit odd... 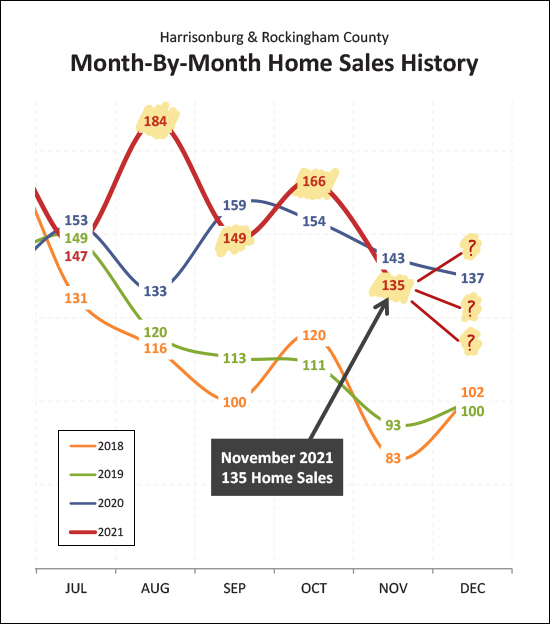 Perhaps everything is a bit odd this year? :-) The red line above shows the number of home sales each month in Harrisonburg and Rockingham County, as compared to the blue line which is showing 2020 home sales. As you can see, home sales were extraordinarily strong in August and October... and then slower than last year in September and November. So... what does December hold in store for the local housing market? It's anyone's guess! :-) But regardless of what happens in December... this year has already outperformed last year... 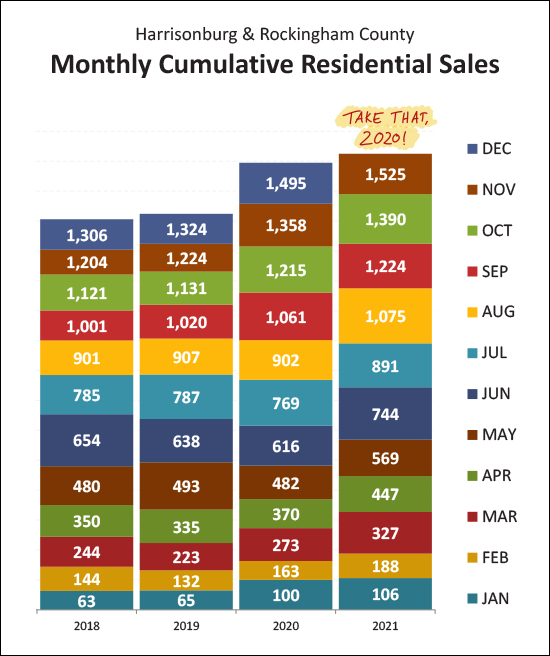 Indeed, after just 11 months this year we have seen 1,525 home sales as compared to only 1,495 in all of 2020. There was a significant increase in local home sales in 2020 and in early 2021 there were doubts as to whether 2021 could really stay on pace with such a robust year last year. Well, 2021 is finishing out strong.. already having broken through the high water mark set last year. Now, a quick -- startling -- observation about the changing values of detached homes in our area... 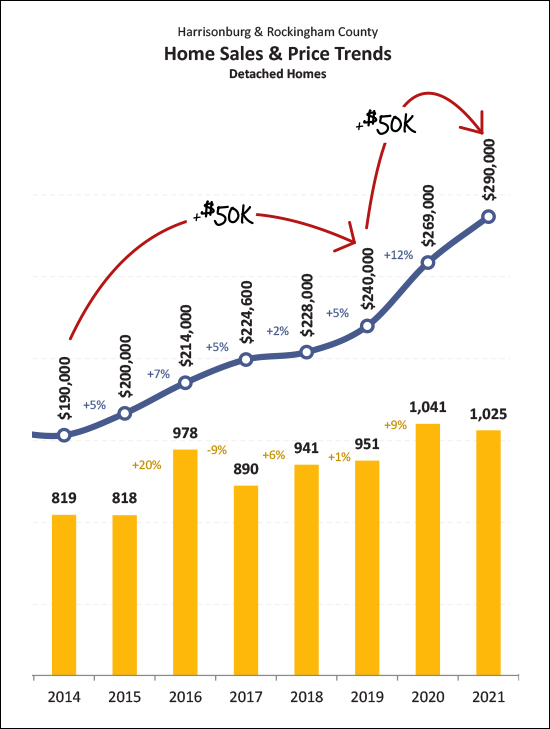 Maybe you already picked up on it based on the graph above... but... WOW! [1] Over the course of five years (2014-2019) the median sales price of detached homes increased by $50,000. Then, over the course of only two years (2019-2021) it did it again! ...and... [2] Over the past seven years (2014-2021) the median sales price of a detached home in Harrisonburg and Rockingham County has increased by $100,000... from $190,000 up to $290,000! These are startling changes in property values in our area over the past seven years, especially if you haven't been reading my monthly report each month for the past 84 months! ;-) Now, moving beyond what's selling, let's look for a moment at current inventory levels of homes that are available for sale. Remember, though, that these figures are showing "moment in time" inventory levels. There have been plenty of homes offered for sale in recent months even if very few are on the market now. First, let's look at houses for sale by property type... 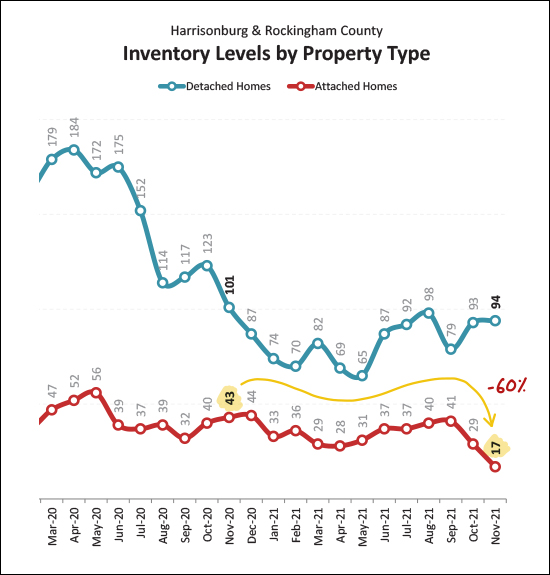 This one surprised me. I knew that inventory levels were dropping, but I didn't know how far they had declined when it came to attached homes -- townhouses, duplexes and condos. A year ago there were 43 attached homes on the market for sale -- now, only 17 are currently available for sale. This 60% decline means that buyers are snapping up attached homes faster than sellers are listing them for sale or building them. But wait, there's more. Take a look at this breakdown between the City and County... 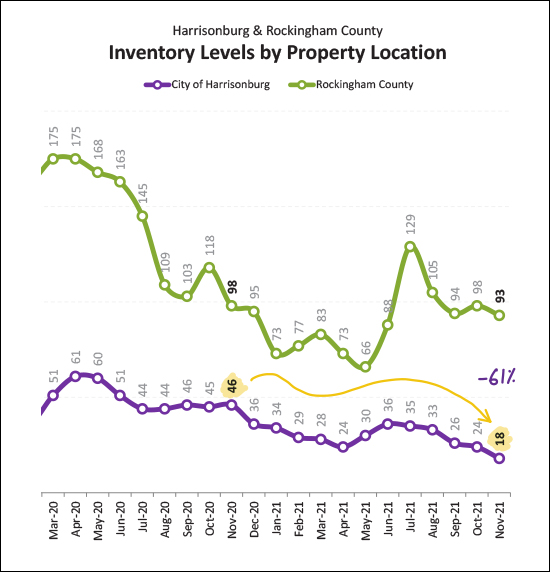 Again, this graph reveals a rather surprising trajectory. A year ago there were 46 homes for sale (detached or attached) In the City of Harrisonburg. Today there are only 18 homes for sale in the City. Read that twice, perhaps. There are only 18 homes (detached homes, townhouses, duplexes, condos) currently available for sale in the City of Harrisonburg. Again, this is an indication that buyers in the City are snapping up homes more quickly than sellers are selling them. Despite the 50 to 60 degree temperatures of late, you might be wondering if the market is remaining strong as we head into the winter... 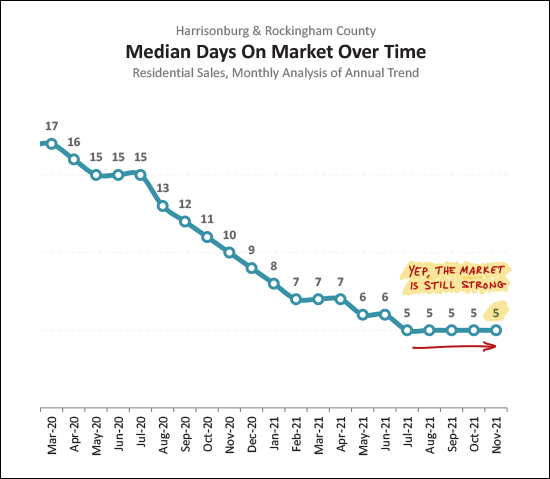 Indeed, the market is remaining strong. The graph above shows the median number of days it took for houses to go under contract - with each data point calculated from the properties going under contract in the previous 12 months. As you can see, we have sort of bottomed out at a median of five days on the market here over the past five months. If the market is starting to cool off or slow down, this graph is one of the places we are likely to first see that show up in the data. Given the low availability of houses to purchase, are some buyers thinking about building a house? 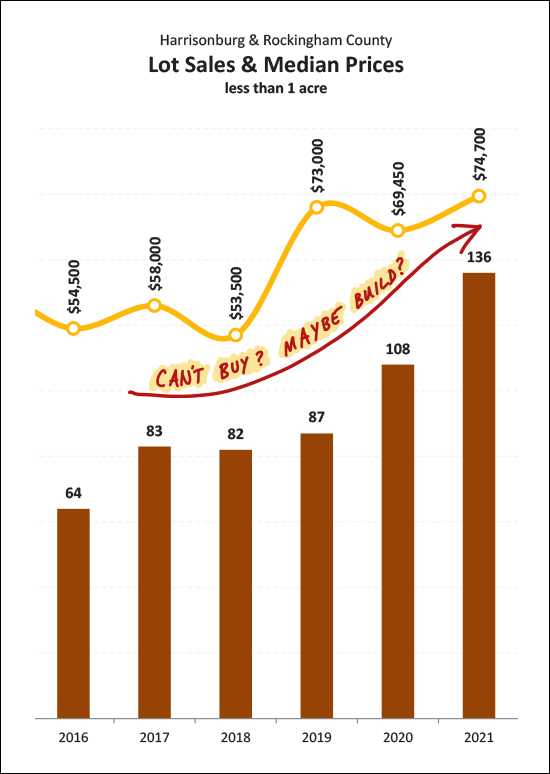 Maybe so! The graph above shows the number of building lots (of less than an acre) sold per year over the past six years. As you can see, the market demand for building lots has been increasing for several years now. Unfortunately, construction costs are also increasing, which may make it at least somewhat difficult for these lot buyers to build a home and stay on budget -- but at least they will have a bit more control over getting the house they want, as compared to competing with many other buyers in the resale market. One last graph and then I'll let you go out in your backyard to start gather kindling for the fire you plan to have this evening. ;-) 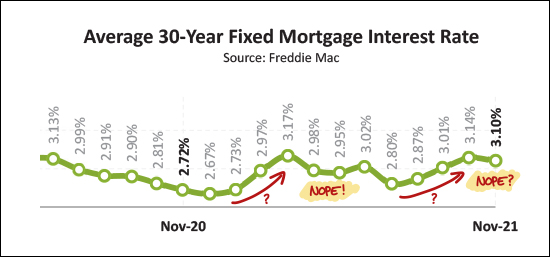 For years I've been thinking mortgage interest rates will be starting to increase. It keeps not happening. Over and over. This year, it seemed -- again -- they were definitely going to increase. Back in January through March it seemed we were headed that way -- but, nope. Then again in August, September and October, but then, maybe not. So, the cost of money is still extremely low! Alright, that brings this month's overview of our local housing market to a close. Thanks for hanging in there with me if you made it to the end, and I hope the information and context I have provided has been either helpful or entertaining, or both! I hope the last two-ish weeks of 2021 go well for you, and that you are able to enjoy some down time with family and friends. If you enjoy some time around a fire, maybe you can make a s'more for me -- I like the marshmallow to be toasted very, very, very slowly and thoroughly until it is a golden brown on the outside and completely gooey in the middle -- constant rotation of the stick helps. I also find it best to leave the chocolate resting on the graham cracker next to the fire while I toast my marshmallow so that the chocolate will start to melt as well. I know, I know. It's overwhelming to get both gourmet outdoor cooking tips AND real estate updates at the same time. ;-) Finally, as we all look towards 2022, if you are contemplating a home purchase or a home sale in the New Year, let's find a time to talk further about your plans. You can reach me via phone/text at 540-578-0102 or by email here. | |
More Homes Are Selling, Faster, At Ever Higher Prices |
|
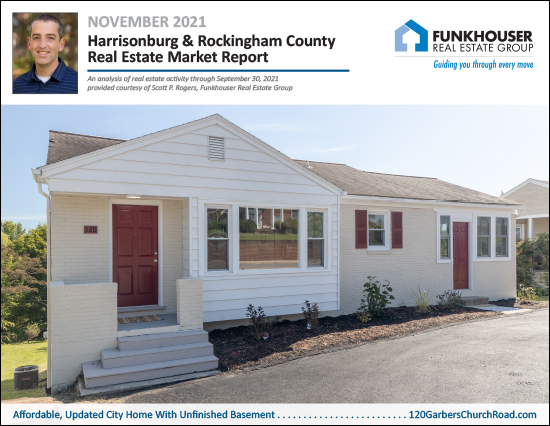 Happy, Chilly November morning, Friends! This month's market report is brought to you by... turkey, stuffing, cranberry sauce, sweet potato casserole, carrot souffle, corn casserole, mashed potatoes and gravy...  Thanksgiving is my favorite meal of the year because of all of the delicious foods offered all at once. This year, my family humored me... and spoiled me... by making me a full Thanksgiving meal for my birthday at the end of October! :-) So, for everyone who hasn't had a full Thanksgiving meal for 11.5 months now, I can tell you from personal, recent, experience, you're in for a treat... nine days and counting! ;-) Speaking of Thanksgiving, there is much in my life for which I am immensely grateful -- my family, friends, health, a job I enjoy, my clients, and much more -- and I hope you are finding much in your life for which you are also thankful this year. I also hope you are able to spend some time this Thanksgiving with family and friends and enjoy a bit of downtime amidst what has been a hectic and stressful year for many. But, enough talking turkey, back to the main course -- the local housing market. ;-) The photo on the cover of my market report is a lovely, updated house on Garbers Church Road, which you can check out here, and you can download a PDF of all of the charts and graphs from my market report here. Now, let's start stuffing our faces with some of the latest stats... 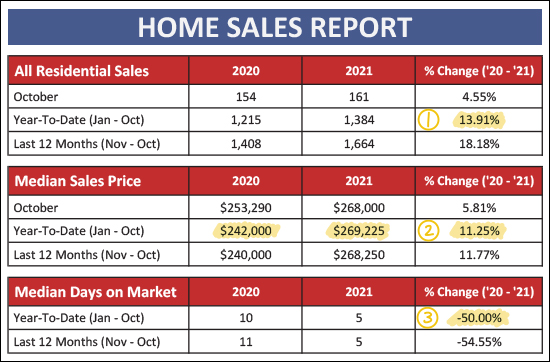 OK, quite a few highlighted items here... [1] We have seen 1,384 home sales thus far in 2021 which is almost 14% more than we saw last year during the same timeframe. The market continues to be red hot with lots of homes selling -- more than any recent year! [2] The median sales price has risen 11.25% in the past year. One year ago, the median sales price (for 2020) was $242,000. Now, that median sales price is $269,225. That is an increase of more than $25,000 in a single year! [3] The time it takes for homes to sell has been cut in half in the past year. A year ago the median days on market was 10 days, and this year it is only five days. That is to say that half of homes are going under contract in five or fewer days! Let's break it down, now, between detached homes and attached homes. Attached homes are duplexes, townhomes and condos... 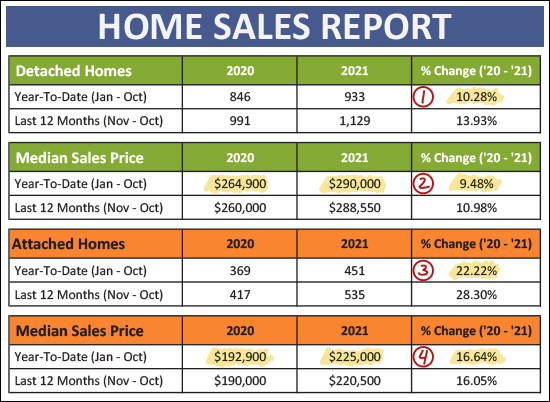 The green charts, above, are detached homes and the orange charts are attached homes, and here's what I'm noticing... [1] We have seen 10% more detached home sales this year -- an increase from 846 sales up to 933 sales. [2] The median sales price of these detached homes has risen 9.5%, from $264,900 up to $290,000. We are now pretty close to a $300,000 median sales price for detached homes in our area. Wow! [3] We have seen even more of an increase in the pace of sales of attached homes, with a 22% increase in those sales from 369 sales last year to 451 sales this year. [4] The median sales price of attached homes has risen even more than detached homes, with a 17% increase from $192,900 up to $225,000. So, many more sales this year than last, and higher prices! It's been a busy year for buyers and sellers in the local housing market. Breaking it down month by month, here's what we're finding... 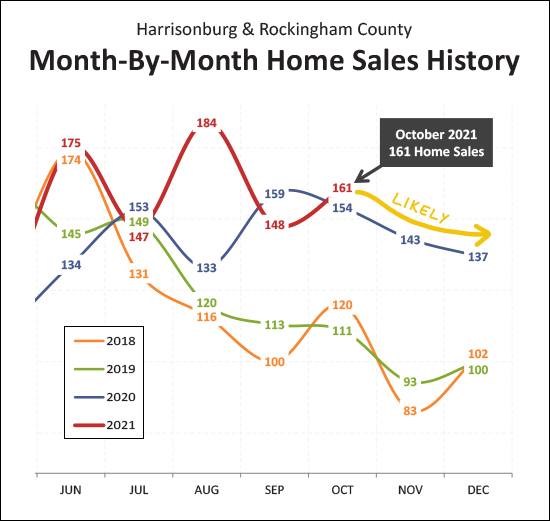 It's been a bit of a roller coaster ride in the second half of this year... JUN: highest month of sales in many years JUL: slower sales than last year AUG: highest month of sales, by far, in many years SEP: slower sales than last year But, the market is back in full force in October, with the... highest month of sales in many years. :-) We are likely to see a slow decline in monthly home sales in November and December as is typical most years -- but then again, maybe I'll be surprised yet again! If we do stay on track with a relatively solid November and December, here's what that might look like... 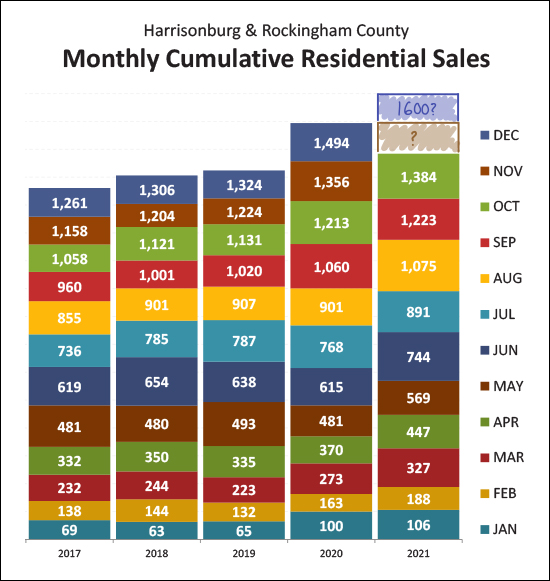 As you can see, with only ten months of sales thus far in 2021 we have already eclipsed the total number of sales in 2017, 2018 and 2019. We may very well rise above 2020 just with the addition of November sales, and when 2021 is completely in the books, perhaps we'll get all the way up to 1,600 home sales! Here's an another visualization of how we made our way to this pace of home sales... 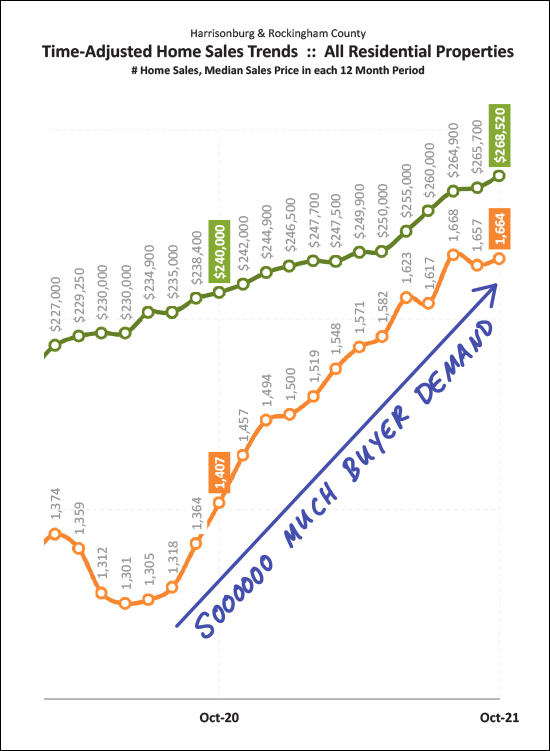 Yeah, that orange line. The orange line is showing the annual pace of home sales in Harrisonburg and Rockingham County. The annual pace of sales slowed in mid 2020 due to Covid -- that's the multi month dip on the left side of the graph. But when Fall 2020 came into view, the pace of buying activity took off like a rocket and has not slowed down much since. The annualized pace of home sales has actually been over 1,600 for five months in a row now, which is a relatively good indicator that we'll see a total of 1,600 home sales in 2021. Will the pace of home buying activity slow in 2022? I don't think that it will. I believe there is a good bit of unmet buyer demand that has built up in our local market over the past five years. I think there are plenty of would be home buyers that are just waiting on resale homes, or newly constructed homes, to be available so that they can buy a home. Assuming we continue to see growth in new construction options, and assuming mortgage interest rates don't rise dramatically, I think we are likely to continue to see an annualized pace of 1,600+ home sales as we work our way into and through 2022. And what about home prices... 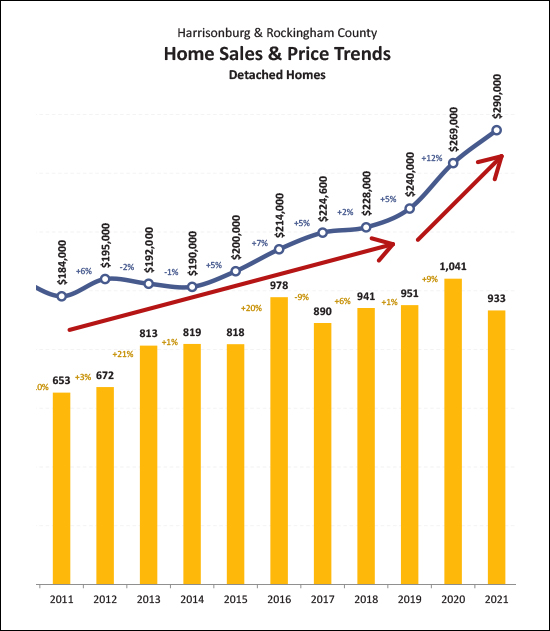 Between 2011 and 2019 the average increase in the median sales price of detached homes was 3.4% per year. Over the past two years (2020, 2021) the average annual increase in the median sales price of detached homes was... 10%. So, clearly, home values are increasing much faster now than they were for most of the past decade. Looking ahead, what will we see next. I believe we will soon (2022) or eventually (2023) see that annual increase return to that longer term norm of three to four percent. I am not thinking, at this point, that we will see sales prices drop -- but I don't think we will continue to see those prices increase as fast as they have for the past two years. Looking ahead at what closed sales might be in the next two months requires looking backwards at what we've seen in the way of contract activity over the past few months... 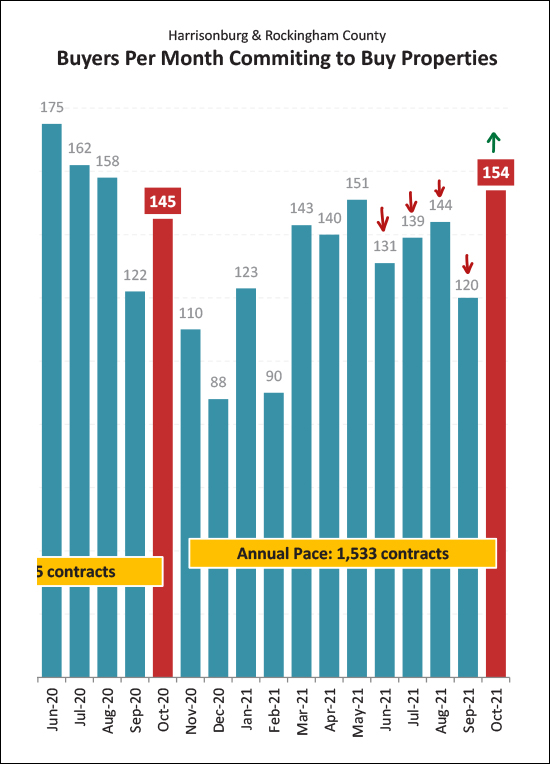 As noted by the red and green arrows above the last five months above... [1] In June, July, August and September of 2021 we saw fewer contracts being signed than in the same month in 2022. [2] In October 2021 we saw more contracts being signed than in October 2021. [3] In the total of those five months there were 762 contracts in 2020 and only 688 contracts in 2021. So, contract activity might be (?) slowing a bit, which means home sales activity might (?) slow a bit as we finish out 2021 and roll into 2022. Stay tuned as I continue to track this over time. Here's a bit of a confusing graph, at first glance... 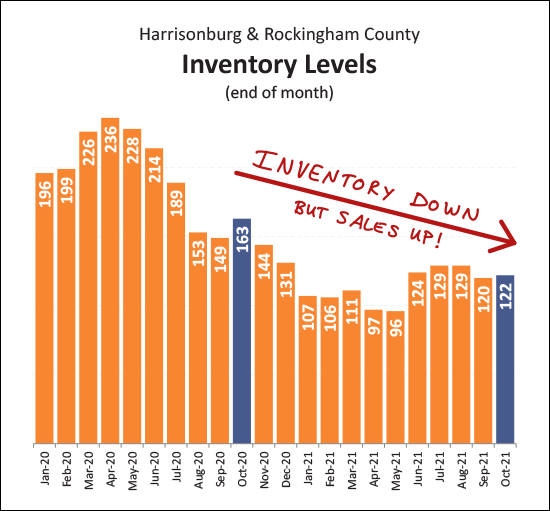 This graph, above, shows the number of homes on the market at any given time, measured monthly. Inventory levels have been dropping for many years now -- but home sales have been increasing during that same timeframe. Confusing, right? Here's the skinny... [1] More homes have been listed over the past year than the previous year. [2] Homes have sold much more quickly this year than last. [3] As a result, the number of homes on the market at any given time has dropped over the past year. Maybe that's clear, maybe not. As with all of this data and these graphs, just ask if you have a question! As per #2 above, homes are selling rather quickly... 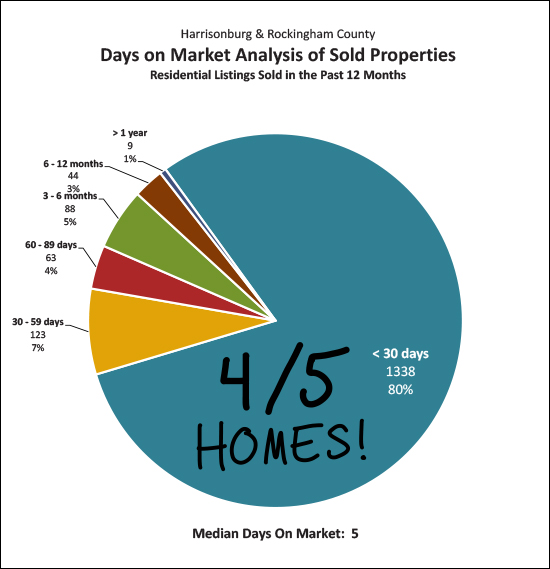 A few things we can pick up from the graph above... [1] As scribbled on the chart, four out of five homes are going under contract within 30 days. [2] Narrowing the focus a bit, we can note at the bottom that per the median of five days, at least half of the homes that have sold in the past year have been under contract within five days of being listed for sale. Here's an even more interesting visualization of how quickly homes are going under contract in Harrisonburg and Rockingham County these days... 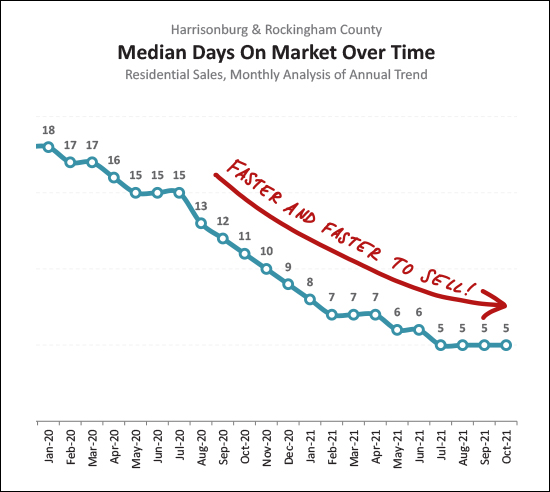 This graph takes a look at the median days on market of all residential sales in Harrisonburg and Rockingham County in a year's time. This shows the speed of home sales in our marketplace and that speed has been steadily increasing over the past 18+ months. Alright, that brings my monthly overview of our local real estate market to a close for now. As noted throughout... more homes are selling, more quickly, at ever higher prices. It is not clear when these trends will slow down, stop or reverse themselves, but for now, the local market keeps on moving steadily ahead. If you made it through reading the entire overview of my market report, kudos to you, and you can consider yourself to be well informed on the latest local market trends. You are now dismissed from class to go daydream about your favorite foods you will devour on Thanksgiving day. As we continue through November, I hope your Thanksgiving season is one full of plenty of relaxation, delicious food, and enjoyable time with family and friends. Looking ahead, if you hope to buy a home or sell a home yet this year, or in early 2022, let's chat sooner rather than later to prepare you for entering into this fast pace local housing market. You can reach me via phone/text at 540-578-0102 or by email here. Happy Thanksgiving! :-) | |
Home Sales Up 15%, Prices Up 12% In 2021 Despite Slightly Slower September Sales |
|
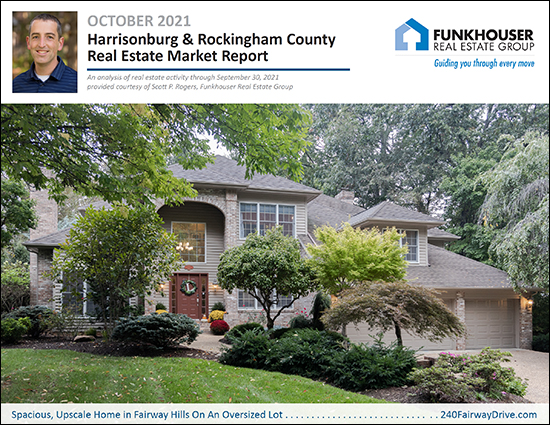 Happy Tuesday Morning, Friends! I hope October is treating you well and that you are enjoying the cooler temperatures as much as I am. Earlier this month I had a great time picking apples at Showalter's Orchard in Timberville for the very first time. I brought home plenty of apples and some of their delicious apple cider. I had high hopes of baking some of those apples into a crisp... probably to be enjoyed with some vanilla ice cream and caramel sauce... Delicious! Alas, thus far those delicious, crisp, apples have only been enjoyed with a side of peanut butter -- but maybe I'll break out the apple crisp recipe yet this week. I hope you are enjoying some delicious flavors of fall yourself, and perhaps you'll consider a visit to Showalter's Orchard... But moving past delicious, freshly grown, hand picked apples... and the desserts they might produce... let's explore the latest numbers from our local housing market for a bit. As always, you download a PDF of all of the charts and graphs here or, if you are intrigued by the beautiful house in Fairway Hills that graces the cover of my market report this month, check it out here. Now, let's break down the stats... 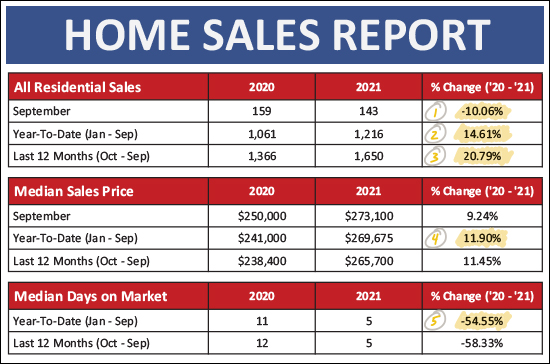 From a big picture perspective, here's what jumps out to me above... [1] Home sales were a bit slower this September (143) than last September (159). [2] Despite a slightly slower September, we've seen 15% more home sales thus far in 2021 than during the same time period in 2020! [3] When looking at a full year (12 months) of data there has been a 21% increase in the number of homes selling, annually, in Harrisonburg and Rockingham County. That is a significant surge! [4] The median sales price thus far in 2021 is $269,675 which is 12% higher than it was a year ago when it was only $241,000. This is a large increase in median sales prices in just a year. [5] Homes were selling fast a year ago. They are selling faster now. Median days on market has dropped 55% from 11 days to five days over the past year. When we break things down between detached homes and attached homes we can learn a bit more about what is happening in our local market. An attached home is a duplex, townhouse or condo... 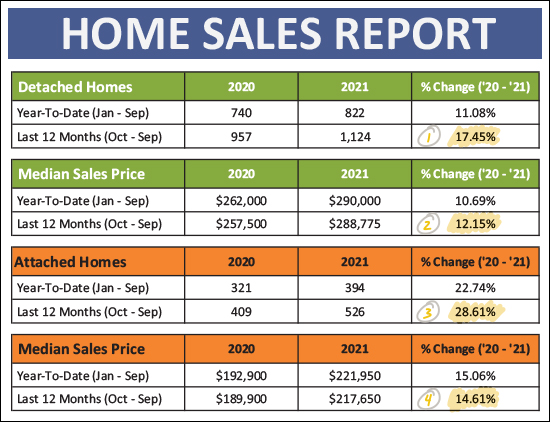 The green sections above are tracking the sales of detached homes where we find... [1] There have been 17% more detached home sales (1,124) in the past 12 months as compared to the prior 12 months (957). [2] The median sales price of detached homes has increased 12% over the past year, from $257,500 to $288,775. That is an increase of more than $30,000 in a single year. The orange sections above are tracking the sales of attached homes where we find... [3] There was a much larger, 29%, increase in the sales of detached homes over the past year. The annual pace of these detached home sales increased from 409/year up to 526/year. [4] The median sales price of these detached homes has increased 15%, from $189,900 up to $217,650. I mentioned earlier that home sales slowed down in September -- but maybe partially because August was bonkers? 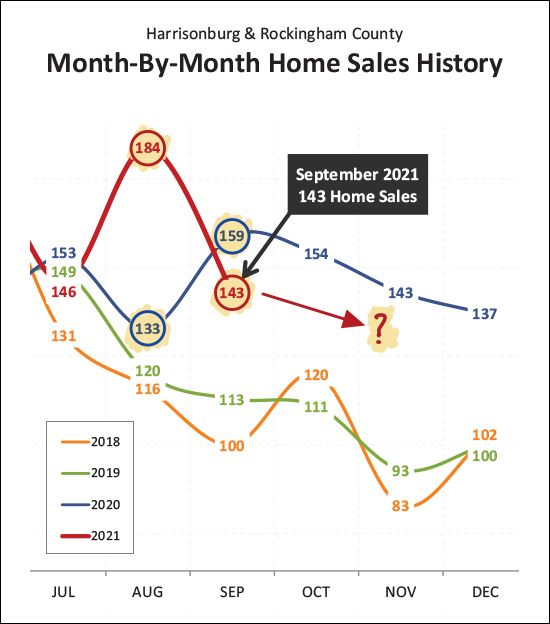 As shown above, September 2021 fell short (143 sales) of September 2020... but... [1] Don't forget about August! There were an astonishingly high number of home sales (184) in August 2021, and if we combine August and September we find that there were 292 home sales during those two months last year, compared to 327 this year. [2] The last four months of 2020 were abnormally active because many home sales that would have likely taken place in the first half of 2020 were pushed into the second half of 2020 because of Covid. As such, looking towards the remainder of the year, I would not be surprised if 2021 continues to under perform as compared to 2020. Now, let's stack all of those months up to see how 2021 compares to past years... 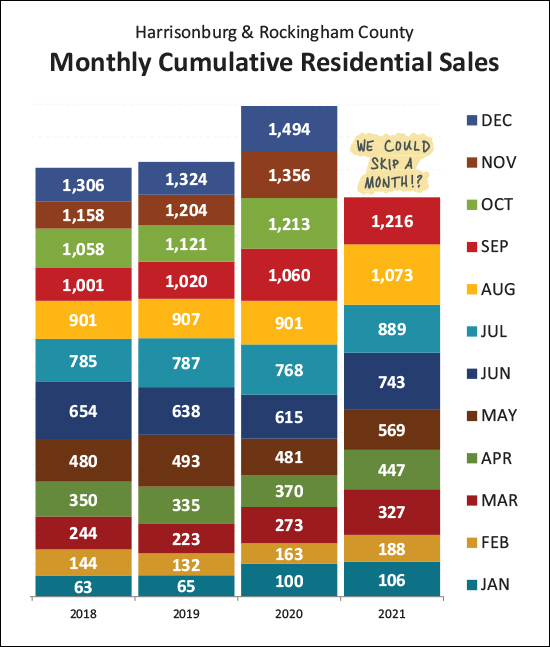 Remarkably, the home sales in the first nine months of 2021 was more than in the first ten months of 2020 and more than the first eleven months of 2018 and 2019! So, we can take a month off, right? We could have no home sales in October and we'd still be outperforming last year! Alas, it doesn't seem like home sales will be taking a break in October. But as for predicting future sales activity, the best bet is to look at recent contract activity... 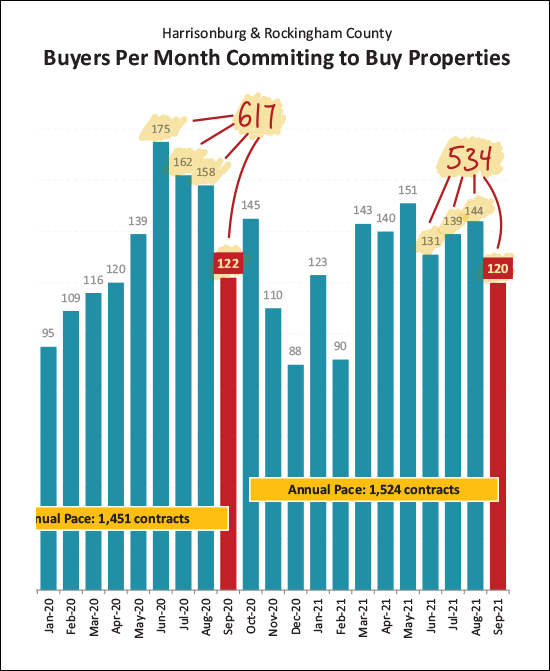 The most recent four months of contract activity (Jun-Sep) have definitely been slower than the contract activity we saw a year ago. There have been a total of 534 contracts signed between June 1 and September 30 this year -- as compared to 617 contracts signed during the same timeframe last year. This likely means we'll see somewhat fewer home sales over the next few months. This next graph won't surprise you as you've likely heard about the extremely low inventory of available homes in this area... 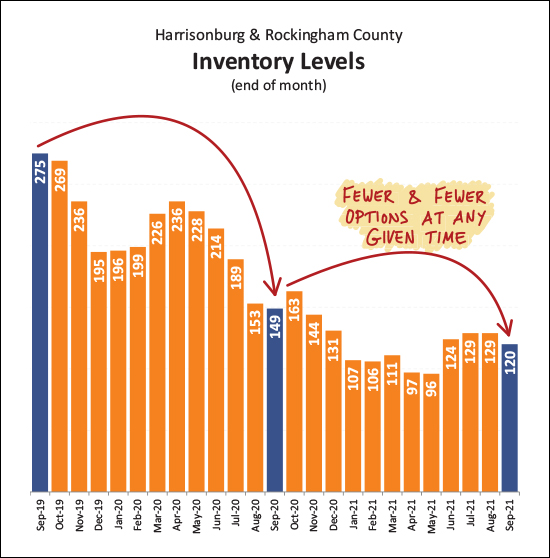 As I have mentioned before, this graph can be a bit misleading. Some might understand it to mean that there are fewer and fewer homes for sale and thus fewer and fewer homes are selling. But, in fact, we have seen 21% more home sales in the past 12 months as compared to the prior 12 months -- so what's the story? The second half of my comment above "at any given time" is the key to unlocking this mystery. Homes are selling (going under contract) quickly, and thus the number of homes on the market at any given time is continuing to stay low. That doesn't mean that there aren't homes on the market to buy -- there are, or were -- but most will go under contract and not be available for any more than a few days. So, as a buyer, be prepared to act quickly, likely compete with other buyers, and possibly have to wait a bit to find the right opportunity. Interestingly, the changes in inventory levels haven't affected all property types in the same way... 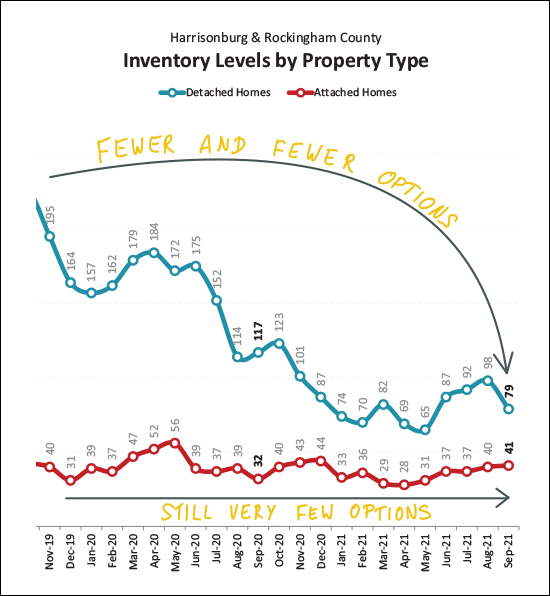 The blue line above is showing changes in the number of detached homes on the market at any given time. You'll note that these inventory levels have dropped quite a bit over the past two years. The red line, showing attached homes) has been very low and remained very low for quite some time now. Neither property type is likely to meaningfully increase until and unless we see a significant amount of new construction to help offset high buyer demand. 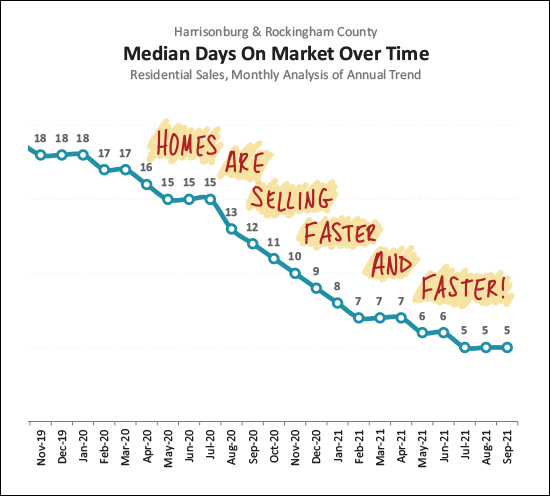 This graph is a new one, but I think an important one for keeping an eye on the mood of the market. Days on market, as shown above, measures how quickly homes are going under contract. Independent of how many homes are selling and the prices at which they are selling -- if they are going under contract quickly then the market is strong and power is tipped towards sellers -- and if homes are taking a longer time to go under contract the market is not quite as strong and power is starting to balance out between sellers and buyers. Over the past three years we have seen a steady decline in how long it takes homes to go under contract, with a current median of five days on the market. I'll continue to monitor this "days on the market" metric over time to see if things are cooling off at all in our local market. That doesn't seem to be happening yet. :-) You might have heard that mortgage interest rates are increasing, but... 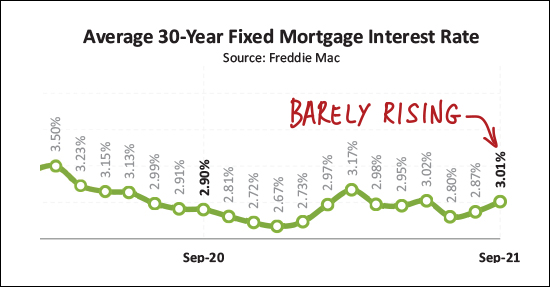 I have read quite a few headlines lately about how rising interest rates are certain to dampen home buyer enthusiasm. If I had a dollar for every time someone told me (or I told you) that interest rates were going to rise over the past seven (+) years... Mortgage interest rates were around 3.5% a year and a half ago, and around 3% a year ago, and are around 3% now. So, are interest rates rising? Sure, a bit, depending on when you pick as the "then" to compare to the "now" but they are still very (very!) low. Alrighty then! That brings my monthly deep dive into our housing market statistics to a close, for now. As usual... If you are thinking of selling your house this fall or winter, let's talk sooner rather than later about timing, pricing, preparations and more. If you're thinking of buying this fall or winter, start looking now, because there aren't many houses on the market, so we'll likely need to patiently wait for the right opportunity to come along and then jump on it, quickly! Have a great remainder of the week, and if you visit Showalter's Orchard and subsequently make apple crisp, text me a photo to make me jealous... or invite me over to sample it... I'll bring the ice cream and caramel sauce! ;-) | |
Harrisonburg Area Home Sales Spike Again In August 2021 |
|
 Happy Tuesday Morning, Friends! I hope you had a fun and relaxing weekend. My Sunday included an adventure with my daughter, about 24 of her classmates, and several other dads... hiking to Saint Mary's Falls... with many of them then jumping off a 15 foot high ledge down into a pool of water below!?! A bit nerve-wracking at first, but we didn't have any injuries, so we'll call it success. :-) You should definitely check out Saint Mary's Falls if you haven't been -- it's a 4.3 mile out and back hike only about 45 minutes from Harrisonburg!  But back to the business at hand - the very active Harrisonburg and Rockingham County real estate market! August 2021 was a busy month, and there is plenty to unpack in the latest data. Download a PDF of all of the charts and graphs here, check out this beautiful home on East Wolfe Street on the cover of this month's report, or keep reading for some insights into the latest news from our local housing market... 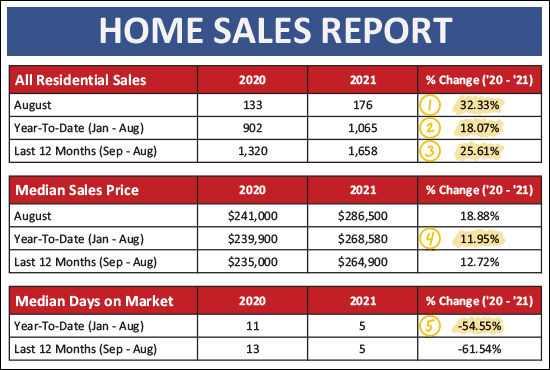 OK - so much to jump into (I guess I'm still thinking about the waterfall!?) right from the start... Referencing the data table above... [1] There were 176 home sales in August. 176! That's 32% more than last August. Admittedly, things slowed a bit in July -- but then sales spiked again in August! [2] We've now seen 1,065 home sales in 2021 which is 18% more than we saw last year during the same timeframe. It has been an active year! [3] Over the past 12 months we've seen 1,658 home sales recorded in Harrisonburg and Rockingham County via the MLS and that is 26% more than the prior 12 months! [4] The median sales price thus far in 2021 -- $268,580 -- is 12% higher than it was a year ago. That is a much larger than normal increase in the median sales price. [5] Homes are selling quite a bit faster this year (median of 5 days on the market) than last year (median of 11 days on the market). 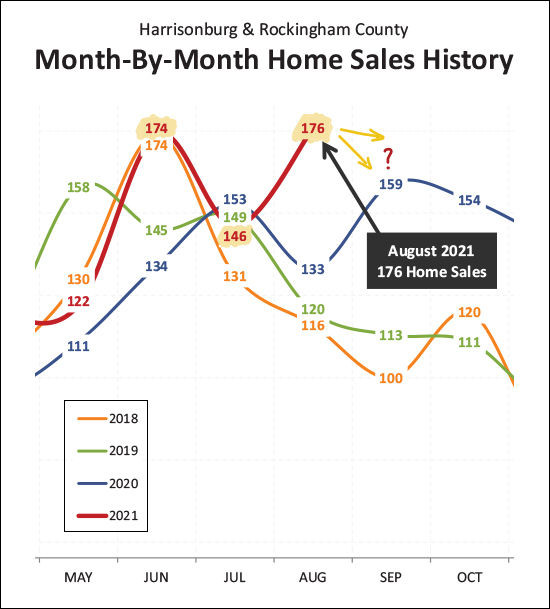 Above you can take a closer look at the month by month trajectory of home sales this year. We saw 174 home sales in June -- which was well above 2020 (134) and tied with June 2018... but then home sales in July 2021 slowed to 146 sales, a small decline from the 153 sales seen in July 2020. But then, August!?! After only seeing 133 home sales last August, there were 176 this August! Where do we go from here? It's anyone's guess. September and October were extremely active for home sales last year -- could we match that pace this year? All these active months of home sales in 2021 have been piling up... 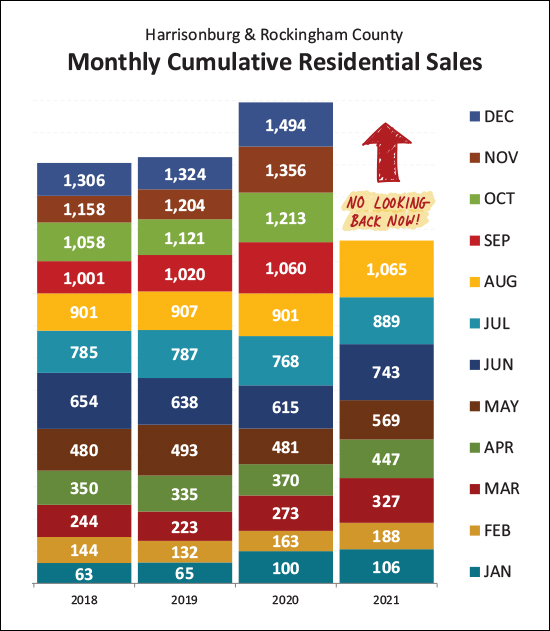 We're now more than a full month ahead of the pace of home sales last year. We've had more home sales (1,065) in the first eight months of 2021 than the number of sales (1,060) seen in the first nine months of 2020! Given the current trajectory, we are very likely to see more than 1,500 home sales in 2021 -- and it seems possible that we could get all the way up to 1,600 home sales! Here's the best "why" I can come up with at this point... 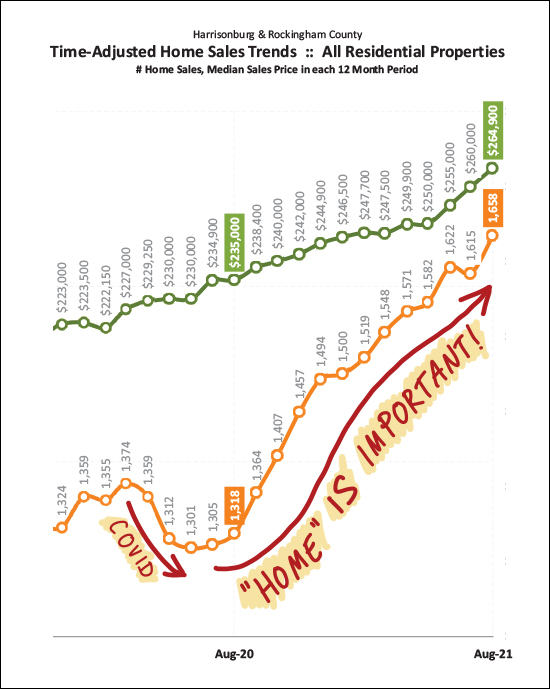 We saw a temporary decline in the pace of home sales when Covid started showing up in our lives -- in March/April of 2020. Then -- many of us started to work from home, learn from home, stay at home -- basically spending more and more time in our homes. This seems to have caused many folks to realize it was more important to have a home that worked well for them -- related to amount of space, types of spaces, etc. Home sales took off starting in late August 2020 and have been on a tear ever since. But it's not just the pace of home sales that has been increasing... 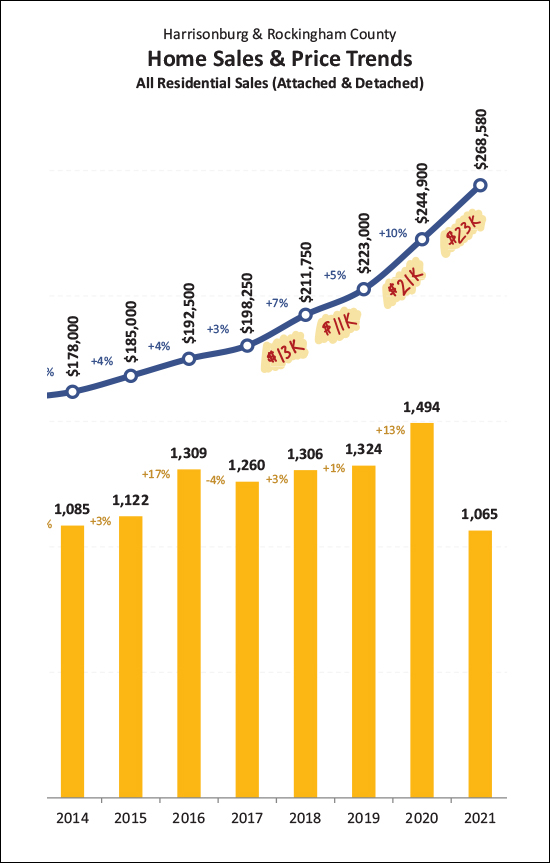 Home prices have been rising very steadily over the past few years, but we have seen a 10% or higher increase in the median sales price in both 2020 and thus far in 2021. Of note, here are the annual increases in the median sales price per year for the past four years, including 2021...
So, if you have owned a median priced home for the past four years you may have very well seen a $70,000 increase in your home's value in the past four years! What comes next? 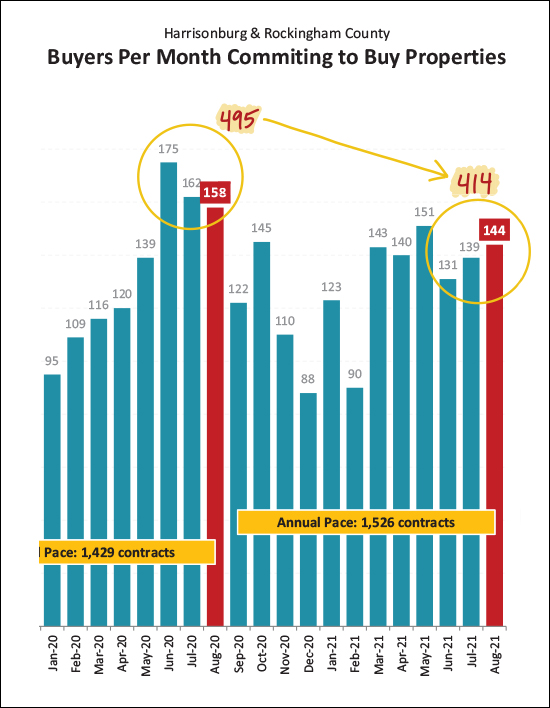 Well, technically, things might eventually start slowing down? Last summer (June / July / August) there were 495 contracts signed for homes in Harrisonburg and Rockingham County -- compared to only 414 this summer. So, maybe we start to see a decline in closed sales in September and October? It's hard to say at this point. Clearly, the robust month of home sales in August is not an indication that things are slowing down or cooling off. :-) We are also seeing a marginal increase in available inventory... 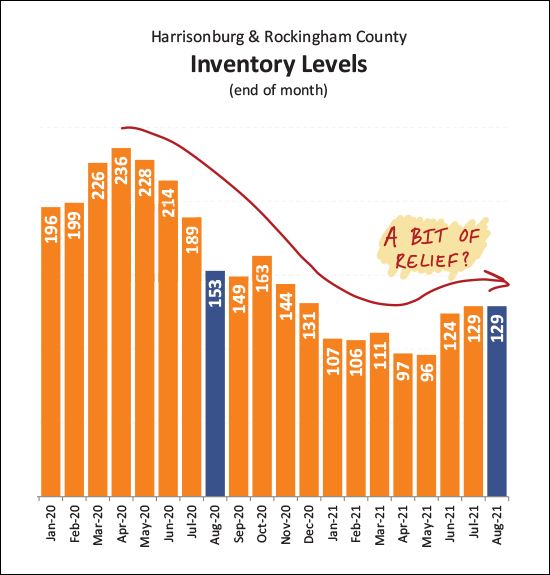 The number of homes for sale at any given time has been declining for years -- but over the past few months the number of homes on the market at any given moment in time has increased slightly from "barely any" to "still very, very few" in Harrisonburg and Rockingham County. Keep in mind -- when 1,658 homes are selling in a year, an increase from 96 homes on the market to 129 homes on the market is not overly encouraging for new buyers. That means there is still less than a month of inventory on the market right now! Given than there aren't many homes on the market for sale -- some buyers are considering the purchase of a building lot to build a home... 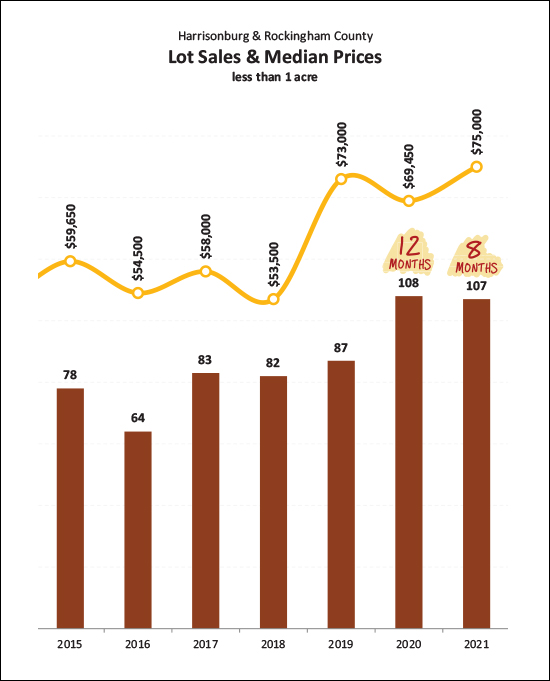 Indeed, even at a time when the price of building materials is still quite high, we are seeing a lot of building lots selling. There were 108 lot sales (of less than an acre) all of last year -- and we've seen 107 such sales in the first eight months of 2021. It's not clear whether all of those buyers will really build -- or be able to build -- but low housing inventory has certainly contributed to more buyers considering building lots. And here's a big part of what has kept all of this home buying activity chugging along... cheap money... 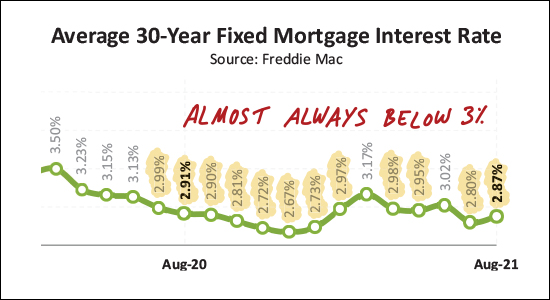 The 30-year fixed mortgage interest rate has been below 3% for almost all of the past year. This has kept housing payments for buyers very low -- even amidst rising home prices. I've been saying for years that mortgage interest rates will certainly start rising soon. I think I have given up on that mantra now, after having been wrong year after year. Certainly, if or when rates do start to rise, that will affect monthly housing costs and housing affordability -- but higher interest rates don't necessarily seem to be on the horizon anytime soon. And now... we're already half way through September!?! We might be seeing high temperatures again this week, but hopefully it will start feeling like fall by the time we get to the first official day of fall, next week, on September 22nd. Meanwhile... If you are thinking of selling your house this fall, let's talk sooner rather than later about timing, pricing, preparations and more. If you're thinking of buying this fall, start looking now, because there aren't many houses on the market, so we'll likely need to patiently wait for the right opportunity to come along and then jump on it, quickly! If you have a question about the market, or your home, or your overall real estate plans -- don't hesitate to ask. Email me or call/text me at 540-578-0102. If you made it to the end, thanks for reading along. I hope you learned something -- and I hope you'll plan something exciting for this coming weekend -- as exciting as jumping off a 15 foot ledge into a pool of water! | |
Harrisonburg and Rockingham County Home Prices Have Risen 10% In The Past Year |
|
Happy Wet Wednesday morning to you! It looks like this will be the fourth (?) day in a row of rain in the valley, which is a welcome trend for many given the previous few weeks of very, very dry weather in the Harrisonburg area. I hope at least some portions (or most!?) of your summer have been enjoyable and relaxing amidst all that is going on in the world right now. I escaped dry Harrisonburg to visit even drier Utah with my family in early August -- and was impressed by both the lack of humidity :-) and the beautiful landscapes of Arches National Park. I'm back now, though, and Luke (11th grade) and Emily (8th grade) are transitioning into a new school year. If you have little (or big) ones starting school now or soon, I hope that transition goes well for you and them. Now, then, let's chat for a bit about our local housing market. Or, rather, I'll chat -- while you read -- and if you want to chat back, shoot me an email me with what's on your mind or let me know if you'd like to grab a coffee and we can chat in person. But one last note -- you'll find a PDF of all of the charts and graphs in my market report here and you can learn more about the amazing Highland Park home pictured above here. Now, to the data... 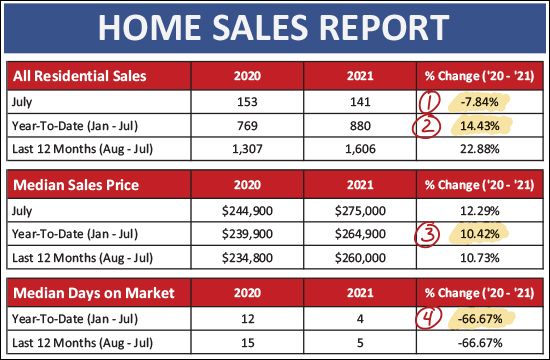 This first data table (above) gives you a quick overview of the basic market dynamics we're seeing right now in the Harrisonburg and Rockingham County area -- and most of it is probably what you would have guessed that you would see... [1] This first one might be a bit of a surprise. There were 8% fewer home sales this July compared to last July. But... you need to keep last July (and last June) in context remembering that they were extraordinary busy months for home sales after the usually strong spring real estate market was delayed by a few months by Covid, resulting in slower spring 2020 home sales and much stronger summer 2020 home sales. Thus, while there were fewer home sales this July compared to last -- that's mostly a story about how crazy things were last July. [2] Here you'll note that the year-to-date pace of home sales (880 sales) is 14% higher than it was last year (768 sales) when evaluating only the first seven months of the year. So, yes, despite extraordinary low inventory levels -- at any given time -- 14% more homes are selling this year than last! [3] Those home prices keep on rising. You might have noted the headline of this update was related to the increase in sales prices. After receiving one of my market reports that lauded a strong pace of home sales, one of my past clients once commented that he could care less how many homes sold -- he just wanted to know what prices were doing -- going up or down. So, in that spirit, I lead this month's update with the fact that the median sales price has increased 10% between last year ($239,900) and this year ($264,900) when looking only at the first seven months of the year. [4] Finally, sales are still happening very (very) quickly in our local market. The median "days on market" for homes that sold in the first seven months of this year was... four days. That is to say that half of the homes that sold went under contract in four days or less! Wow! Now, then, a slightly (just slightly) deeper dive into the basic sales data... 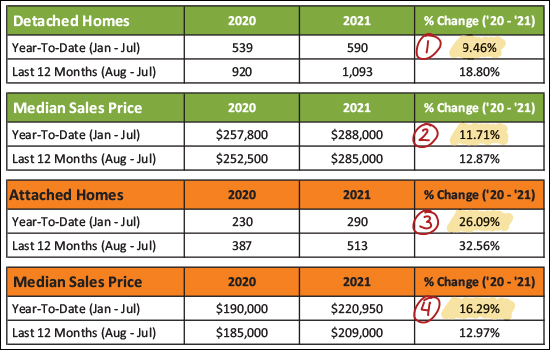 The data table above provides a slightly more nuanced analysis of detached homes in green as compared to attached homes in orange. An attached home is a duplex, townhouse or condo. Splitting out the data in this way calls attention to the fact that while we've seen 9% more detached home sales thus far in 2021, we have seen a much larger, 26%, increase in the number of attached homes that have sold in 2021. Lots of duplexes, townhouses and condos are selling -- though mostly townhouses, and many of them are new townhouses. Looking at sales prices between these two data sets we find that the median sales price of detached homes has increased 12% to $288,000 -- while the median sales price of attached homes has increased 16% to $220,950. So -- at least some portion of the overall increase in home sales in this area is a big increase in the number of attached homes that are selling. Now, to the monthly sales trends... 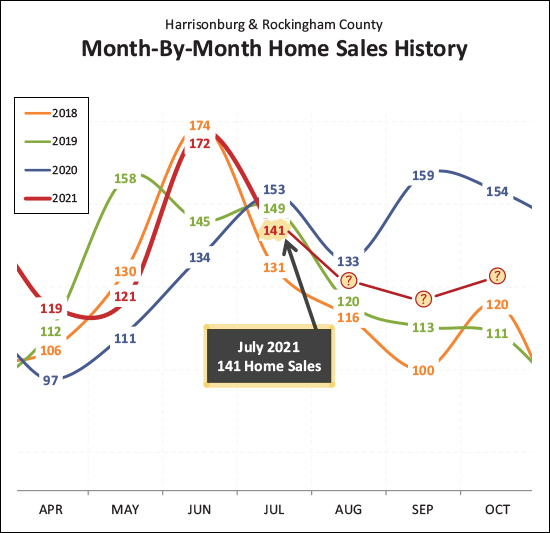 There is a lot going on in this graph, above, but focus on the bright red line for the current year and the dark blue line for last year. By doing so, you'll note that April, May and June home sales were extremely strong in 2021 compared to 2020 -- though that was mostly because home sales were sloooooowwww during those months last year as a result of Covid pushing last year's home sales later in the year. When we then look at June and July home sales in 2021 they look slow compared to 2020 -- but again, this is largely a result of Covid pushing last year's home sales later in the year. So, what then should we expect for August and thereafter in 2021? As illustrated above, I think we are likely to see more home sales than in the same month of 2018 and 2019, but likely fewer home sales than seen in the same month in 2020. The second half of last year was absolutely bonkers as far as the number of homes that sold per month and as strong of a year as 2021 has been, I just don't think it can keep pace with last year. But... in the end, I do think we'll see more home sales this year than last... 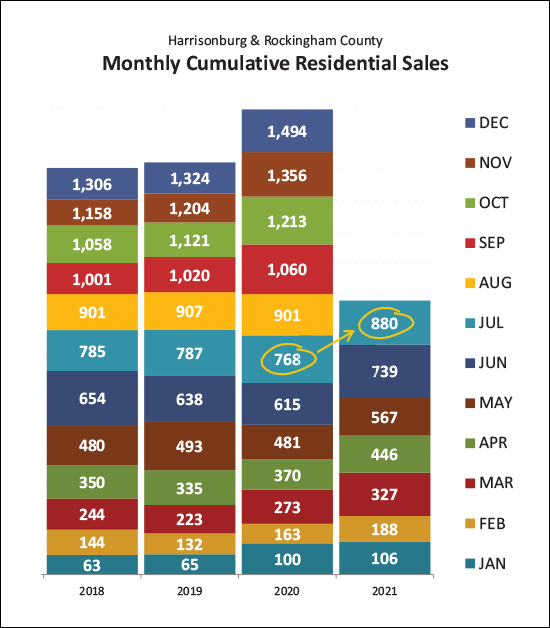 This graph (above) piles each month of home sales on top of the previous months that year, and you'll see that 2021 has established a serious lead over 2020. We are now 112 home sales ahead of the pace of last year's local housing market. So -- even if home sales are a bit slower in the last five months of 2021 than they were in 2020, I still think we'll see more home sales in all of 2021 than we did in all of 2020. Looking back, then, at home sales prices -- some folks have asked if home prices are going up too much or too quickly... 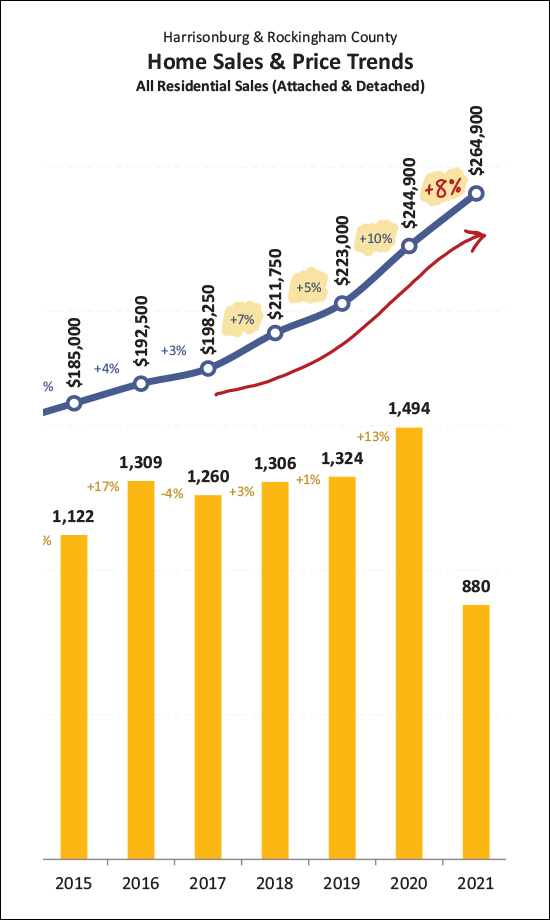 As shown above, there was a 10% increase in the median sales price in 2020, and depending on how you crunch the numbers an 8% of 10% increase in 2021. So, will home prices keep going up? Will they come down? As I mentioned on my blog earlier this week, I don't think home prices are going to decline in the next year, because... [1] I believe housing (for purchase) has been under built for many years in this area. I believe there are more homeowners or would-be homeowners in the market than there are homes to be owned. [2] Even if lots and lots of homes are being built or being planned, it takes a long time (relatively speaking) for those homes to be planned and built. [3] There are a flurry of showings and often multiple offers on most new listings. So, home prices are rising (10-ish percent in the past year) and I don't see that changing significantly in the near future. Now, technically closed home sales are old news -- it's the contract activity that gives us the freshest data, so let's take a look... 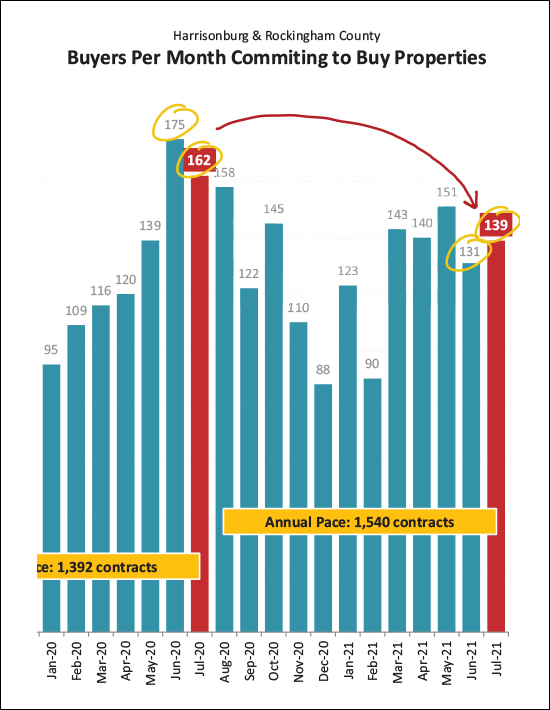 As shown above, contract activity in June and July has been dreadfully slow compared to last June and July. ;-) While technically true, this doesn't tell the whole story, in my opinion. During early 2020, Covid caused a major slow down in the number of homes coming on the market and thus the number of buyers contracting to purchase homes. The spring months are usually some of the busiest months for contract activity and that didn't happen in 2020. As a result, contract activity spiked to record or near record highs in June, July and August. Last year's incredibly and unusually strong months of contract activity during those summer months does make this summer's contract activity look a bit pitiful, but again, it's only because of the crazy highs last summer. Now, how about those inventory levels? Are we getting any relief? 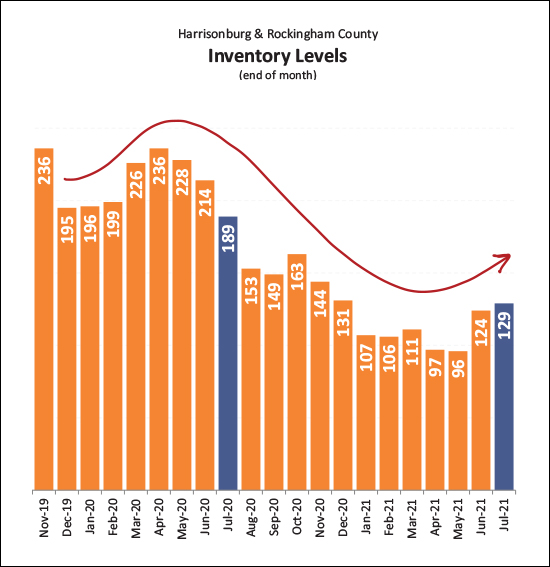 Maybe? Possibly? A little? Inventory levels crept up a bit in June and July of 2021 from terribly, dreadfully low all the way up to... yeah, still terribly and dreadfully low. Inventory levels in early August over the past few years have been 345 homes for sale in August 2018, 270 homes for sale in August 2019 and 189 homes for sale in August 2020. So, before you get too excited about inventory levels increasing from 96 homes *all the way* up to 129 homes, keep in mind that this is still far fewer homes on the market at any given time than we have seen... ever. And finally, a happy recap of recent trends in mortgage interest rates... 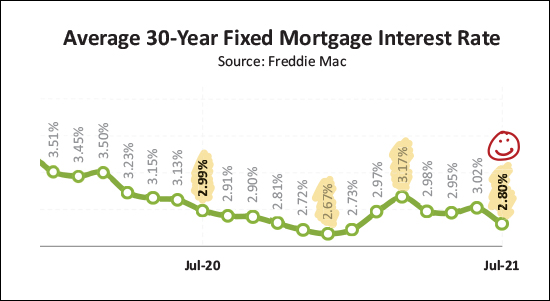 Interest rates were around 3.5% a year and a half ago, fell to 3%, then all the way down to 2.67% back in December before rising again until they were above 3% again. But, no longer. The average mortgage interest rate (on a 30 year fixed rate mortgage) has declined for a few months now and is right around 2.8% -- a welcome sign for home buyers. OK -- I'll wrap it up there for now. All in all... [1] Lots of homes are selling in 2021 -- well more than in 2020. [2] Home prices are much higher this year than last. [3] Buyers need to be prepared to see new listings as soon as they hit the market and to make a quick decision about making an offer. [4] Sellers are likely to continue to see favorable market conditions for at least the next six to twelve months. You'll still need to price your home appropriately, prepare it to show well and market it thoroughly -- but you'll likely enjoy the price for which you sell your home. If you made it this far, thanks for reading. Drop me a line to let me know if you have any questions about our local housing market -- or even more interestingly, to tell me about about your favorite adventure of summer 2021! I'd love to hear from you!
| |
Special Saturday Edition: Home Sales, Prices Flying High In Harrisonburg Area |
|
 Happy Saturday morning to you! I hope you had a wonderful week. I am still unwinding a bit from a great time at the Red Wing Roots music festival last weekend. I enjoyed seeing many of you there, and if you missed it this year, you should consider attending next year! Back to the here and now, though -- I'm not sure what your weekend looks like -- but thus far mine has involved sipping coffee while my daughter and I have been drawing on our iPads. Admittedly, Emily is creating art, and I'm doodling on graphs and charts as included below - but fun times nonetheless. :-) Regardless of whether your weekend will include relaxing at home, traveling out of state to see family, heading to the beach for a week, or working in the yard -- I hope it is a weekend that includes at least some moments of fun and relaxation. When you get to a few free moments in your weekend, take a look through the remainder of this market update to learn more about what is happening in our quickly moving local real estate market. First, the full PDF of my market report can be found here, second, the featured home shown above is located at 261 5th Street in Broadway and you find details of it here, and now, let's dive in... 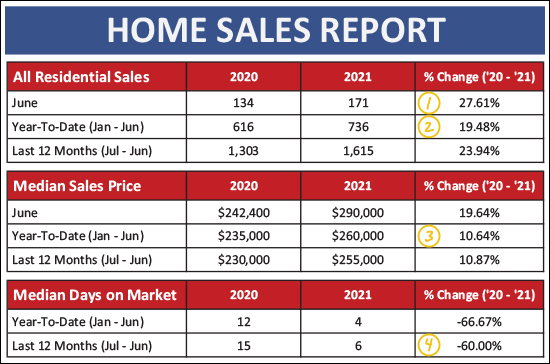 Quickly glancing through the numbers above, you might find your eyes opening wider than normal and your eyebrows rising higher than normal. There are some rather surprising things going on in our local housing market. Anyone who is selling their home, or trying to buy their home, knows about these dynamics -- but it's good to put some numbers to it... [1] There were 171 home sales in June 2021, which was 28% more than last June! [2] Thus far this year (we're halfway through it) there have been 736 home sales, which is 19% more than the first half of last year! [3] The median sales price in the first half of this year was $260,000 (!!) which is 11% higher the median sales price during the first half of last year which was only $235,000. [4] Over the past 12 months it has taken a median of six days for houses (that sold) to go under contract -- compared to a median of 15 days during the 12 months before that. So, yeah, lots of homes are selling, at much higher prices than a year ago, and much more quickly! Breaking it down between detached homes and attached (duplexes, townhouses, condos) homes reveals a few other details... 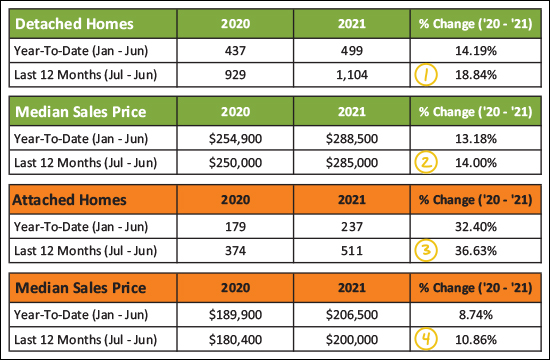 Above you might notice that... [1&3] There have been a 19% increase in the number of detached homes that have sold in Harrisonburg and Rockingham County over the past year -- but a much higher 37% increase in the number of attached homes that have sold! [2&4] The median sales price of detached homes ($285,000) has risen a bit more (14%) over the past year than the median sales price of attached homes ($200,000) which has only (haha) risen 11% over the past year. Those (above) are the long term trends. When we dial in a bit and look at things on a monthly we find that this strong increase in the number of home sales thus far in 2021 has been a month after month after month occurrence... 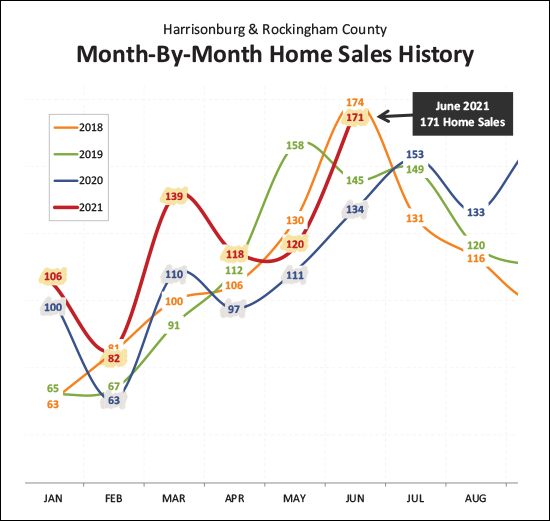 I have highlighted each of the first six months of 2021 in yellow above, and the corresponding month last year in gray. Now, it certainly bears noting that home sales during some of the months in the first half of last year were likely a bit lower than they would have been otherwise because of Covid, but regardless -- each month of home sales in 2021 has been head and shoulders above the corresponding month of 2020. And now, let's see how this first half of the year stacks up against the first half of the past few years... look for the dark blue bars... 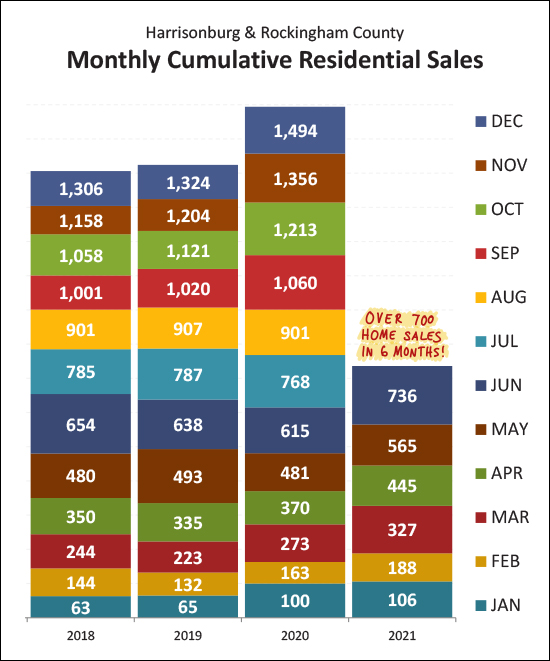 As you can see, with over 700 home sales (736) in the first half of 2021 this year is well ahead of the pace of home sales in the first half of each of the past three years. Looking ahead, it currently seems quite reasonable to think that we would see 1500+ home sales in 2021, with one significant exception. Home sales were tilted towards the second half of the year last year due to Covid, so while we are seeing stronger sales in the first half of 2021 (compared to 2020) things might level out a bit when we get to comparing the second half of 2021 to an abnormally strong second half of 2020. The next visualization is still shocking to me each time I update it with another month of data... 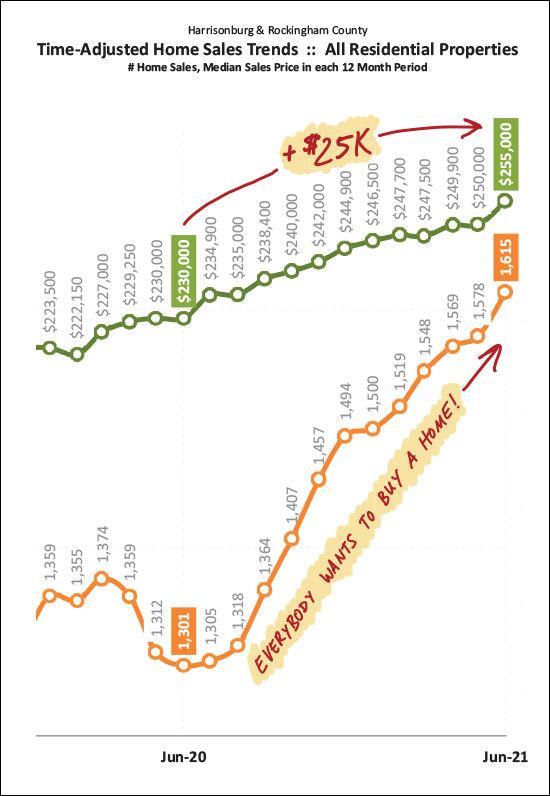 A year ago, 1300-ish buyers were buying homes a year -- now that has risen to 1600+ buyers per year!?! Indeed, it feels like EVERYBODY wants to buy a home... because, keep in mind, this 1600+ per year figure does not include all of the would-be buyers who made offers on houses in the past year but were not successful in securing a contract to buy a house!?! Imagine if there had been enough houses on the market for all of those buyers to have bought as well... The price change (orange line above) over the past year is also somewhat of an eyebrow raiser. The median price has risen $25,000 in the past year. Thus, if you own a home, the value of that property may have very well increased $25,000 over the past year! Admittedly, this varies based on property type, location, price range, etc., -- but suffice it to say -- home values have increased quite a bit in the past year!! Now, just to keep you levelheaded this morning, the next two graphs might make you (and me) say "hmmm..." and "well, let's see what comes next"... 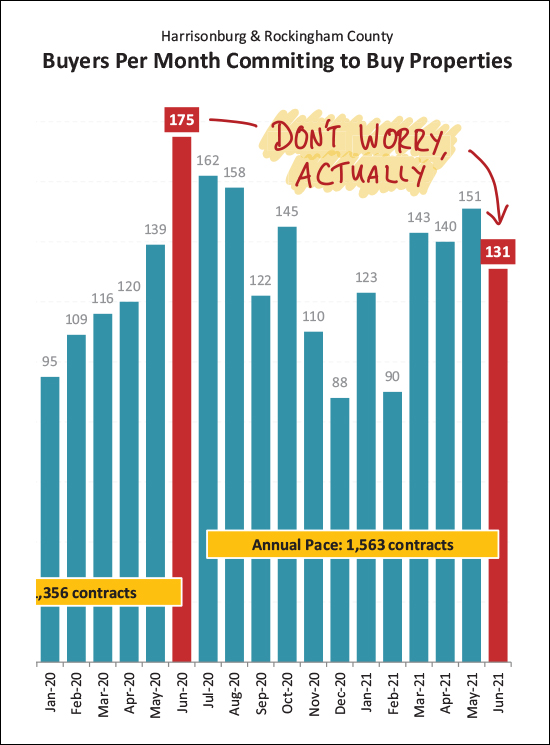 Above, it would appear that the pace of buyers signing contracts has dropped off considerably in June 2021!?!?! ;-) But don't worry too much -- I don't think!? The pace of contract signing in any typical March / April / May is usually quite (!!) active. Last year, buyer activity was significantly suppressed during those normally active months because of Covid -- we didn't know what was happening, what was going to happen, whether the housing market was going to slow down, etc. Then, buyer activity exploded in June of last year and remained quite strong throughout most of the remainder of the year. So, as you look at the decline in June 2021 as compared to June 2020, keep in mind that it was a very unusual June 2020. So, wait and see -- but I don't think June contract numbers mean that our local housing market is slowing down. And now, the second graph to make you say hmmm..... 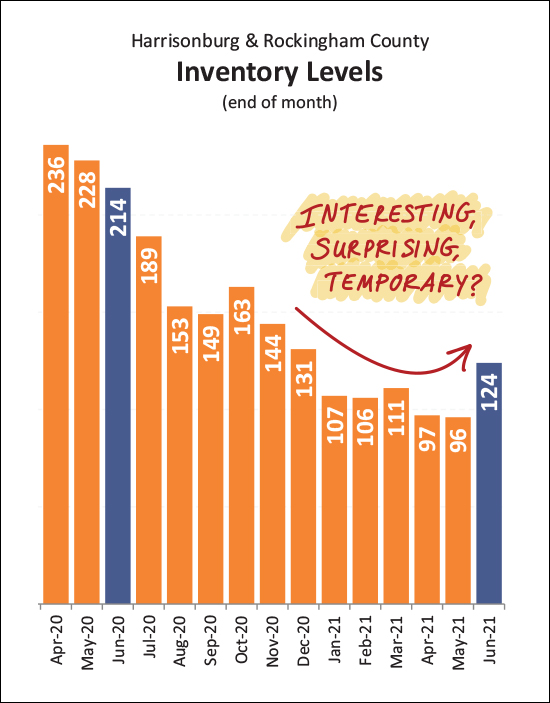 Inventory levels have risen over the past month -- to the highest level in almost six months! This is somewhat interesting and surprising -- but I do also wonder whether it is temporary. I should also point out that this increase in inventory levels only takes us from super-super-super-super low inventory levels up to super-super-super low inventory levels. In the end, most buyers in most price ranges will still find very few choices of homes on the market at any given time. So, I think this is a wait and see -- as to whether we'll start seeing inventory levels rising again, or if this is a one month blip. Lastly, just to remind everyone of at least one of the reasons why so many buyers would LOVE to buy a house right now -- mortgage interest rates are phenomenally low right now... 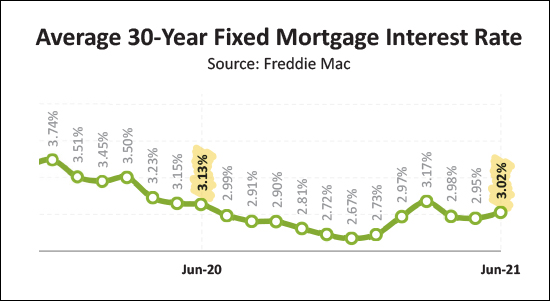 Interest rates have been up and down over the past year, falling as low as 2.67% and rising as high as 3.17%. Clearly, though, anything under 4% still has to be described as absurdly low from any sort of a long term perspective. The cost of financing your home purchase will be very, very low if you are fortunate enough to secure a contract to buy a home in 2021. OK, that's all of the charts and graphs I have for you this morning. A few short takeaways from a big picture perspective... BUYERS: Get prequalified now, see new listings quickly, and carefully consider each contract term of your offer to make it as strong as possible. SELLERS: Prepare your home well, price it reasonably, enjoy a short period of time when you have to put up with showings, and enjoy likely being able to select from multiple offers with favorable terms. HOMEOWNERS: Enjoy knowing that your home value is increasing. :-) If you have questions about buying, or selling, or just want to tell me about the exciting plans you have for the weekend ahead -- drop me a line via email or call/text me at 540-578-0102. Otherwise, enjoy the weekend! | |
Harrisonburg Area Home Sales and Prices Rising Quickly In 2021 |
|
 Happy Friday morning to you, friends in the Harrisonburg real estate world and beyond! It is a wild and crazy time right now in the local real estate market with many (many!) homes selling in a matter of a day or two -- often with multiple offers. It is not uncommon to have 5+ (or 10+) offers on a house within the first 48 hours of the house being listed for sale. Which means, as you might imagine, that... [1] It is a delightful time to sell! [2] It is a difficult time to buy! [3] If you need to do both, perhaps it's a wash!? Read on for some numbers and charts and graphs that can help us gain a deeper understanding of some of the current dynamics of our local real estate market -- or download my entire market report as a PDF here. First, the basic overview of how things are looking so far this year... 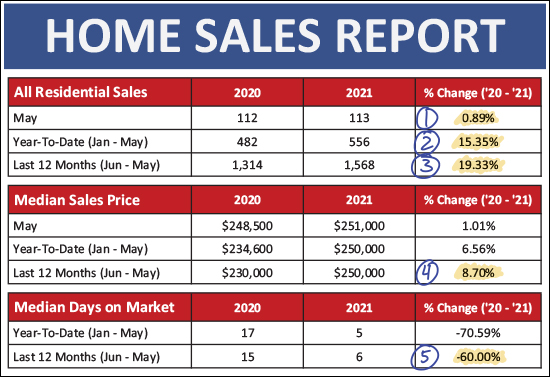 Several things to unpack here, actually... [1] We saw about 1% more home sales this May (the month that just ended) as compared to last May. This is actually a bit surprising. Home sales were rather sluggish last May due to Covid. As a result, I expected we'd see more home sales than we did this May. That said, the limitation on the number of home sales happening these days seems to be more in the area of how many sellers are willing to sell -- as opposed to how many buyers want to buy. So, sometimes when we see fewer homes selling -- it may simply be a result of fewer sellers being ready and willing to sell. [2] Despite only seeing a 1% increase in home sales during May, there have been 15% more home sales in the first five months of this year as compared to the first five months of last year. Thus, don't knock 2021 just yet -- we're well ahead of the pace of home sales that we saw last year. Later on I'll show you an even broader picture to see how 2021 compares to earlier years. [3] When we look at a full year of home sales there has been an impressive 19% increase in the pace of sales. There have been 1,568 home sales in the past 12 months -- compared to only 1,314 home sales in the 12 months before that! [4] Prices keep on rising! The median sales price of all homes sold in Harrisonburg and Rockingham County was $250,000 over the past 12 months -- which is a 9% increase over the median of $230,000 during the prior 12 months. [5] Homes are selling fast -- FAST! The median days on market has dropped 60% over the past year, from a median of 15 days to a median of 6 days. The median days on market is a measure of how many days it takes for a house to go under contract once it is listed for sale. OK, phew, now -- onto one slight nuance that bears noting... 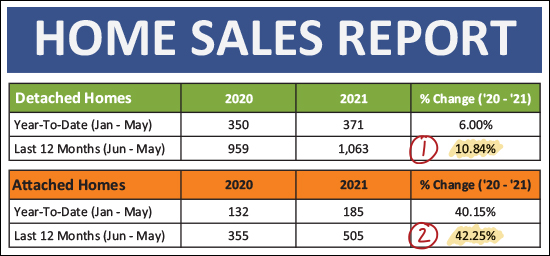 The chart above is comparing detached home sales (green section) to attached home sales (orange section) over the past year. While we have seen a respectable 11% increase in the number of detached homes selling -- we have seen an astonishing 42% increase in the number of attached homes selling! These attached homes are duplexes, townhomes and condos -- and a good number of those are likely new homes. Most new dwellings currently under construction are attached homes -- which contributes to the larger increase in the sale of attached homes. Here's another visual look at what was actually a somewhat surprisingly low month of home sales in May 2021... 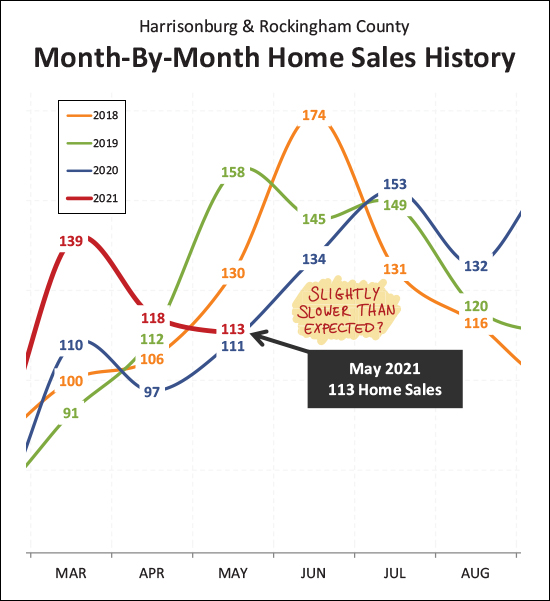 As stated previously -- home sales in May 2021 were lower than I thought they'd be given past months of May. During May of 2018 and 2019 we saw 130 and 158 home sales -- but that dropped down to only 111 home sales in May 2020, largely due to Covid. So, yes, I was surprised to only see 113 home sales in May 2021. I expect we'll see home sales pop back up in June -- but as also stated previously, this will largely depend on enough sellers having been willing to sell! Now, let's look at the first five months of this year compared to the same timeframe for the past three years... 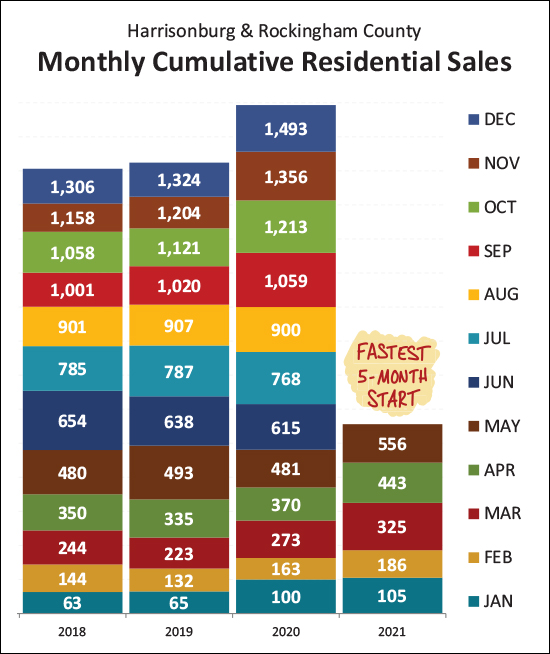 As shown above, we've seen 556 home sales thus far in 2021 -- which is well ahead of the pace we saw for each of the past three years. Thus, even though 2020 ended up being a wildly active year for home sales (1,493) it would seem that 2021 might be on track to surpass that pace! Buckle your seat belts -- if we're going to get there, to perhaps 1500+ home sales -- it's going to be a wild ride for the next seven months of the year. Here's a visualization of how the annual pace of home sales has been speeding up... 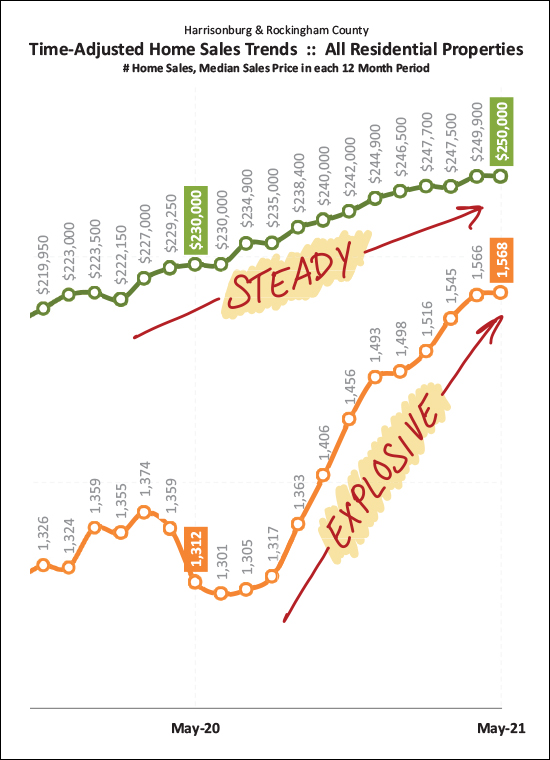 As I have described it above -- [1] We have seen STEADY growth in the median sales price over the past year, plus. The current median sales price of $250,000 is 9% higher than it was a year ago. [2] We have seen EXPLOSIVE growth in the pace of home sales over the past year. The current pace of 1,568 home sales a year is 20% higher than it was a year ago! Will home prices keep rising forever? Maybe so. Will the pace at which they increase start slowing? Maybe so. Here's a brief look at that dynamic just five months into the year... 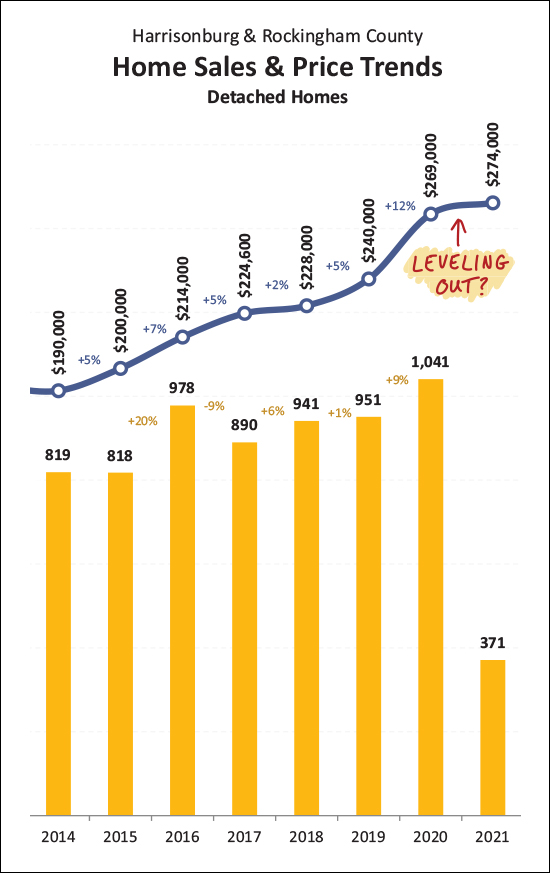 When looking just at single family homes, above, we find that... In the five years before 2020 we saw between a 2% and 7% increase per year in the median sales price. On average, the median sales price increased 4.8% per year between 2014 and 2019. But then, 2020. :-) We saw a 12% increase in the median sales price of single family homes between 2019 and 2020. So, what will happen in 2021? Well, we're only five months into 2021 thus far -- AND, if you ask most active Realtors in this area, they'd likely tell you that, anecdotally, home prices seem to be accelerating even more this year than last year -- BUT, thus far we have only seen a 2% increase in the median sales price in 2021. So, stay tuned. I'll keep monitoring this as the year continues. I don't think the median sales price is going to actually flatten out or decline -- but I also don't think we'll necessarily see another 12% increase this year. OK, this next one requires a bit of thought and explanation, but bear with me... 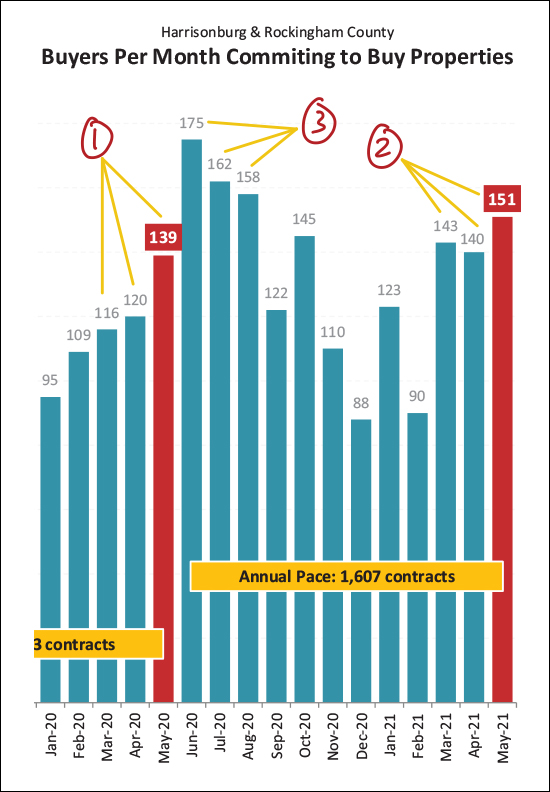 When it comes to contracts signed per month, as shown above, here's what I'm trying to point out... [1] Last spring (March, April, May) only 375 buyers (and sellers) signed contracts. This was likely a bit slower than normal because of Covid. [2] This spring (March, April, May) things were much more active, comparatively, with 434 contracts signed. [3] Last summer (June, July, August) was extremely active -- with 495 contracts signed. This was likely somewhat the result of the market bouncing back after a slower spring. So, what's in store for summer 2021? It's hard to say if we'll have as strong of a summer as we saw last year -- and as mentioned several times thus far, a huge impact on the pace of sales, and contracts being signed, is how many sellers are ready and willing to sell. The buyers are certainly there waiting to pounce! Now, perhaps one of the most confusing and most depressing graphs... 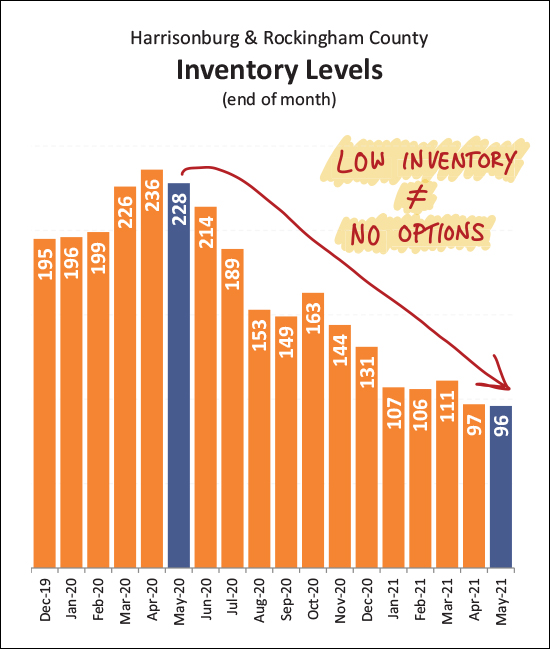 Lots going on here in this relatively simple graph... [1] A year ago a buyer would have found 228 homes on the market for sale in Harrisonburg and Rockingham County. That end-ish of May inventory figure has tumbled 58% over the past year to where current buyers are only finding 96 homes for sale right now!? [2] Bear in mind that low inventory does not mean no options. While buyers at this exact moment have 58% fewer choices than they did a year ago -- technically, they have had about 19% more options of what to buy over the course of the past year as compared to the prior year. After all -- the 19% increase in the number of sales in the past 12 months (compared to the prior 12 months) is a result of 19% (or more) new listings having coming on the market in the past year as compared to the prior year. [3] How can this be? How can a buyer have had 19% more options over the past year but 58% fewer options today? It's a result of the how quickly homes are going under contract. Lots of new listings have come on the market over the past year but they have been going under contract faster and faster and faster, resulting in fewer and fewer and fewer homes left on the market for buyers at any given point in time. What's one of the reasons why so many buyers are buying right now? 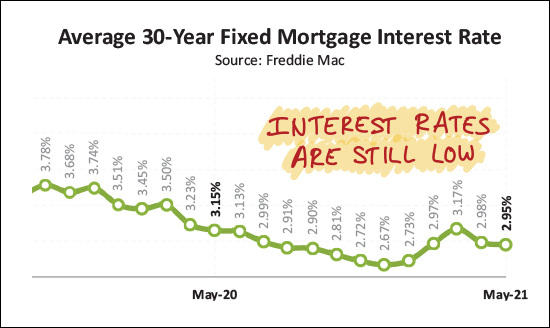 Low mortgage interest rates are making it a very compelling time for buyers to buy right now. Even if prices are going up, interest rates are super low -- and buying with such a low interest rate allows you to lock in the largest part of your monthly housing cost (principal and interest) at a super low payment given these super low rates. Alrighty then! If you made it through all of the charts and graphs and commentary above, hopefully you are feeling like you have a relatively good understanding of some of the market dynamics affecting our local real estate markets. Now, the "so what" of all of these market dynamics... HOME BUYERS - It's definitely possible to buy a home right now, but you're going to have more competition than ever before. You need to have a lender letter in hand, see a house within the first day (or two) of it being listed for sale, be ready to make an offer very quickly, and be willing to consider paying over the asking price and limiting your contract contingencies. It's a tough market, but well prepared, decisive, strategic buyers are winning contracts on houses. HOME SELLERS - You will likely sell your home more quickly, at a more favorable price, and with more favorable terms than you would have a year ago. That said, if you do receive multiple offers within the first week of being on the market, we'll need to make sure we're picking the offer with the most favorable terms overall, that stands the best chance of making it successfully to closing. HOME OWNERS - If you love your home, or even if you just like it pretty well, great! Settle in and enjoy owning a home during a time when home values are increasing quickly and when homes are hard for buyers to buy. Just like toilet paper, swimming pools, lumber, gasoline, and cars -- houses are in short supply and are getting more expensive. Enjoy the fact that you already own one! If you're looking to connect with me to talk about buying or selling a house, perhaps this summer, feel free to reply to this email or call/text me at 540-578-0102. Until next month, I hope you are able to find some time this June to relax and enjoy this first month of summer 2021! | |
| Newer Posts | Older Posts |
Scott Rogers
Funkhouser Real
Estate Group
540-578-0102
scott@funkhousergroup.com
Licensed in the
Commonwealth of Virginia
Home Search
Housing Market Report
Harrisonburg Townhouses
Walk Through This Home
Investment Properties
Harrisonburg Foreclosures
Property Transfers
New Listings


