News
| Older Posts |
Rockingham County and New Home Sales Drive Surge in Area Housing Market |
|
 Happy Friday morning, all! November is flying right along... with a rather entertaining overlap of the JMU football and basketball seasons (Go Dukes!)... plus one of my favorite holidays, Thanksgiving! Speaking of JMU Basketball... each month I offer a giveaway for readers of my market report. This month I'm giving away four tickets to the JMU Men's Basketball game on Saturday, December 7 at 4:00 PM. Click here to enter for a chance to win the tickets to cheer on the JMU Dukes! Now, on to the latest in our local housing market. First, some of the overall metrics... 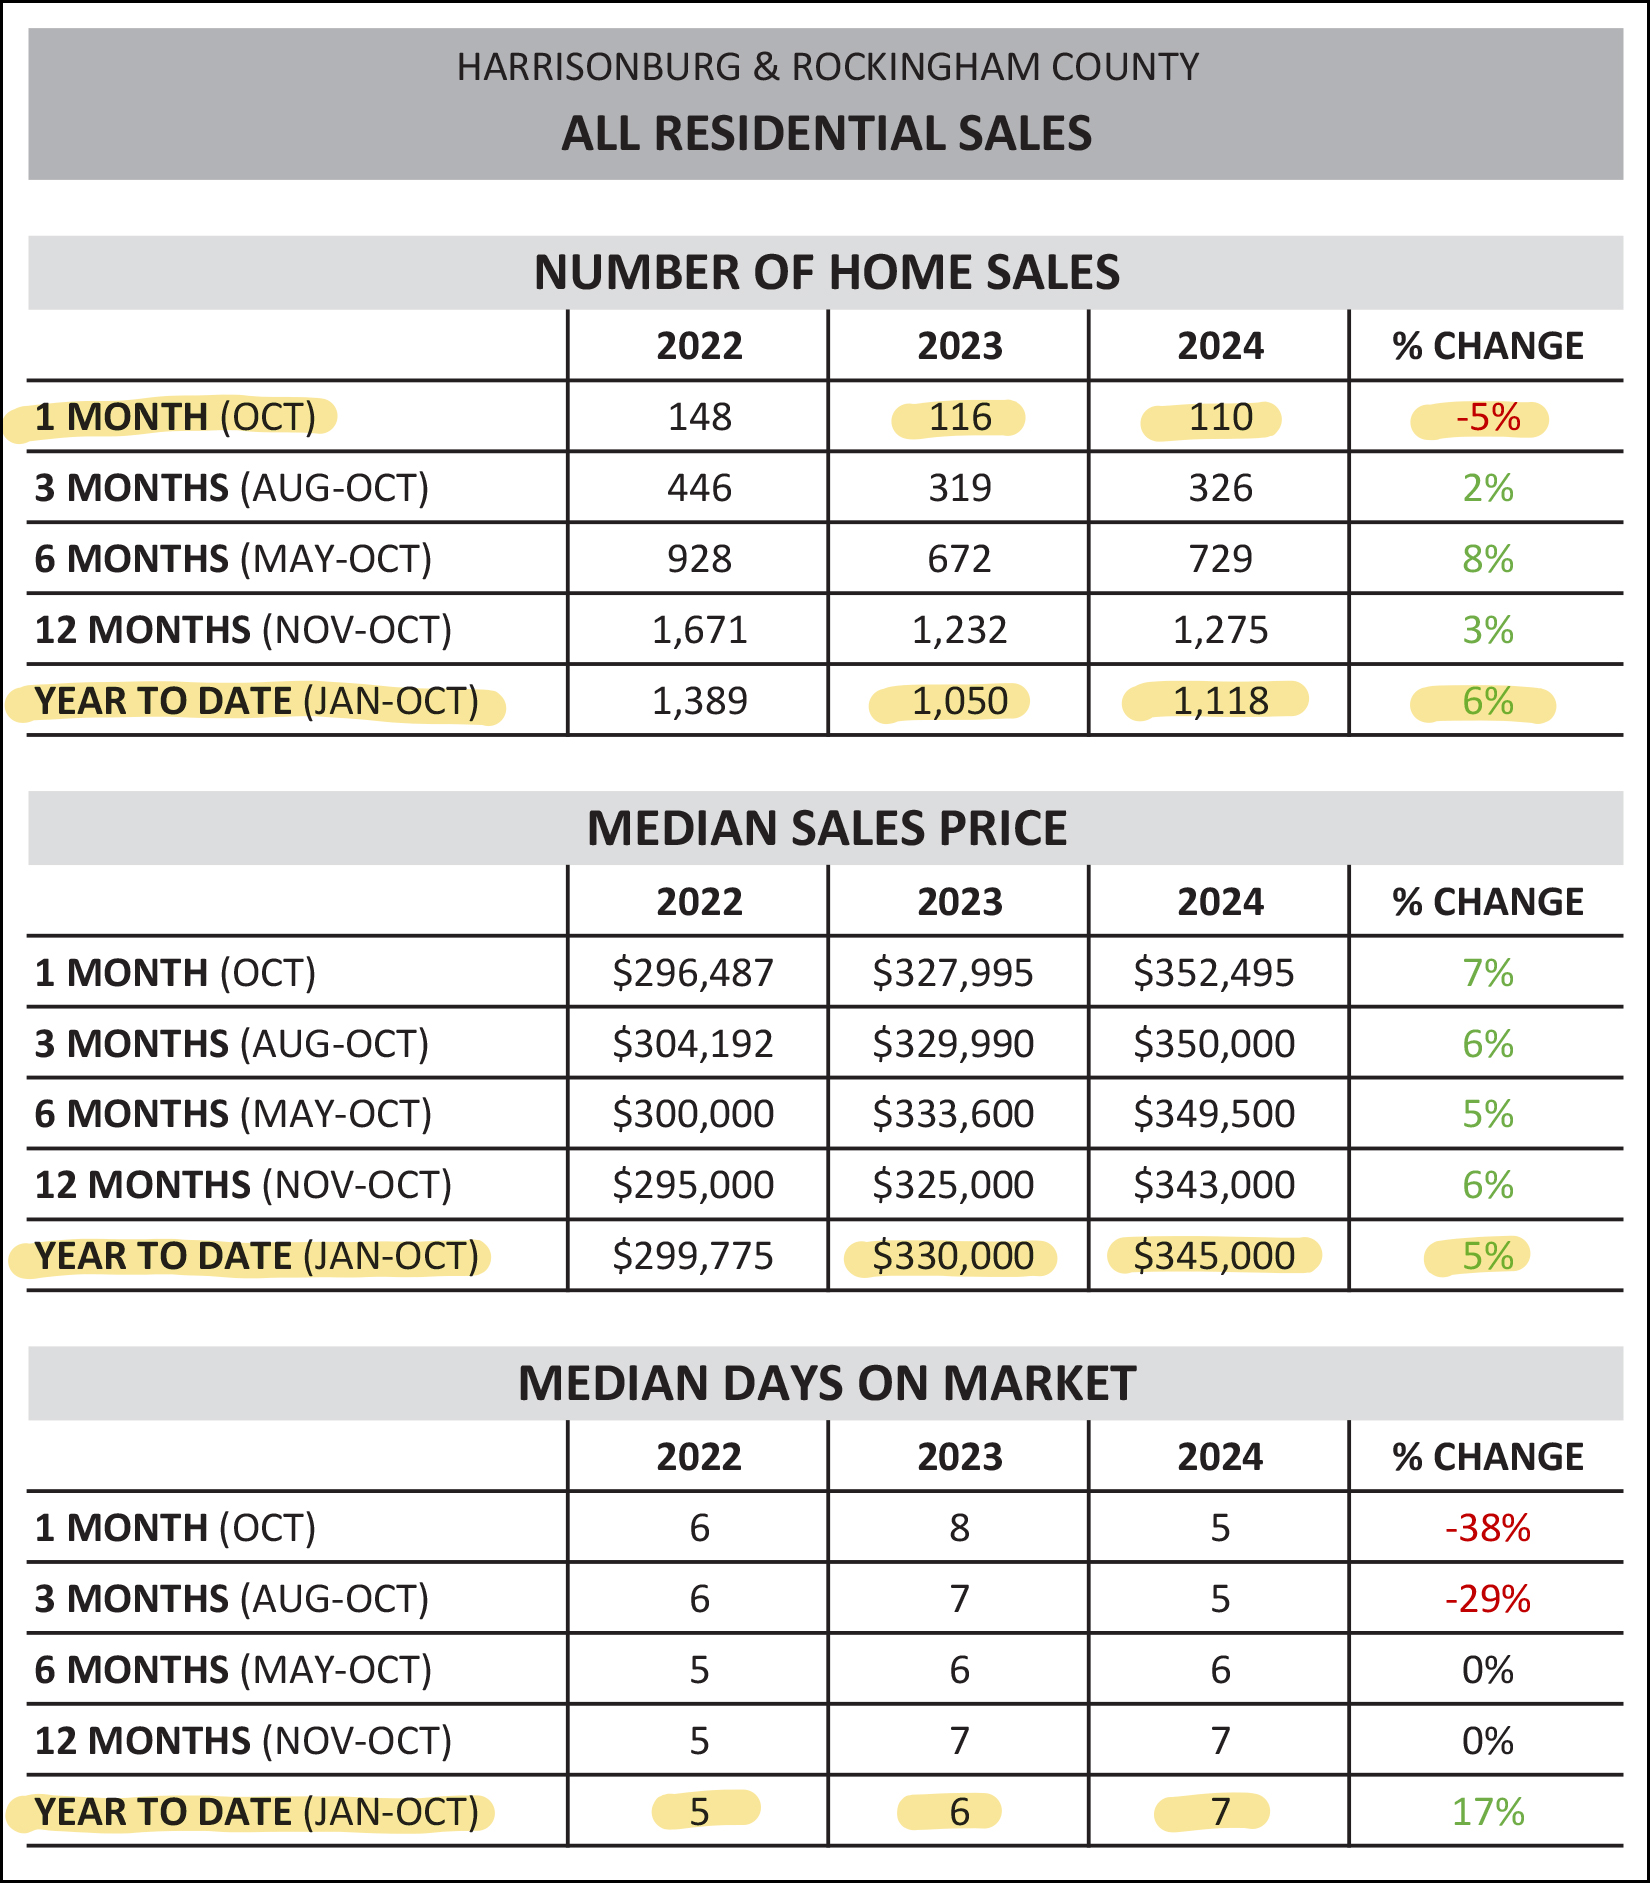 Home sales slowed, a touch, in October 2024 with only 110 home sales as compared to 116 last October... but thus far this year we have seen 1,118 home sales, which is a 6% increase from the 1,050 seen in the same timeframe last year. So... 6% more home sales this year than last... and how about those prices... The median sales price in Harrisonburg and Rockingham County over the first ten months of 2024 has been $345,000 -- which is a 5% increase from the median sales price of $330,000 last year at this time. So... 6% more home sales, and 5% higher prices... how about the speed of those sales... Median days on market continues to (slowly) increase in 2024... which a current median of 7 days, up from 6 days a year ago, and 5 days the prior year. So... small increases in the speed at which home sales go under contract, but 6% more home sales and 5% higher prices. Now, let's take a quick look at only single family detached housing, which excludes townhouses, duplexes and condos... 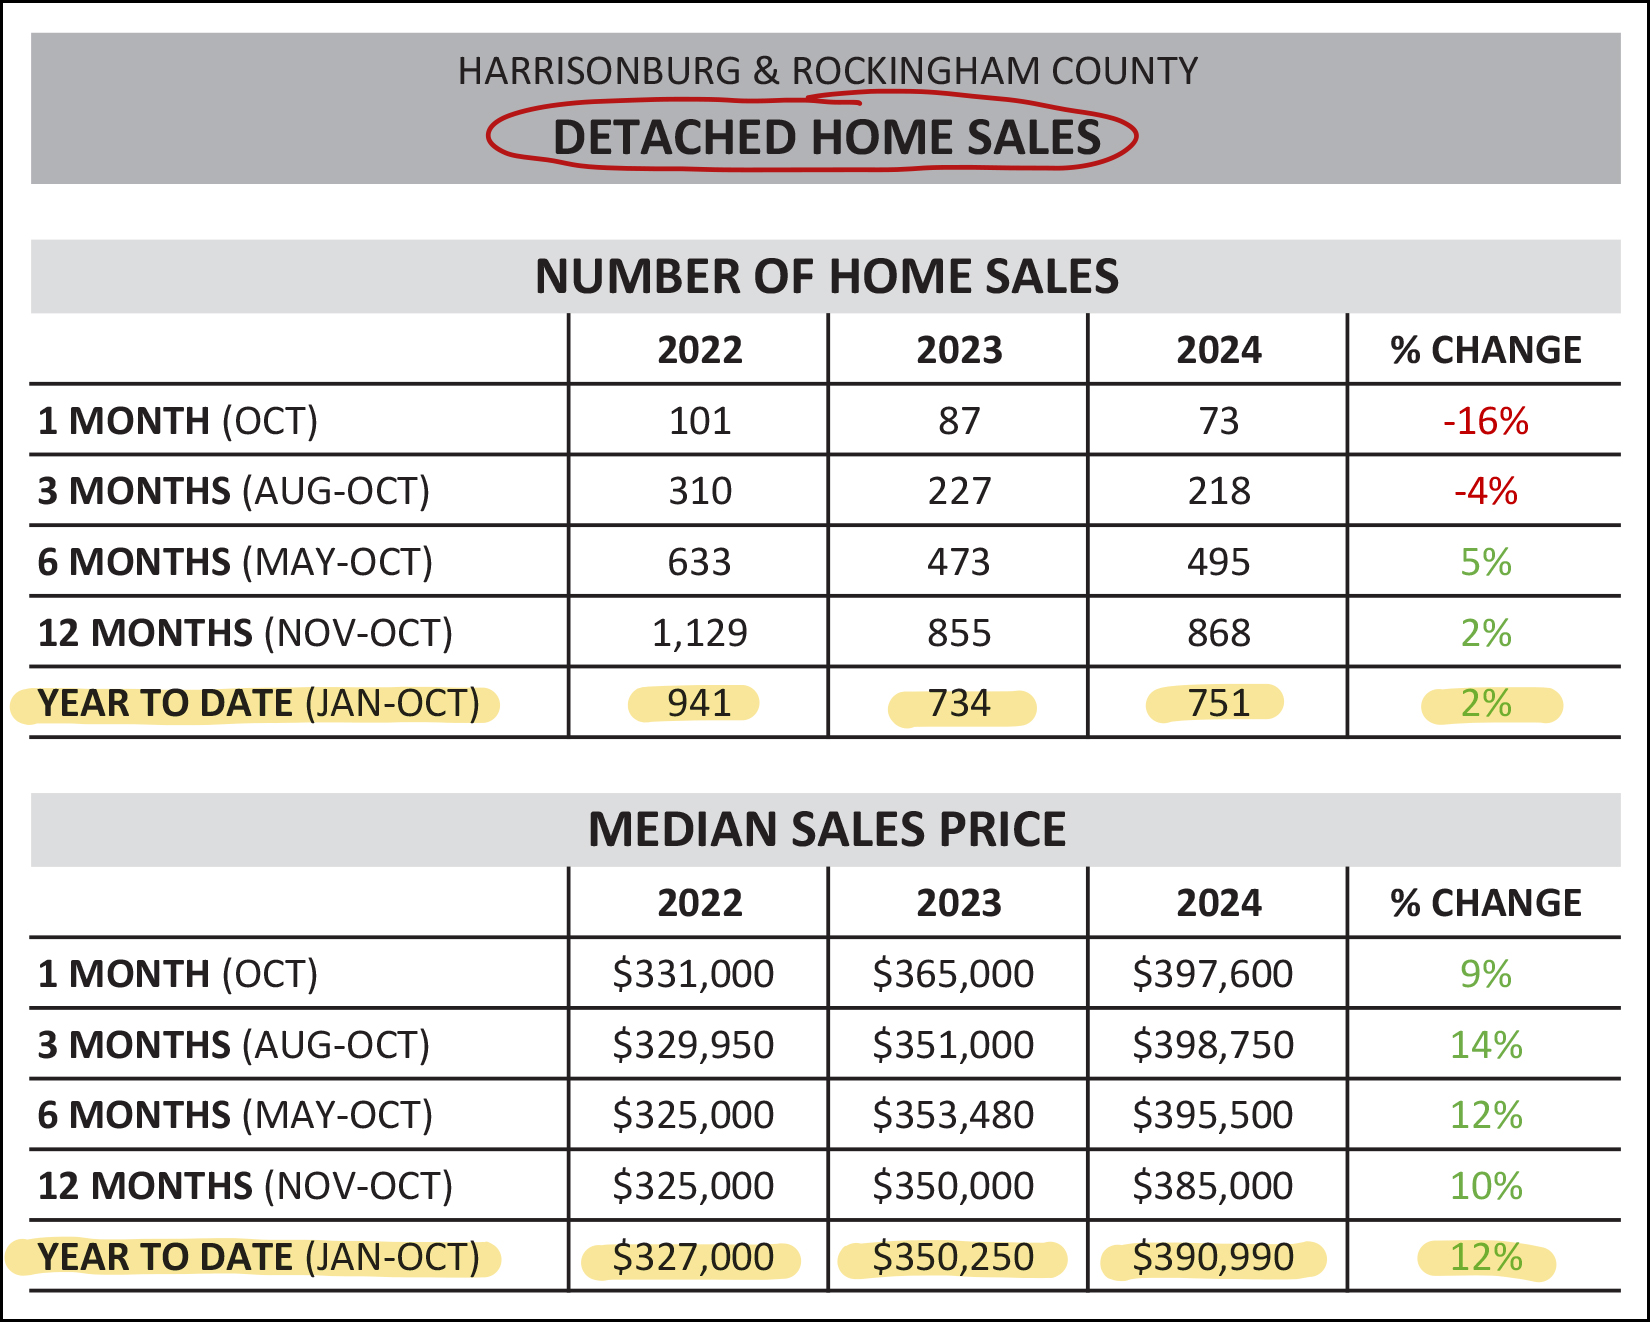 In contrast to the market-wide 6% increase in the number of homes that are selling, we are only seeing a 2% increase in the number of detached homes that are selling. Also of note, two years ago we had seen 941 detached home sales in Harrisonburg and Rockingham County through the end of October, whereas we are only seeing 751 such sales thus far in 2024. When it comes to prices, we are seeing a stronger (12%) increases in the median sales price of detached homes as compared to the overall market-wide 5% increase in the median sales price. Furthermore, the median sales price of a single family detached home has increased from $327,000 to $390,900 over the past two years. Next up, let's take a peek just at the City of Harrisonburg... 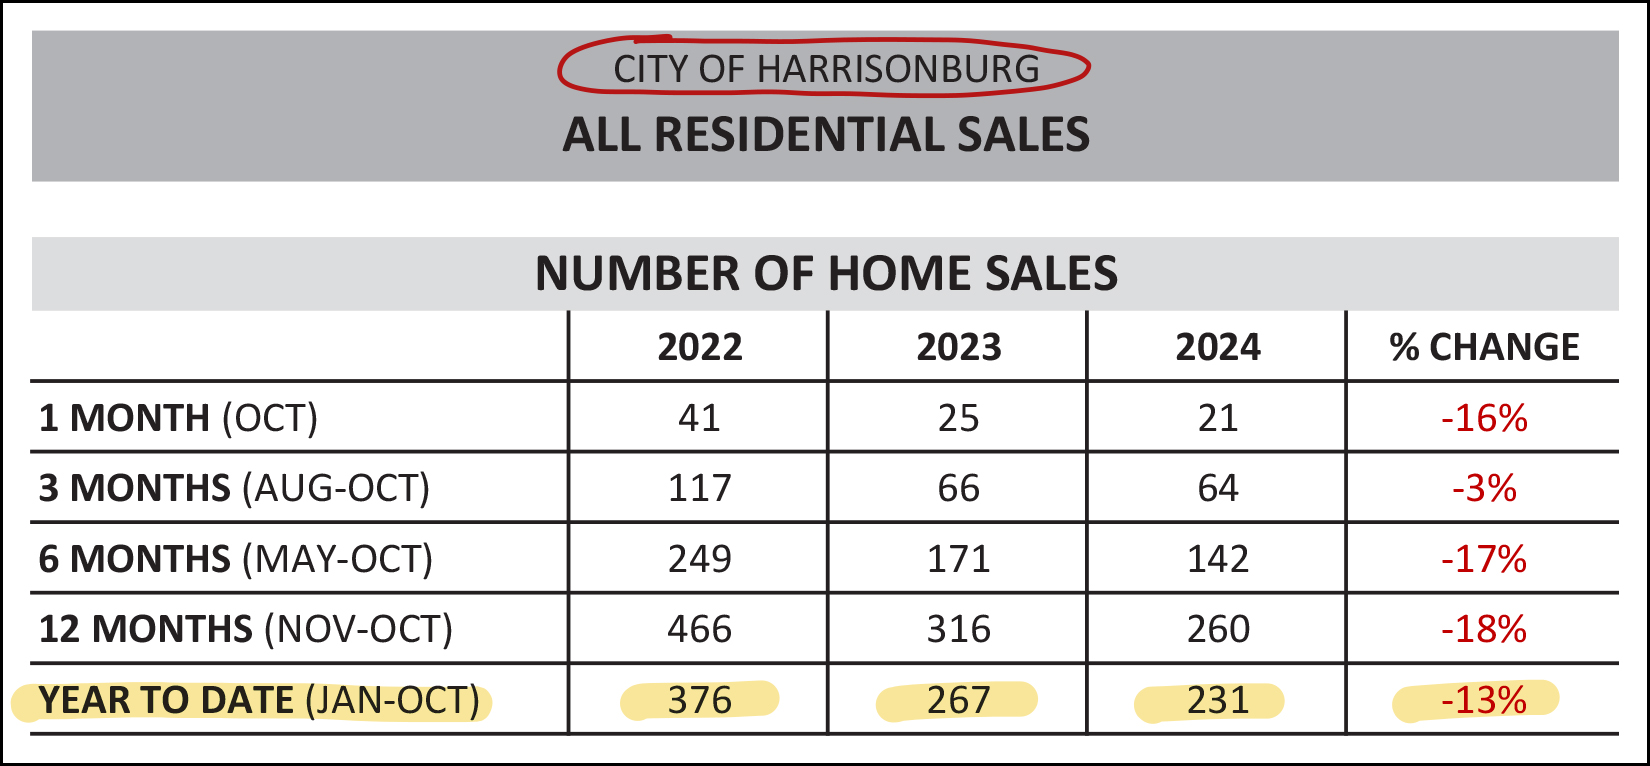 While we are seeing increases in home sales in most portions of the market... and in the overall market... not so much in the City of Harrisonburg. There have only been 231 home sales in the City thus far in 2024 which is a 13% decline from last year, and a 39% decline from the 376 home sales seen in the first ten months of 2022. Meanwhile, in Rockingham County... 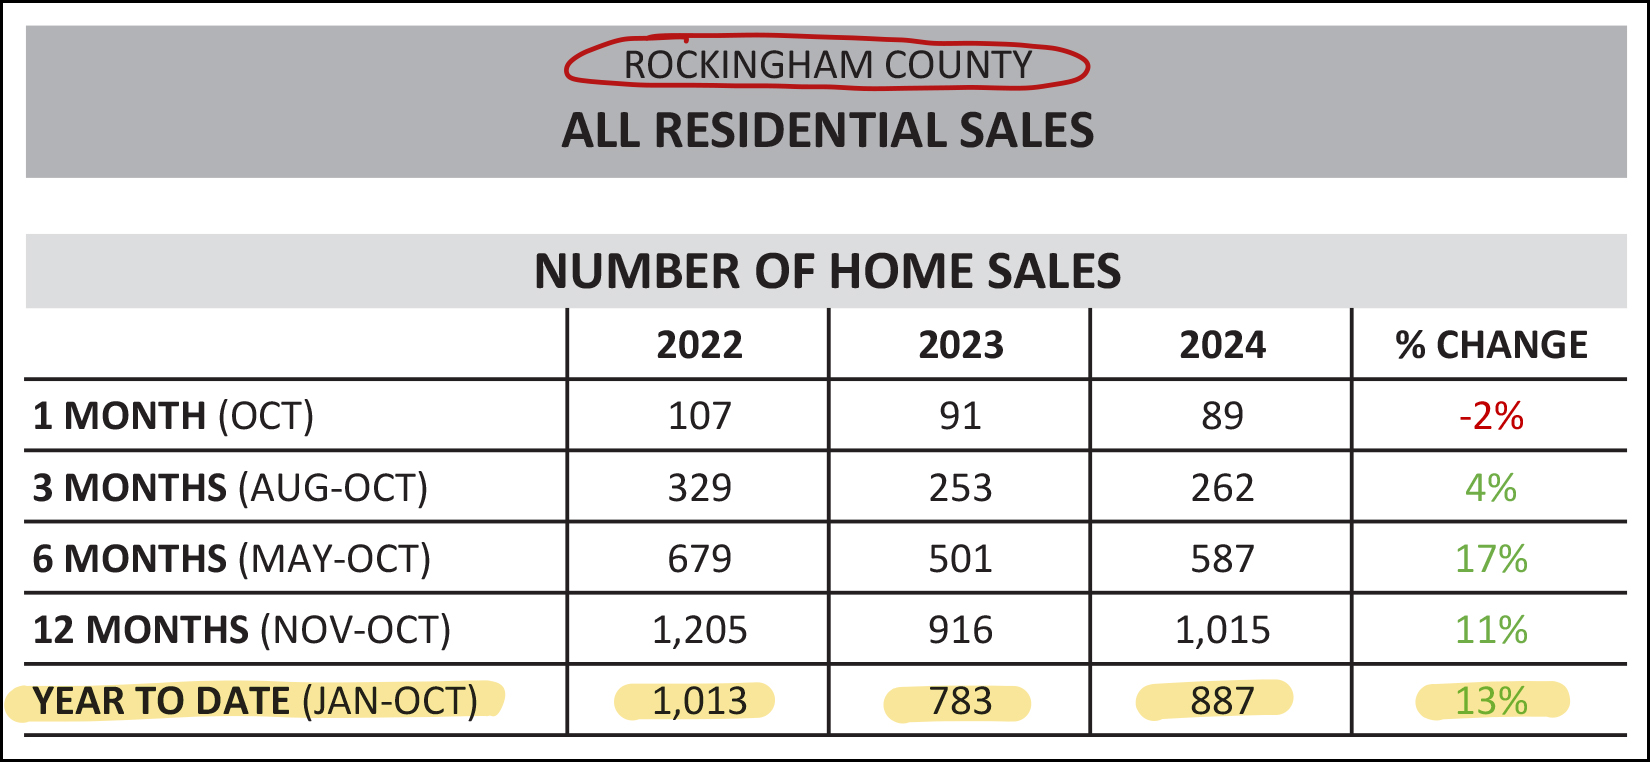 Mirroring the 13% decline in City sales in 2024, we are finding a 13% increase in Rockingham County home sales thus far in 2024. One reason we are seeing more of an increase in home sales in the County than in the City is a result of most new home developments currently being built in the County... and not the City. Here's a look at the number of new construction homes selling in recent years... 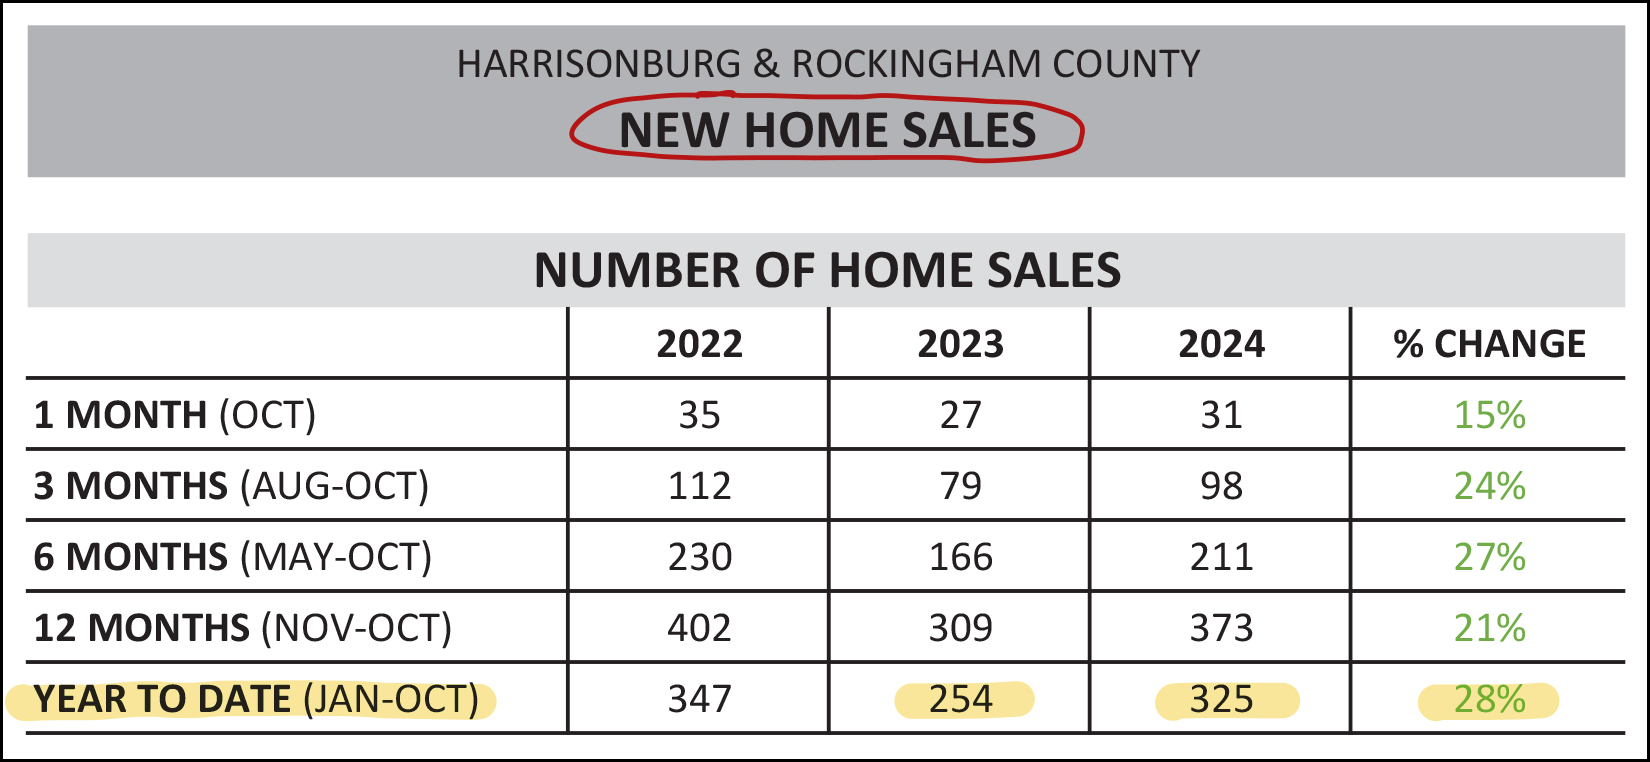 And as you might imagine... if we're seeing a 28% increase in new home sales in the first ten months of 2024, we probably aren't seeing much of an increase in existing home sales... 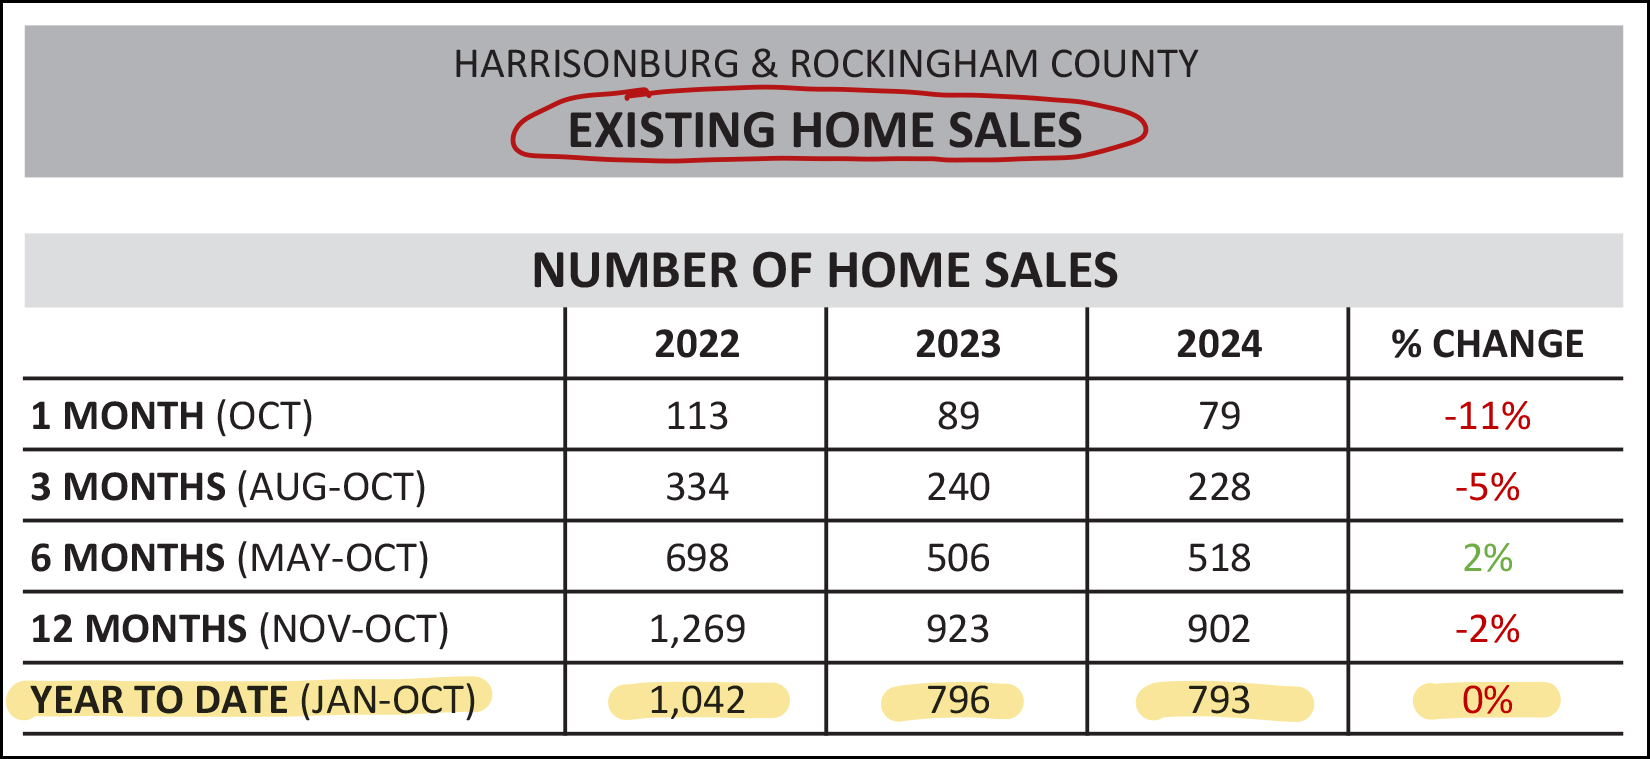 Indeed, we are seeing a tiny decline in existing home sales this year (793) compared to last year (796) though both are considerably below the 1,042 existing homes that sold two years ago in the first 10 months of 2022. Rolling over now into some graphs, let's see what else we can learn about our local housing market through the end of October 2024... 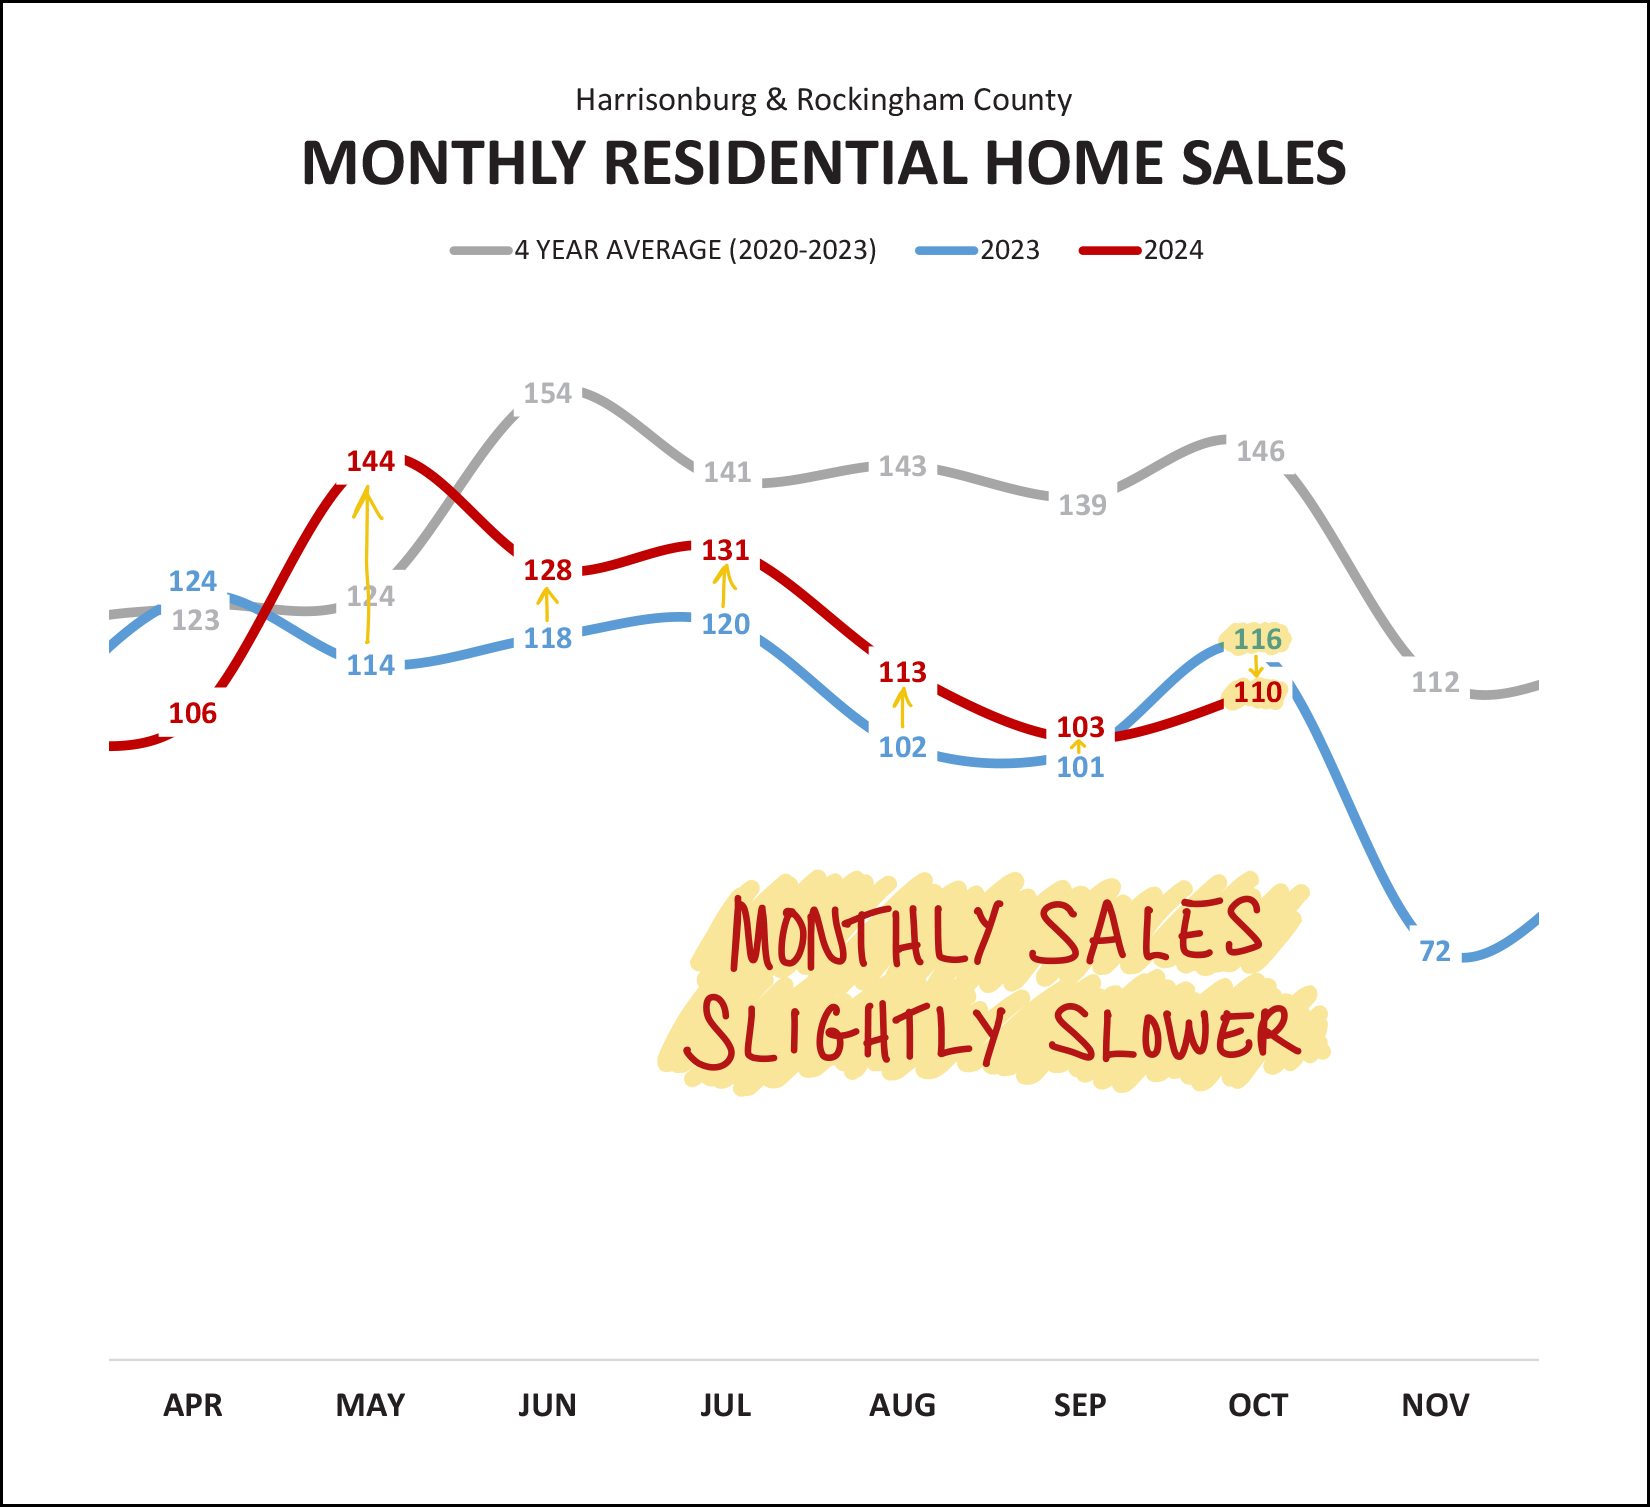 For five of the past six months we have seen more home sales this year than last year... the one exception being October. We could also generalize and say that the larger increases in monthly sales (larger little gold arrows) were on the first half of the past six months... while the smaller increases (smaller little gold arrows) were on the second half of the past six months. Looking ahead a bit on the graph above... it seems almost guaranteed that we will see more November home sales this year than last. Last year we saw monthly home sales drop from 116 in October to 72 in November. I don't think we will see that large of a decline this year. When we pile up each month of the year on top of the prior months, here's what we get over the past few years... 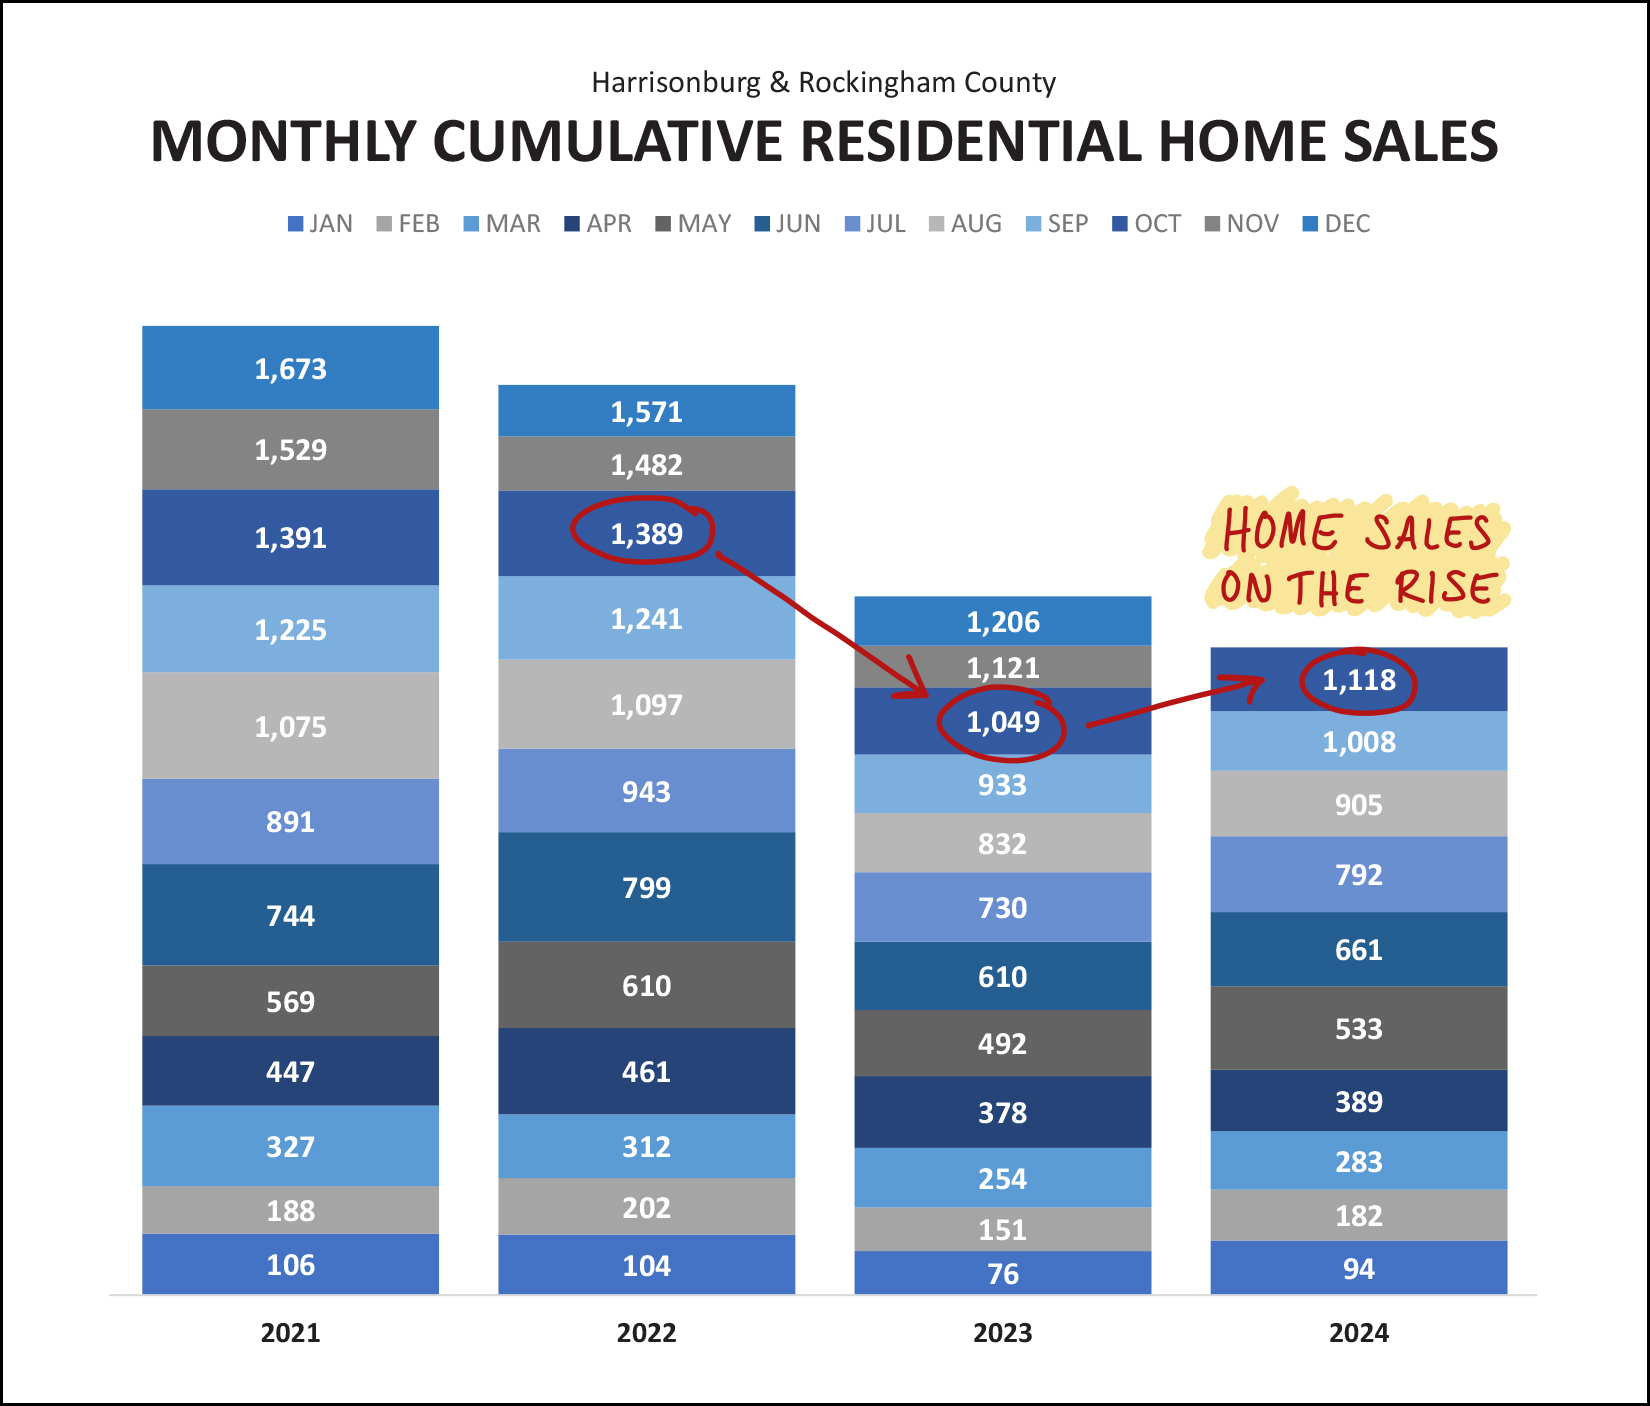 Home sales are on the rise this year... increasing from 1,049 to 1,1118 in the first ten months of the year... BUT... that is still a significant drop from the 1,389 home sales seen in the first 10 months of 2022! The biggest difference, as you likely know, is that we were still experiencing super low mortgage interest rates in 2022... which were no longer around in 2023 and 2024. On this next graph I'm trying to generalize the main two shifts I have seen in 2024... 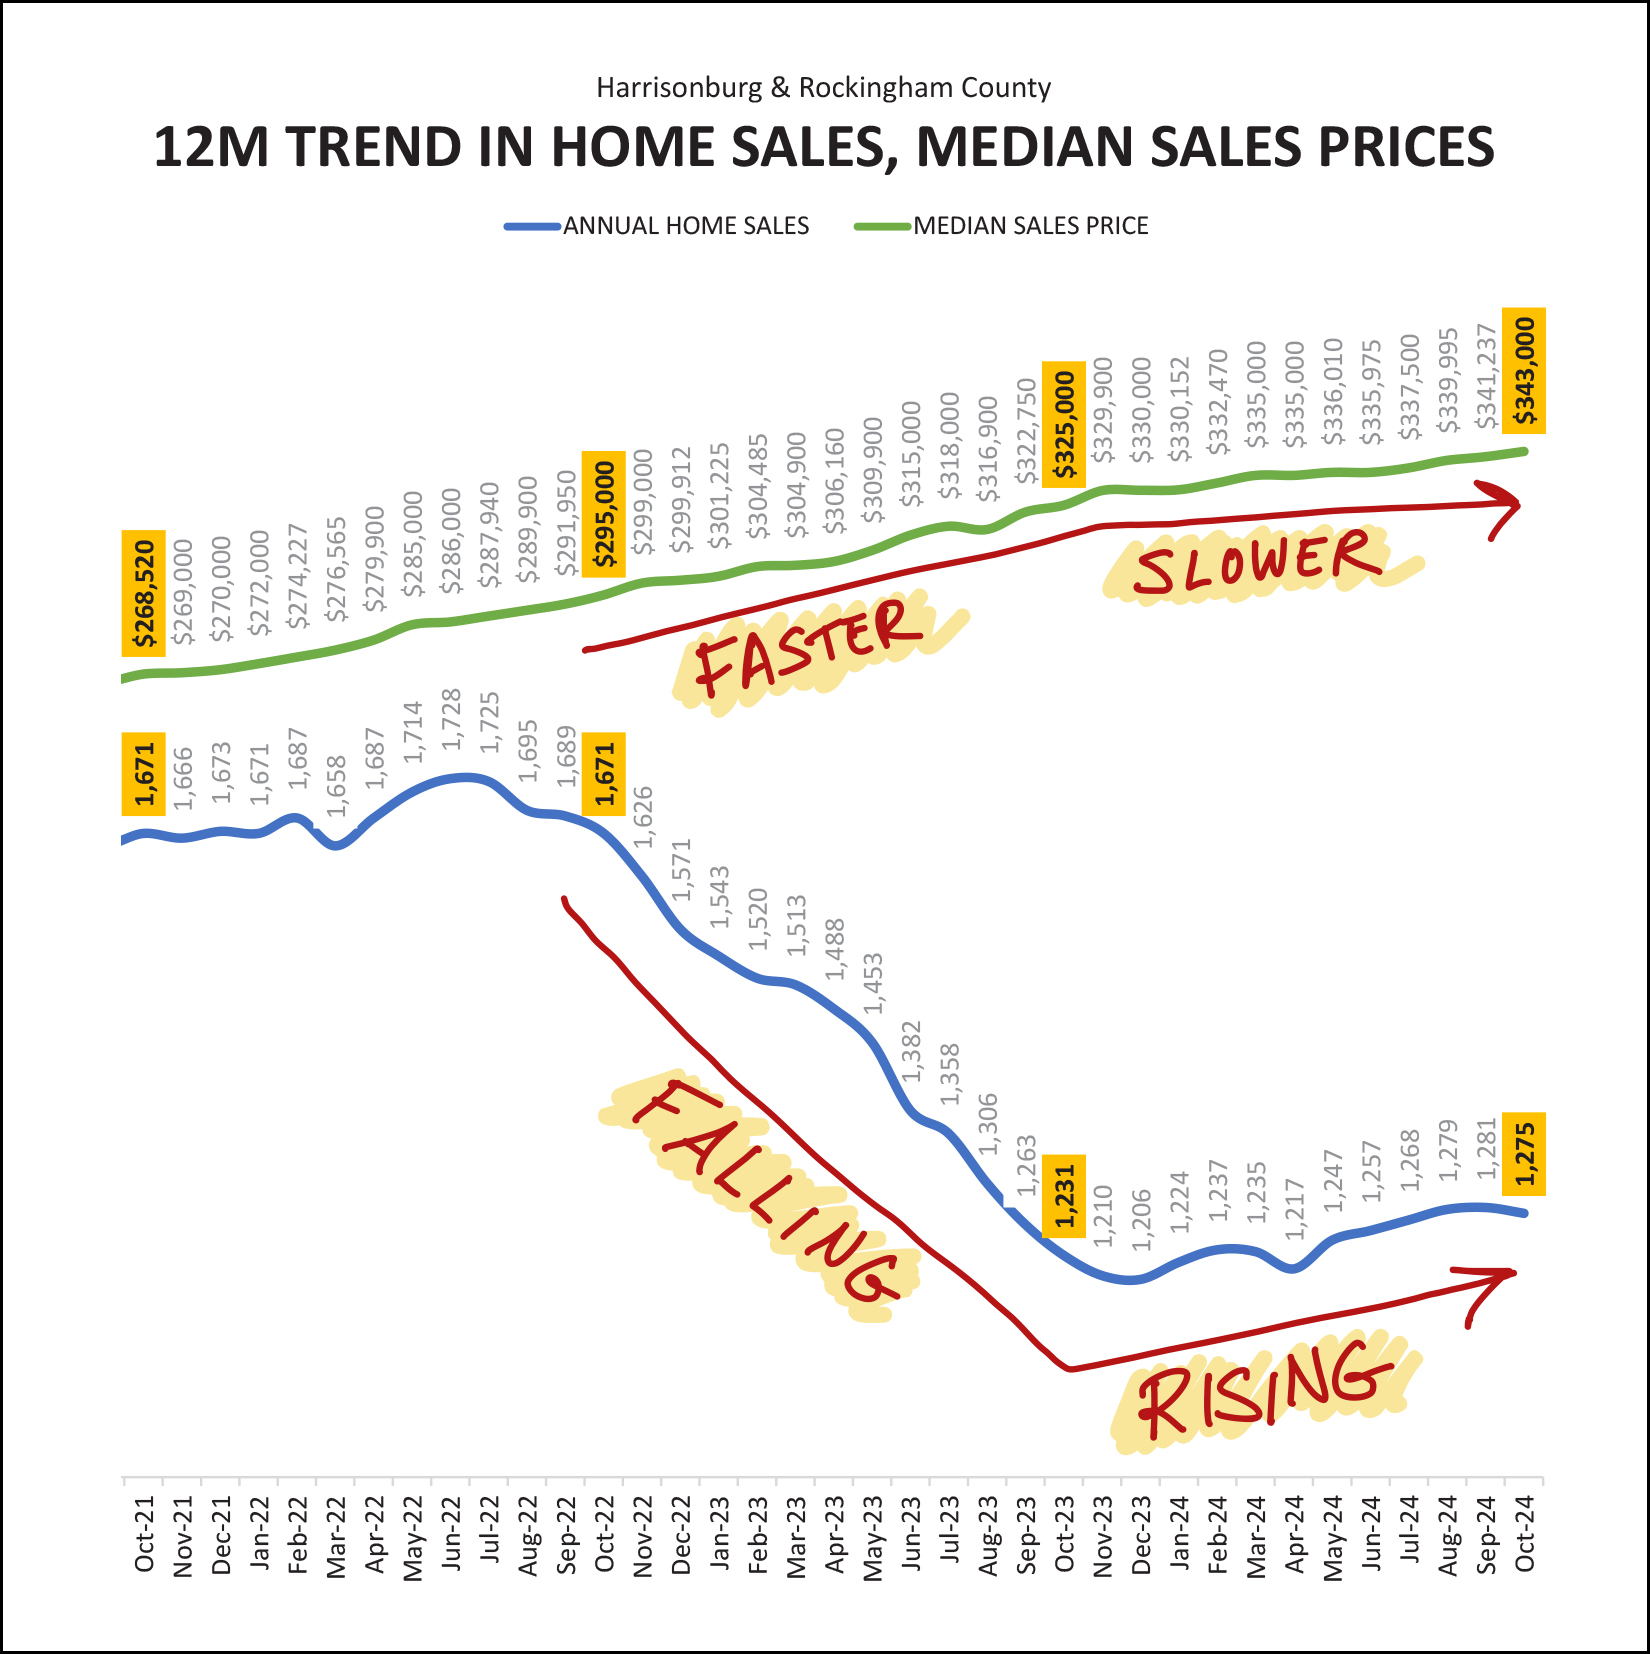 The top line is tracking median sales prices. For several years we saw 10% per year annual increases in the median sales price... up to and including in 2023... but home prices seem to be increasing a bit more slowly in 2024... more in the neighborhood of a 5% increase instead of a 10% increase. The other main change we have seen in 2024 is that home sales are rising again... so as to say that more homes are selling. Through most of 2023 we saw steady declines in the number of homes that were selling, but that trend reversed itself (slowly) in 2024. Zooming out a bit, take a look at the change in home values for detached homes in Harrisonburg and Rockingham County over the past five years... 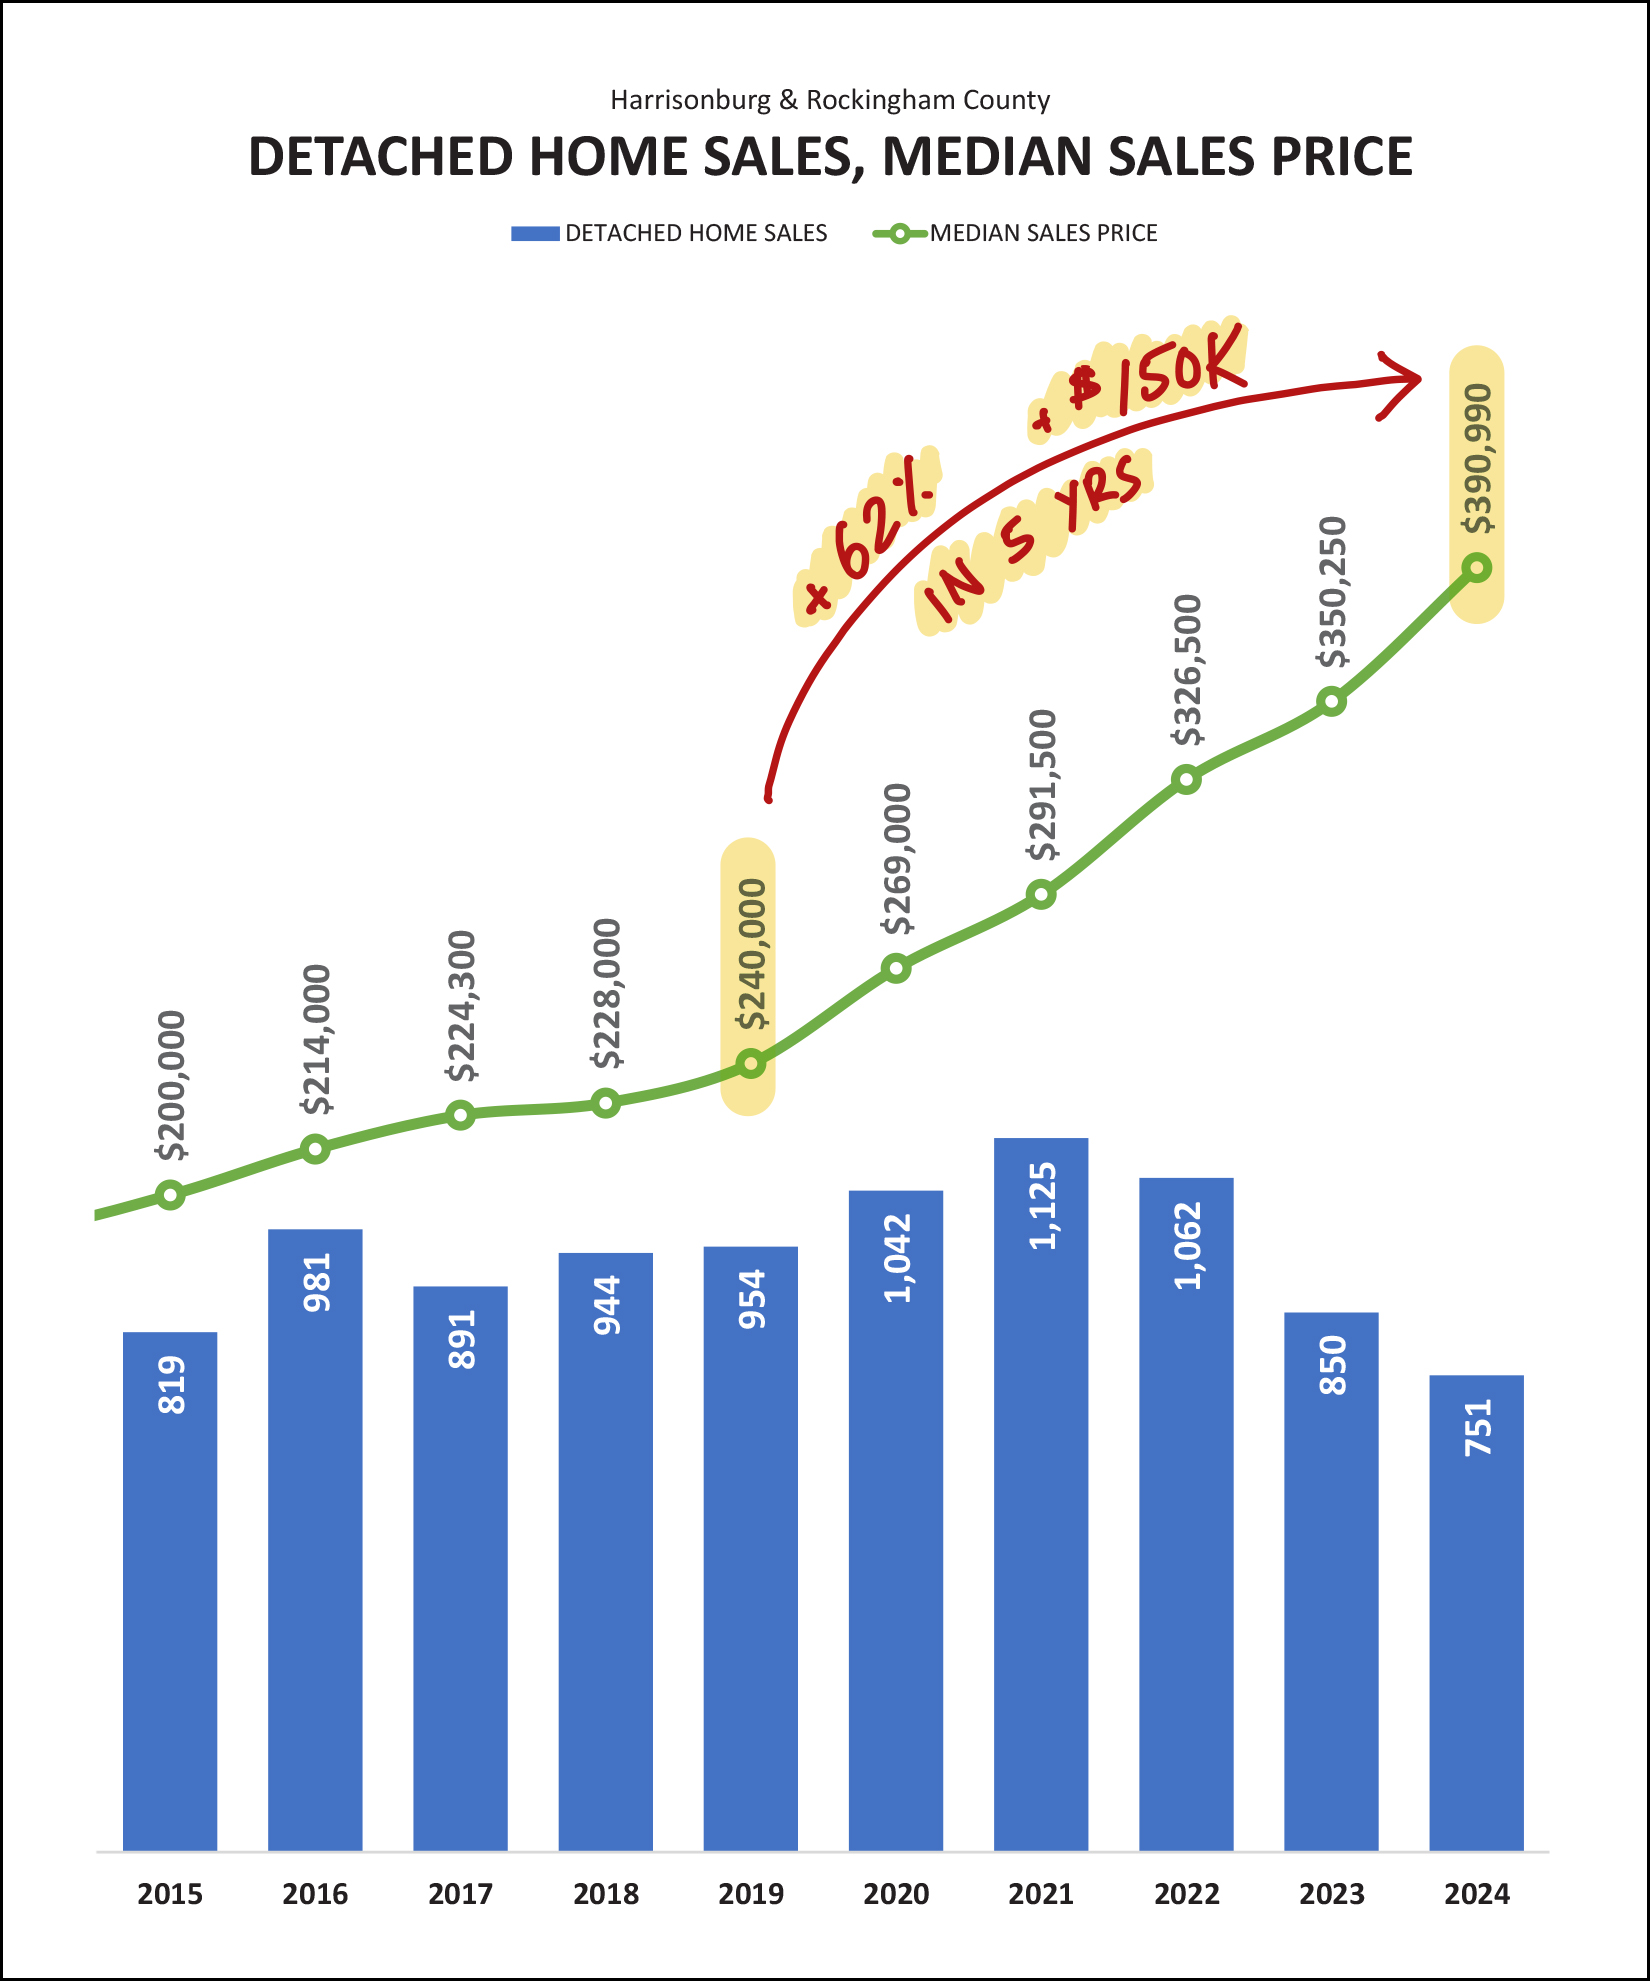 Indeed... you are reading that correctly... the median sales price of a detached home in Harrisonburg and Rockingham County has increased by $150,000 over the past five years... for a cumulative 62% increase! A few thoughts come to mind... 1. Anyone who has owned the same home for the past 5+ years likely has quite a bit of equity in their home. 2. It is a lot harder (financially) to consider buying a detached home now (median price of $391K) than it was five years ago (median price of $240K). 3. Changes in mortgage interest rates over the past five years haven't helped buyers either -- as the average rate on a 30 year mortgage was 3.75% five years ago, and is 6.78% today. Wowsa! Shifting gears a bit, let's zoom back in to the here and now, to see what recent contract activity might tell us about upcoming months of home sales... 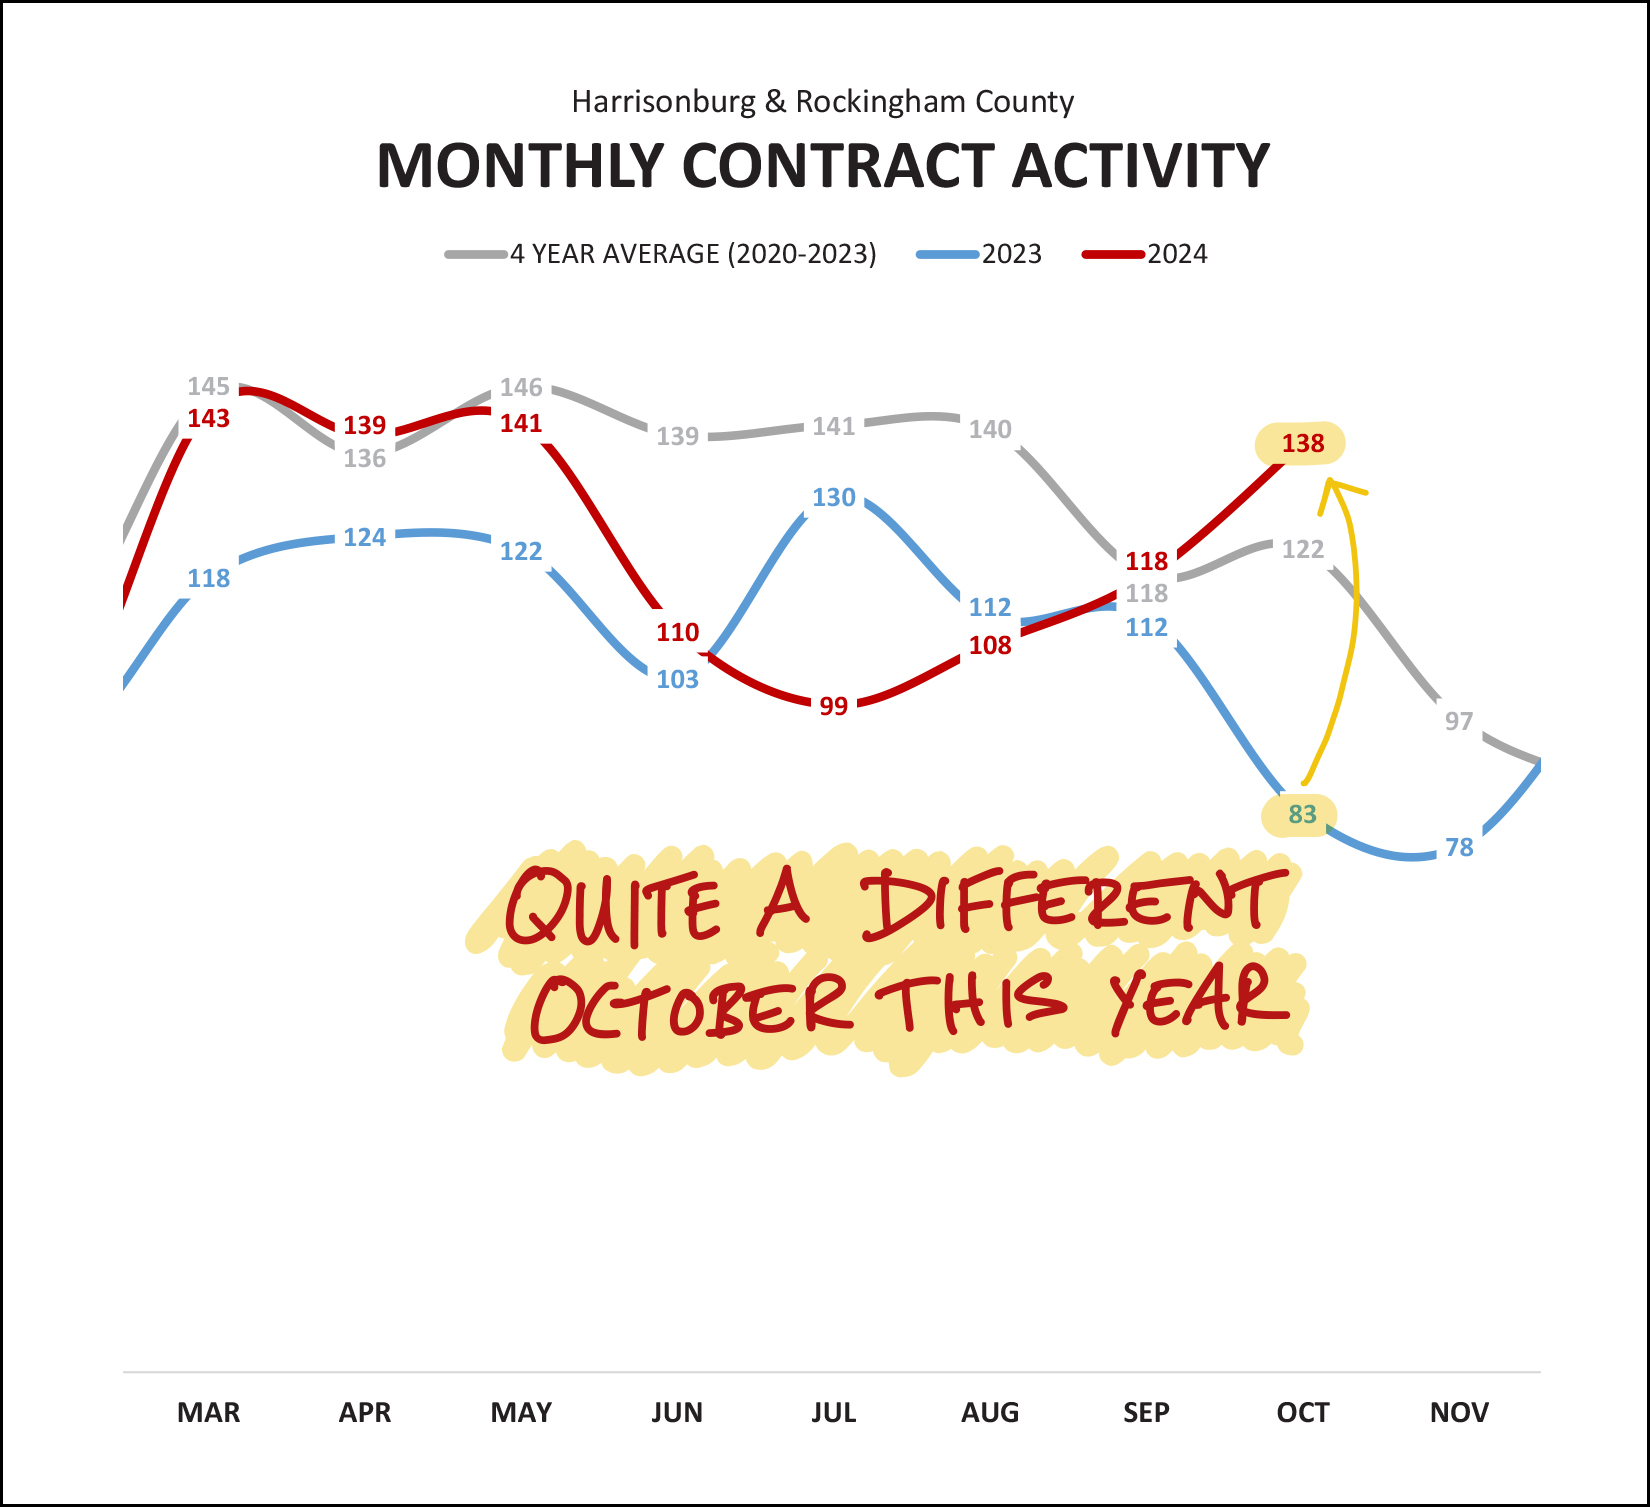 Here (above) is the other reason why I don't think we'll see a decline in November home sales this year like we did last year... there was a drastic difference in October contract activity this year compared to last. The key thing to remember about last October is that it included the final climb to a peak average mortgage interest rate of 7.79%. That steady climb slowed and slowed and slowed down buyer activity last October (and November) as shown by the blue line above. Thus, even though mortgage interest rates are currently in the 6% - 6.75% range, we still saw many more buyers signing contracts to buy homes this October (138) as compared to last October (83). I expect we will continue to see stronger contract activity in November and December of this year compared to the same months last year. Which leads us to "pending sales" -- the number of homes that are under contract at any given time... 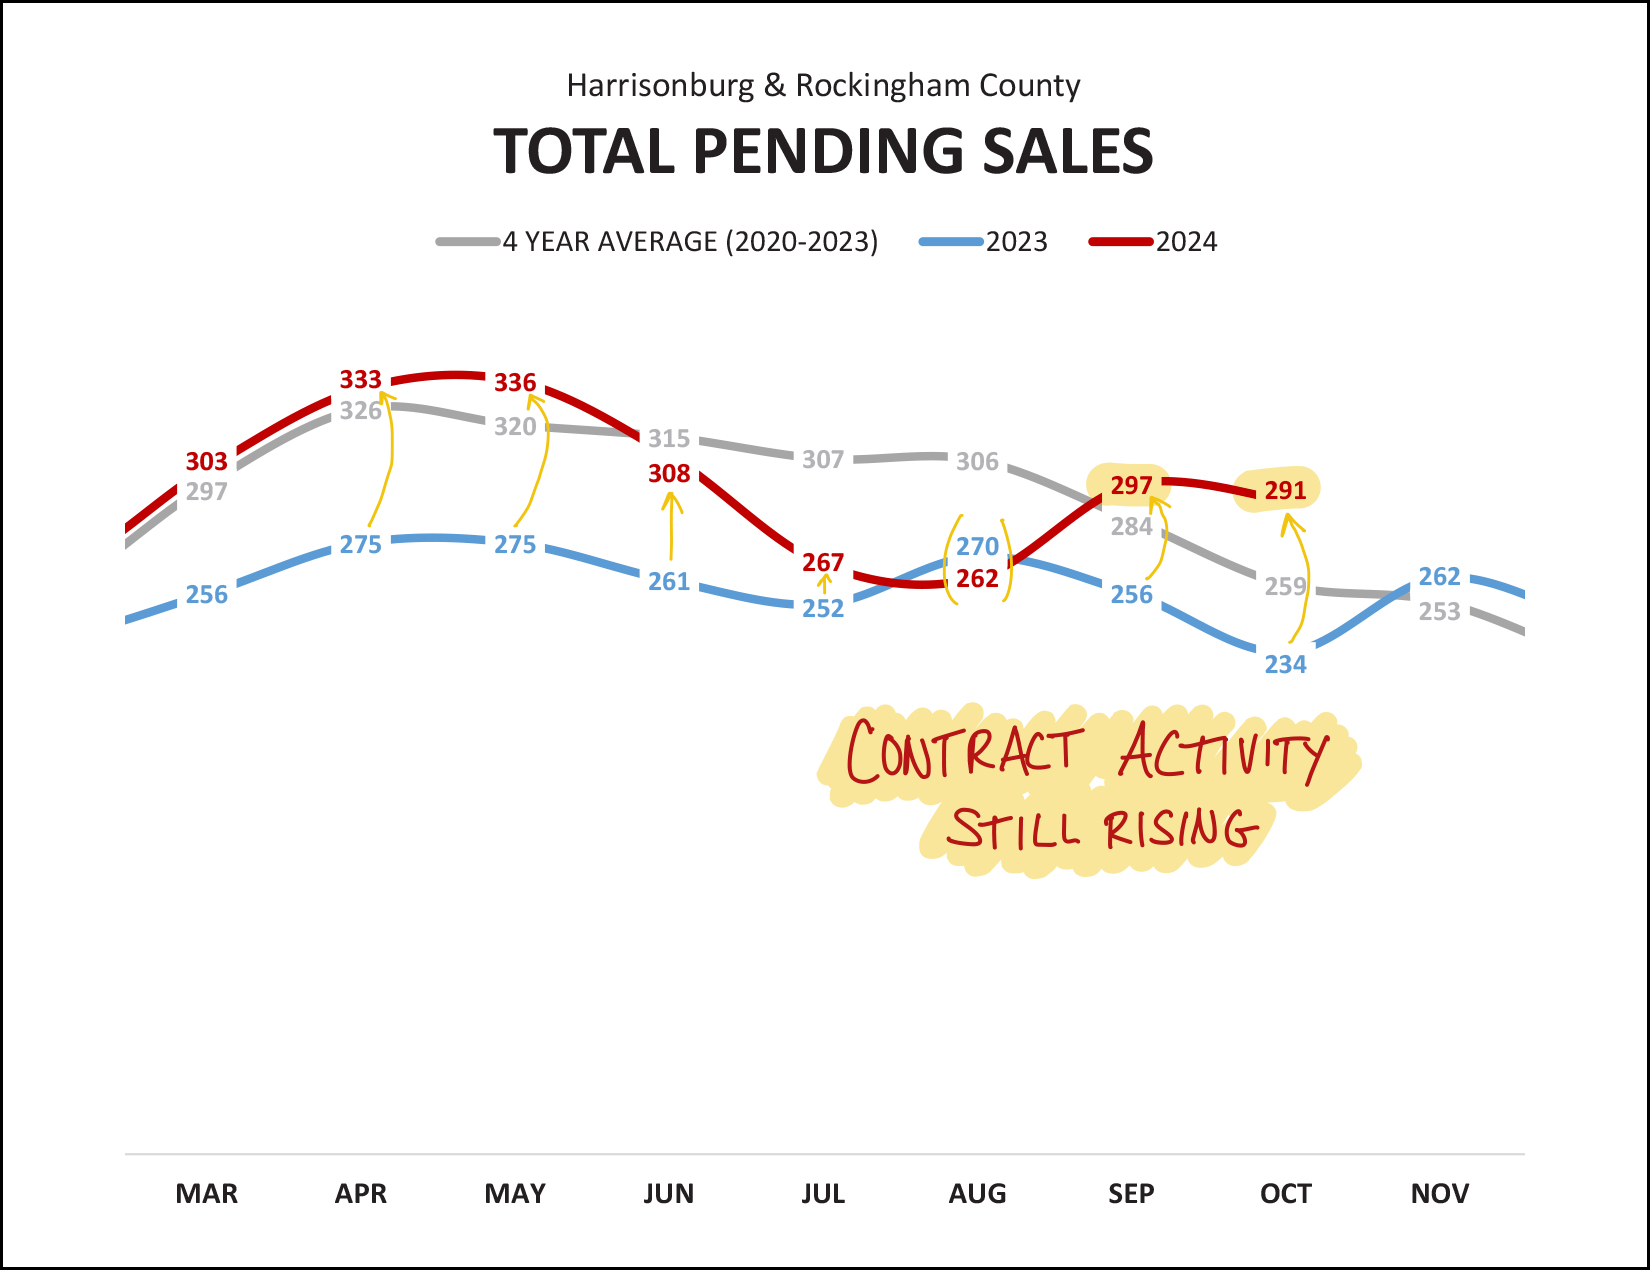 The red line (above) tracks how many homes are pending (under contract) per month in Harrisonburg and Rockingham County. As you can see from all the gold arrows, we had been seeing increases in pending sales for most of the months this year... through August, when 2024 fell below 2023... but things have picked back up again significantly in September and October. There are currently 291 homes under contract (pending) in Harrisonburg and Rockingham County as compared to only 234 a year ago at this time. And how about those inventory levels? 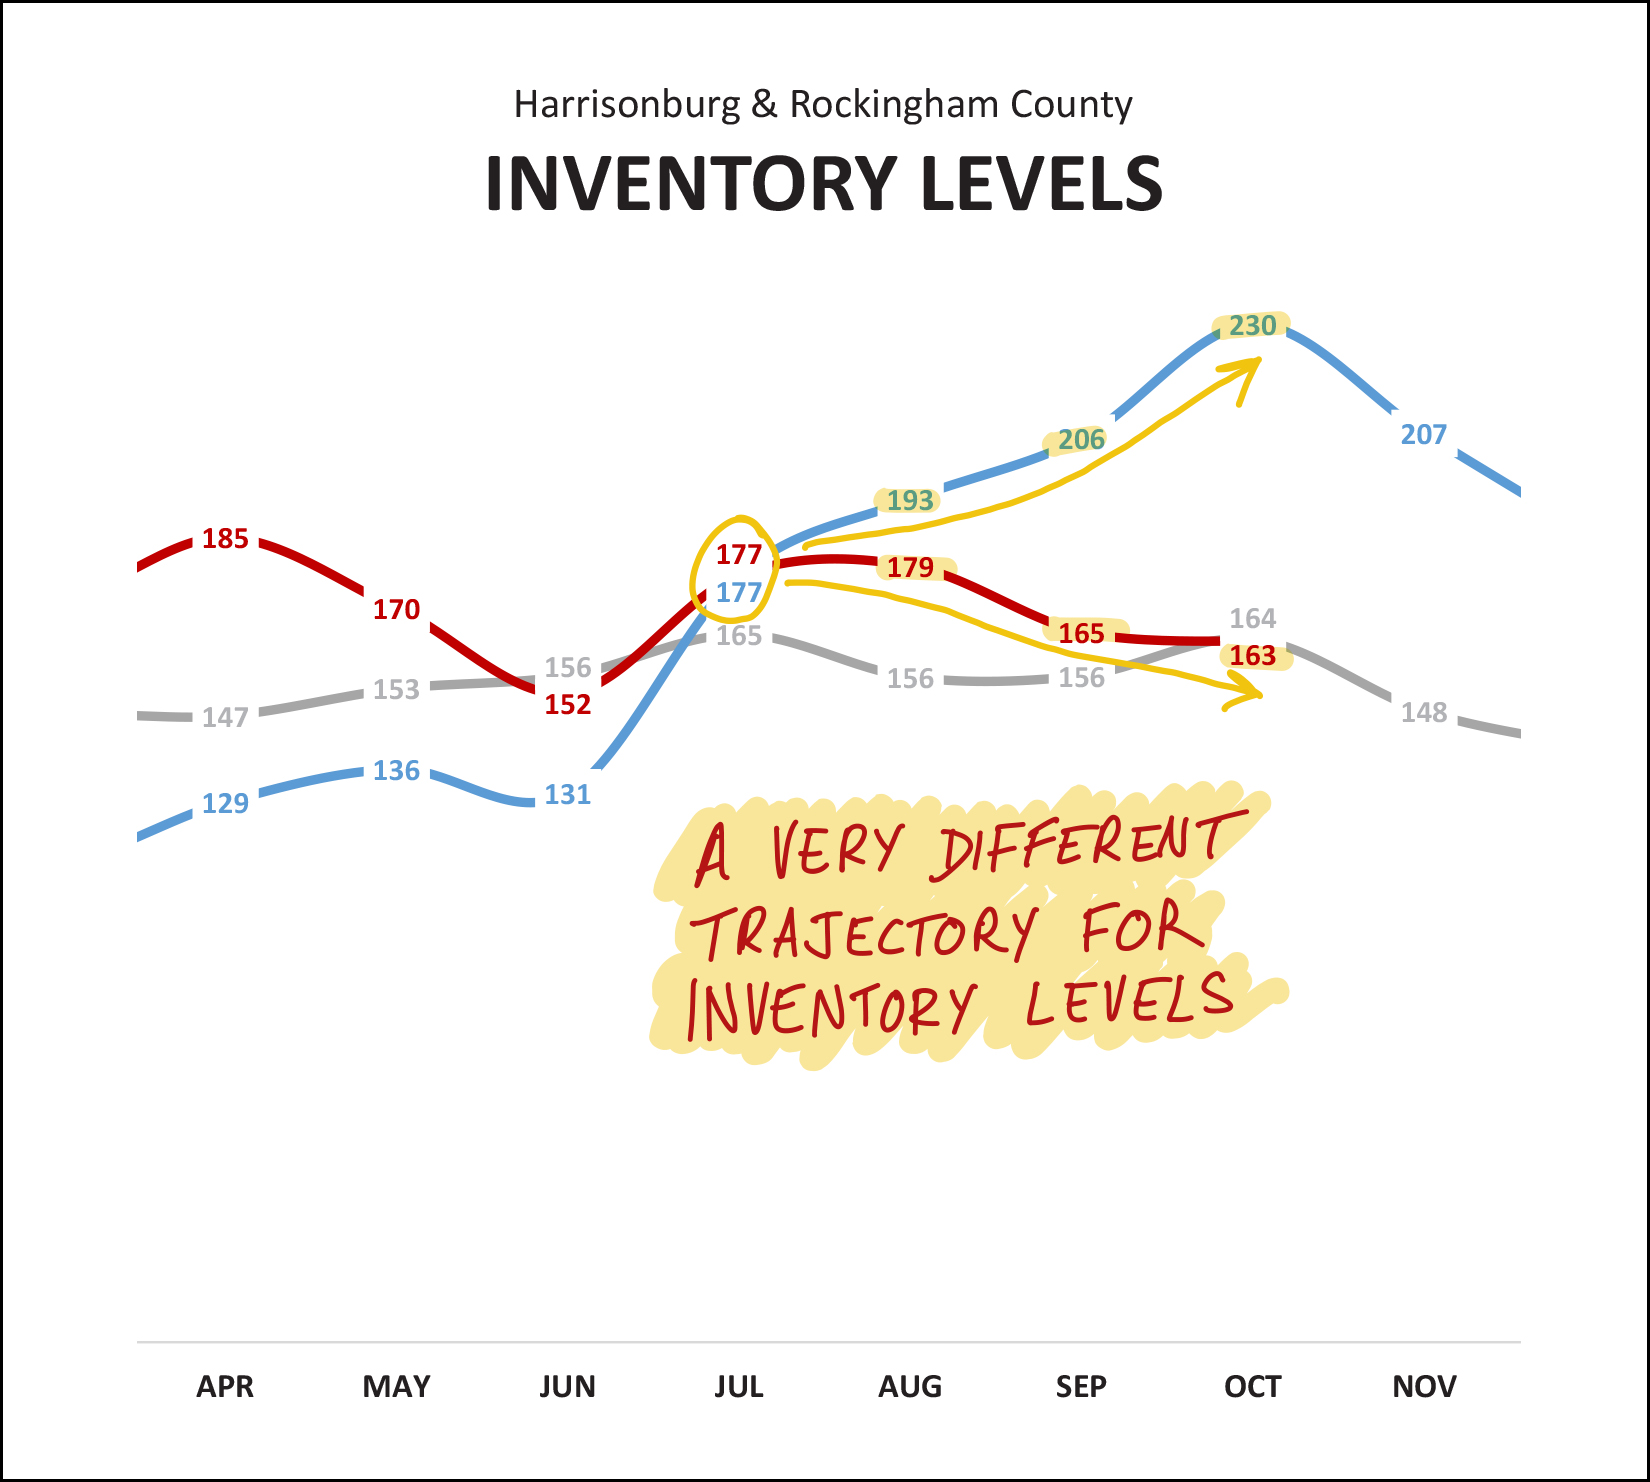 Look at the difference in the trajectory of the blue and red lines above. The blue line shows how inventory levels were steadily rising last year between July and October... in contrast to the red line that shows inventory levels mostly decreasing this year between July and October. Now in November, we see far fewer (163) homes for sale than at the same time last year when 230 homes were listed for sale and not yet under contract. A thread that runs through all of these charts are graphs is change in mortgage interest rates over time which is what we'll examine next... 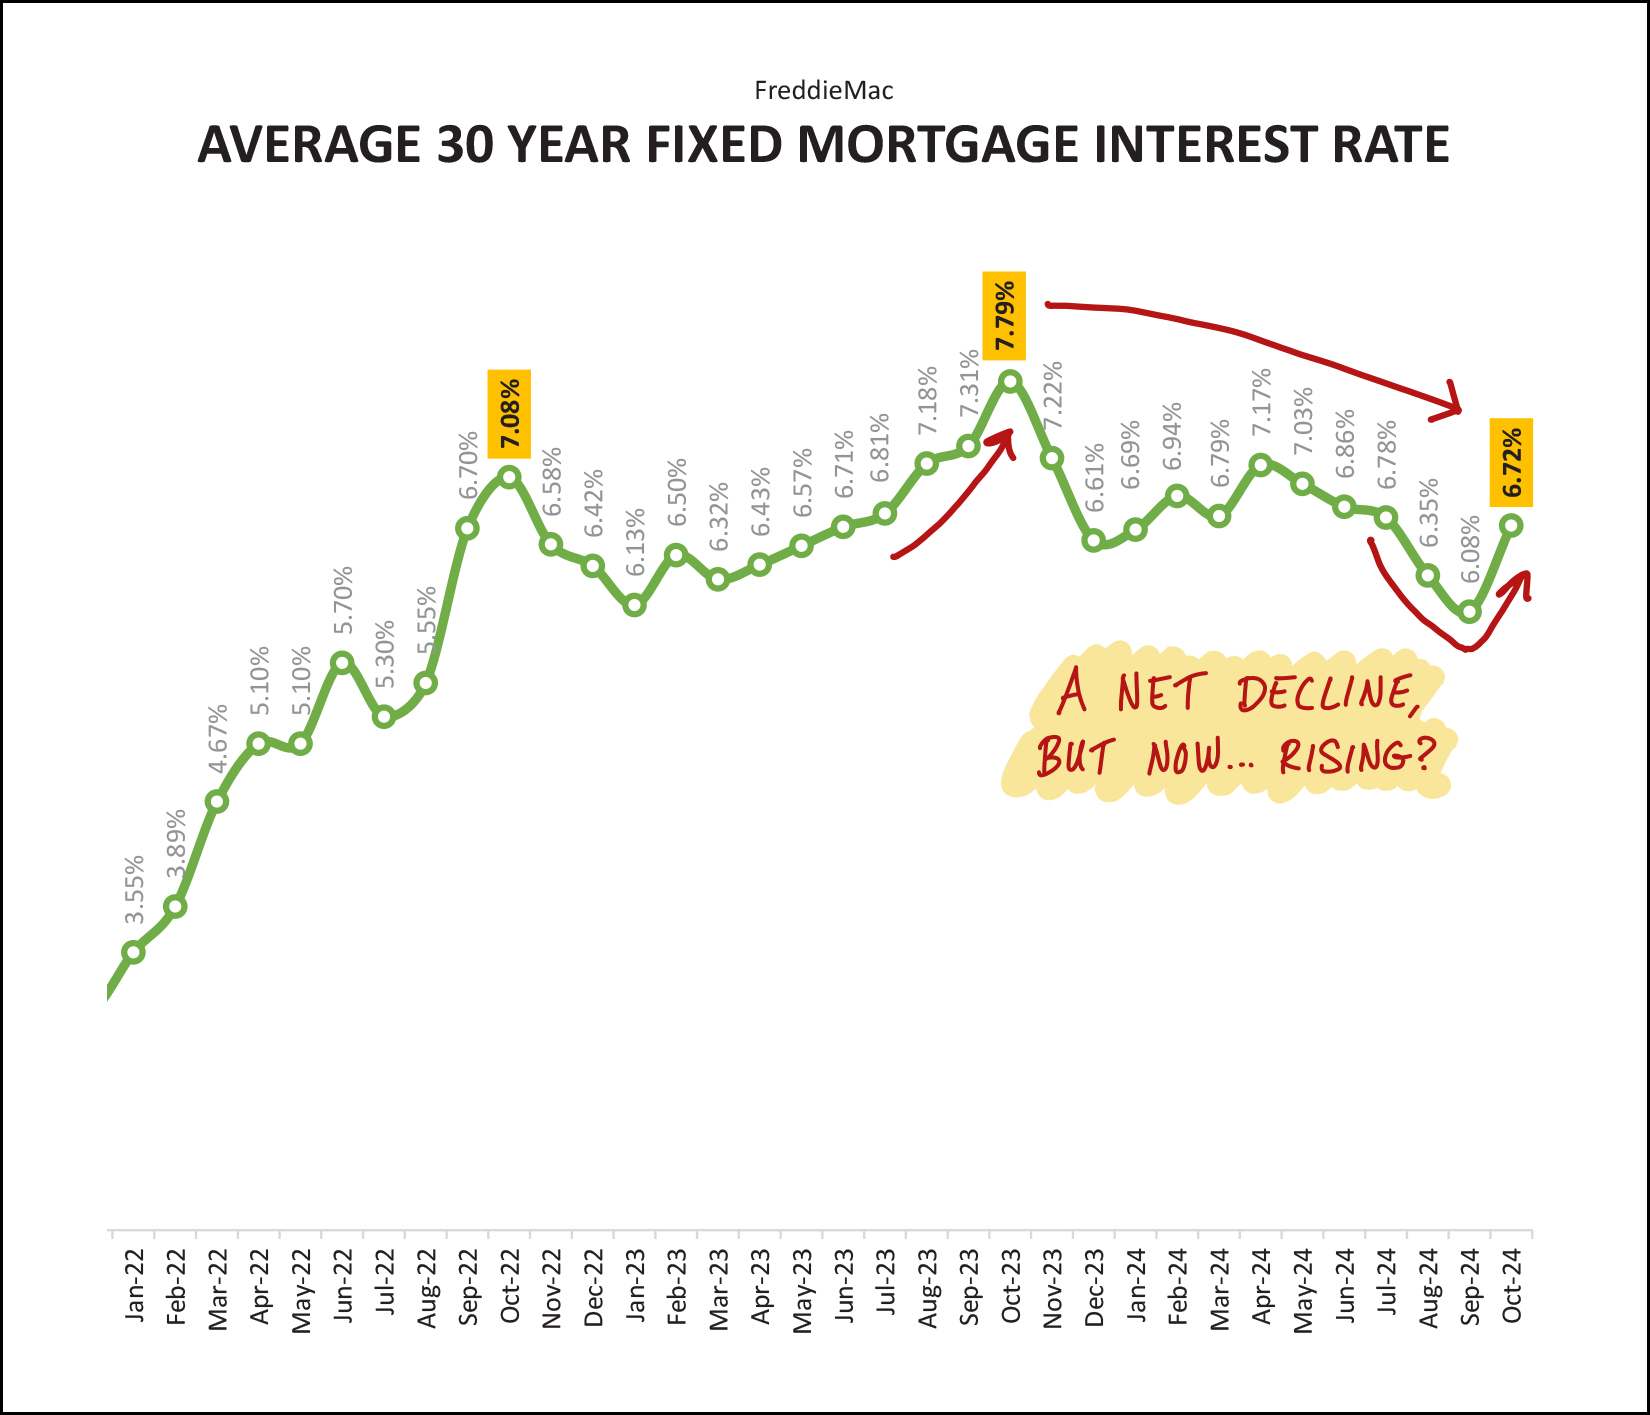 Lots of arrows on this graph -- sorry, not sorry. A year ago we were seeing mortgage interest rates rise as we progressed from August (6.81%) to November (7.79%). We have seen an overall decline in rates over the past year (7.79% to 6.72%) but over the past month we have actually seen them start to increase a bit, rising from 6.08% at the end of September up to 6.72% at the end of October. Mortgage interest rates significantly impact the cost of housing and have played an oversized role in the the housing market (locally and beyond) over the past few years due to how quickly they have increased. So, if you've made it thus far, thanks for reading and for educating yourself on the state of our local housing market. The general, recent, local, trends I am seeing in our local market include:
If you will be buying or selling a home in the next three to six months, we should talk sooner rather than later about your hopes, goals, dreams and the best timing for your big move. Even if you don't know if you really will buy... or if you really will sell... I'm still happy to connect with you just the same to discuss your possible purchase/sale, to discuss the market, or to discuss life in general. Feel free to reach out anytime with questions or to set up a time to meet. You can contact me most easily by phone/text at 540-578-0102 or by email here. Until we chat next, I hope you have a wonderful Thanksgiving celebration and are able to enjoy bountiful, relaxing, refreshing and fulfilling time with your family, friends and other special people in your life. If you're running in the Rocktown Turkey Trot, I'll see you on Thanksgiving morning in downtown Harrisonburg! :-) Gobble, Gobble! | |
Contract Activity Increasing, Inventory Levels Decreasing, In Harrisonburg And Rockingham County |
|
 Happy Crisp, Cool, October Wednesday To You! This is a fantastic time of year... one of my favorite times of the year... we'll often have both pleasantly cool and pleasantly warm temperatures in the same day... the leaves are changing colors... I get to have a ton of fun coaching middle school volleyball and watching Emily's volleyball matches... cheering for the Dukes at plenty of JMU football games... not to mention my birthday later this month. ;-) And, let's not forget another October highlight... the Harrisonburg Half Marathon... 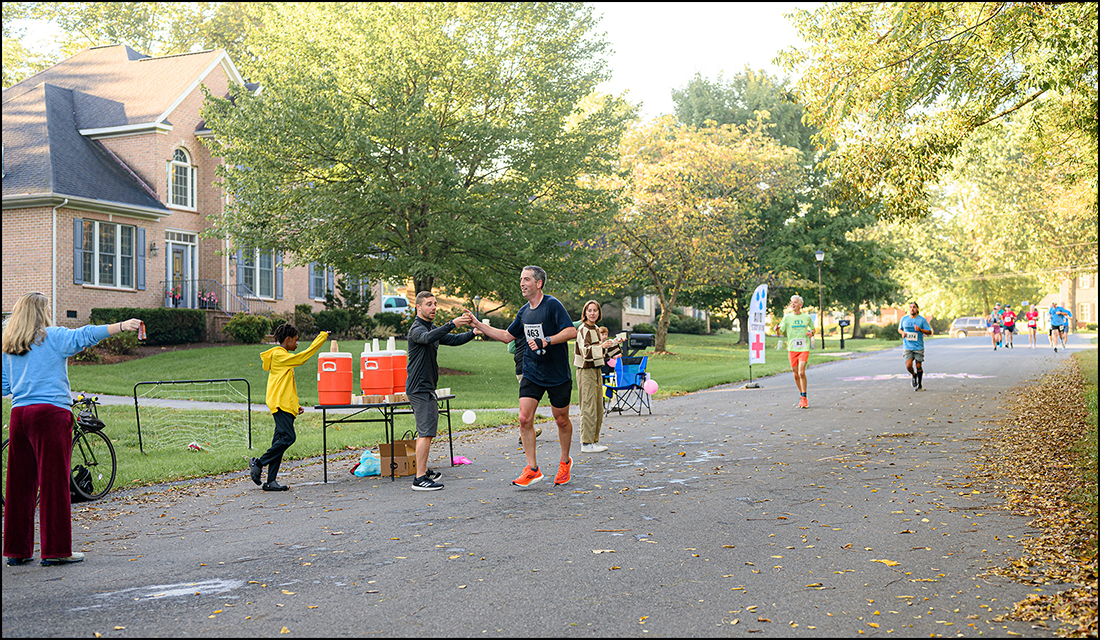 "Funny" story... last year, I ran in the Harrisonburg Half Marathon after having been sick for a few days... and only made it through the first 10 miles before worrying all those around me by semi-collapsing. Oops! This year, at least a dozen people shouted out to me as I ran - "hey Scott, don't forget to finish this year!" - real funny guys, real funny. But yes, I did finish this year. Maybe I won't get the same jokes next year? Let's hope. :-) Before we get into the latest trends in our local housing market, each month I offer a giveaway for readers of my market report. This month I'm giving away a seasonally appropriate $50 gift card to Showalter's Orchard in Timberville. Let this be a reminder to you to go pick some apples, enjoy some apple cider donuts, and get into the Fall season! Click here to enter to win the gift card. And now, on to the real estate data. Charts first, graphs second. 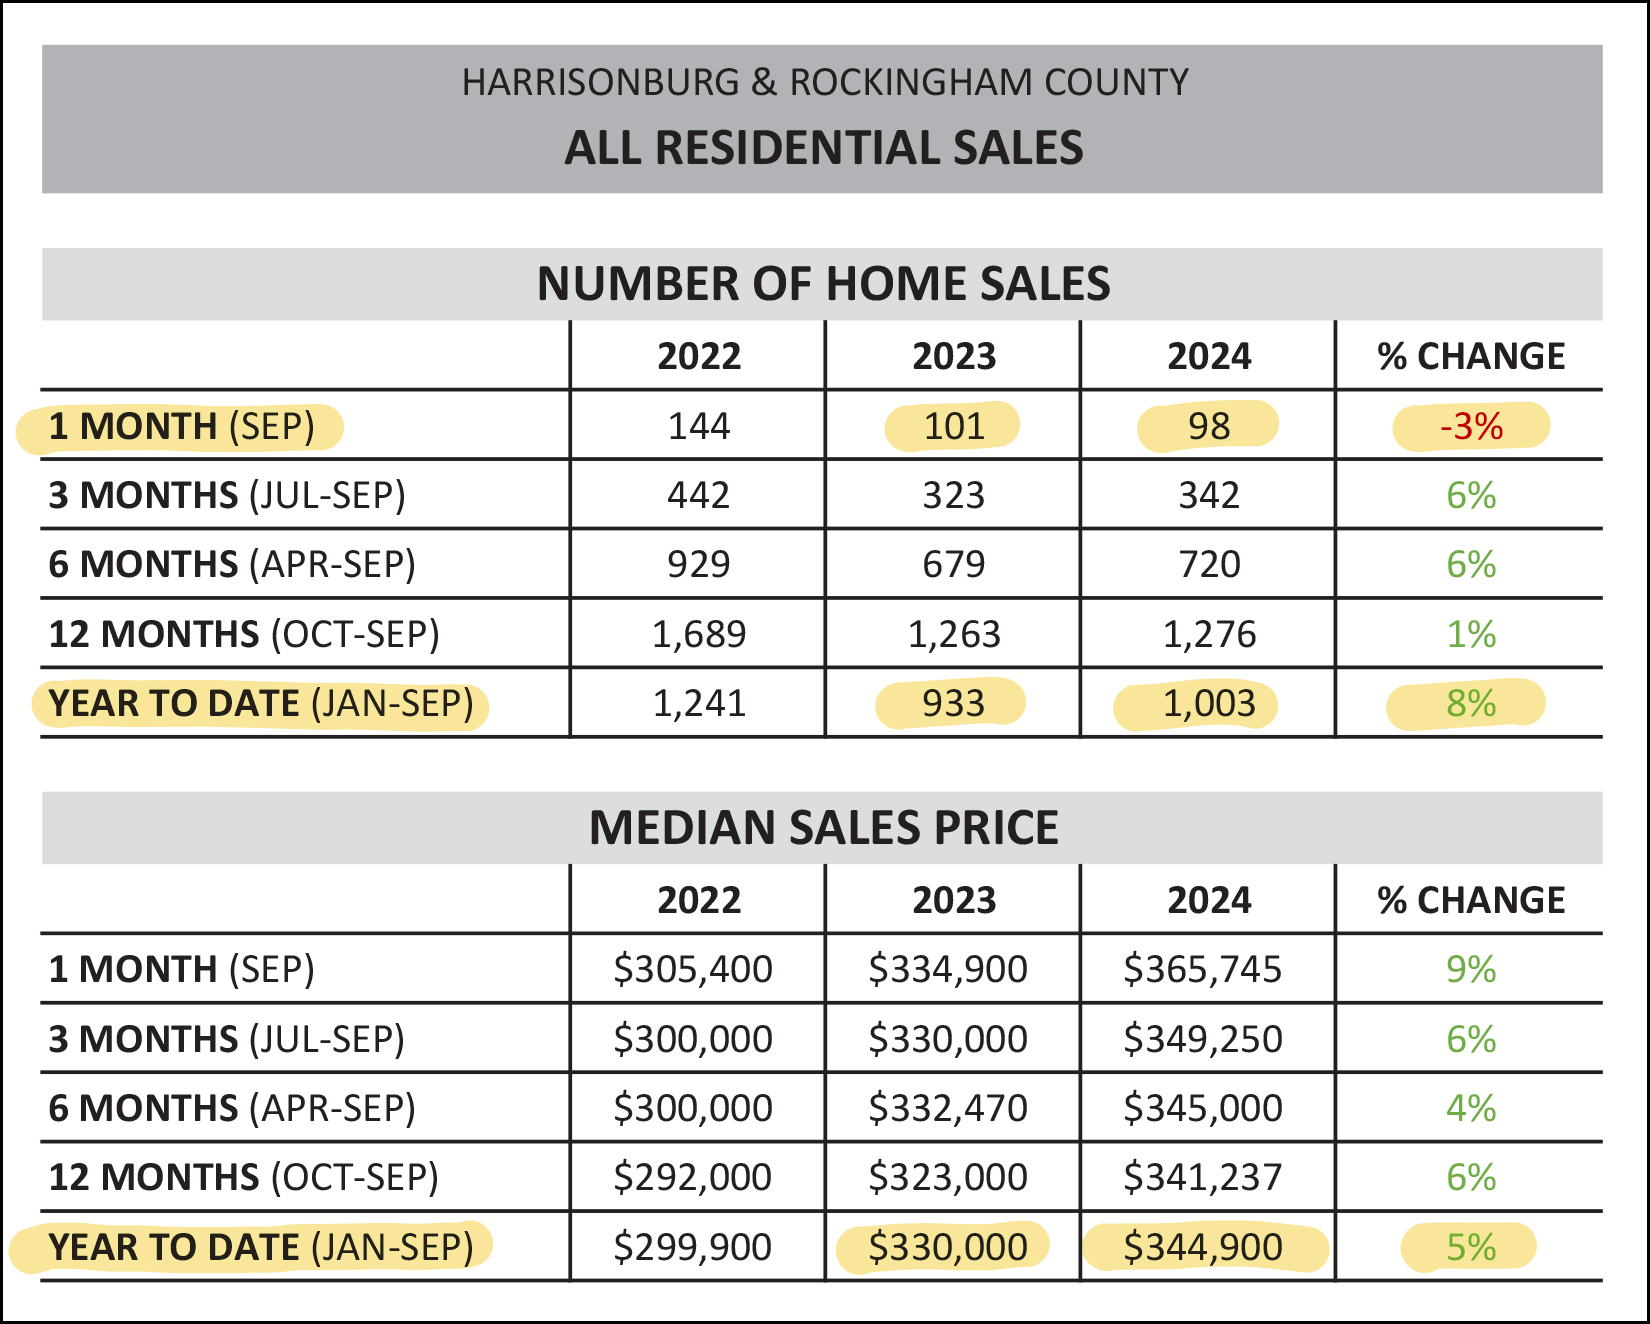 Above you'll find a snapshot of the overall market in Harrisonburg and Rockingham County, showing... [1] Despite a small (3%) drop in home sales in September (101 down to 98) we have seen an 8% increase in home sales when comparing the first nine months of this year to the first nine months of last year. Home sales are on the rise. [2] The median sales price of those homes that sold in 2024 has been "only" 5% higher than it was a year ago. I say "only" because we have seen multiple years of 10% increases in the median sales price, so this 5% increase is a smaller increase than we have otherwise seen in recent years. Interestingly, we see slightly different trends if we focus in on only detached homes... excluding townhomes, duplexes and condos... 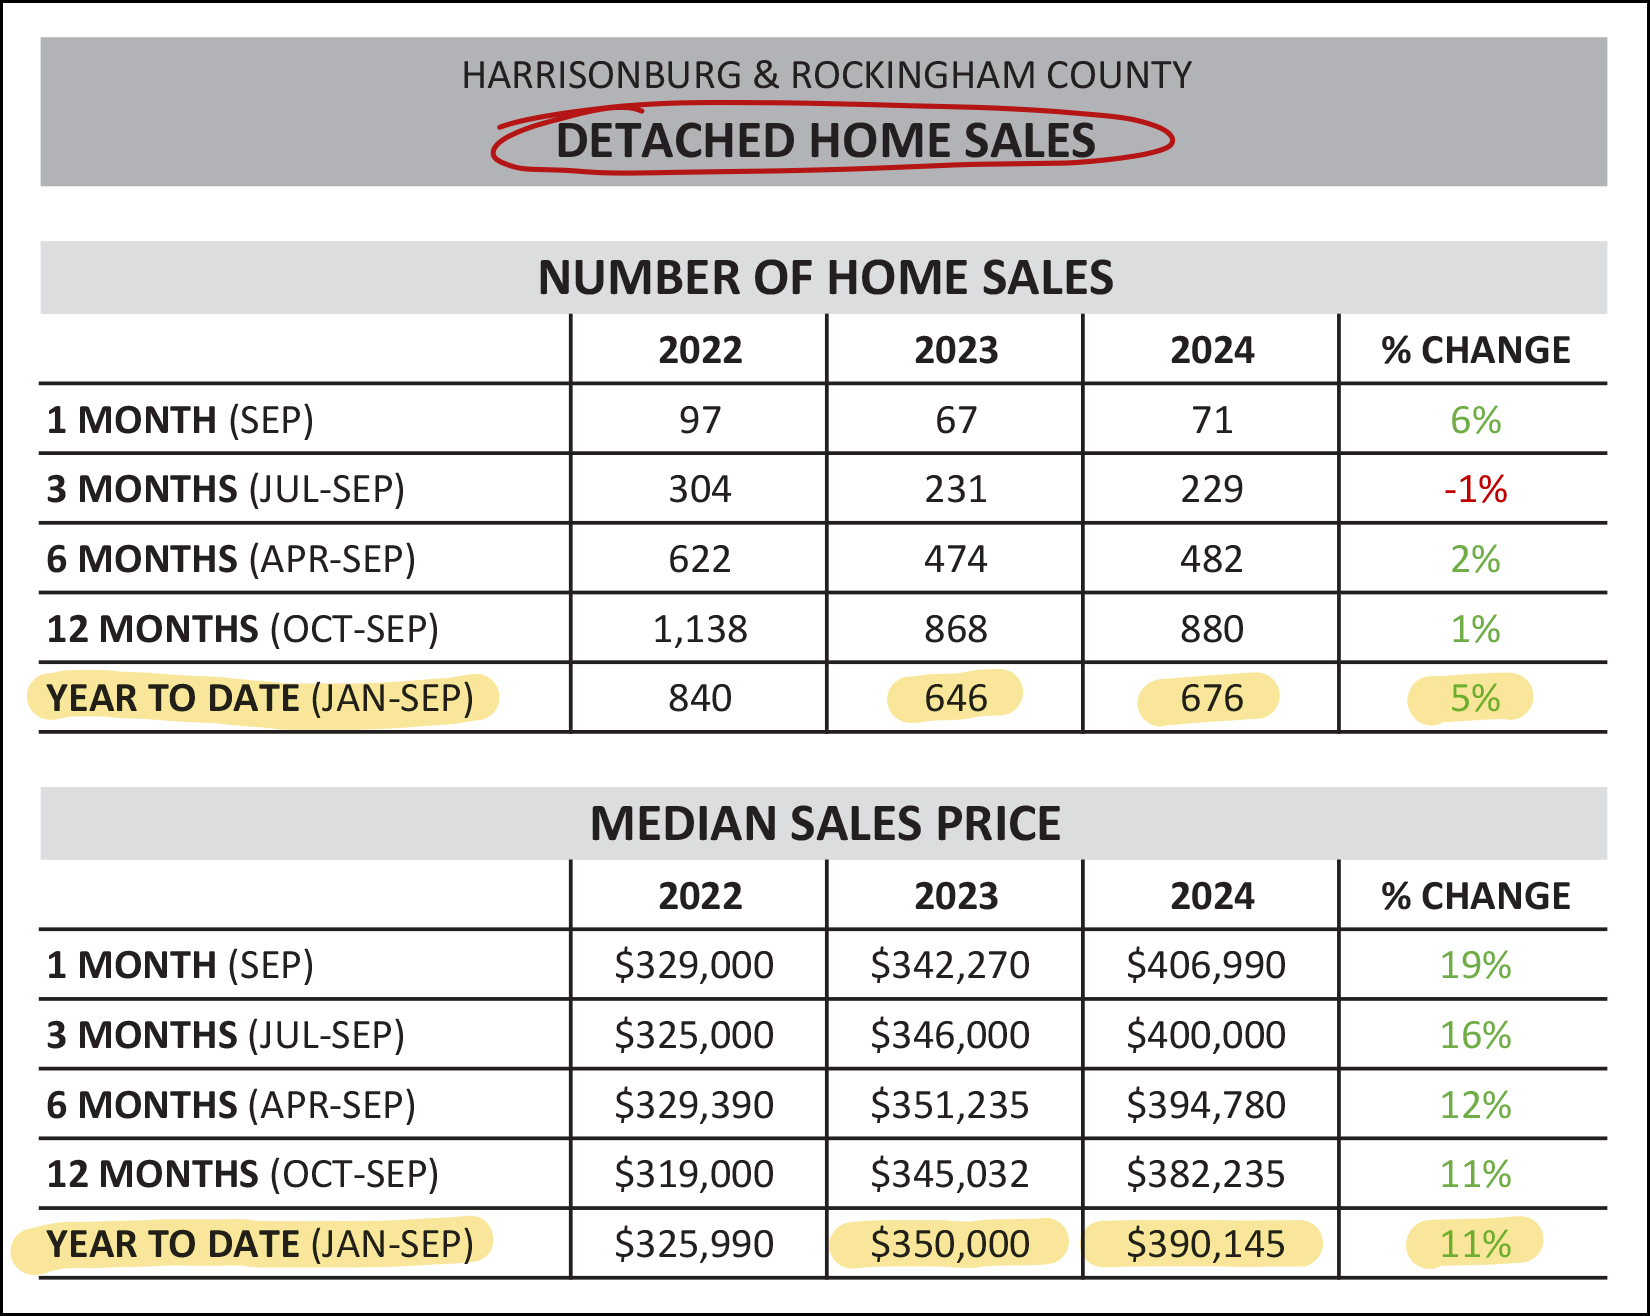 [1] Compared to the market-wise 8% increase in home sales in 2024, we have only seen a 5% increase in detached home sales. We're not seeing the number of detached homes selling bounce back quite as much as we are seeing that in the overall market. [2] The detached home sales market is outperforming the overall market when it comes to sales prices. The median sales price of a detached home has increased 11% (from $350K to $390K) over the past year as compared to the 5% increase seen in the overall market. Thus, you likely won't be surprised to see the opposite trends in the attached home sales report which includes townhomes, duplexes and condos... 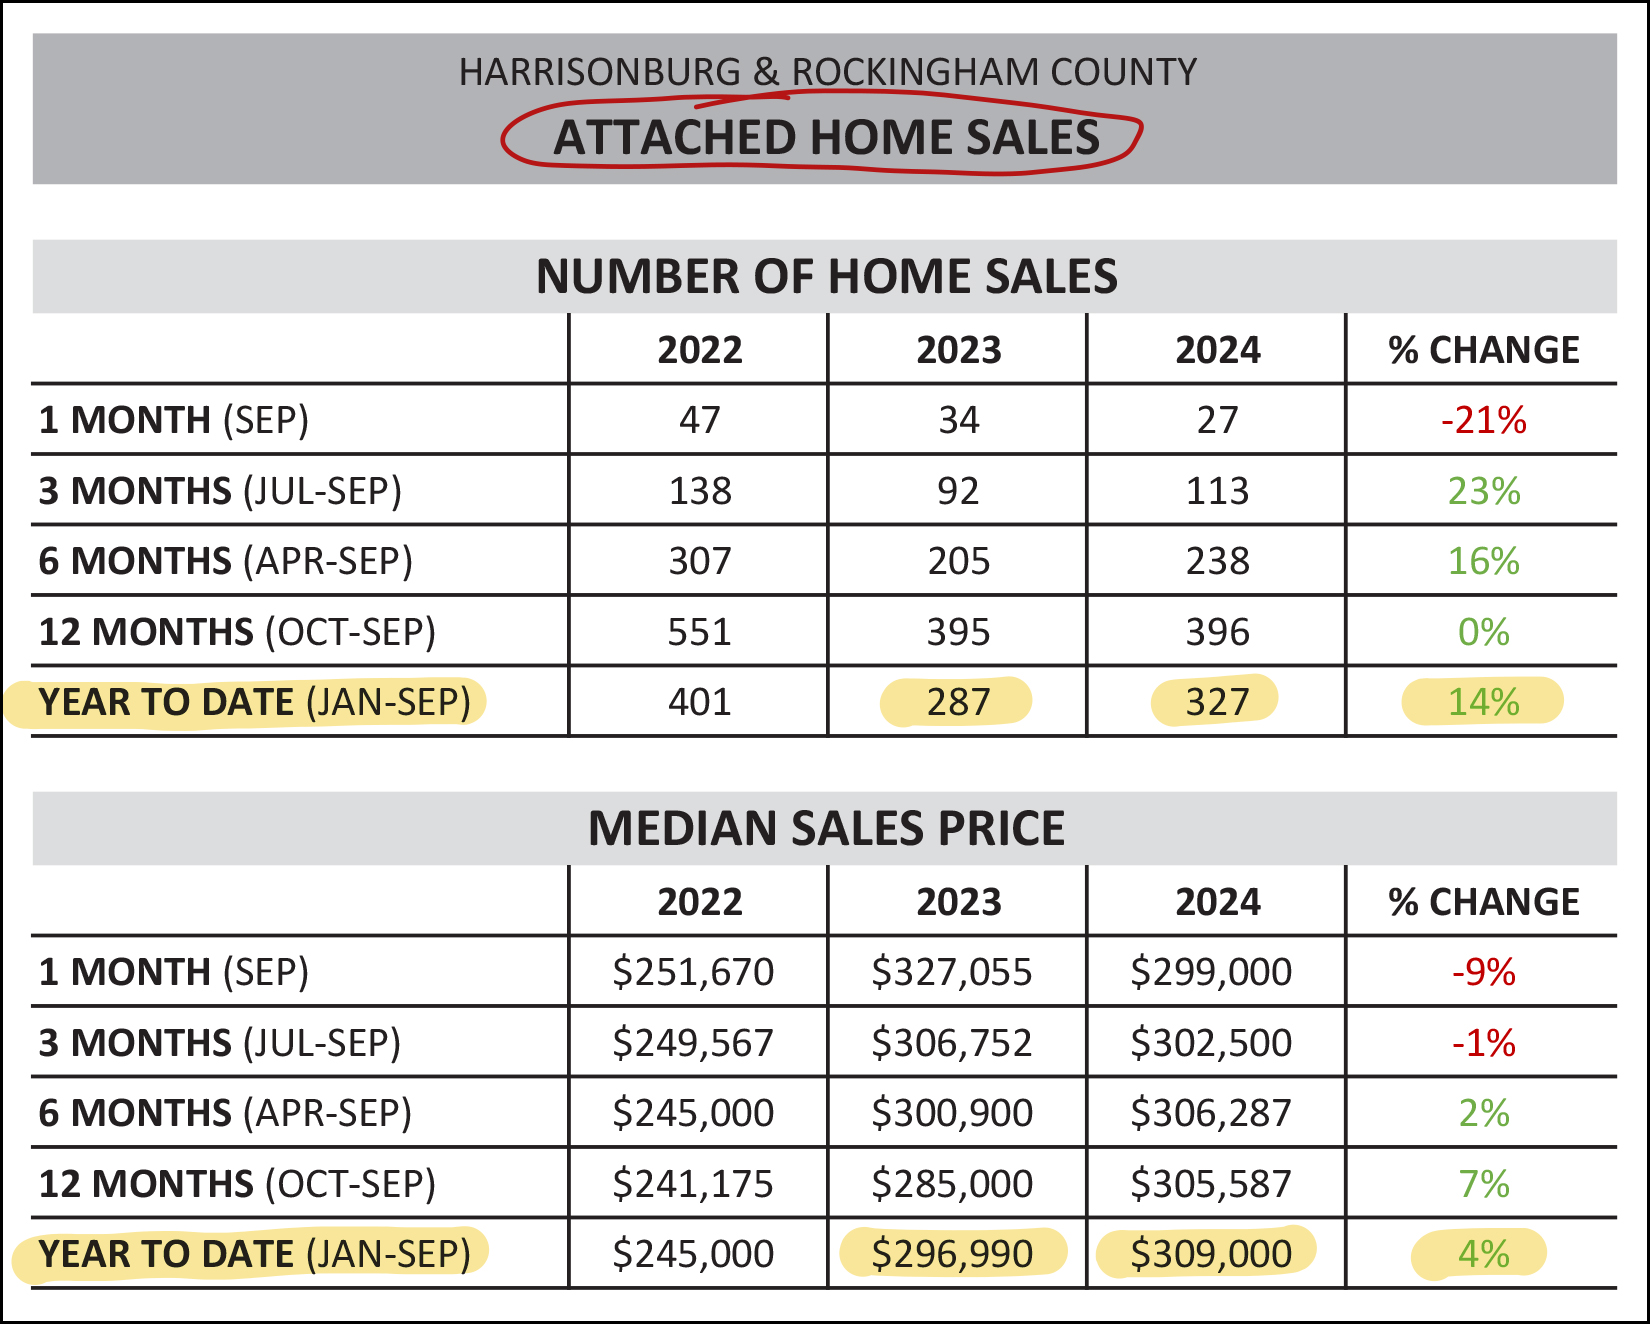 When looking just at attached home sales we find... [1] There has been a much larger increase in the number of these sales that are taking place with a 14% year to date increase, compared to the 8% increase in the overall market. [2] The increase in median sales price has been a smidge smaller (4%) than in the overall market (5%) thus far in 2024. Next, let's take a quick peek at one smaller segment of the local market... the City of Harrisonburg... 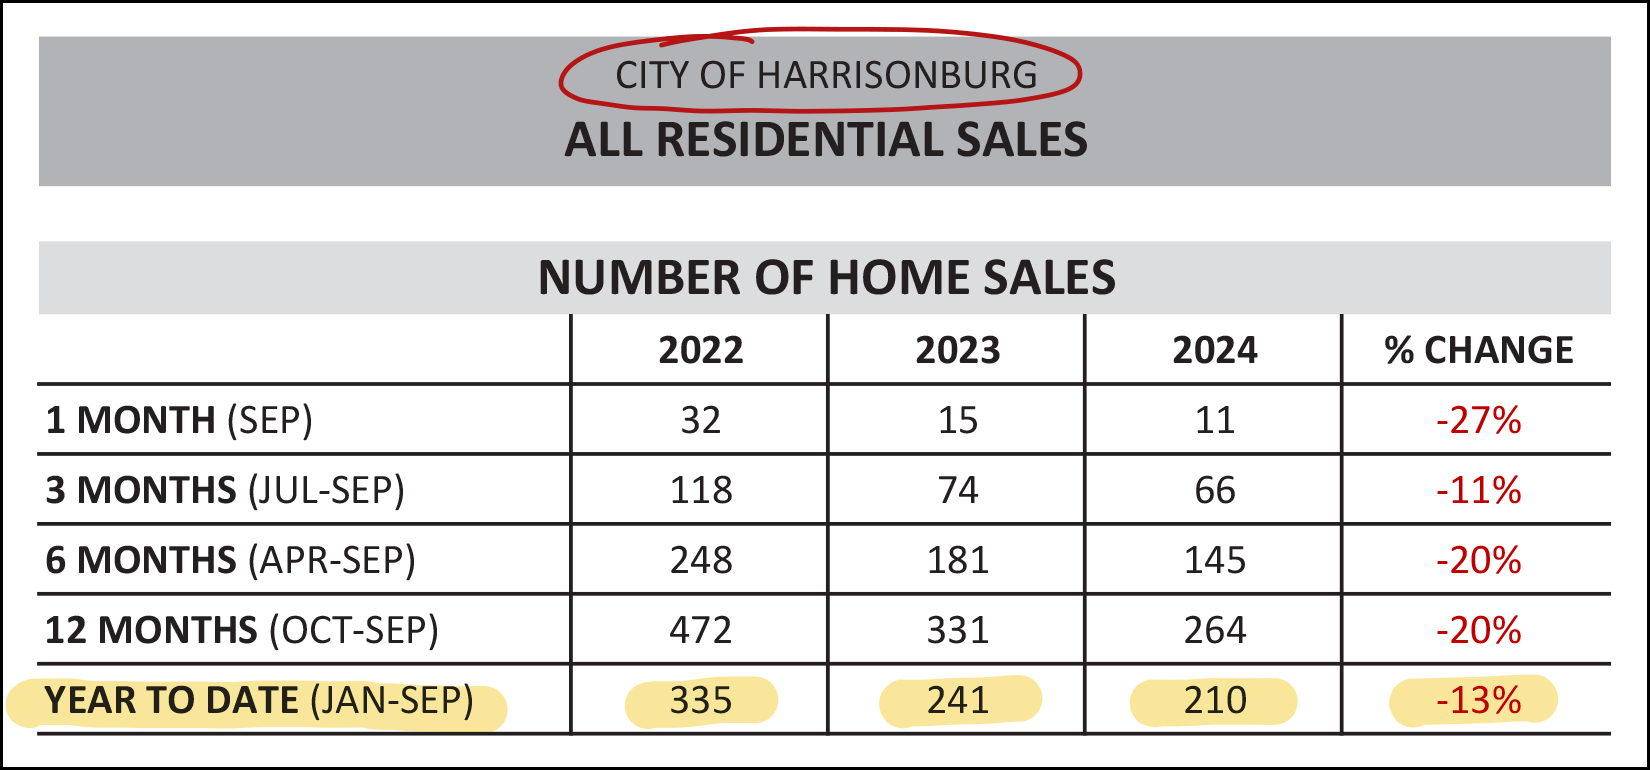 If you're looking to buy a home in the City of Harrisonburg, you likely won't have that many options. After seeing 335 home sales in the first nine months of 2022, that dropped to 241 sales last year, and has now fallen to 210 home sales this year. These declines in home sales are not a result of fewer buyers wanting to buy -- it is almost entirely (or entirely) a result of fewer sellers being willing to sell -- and little to no new home construction taking place in the City. In contrast, in Rockingham County... 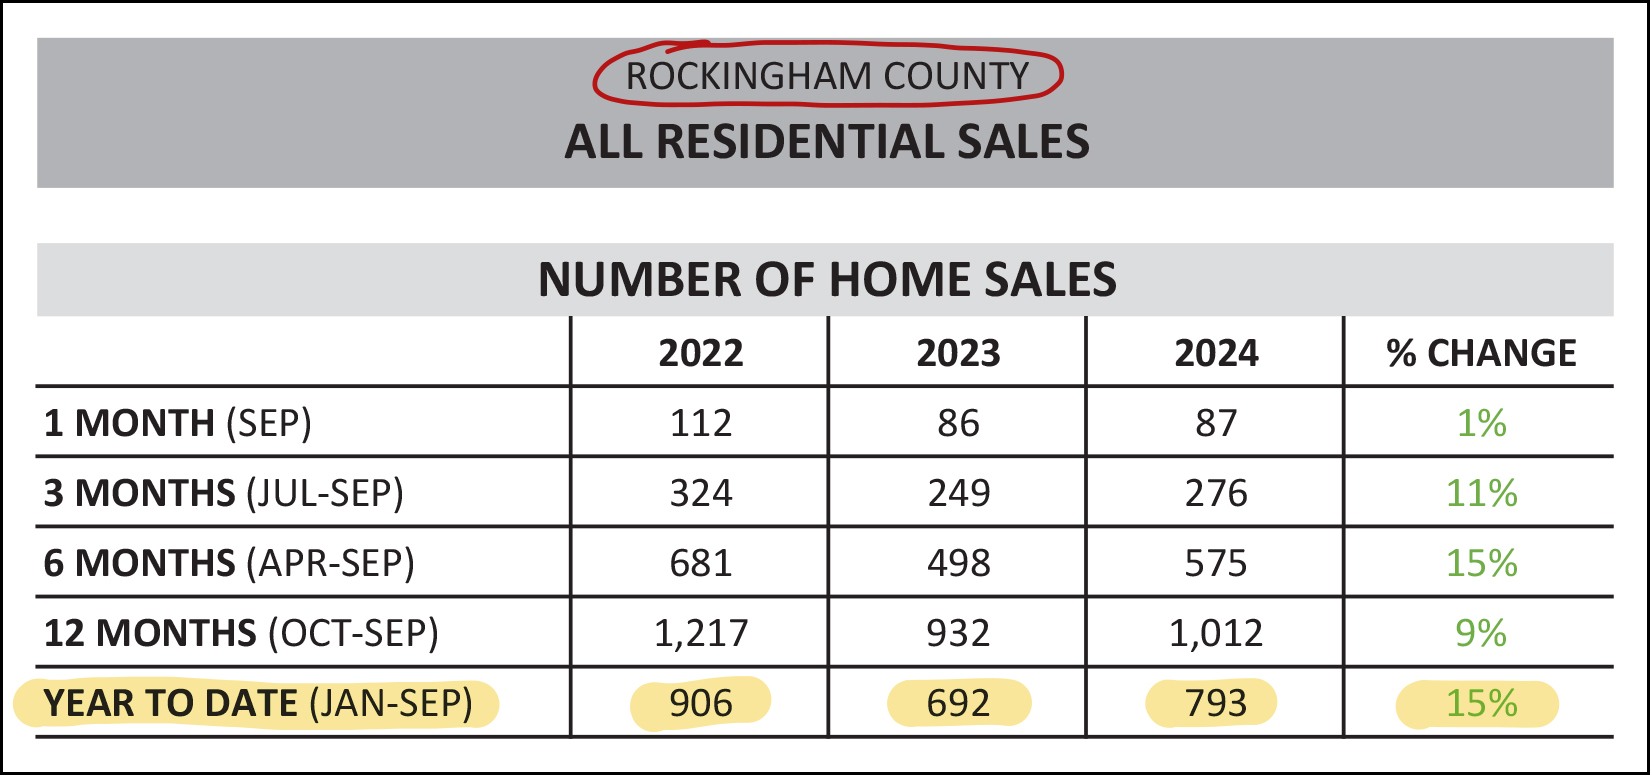 Home sales are booming (+15% YTD) in Rockingham County, due in large part to new home communities springing up almost entirely in the County rather than in the City. While we aren't back to 2022 sales levels, we have seen a solid increase in County home sales activity in 2024 as compared to 2023. Finally, a synopsis of those new home sales that are a significant part of the local housing market in a time when many homeowners do not want to sell their homes... 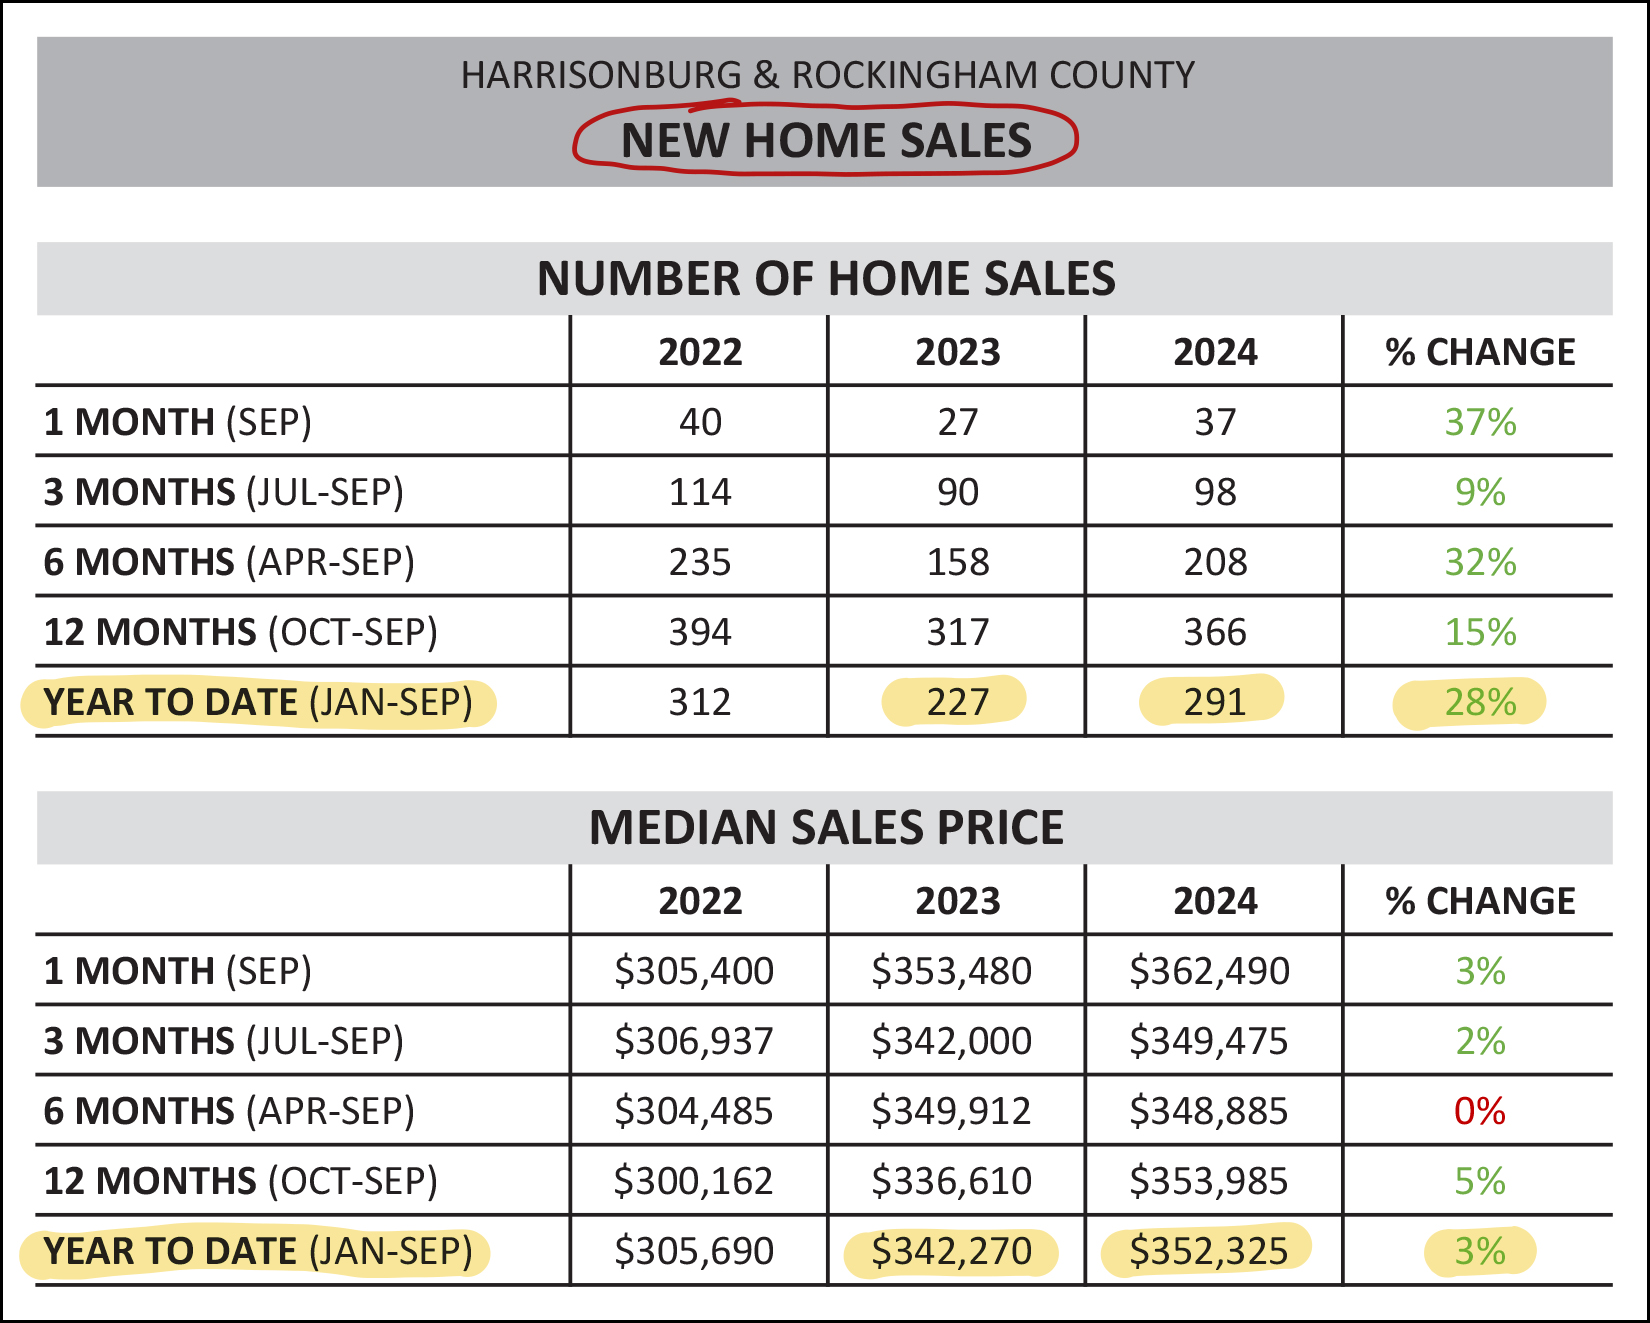 Two things to note here... [1] While the overall market has seen only an 8% increase in the number of homes selling in the City and County, we have seen a (much larger) 28% increase in the number of new homes selling this year compared to last. [2] Despite a 5% increase in the median sales price of the entire market, we are only seeing a 3% increase in the median sales price of new homes. And again, let's not be too surprised by the opposite indicators in the resale market... 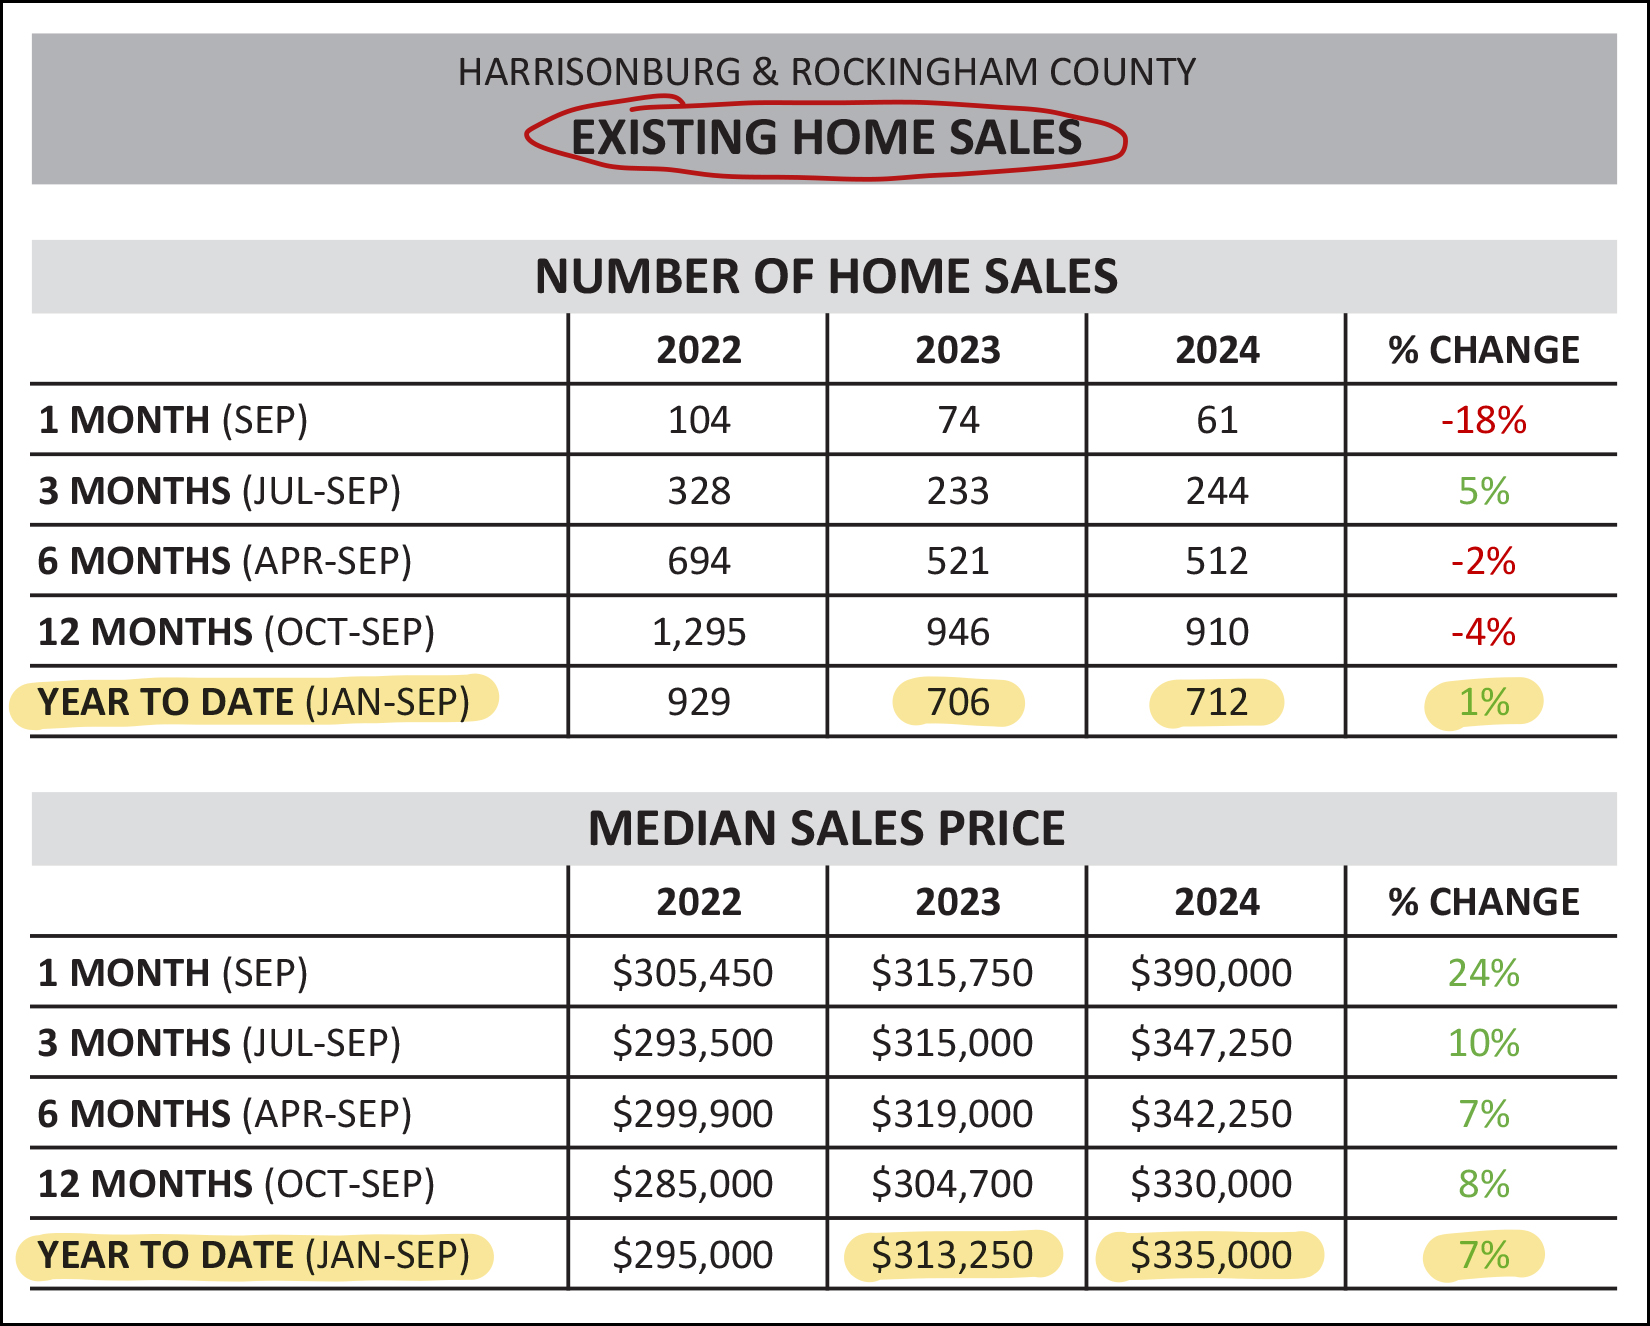 Looking just at resale homes, or existing home sales... [1] There has only been a 1% increase in the number of existing homes selling this year... compared to an 8% increase in the overall market. Thus, that 8% increase in overall home sales is almost entirely due to new homes being built and available for sale. [2] The median sales price of existing homes has risen 7% over the past year, at a slightly higher rate than the overall market where the median sales price has only risen 5%. And now... moving beyond the words, to some graphs... 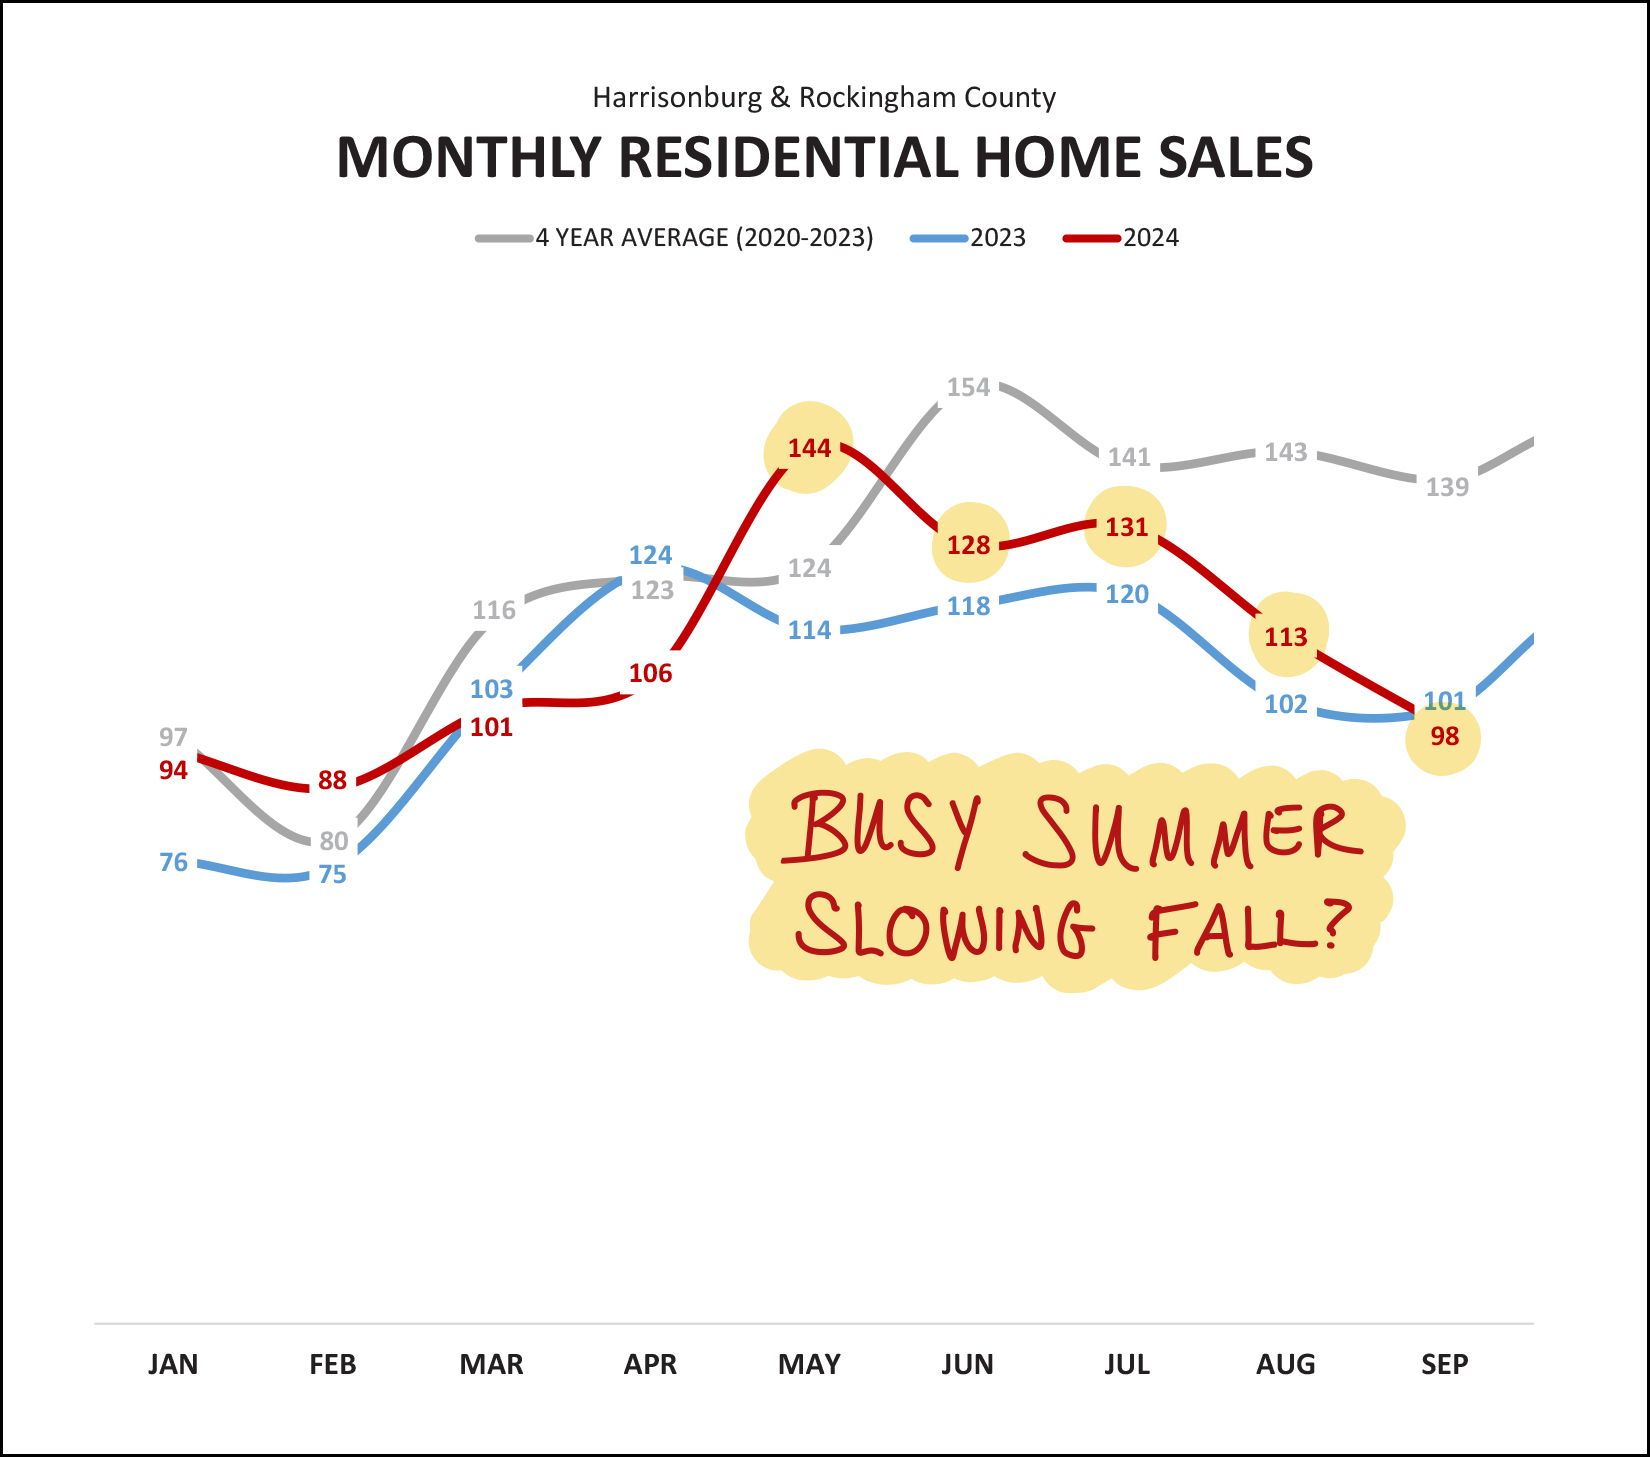 On the graph above, you can see that the months of May (144), June (128), July (131) and August (113) all out performed the same months last year when it came to the number of home sales that went to closing in Harrisonburg and Rockingham County. But... we saw fewer home sales this September (98) than last September (101) so maybe home sales are slowing down a bit? Hold that theory for a few more graphs and we'll see if it is reinforced by recent contract activity. While we're holding that thought, let's see where nine months of home sales have taken us thus far in 2024... 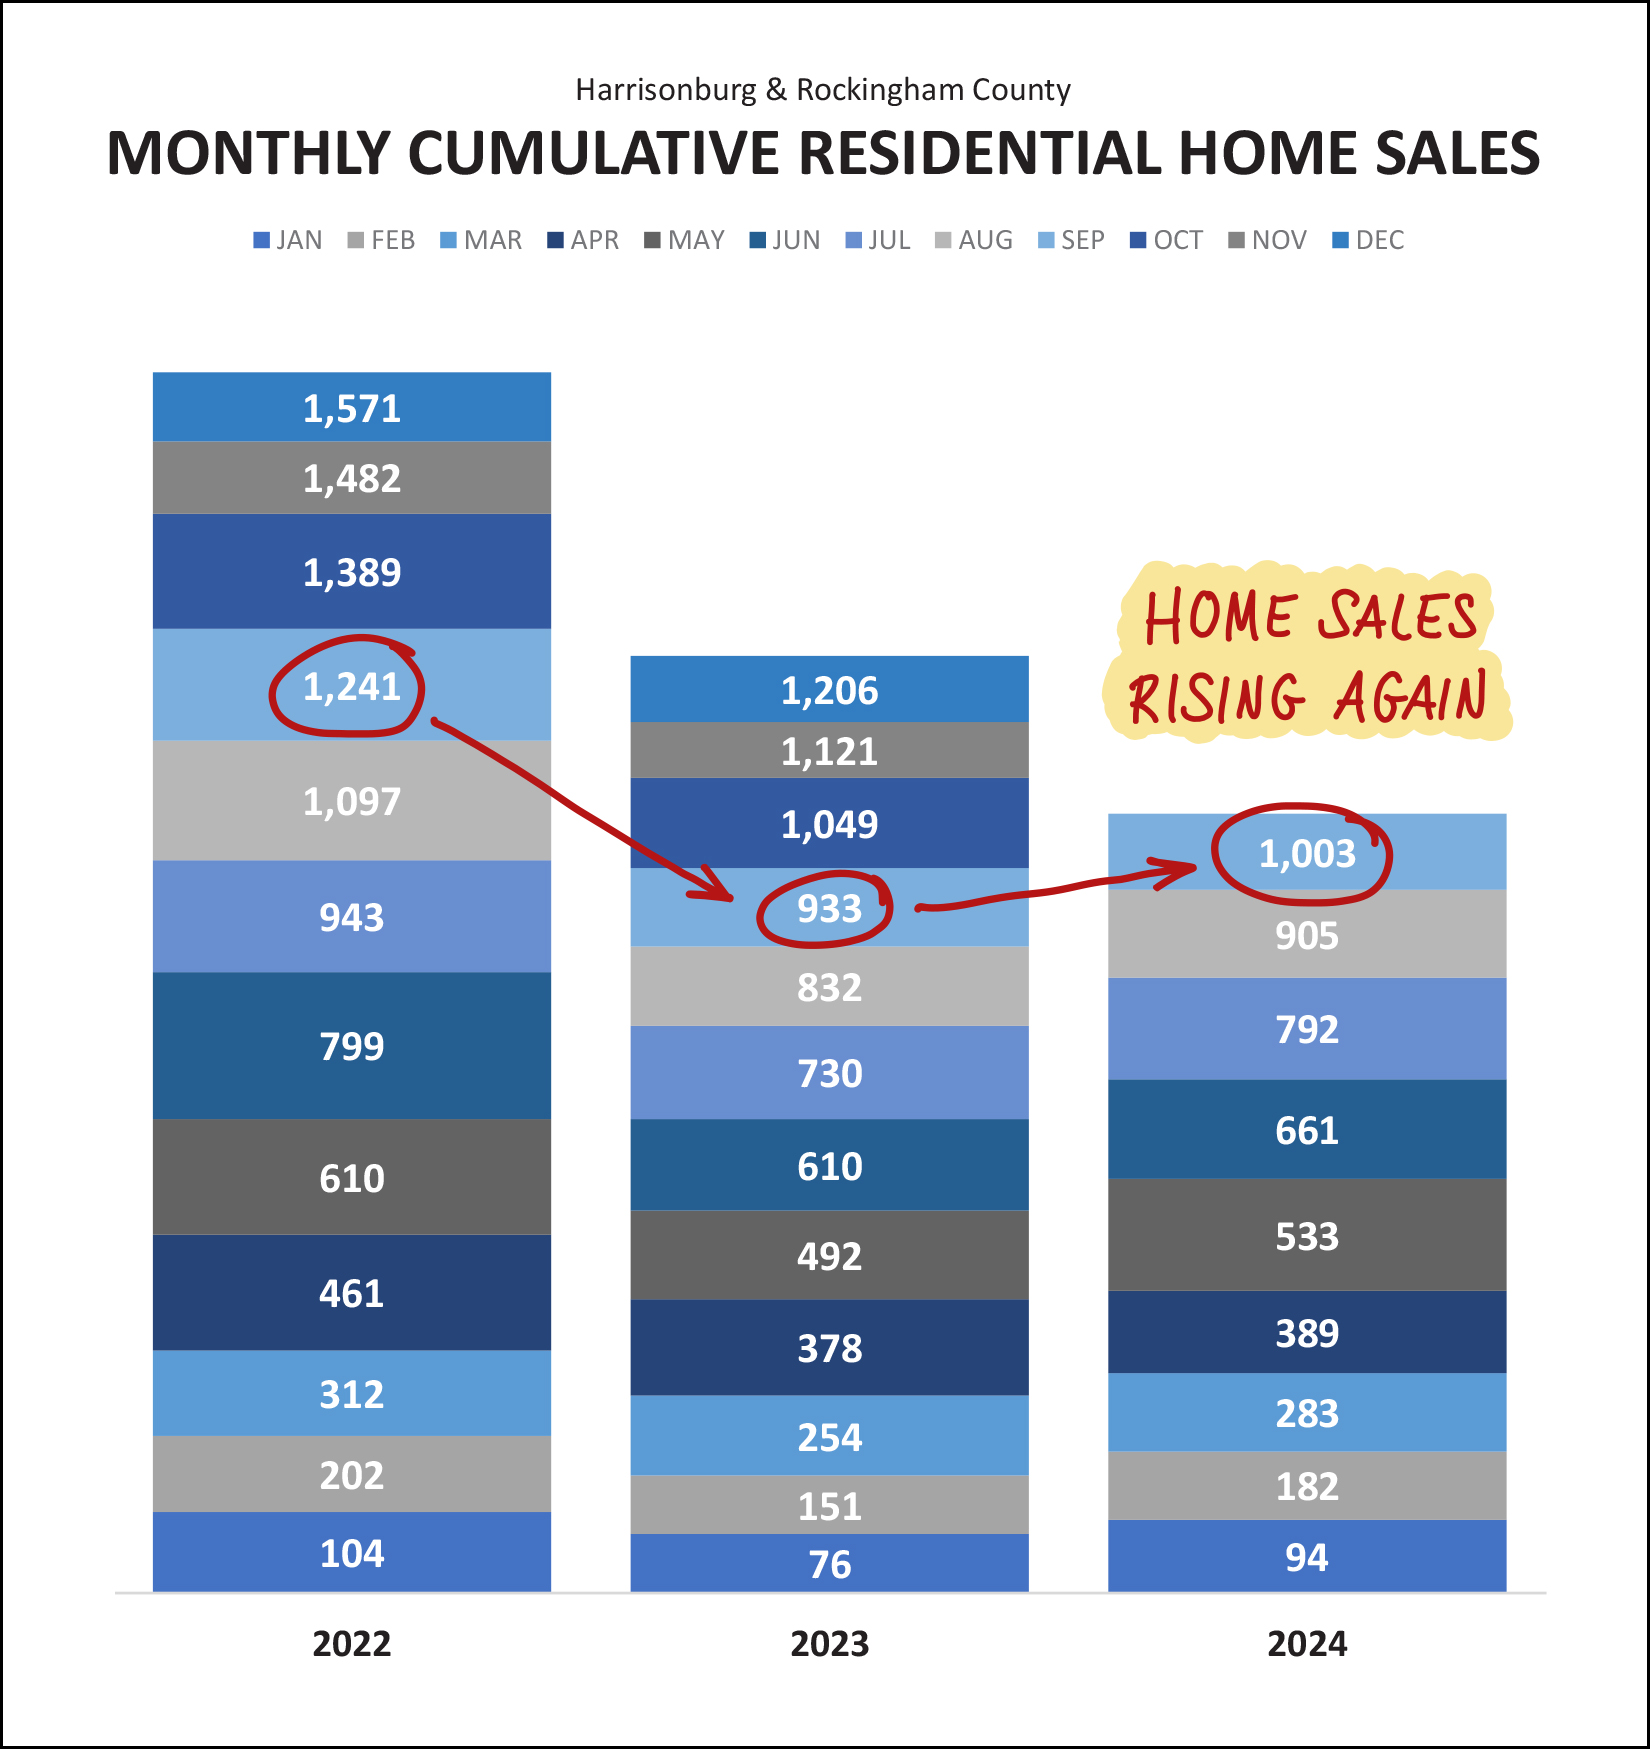 Home sales are on the rise! We've seen 1,003 home sales in the first nine months of last year, which is solidly above where things stood last year (933) though is still well below the number of home sales we were seeing in 2022. At this point it seems very likely that we will finish out 2024 with more home sales than last year (1,206) but we seem very (very) unlikely to rebound back to the 1,571 home sales seen in 2022. And here are those long term, slow moving, trendlines that are important to monitor over time... 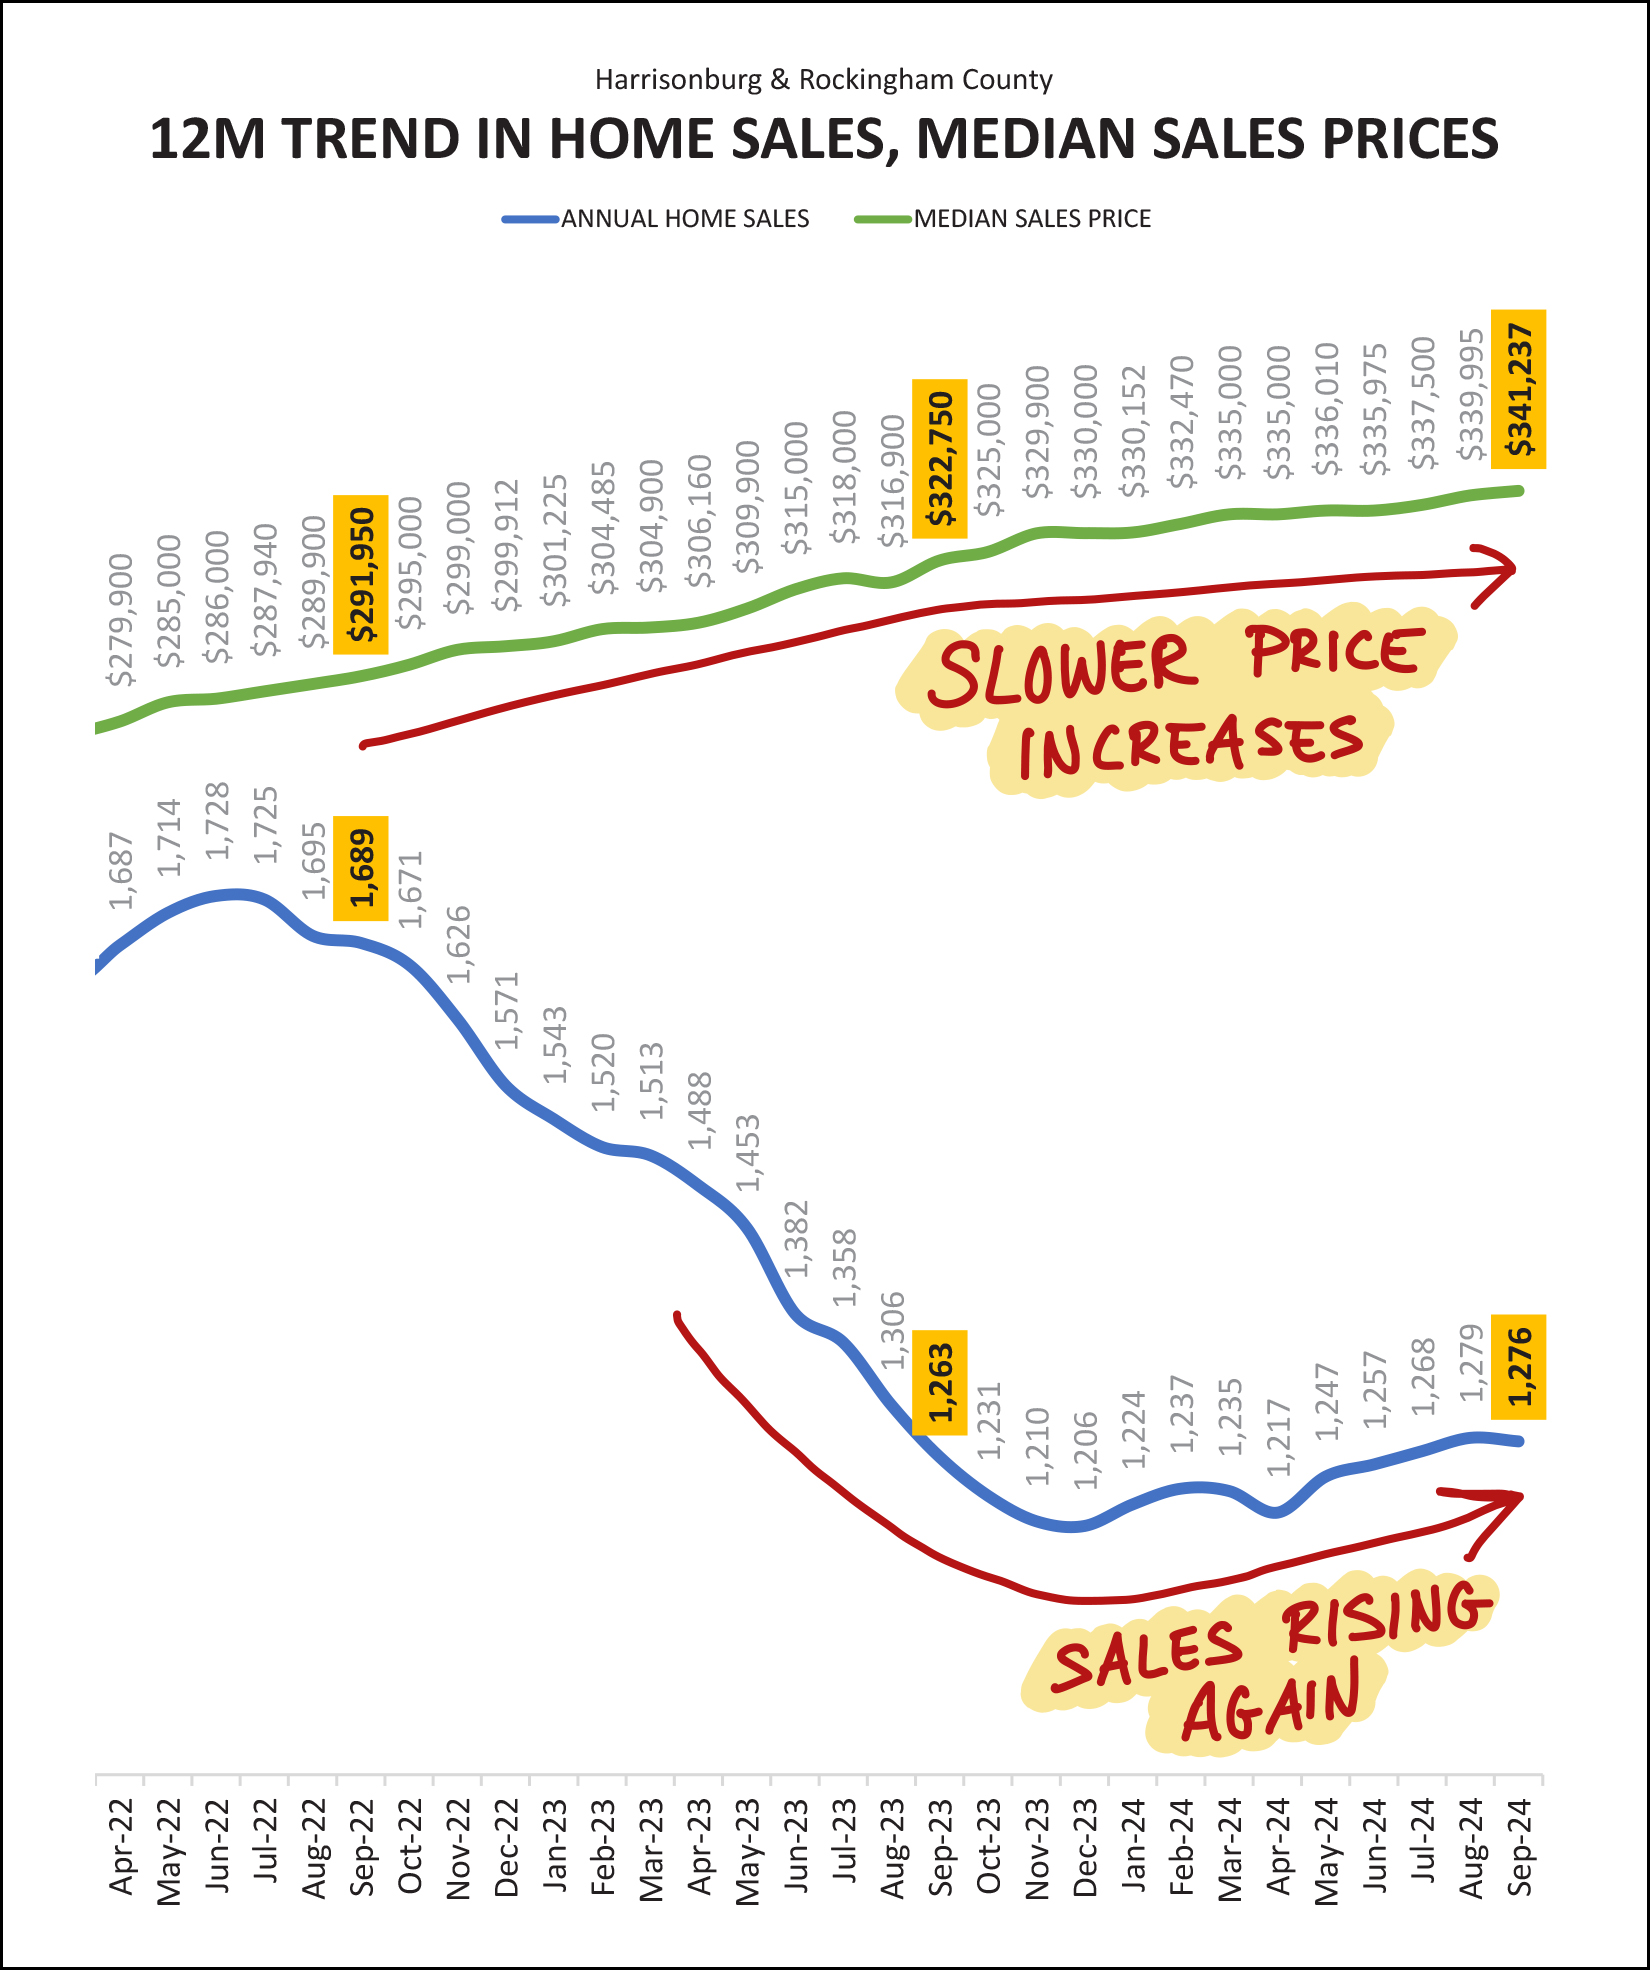 The green line above shows that while the median sales price is still steadily increasing in Harrisonburg and Rockingham County... the pace at which is increasing is... slowing. After a few years of 10% annual increase in the median sales price, we seem likely to only see a 5% annual increase in 2024. But... as shown by the blue line... home sales are rising again. A few graphs from now you'll see that mortgage interest rates hit their 20+ year high in October 2023, and lo and behold, once those rates started drifting back downward again... home sales started to rise again. Now, contract activity. Remembering back a few graphs, we were wondering if a slight decline in September home sales meant that we would see an overall slower Fall sales season. Per this graph, I'm going to say no... 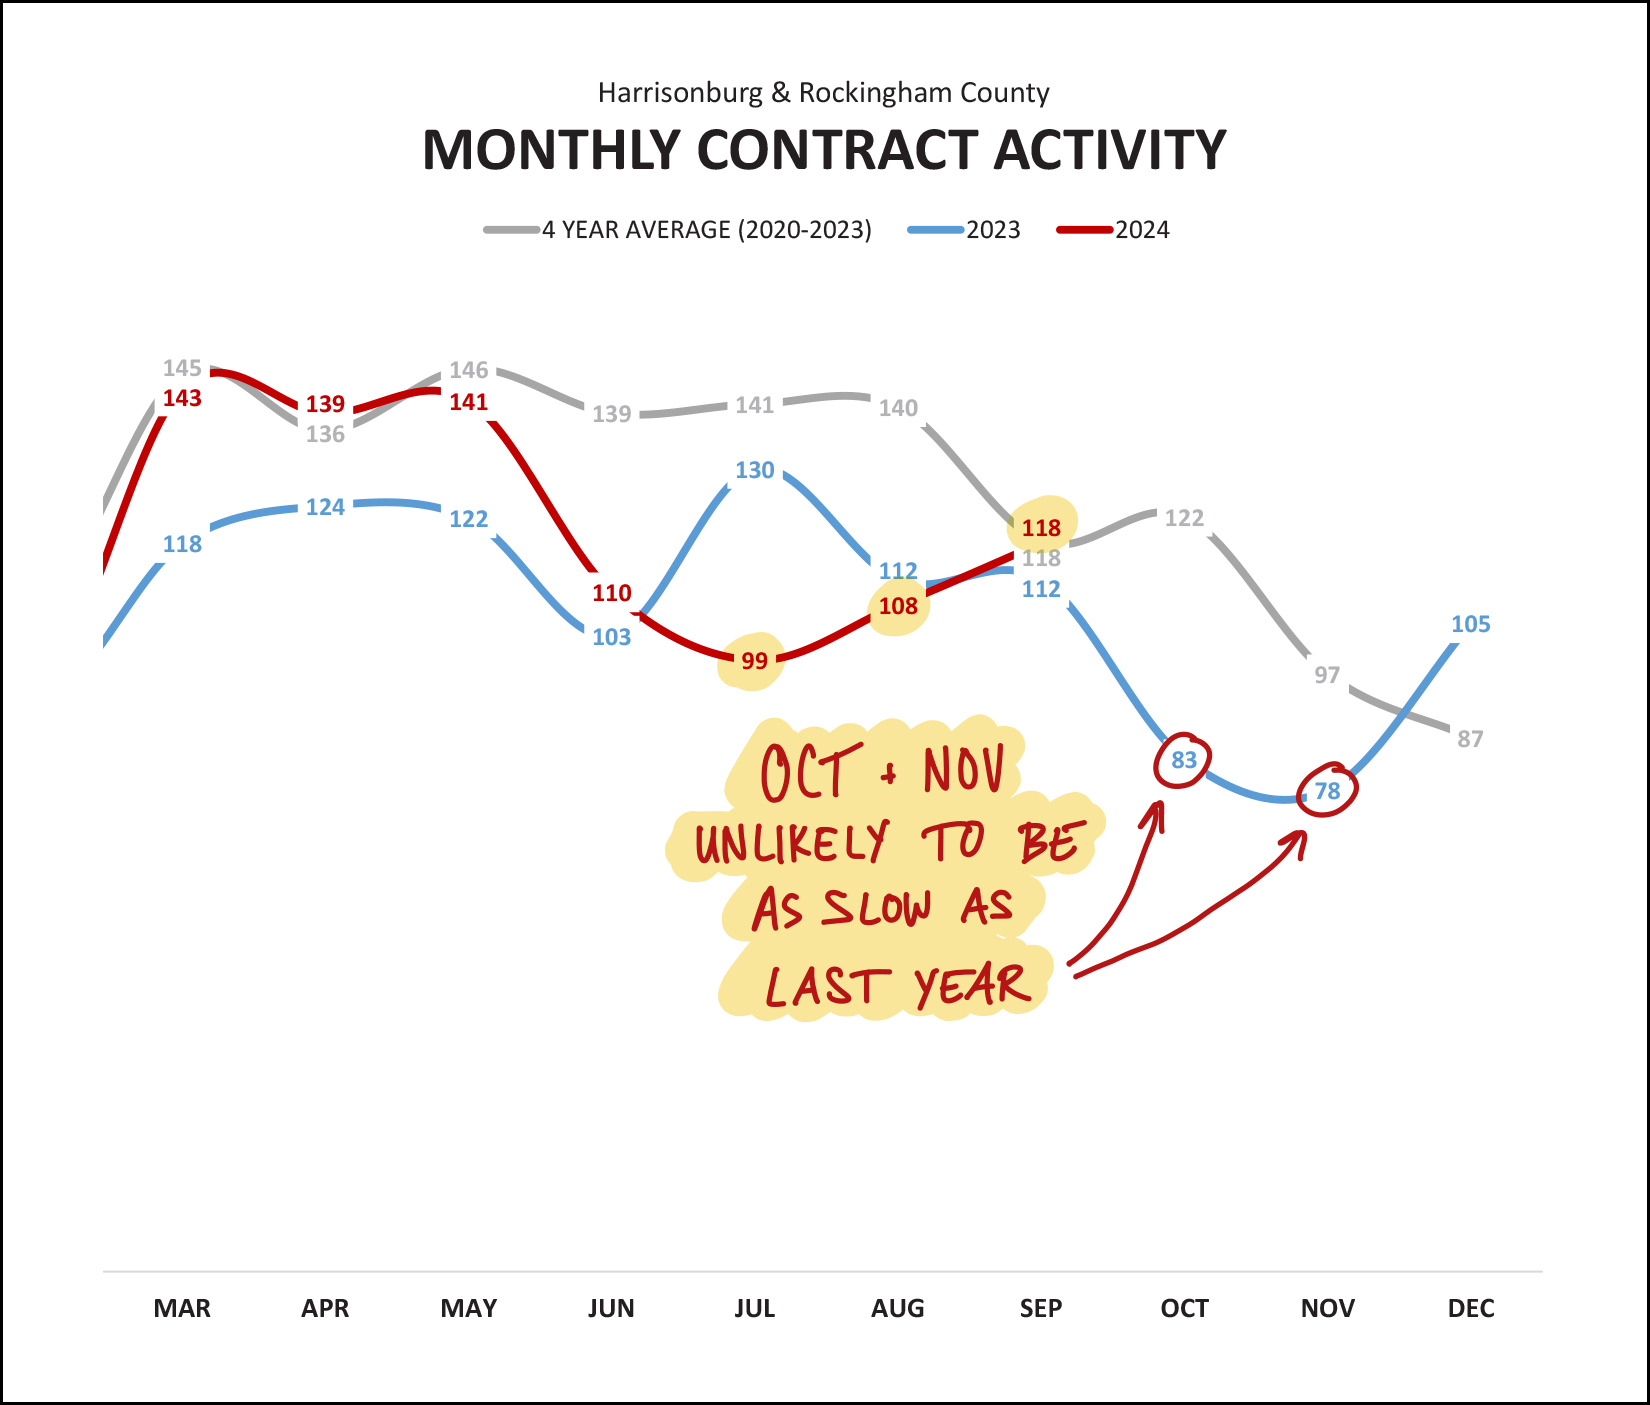 Two things to note above... [1] July through August contract activity generally fell last year (blue line) while it has been rising this year (red line) indicating we should see stronger home sales over the next few months. [2] Contract activity *really* fell last October and November... likely due to the highest mortgage interest rates in 20+ years. We are not seeing those same high rates this year, so contract activity seems likely to be well exceed last year's figures in October and November. And... a slow rise in contract activity over the past few months has resulted in... 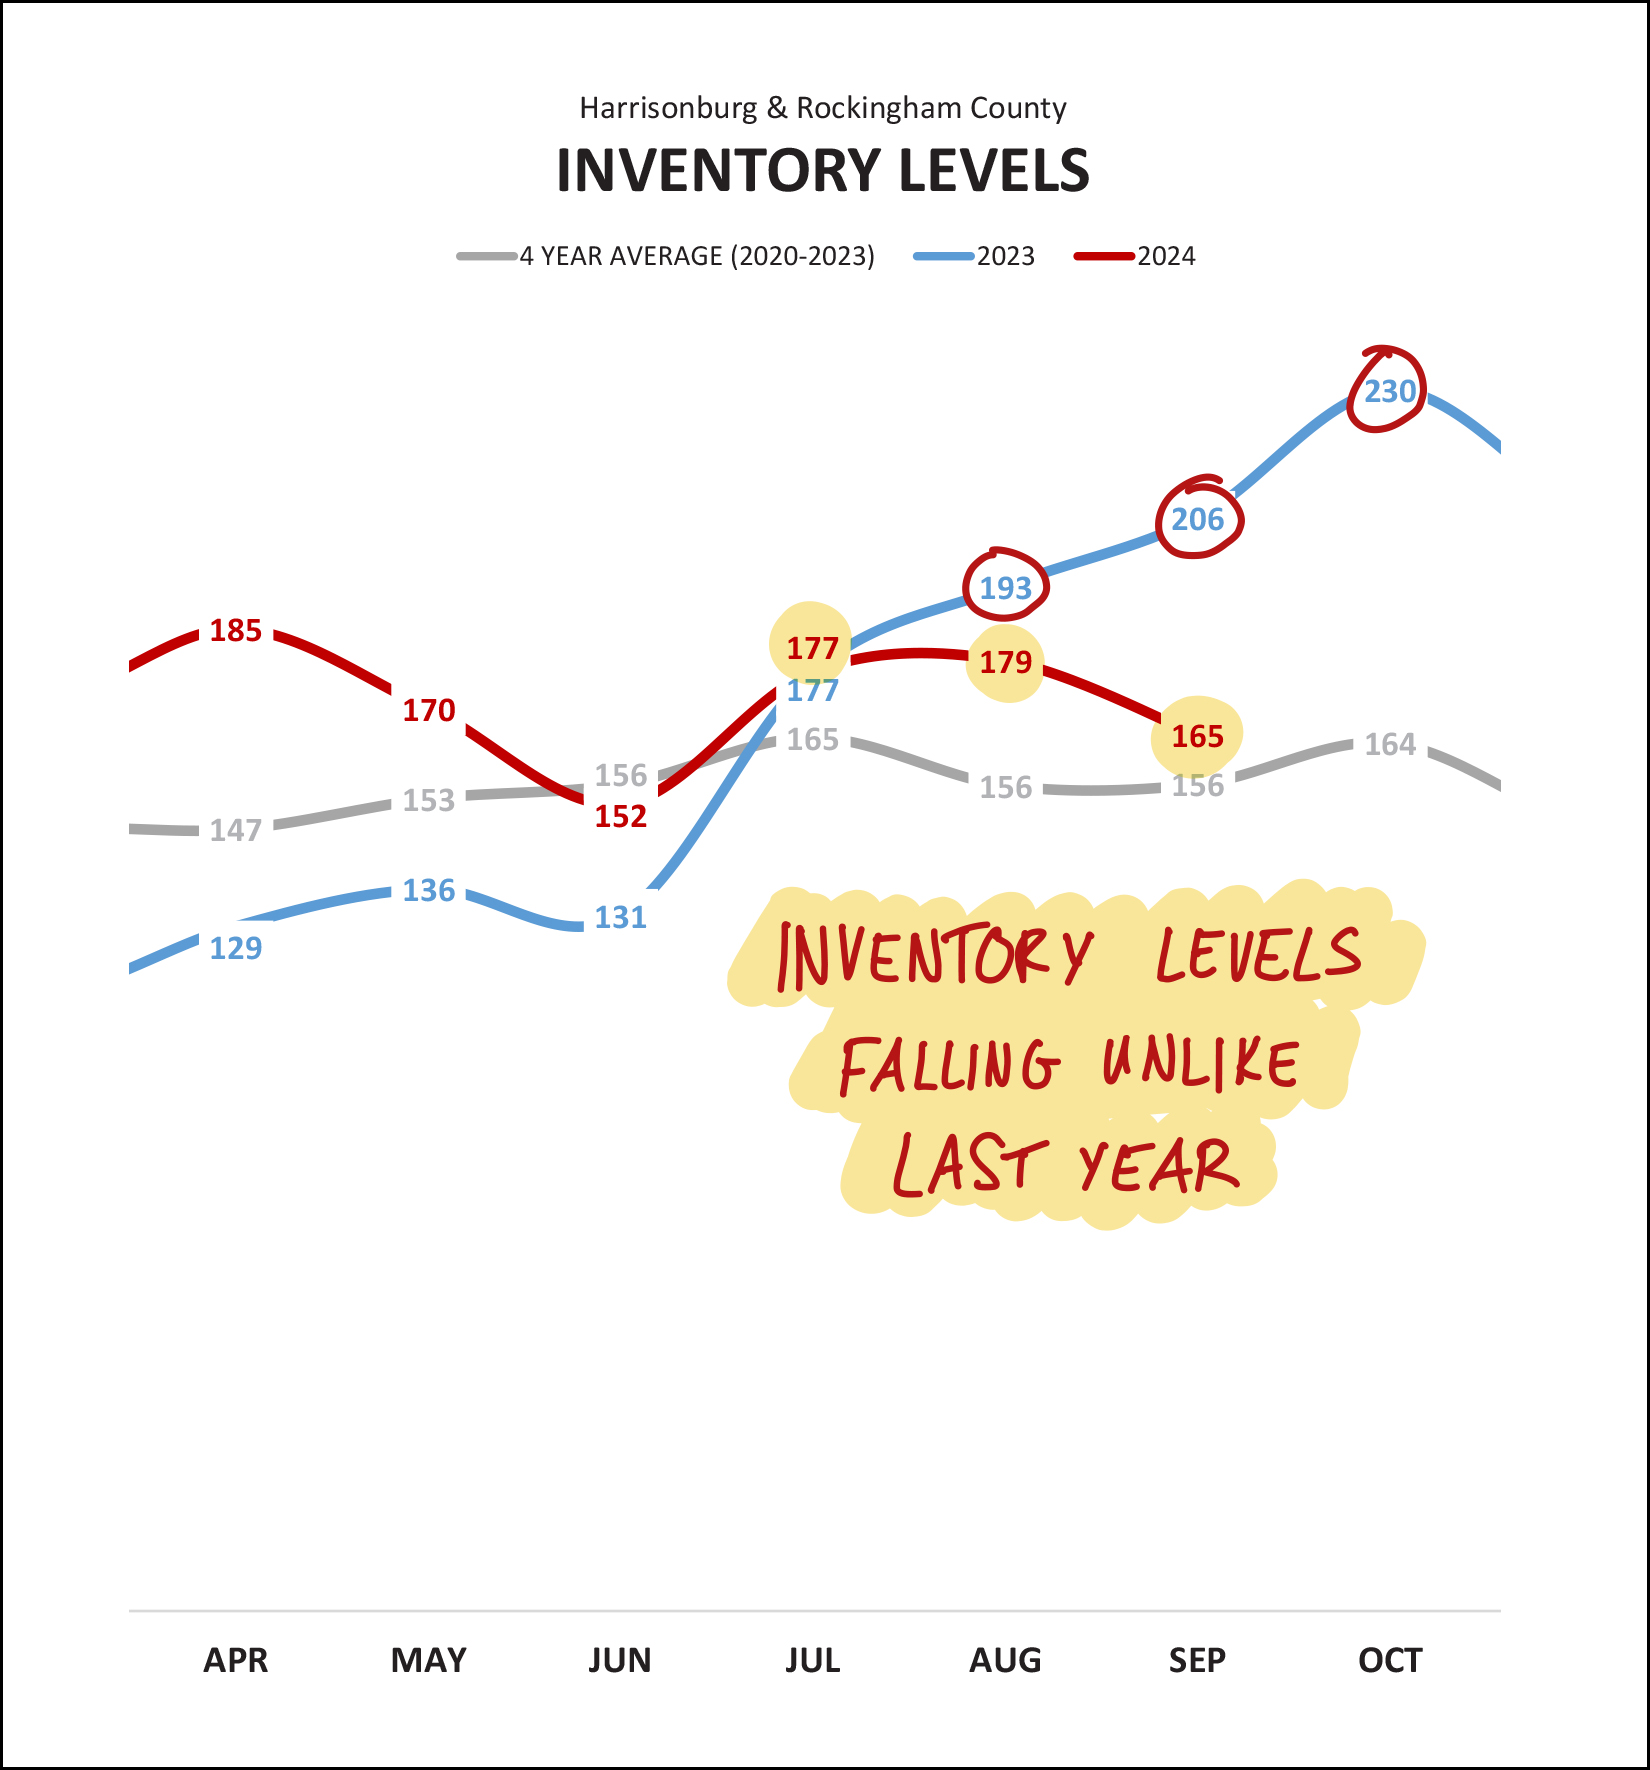 Lower inventory levels! Over the past two months we have seen small but steady declines in the number of homes listed for sale (that are not under contract) as compared to a steady increase between last June and October. We seem unlikely to see a rapid rise in inventory levels this October and November, as last year's increase was likely directly related to 7.5%+ mortgage interest rates that (thankfully) just lasted for a few months. This next (and second to last) graph has become more interesting of late... 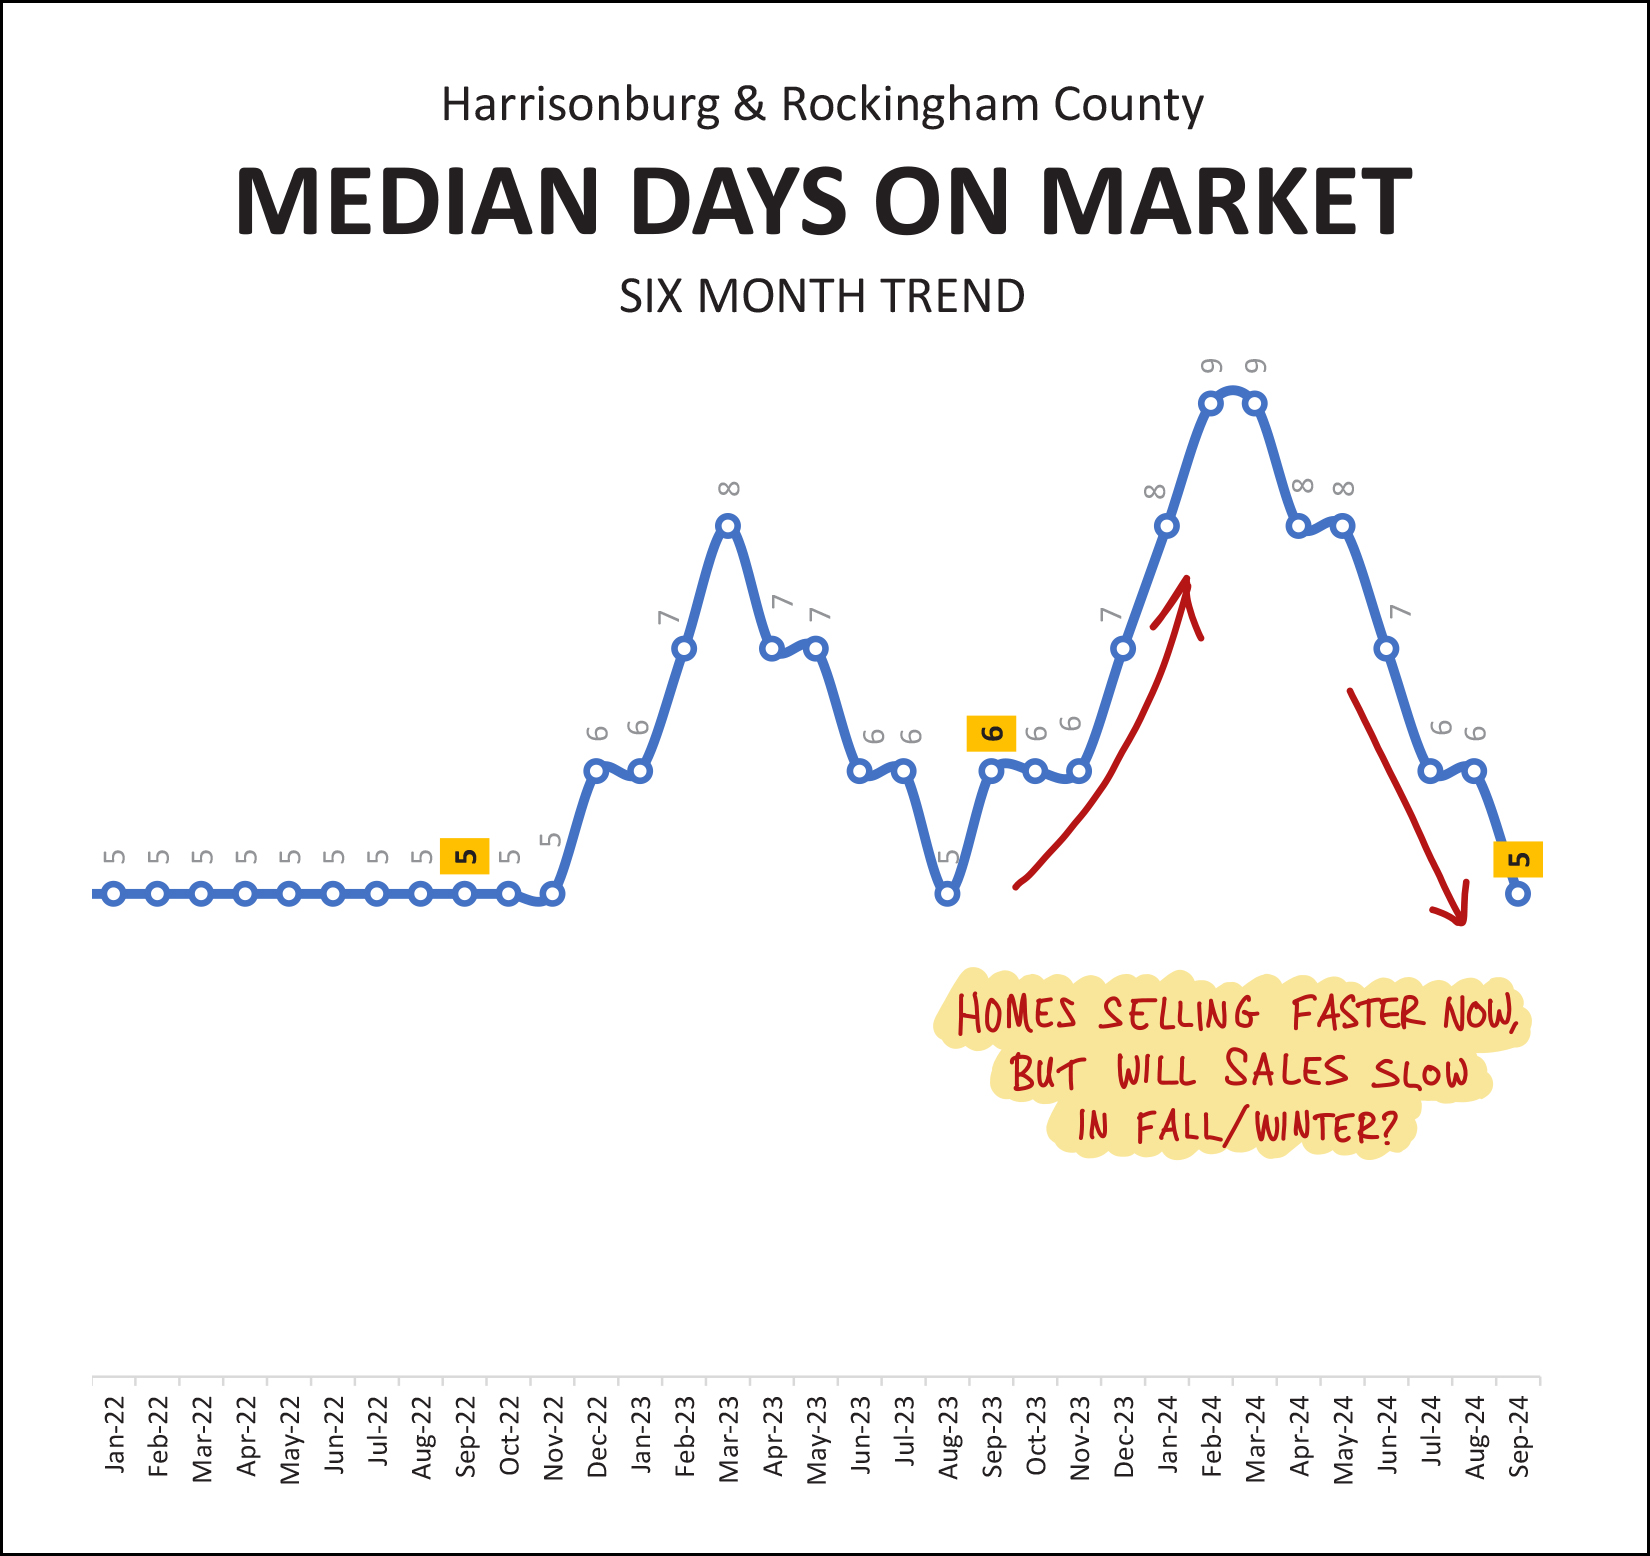 The big question... is seasonality back when it comes to "median days on market" in Harrisonburg and Rockingham County? Over the past two years we have seen this median days on market metric increase in the Fall and Winter and decline in the Spring and Summer. Will we see that happen again as we roll through November, December, January and February? Stay tuned! Finally, we've talked about mortgage interest rates a half dozen times thus far, so let's see what they have been doing... 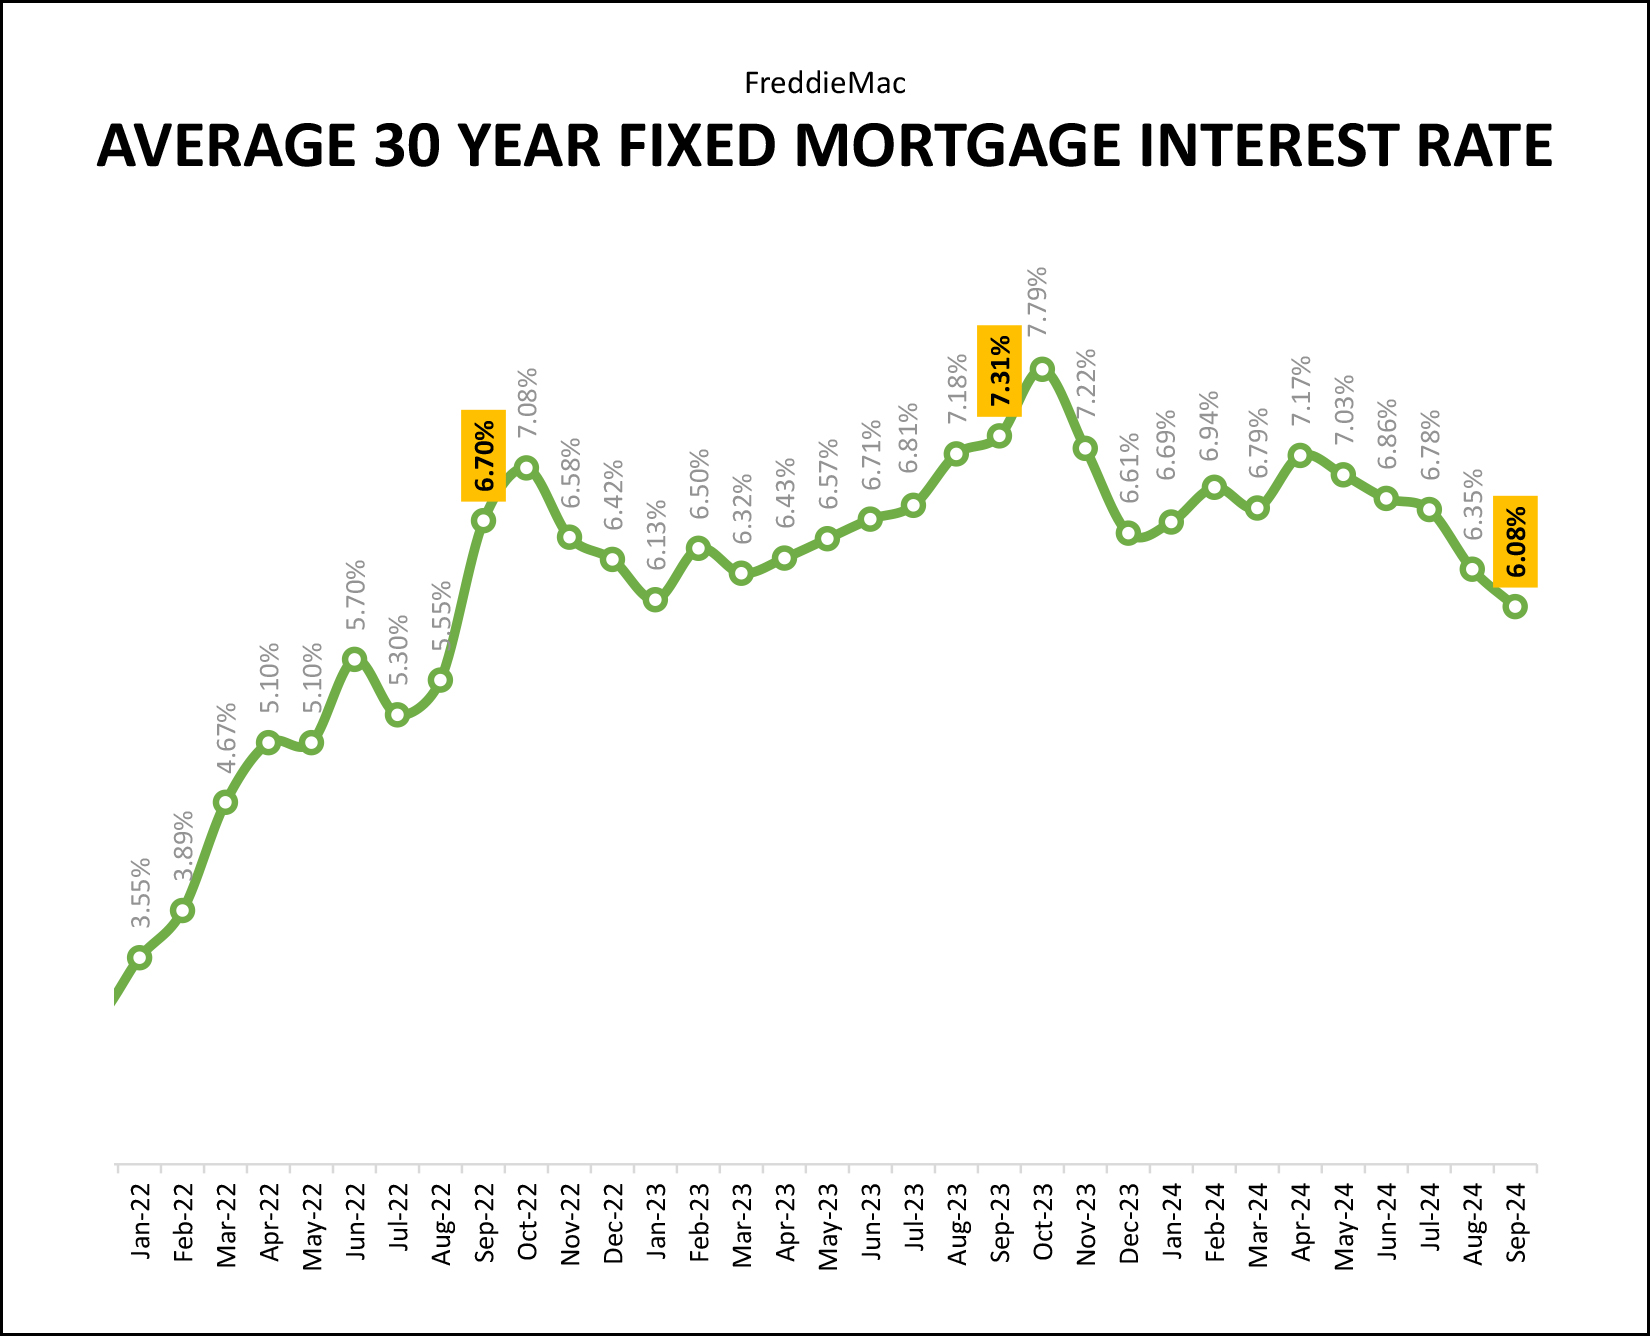 Mortgage interest rates have been falling for the past five months to a low of 6.08% at the end of September... down from 7.31% a year ago. These lower mortgage interest rates have progressively lowered mortgage payments for actual buyers and would be buyers and has likely brought more buyers back into the market at many price points. And there you have it folks, in summary...
All that said, this is all much more nuanced in any particular segment of the market based on property type, size, age, location, etc. So... If you are thinking about selling your home this Fall, let's dive into the trends for your corner of our local real estate market to determine the best pricing strategy for your home. If you are thinking about buying a home this Fall, go ahead and get pre-approved and let's start looking at new listings of interest as they hit the market, as they likely won't last long. Feel free to reach out anytime with questions or to set up a time to meet. You can contact me most easily by phone/text at 540-578-0102 or by email here. Until next month... enjoy Fall... and may you not forget to finish whatever race you are currently running... literally or figuratively. ;-) | |
Contract Activity Cools Slightly After Strong Summer Surge in Home Sales in Harrisonburg and Rockingham County |
|
 Happy Monday Morning, Friends! We are just six days from the first day of Fall... and it's starting to feel like it! High temperatures are peaking in the 70's instead of the 80's this week... the leaves are starting to change colors... and we're back to having fun watching JMU football games...  My niece, Sofia, just started college at UNC Charlotte, so Luke and I were excited to go down to visit her and to take in the first JMU football game of the season. Here's looking forward to some further fun as the season continues! Go Dukes!!! Before we dive into the real estate data... as one last reminder of summer... I'm giving away a $50 gift card to Sweet Frog. Yes, I know, we can enjoy Sweet Frog all year round, but it's particularly tasty on a warm summer evening. So, if you're a fan of Sweet Frog frozen yogurt (and all the toppings!) click here to enter the gift card. And now, on to the latest in our local real estate market... 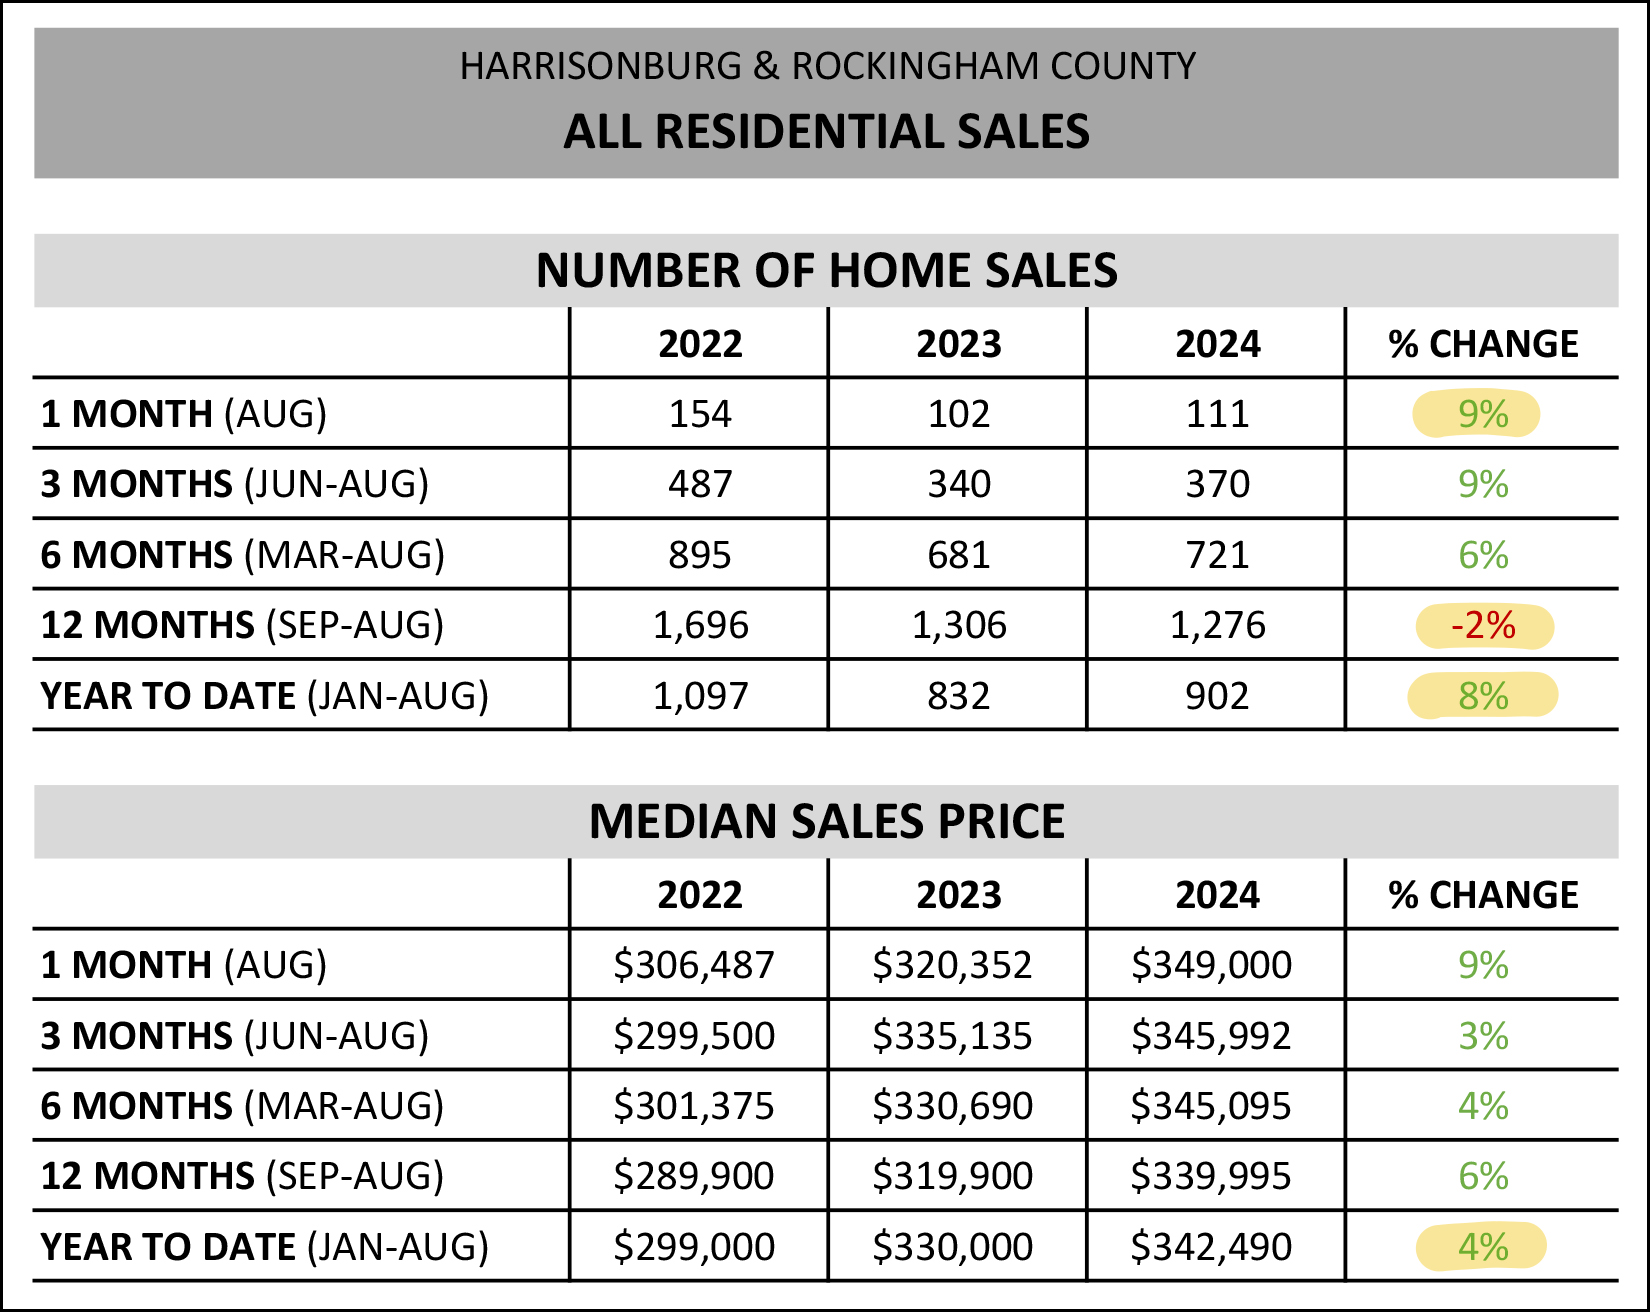 Above you'll see a basic overview of the amount of homes that are selling these days, and the prices at which they are selling. A few things to note... # Sales: We saw more home sales this August than last (+9%) and even though we've seen fewer home sales over the past 12 months compared to the prior 12 months (-2%) we are seeing an increase (+8%) in the first eight months of 2024 as compared to the same timeframe last year. So... more homes are selling this year than sold last year, and... Prices: In every time horizon I explored above (1M, 3M, 6M, 12M, YTD) I found an increase in the median sales price. I'll focus in on the year to date number, however, where we see a 4% increase in the median sales price when looking at homes selling in the first eight months of this year (median of $342,490) compared to the first eight months of last year (median of $330,000). As we continue, we'll want to see how the performance of different market segments compare to this market wide 4% increase in the median sales price. First up, detached home sales... 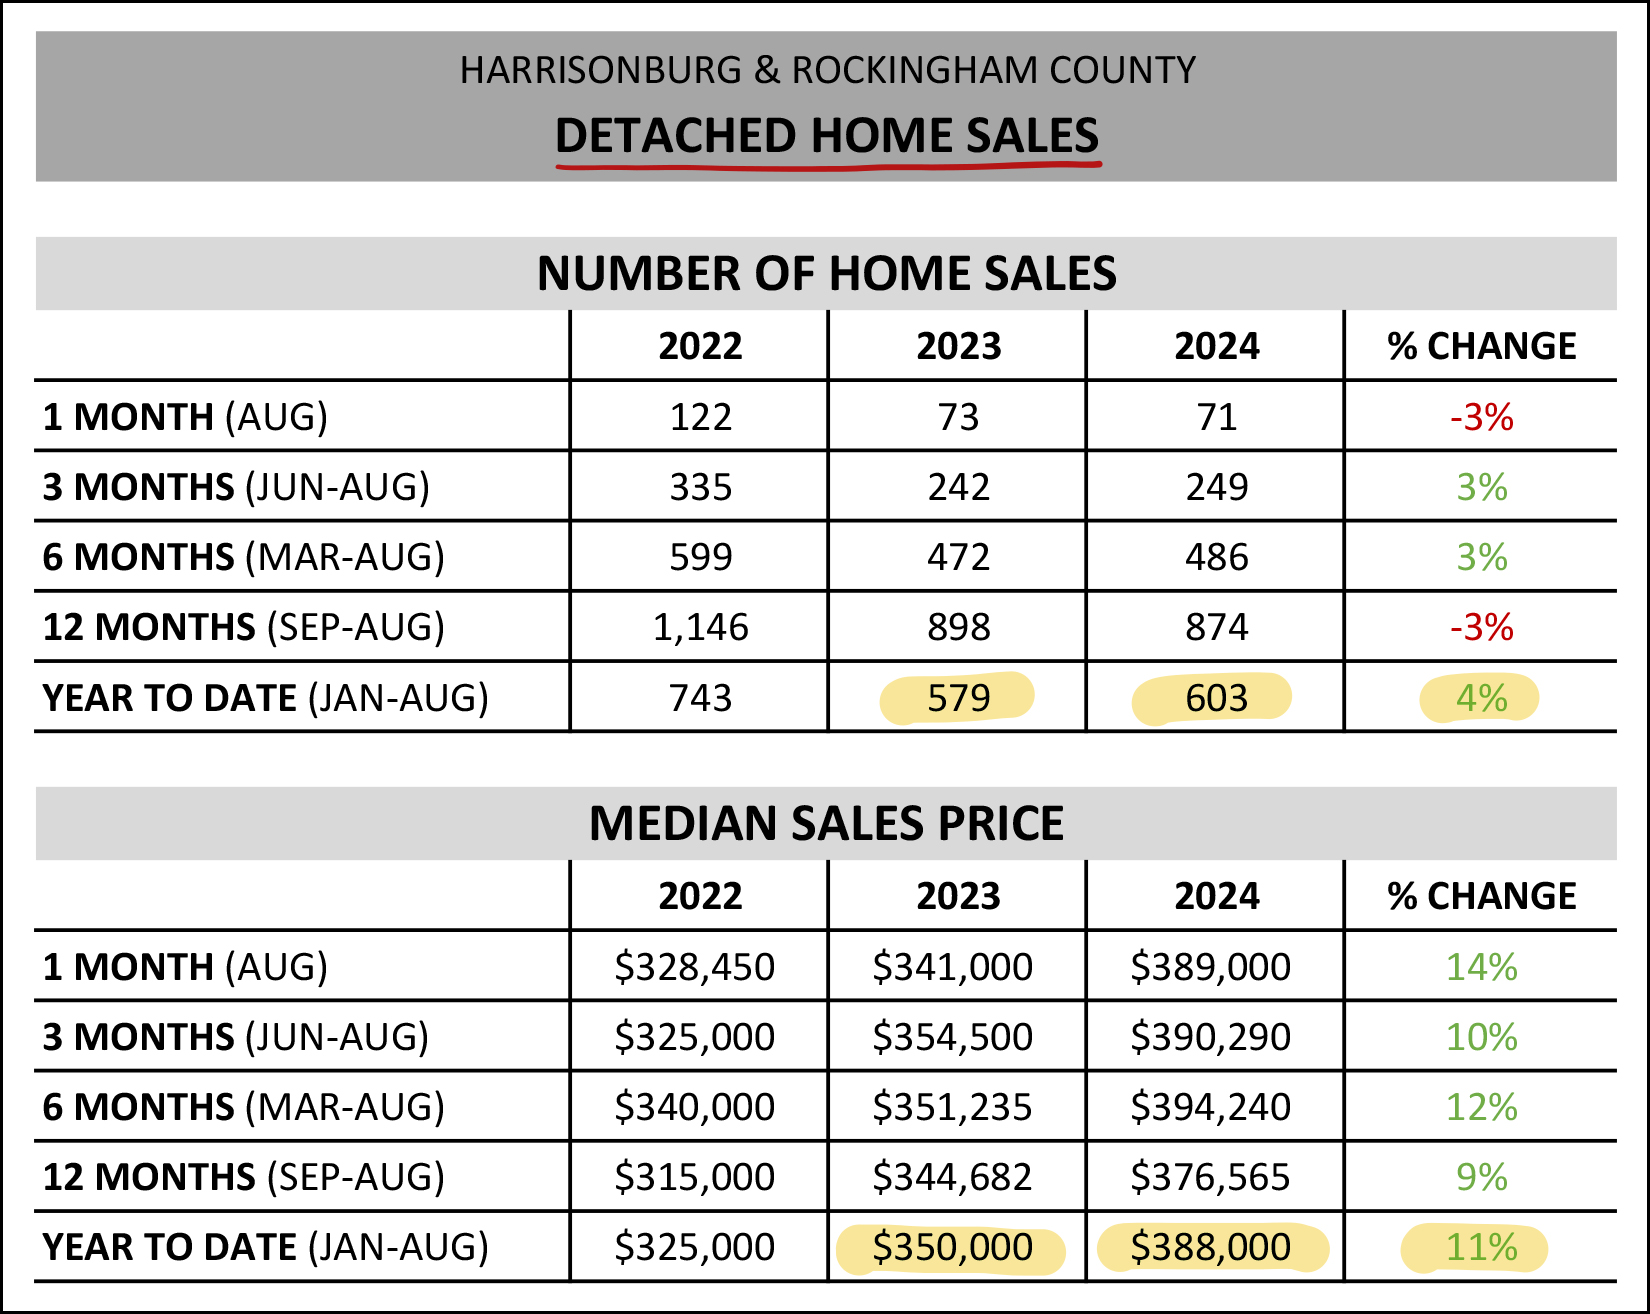 Interestingly... [1] Despite an 8% market-wide increase in home sales thus far in 2024... we're only seeing a 4% increase in the number of detached homes that are selling. [2] Despite only a 4% increase in the median sales price in the overall market (detached + attached) we're actually seeing an 11% increase in the median sales price of detached homes in 2024. As we continue through this report, you'll note a variety of charts and graphs that indicate that price growth is slowing to only 4%... but that is the overall market, whereas detached home median sales prices still seem to be climbing more quickly than the overall market. Dialing in now on one specific geographic area... the City of Harrisonburg... 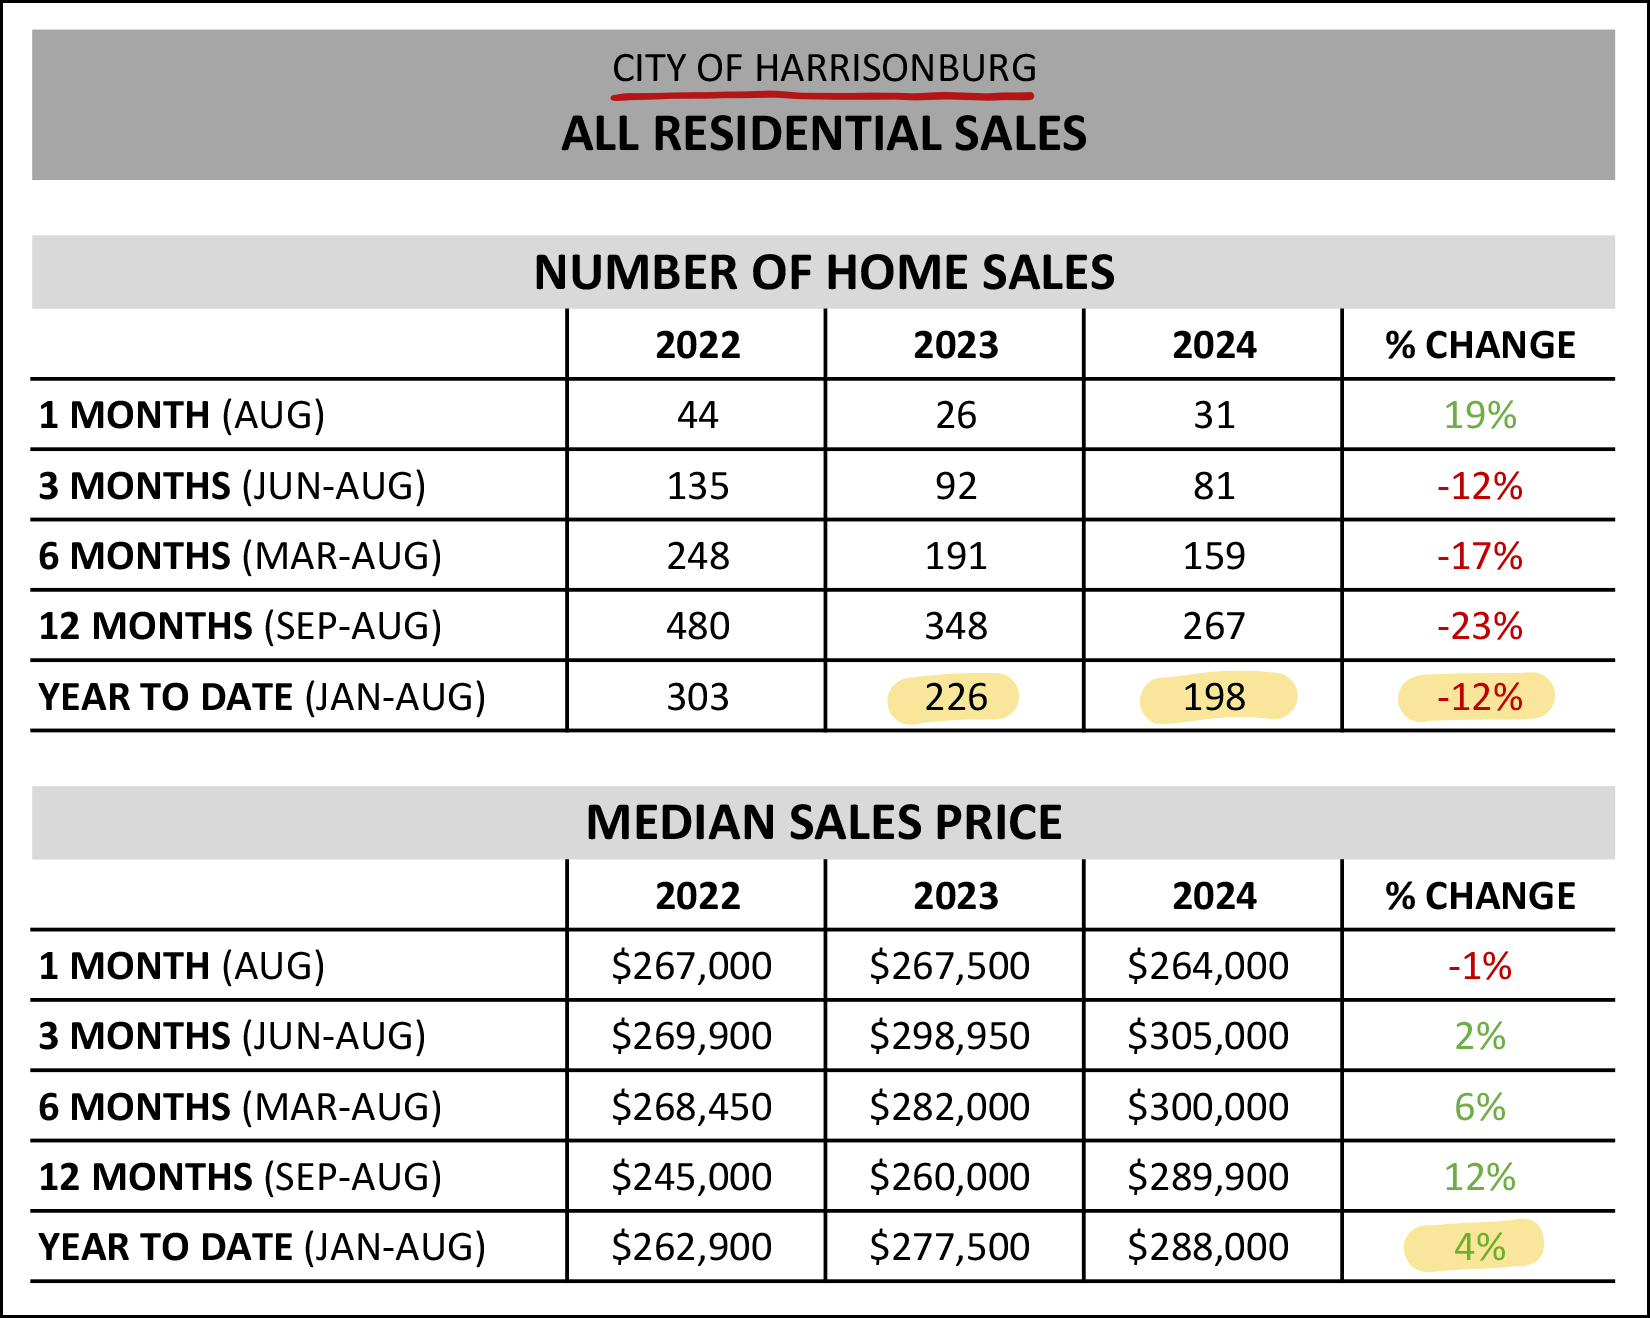 It has been increasingly difficult to find a house to buy in the City of Harrisonburg. As shown above, in the first eight months of 2022 we saw 303 home sales in the City, last year that dropped to 226 sales and this year only 198 sales. To be clear... this is almost entirely a supply side issue - there aren't enough property owners willing to sell their homes, and there isn't much new construction happening in the City these days. Despite that restriction in the market in the City of Harrisonburg, we are still seeing only a 4% increase in the median sales price when comparing the first eight months of this year to the first eight months of last year... and the median sales price in the City of Harrisonburg is still under $300K thus far in 2024. And how about out in Rockingham County? How are things going there? 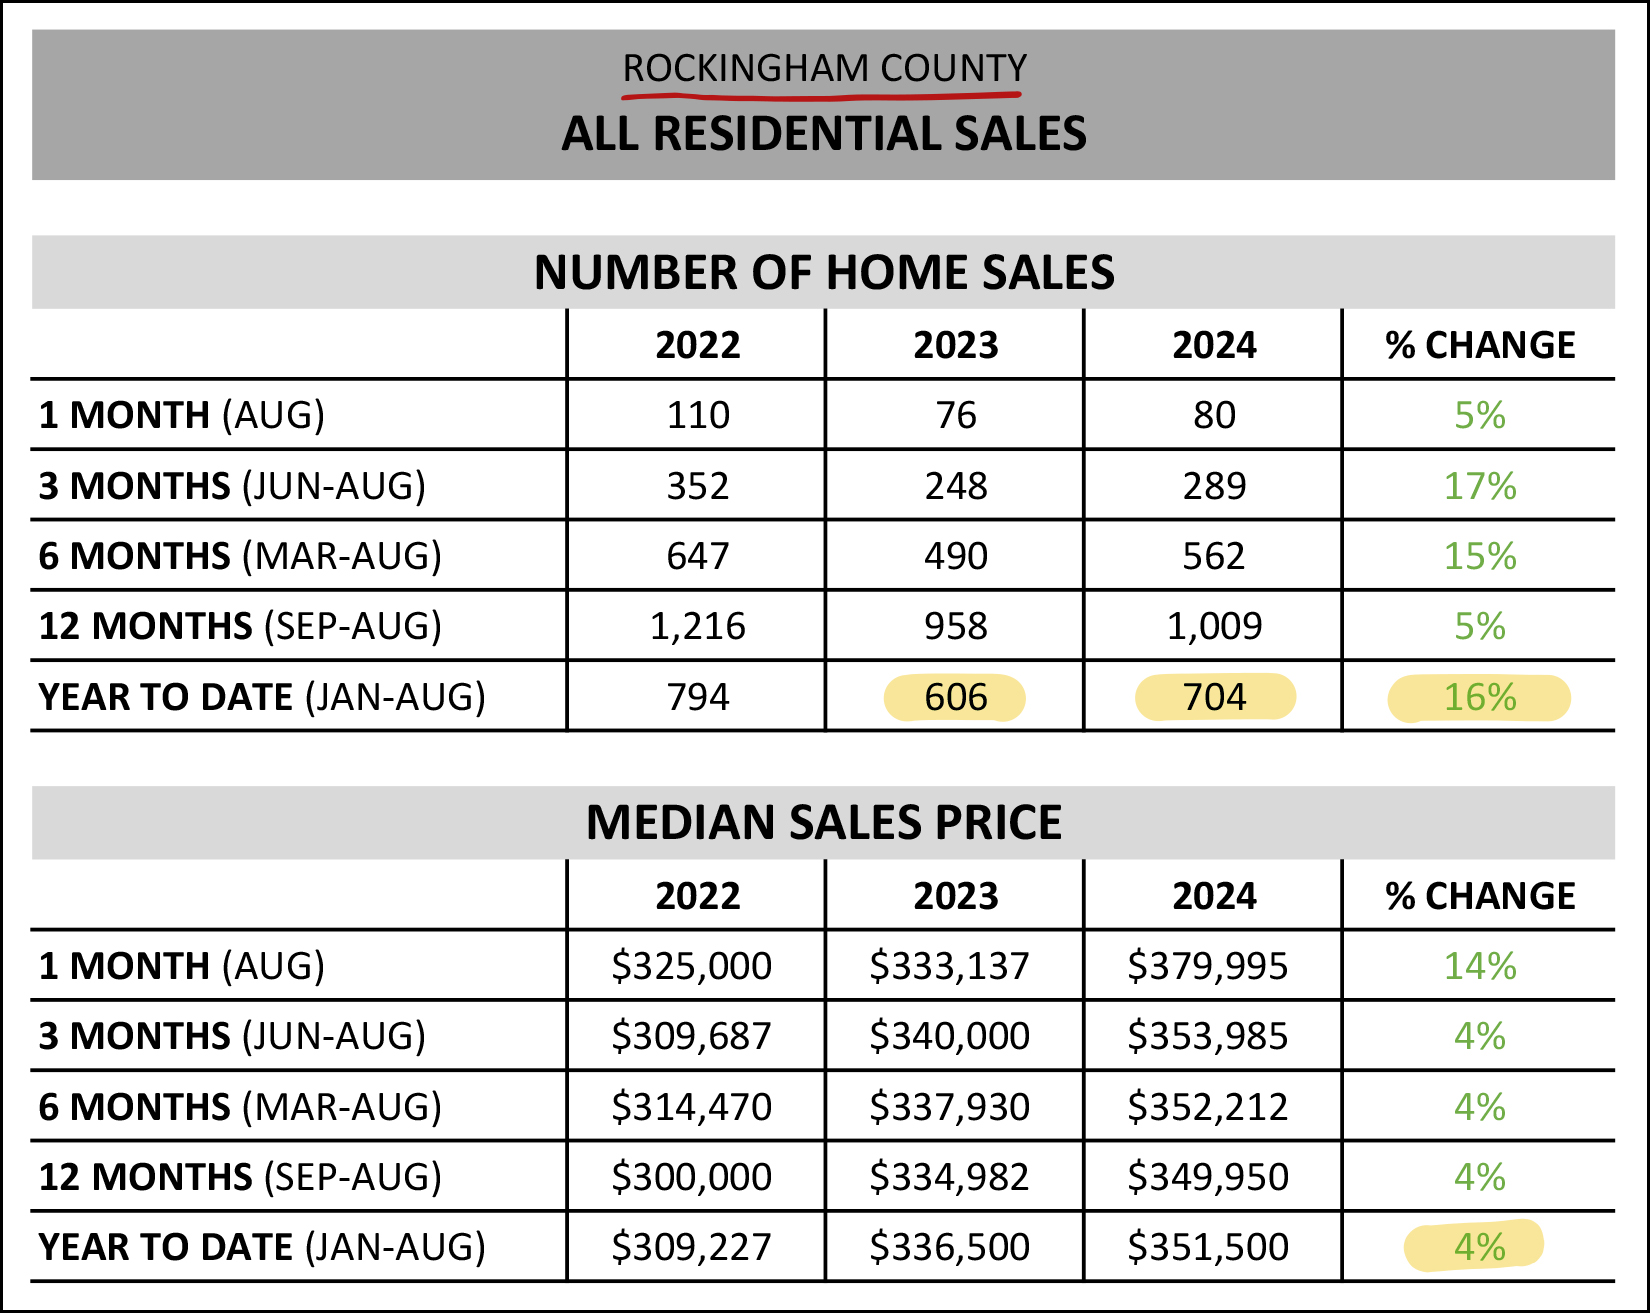 We are seeing a significant increase (+16%) in the number of homes selling in Rockingham County thus far in 2024 compared to in the same timeframe in 2023. You can't see it from the chart above, but a lot of that increase in the number of homes selling is a result of new homes being built in the County. Median prices, however, continue to rise in Rockingham County at that same 4% in the first eight months of 2024 compared to the same timeframe last year. New home construction... it's on the rise? Yes, indeed, it is... 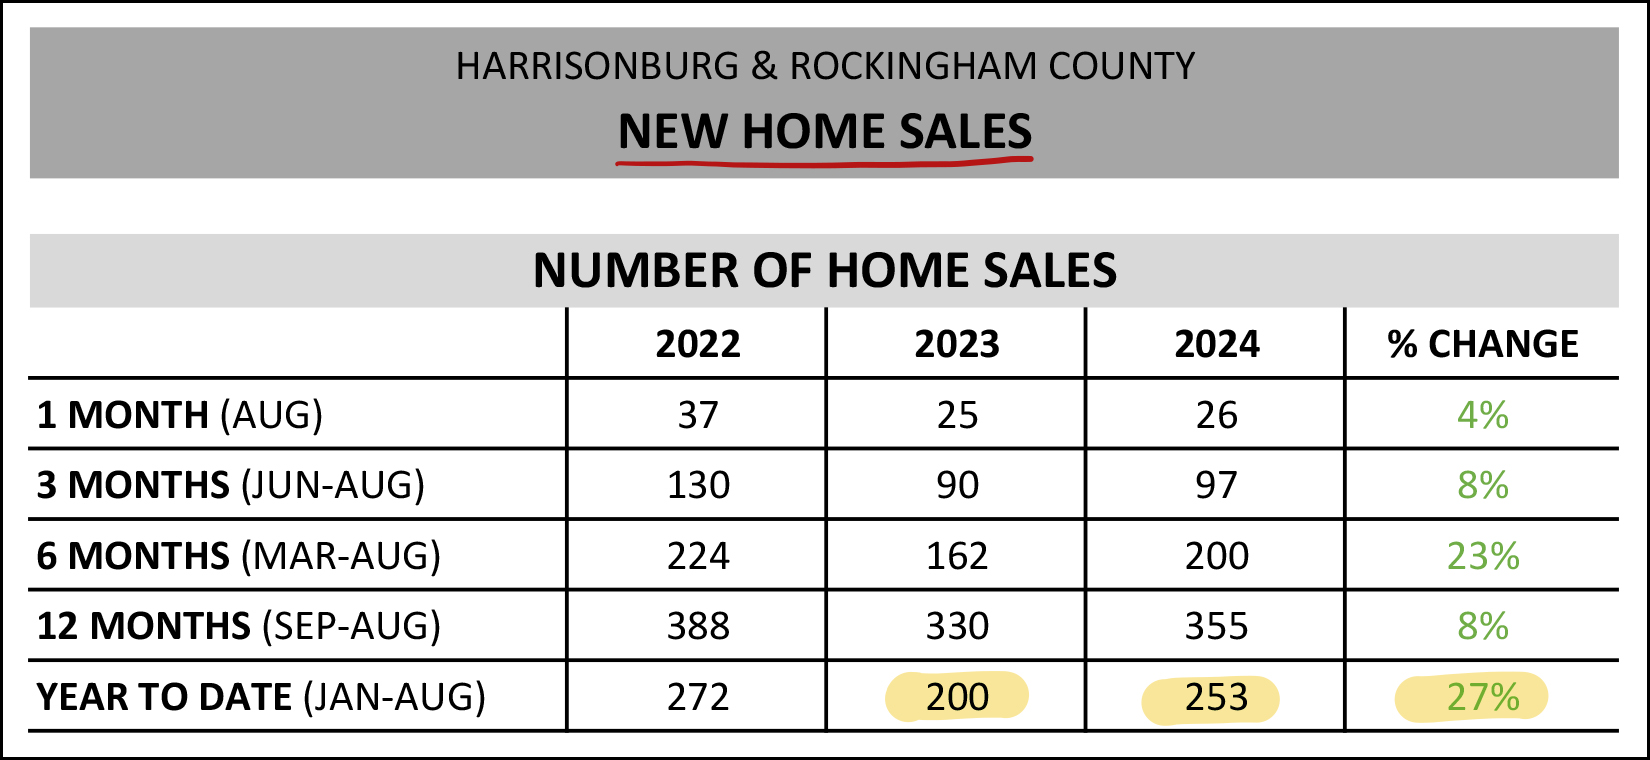 We've seen 253 new home sales thus far in 2024... which is a 27% increase from the first eight months of 2023... though interesting, it's slightly fewer than we saw two years ago, in 2022. I expect we will continue to see quite a bit of new home construction over the next few years... and we need it... as we continue to see high levels of demand from home buyers. So, if we're seeing a 27% increase in new home sales, how about those existing home sales? Are they also increasing at that pace? Ummm... nope... 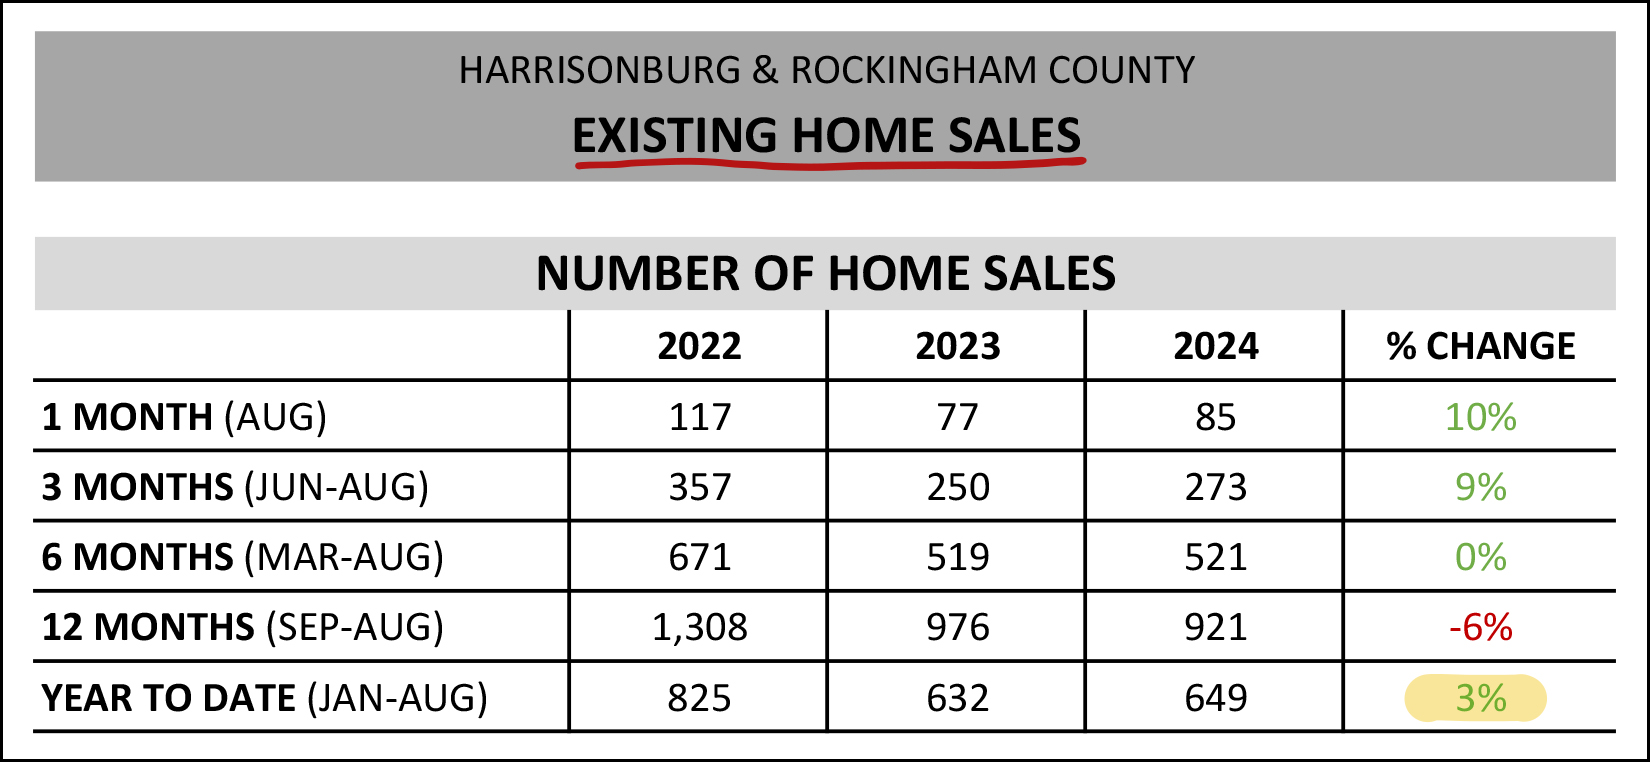 In contrast to the 27% increase in new home sales thus far in 2024... we have only seen a 3% increase in existing home sales. Lots and lots of homeowners are just staying put and not selling their homes. Now, let's get to some of the graphs, to get a clearer picture of some of the trends we have been discussing... 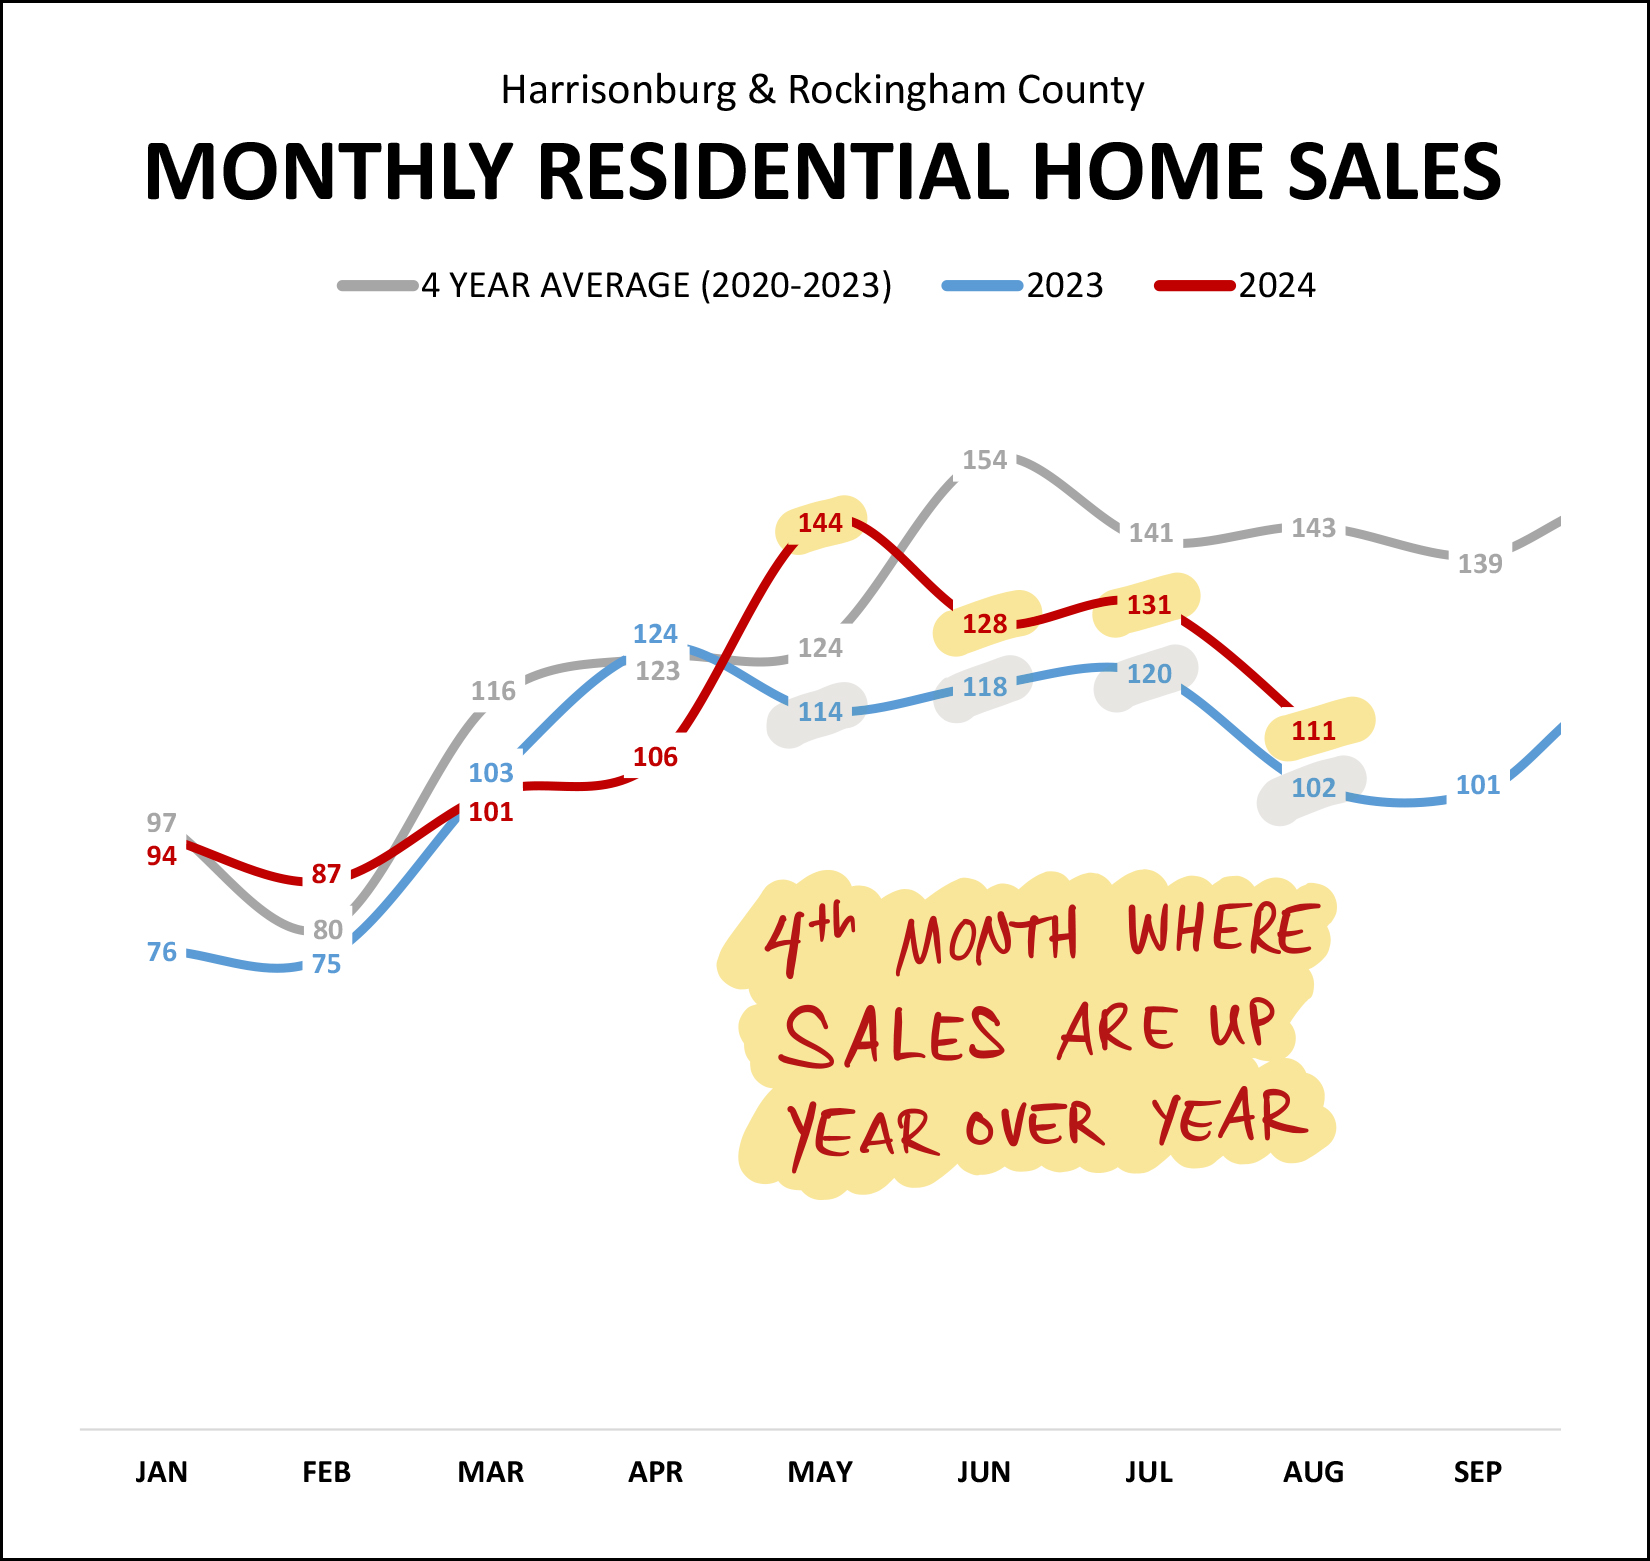 August marks the fourth month in a row with more home sales (closed home sales) than during the same month last year. This has been an active summer of real estate closings... though homes often go under contract a month or two before they make it to closing... so this busy summer of real estate closings was the result of a busy late Spring and early Summer of contracts, which we'll see shortly. To put this year in the context of the past two years... 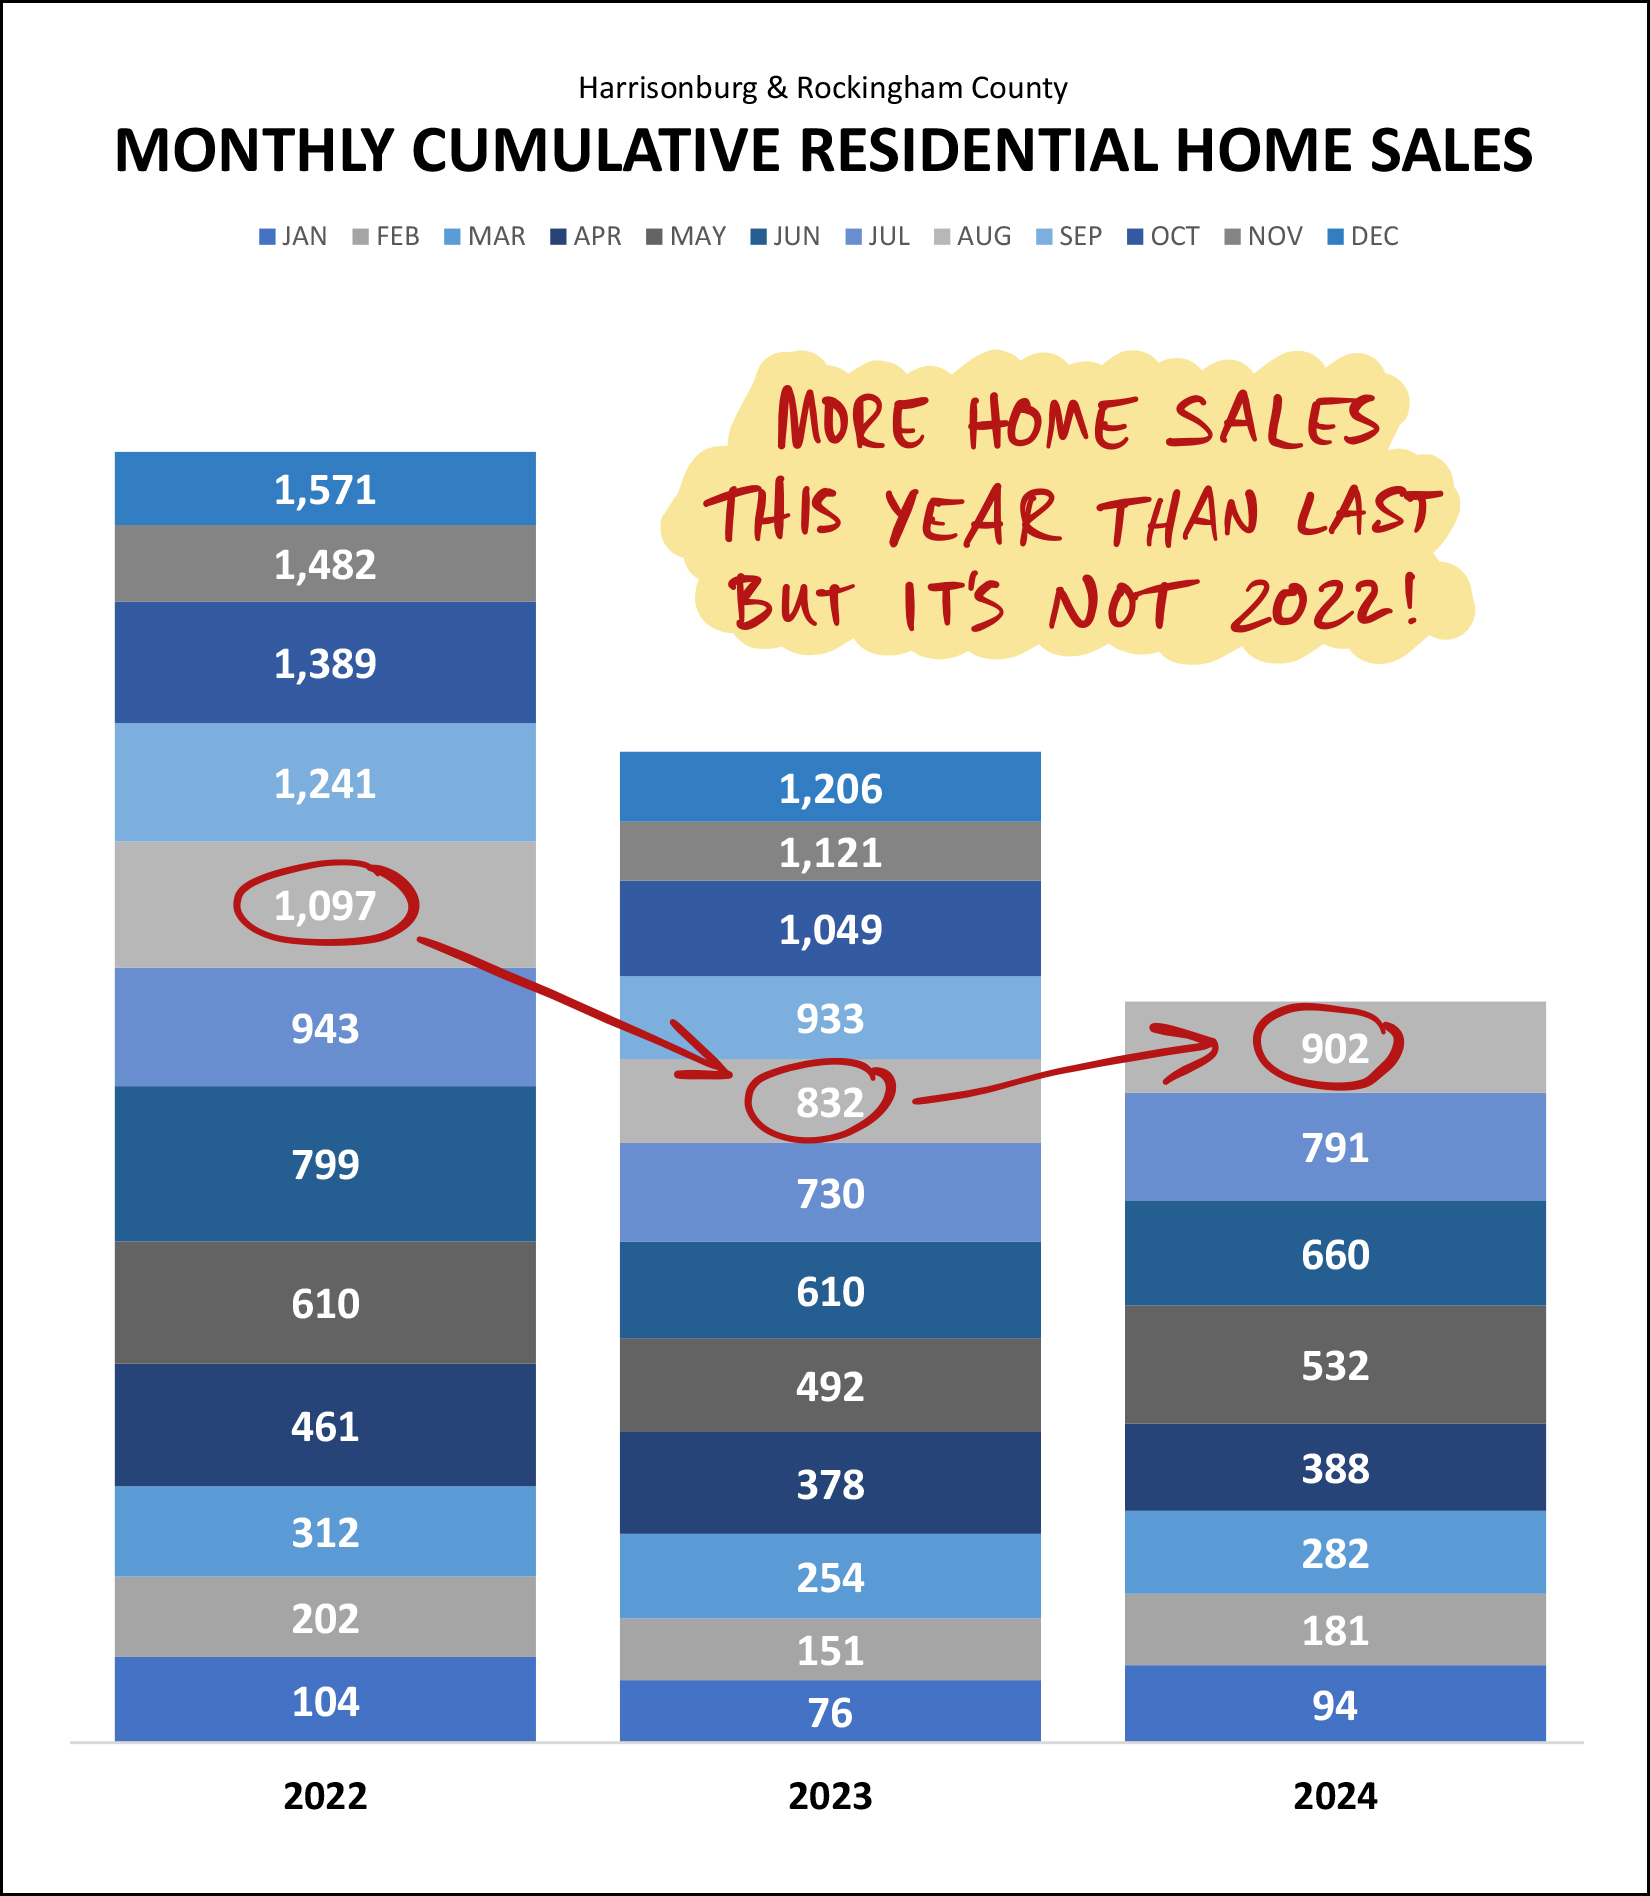 Home sales in 2024 are definitely exceeding 2023 levels... but pale in comparison to 2022. I expect we might see some further upward momentum in home sales later in 2024 if or when we see further relief in mortgage interest rates. More on that later. Here is an illustration of the two overall trends we're seeing right now in Harrisonburg and Rockingham County... 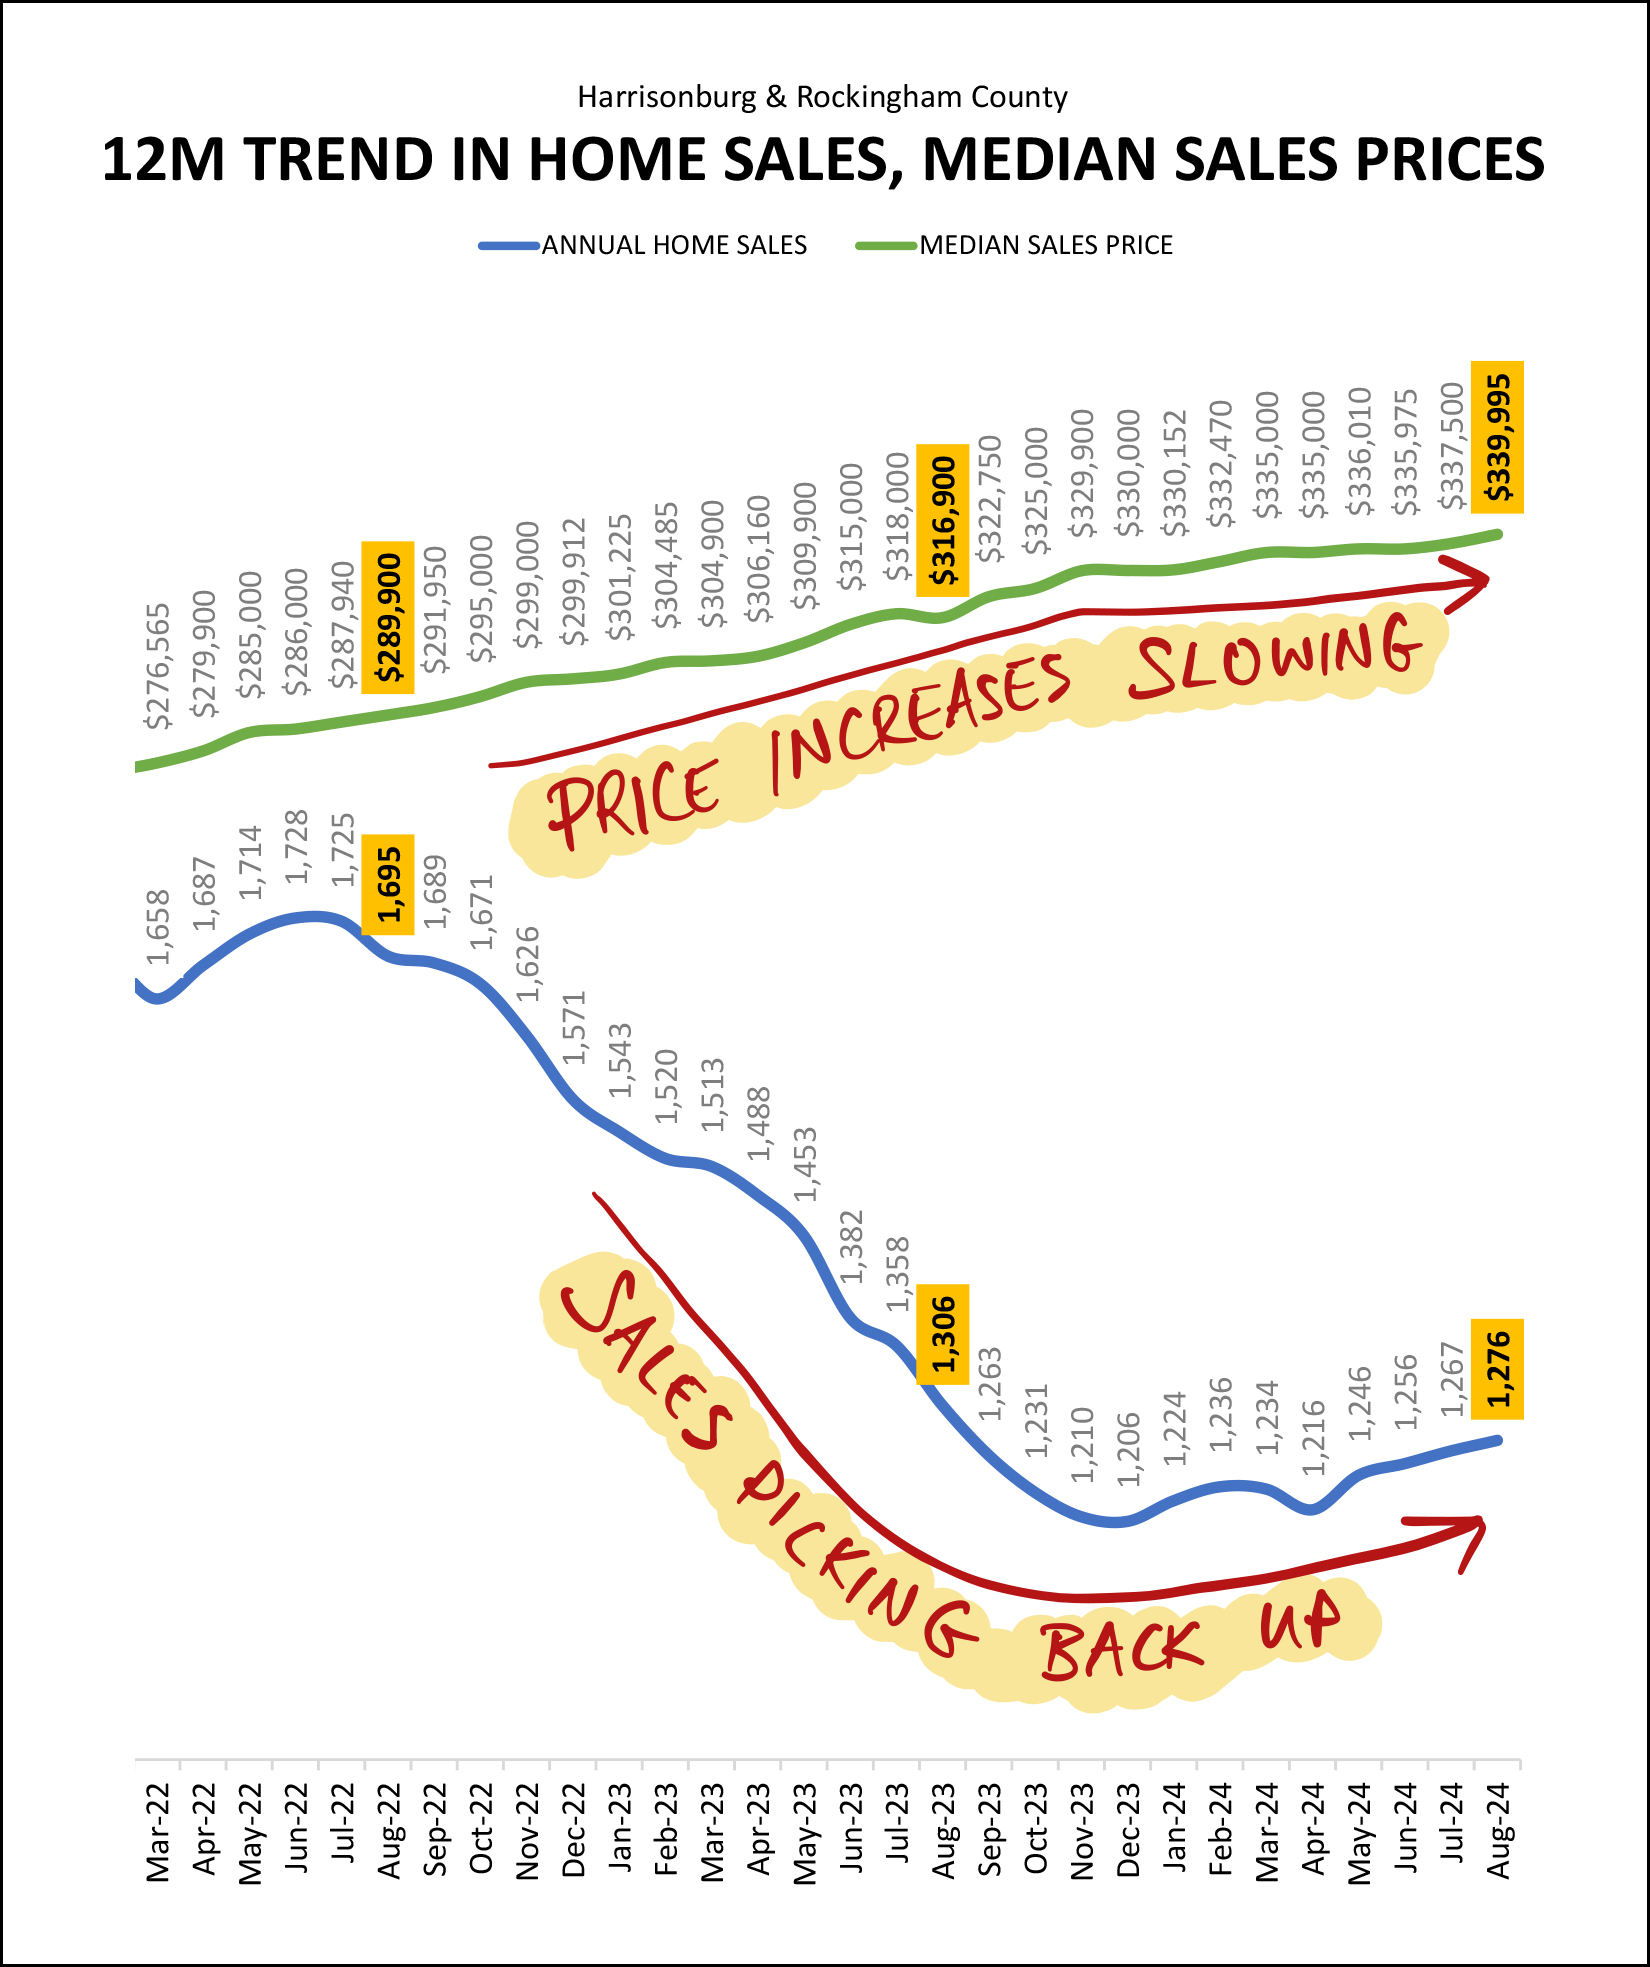 First off, at the top, home price growth is slowing. Testing your reading comprehension and short term memory... do you recall that the overall market is seeing only a ___% increase in the median sales price while the detached home segment of the market is seeing an ___% increase in the median sales price? ;-) Overall Market = 4% increase; Detached Homes = 11% increase. And... that second line (the blue one) at the bottom... shows us that aver steady declines from over 1,700 sales a year down to about 1,200 sales a year, we are now seeing some overall increases in the number of homes selling in our market. Back to those detached homes for a moment... 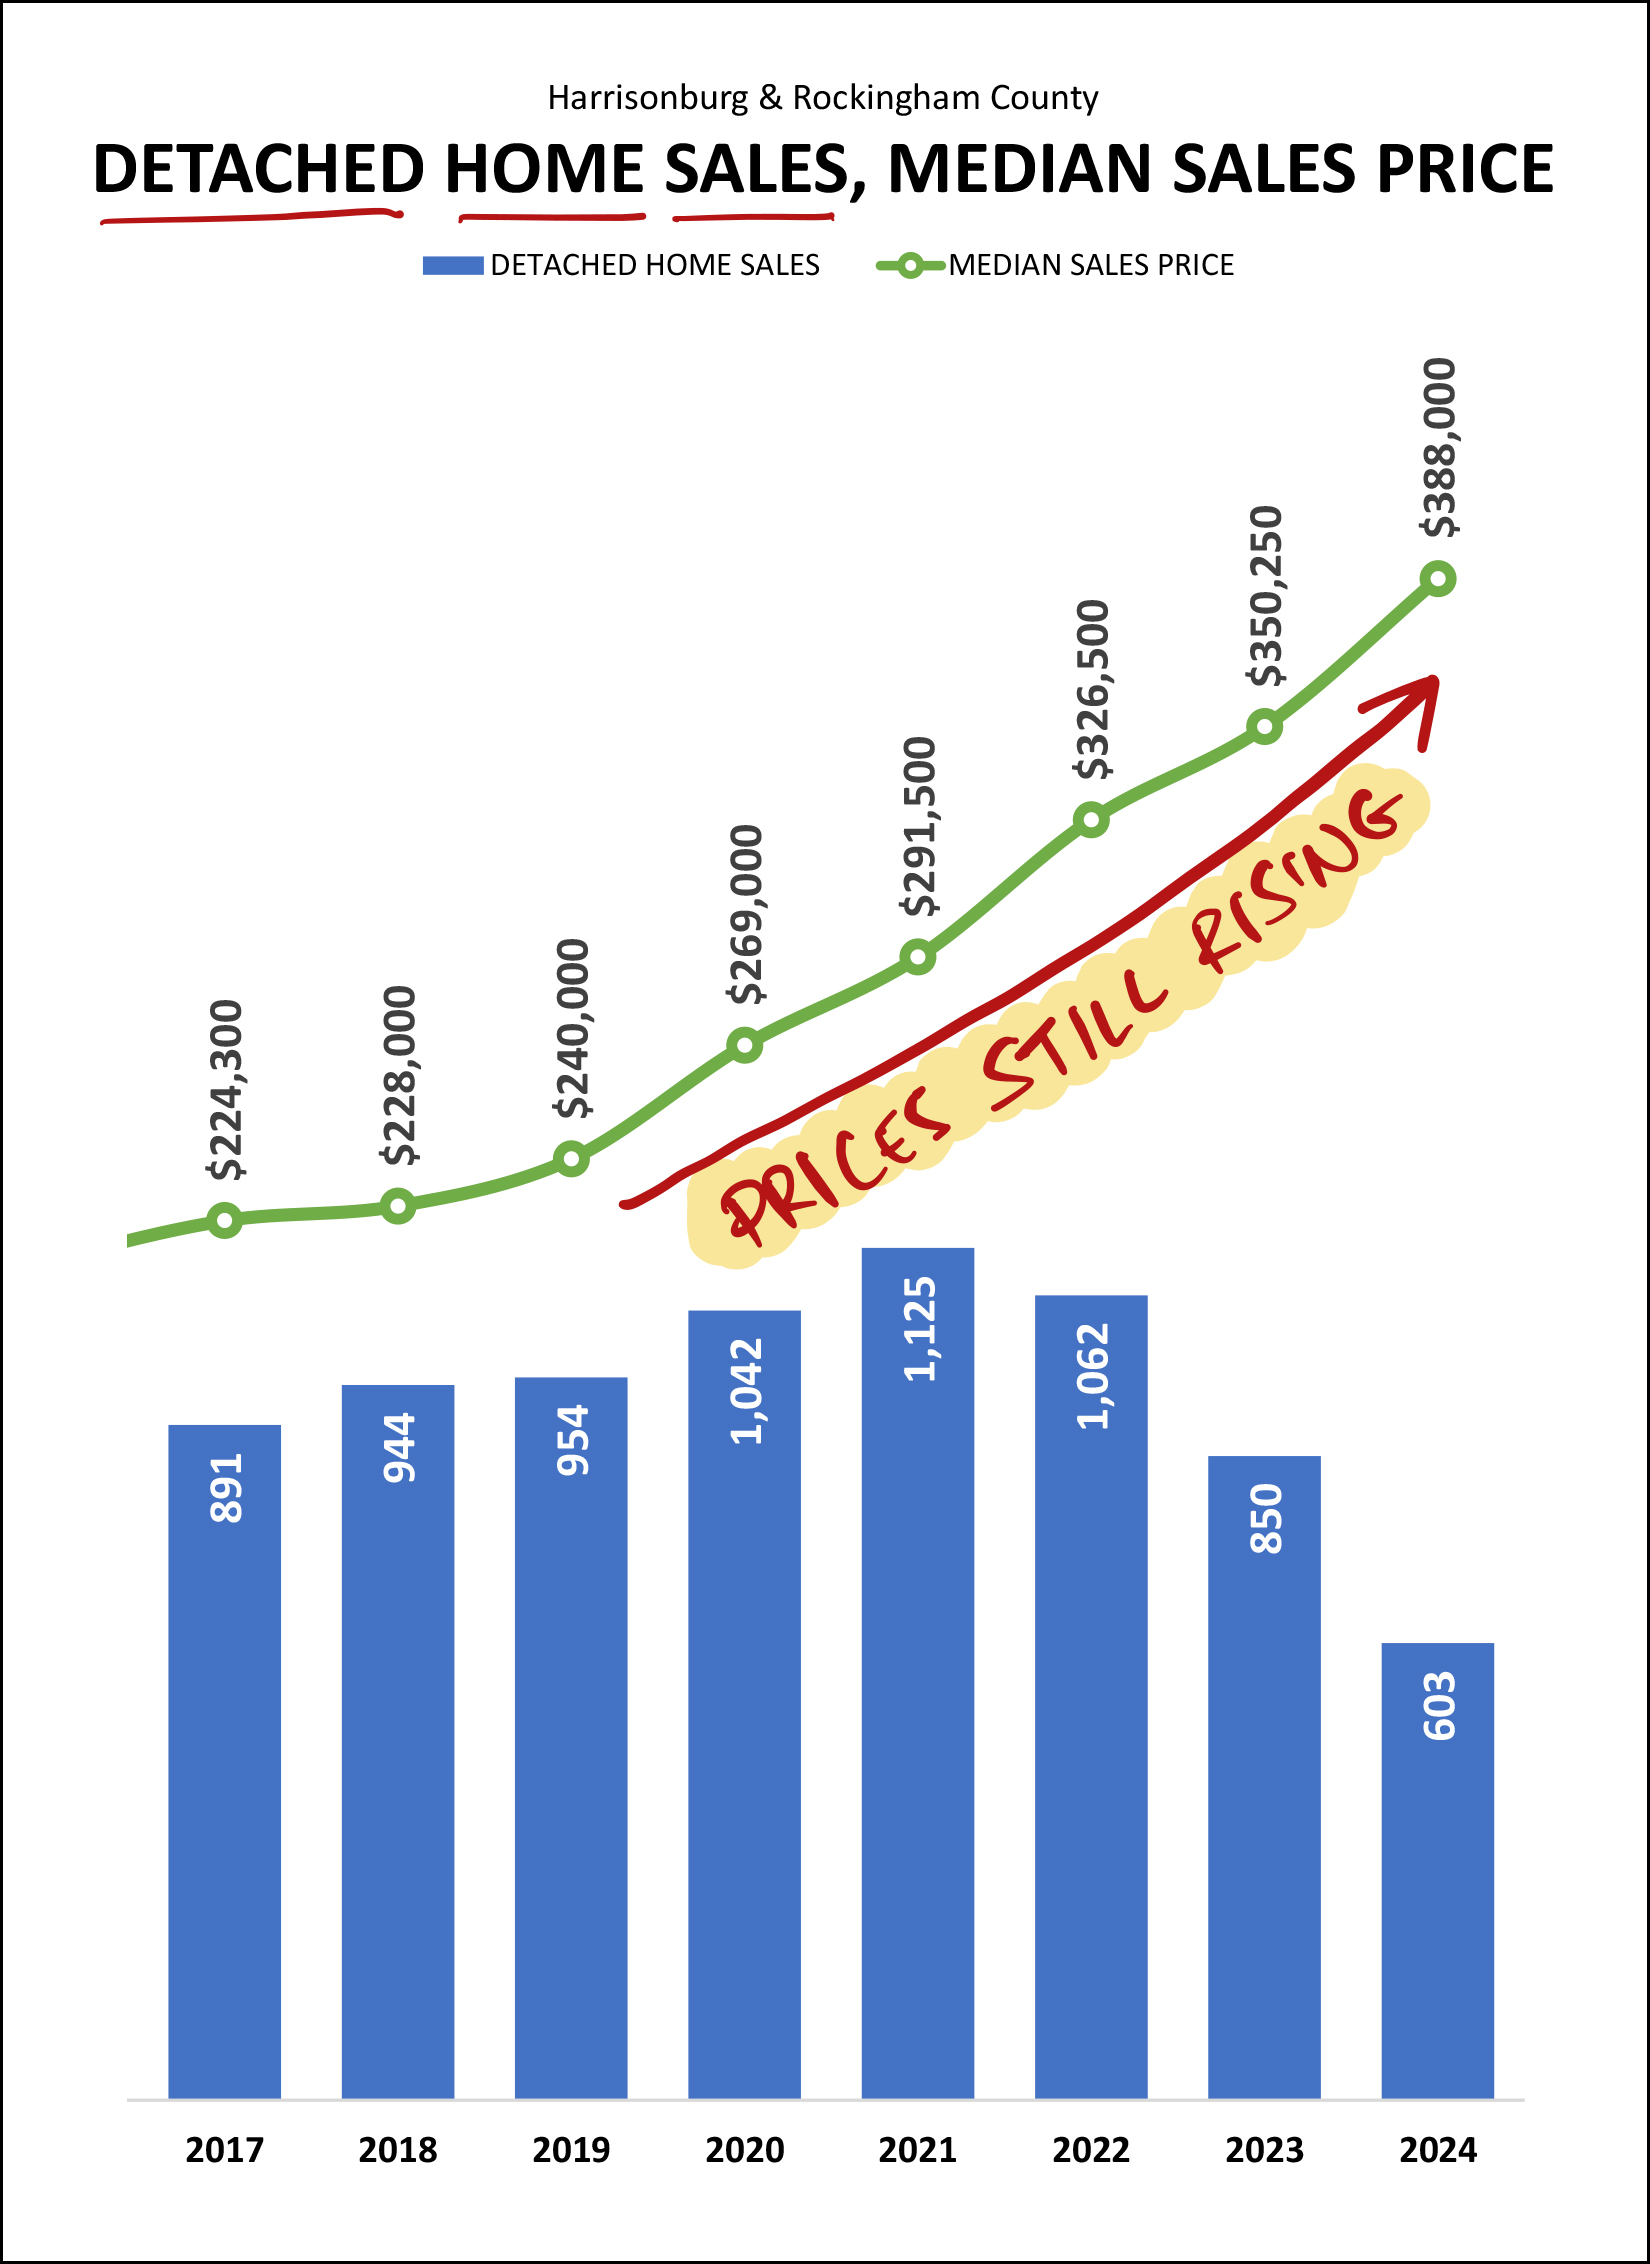 Here's you'll note the *absence* of a flattening out of the median sales price line in green. While the overall market is only seeing a 4% increase in median sales prices in 2024, thus far this year detached homes have been selling at prices that are 11% higher than last year. Earlier I talked about a busy summer of closings which was a result of earlier contract activity. This next graph shows current contract activity, which is a predictor of home sales activity over the next month or two... 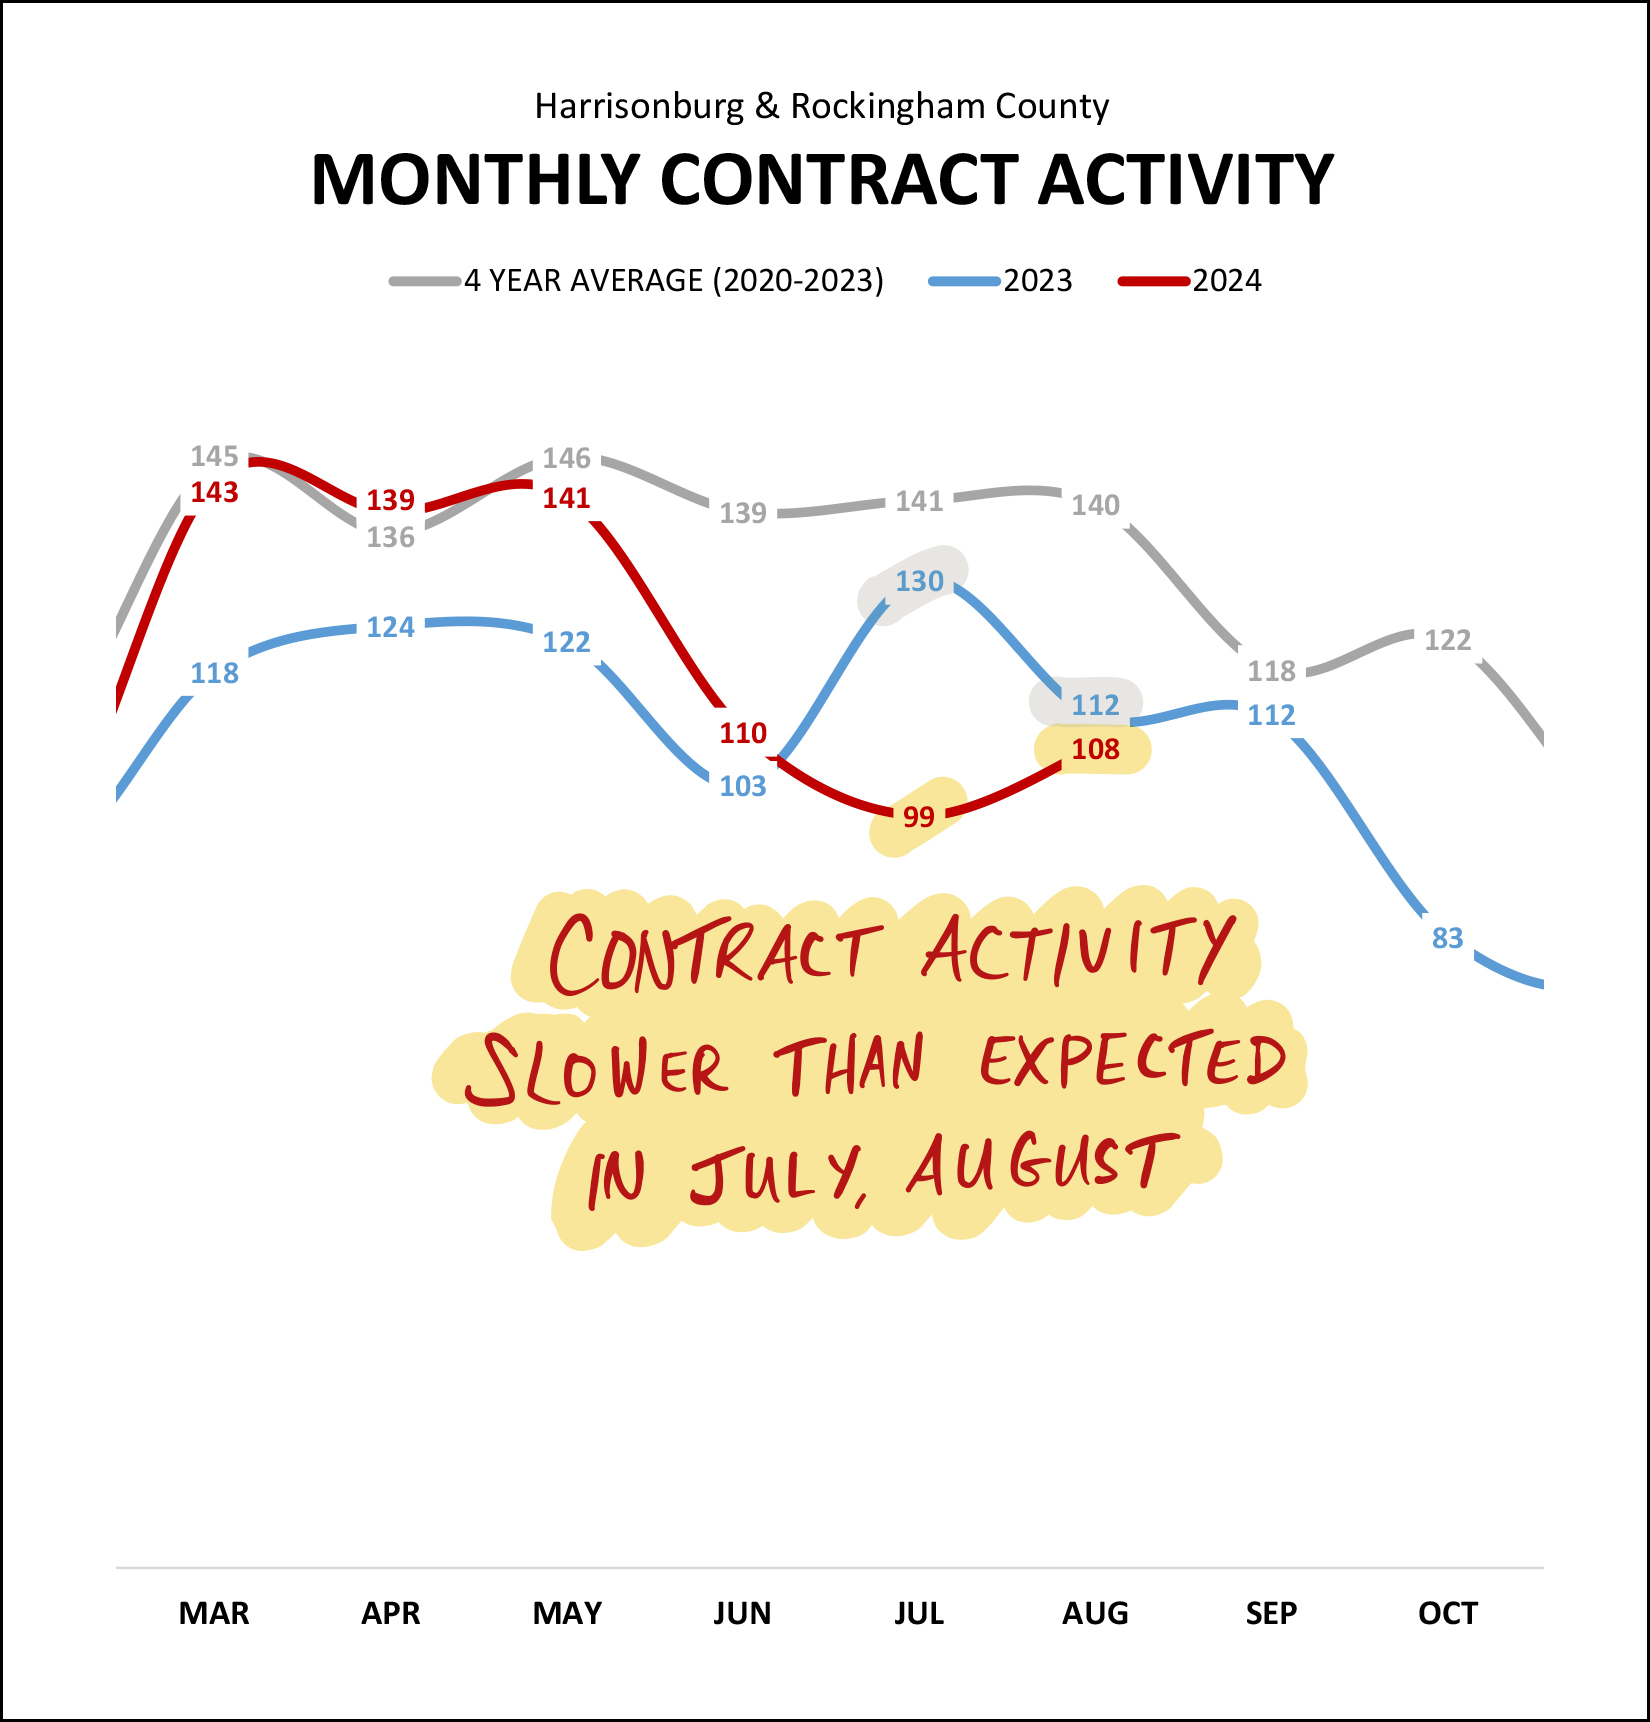 On the left side of the graph above you can see quite a few months of much higher contract activity this year (red line) than last year (blue line) -- particularly in March, April and May. But then, contract activity declined in July and August to levels below where we were a year ago. Looking ahead, we will most likely see a similar number of homes going under contract in September as we did in August, before contract activity likely starts to decline even further in October. This recent slow down in contract activity has also shown up in the pending sales metric, which tracks how many homes are under contract at any given point... 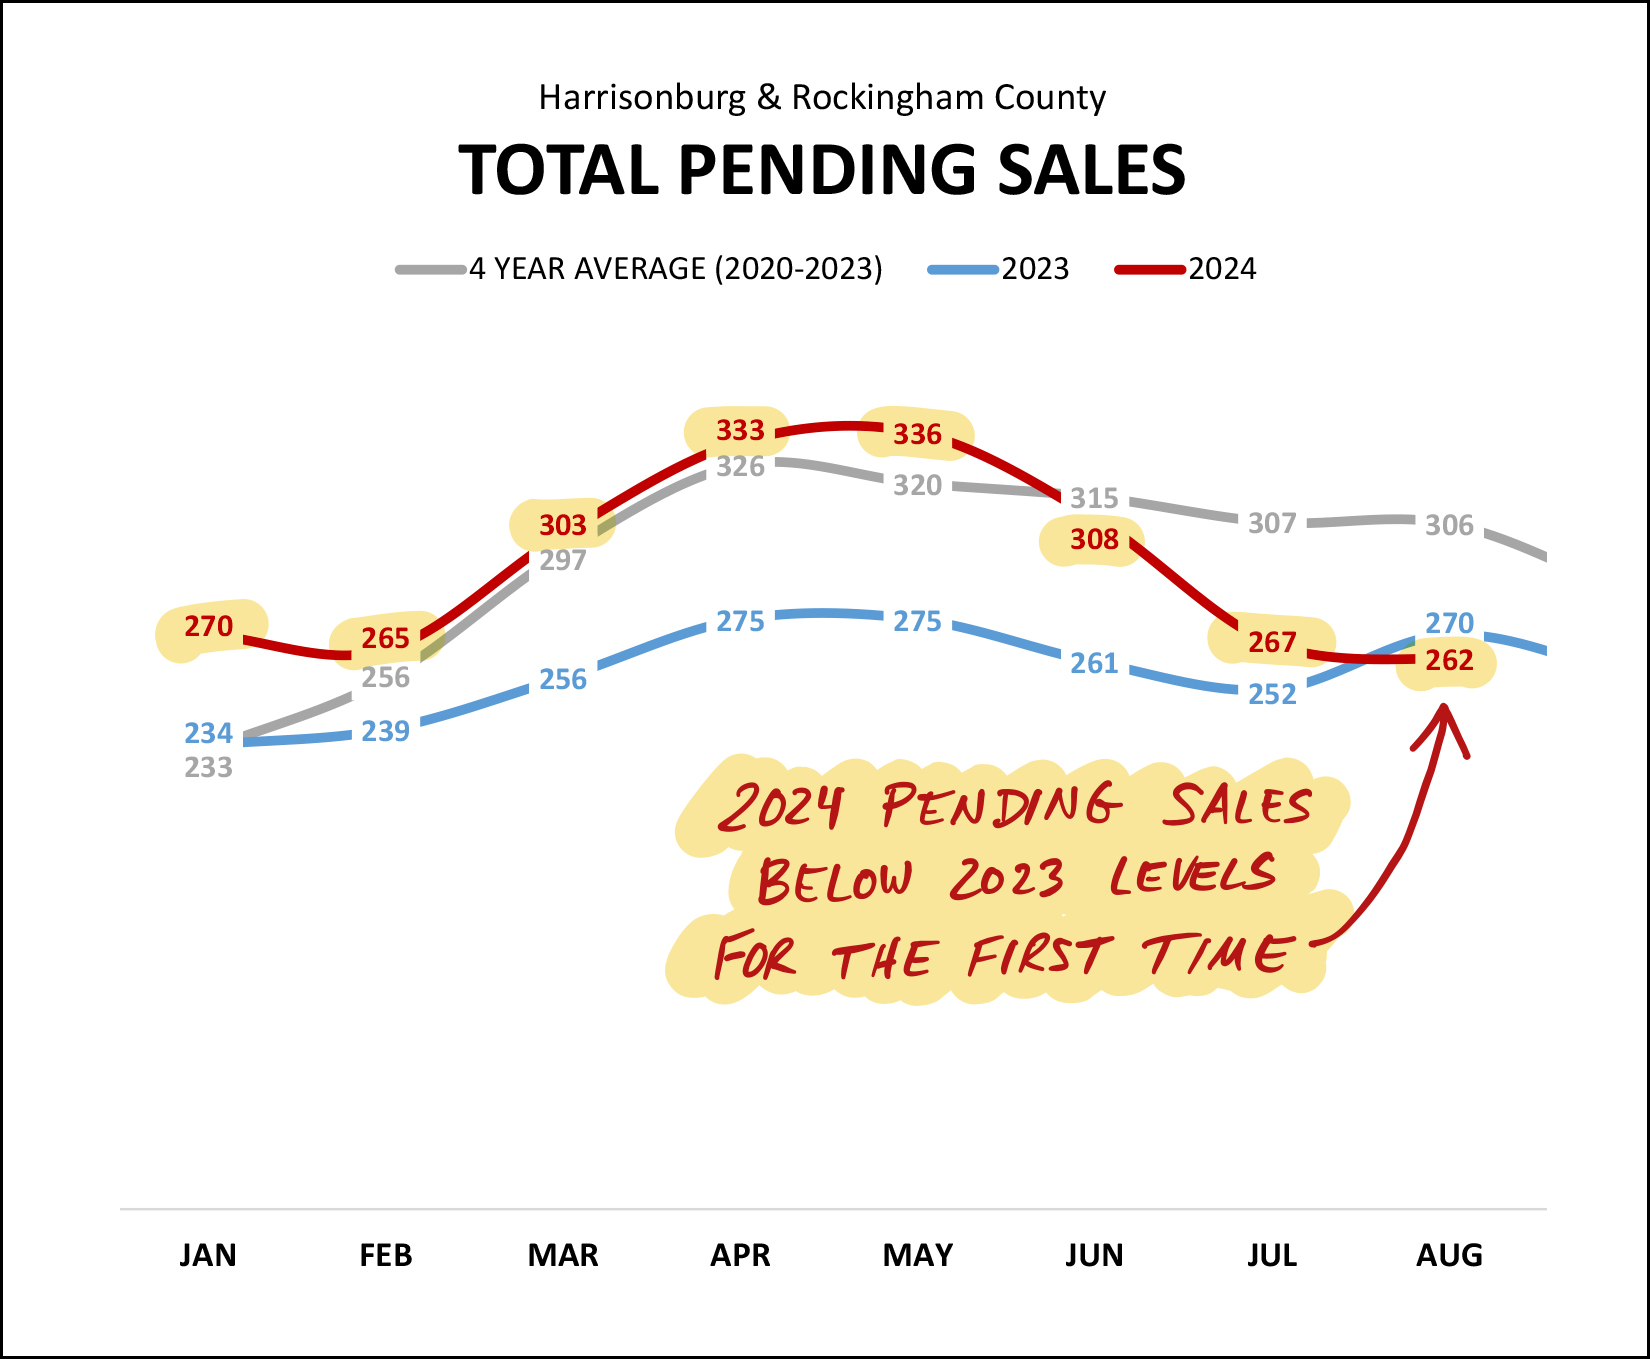 After seven months of riding high above 2023 levels, we have now seen pending sales drop below 2023 levels in August. This is mostly a result of slower months of contract activity in July and August. It's certainly possible that we'll see pending sales pop back up again as we work our way through September and October... but the 2023 and 2024 trajectories have crossed as of the end of August. But wait... if pending sales are declining, that must mean inventory is rising? 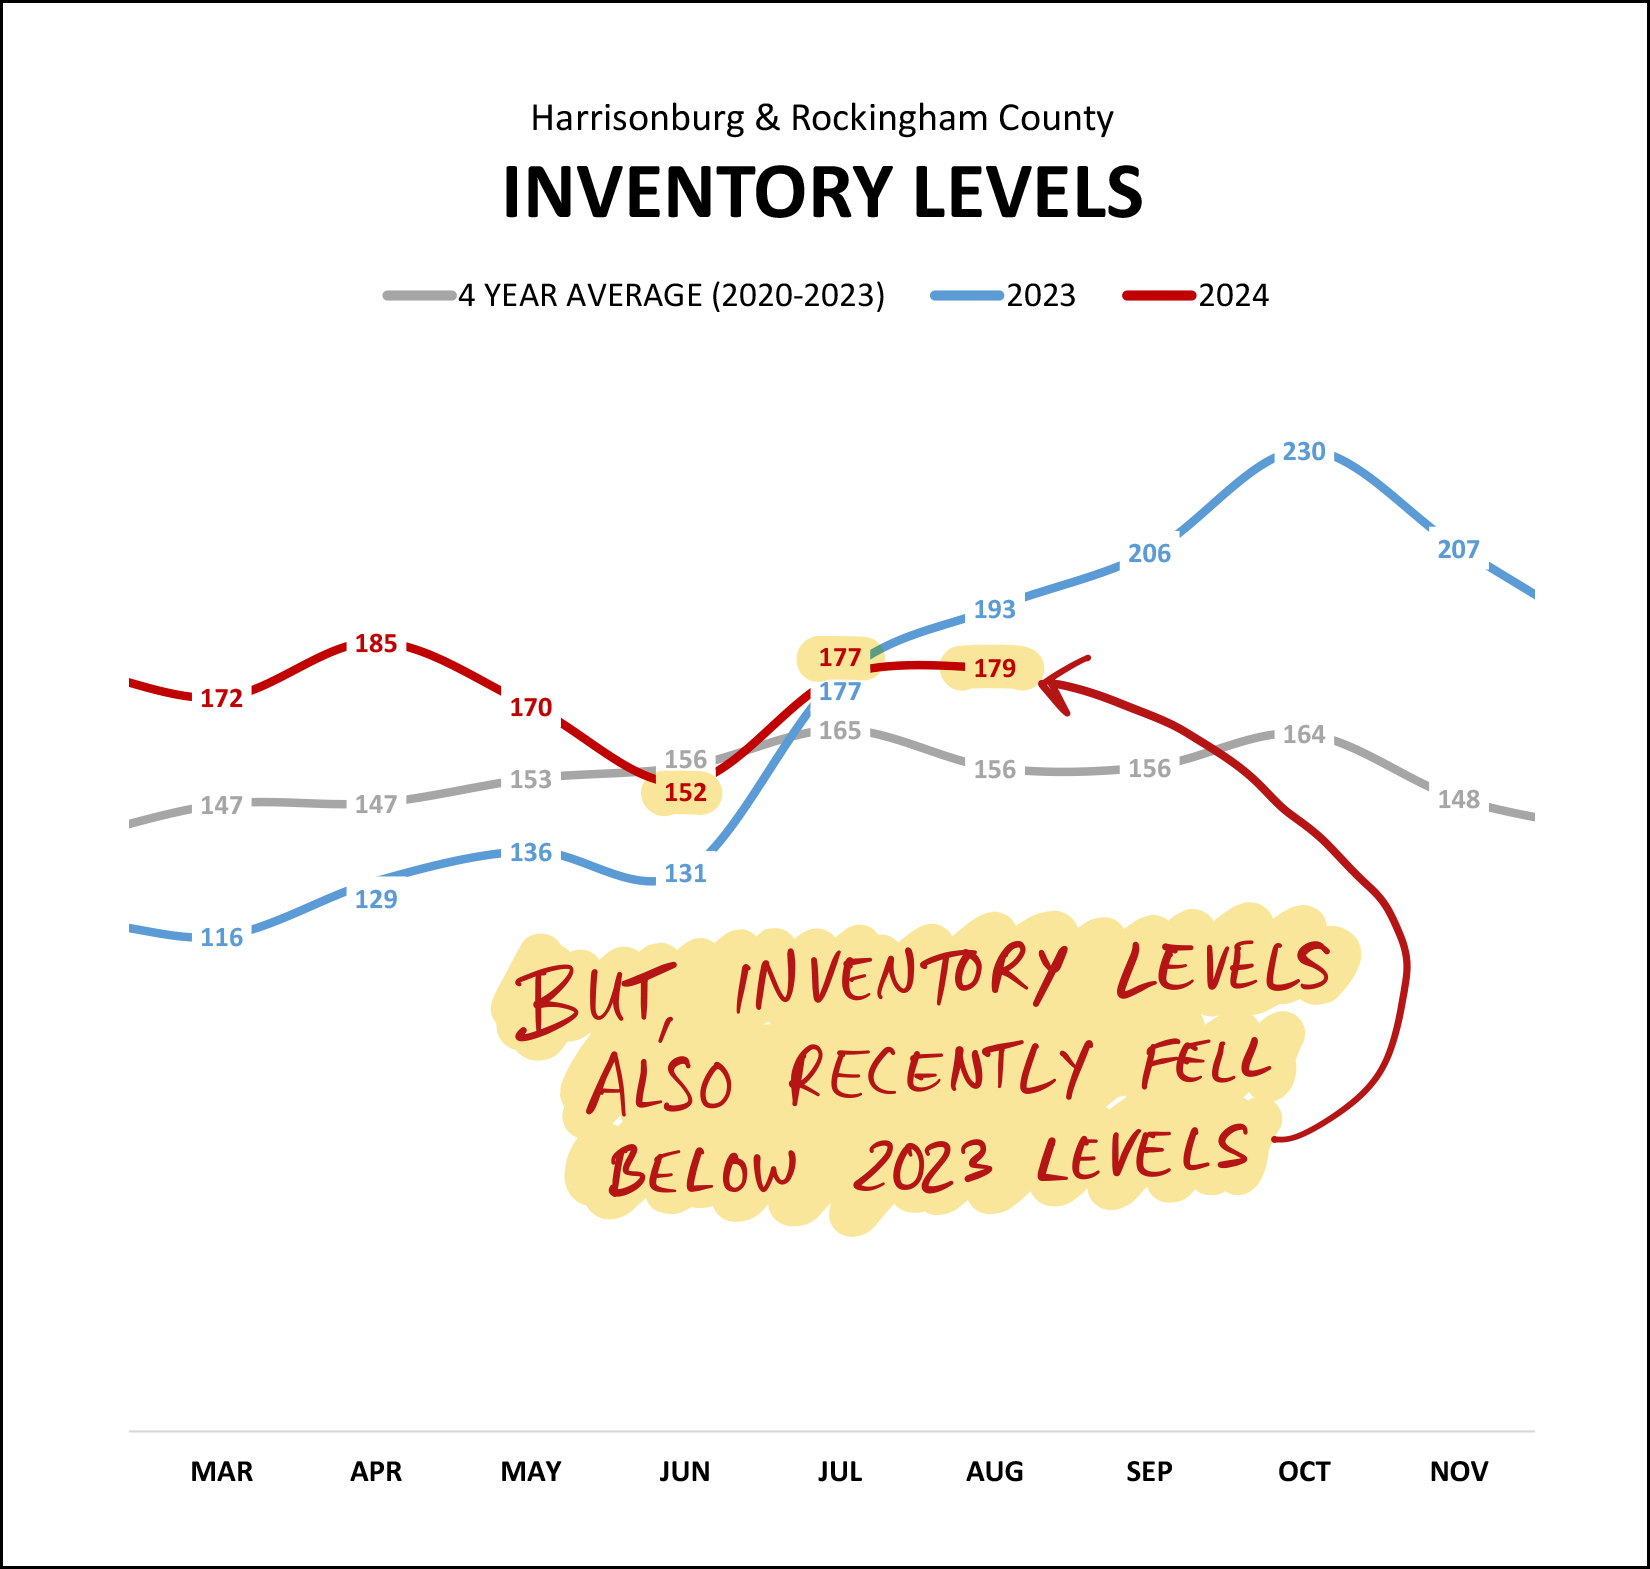 Sorta kinda. Inventory levels dropped to their lowest levels at the end of June... but rose again in July and remained steady at that point in August. Of note... inventory levels consistently climbed last year between June and October... but that was during the exact same timeframe when mortgage interest rates were climbing to their highest levels in 20 years. I do not expect that we will see inventory levels climb that high in September and October this year. But speaking of climbing... will days on market start to climb soon? 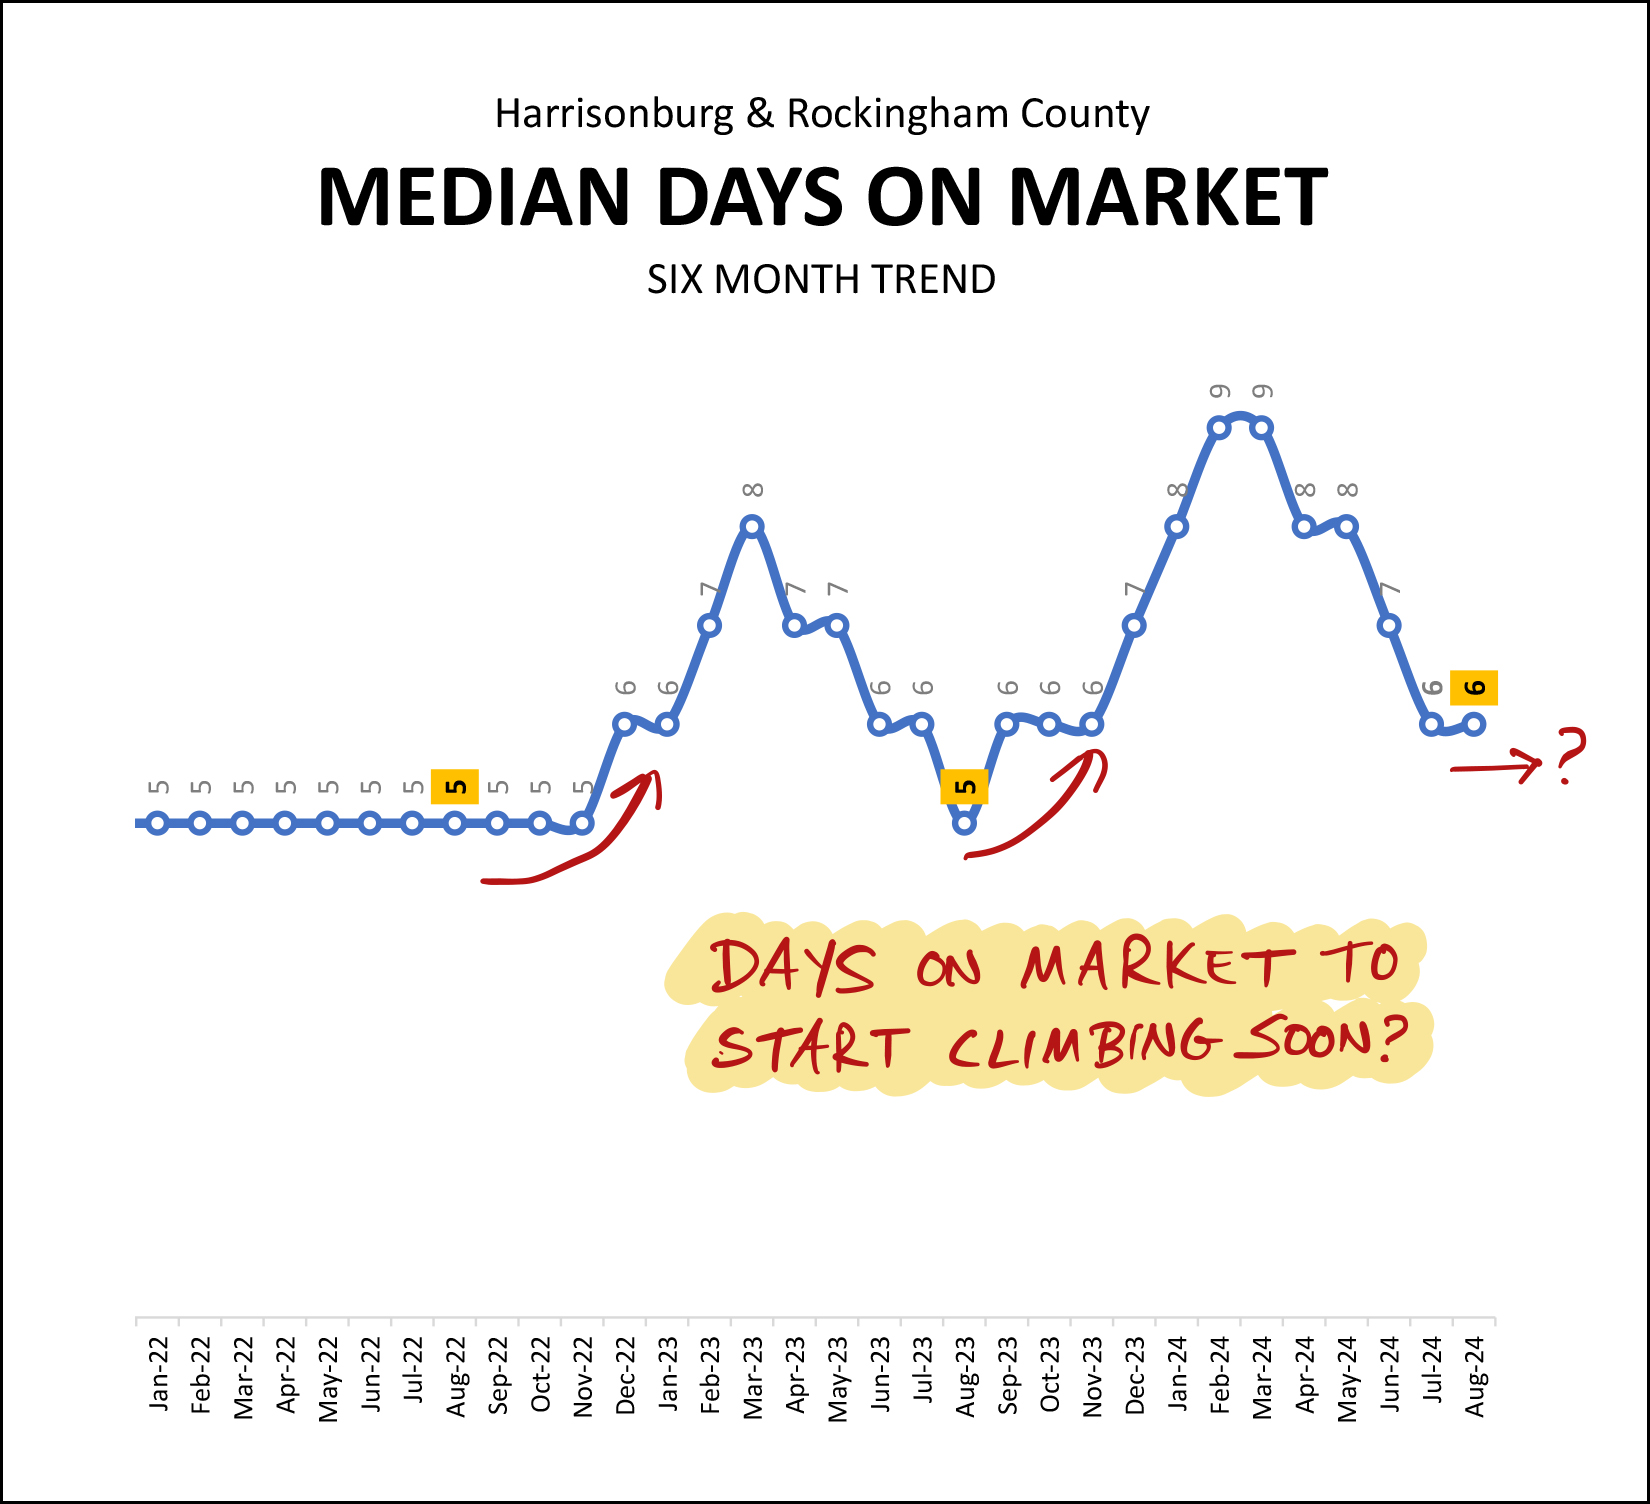 After quite a few years of absurdly, consistently low median days on market, we have seen some variability in this metric over the past two years. That pace at which homes go under contract (days on market) slowed during each of the past fall/winter seasons, so perhaps we'll start seeing that again in 2024. Finally, that one little (or big) number that seems to have been having an oversized impact on the housing market over the past few years... mortgage interest rates... 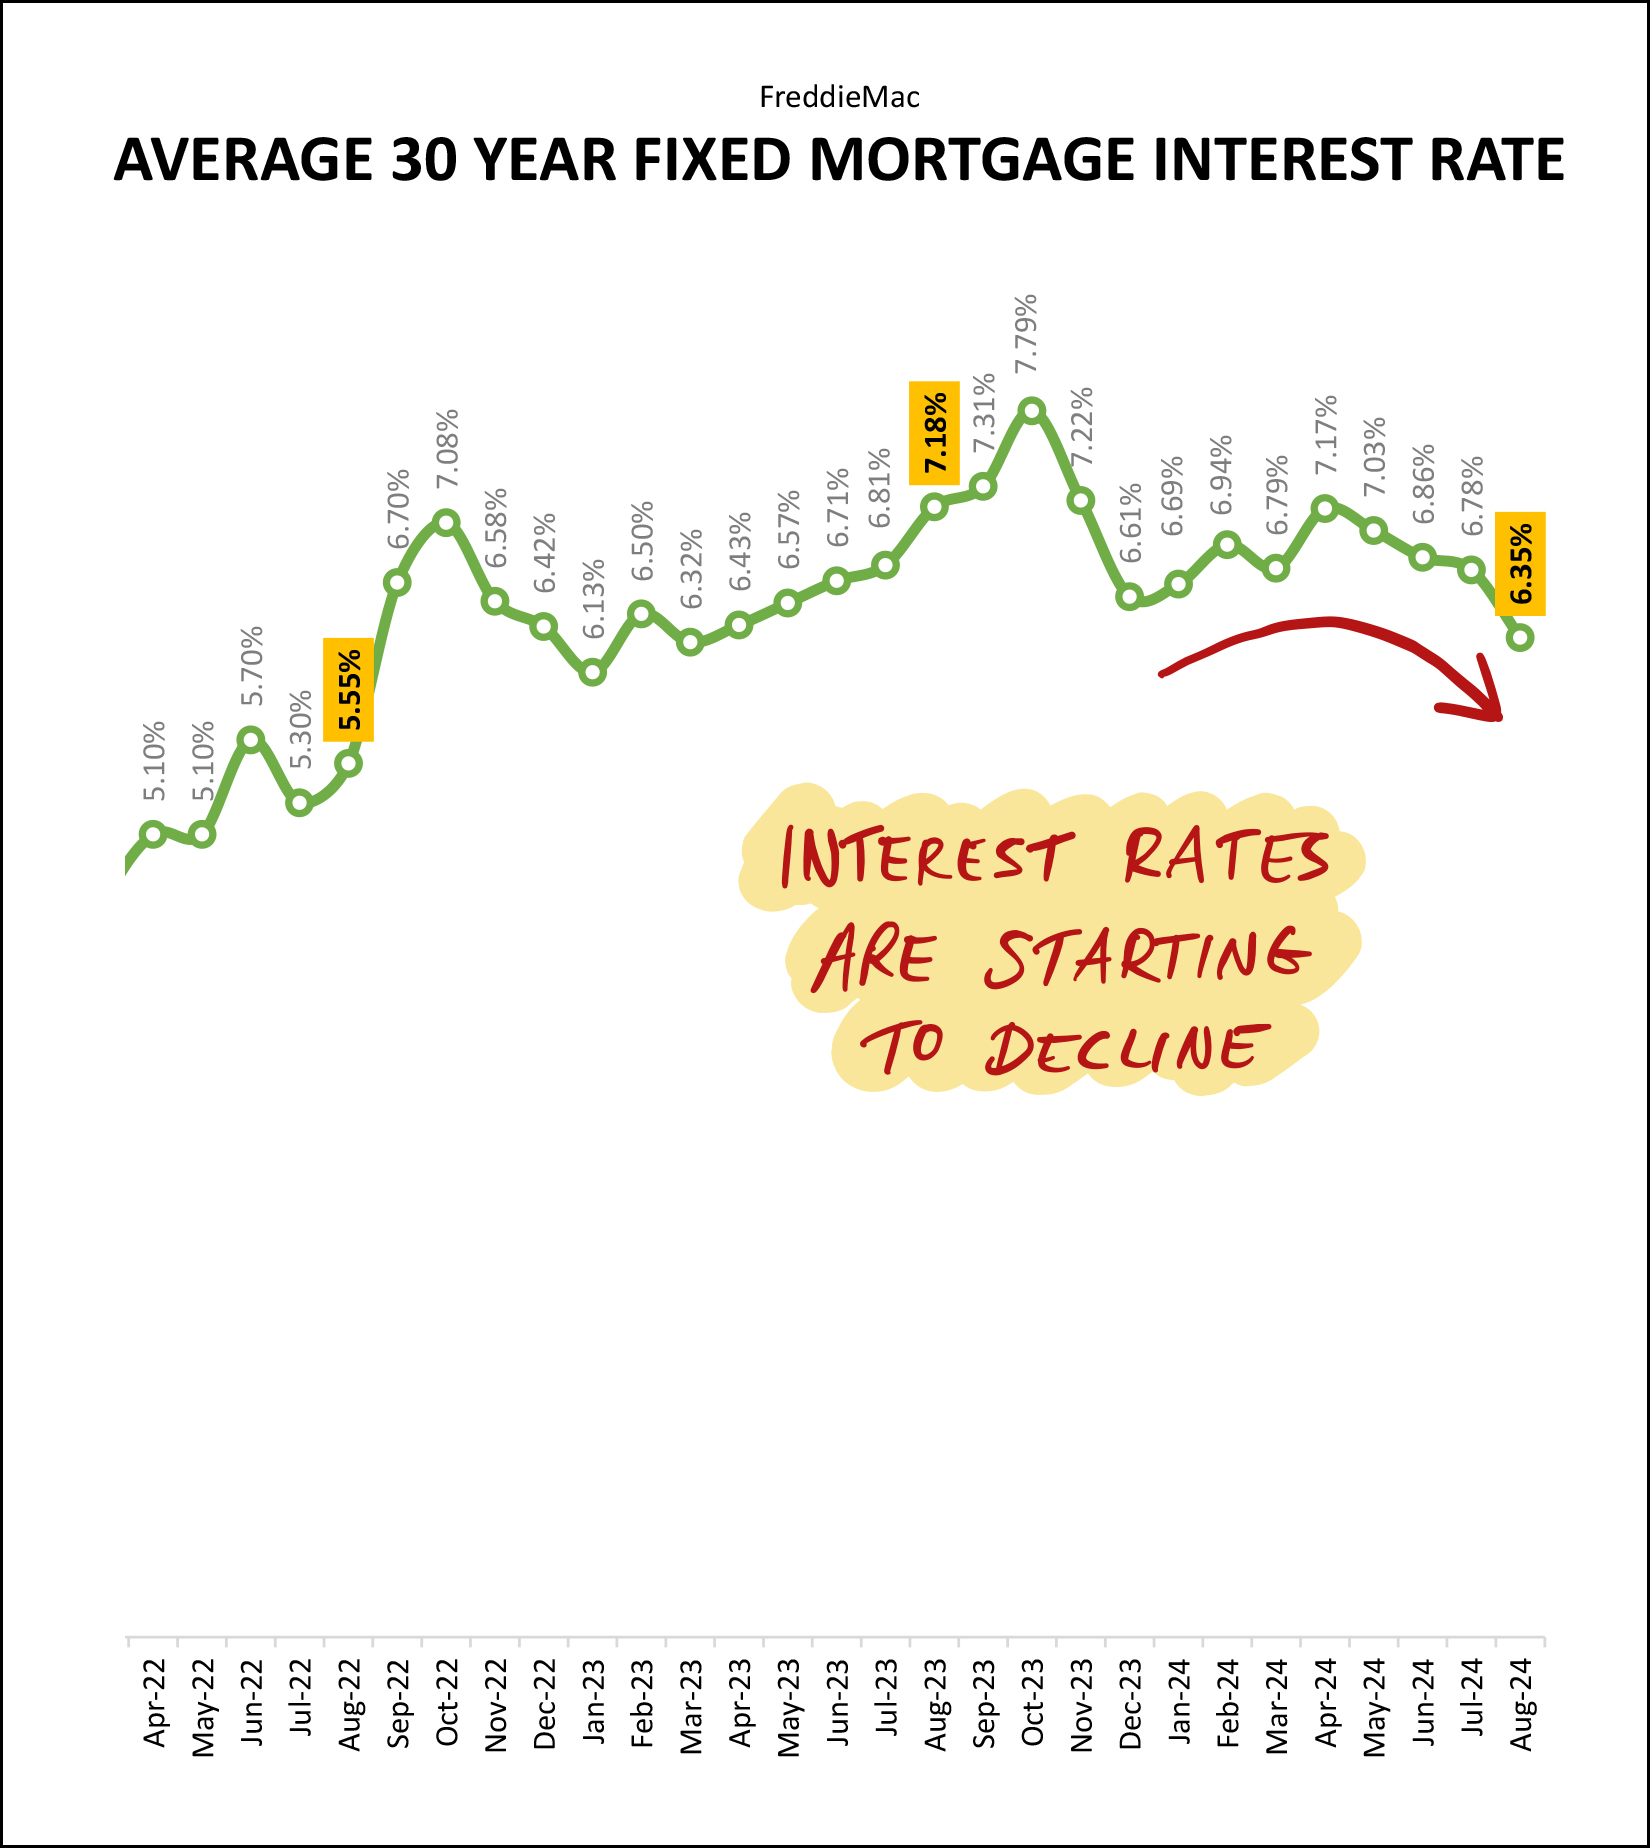 After peaking at 7.79% last October (the highest level in 20+ years) we have started to see some relief in mortgage interest rates -- particularly over the past three to six months. As of June, the average 30 year fixed rate mortgage had fallen below 7%, and now we're closer to 6% than 7%. The Federal Reserve might be announcing a rate cut this Wednesday... though some say that the recent anticipation of that rate cut has already been priced into adjustments in mortgage interest rates. So, let's play a bit of up and down in 2024...
So, as we look ahead at the final three and a half months of the year (yes, that's all that remains) here are a few things to keep in mind... Home Buyers - Many segments of the local market are still rather competitive (multiple offers) but plenty of homes aren't going under contract within two days. Get preapproved now, go see houses quickly when they hit the market, and be prepared to make a rapid, but thoughtful decision about whether to make an offer. Home Sellers - Some, but not all, houses are going under contract quickly. The more broadly appealing your home is to buyers (based on size, location, house features, lot features, etc.) the more quickly we are likely to receive offers. If there are some attributes of your home that disqualify broad segments of the pool of potential buyers, then we are likely to have a longer wait for an offer... and we might have to adjust your list price more than the market data would otherwise suggest in order to inspire a buyer to make an offer. The data and observations I have presented in this market report are a high level overview of our overall market. If you're getting ready to buy or thinking about selling, we should be chatting more specifically about your segment of the market -- what you will be buying, or selling. Feel free to reach out anytime with questions or to set up a time to meet. You can contact me most easily by phone/text at 540-578-0102 or by email here. | |
Fewer City Home Sales, More County Home Sales In 2024 With Higher Prices All Around |
|
 Happy Thursday morning to you! The summer seems to have flown by, and soon school will be starting for many of us... as parents of K-12 students, as parents of college students, as teachers or administrators at a K-12 school or professors or administrators at a local college or university. If you have a such a transition coming up, I hope you had a full and fun and relaxing summer and are excited for the school year ahead.  Shaena, Luke, Emily and I had a fun and fulfilling summer and soon Luke will be starting his second year of college and Emily will start 11th grade. The years fly by quickly! Before we start looking through the latest trends in our local real estate market, each month I offer a giveaway for readers of my market report. This month I'm giving away a $50 gift card to Jack Brown's. If you find me at Jack Brown's it will probably be enjoying one of their delicious burgers and some sweet potato fries. Click here to enter to win the gift card. Now then, where were we... ah, yes, the latest housing market data...  The chart above outlines some of the main trends in our local housing market and a few things stand out to me... [1] We have seen strong sales over the past three months as compared to last year, with a 14% year over year increase in the number of home sales taking place in Harrisonburg and Rockingham County. [2] This latest surge over the past three months (+14%) has been pushing back against the 7% decline in sales when we look at the past 12 months of home sales compared to the 12 months before that. [3] When looking just at the current calendar year, we have seen an 8% increase in the number of home sales taking place in Harrisonburg and Rockingham County in 2024 compared to 2023. ...and on sales prices... [4] Over the past year the median sales price has increased 6% from $318,480 to $337,500. [5] But when we look just at the current year to date (Jan-Jul) we have only seen a 4% increase in the median sales price compared to the same seven months last year. So, we're seeing more home sales in the first seven months of this year compared to the first seven months of last year... but sales prices seem to be rising a bit more slowly than they had been over the past few years. Sneaking a quick glance at detached single family homes, and then attached homes...  The median sales price of detached homes has increased 11% thus far in 2024 as compared to the same timeframe in 2023... to a median sales price of $388,000. That is to say that half of detached homes selling in Harrisonburg and Rockingham County are selling for $388K or more and half are selling for $388K or less. And how about those attached homes...  We have only seen a 5% increase in the median sales price of attached homes... which includes townhomes, duplexes and condos. The median sales price of these properties thus far in 2024 is $310,000... which means that half of the attached homes selling in Harrisonburg and Rockingham County are selling for $310K or more and half are selling for $310K or less. If you're looking to buy a home, the number of opportunities you might have will likely vary depending on if you want to buy in the City or the County. Here's what we're seeing in the City of Harrisonburg...  City home sales (shown above) have declined 17% in the first seven months of 2024 compared to the same timeframe last year. While 200 homeowners sold their homes last January through July, only 167 homeowners sold this January through July. This is largely a supply side issue... fewer sellers selling... not fewer buyers buying. Meanwhile, in Rockingham County...  If you have been hoping to buy a home in Rockingham County, you're in luck, there are many more opportunities to do so than in the City of Harrisonburg. In the first seven months of this year we have seen 17% more home sales in the County than during the same timeframe last year. But... one of the reasons why there are more home sales in the County than in the City is because most new homes currently being built are in the County (not the City) and new home sales are on the rise...  While only 175 new homes sold in the first seven months of 2023... we have seen 227 new home sales during that timeframe this year... which marks a 30% increase in new homes selling in our area. We have not, though, seen a 30% increase in existing homes selling...  We have seen... only a 1% increase in the number of existing homes selling in the first seven months of 2024 as compared to 2023. Looking one year further back on the chart above you'll note that the mid-500-ish home sellers who sold during this timeframe in 2023 and 2024 is well below the 708 existing home sales seen during that timeframe in 2022. Mortgage interest rates being what they are continues to impact how many homeowners are willing to sell their home. And now, some graphs to provide some visual insights into these latest trends...  May, June and July have been busy months for home buyers and sellers this year with a total of 401 home sales... as compared to only 352 in the same three months last year. Looking ahead, we are likely to see fewer home sales taking place in August if we track along last year's trend. These last three months have helped 2024 eek ahead of 2023...  After a significant decline in the number of homes selling in our area (1600-ish down to 1200-ish) between 2022 and 2023 we are now seeing a modest increase in home sales activity in 2024. The 789 home sales thus far in 2024 exceeds the 730 seen last year through the end of July, though it is well below the 943 seen in January through July of 2022. And as we have been seeing for quite a few months now, sales are slowly rising and price increases might be slowing a bit...  The bottom blue line, above, shows the annual pace of home sales in Harrisonburg and Rockingham County - measured monthly. Over the past seven months we have been (mostly) seeing this pace of home sales trend upwards. The top green line, above, shows the annualized median sales price in Harrisonburg and Rockingham County - measured monthly. We are still seeing steady increase in the median sales price, but it is not increasing quite as quickly as it has over the past few years. But of note... the median sales price of *detached* home sales is definitely still steadily increasing...  Market-wide median sales price trends can be affected by how many detached vs. attached homes are selling... or how many new vs. resale homes are selling. While the median sales price in our overall market is trending upwards a bit more slowly than in recent years, the detached median sales price is still *steadily* increasing. Just three years ago the median sales price of a detached home was just below $300K and now we are edging closer and closer to $400K. Lots of circles and arrows on this next graph... focus, folks, focus...  The graph above shows the number of contracts being signed each month. We saw much higher levels of contract activity this March, April and May than we did last March, April and May. Then, contract activity in June was about where it was last June... and July contracts were well below levels seen last July. This likely means that we will see fewer closed sales over the next few months, which is confirmed by the latest pending sales trends...  The number of pending sales (under contract homes) peaked in May 2024 and has been declining ever since. That said, current levels (267 pending sales) are still above where we were a year ago (252 pending sales) in Harrisonburg and Rockingham County. Another quirky metric of late has been inventory levels...  Inventory levels (the number of homes for sale at any given time) were steadily trending now between April and June, and then popped back up again in July 2024. The blue line above shows inventory levels last year and you can see a similar increase between the end of June and the end of July... so the increase this year is not unexpected, but does run counter to the steady decreases we had been seeing over the past few months. This following graph, tracking median days on market, has become much more interesting over the past year and a half...  For quite a few years (see the first third of the graph above) the median sales on market was sticking right around five days, regardless of the time of year. All homes were selling very quickly at all times of year. Now, we seem to be seeing a bit more seasonality in this trend, with median days on market (how quickly homes go under contract after they are listed for sale) trending upwards through the fall and winter and then back downwards in the spring and summer. So, don't be surprised if median days on market starts to rise again over the next few months. And finally, one of the main drivers of buying and selling activity of late...  Those darn, silly, pesky, mortgage interest rates. As mortgage interest rates rise, the cost of a monthly housing payment rises, assuming the same sales price. Over the past few years we have seen steadily rising home prices AND rising mortgage interest rates. When we see higher rates, buyers aren't quite as capable or as interested in buying... and sellers (if they would have to then buy again) aren't quite as interested in selling. If or as or when we see mortgage interest rates start trending downwards, we will likely see more buyers AND sellers enter the market. As noted above, during August, rates have fallen even further than shown on the graph... down to 6.47% and I have seen some buyers locking in as low as 5.99% recently. So, having absorbed all of those insights into the latest trends in our local housing market, what does it all mean for you? If you are thinking about buying a home in the next few months... things might see a smidge more hopeful. Mortgage interest rates are trending down a bit. Inventory levels are trending up a bit. Days on market might trend upwards a touch. Many segments of the market are still moving very quickly and are still very competitive, but not all segments of the market. Depending on what type of property you want to buy, and its location, and its price range -- you might be competing with multiple other buyers within a day of a house being listed for sale -- or you might actually be able to sleep on your decision about whether to make an offer on a new listing. If you are thinking about selling your home in the next few months... it is still relatively likely that it will sell quickly and almost certainly at a very pleasing price... but all property types, locations and price ranges are not performing equally right now. We'll want to dive a bit deeper into the data related to your specific home to devise the best pricing strategy and to give you reasonable expectations as to how quickly your home will sell. If you have questions about buying, selling, the process, the market or anything else, you are more than welcome to reach out anytime. You can contact me most easily by phone/text at 540-578-0102 or by email here. All the best to your and your family as this new school year begins... and if you don't have anyone in your life starting a school year, then just get excited about the eventual return of cooler temperatures as we head into the autumn months. :-) | |
May 2024 Home Sales Outpace Projections, With Median Prices Increasing More Slowly |
|
 Happy Monday, friends, and Happy Summer! Summer is well underway over here at the Rogers household, with Luke having finished his first year of college and Emily wrapping up 10th grade. The start of our summer has included getting away for a few days to the lake for some water skiing and tubing, celebrating my niece's graduation (congrats Sofia!) and looking forward to Red Wing Roots Music Festival in less than two weeks! I hope your summer is off to a great start and that you'll find some time to relax or get away for a few days at some point this summer.  Before we dive into the lake, or rather, the real estate data... each month I offer a giveaway for readers of my market report. This month I'm giving away a $50 gift card to Bruster's. Yes, I realize that is a lot of ice cream... but they have SO many delicious flavors! Click here to enter to win the gift card. Now, on to the latest happenings in our local housing market... 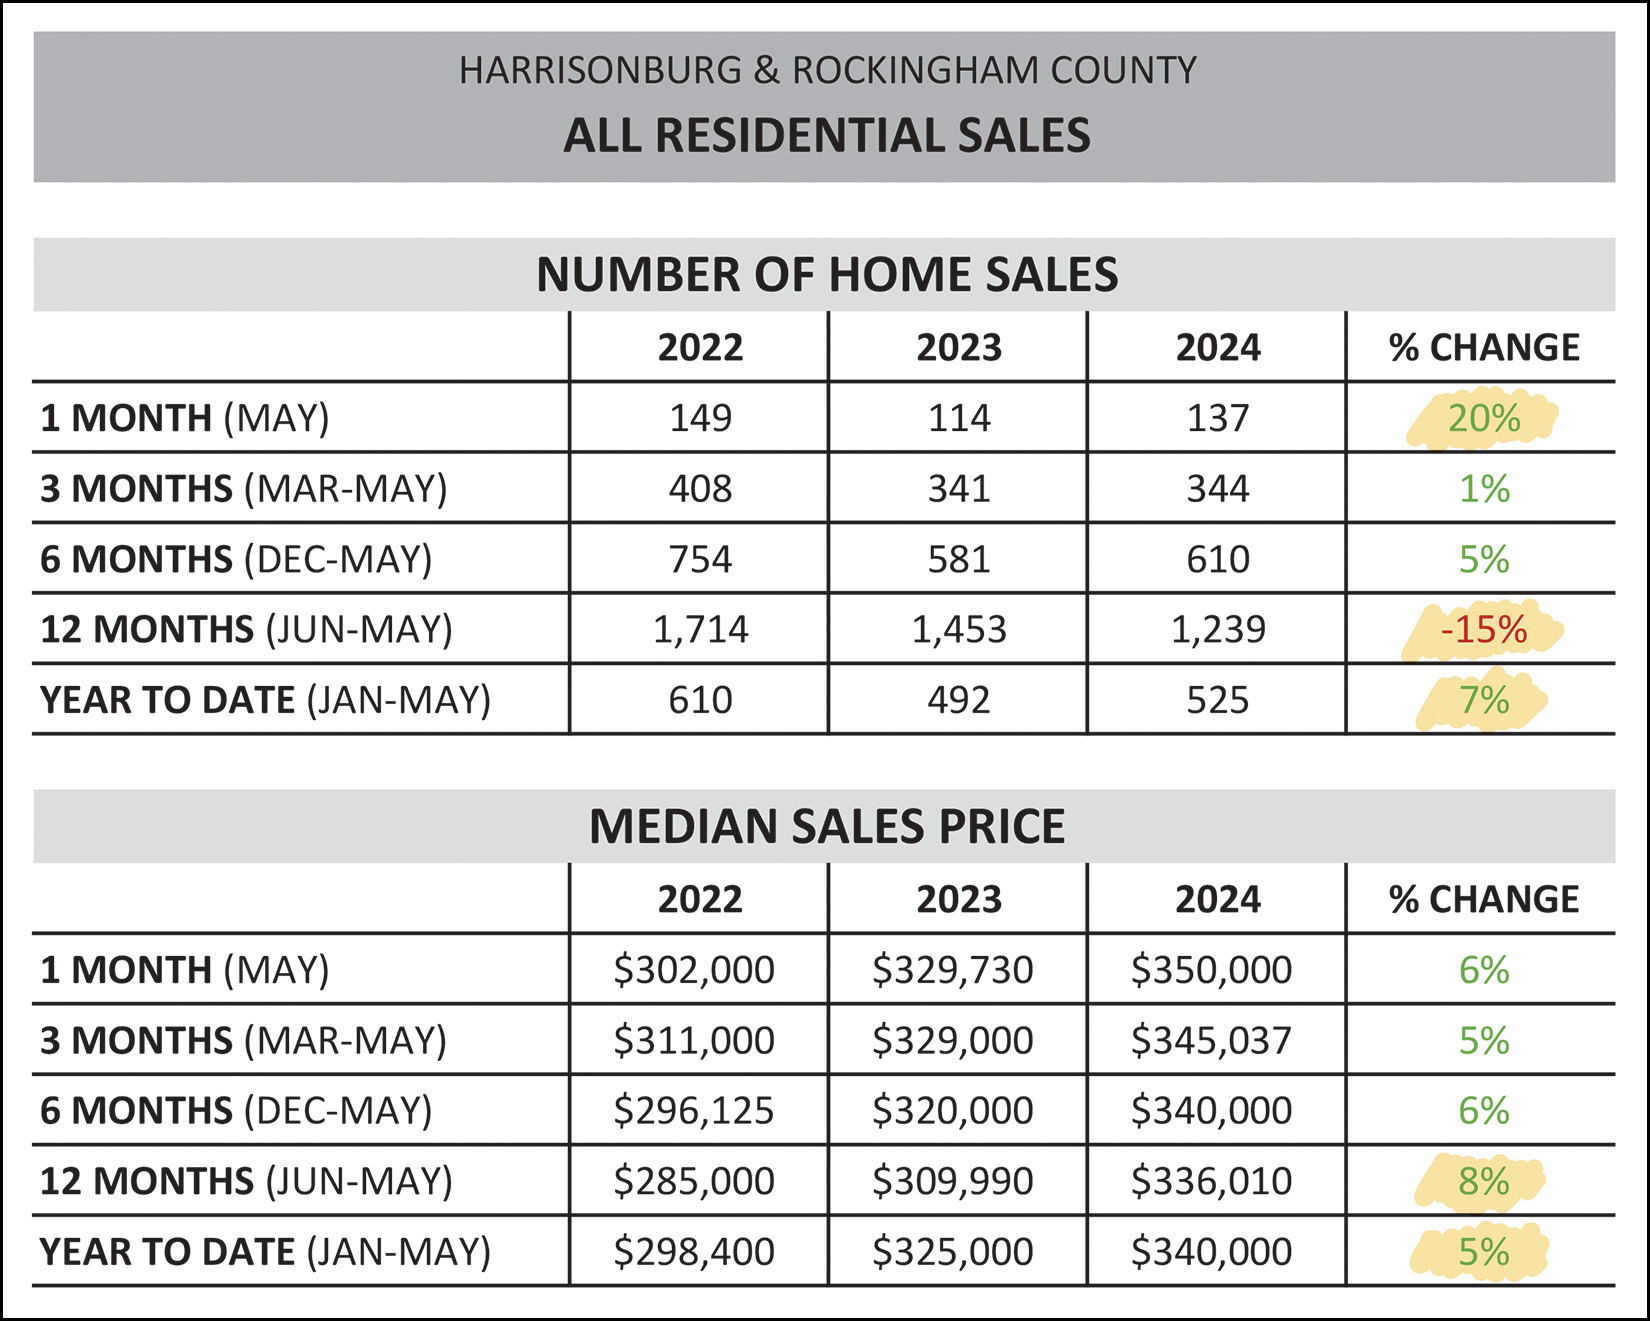 Above you'll find the basic numbers related to how many homes are selling in Harrisonburg and Rockingham County and the prices at which those homes are selling. Here are a few things that stand out to me... [1] Home sales this May (last month) were much higher than expected... with 20% more sales than last May. [2] Despite seeing a 15% decline in the number of home sales in the past 12 months compared to the 12 months before that, we are now seeing a 7% increase in year to date home sales, thanks in part to the strong month of sales in May. [3] You might recall that for the past few years we have been seeing a (surprising) 10% increase in the median sales price each year. The median sales price over the past 12 months ($336,010) is now 8% higher than in the 12 months before that -- and the year to date median sales price is only 5% higher than in 2023 year to date. Thus, it seems that the median sales price may be increasing a bit more slowly this year than in recent years. Looking for a moment just at detached single family homes... 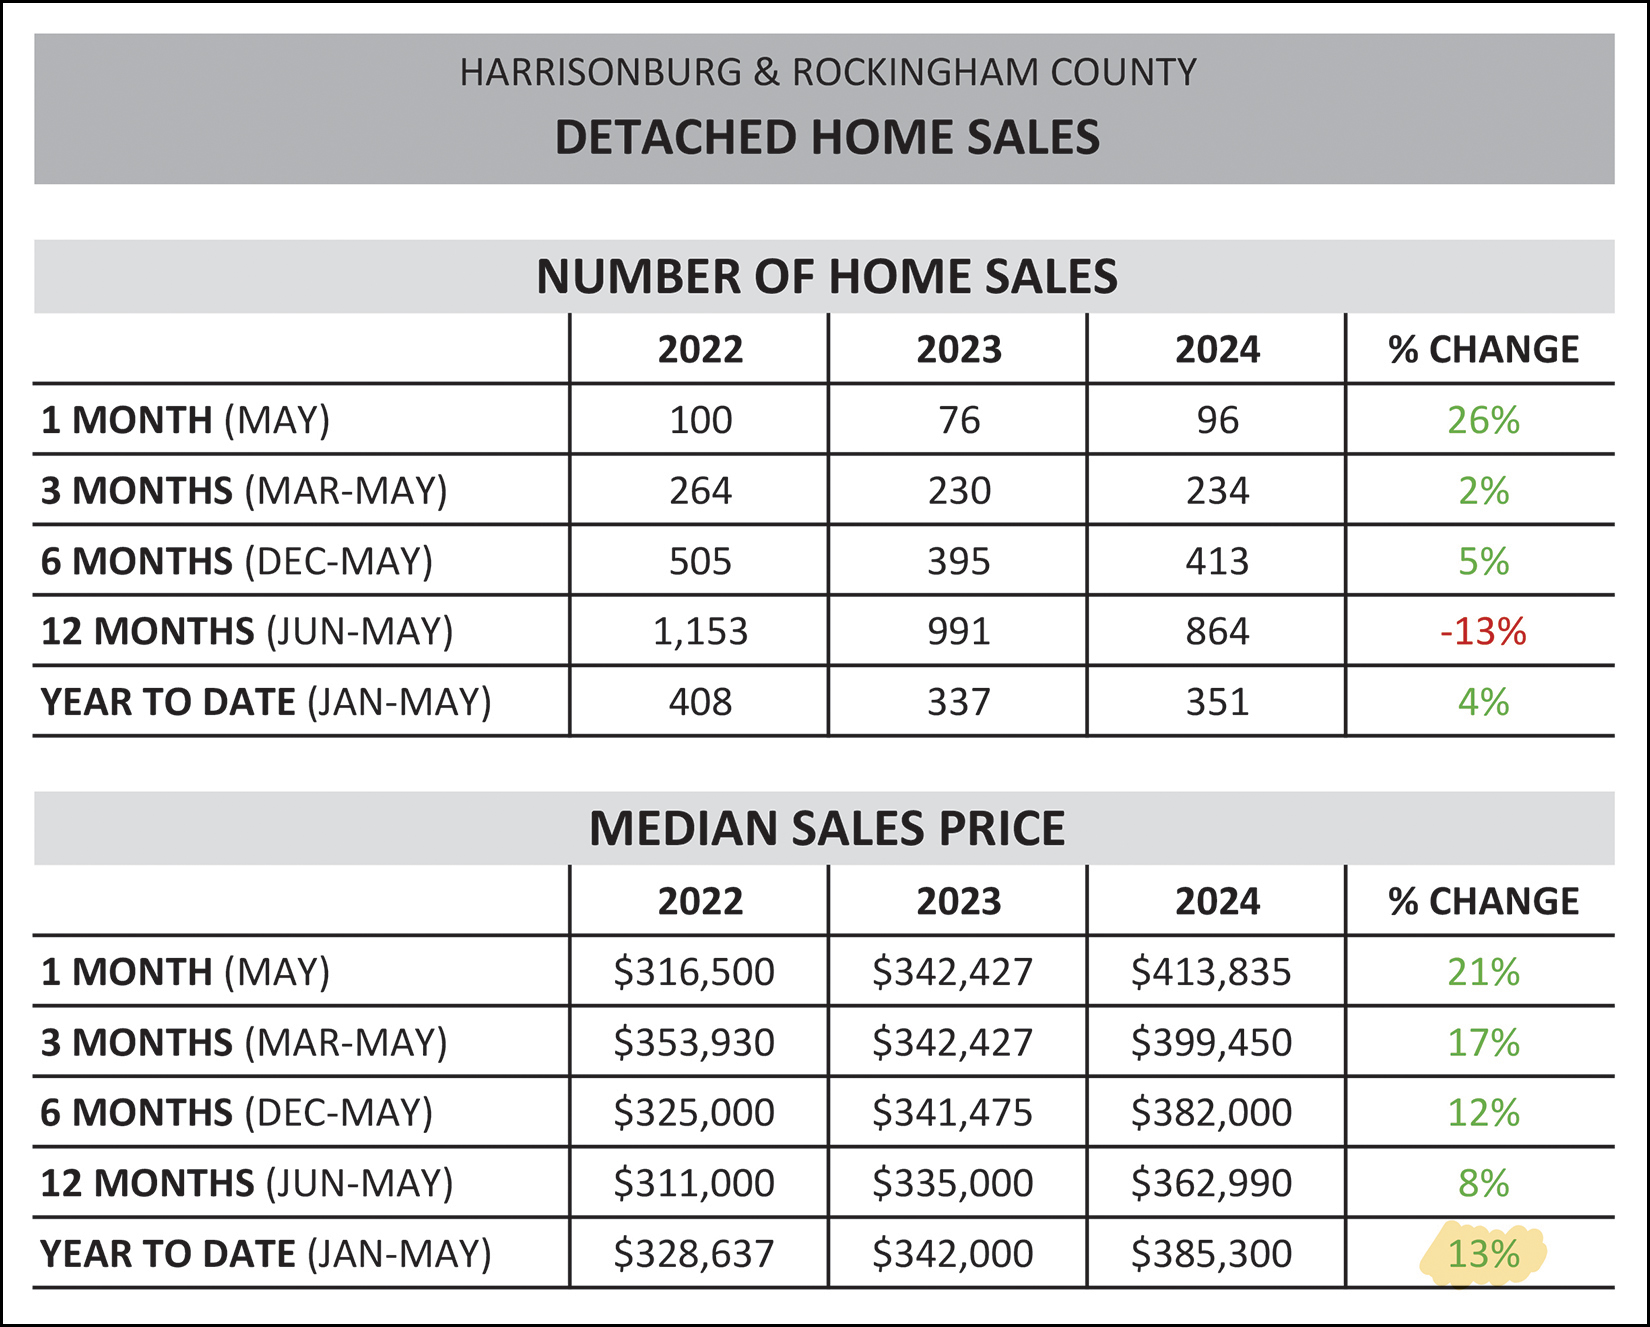 Sometimes it can be helpful to look only at detached home sales to see how they are comparing compared to the overall market. This month I am noting that the median sales price of all homes sold has only increased by 5% year to date (from $325K to $340K) but the median sales price of detached homes has increased by 13% year to date (from $342K to $385K). If you're trying to buy a home, you are likely paying a higher price now than you would have a year ago. If you are trying to buy a detached single family home, you are likely paying a much higher price now than you would have a year ago. As one final subset of the overall market data, here's a look at only existing homes... excluding new construction homes... 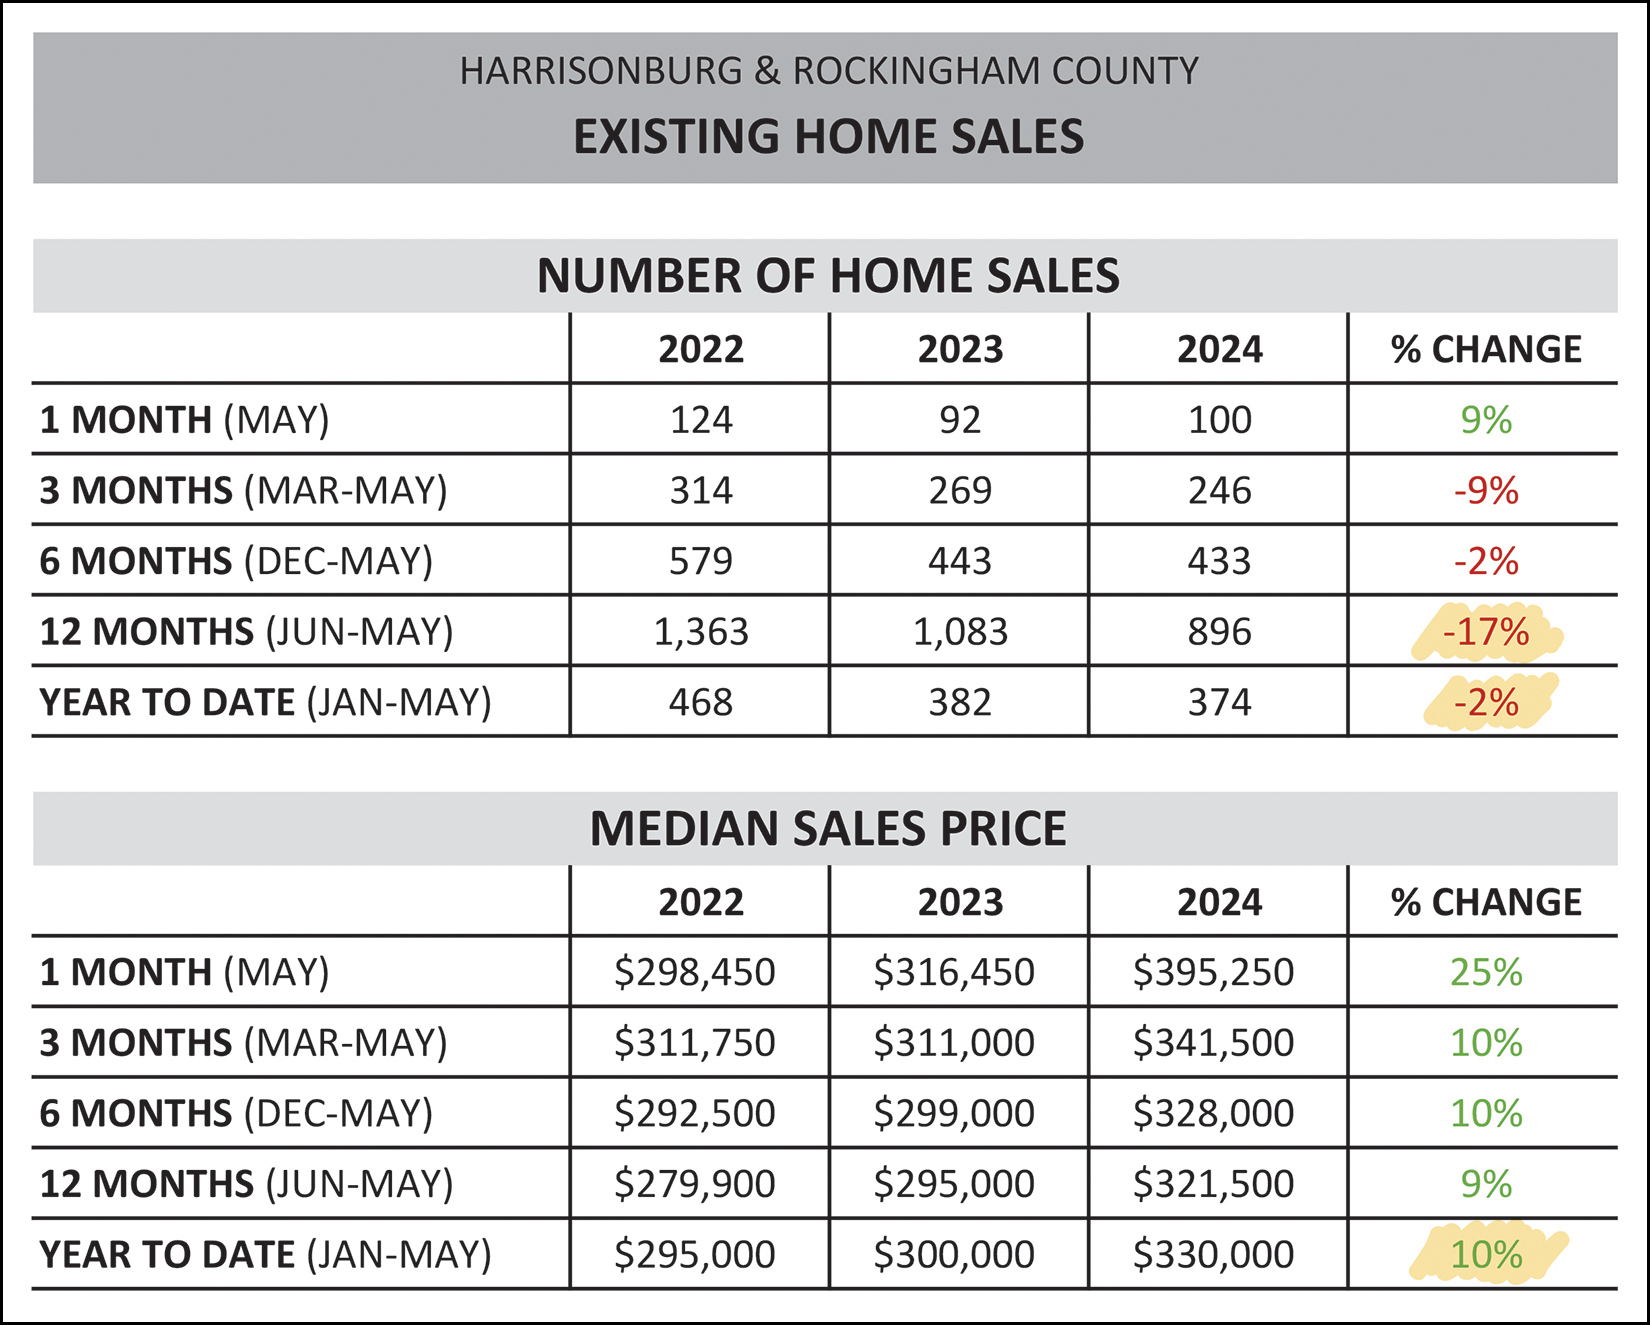 If you don't happen to want to buy a new home (based on their size, location, price, etc.) then you'll be focusing just on resale homes -- and there have been far fewer of those home sales over the past 12 months. We have seen 17% fewer resale home sales over the past 12 months (compared to the 12 months before that) mostly due to sellers not selling - rather than buyers not buying. In slightly better news, we have only seen a 2% decline in existing home sales year to date, so as to say that the decline is slowing in the number of existing homes that are selling. Perhaps it is unsurprising then that the median sales price of existing homes is 10% higher this year to date compared to last year to date, which shows a higher rate of increasing prices for existing homes as compared to the overall market. Now, I started off by mentioning that May home sales exceeded expectations... and you can see that more clearly here... 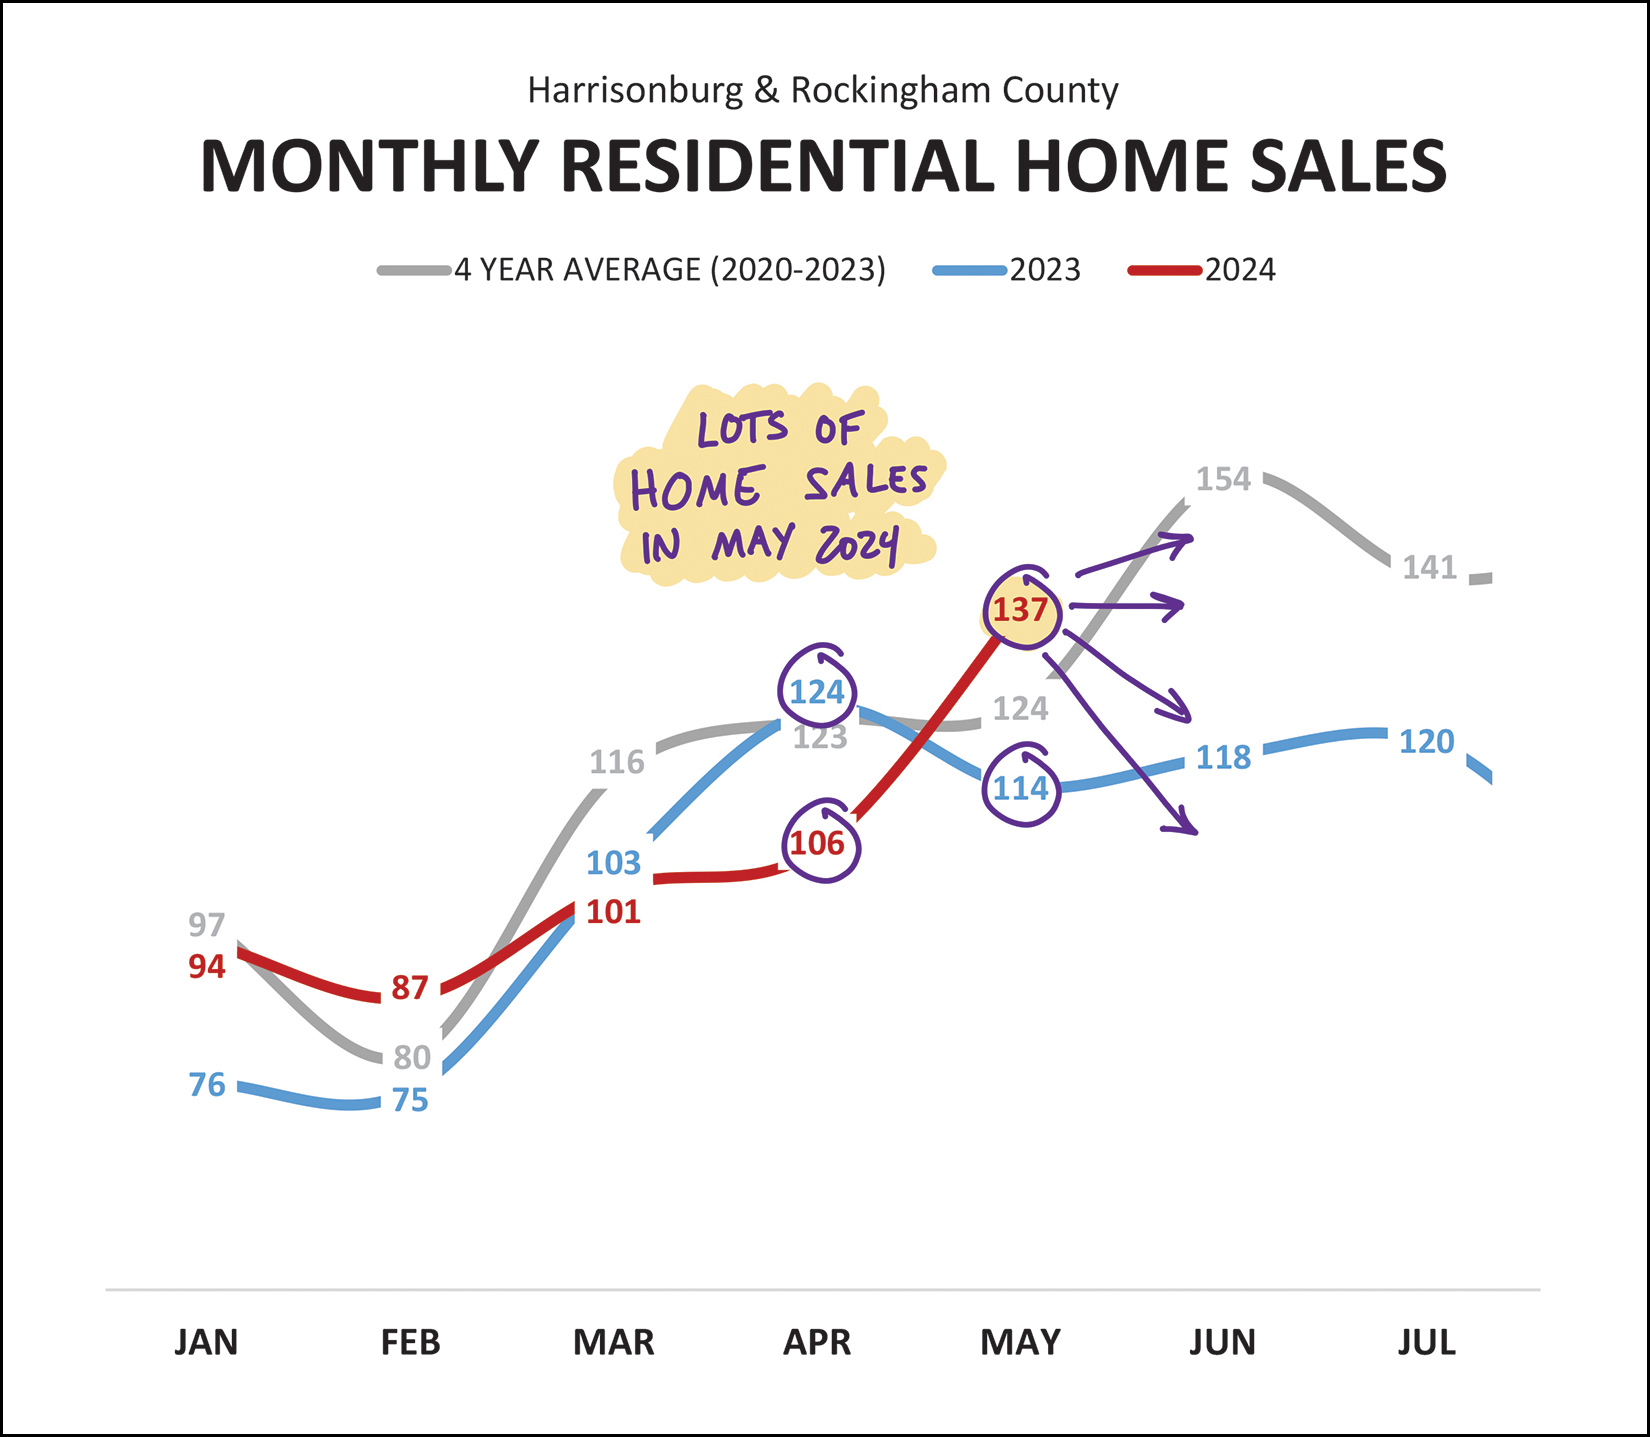 April home sales (106) were much (!) lower than last April (124) but May did not follow that pattern. After only seeing 114 home sales last May... there were 137 this May! Adding up those two months to see how April+May is tracking year over year, we find 243 home sales this year compared to 238 home sales last year. As you can see from my abundance of purple arrows above, it's hard to say where things will head in June... will home sales drop below 2023 again, or match 2023, or exceed 2023? It's hard to know for sure, but keep reading for the latest on contract activity and pending sales, both of which should give us somewhat of a hint of what is ahead. But first, let's see how this year stacks up compared to prior years... 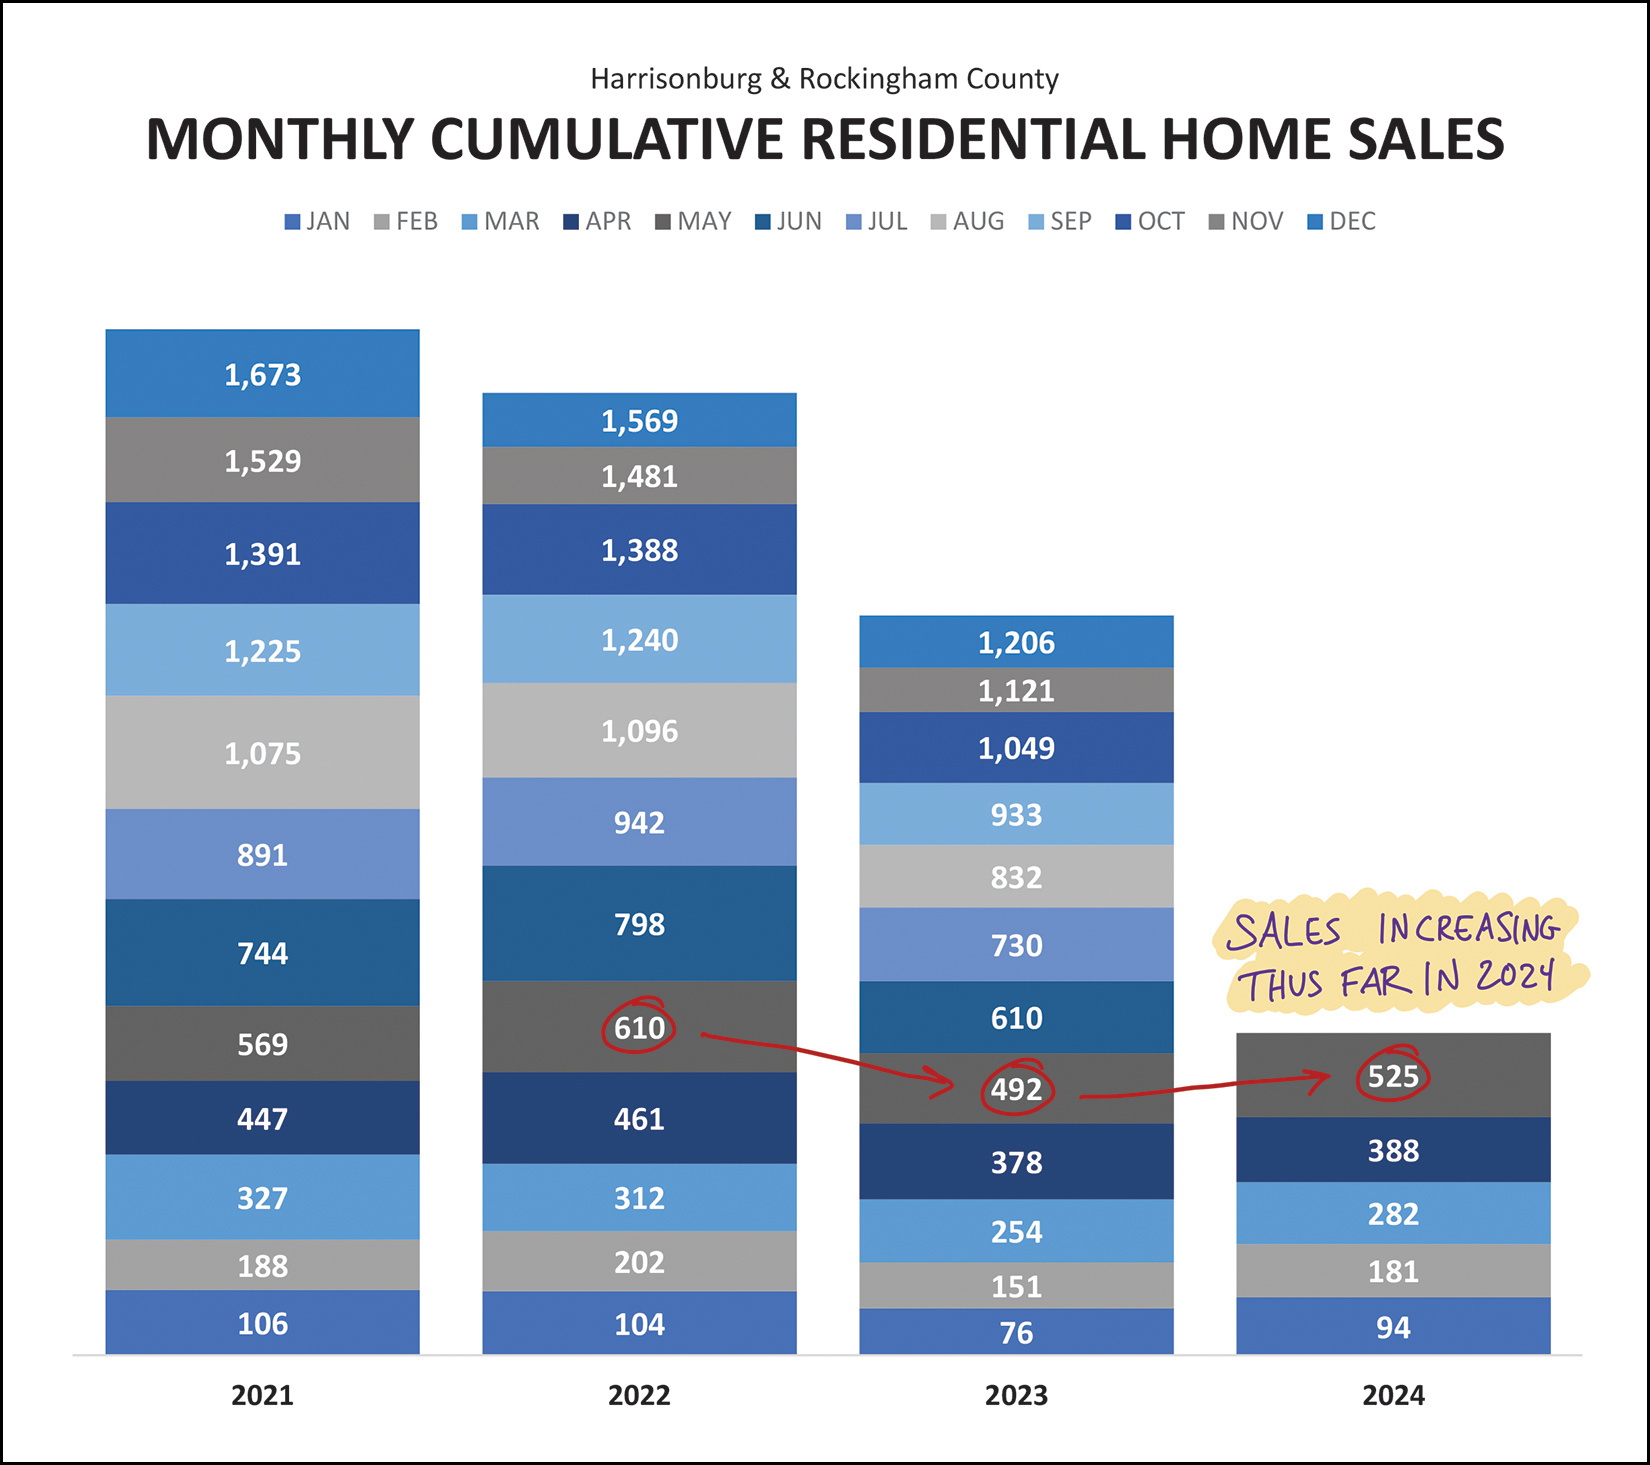 We have been seeing a decline in the number of home sales over the past few years (2021 to 2022 as well as 2022 to 2023) but that might be reversing itself in 2024. The 525 home sales we have seen in the first five months of 2024 puts us ahead of 2023, though certainly still behind 2022 and 2021. Stay tuned to see if we can come out ahead of the 1,206 home sales we saw last year. Next up is a monthly look at rolling 12 month trends... 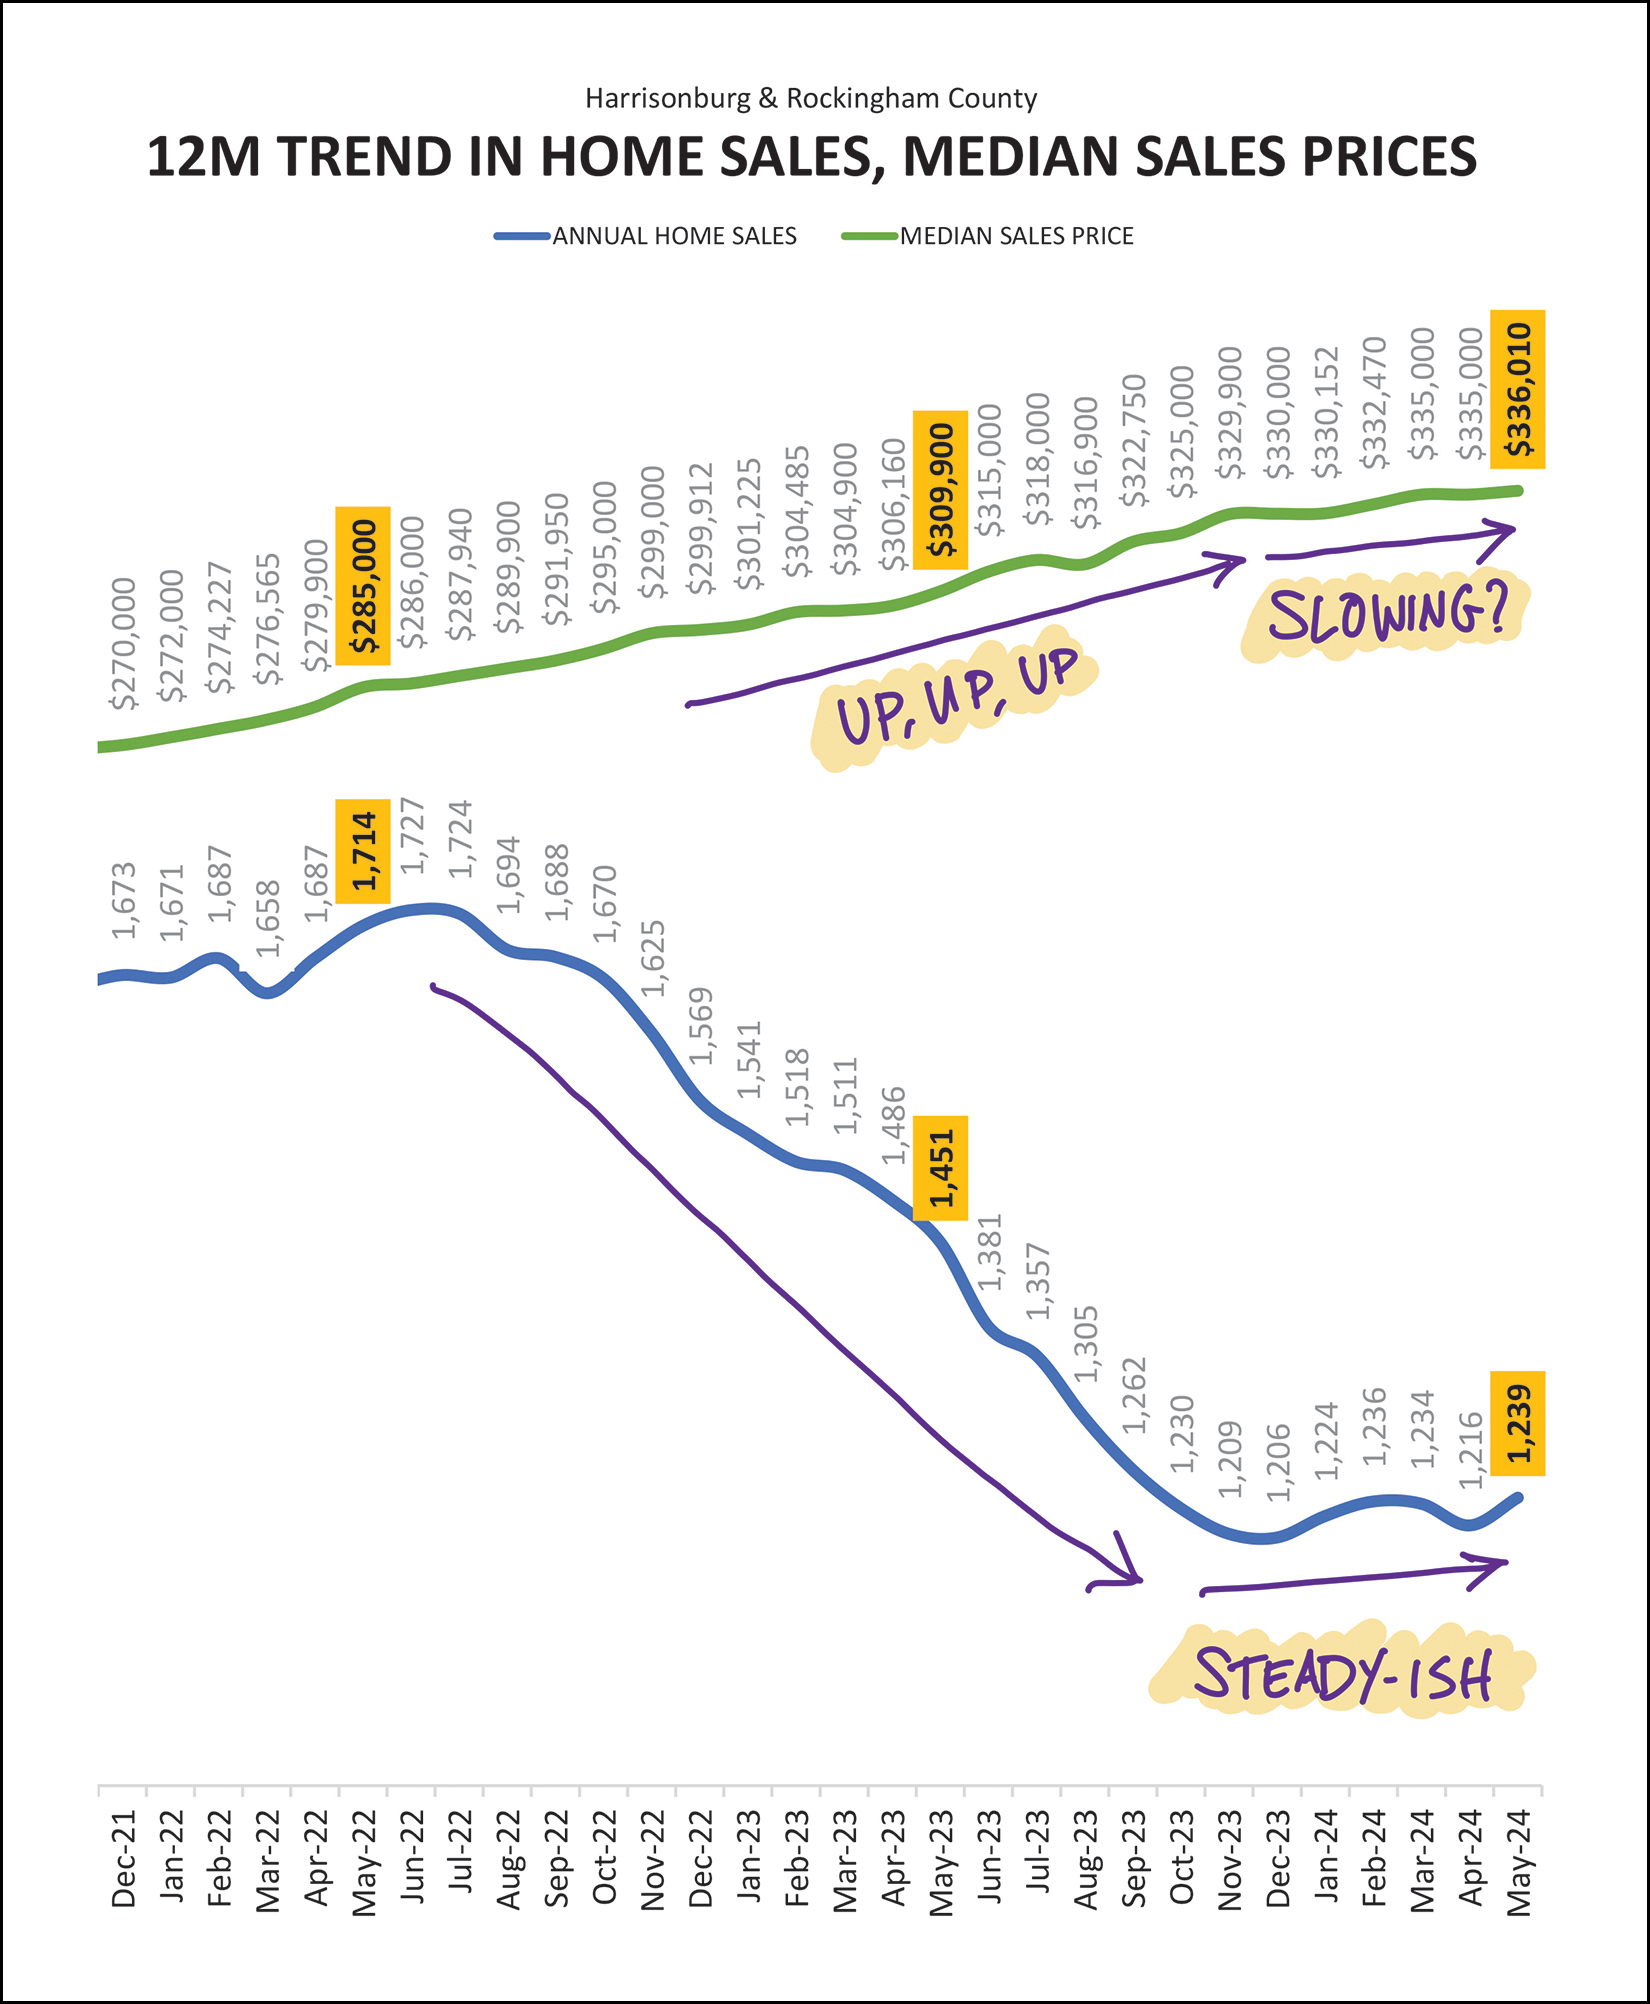 The top (green) line shows (barely, if you squint) what I have already mentioned in this month's report... median sales prices are increasing, but maybe not quite as quickly over the past six months as compared to their trajectory over the past few years. But, we'll need to continue to watch this metric to see if price increases are indeed settling down a bit. The bottom (blue) line shows that after almost two years of a downward trend in the number of homes selling in Harrisonburg and Rockingham County... we might finally be seeing things level out and increase a bit. We peaked above 1,700 home sales a year... and over about two years then saw things bottom out at just over 1,200 home sales a year. Will this trend slowly make its way back up to 1,300 home sales a year? If so, how soon? I mentioned new vs. existing home sales a bit earlier, but here's how the breakdown looks over the past few years... 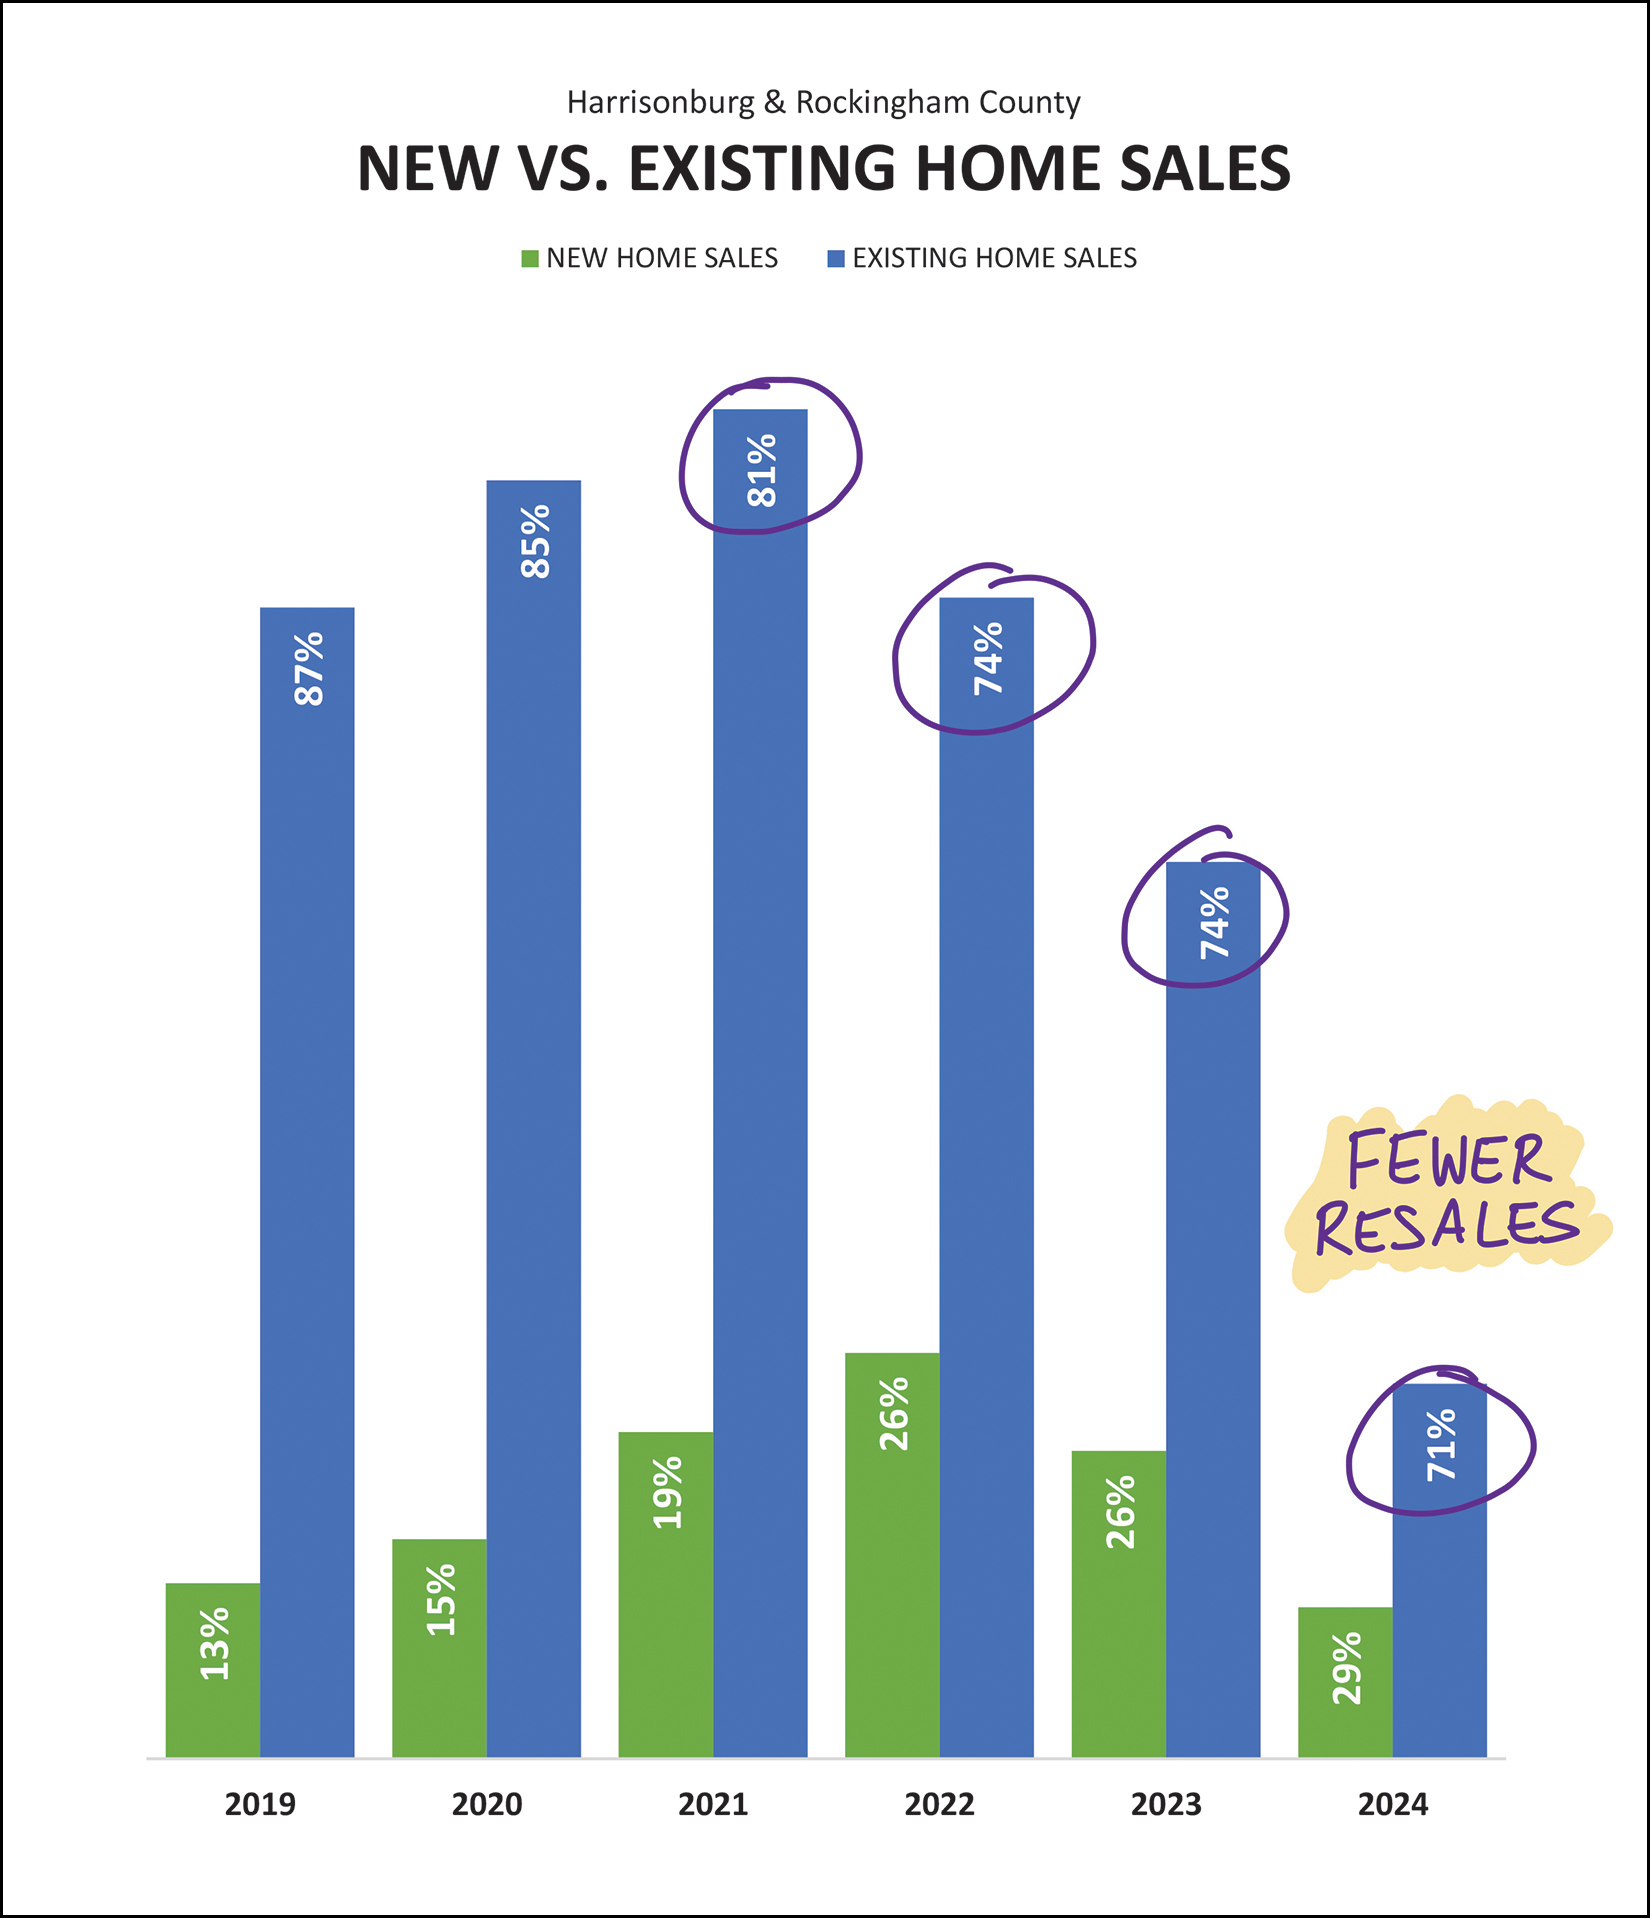 We have seen a steady decline in the number of existing homes selling in our market... and in the percentage of home sales that are existing homes. Three years ago 81% of home sales were existing homes and only 19% were new homes. This year only 71% of homes that are selling are existing homes and 29% are new homes. Many homeowners have low mortgage interest rates on their existing mortgages and thus do not want to sell their homes -- which is contributing to lower numbers of existing home sales. We are also seeing many more new home communities in our area -- from local builders, but mostly from regional builders. I suspect we will continue to see new homes making up 25% or more of all home sales over the coming years. Now, for predicting the future... 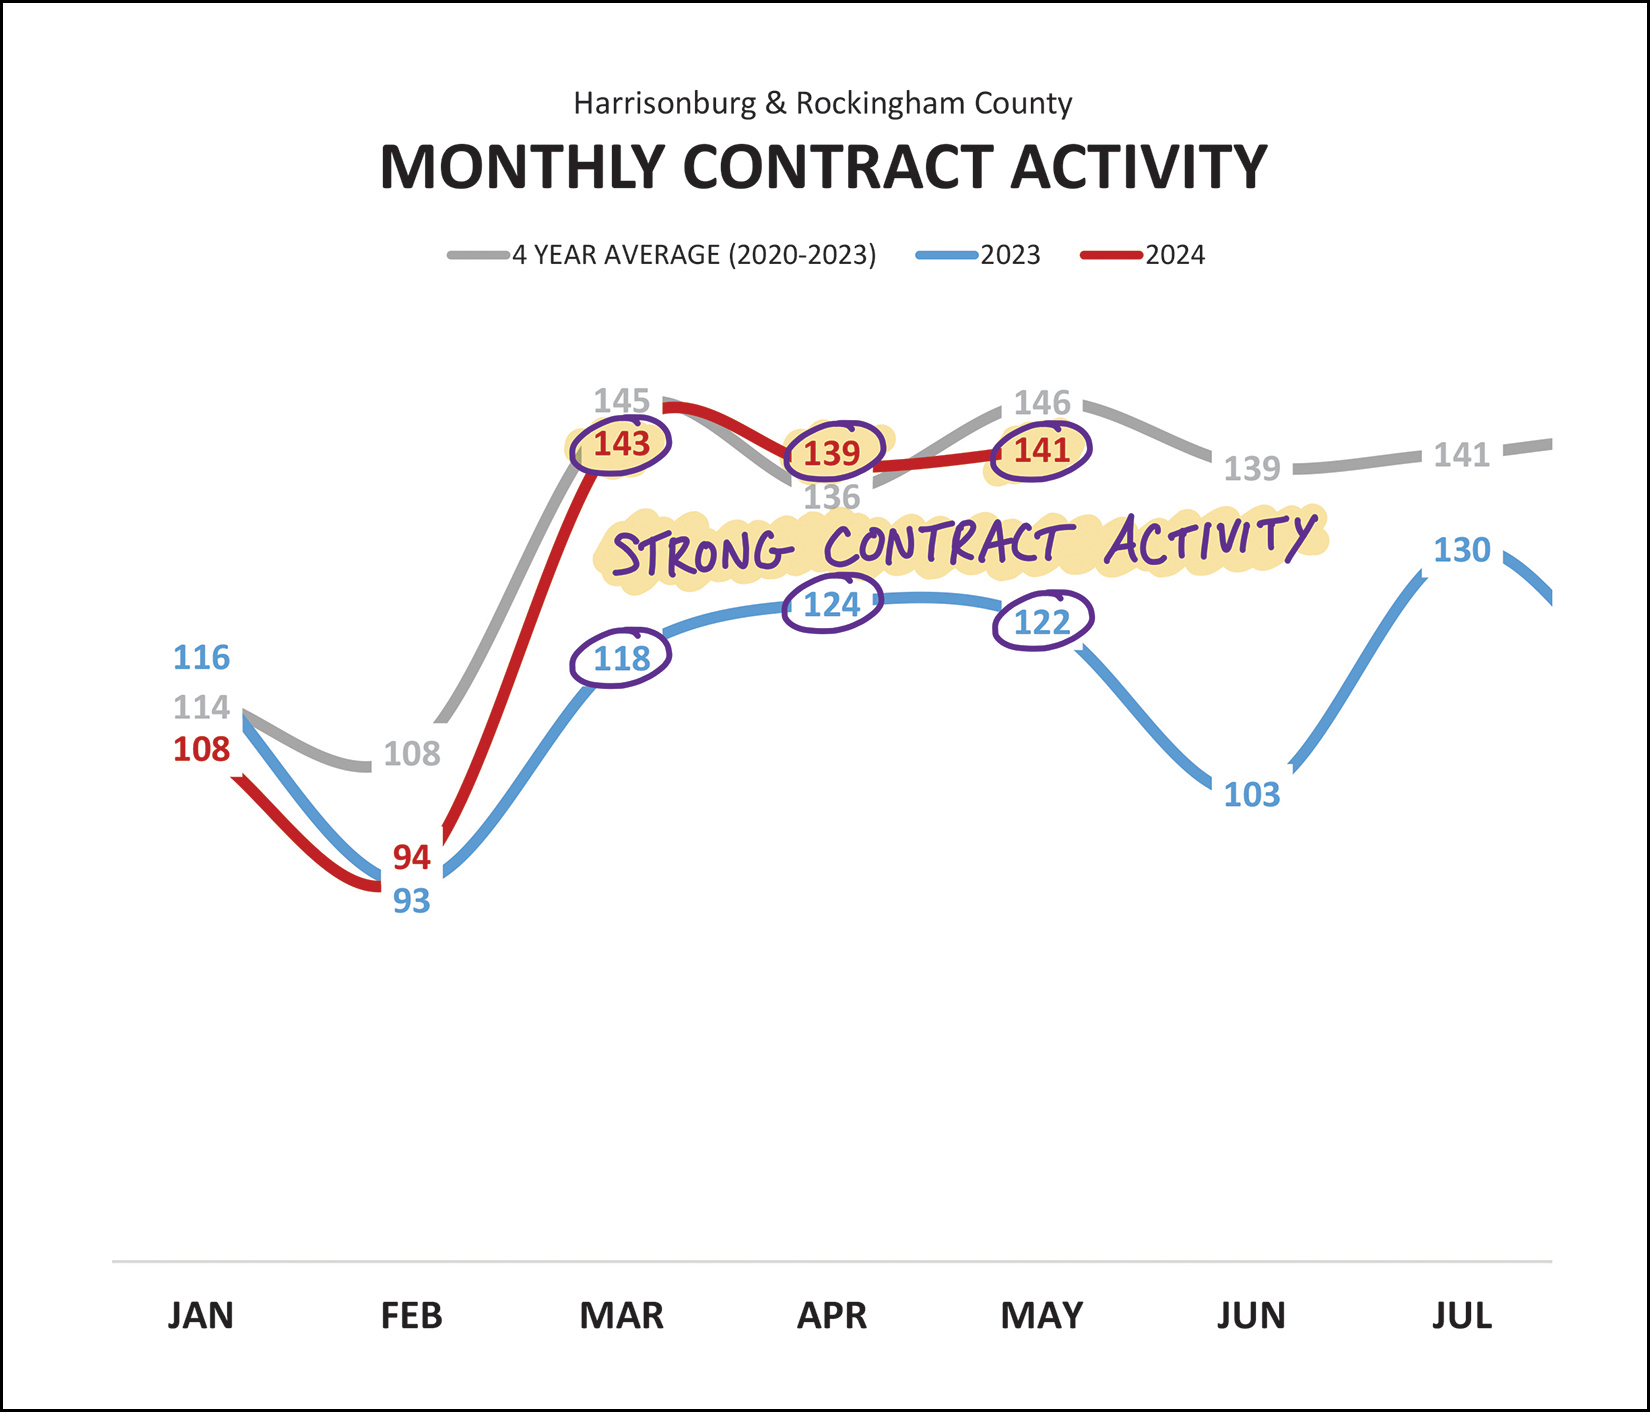 After a strong month of sales activity in May, one might wonder what the next few months will hold. As shown above, we have now had three straight months of solid contract activity (red line) compared to those same months last year (blue line). Over the past three months, 423 buyers (and sellers) have signed contracts compared to only 364 in the same three months last year. These strong levels of contract activity suggest that we will continue to see at least several more months of strong home sales. Trends in pending home sales also supports that theory... 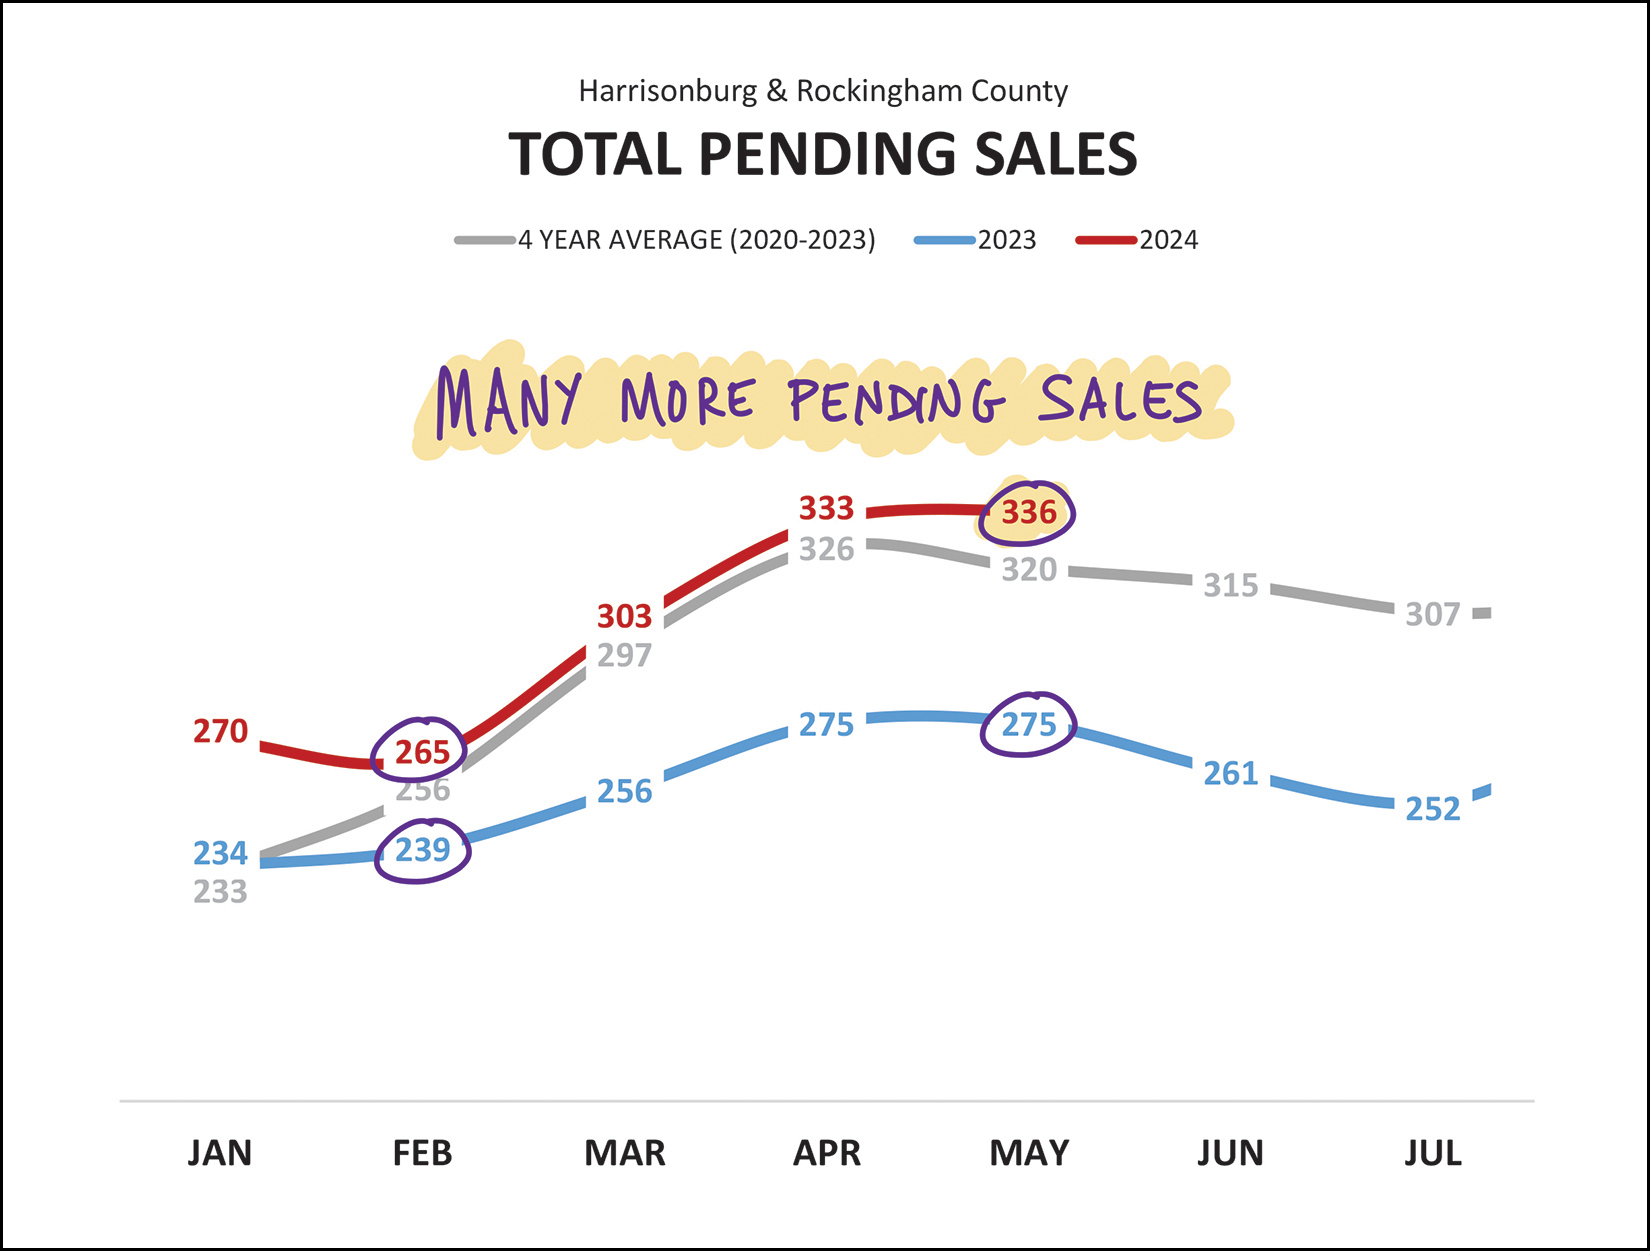 A year ago (blue line) there were only 275 homes under contract (pending) in Harrisonburg and Rockingham County. Today, that has risen to 336 homes under contract in our market. The overall declines in the number of homes selling may be behind us at this point given recent months of strong contract activity and the current trends in pending home sales. Perhaps unsurprisingly, inventory levels are also declining a bit... 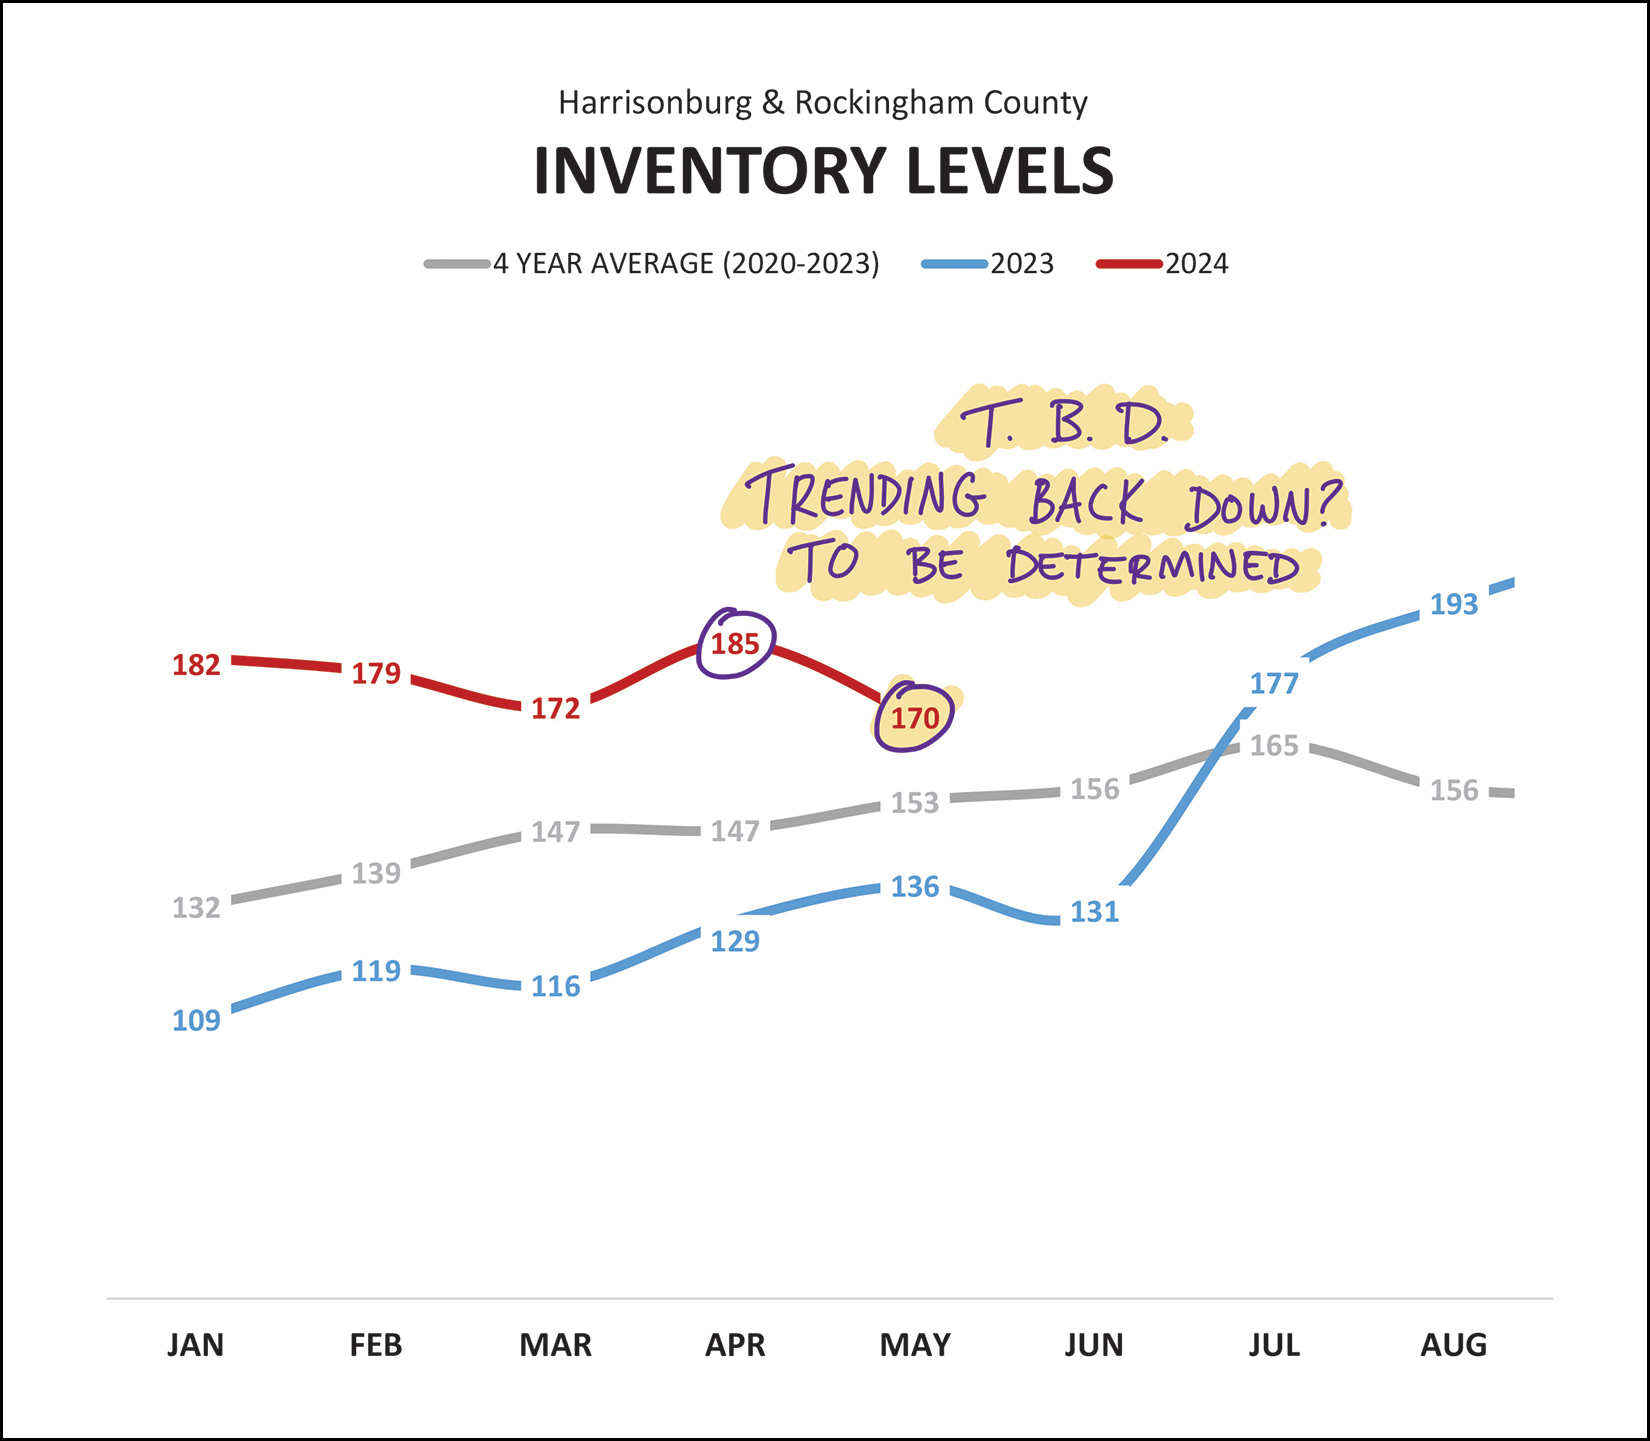 Back in July 2023 we saw inventory levels start to rise... and they have stayed higher than expected since that time. But... at least as of today, inventory levels are trending back down a bit. Will this trend continue? Or is it a one month blip? Stay tuned. Keep in mind that even as inventory levels rose from the 100-130 range to the 180-200 range, all of those levels are well below pre-COVID inventory levels. Days on market -- how quickly homes go under contract -- is also keeping things interesting lately... 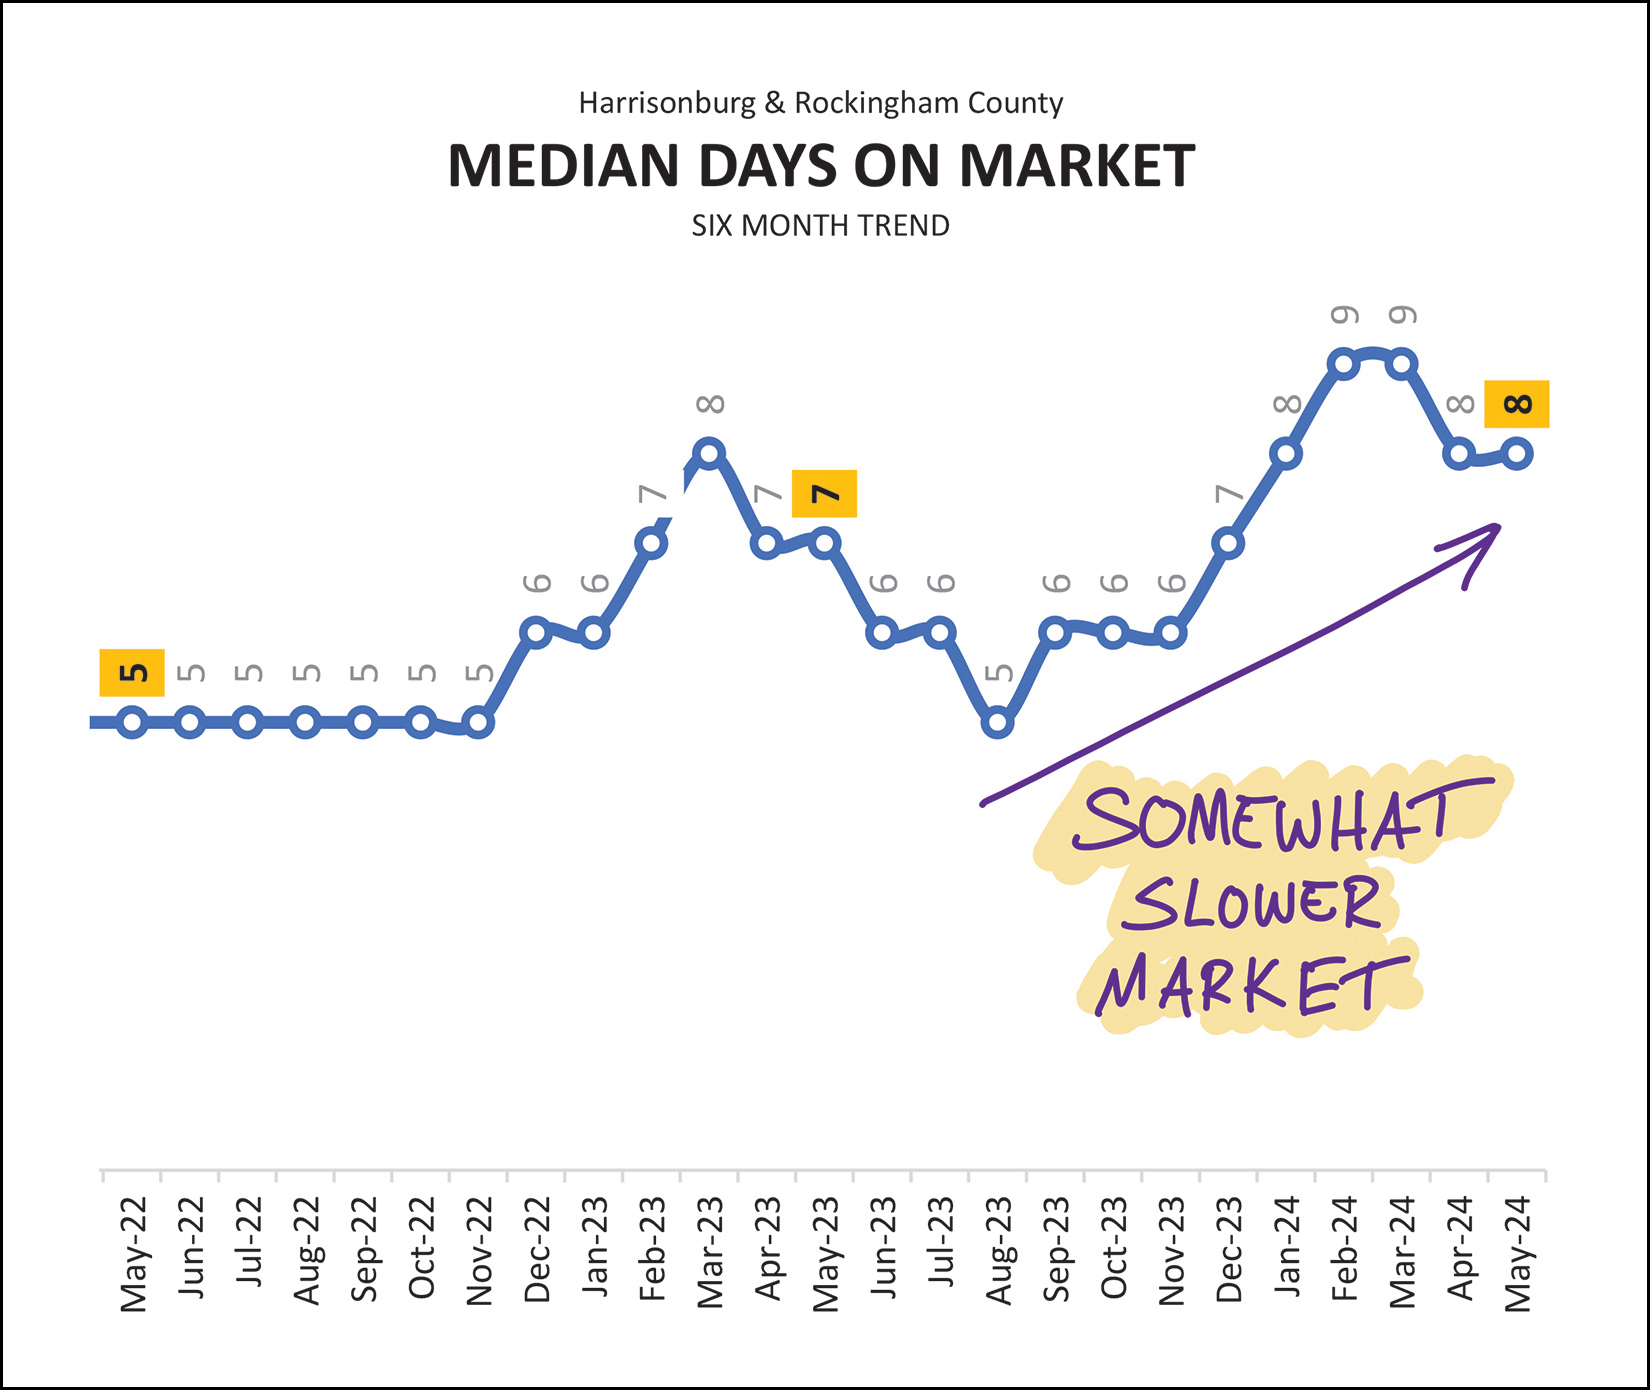 After several years of a median days on market of four or five days, we started to see this metric drift upward in late 2022, corresponding in large part to increases in mortgage interest rates. Last summer we saw days on market start to decline again (back down to five days in August 2023) but then it rose through early 2024. Has the market slowed back down since that time -- or are we starting to see a seasonality to this metric? We'll need to see how things develop as we progress through the remainder of the summer months. And, finally, those mortgage interest rates... 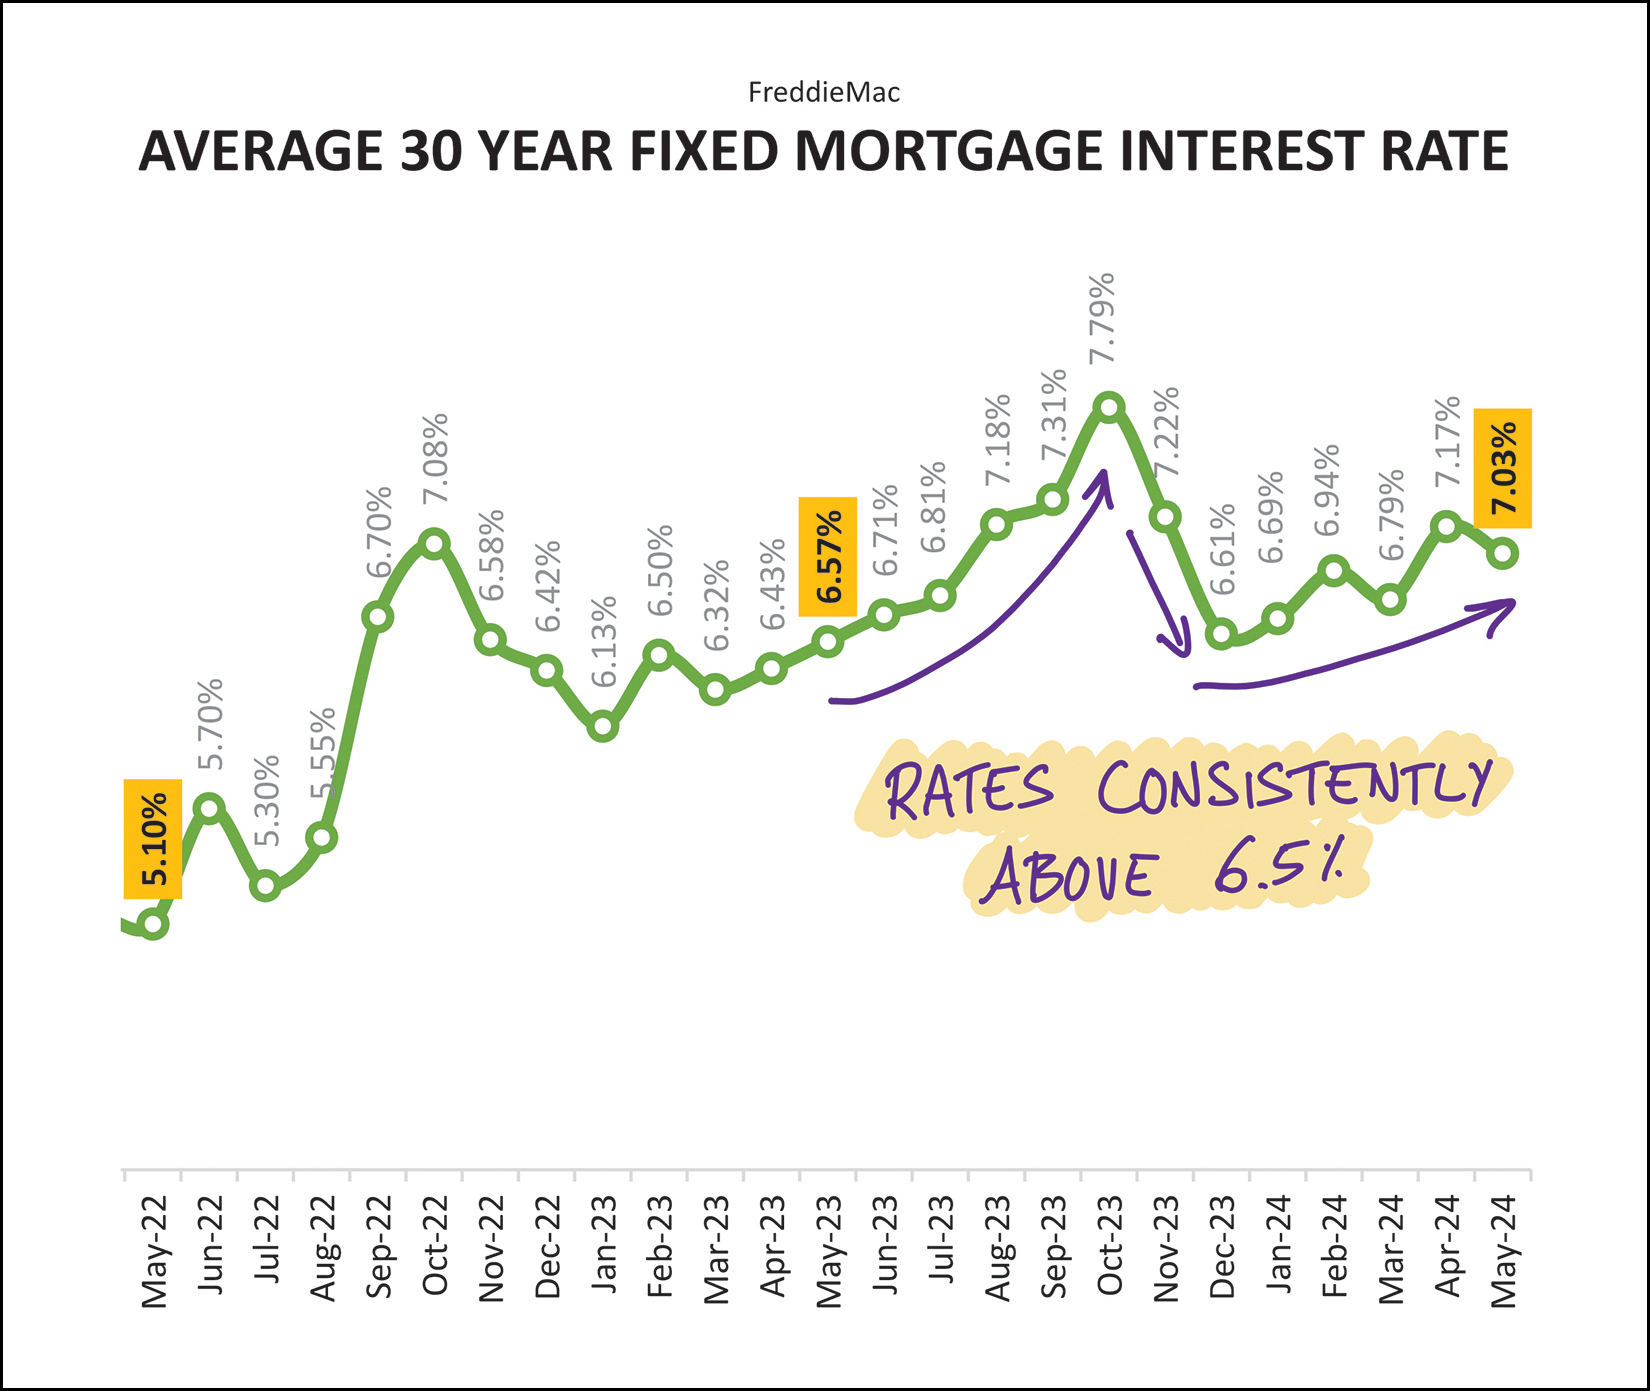 Two years ago the average rate was just above 5%, and rates peaked last Fall just under 8%, but the average 30 year fixed mortgage interest rate has been consistently above 6.5% for a year now... and there are not any indications that we'll see anything below 6.5% anytime soon. Most home buyers (or would be home buyers) have now adjusted to this new interest rate environment, and hopefully nobody is planning to wait to buy until rates get below 5%. There is talk of mortgage interest rates potentially coming down some over the remainder of the year, but we've heard that talk quite a few times over the past six (+) months and it hasn't measurably happened yet. As I bring this monthly market recap to a close, I'll point out that I post even more charts and graphs for your perusal each month over here. And finally, as we look ahead through the summer and towards the fall... If you plan to sell your home in the next six months, let's chat sooner rather than later about market conditions, your home preparations, your timing objectives and more. If you are considering a home purchase in the next six months, I'd be happy to chat with you about the buying process, the market and introduce you to some mortgage lenders who can help you consider your financing options. Reach out to me anytime via phone/text at 540-578-0102, or by email here. | |
Slightly More Homes Are Selling This Year Than Last, At Significantly Higher Prices |
|
 Happy Monday morning, friends! I hope you had an enjoyable weekend of seeing (or in my case, not seeing) the Northern Lights, celebrating the mothers in your life, and soaking in some delightful not-too-hot and not-too-cold spring weather here in the Shenandoah Valley! I was still at least partially in rest and recuperate mode this past weekend after running VA Momentum's Perfect Day 50K trail run the prior weekend with Luke. It was an amazing event with a community feel and great support from the family and friends as individuals and teams ran a 5K every hour on the hour for 10 hours straight, from 8AM until 5PM. It was definitely the longest Luke or I have run in a day!  Speaking of amazing events... each month I offer a giveaway for readers of this market report, and this month... I'm giving away a pair of 3-day tickets to one of my favorite events of the summer... the Red Wing Roots Music Festival!  This super-relaxing and family-friendly music festival from June 21 - 23 at Natural Chimneys Park in Mt Solon features wonderful music (on multiple stages throughout the weekend), great food, lots of activities (hiking, biking, running, yoga, kids events), and all around great fun with family and friends. Have you considered going to Red Wing but haven't been yet? Maybe this summer is the time for you to make it one of your favorite family traditions. I am looking forward to being there with my family and I'm hoping you'll join in on the fun... from June 21st through 23rd. And now, let's move on along to the latest numbers in our local housing market... 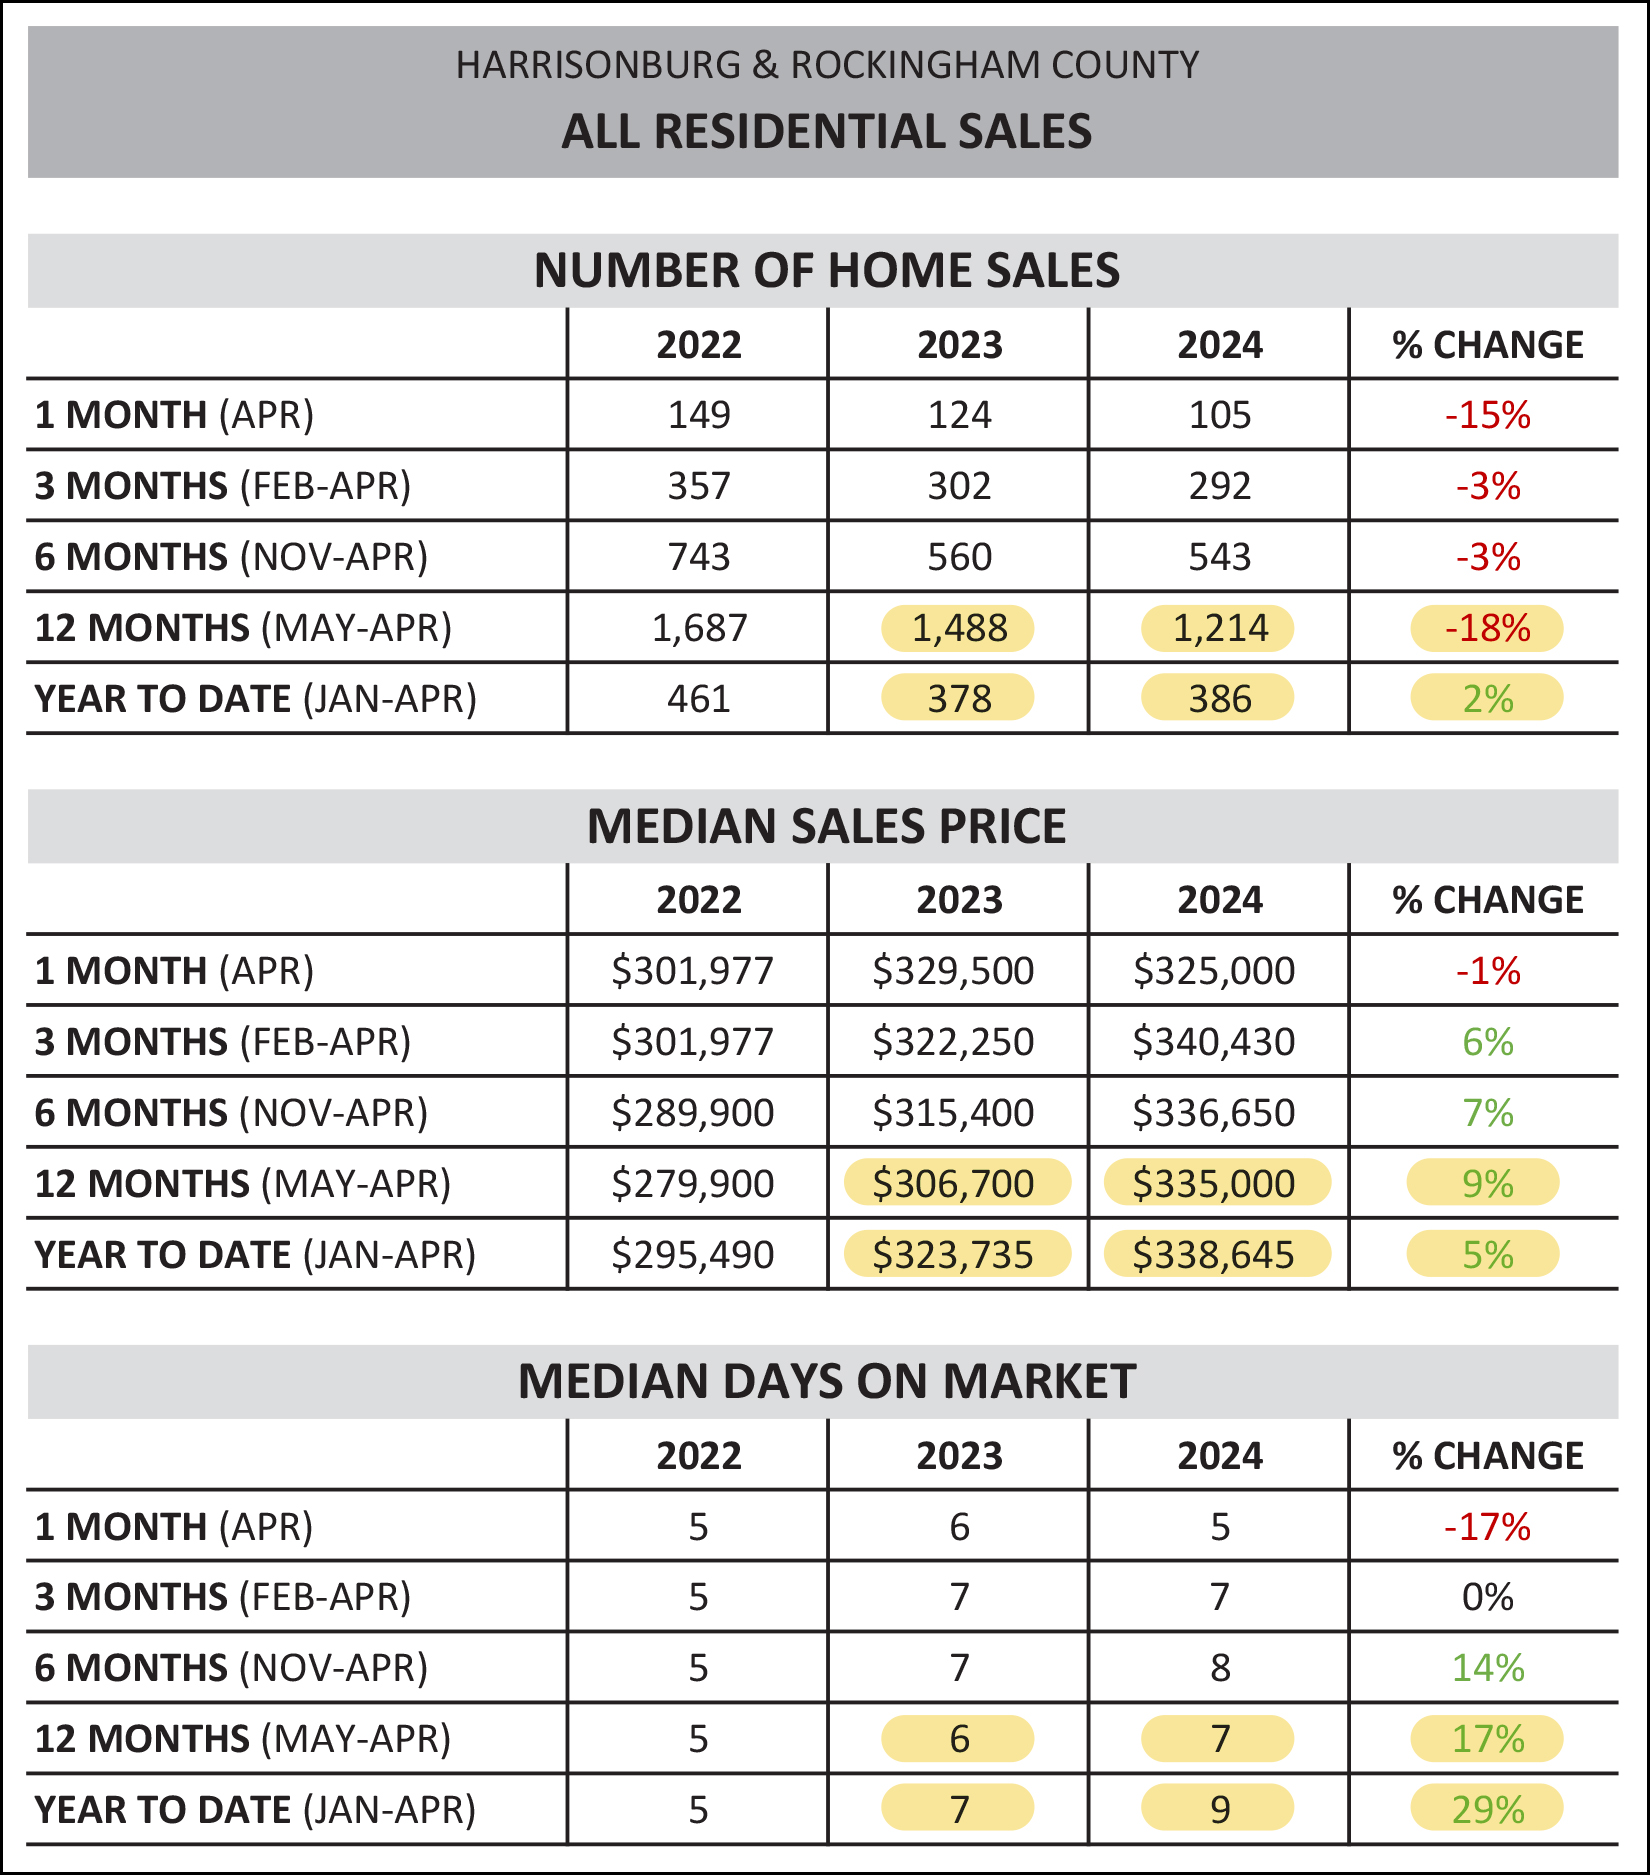 The chart above takes a look at our overall market during a variety of timeframes. Number of Home Sales -- As shown in the first set of highlighted numbers, over the past 12 months we have only seen 1,214 home sales in Harrisonburg and Rockingham County, compared to 1,488 during the 12 months before that. As such, we have seen an 18% decline in home sales when looking at a 12 month period -- but when looking just at this year, thus far, we are seeing a 2% increase in home sales, from 386 this January through April compared to 378 last January through April. Median Sales Price -- Over the past year we have seen a 9% increase in the median sales price in Harrisonburg and Rockingham County, which has now reached $335,000 (over the past 12 months) as compared to only $306,700 over the 12 months prior to that. Looking just at the first four months of this year we see a slightly smaller (5%) increase in the median sales price ($338,645) when comparing it to the first four months of last year ($323,735). Median Days On Market -- Homes are selling a bit more slowly this year than last. The median number of days it took for new listings to go under contract over the past 12 months has been nine days... which is an increase from the median of seven days during the 12 months prior to that. Now, looking at a subset of the market, for a moment, here are the same numbers when looking just at detached homes, and excluding townhomes, duplexes and condos... 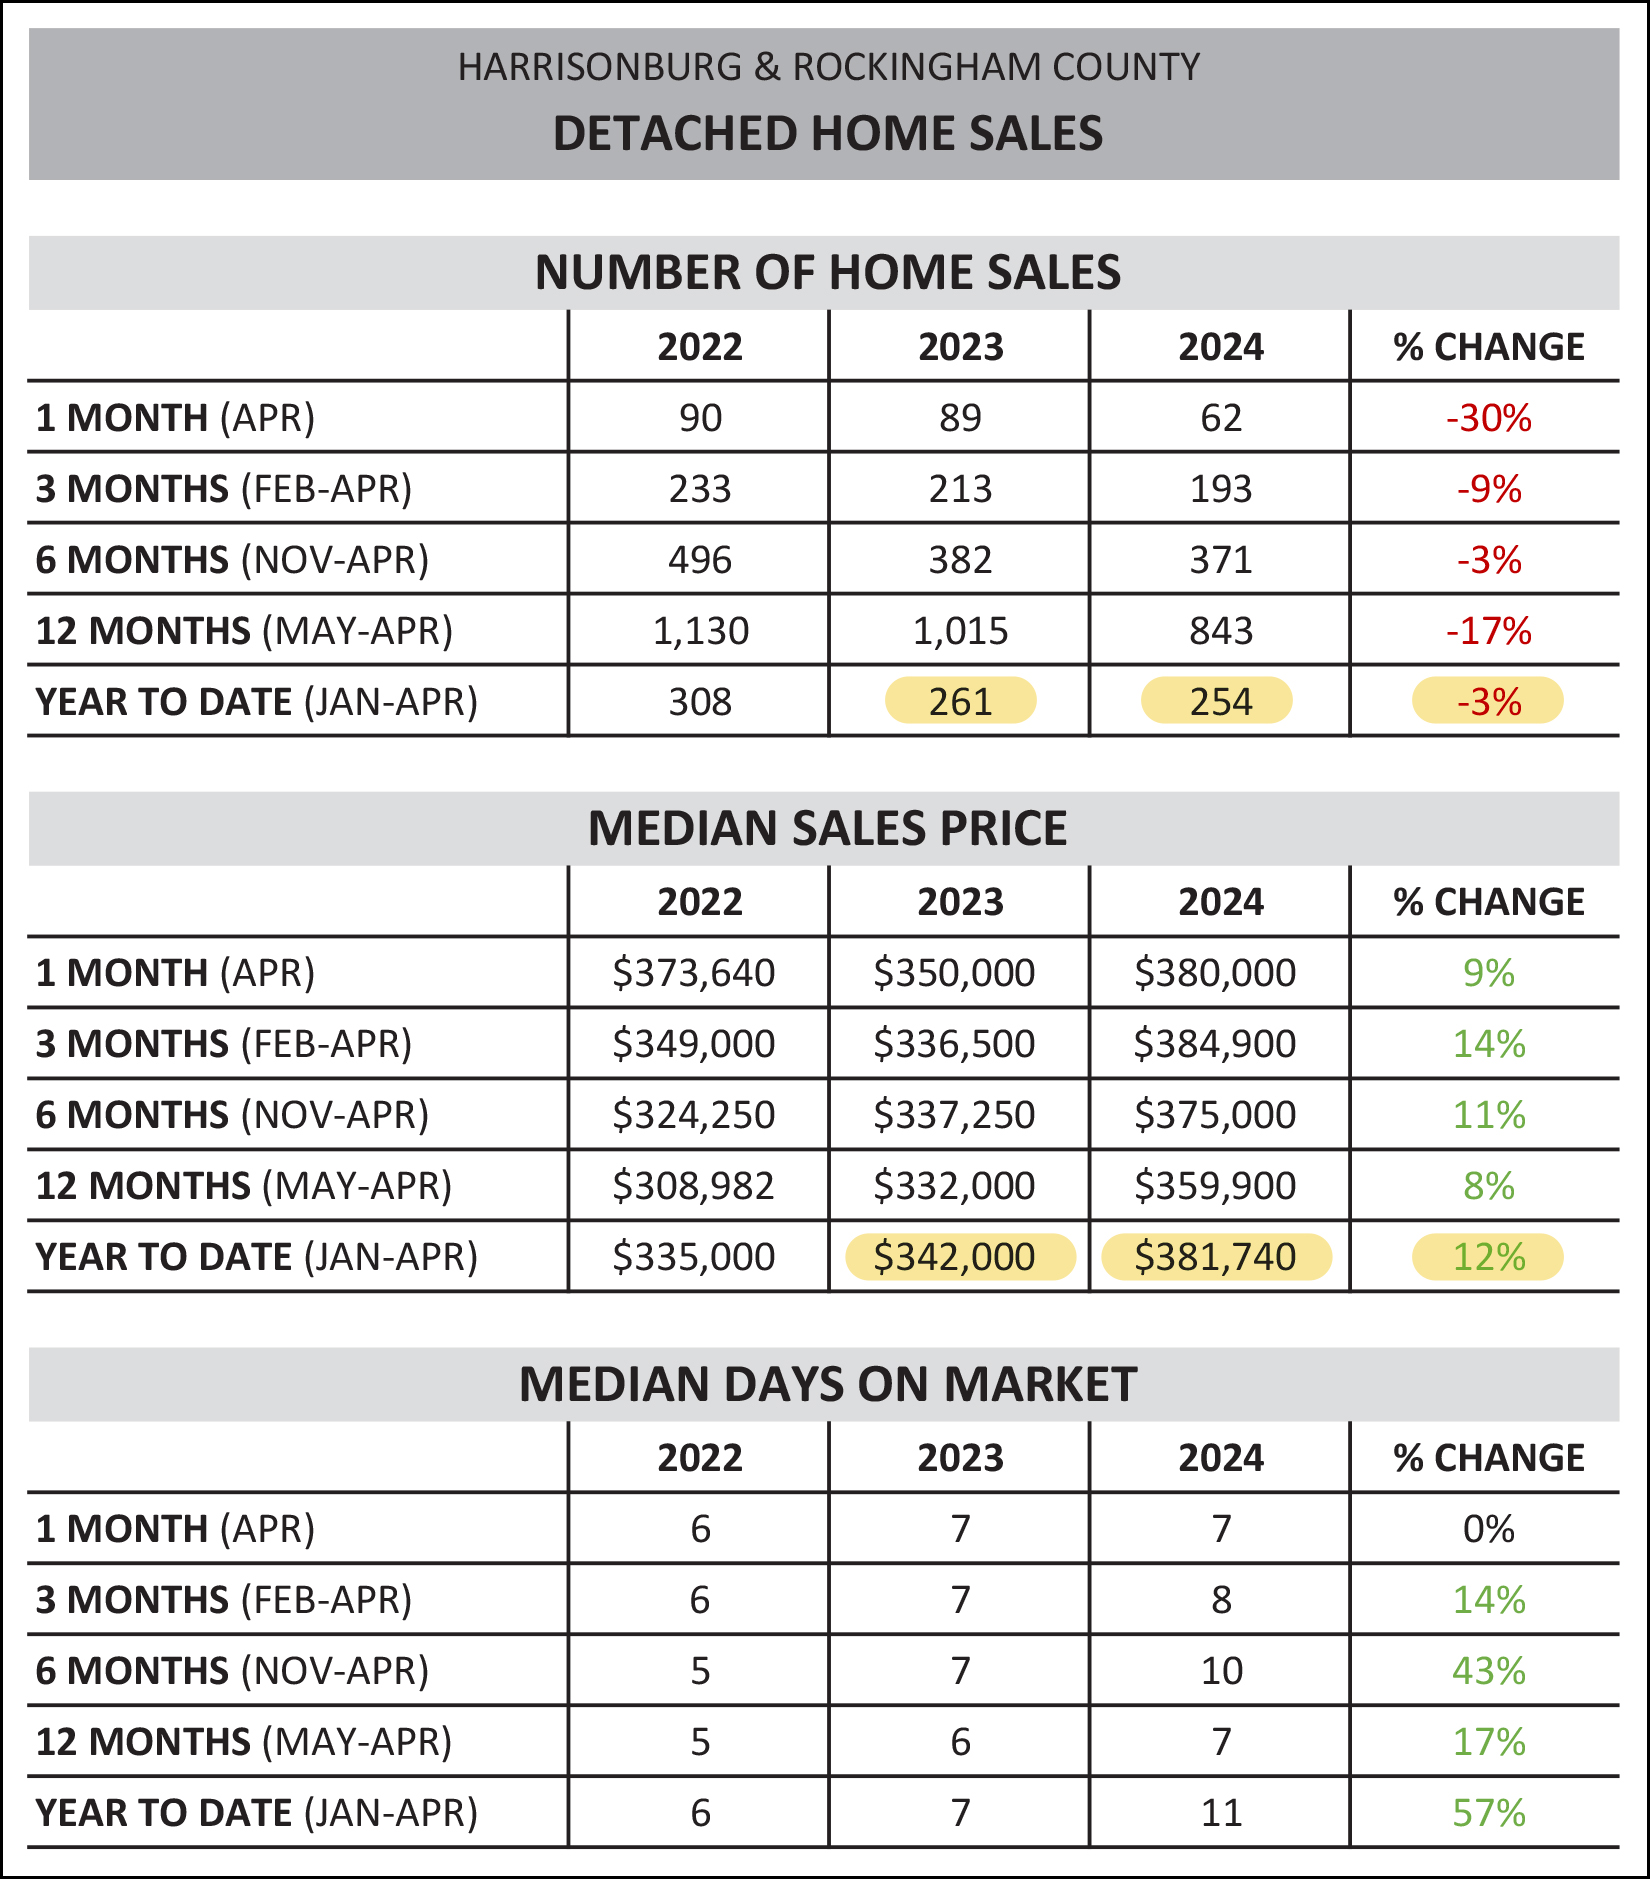 Focusing just on the first four months of 2024 compared to the first four months of 2023, here are the differences we see between the detached home market and the overall market... There has been a 3% decline the number of detached homes that are selling... compared to the 2% increase in the overall number of homes selling. There has been a 12% increase in the median sales price of detached homes that are selling... compared to the 5% increase in the median sales price of all homes that have sold. So, when looking just at detached homes, slightly *fewer* are selling in 2024, and the increase in their median sales price is higher than that of the overall market. Meanwhile, in the attached home market... 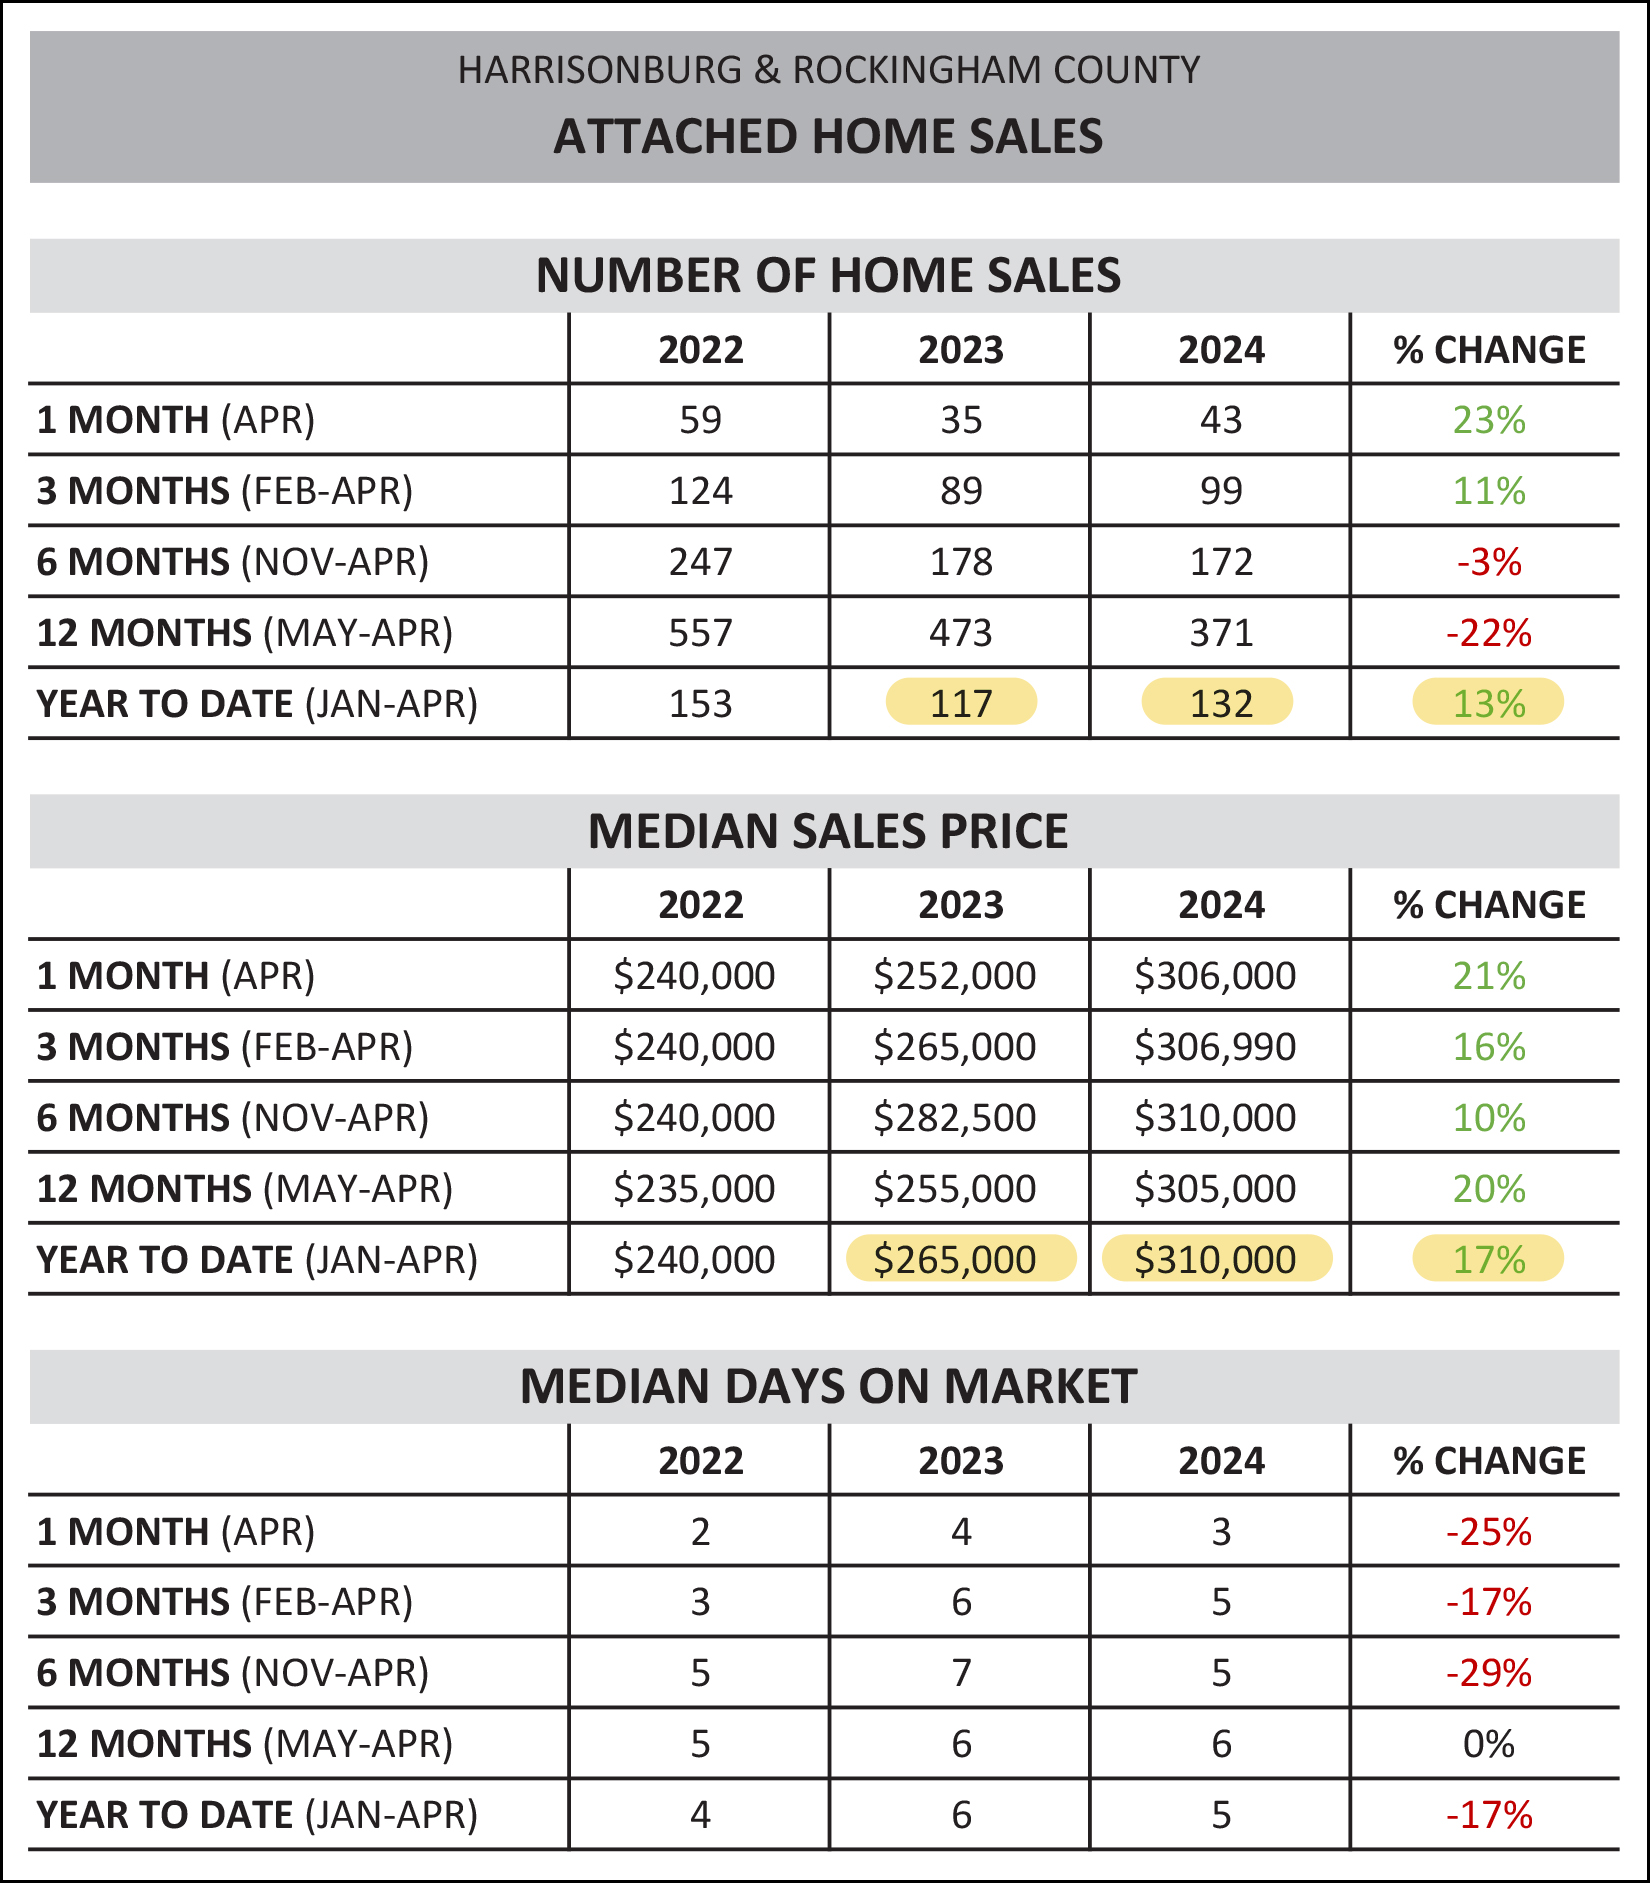 When looking just at attached homes (townhomes, duplexes, condos) we have seen a 13% increase in the number of such homes selling in the first four months of 2024, compared to the first four months of 2023 -- and a 17% increase in their median sales price. As such, the attached home market is seeing a strong start to the year both in number of sales and the price of those homes. Now, let's switch gears learn about the latest trends via some graphs... 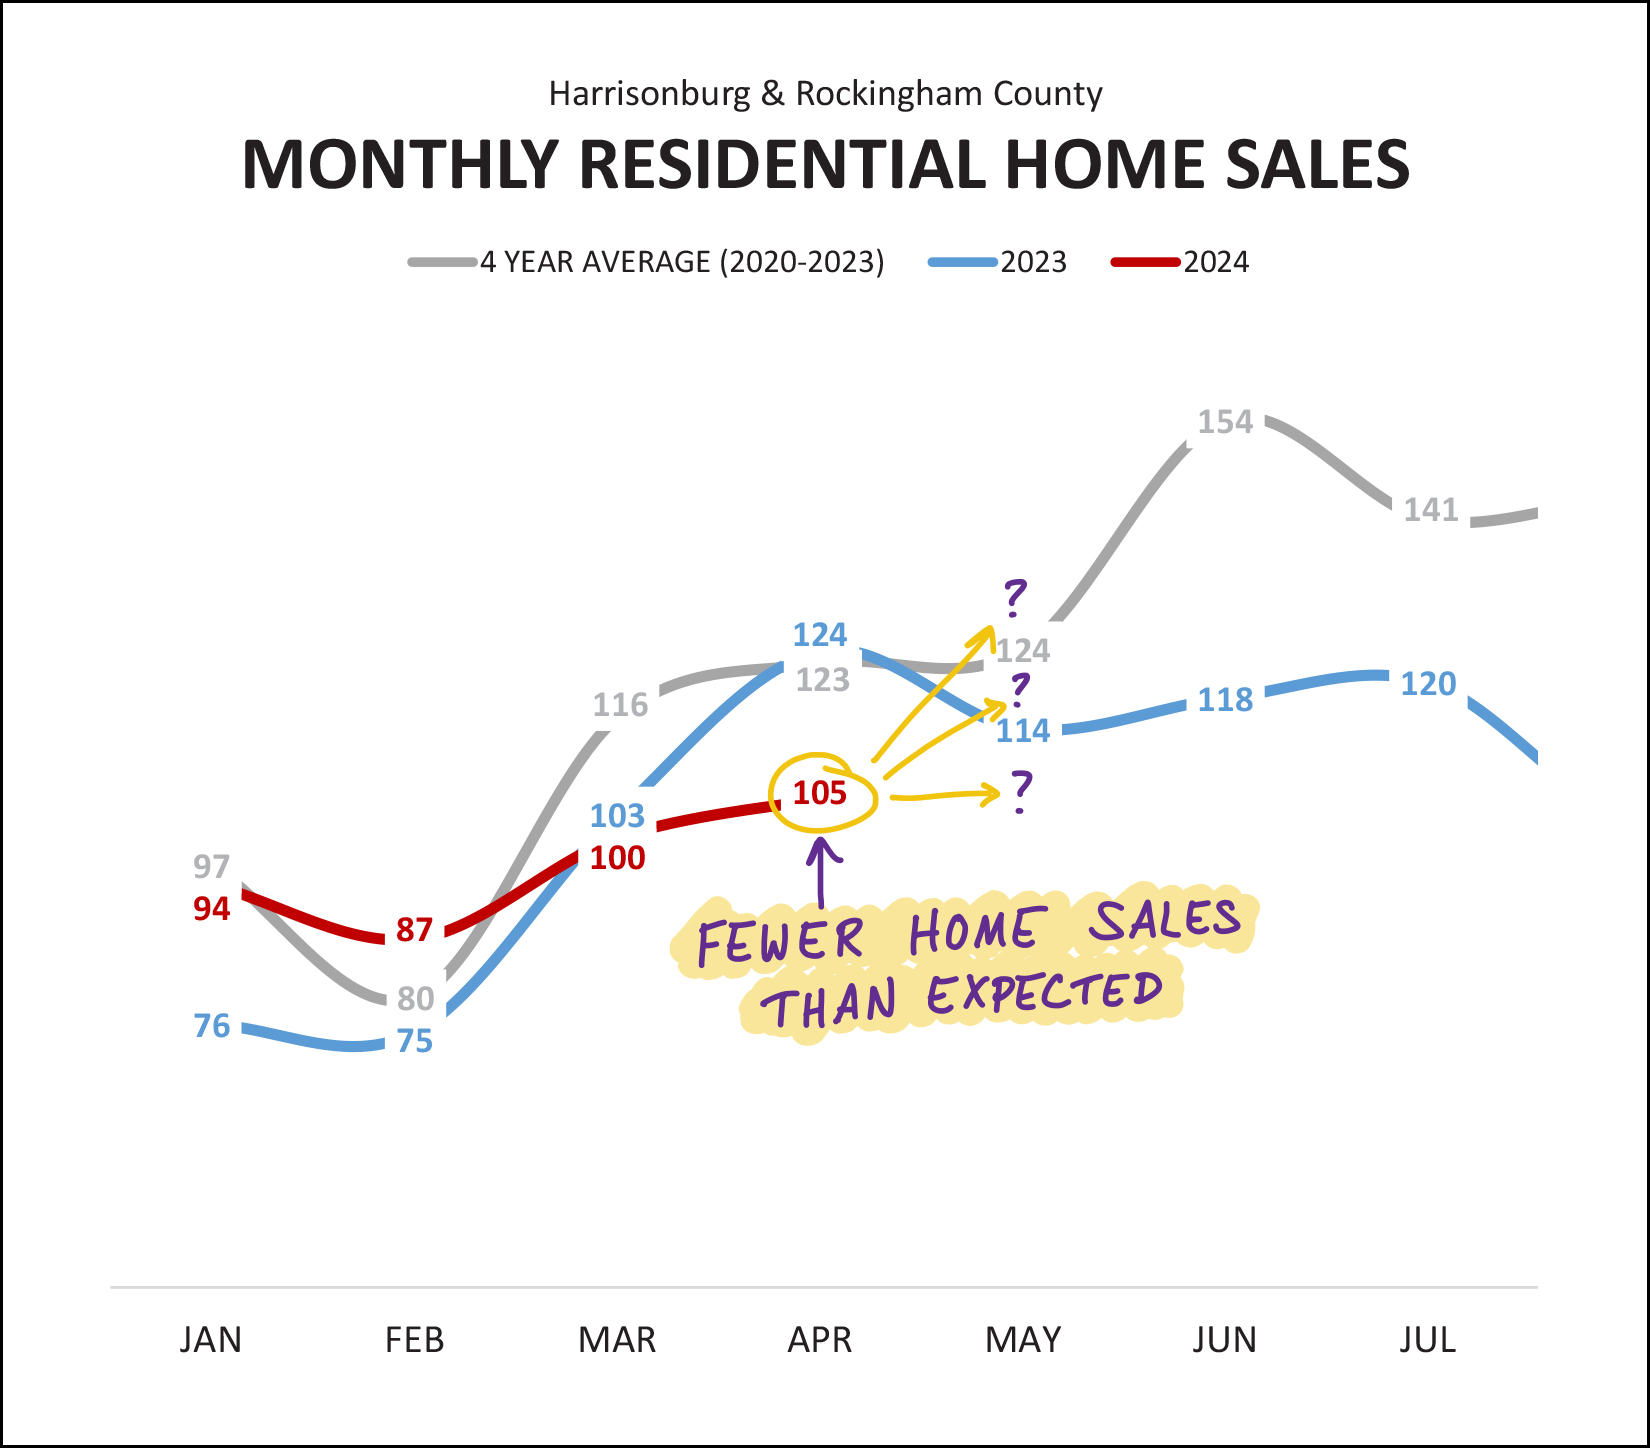 As you read above, we are seeing slightly more home sales in the first four months of 2024 compared to the first four months of 2023... but... April was not a contributor to that trend. Strong months of home sales in January and February were the biggest reason why we're seeing slightly more home sales in the first third of 2024 compared to the first third of 2023, as we saw fewer home sales this April (105) than we saw last April (124). Where do we go from here? We'll have to look at contract activity and pending sales (a bit further down this overview) to guess at whether home sales activity will rebound at all in May 2024. But first, let's see how the start of this year compares to the last few years... 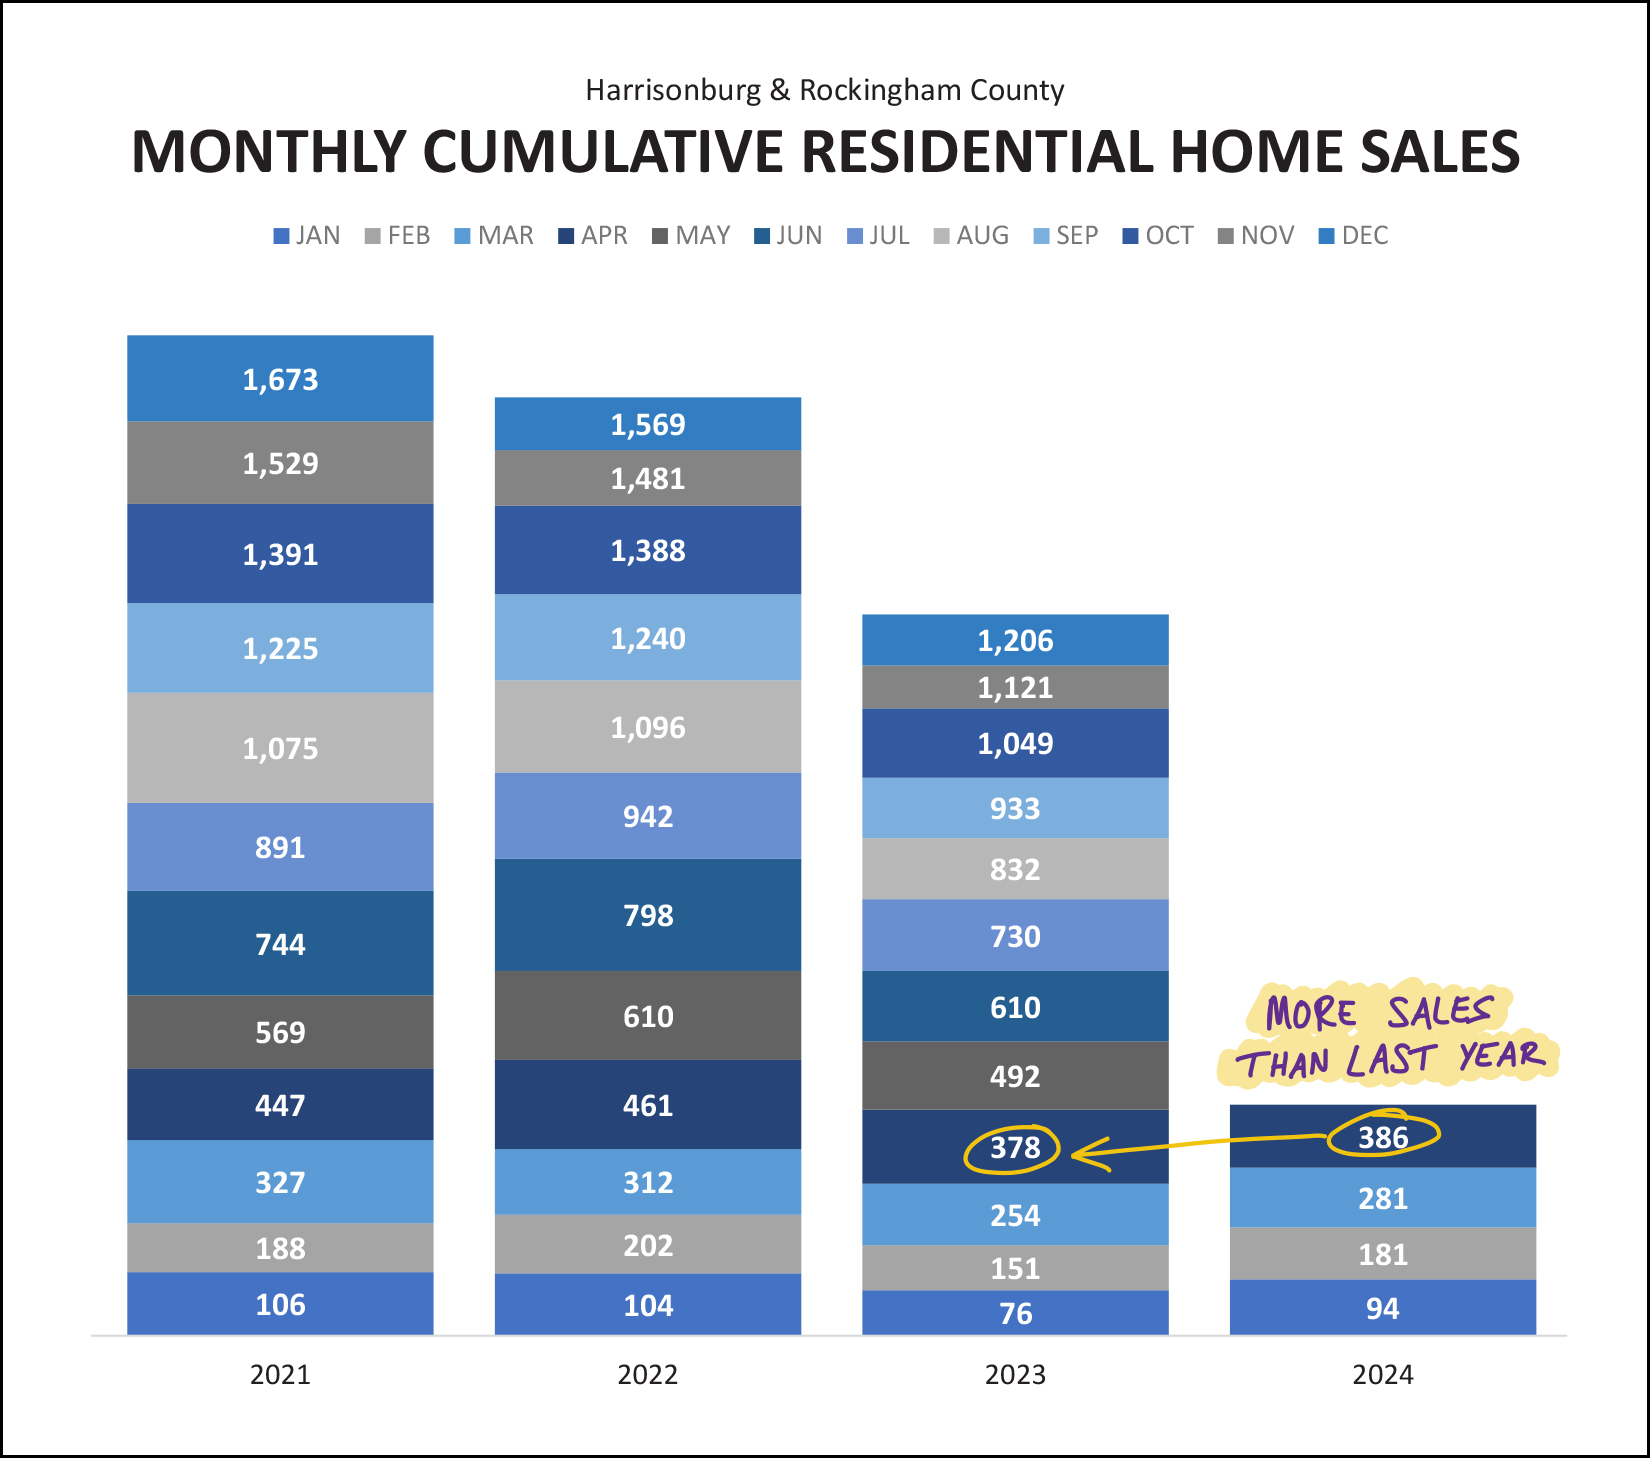 The 386 home sales during the first four months of 2024 puts us slightly ahead of the 378 in the first four months of last year... though well below the 447 and 461 home sales levels reached during the first four months of 2021 and 2022. It seems reasonable to conclude we'll probably see around 1,200 home sales this year (similar to last year) and not 1,500 - 1,700 home sales such as were seen in 2021 and 2022. Now, then, looking at slow moving trends by examining rolling 12 months of data... 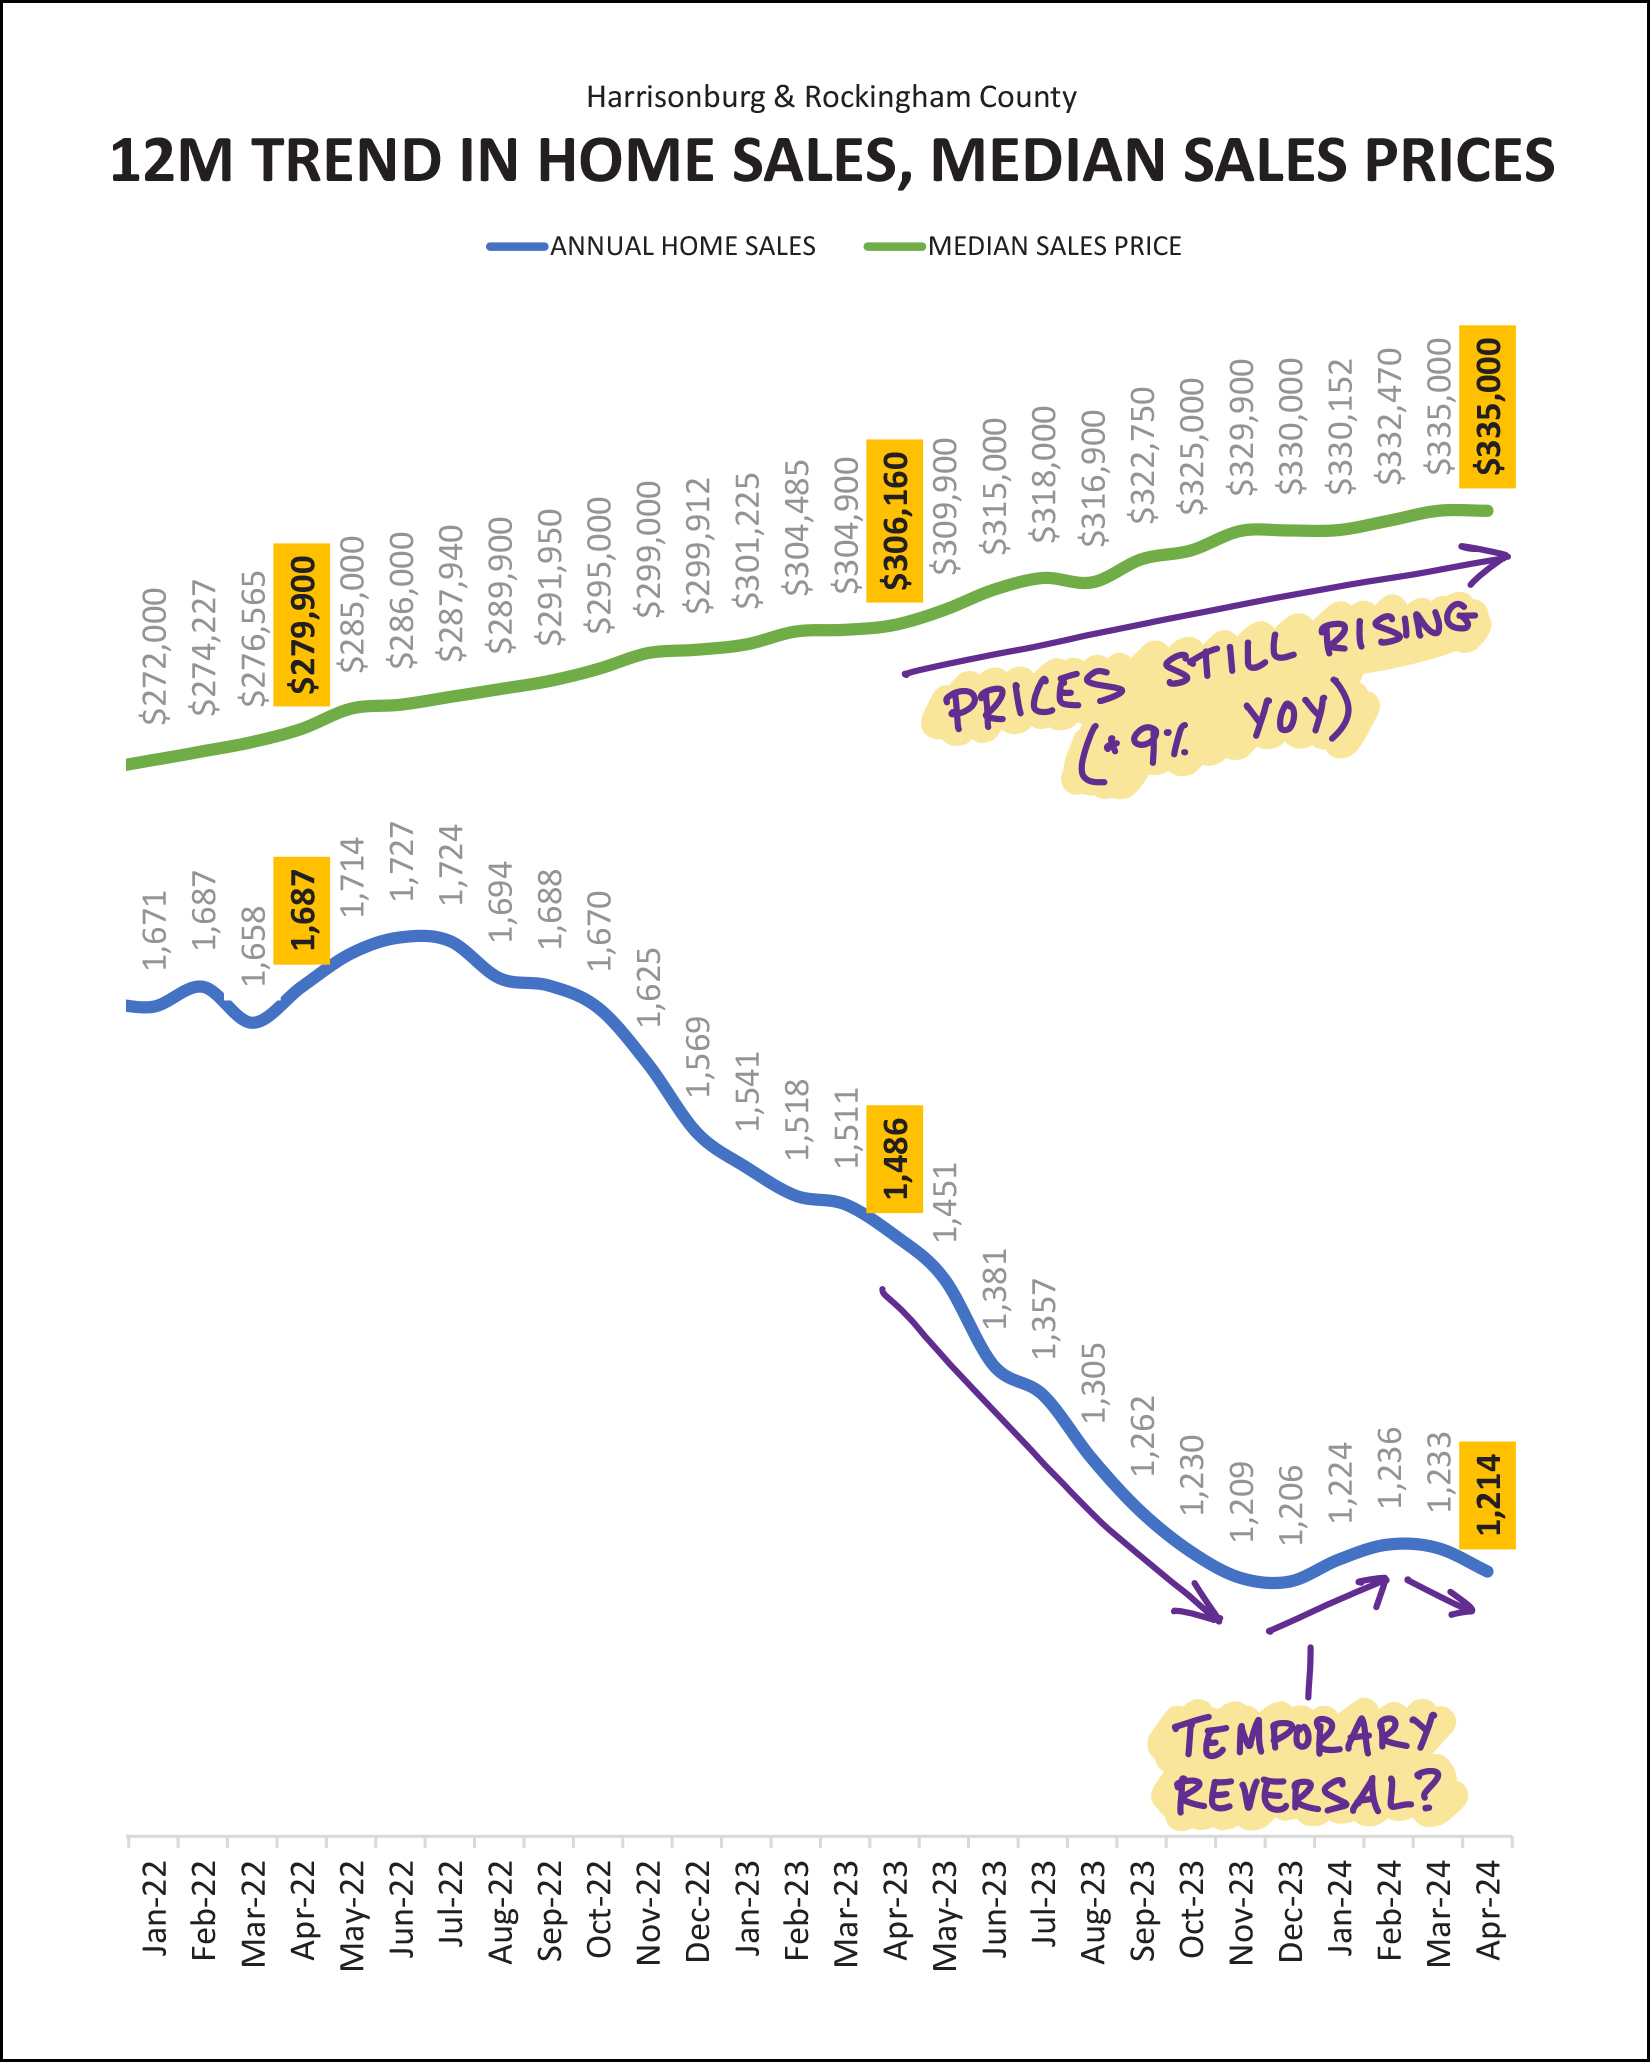 The top green line, above, shows the median sales price over a 12 month period, measured each month. Over the past year that median sales price has increased 9% from $306,160 to $335,000. Despite fewer home sales and higher mortgage interest rates, the median sales prices keeps... on... rising. The blue line, above, shows the number of homes selling in 12 months time, measured each month. Ever since the middle of 2022 we have seen this metric of annual home sales steadily falling... though in early 2024 that trend seemed to be reversing itself as the pace of annual home sales started to rise again. But... not so much in April 2024. Stay tuned to see if the annual pace of home sales levels out, declines even further, or starts rising again as we head through May, June and July. I haven't touched on it yet in this report, but a large portion of homes that are selling this year are new homes....  Thus far in 2024, 25% (1 in 4) home sales have been new home sales. This is a rather significant change from just a few years ago when only 13% (2019) and 15% (2020) of the homes that were selling were new homes. With soooo many current homeowners having rather low (to super low) interest rates on their current mortgages, we seem poised to have lower numbers of resale home sales for several years to come. As such, the new homes offered for sale (and being purchased) help to at least partially satisfy buyer demand for housing, and we are likely to continue to see around 25% (more or less) of buyers buying new homes over the next year or two. To get a sense of where the market might go next, let's look at contract activity...  Despite fewer home sales in March and April of 2024... the amount of homes going under contract was MUCH higher this March and April (red line) compared to last year (blue line). Given these higher months of contract activity, I believe we are likely to see higher numbers of home sales in May and June. This is reinforced when looking at the number of homes under contract at the end of March and at the end of April... 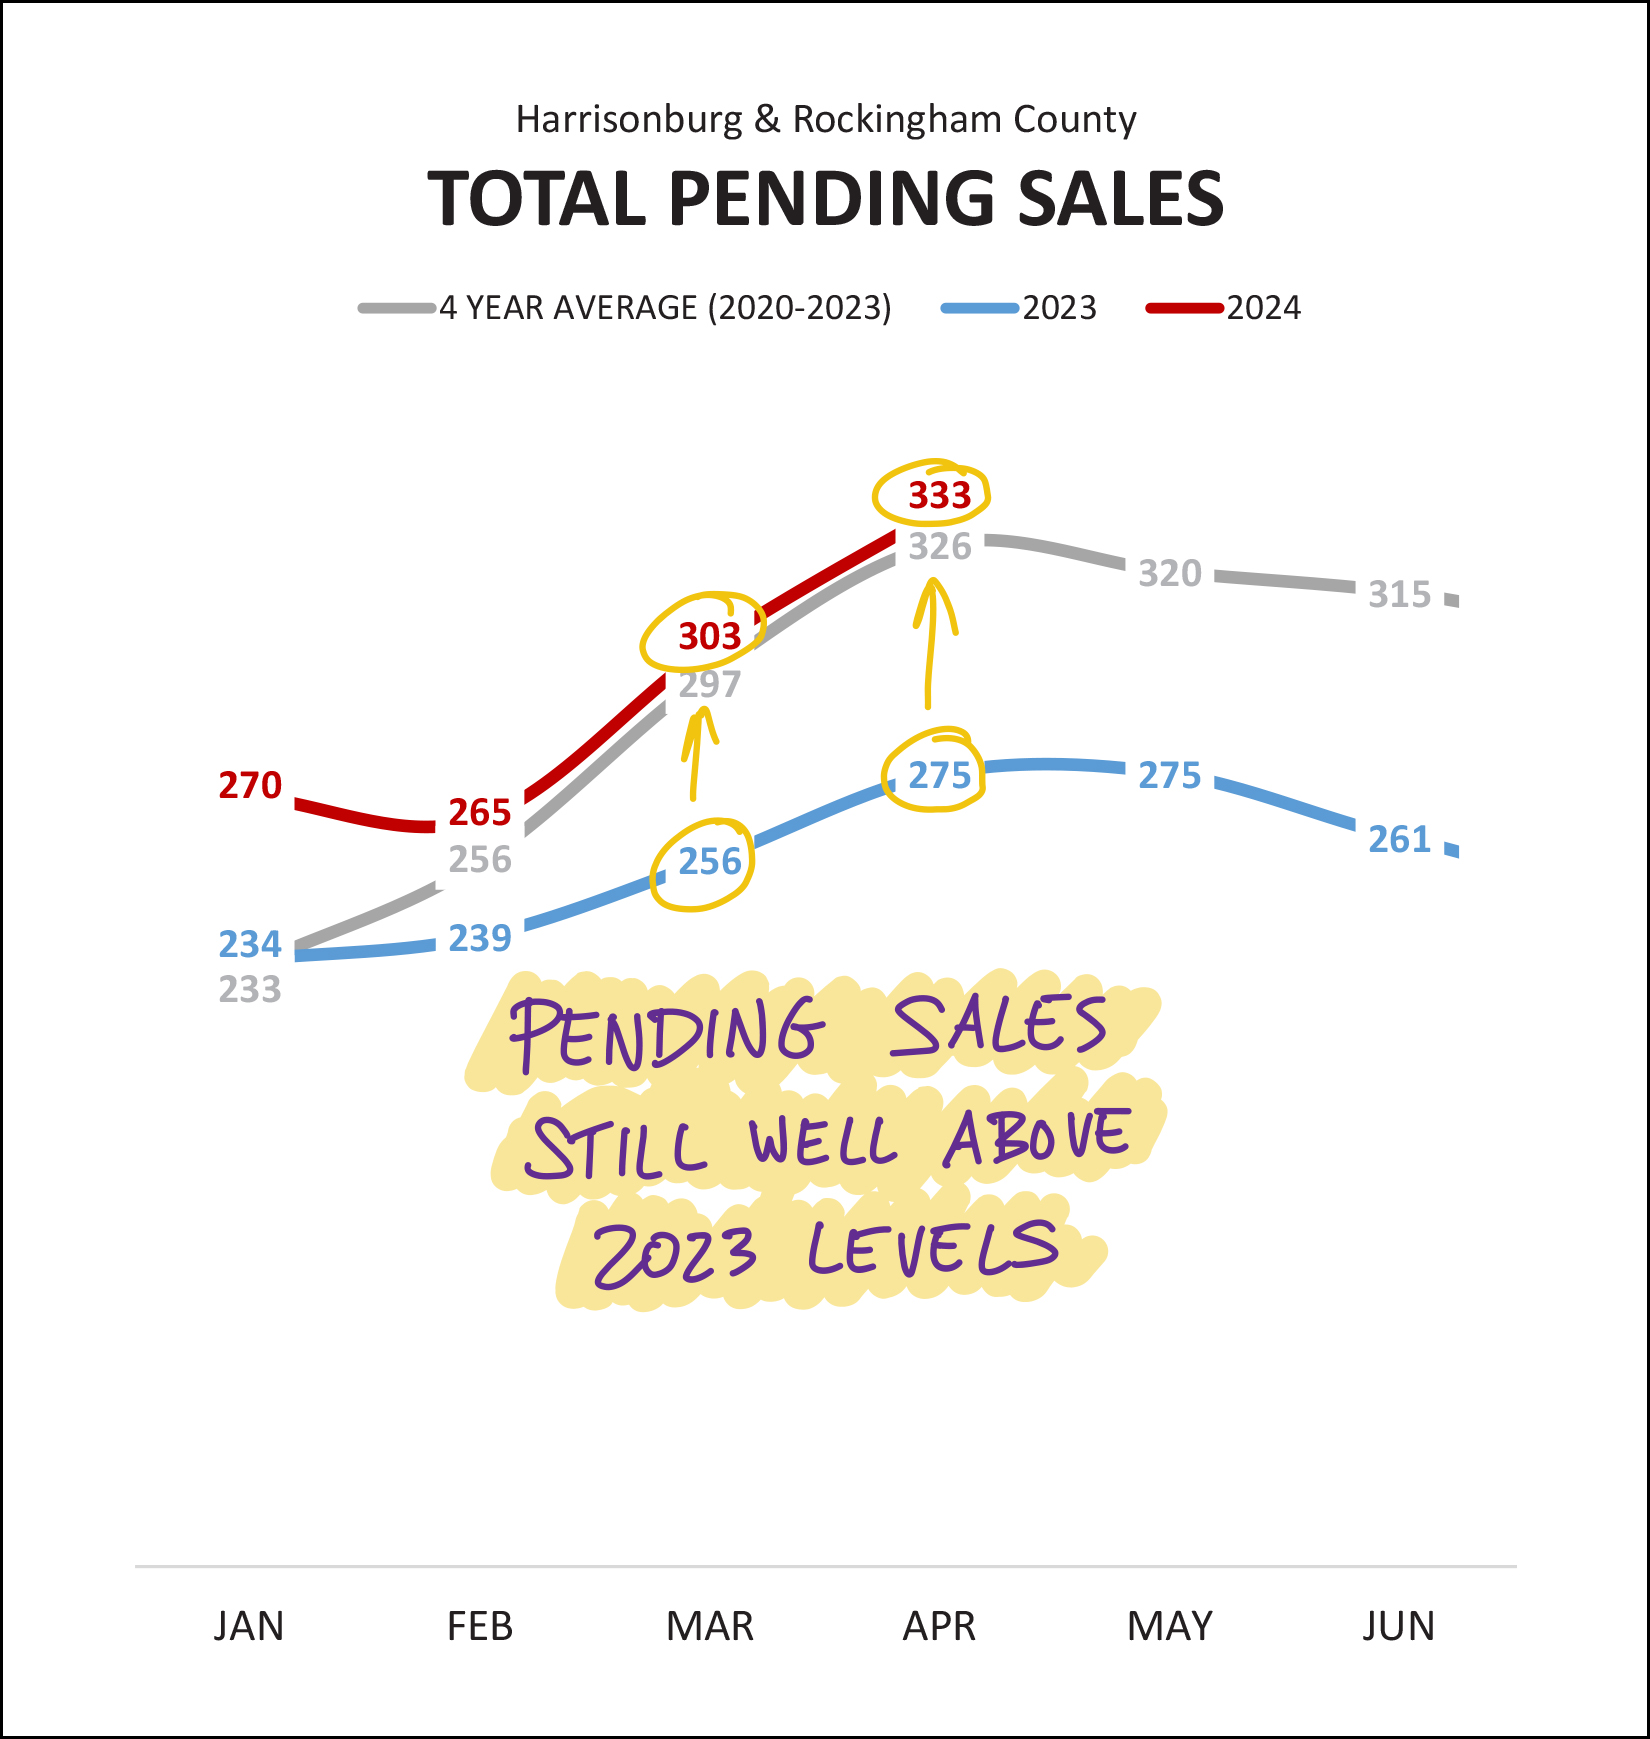 There are currently 333 homes under contract (waiting to go to closing) in Harrisonburg and Rockingham County... compared to only 275 homes being under contract at the same time last year. Higher numbers of homes going under contract in March and April of this year has resulted in this higher number of pending sales, which should (within the next month or two) translate into higher numbers of closed sales. And yet, just to throw one more metric into the mix to at least partially make you scratch your head and think on this Monday morning... 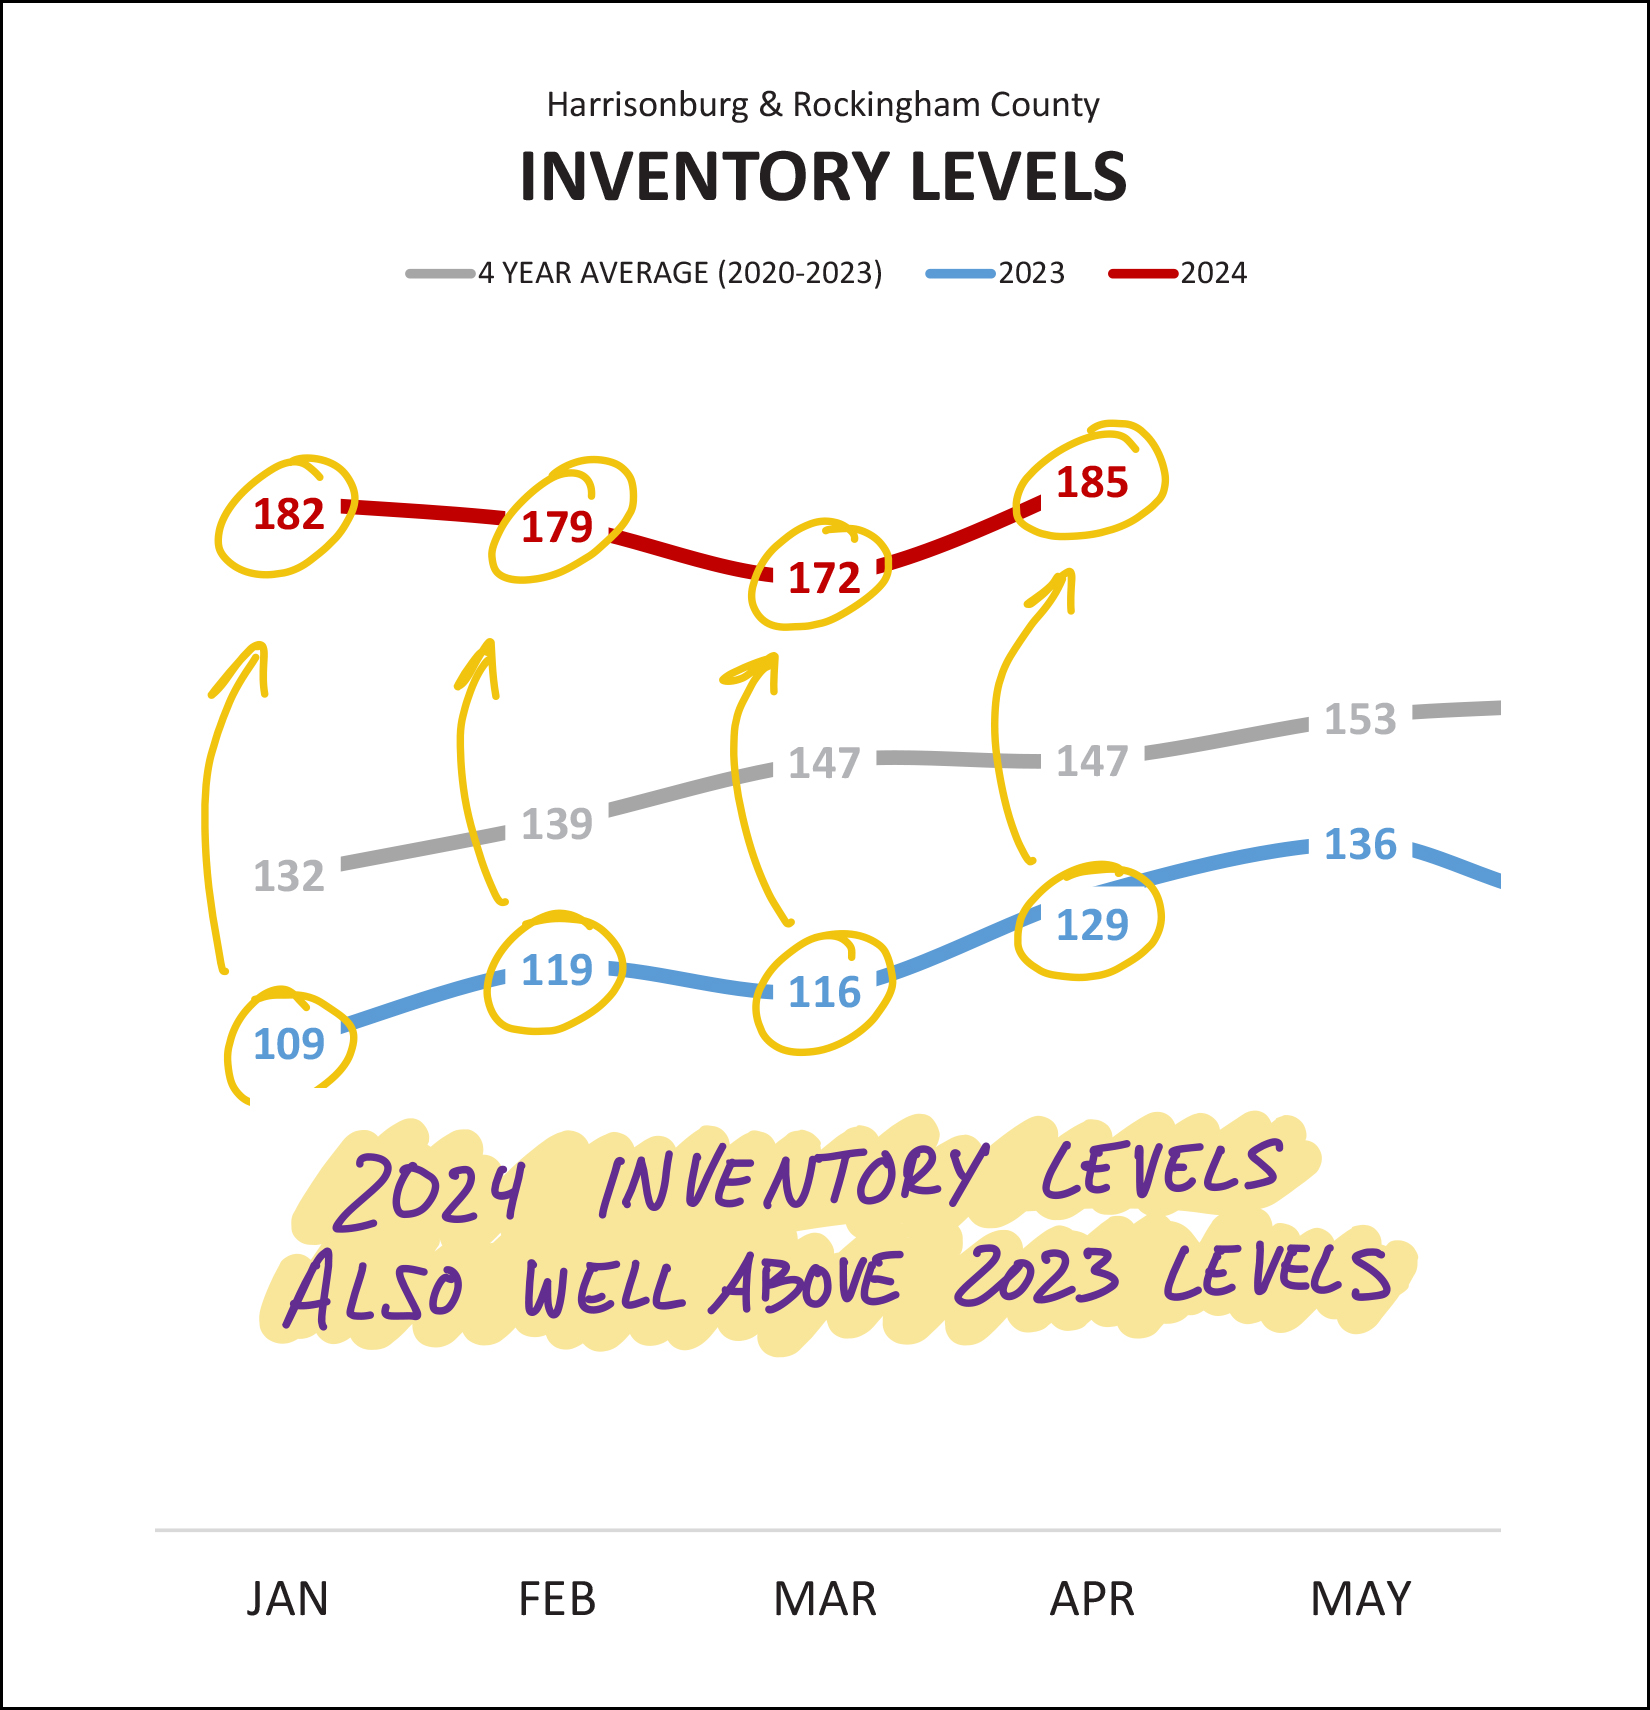 As shown above, inventory levels are tracking a good bit higher at the start of this year (172-185) than they were last year (109-129) and also well above the four year average (132-147). So, why are there more homes on the market (at any given point) this year than last? My two leading theories are... [1] Homes are going under contract (days on market) a bit more slowly this year than last, which could result in slightly higher inventory levels. [2] Quite a few (31%) of these active listings (58 of 185) are new homes... some of which have not yet been built or have not yet been finished, which might result in them remaining as active listings and not going under contract. Think on that mystery... home sales rising, contract activity rising, prices rising, but inventory... also rising... and let me know if you have any other theories. While you think on that, here's one more thing that is rising...  Mortgage interest rates have been above 6.5% for the entirety of the past year, and the sub-5% rates are now a distant (two years ago) memory. After steady declines in rates between October 2023 (7.79%) and December 2023 (6.61) we have seen rates trend back up over the past four months. Anyone who is waiting to buy a home until mortgage interest rates get back down to 5% -- or even 6% -- will probably have a long wait. So, what does all of this mean for you? Home Sellers - As has been the case for quite a few years now, you're in a great position. You will likely be selling your home at a higher price than would have been possible over the past few years. Remember, though, that mortgage interest are high, which make mortgage payments for buyers quite high, so make sure your list price is in line with recent sales so that you have enough buyer interest to hopefully see your home quickly go under contract. Home Buyers - Depending on your price range and the type of property you hope to buy, you may or may not have LOTS of competition. I am currently seeing some properties linger on the market for a week or more without any offers... and some going under contract within days with multiple offers. Talk to a lender to get a sense of where you can be and where you want to be with your mortgage payment and purchase price, and then let's start getting out there to see some homes and get a feel for the market so that you're ready to confidently move forward when the right house hits the market. Home Owners - If your current home works well (or well enough) for you - enjoy your likely low housing payment (depending on when you bought or refinanced) and enjoy the increasing equity you likely have in your home. As much as excited would-be home buyers might wish you would sell your home so they have more options for buying... I can't blame you for staying put and enjoying where you are. Renters - Plenty of folks are not homeowners and are not planning to buy anytime soon, or do not see themselves being able to buy anytime soon. This is completely understandable given the significant increases in sales prices and mortgage interest rates over the past five years. If you are on the edge of being able to or interested in buying, don't hesitate to have a preliminary conversation with a lender and/or with me to get a sense of what it would look like to buy a home... especially given how rental rates keep on increasing. And... that's a wrap, folks. You are about as well informed as is possible on the overall Harrisonburg and Rockingham County real estate market on this Monday morning. But if you have questions about a specific segment of the housing market, or about your neighborhood, or about your home... feel free to ask! Until next month... [1] Check out the complete set of May 2024 charts and graphs here. [2] If you're getting ready to buy, let's chat about the process, the market and what you hope to buy. You'll also want to talk to a lender sooner rather than later. [3] If you're getting ready to sell, let's meet soon to talk about the market, the process, your house, your timing and your goals. To touch base with me about any of the above, call/text me at 540-578-0102 or email me here. Enjoy your Monday! | |
Home Sales Are On The Rise Again In 2024 With Slightly Smaller Increases In Home Prices |
|
 Happy Friday morning, friends! We're having some warmer (and mostly sunny) days this week in the Shenandoah Valley. We probably needed yesterday's rain, though unfortunately it didn't result in another rainbow like the incredible double rainbow that showed up last week...  Warmer weather finds me running outside more these days, preparing for a few races over the next few months... which leads me to my monthly giveaway for readers of my monthly market report. This month you have a chance to win a $50 gift certificate to Sole Focus Running, a new running shop in downtown Harrisonburg. Click here to enter for a chance to win a $50 gift certificate to Sole Focus Running! Now, let's dive right into the latest data from our local real estate market... 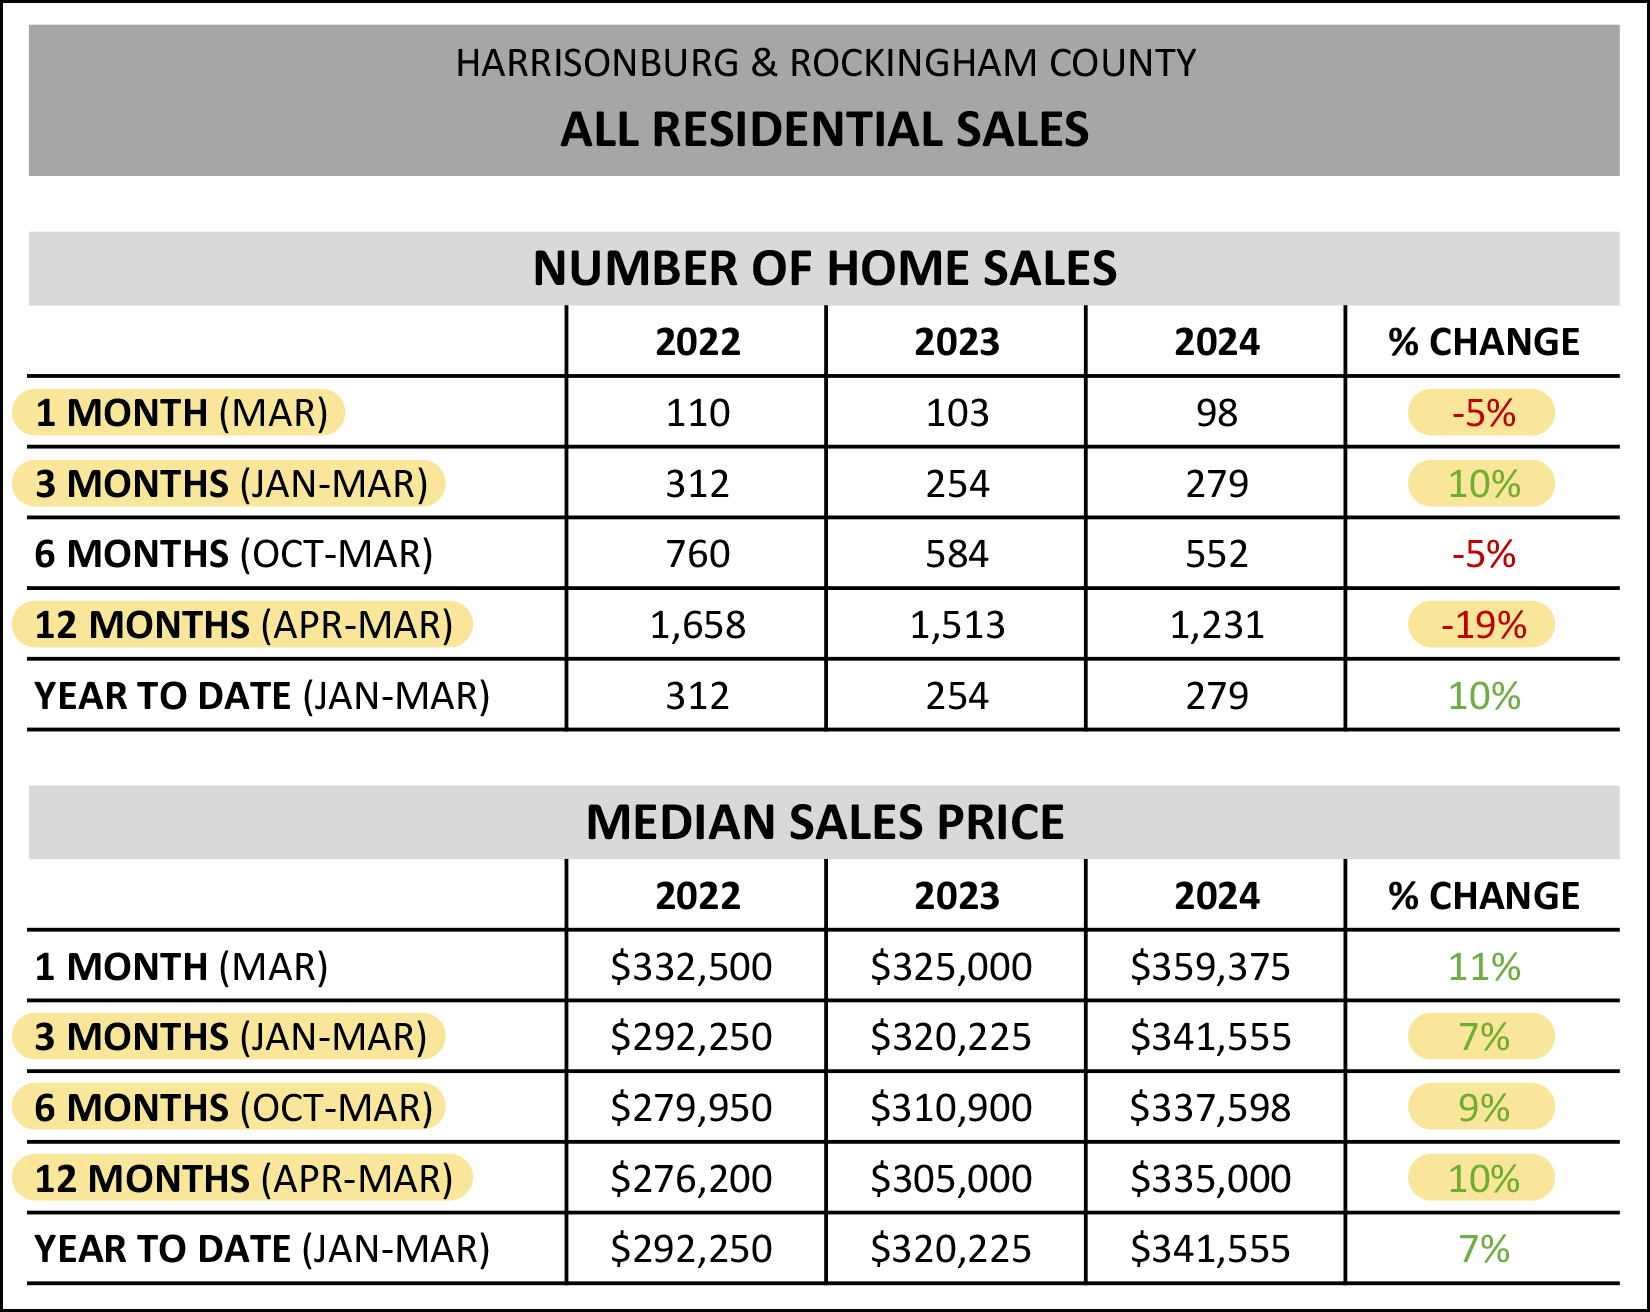 A few items to call out from the data table above... [1] Home sales in March were actually slightly slower this year (98) than last year (103) but not by much. [2] When we look at the first three months of 2024 we'll note a 10% increase in home sales this year (279) compared to last year (254) - which is a reversal of the downward trend seen between the first quarter of 2022 and 2023. [3] When looking at a full year of data, we're still seeing a 19% decline in home sales in the city and county, but again, it seems that trend may be reversing itself in 2024... at least thus far. [4] The median sales price is undoubtedly still increasing in Harrisonburg and Rockingham County... but maybe not as quickly as over the past few years. When looking a year of data we see a 10% increase in the median sales price. When we look just at the most recent six months, it's a 9% increase. When we look just at the most recent three months, it's a 7% increase. So, prices are still rising, but the pace at which they are rising might be declining. Say that five times fast. One particularly squeezed portion of the local housing market is the City of Harrisonburg. It's a tough time to try to buy a home in the City of Harrisonburg because of how few homes are available to purchase... 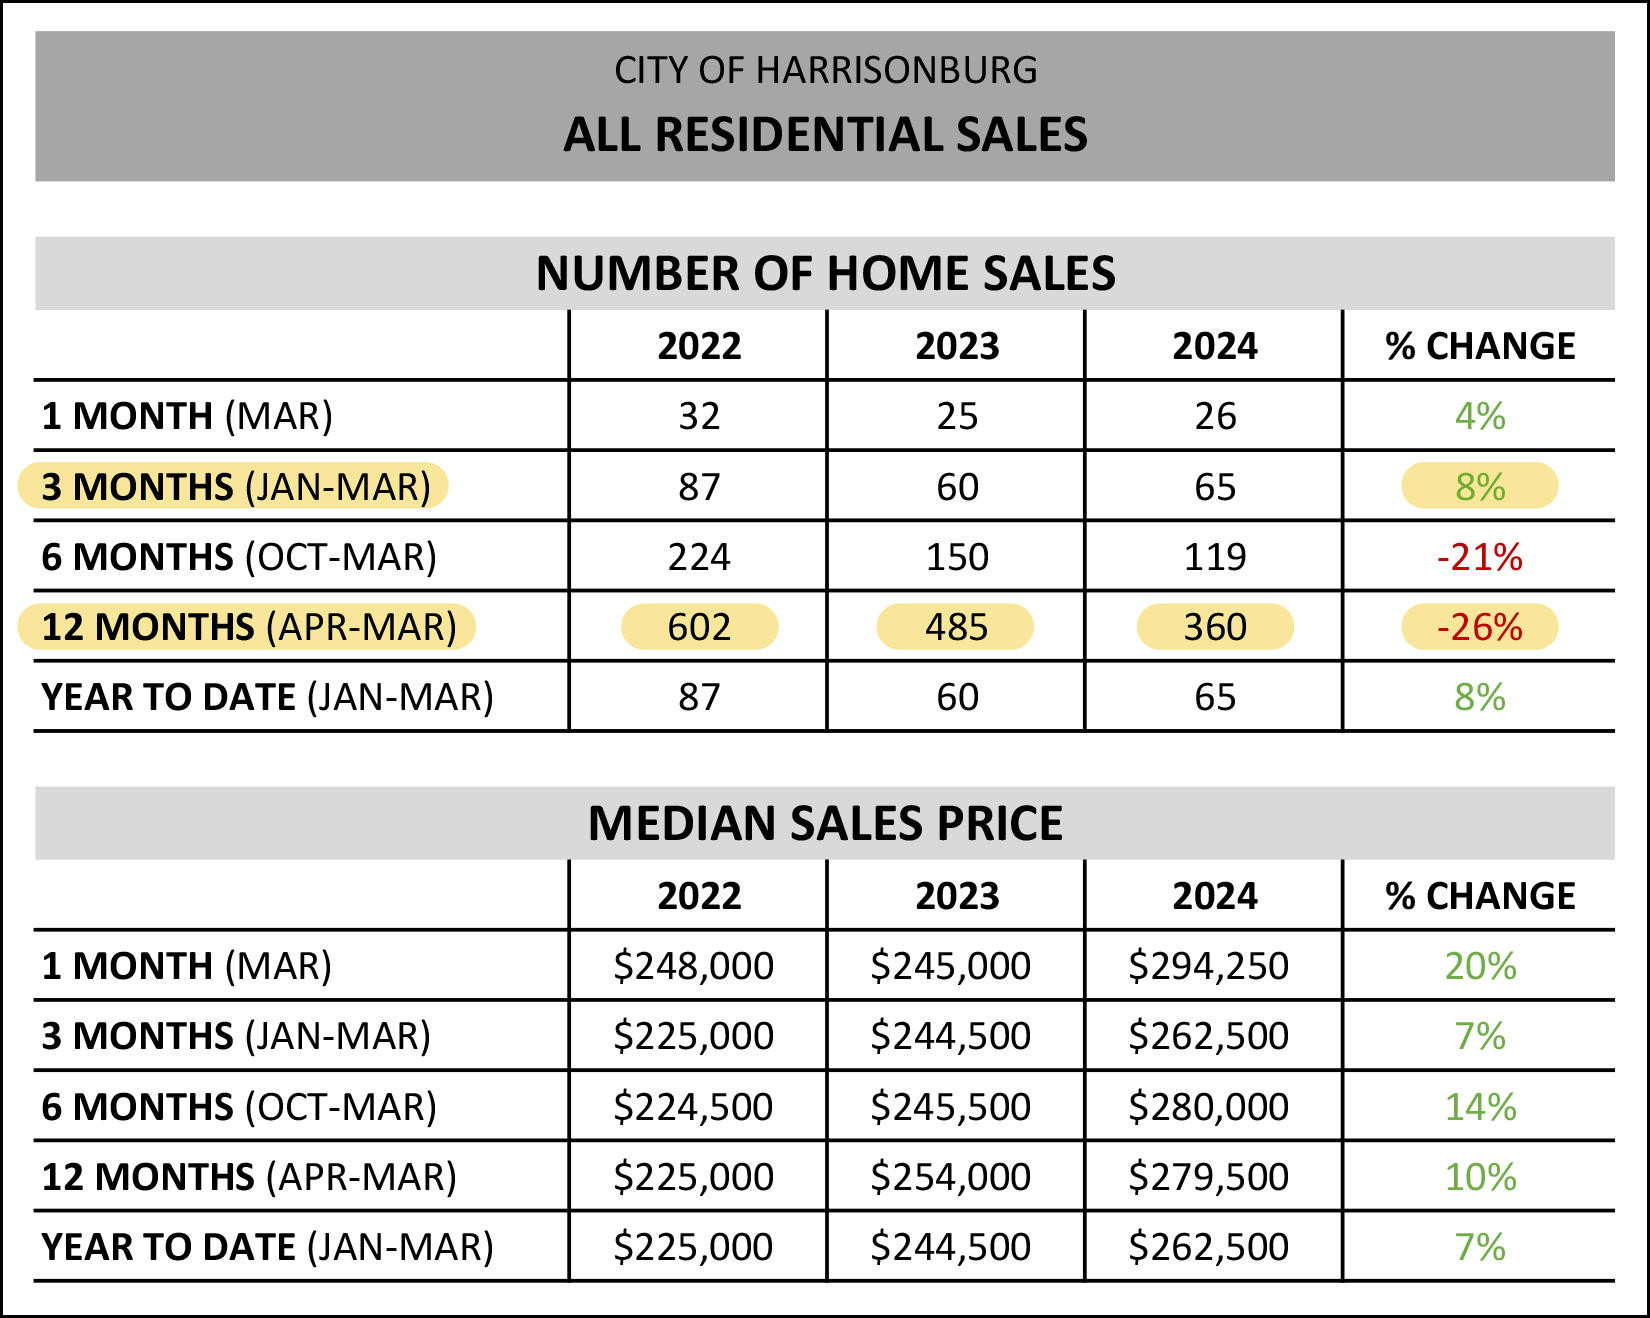 As shown above, yes, we're seeing a slight (8%) increase in home sales in the first quarter of 2024 in the City of Harrisonburg -- but that is against a backdrop of a 26% decline over the past year (from 485 to 360) and a 40% decline over the past two years (from 602 to 360). Far fewer sellers are selling, resulting in far fewer buyers being able to buy. The bottom half of the data tables above show that prices keep on increasing in the City of Harrisonburg, in some instances at faster rates than in the overall market. Now, then, let's get to some pretty graphs to help us further understand the market... 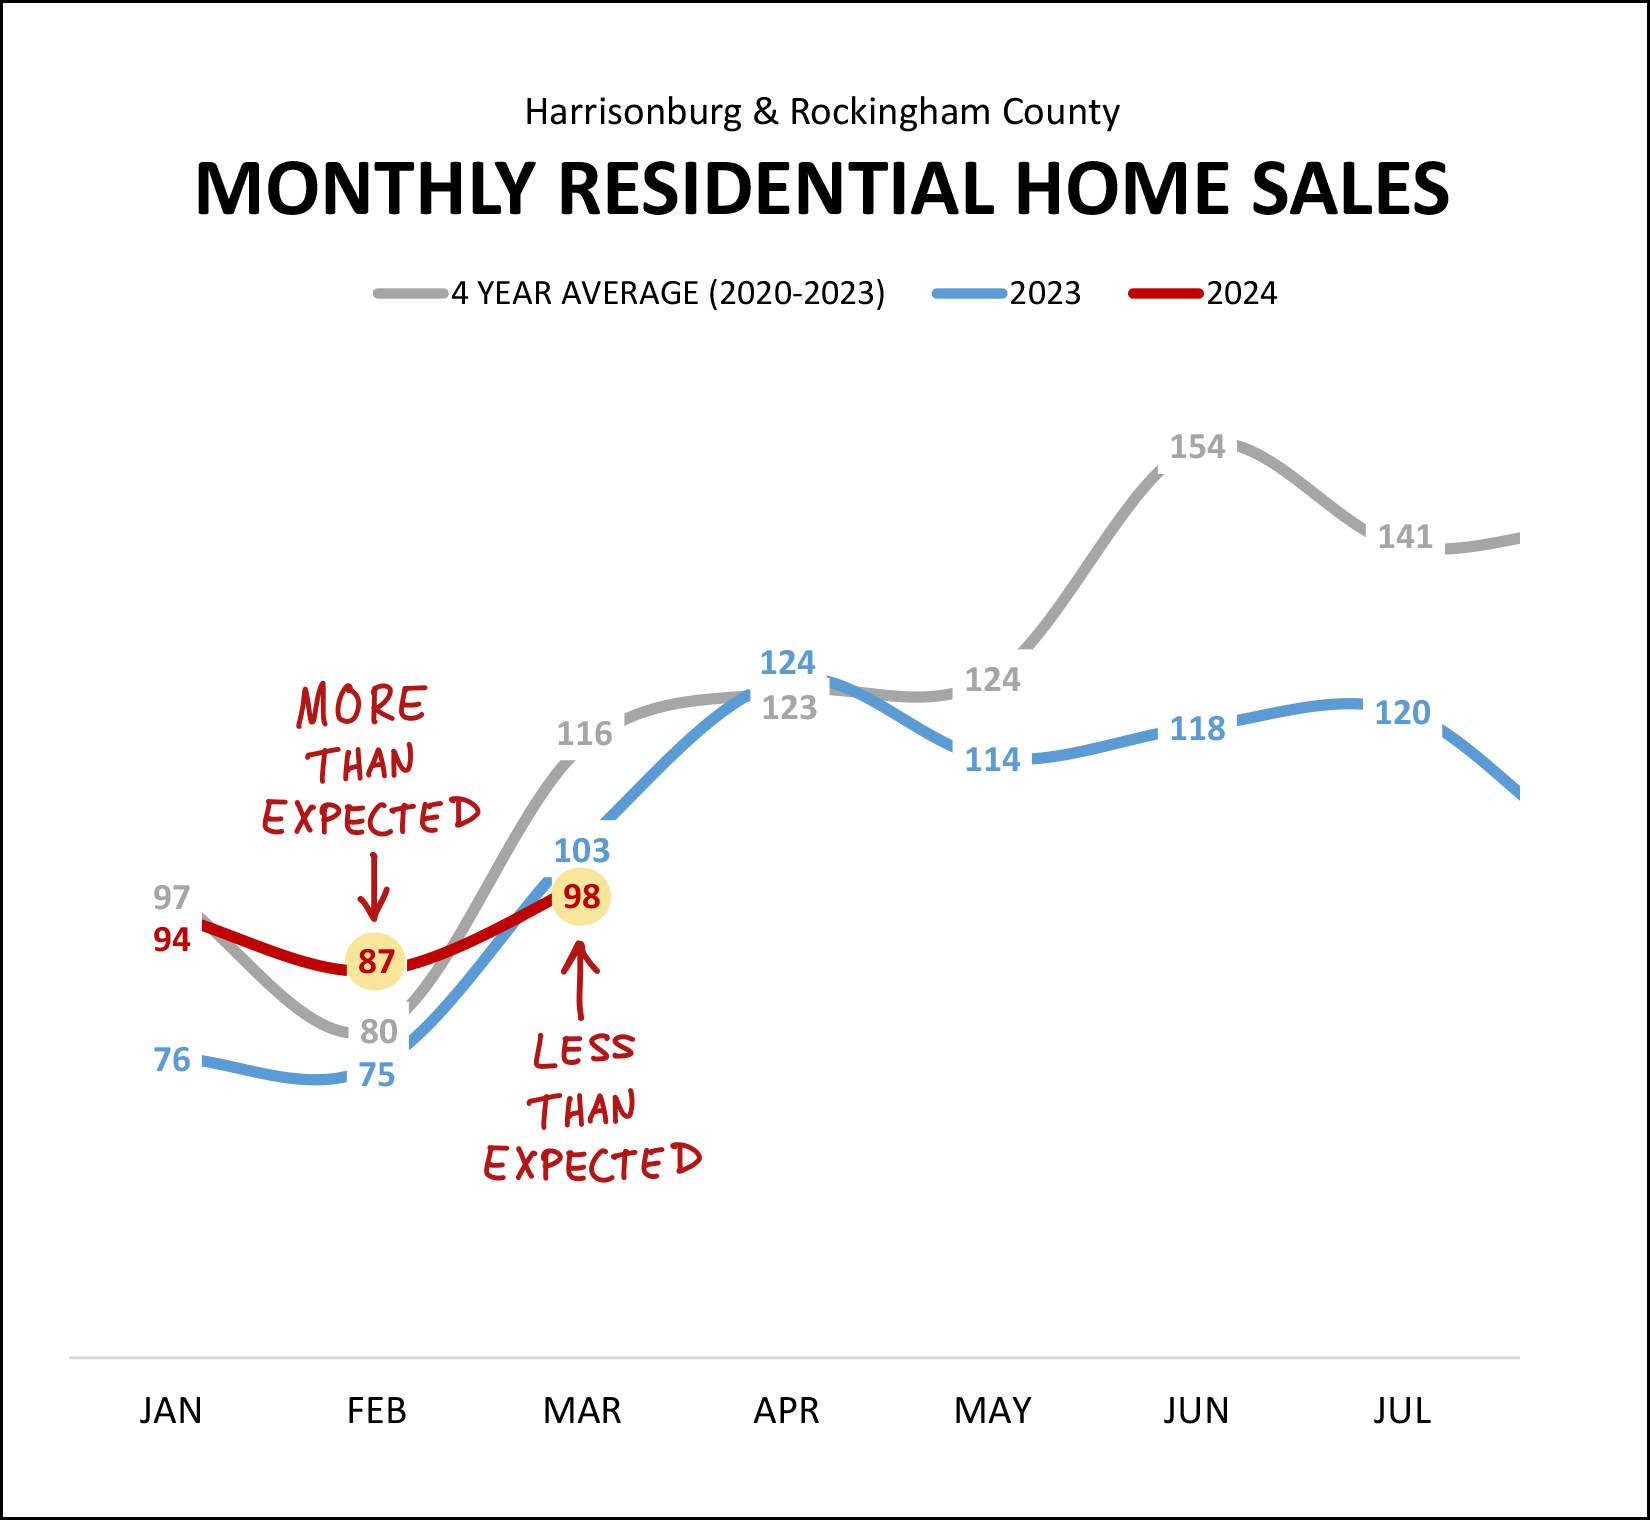 As shown above, home sales in February were a bit higher than expected and March were a bit lower than expected. Home sales popped up from 75 to 87 in February... and then dropped from 103 to 98 in March. Looking ahead, it seems likely that we will continue to see stronger months of home sales as we move through April and May... which will become even more evident when you read a bit further on in this report and see the amount of contract activity in March. :-) But, before we get there, let's look at the first quarter of 2024 compared to the past few years in our local market... 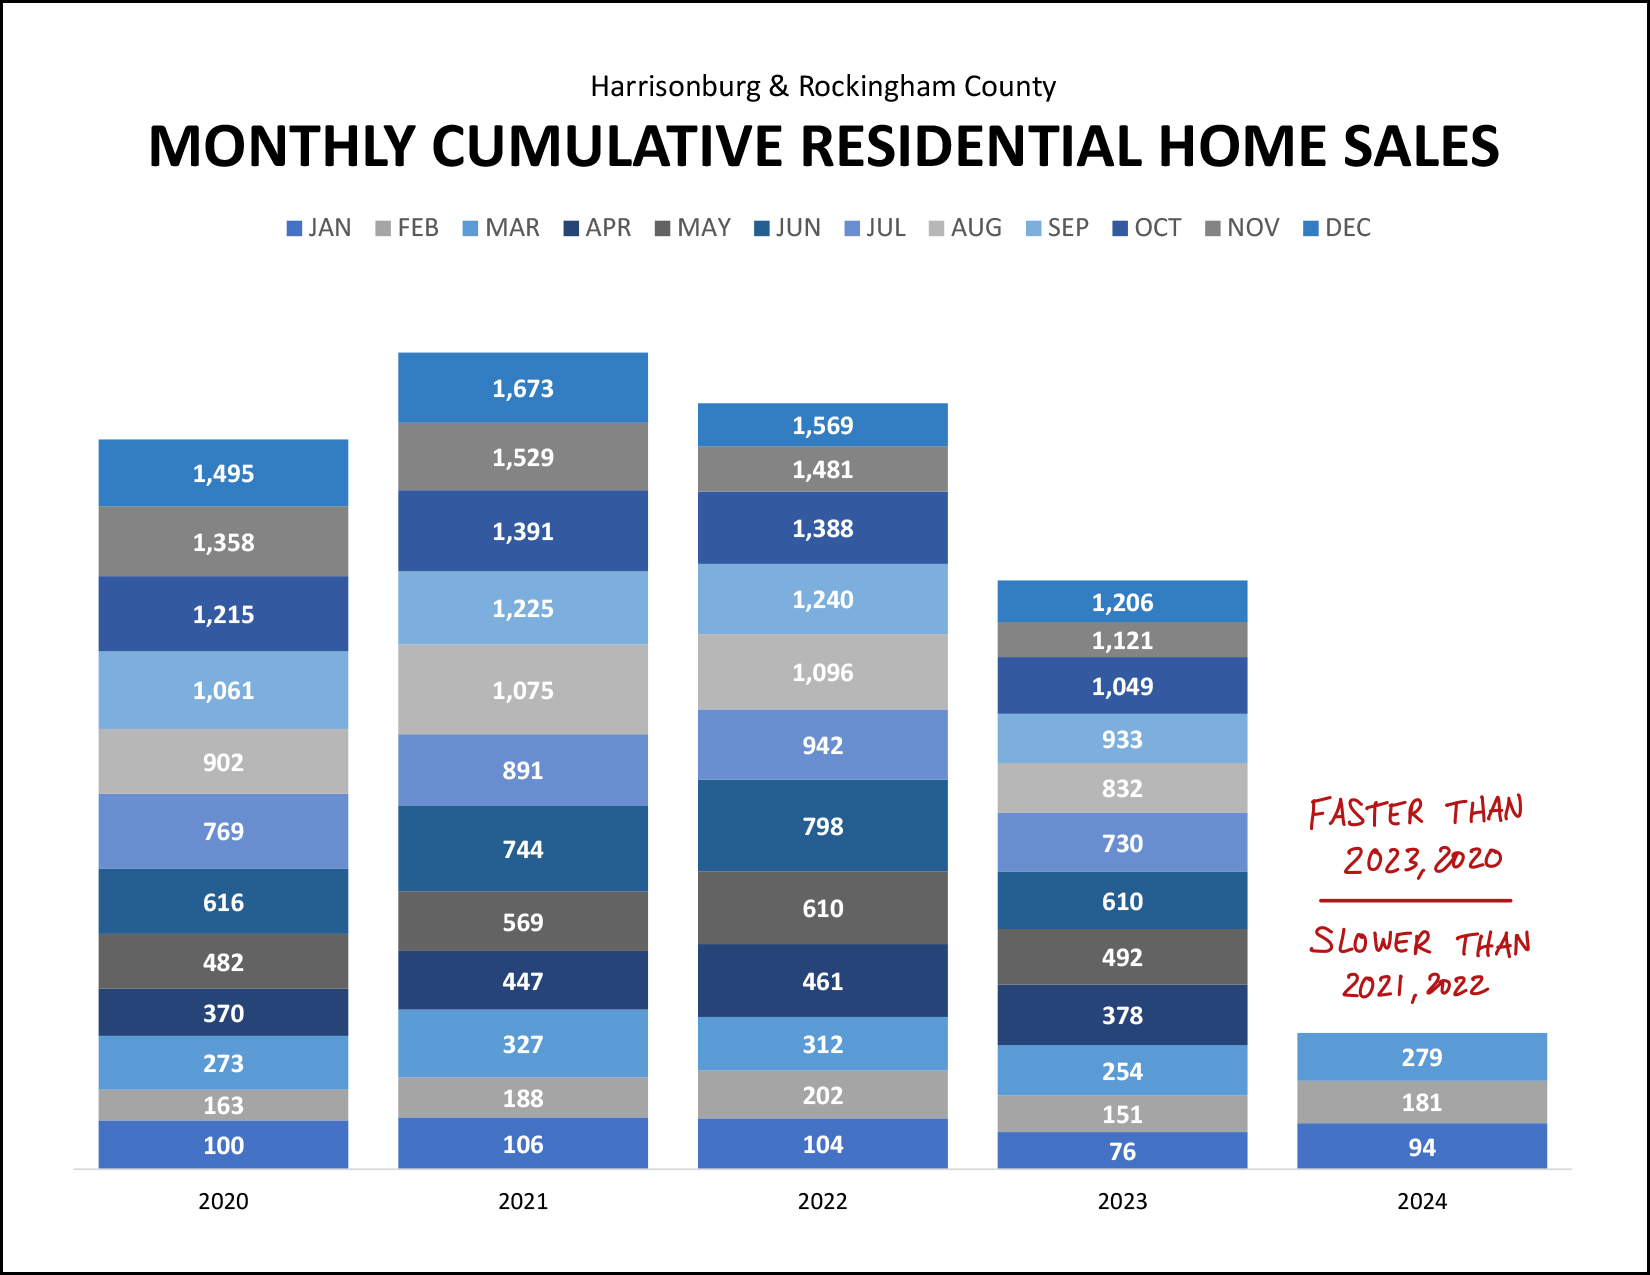 As 2024 began, I wasn't sure what to expect as to how many homes would sell this year in Harrisonburg and Rockingham County. The number of annual sales peaked at 1,673 homes sold in 2021 -- before falling in 2022 and 2023 down to only 1,206 homes sold last year. How, then, would 2024 shape up in our local housing market? Now three months into the year, we can start to have a sense of what we might expect this year. We have seen more home sales in the first quarter of this year (279) than we saw in the first quarter last year (254) and more than in the first quarter of 2020 (273) -- but we have certainly seen fewer than in the first quarter of 2021 (327) and 2022 (312). As such, perhaps we'll see a slight uptick in home sales in 2024? It's probably still too early to tell, but maybe we'll see more than 1,206 home sales this year in Harrisonburg and Rockingham County. Now, let's look at that annual pace of home sales in a slightly different way... 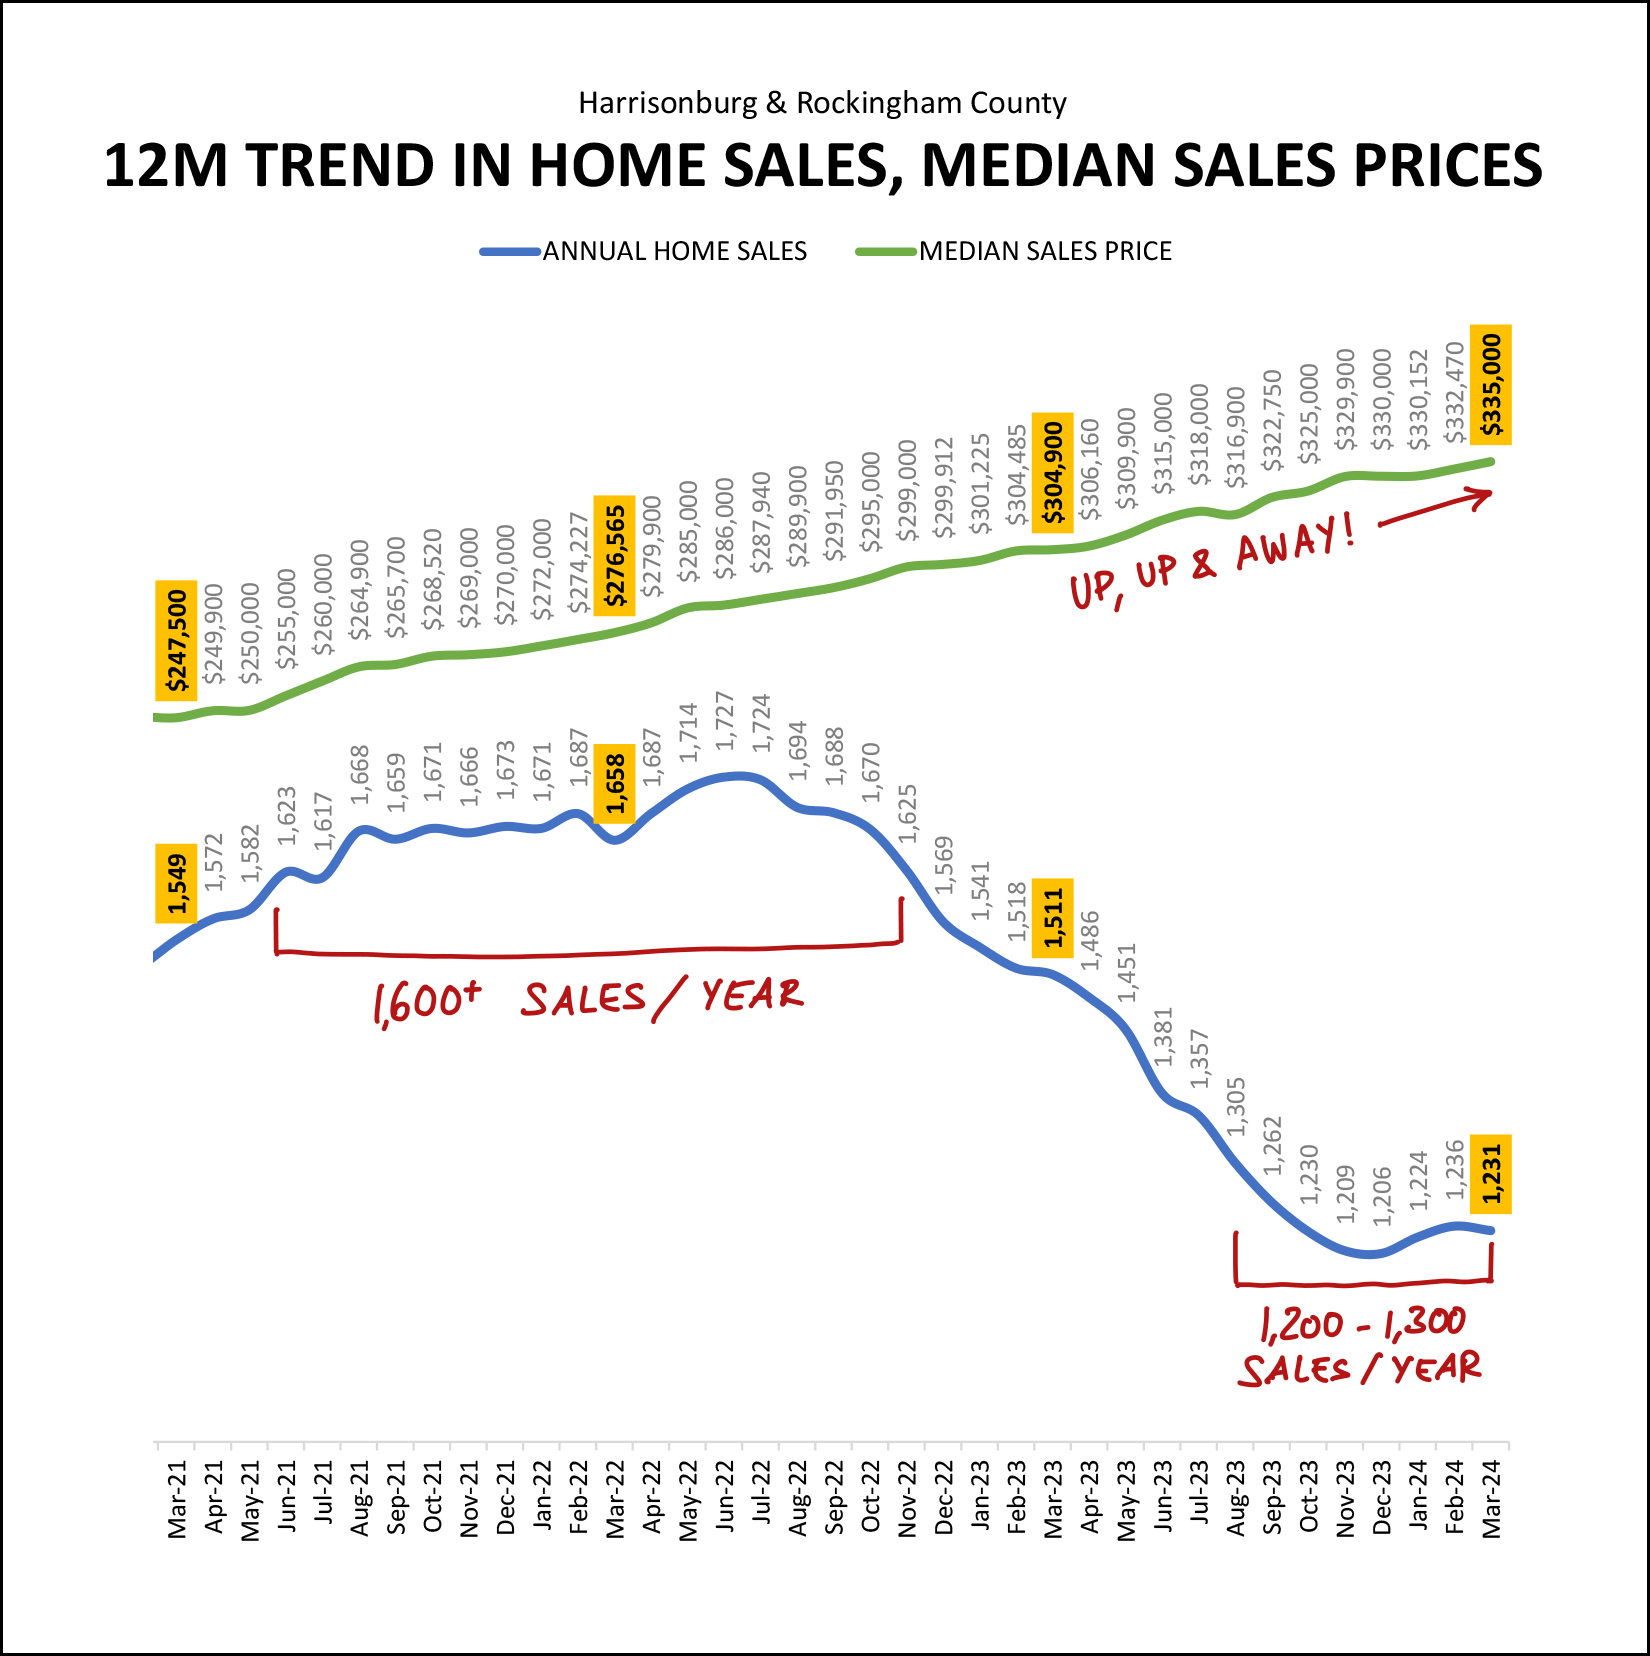 As shown above, for a year and a half we were consistently seeing 1,600+ home sales in a 12 month period... largely due to super low (historically low) mortgage interest rates during the Covid pandemic and our recovery from it. We have definitely shifted out of that high gear now and have been in the 1,200 - 1,300 home sales per year range over the past six months. As mentioned above, while it is possible that we will see further declines in the number of homes selling in our market, it is starting to seem more likely that things are stabilizing in that 1,200 to 1,300 range. Stay tuned through the remainder of 2024 to see if we continue to see a leveling out or increase in the number of homes that are selling. In addition to the likely conclusion that we are seeing a rise in home sales, it also seems quite possible that we are seeing a slowing in the pace at which home prices are increasing... 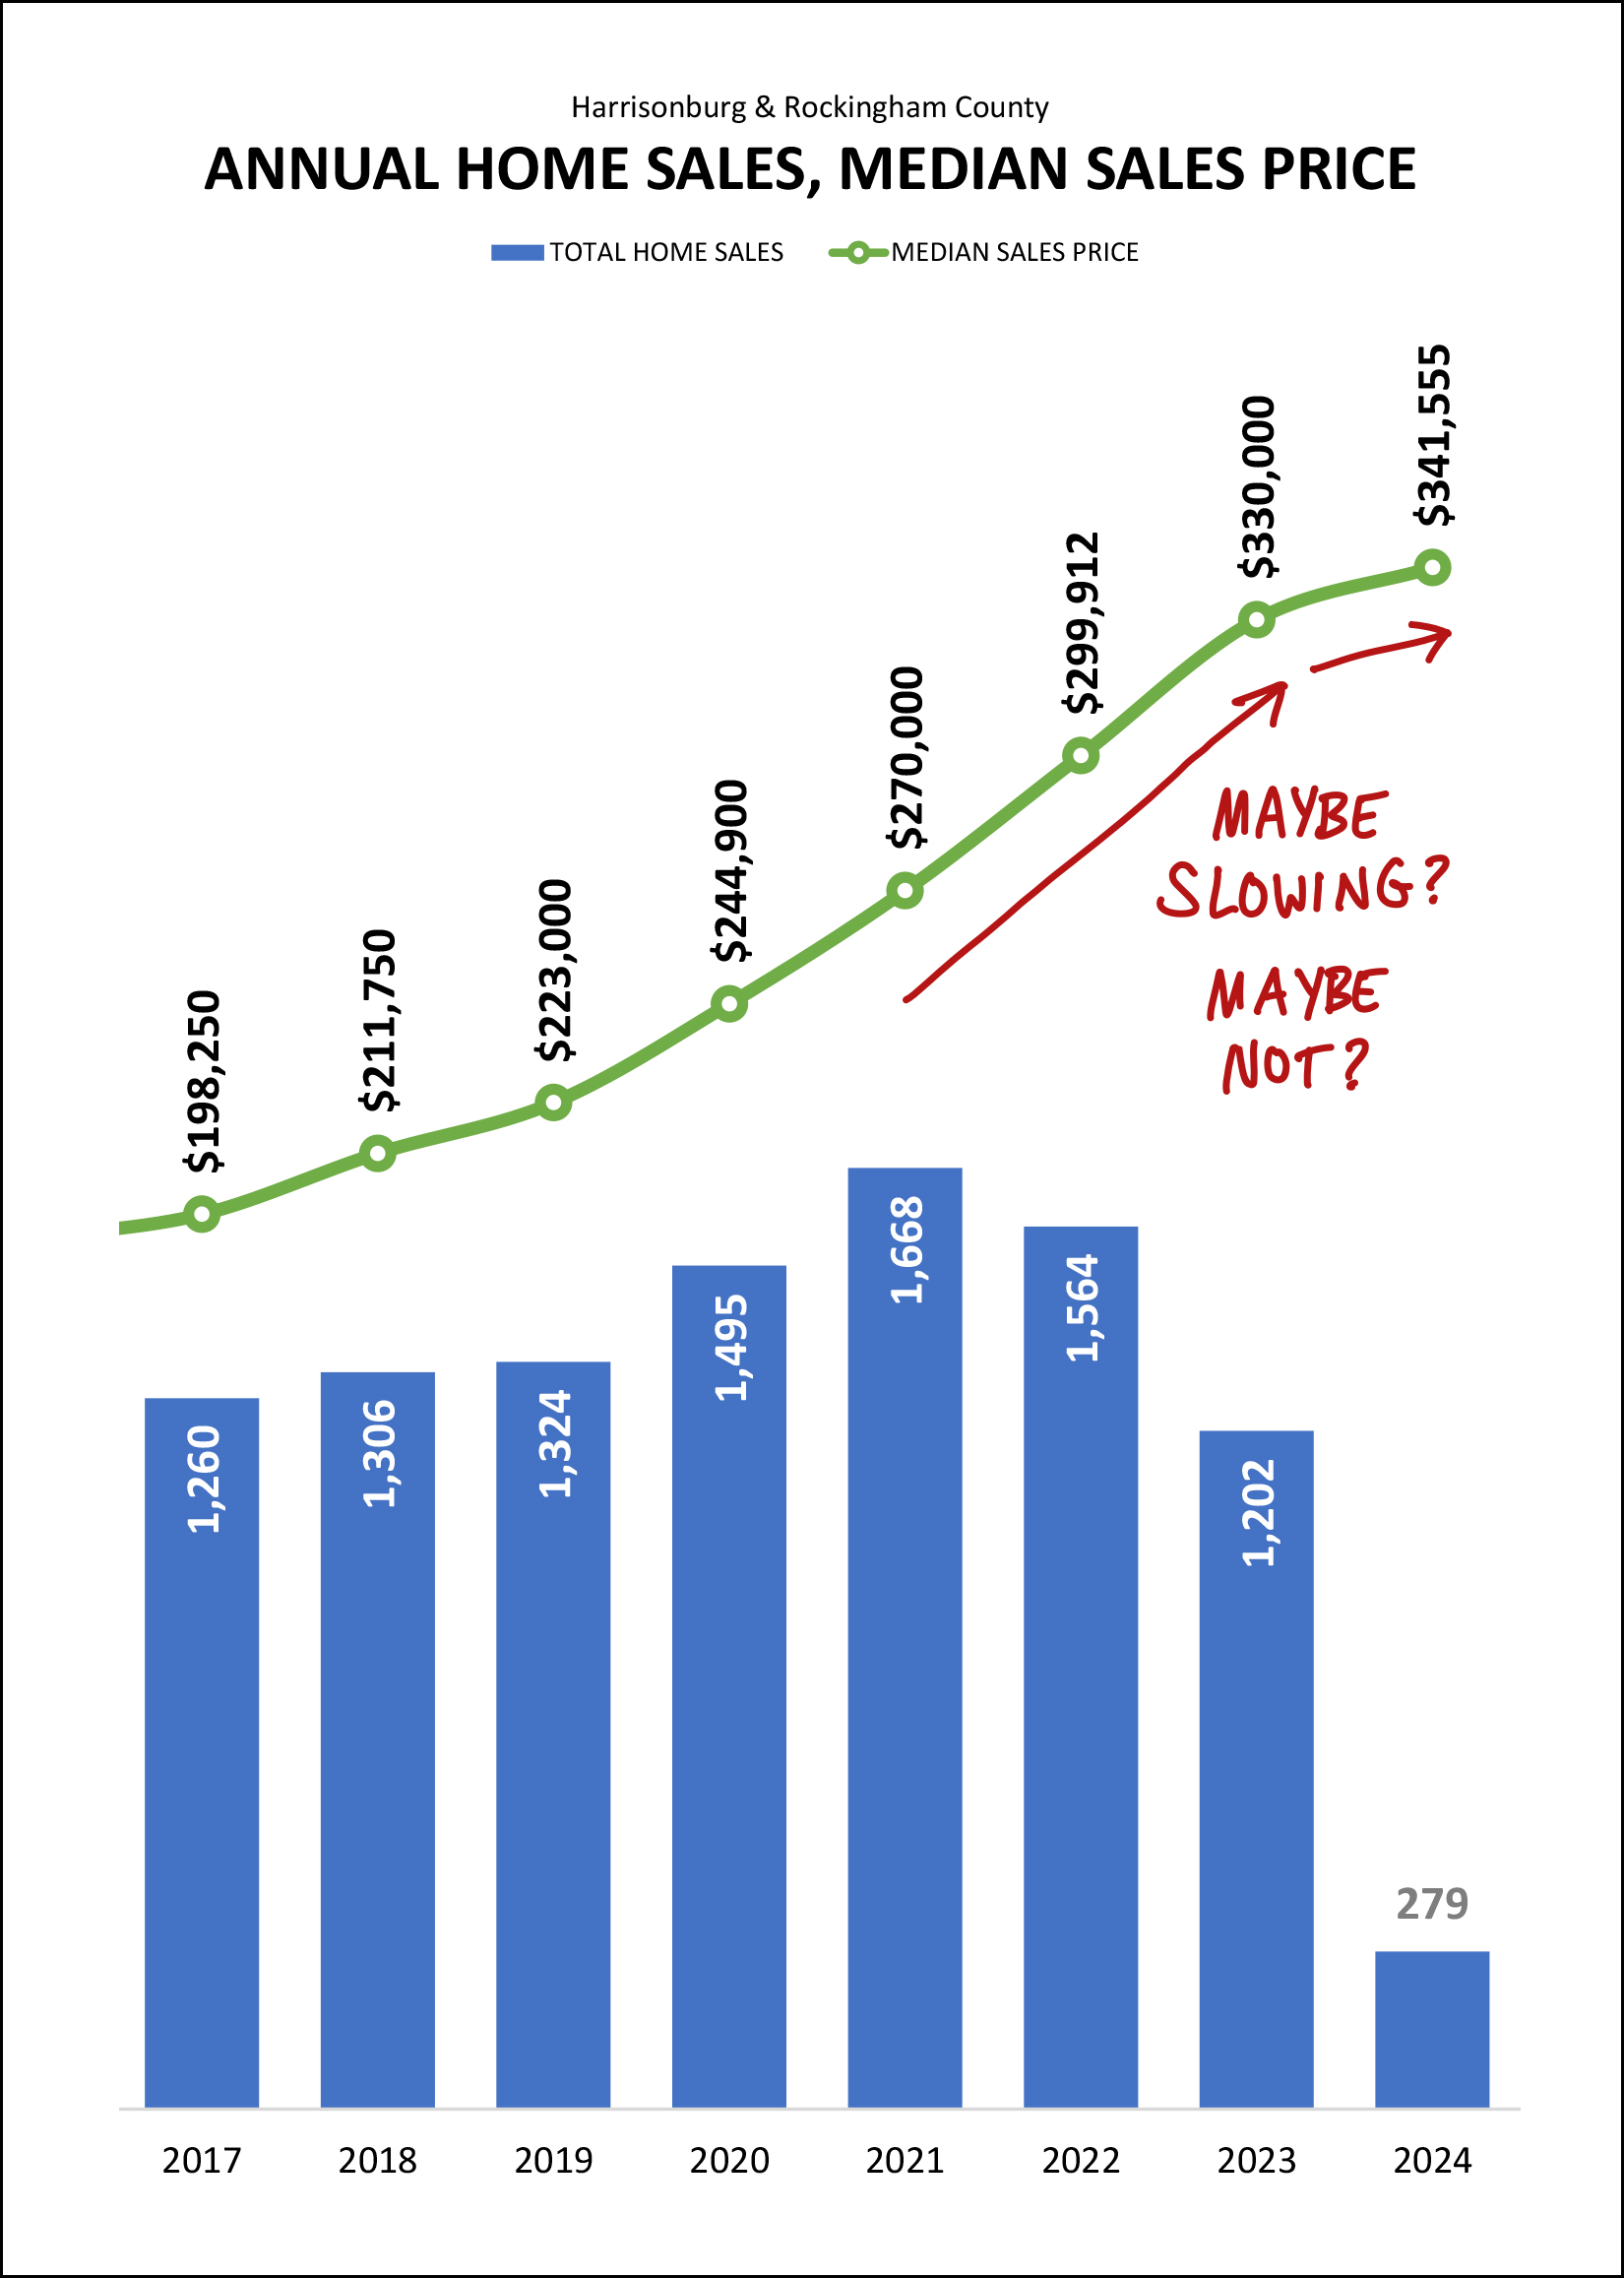 We have been seeing steady 10% per year increase in the median sales price in Harrisonburg and Rockingham County over the past four years -- but maybe this year we will see a slightly smaller increase in the median sales price? The median sales price in Harrisonburg and Rockingham County is definitely still rising... but maybe not as quickly as it has been over the past few years. Or, maybe it is still rising just as quickly, and we're just not seeing it yet with only three months of data. Given that mortgage interest rates have been much higher (sub-3% to over-6%) for over a year now, I don't think we need to think that the higher mortgage interest rates are going to cause home prices to fall. Next up, new home sales... if you bought a home last year, there is a 1 in 4 chance that you bought a new home... 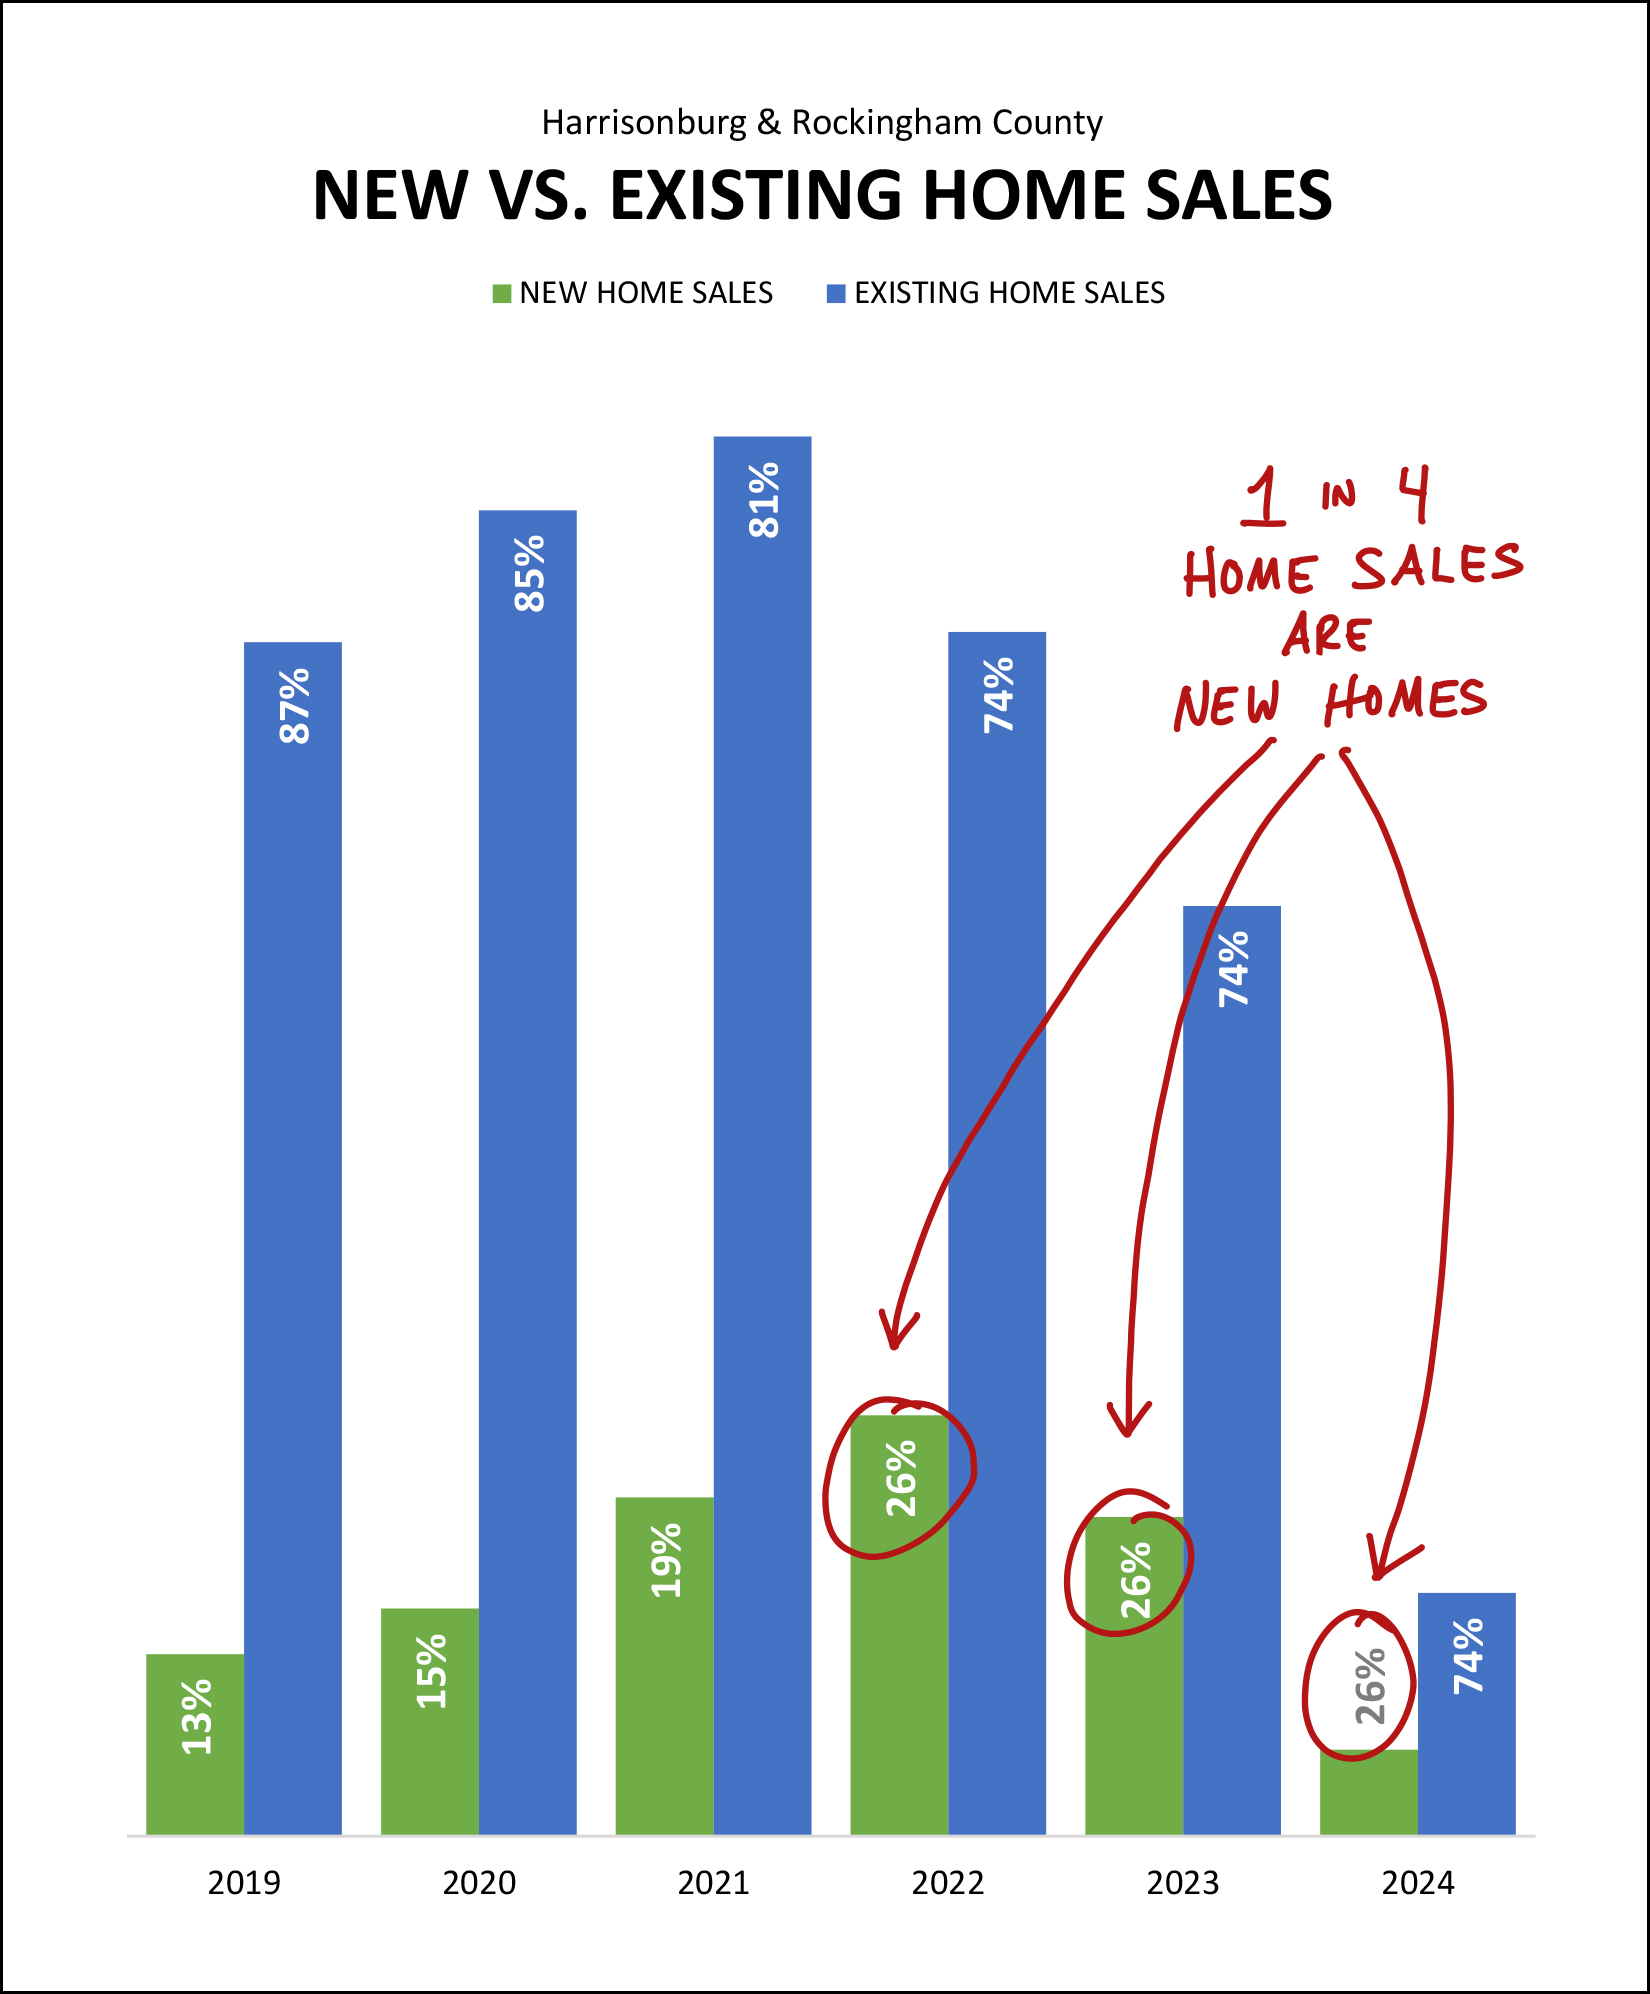 Back in 2019 only about 1 in 7 home sales was a new home... but for the past three years we have consistently seen 1 in 4 home sales being a new home. This is not likely to change much moving forward as many homeowners are choosing not to sell because they love their low mortgage interest rate. I suppose, then, we need to be thankful for so many new homes being built -- as without them, home buyers would have had even fewer options from which to choose last year when buying a home in Harrisonburg and Rockingham County. Next up, contract activity, where we'll see a bit of a surprise... 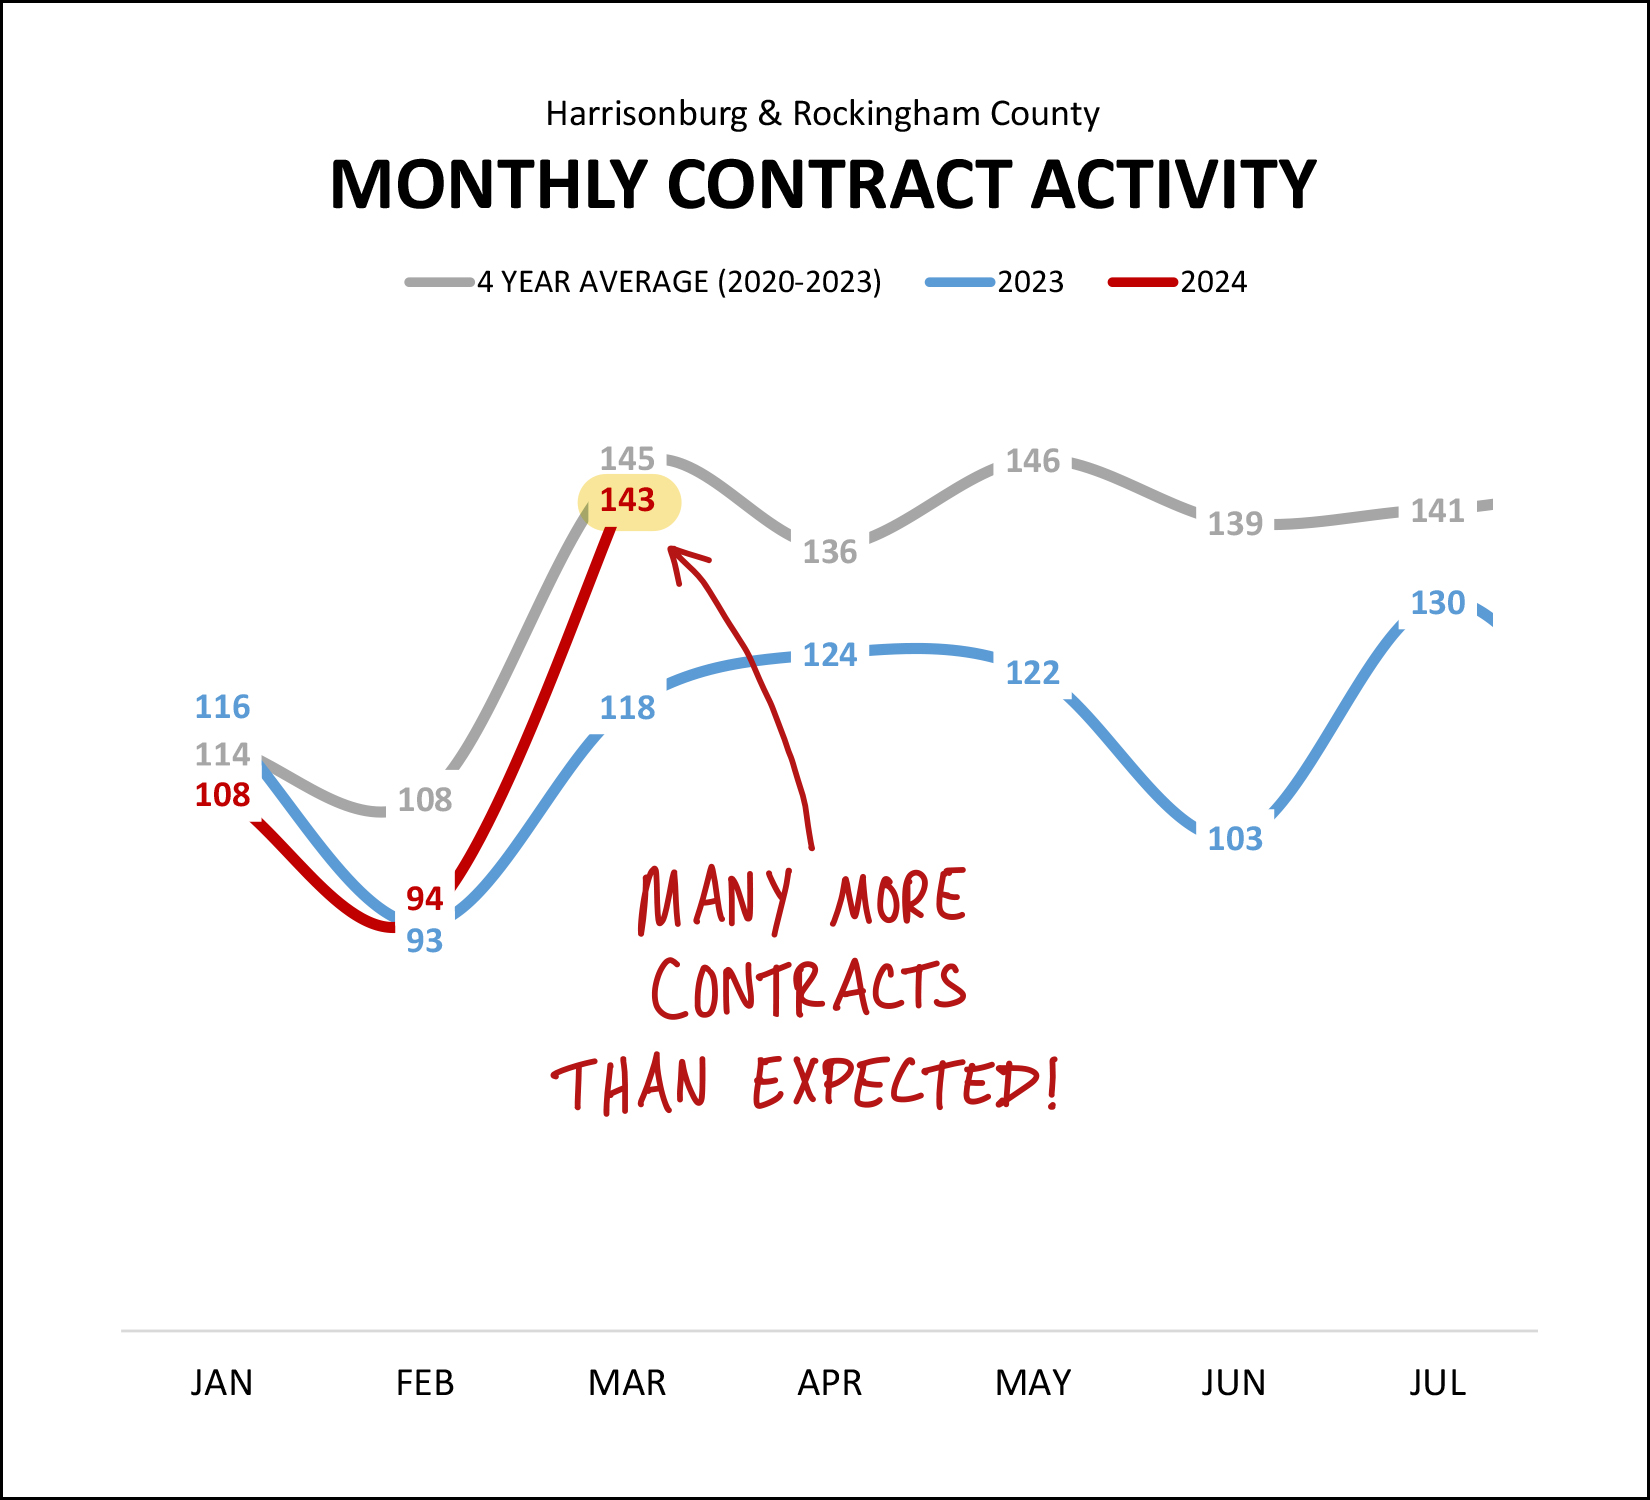 Woah! After rather typical months of contract activity in January and February (compared to previous months of January and February) we saw a sharp uptick in contract activity in March 2024. Last March we only saw buyers (and sellers) sign 118 contracts... but that figured jumped up to 143 contracts in March 2024! It will be interesting to note over the next month or two whether we continue to see elevated levels of contract activity (compared to last year) or if this was a one month phenomenon. All that contract activity may have been a part of what caused inventory levels to inch down a bit over the past month... 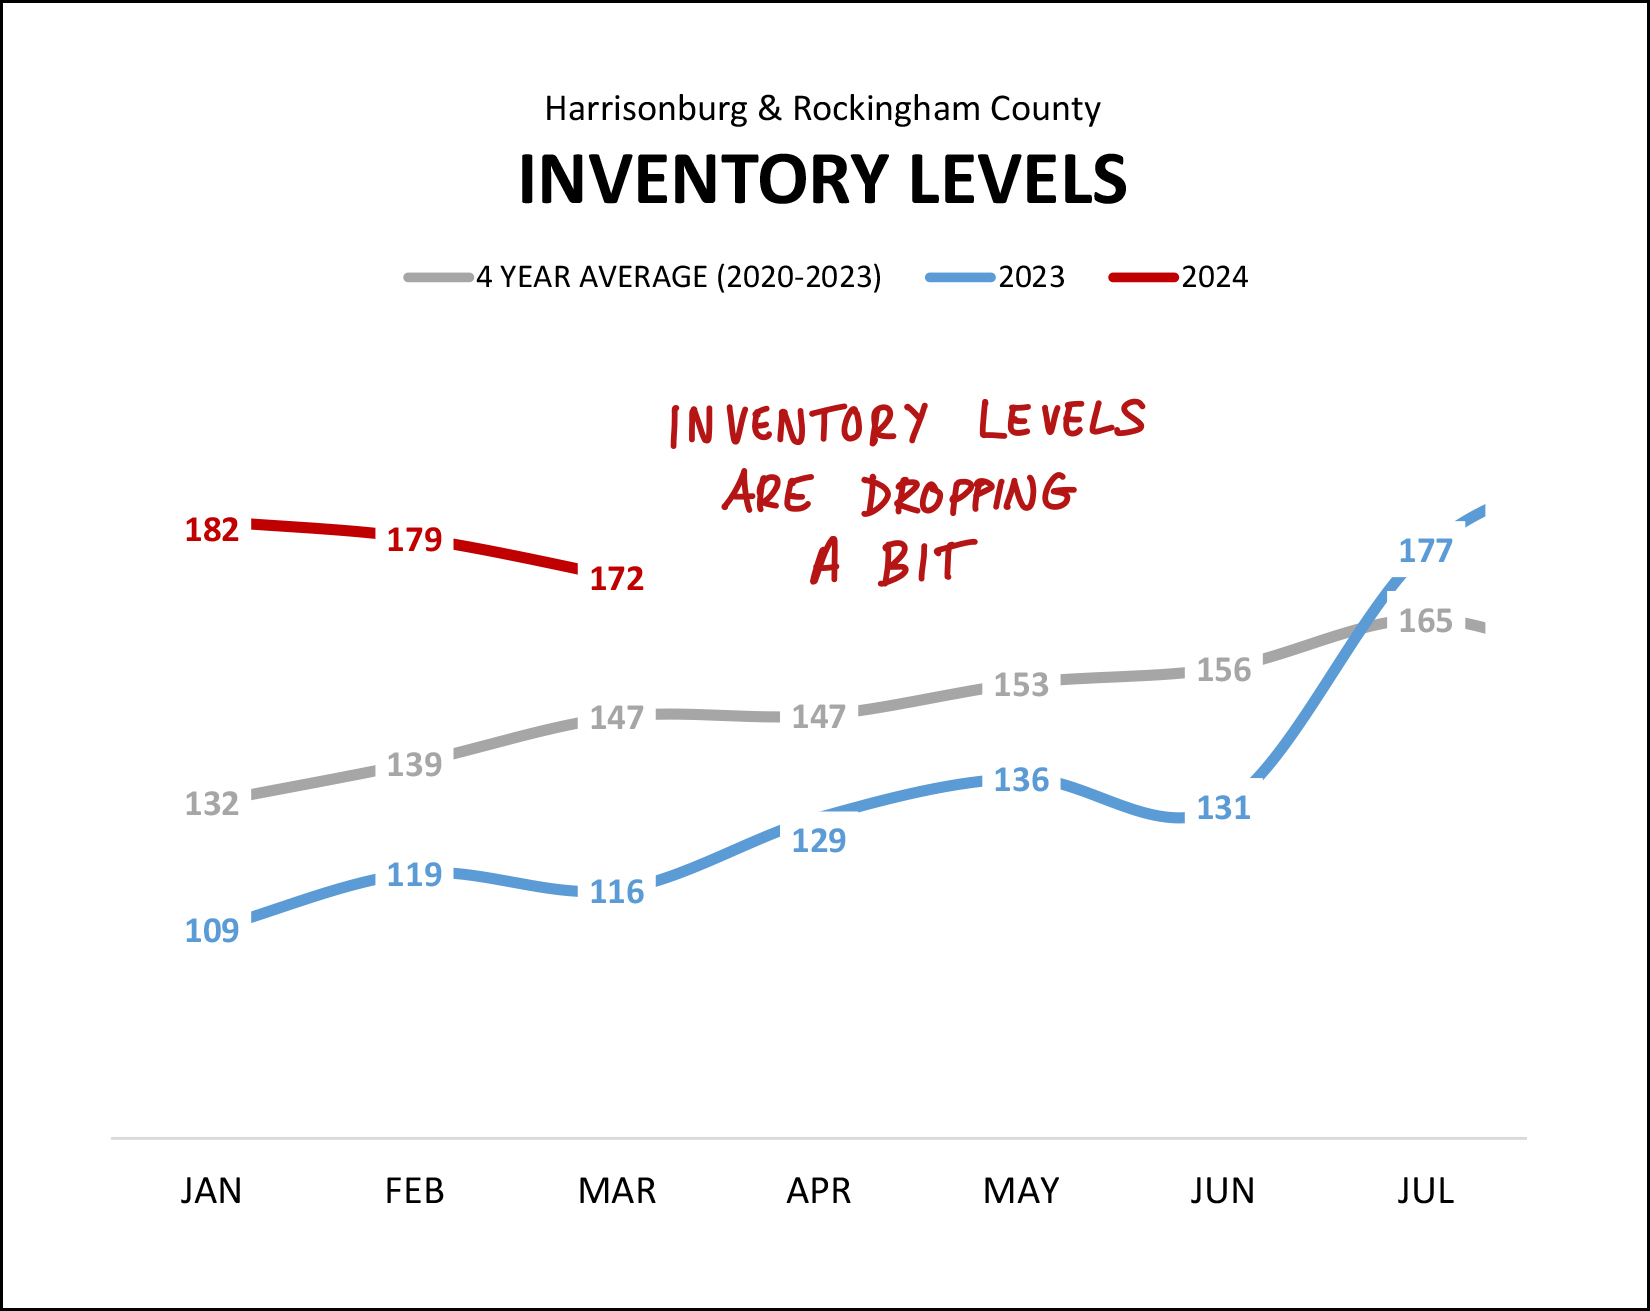 Usually (see the grey line above) we see inventory levels rise between the end of February and the end of March -- but this year that number fell between the end of February and the end of March. For as many sellers as put their homes on the market, buyers kept showing up, causing inventory levels to decline slightly over the past month. That said, inventory levels this year (172) are still well above where they were a year ago (116) so buyers do have more options now than they did a year ago. And how about how quickly homes are (or are not) selling these days... 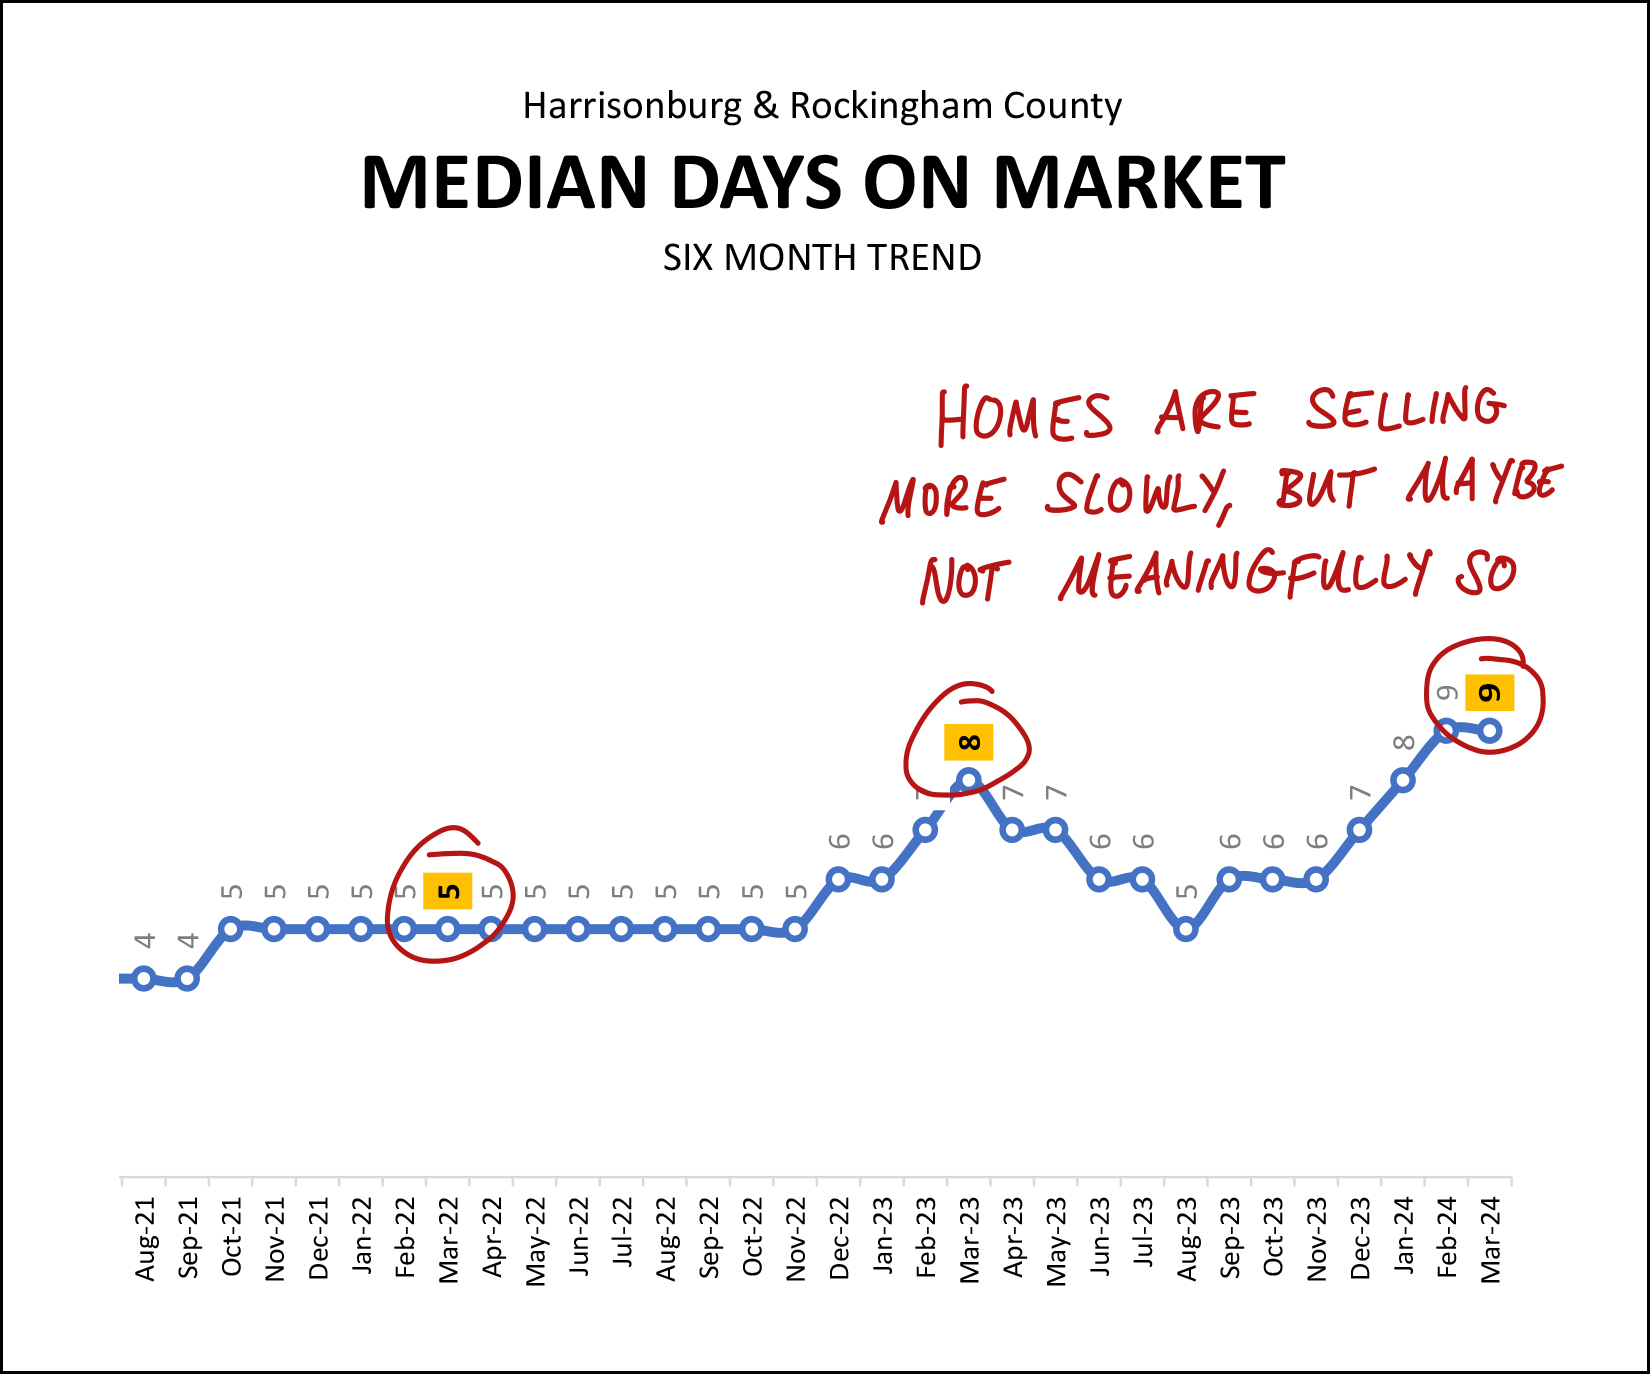 Over the past six months, homes have been going under contract with a median of nine days on the market. That is to say that half of homes that went under contract did so in nine or fewer days and half in nine or more days. This time on the market is certainly higher than it was back in 2021 when it was a median of five days... and higher than the four days back in early 2021... but it's not meaningfully or drastically higher. Many homes in many price ranges are still going under contract very quickly - often with more than one offer. Finally, those silly mortgage interest rates... silly high mortgage interest rates, that is... 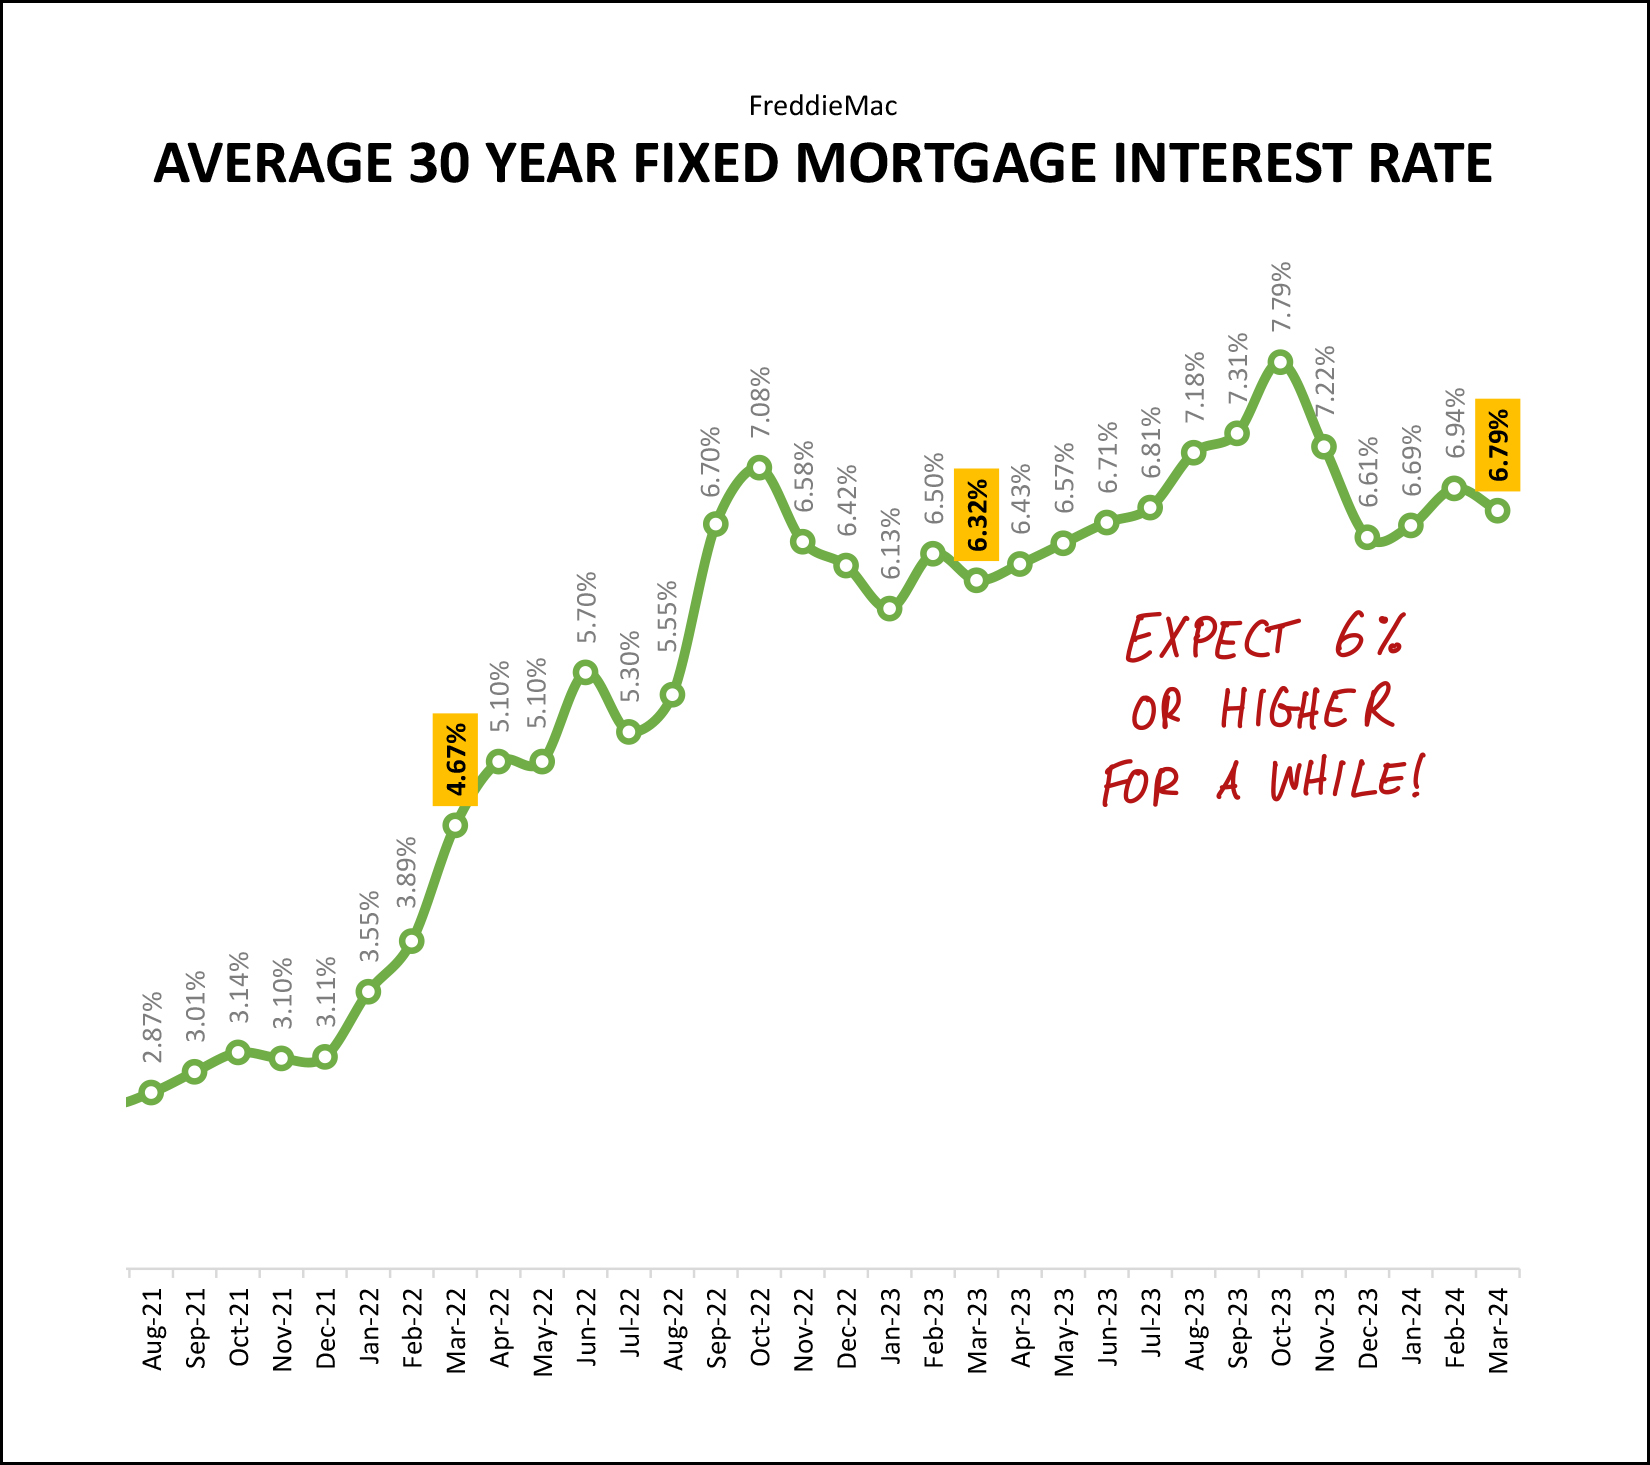 Mortgage interest rates were below 3% just three years ago... and below 5% just two years ago... but they have been above 6% for the entirety of the past year... and I expect them to stay there. While it's tempting to say that mortgage interest rates *might* decline below 6% soon, it just doesn't seem likely. I believe we'll likely see mortgage interest rates above 6% for the remainder of 2024. So, where then does this leave us? First -- If you're interested in even more charts and graphs, I create many more each month than I highlight here. Check them all out here. Next -- If you're planning to buy a house this year, talk to a lender sooner rather than later to become preapproved and to understand your potential monthly housing costs. If you need some lender recommendations, just let me know. Also -- If you're considering selling your home this year, feel free to reach out to me to set up a time to meet at your house to discuss the market, the process, your house, your timing and your goals. Finally -- If you have questions about anything I've mentioned above, or other real estate questions in general, feel free to be in touch anytime. You can contact me most easily at 540-578-0102 (call/text) or by email here. | |
Despite An Increase In Home Sales In January, Contract Activity Is Down, Inventory Levels Are Up, Days On Market Is Up |
|
 â¤ï¸ Happy Valentine's Day! â¤ï¸ For those of you that just *love* reading my market reports each month... consider today's report my valentine to you. ð That said, the real estate indicators this month aren't all hearts and candy and hugs and kisses... so TBD if you'll still consider this to be a loving Valentine's Day message by the end. But first, as a peace (love?) offering... each month I provide a giveaway, of sorts, for readers of my monthly market report. This month I'm highlighting a delightful cafe / coffee shop just outside Dayton called Harvest Table. They offer great coffee beverages, a delicious array of baked goods, and a solid (all-day) breakfast and lunch menu as well! If you haven't checked out Harvest Table -- you should -- and click here to enter your name for a chance to win a $50 gift certificate use on your next visit! Now, on to the real estate data, starting with how many home sales we saw in the first month of 2024. 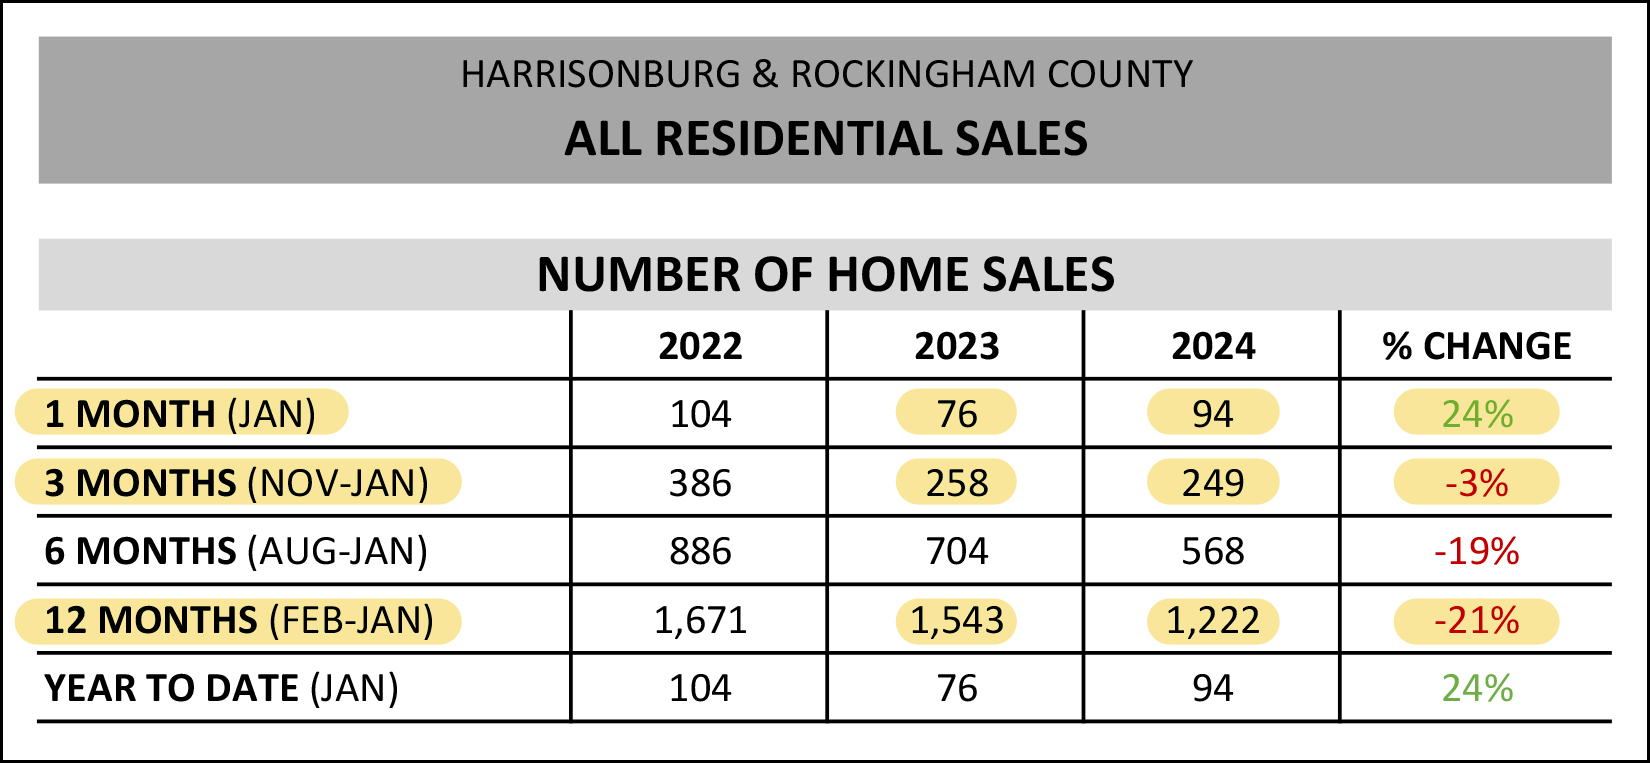 If we start with how many homes are selling right now (see above) we'll be starting with some rather positive news. After over a year of steady declines in the number of homes selling in our area, we did see a bit of a turnaround in January 2024. A few things I am noticing above... [1] After only 76 home sales in January 2023 we saw 94 in January 2024. I wasn't expecting that we would see this 24% increase in the first month of 2024. I don't necessarily think that means we'll see a 24% increase in the number of homes selling throughout 2024 -- as this is just one month of data -- but it was a pleasant surprise to see more buyers able to buy homes this January than last January. [2] The third highlighted line (above) shows that over the past year we have seen a 21% decline in the number of homes that are selling in Harrisonburg and Rockingham County. This certainly stands in contrast to the 24% increase in January 2024... but if we want to broaden our view a touch we see (in the second highlighted line) that home sales have only declined by 3% when looking at the most recent three months (Nov-Jan) compared to the same three months a year prior. So... based on several bits of data... maybe (just maybe) we won't see another 20-ish percent decrease in the number of homes selling this year in our market... maybe we could actually see some stability in this metric, or a slight increase in the number of homes that are selling in 2024? Wait and see... only 11 more months to go. And how about those home prices... 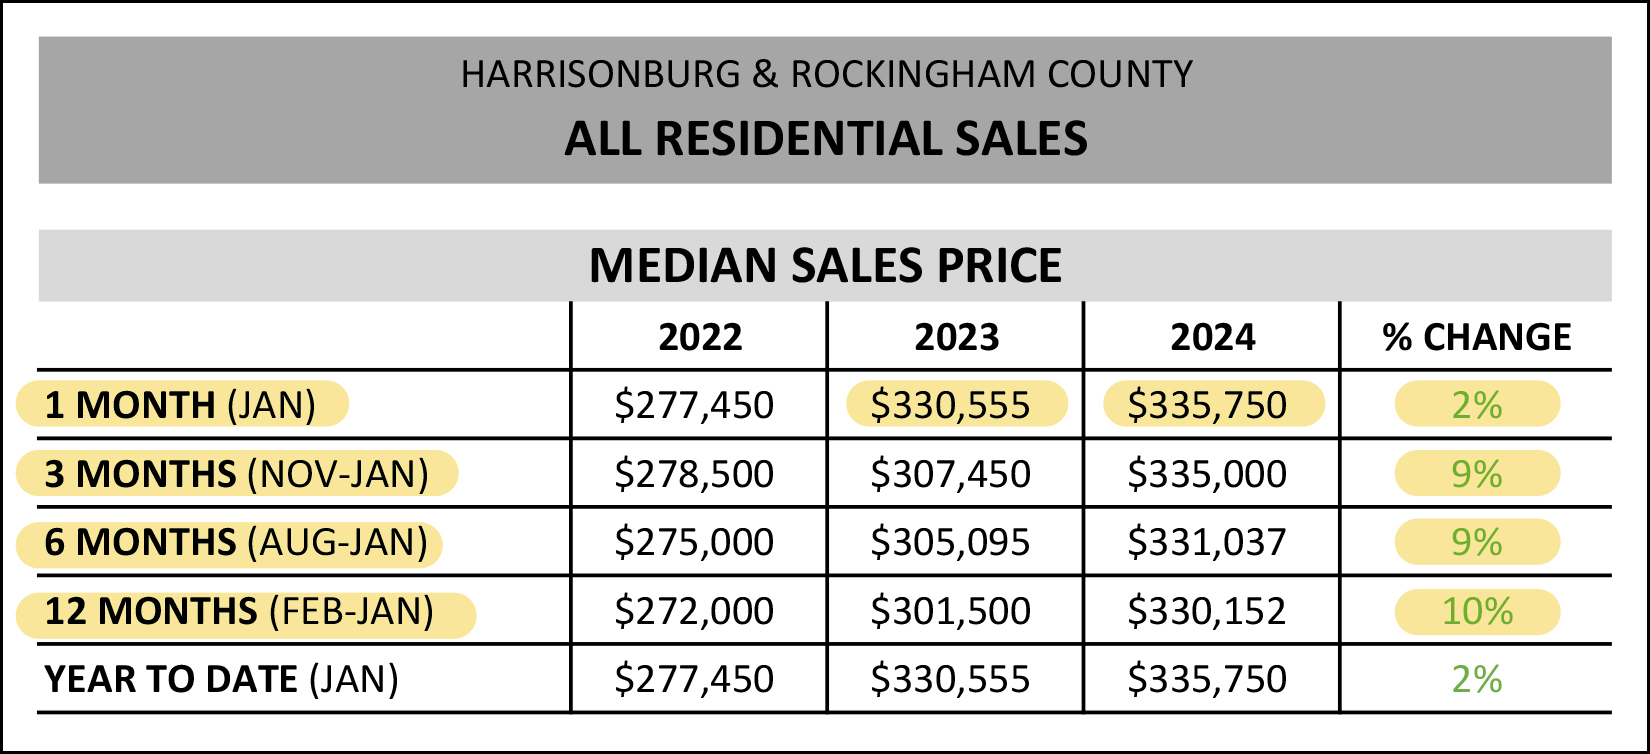 Just as we can't necessarily believe that the 24% increase in home sales in January 2024 will be a lasting trend, we also shouldn't necessarily believe that the 2% increase in the median sales price in January 2024 will be a lasting trend. As shown above, when looking at three, six or twelve months of data, the median sales price in our area has been rising by 9% - 10%. When looking at just one month of data (January 2024 vs. January 2023) we only see a 2% increase in that median sales price, but I don't think we'll see that low of an increase once we get a few more months into the year. And how about how quickly homes are selling... 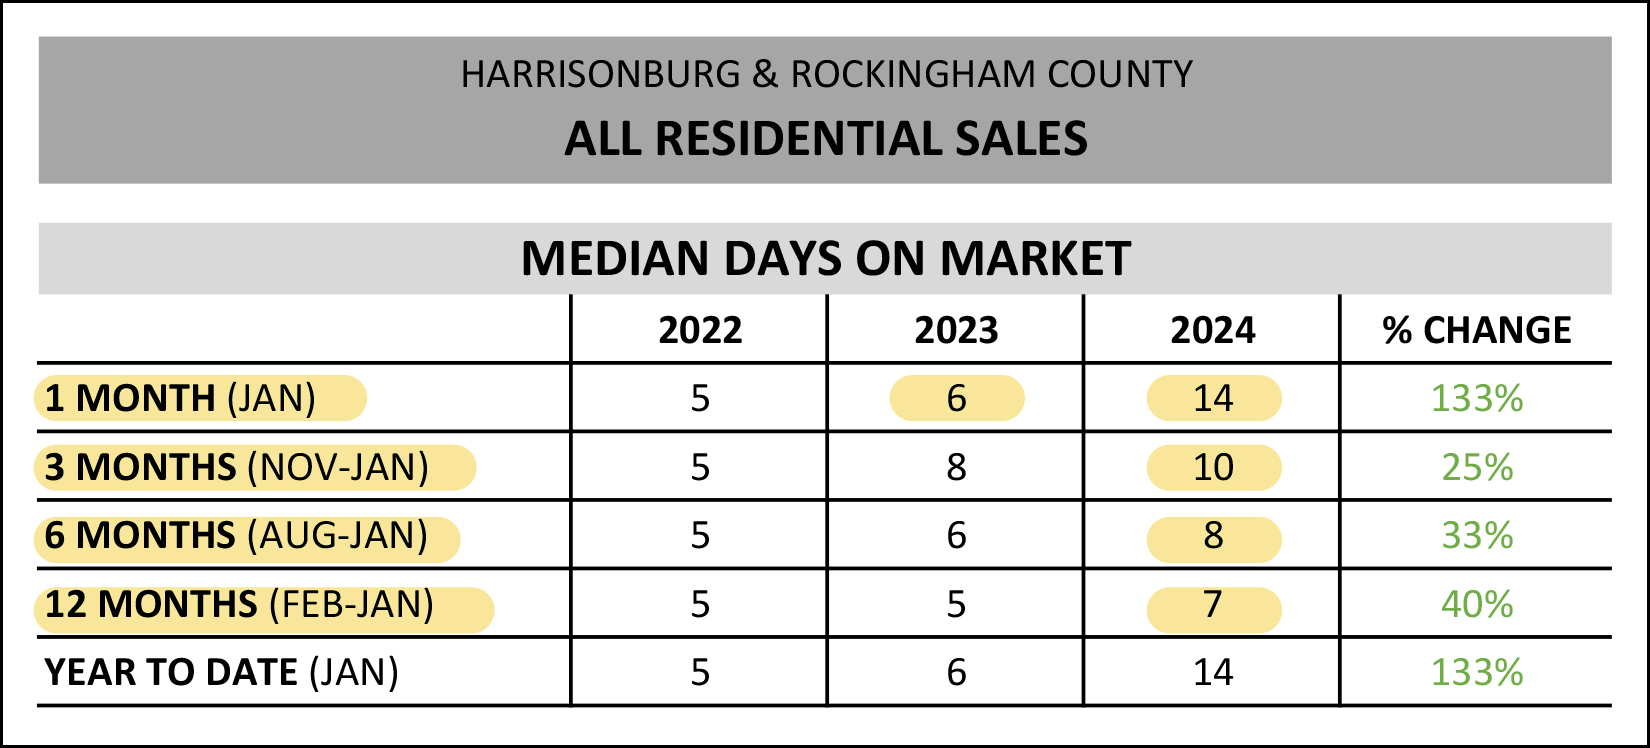 There are enough changes on this table (between 2023 and 2024) to give me confidence in saying that the market will almost certainly move at least a bit more slowly in 2024 than it did in 2023 (and 2022). The median "days on market" was 14 days in January 2024, which means that of the homes that sold in January, half of them took more than two weeks to go under contract. This is quite a bit slower than the median of six days last January. Also, if we zoom out a bit to look at the three month, six month and twelve month metrics, we also see higher median days on market in those timeframes as well. We started to see days on market creep up a bit in 2023 but I think we will see an even more significant increase in this "speed of sale" metric in 2024. Many homes will likely still sell very quickly in 2024, but not all homes. This next graph is a bit hard to read with only one data point for 2024, but see if you can find it... hiding on the left side, and highlighted... 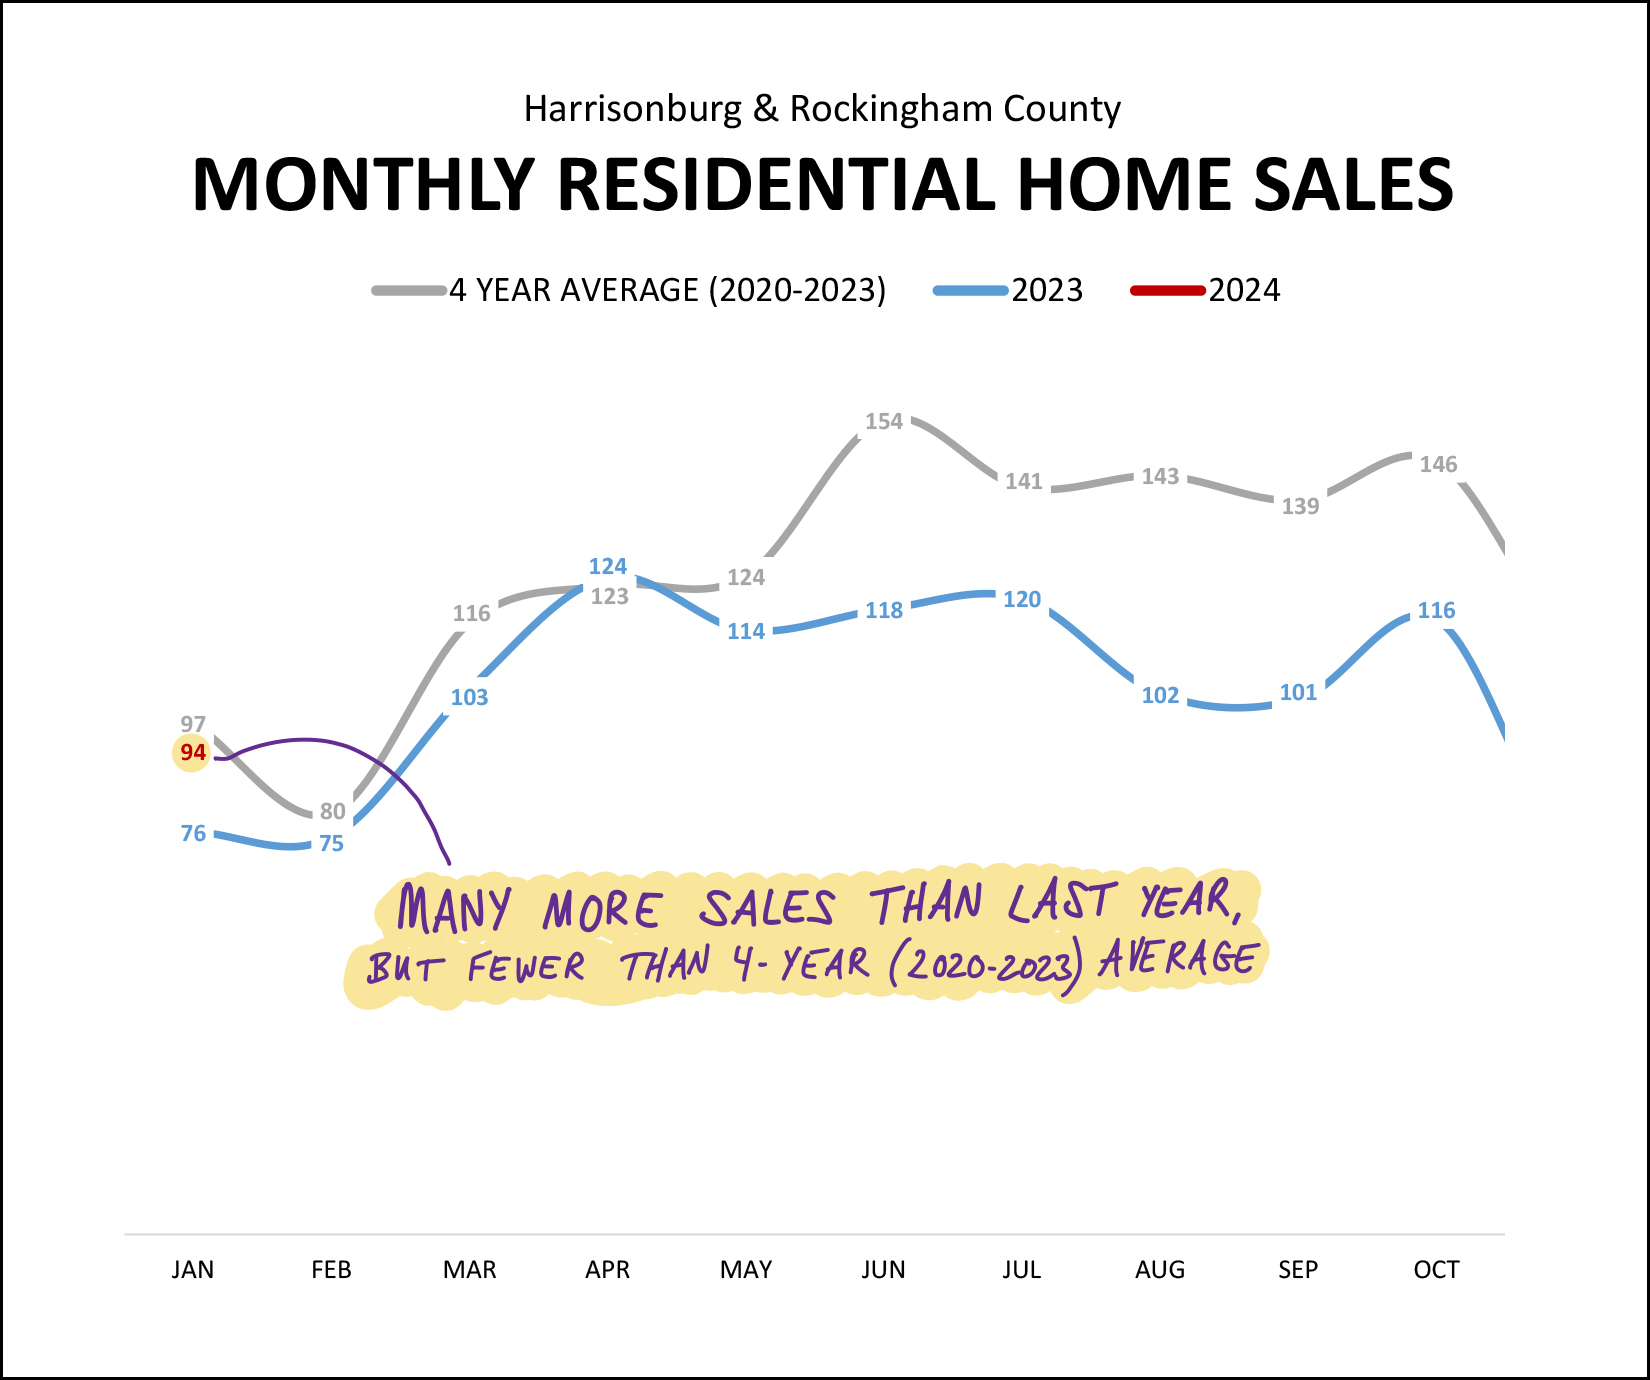 That highlighted "94" is showing the number of homes that sold in January 2024... which was well above the 76 home sales we saw last January (in blue) and only barely above the four year average of 2020 through 2023. Looking and thinking ahead towards the next few months the question that remains is whether home sales in 2024 will remain stronger than in 2023, or whether the monthly sales count will drift back down towards 2023 levels. I'll hit on contract activity and pending sales a bit later to allow us to think more about what the coming months might look like. And now, a look at the overall big picture trends as it relates to how many homes are selling and the prices at which they are selling... 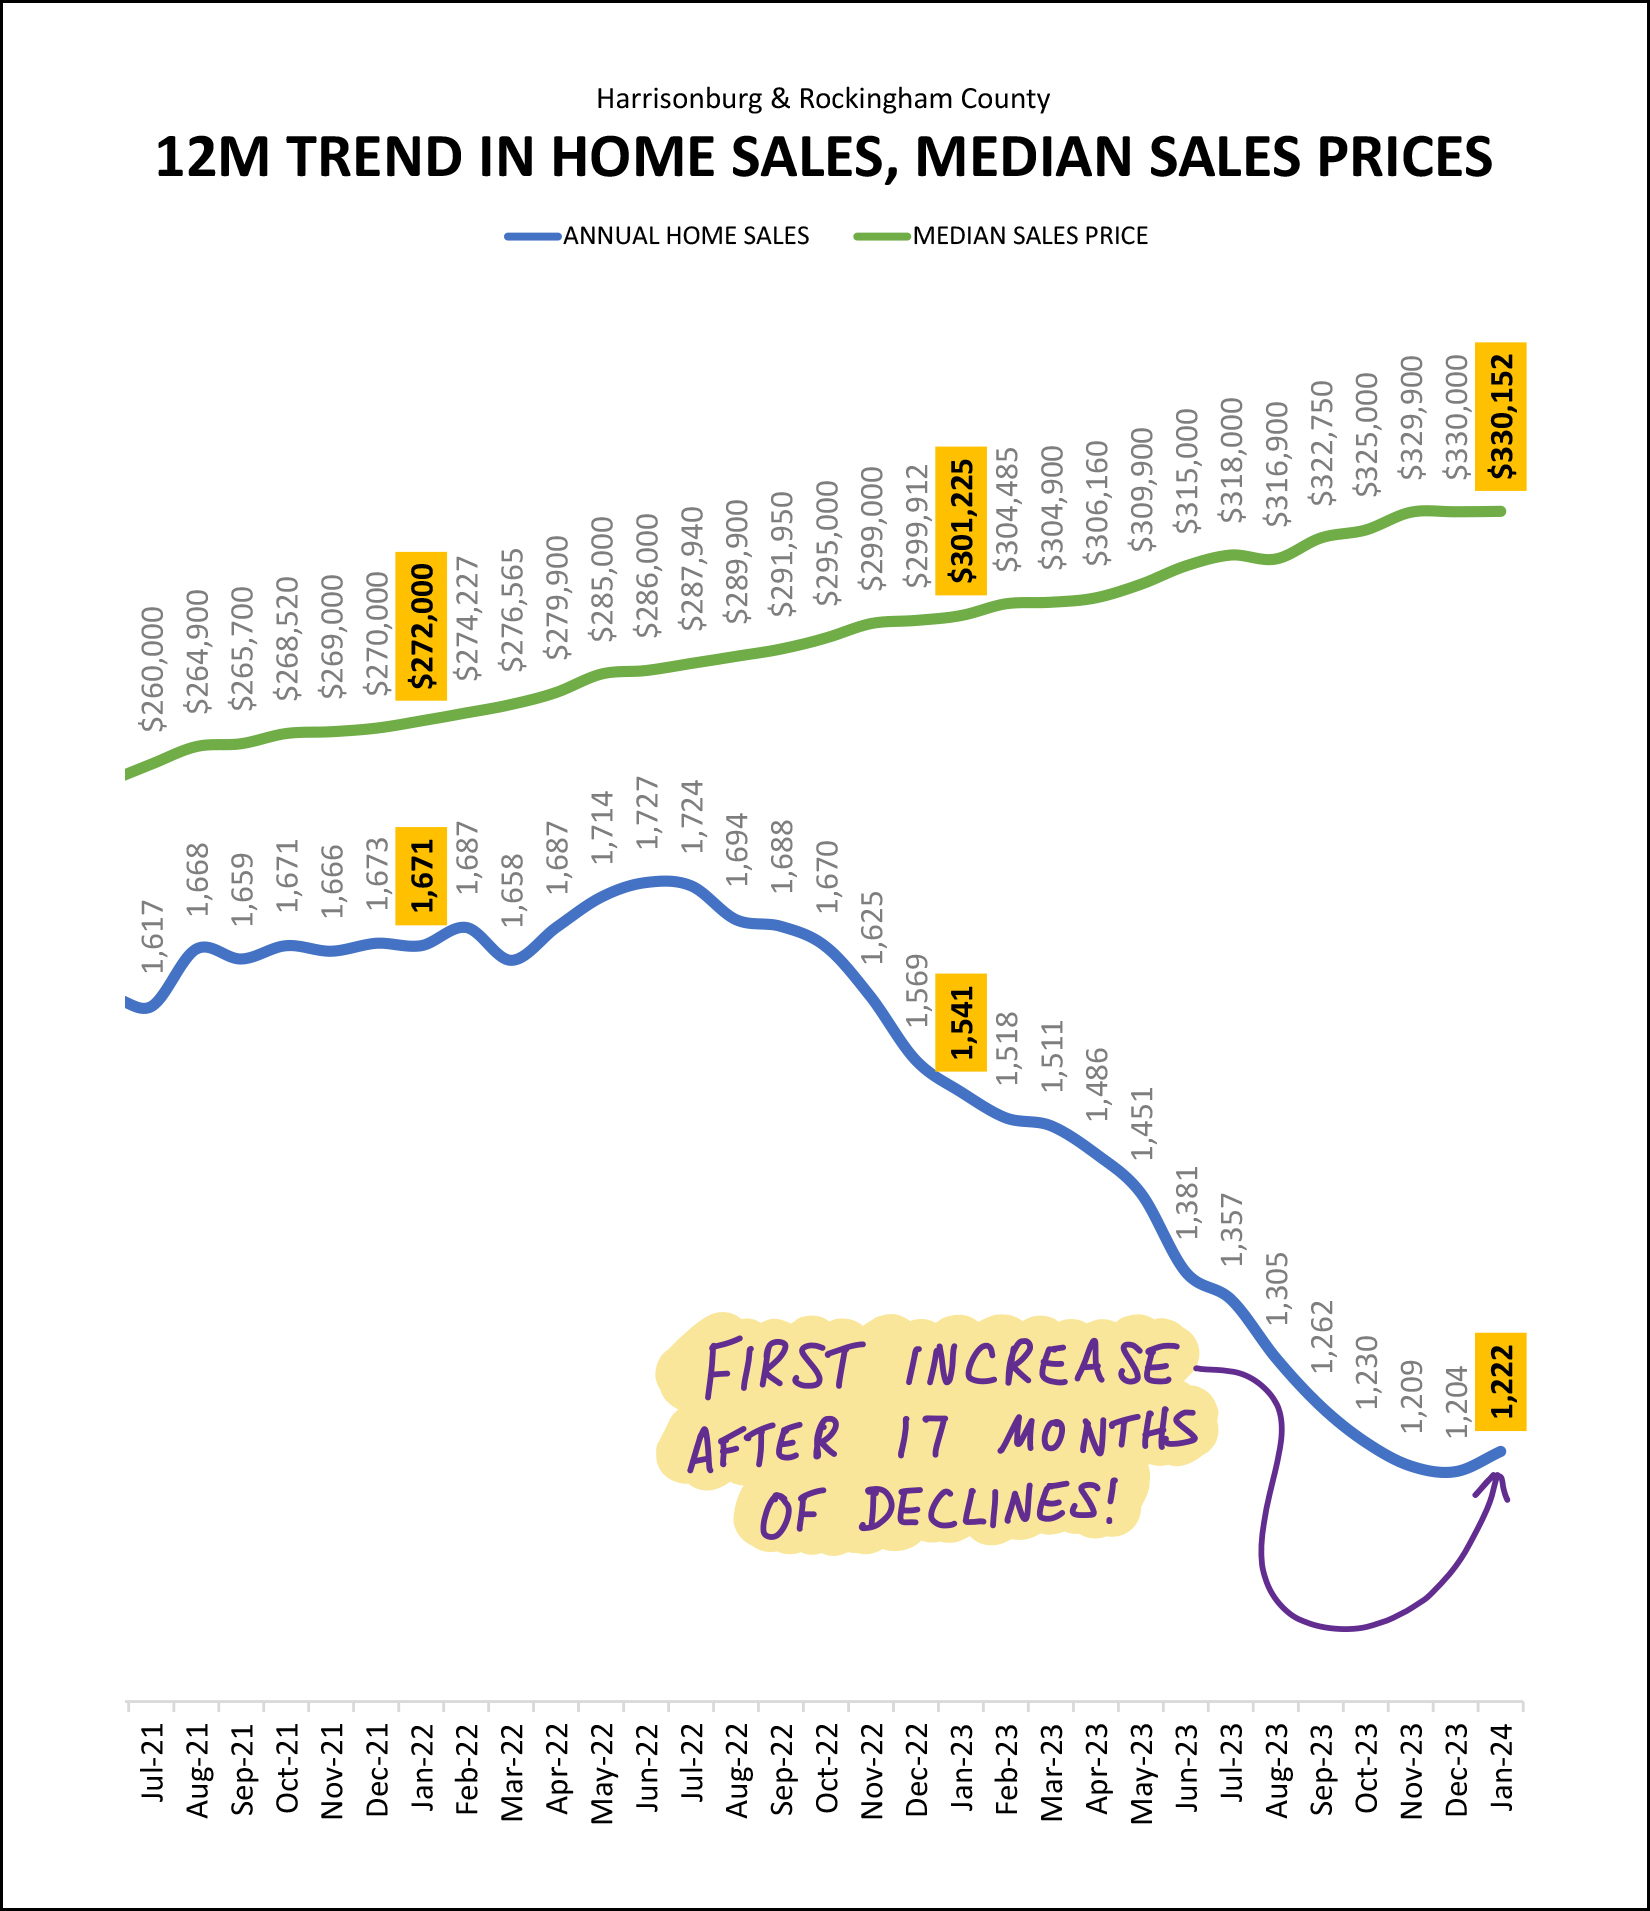 At this point you might be wondering why I warned you in the beginning of the report about some of the metrics not being entirely positive this month. Well, keep reading, but this graph (above) is still in the positive category. The blue line above tracks the number of annual home sales taking place in Harrisonburg and Rockingham County (per the HRAR MLS) when measured on a monthly basis. After 17 months of a declining pace of annual home sales, we saw the first increase in January 2024... from 1,204 home sales to 1,222 home sales. This change in direction in this trend is a result of strong January 2024 home sales compared to January 2023 home sales. If that continues in February 2024, we'll see this line continue to rise again. The top (green) line shows the median sales price over a year's time, measured each month. Clearly, the median sales price has been increasing for many (!!) months (years) now. This metric has flattened out a bit over the past two months, so stay tuned to see if the median sales price continues to increase in 2024 as quickly as it did in 2022 and 2023. Here's another look at that possible change in how quickly prices are rising... 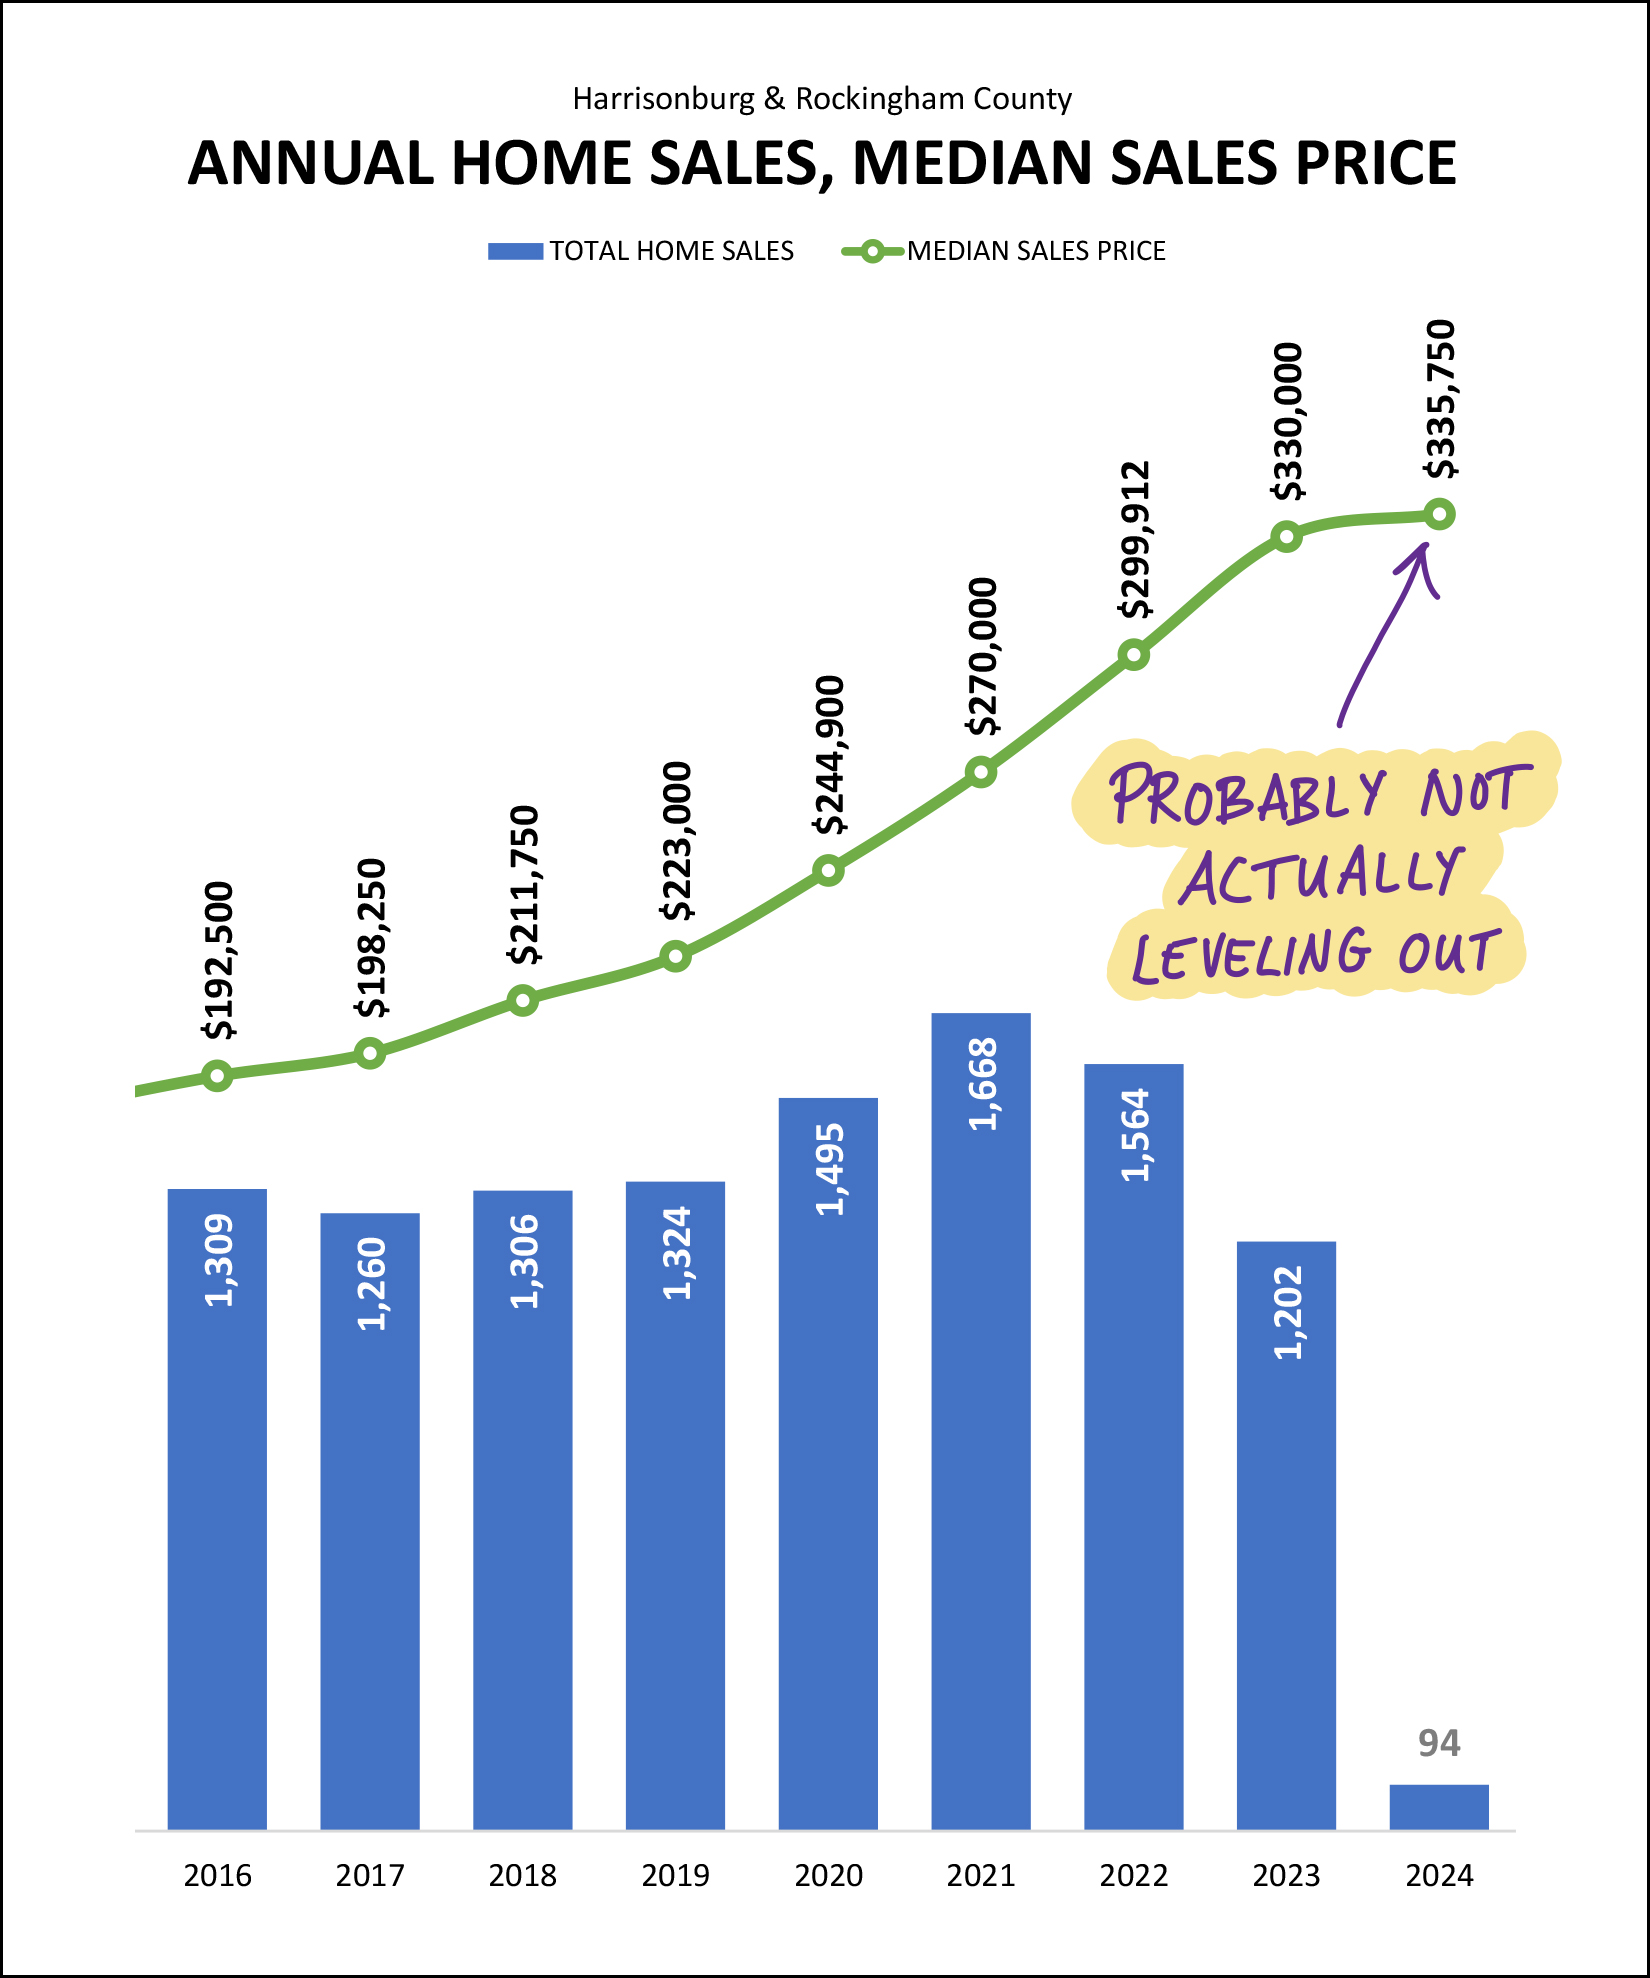 At first glance, it would seem that the rapid increases in the median sales price that we saw in 2020, 2021, 2022 and 2023 might finally be coming to an end in 2024. And, that might be true. We could see a much smaller increase in the median sales price this year. But... keep in mind that the graph above is comparing 12 months of data in 2023 to only one month in 2024. Once we have a few more months of data to consider in 2024 -- a larger data set than the 94 January home sales -- we'll be able to have a better sense of whether we will see similar or smaller increases in the median sales price in 2024. Next up, contract activity, one of the indicators of what we should expect next... 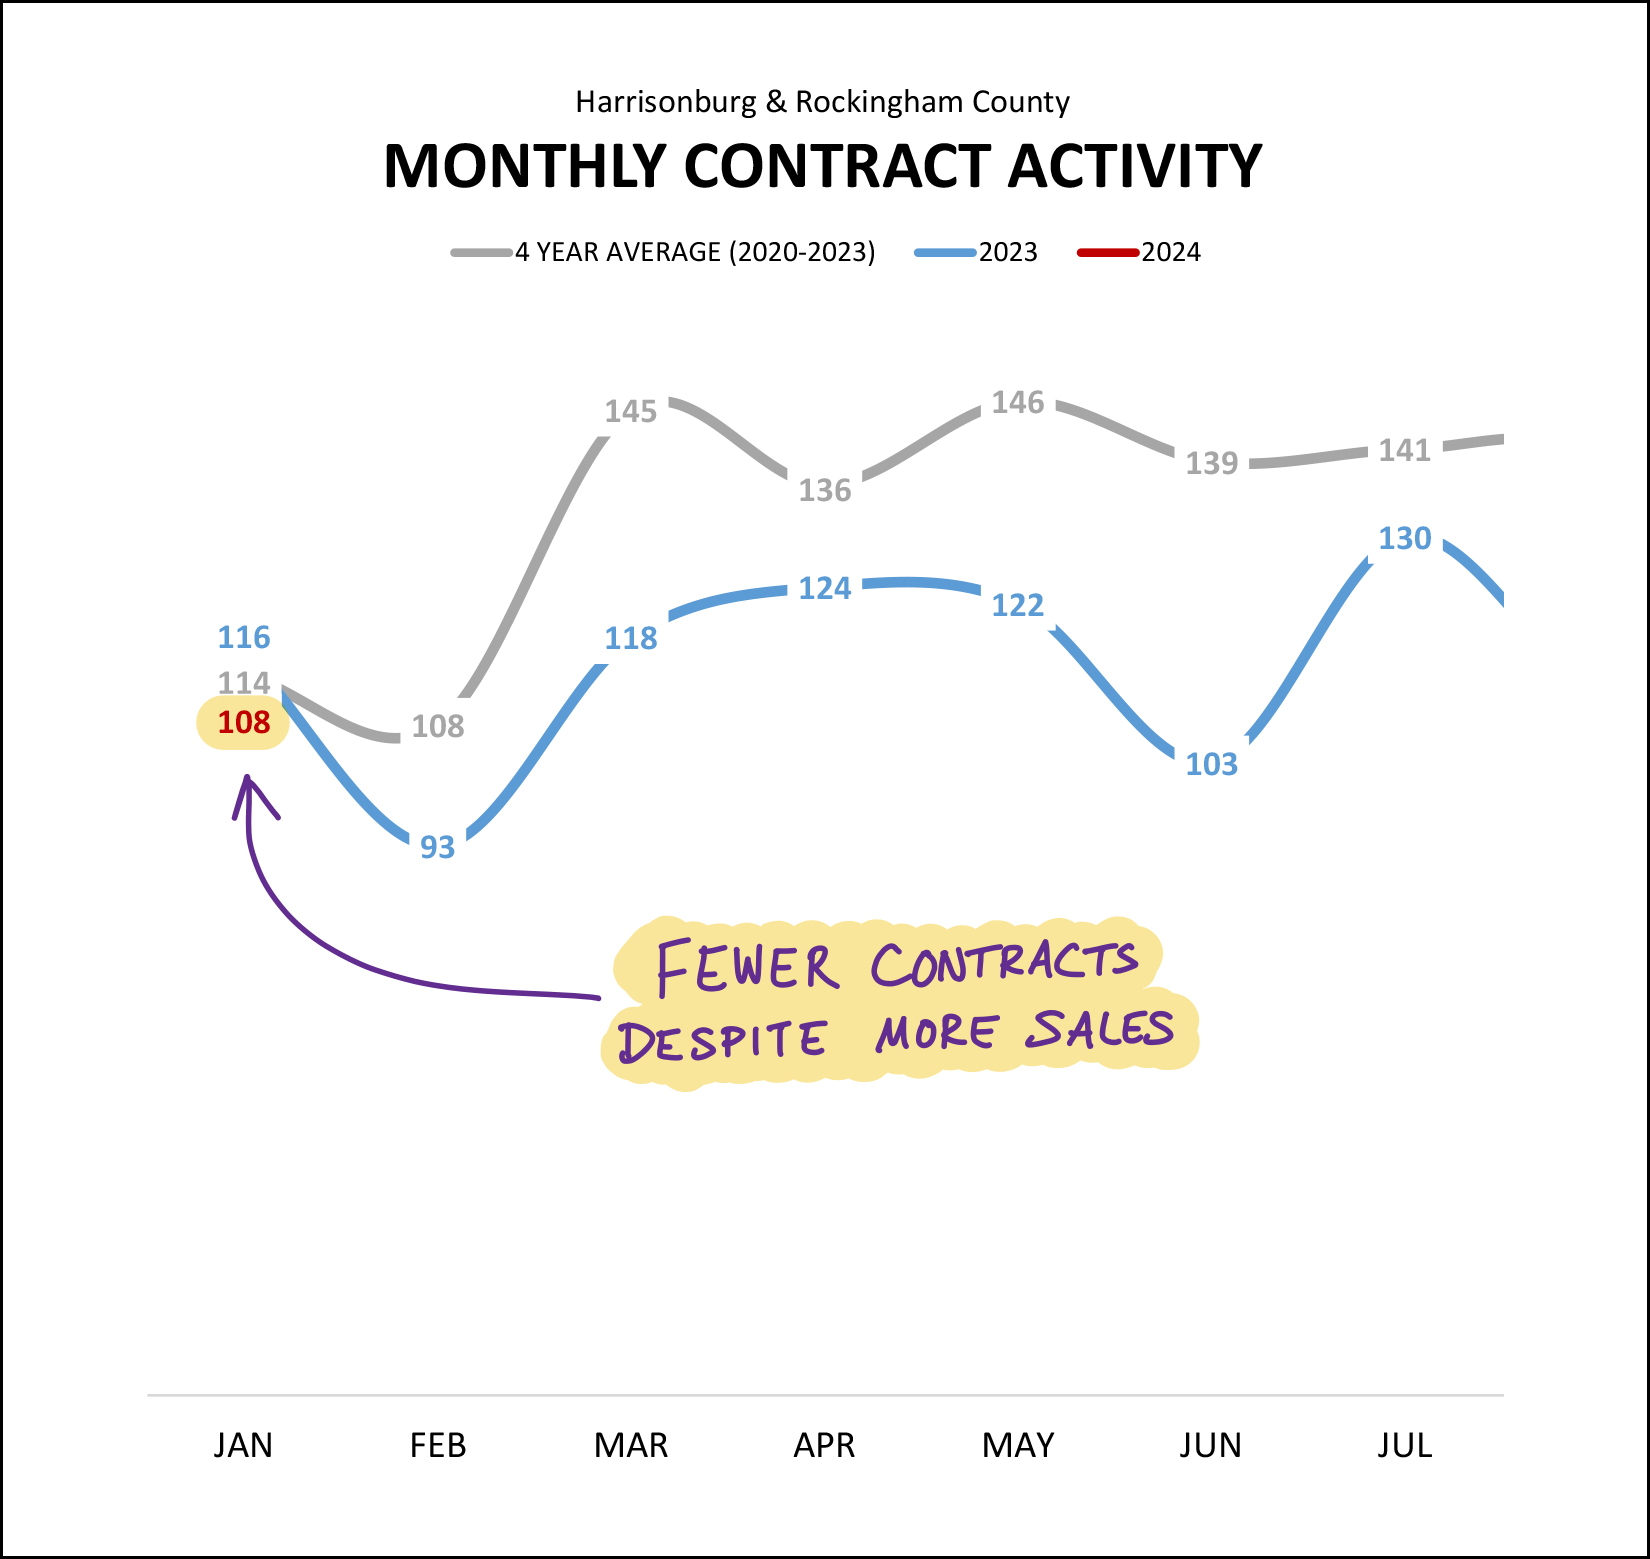 I suppose I shouldn't focus too much on contract activity being slower in January 2024 than in January 2023 because it wasn't that large of a difference... a decline from 116 contracts last January to 108 contracts this January. But, after seeing a big uptick in closed sales in January 2024, I was expecting to see more contracts in January as well -- which would allow us to more confidently expect to see overall home sales activity to increase in 2024. So, with more sales in January, but fewer contracts, what will February (and March) look like in 2024? Well, here's another potential indicator... pending sales... 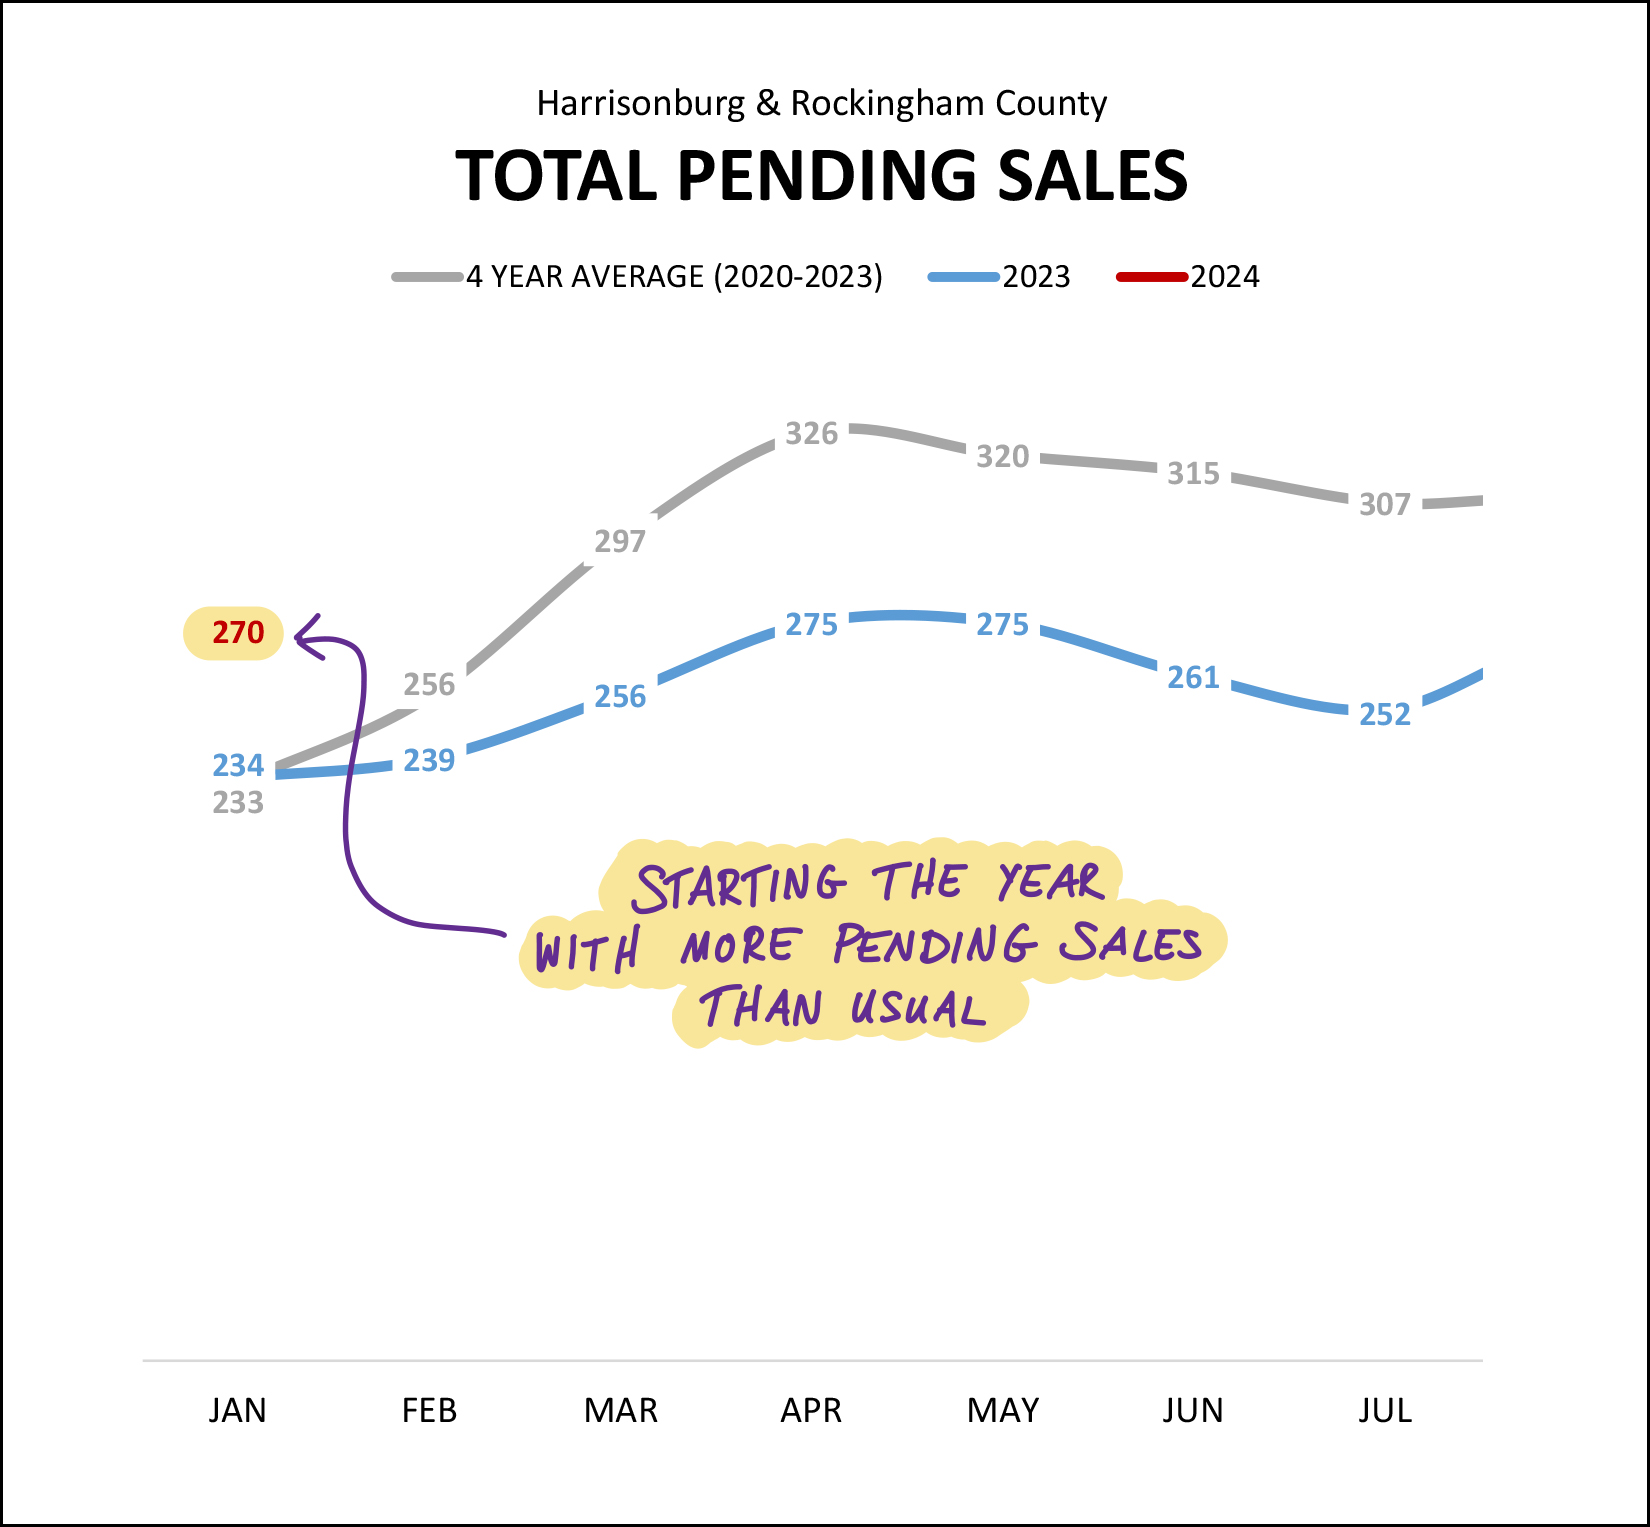 Pending sales is a measure (a count) of how many properties are under contract (pending) at any given moment in time. A year ago there were 234 pending sales at this time, which was in line with the four year (2020-2023) average of having 233 pending sales at this time of year. But then, January 2024. At the end of January (beginning of February) we are now seeing 270 pending sales -- much more than any time recently. So, despite fewer homes going under contract in January, the total number of homes waiting to make it to closing is much higher than we might have otherwise expected. All of this points to the possibility that we will actually see an increase in the number of homes selling in 2024 as compared to 2023. Give it a few more months to see if the data keeps reinforcing that hypothesis, but I am starting to think we'll see an increase in home sales this year as compared to last year. And perhaps more homes are selling because more are available for sale? 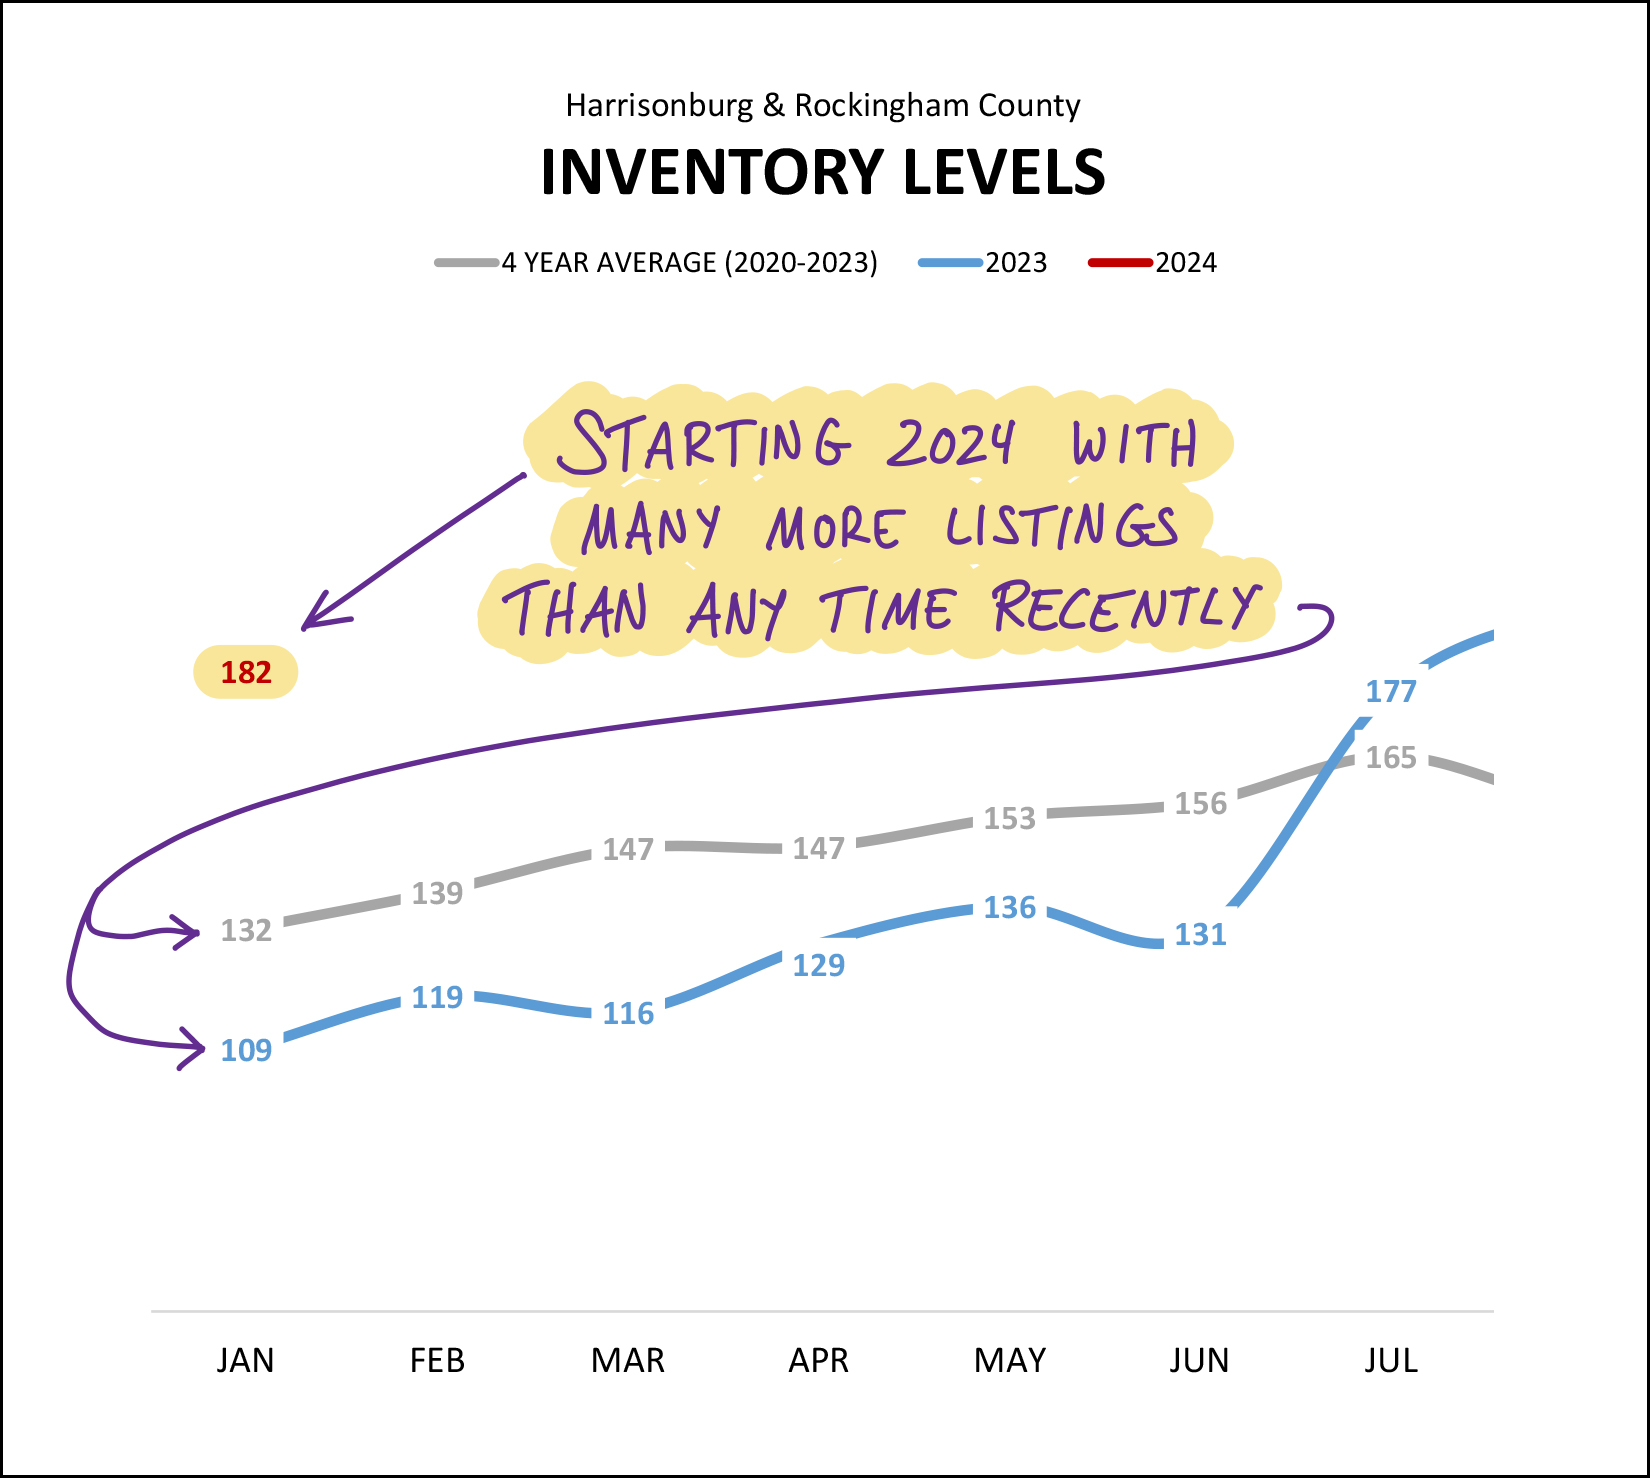 Not only are there many more (15% more) pending sales right now as compared to a year ago, there are also many more (67% more) homes for sale right now as compared to a year ago. That's actually a pretty significant (67%) increase in inventory levels in a year's time. One year ago a buyer would have been able to choose from 109 homes to give to their special someone on Valentine's Day. This year, they can choose from 182 homes for sale. If you've been hoping your loved one will give you a new home for Valentine's Day... you might be in luck, there are sooo many more options this year. If you don't get that new home along with some roses and a box of chocolates, don't let them blame it on the low housing inventory levels... Now, back to that median "days on market" metric... 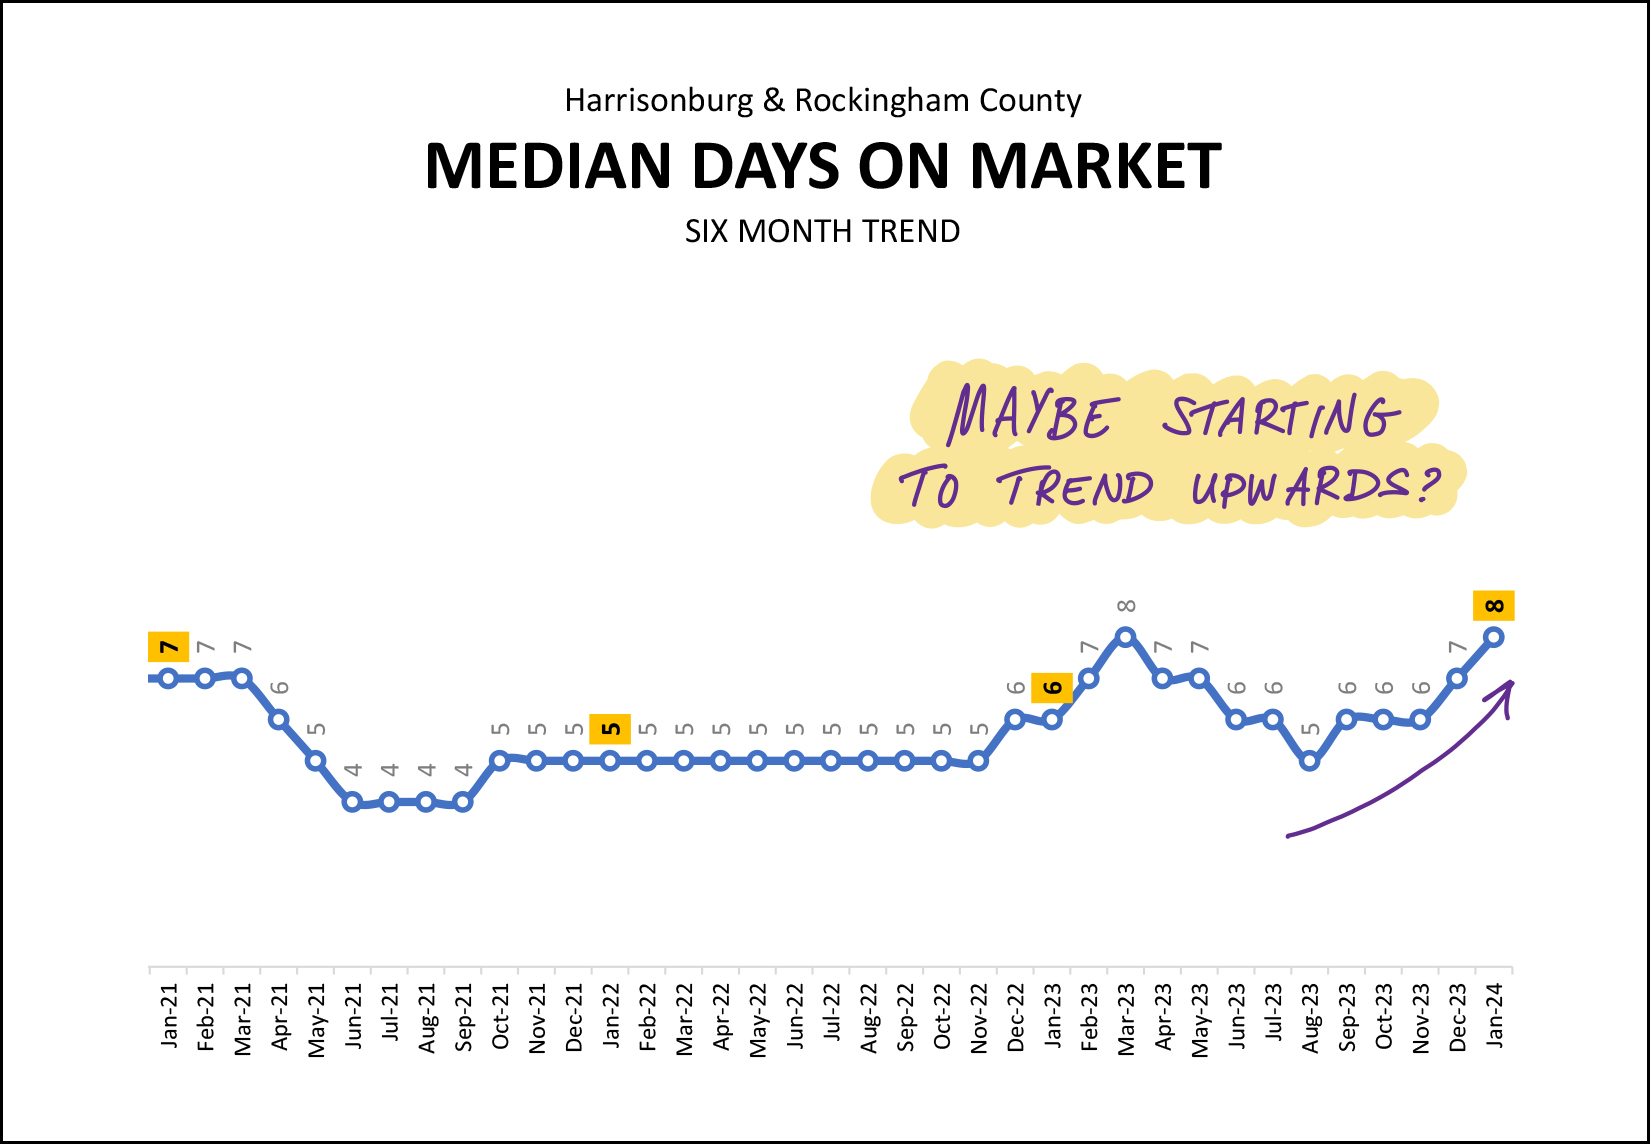 Way back in mid-2021 the median days on market dropped all the way down to four days... and then stayed at five days for more than a year after that. We started to see the median days on market bounce around a bit more in 2023 as we went from a market where absolutely every home seemed to sell very (very) quickly to a market where many homes still sold very quickly, but not all of them did. As we look at the increase from a median of five days on the market back in August to a median of eight days on the market today, we may just be seeing a seasonal increase that we will start to see every year... or we may be seeing the beginning of a slight slowing in the market. But... keep in mind... if the median days on market increases from five to eight days, that is not a drastically different market. It's an increase, but it's not an increase to 10 or 20 or 30 days on the market. Thus, it will be important to continue to monitor this metric over the coming months to see if 2024 is and will be a more slowly moving market than last year. Finally, how about those mortgage interest rates... 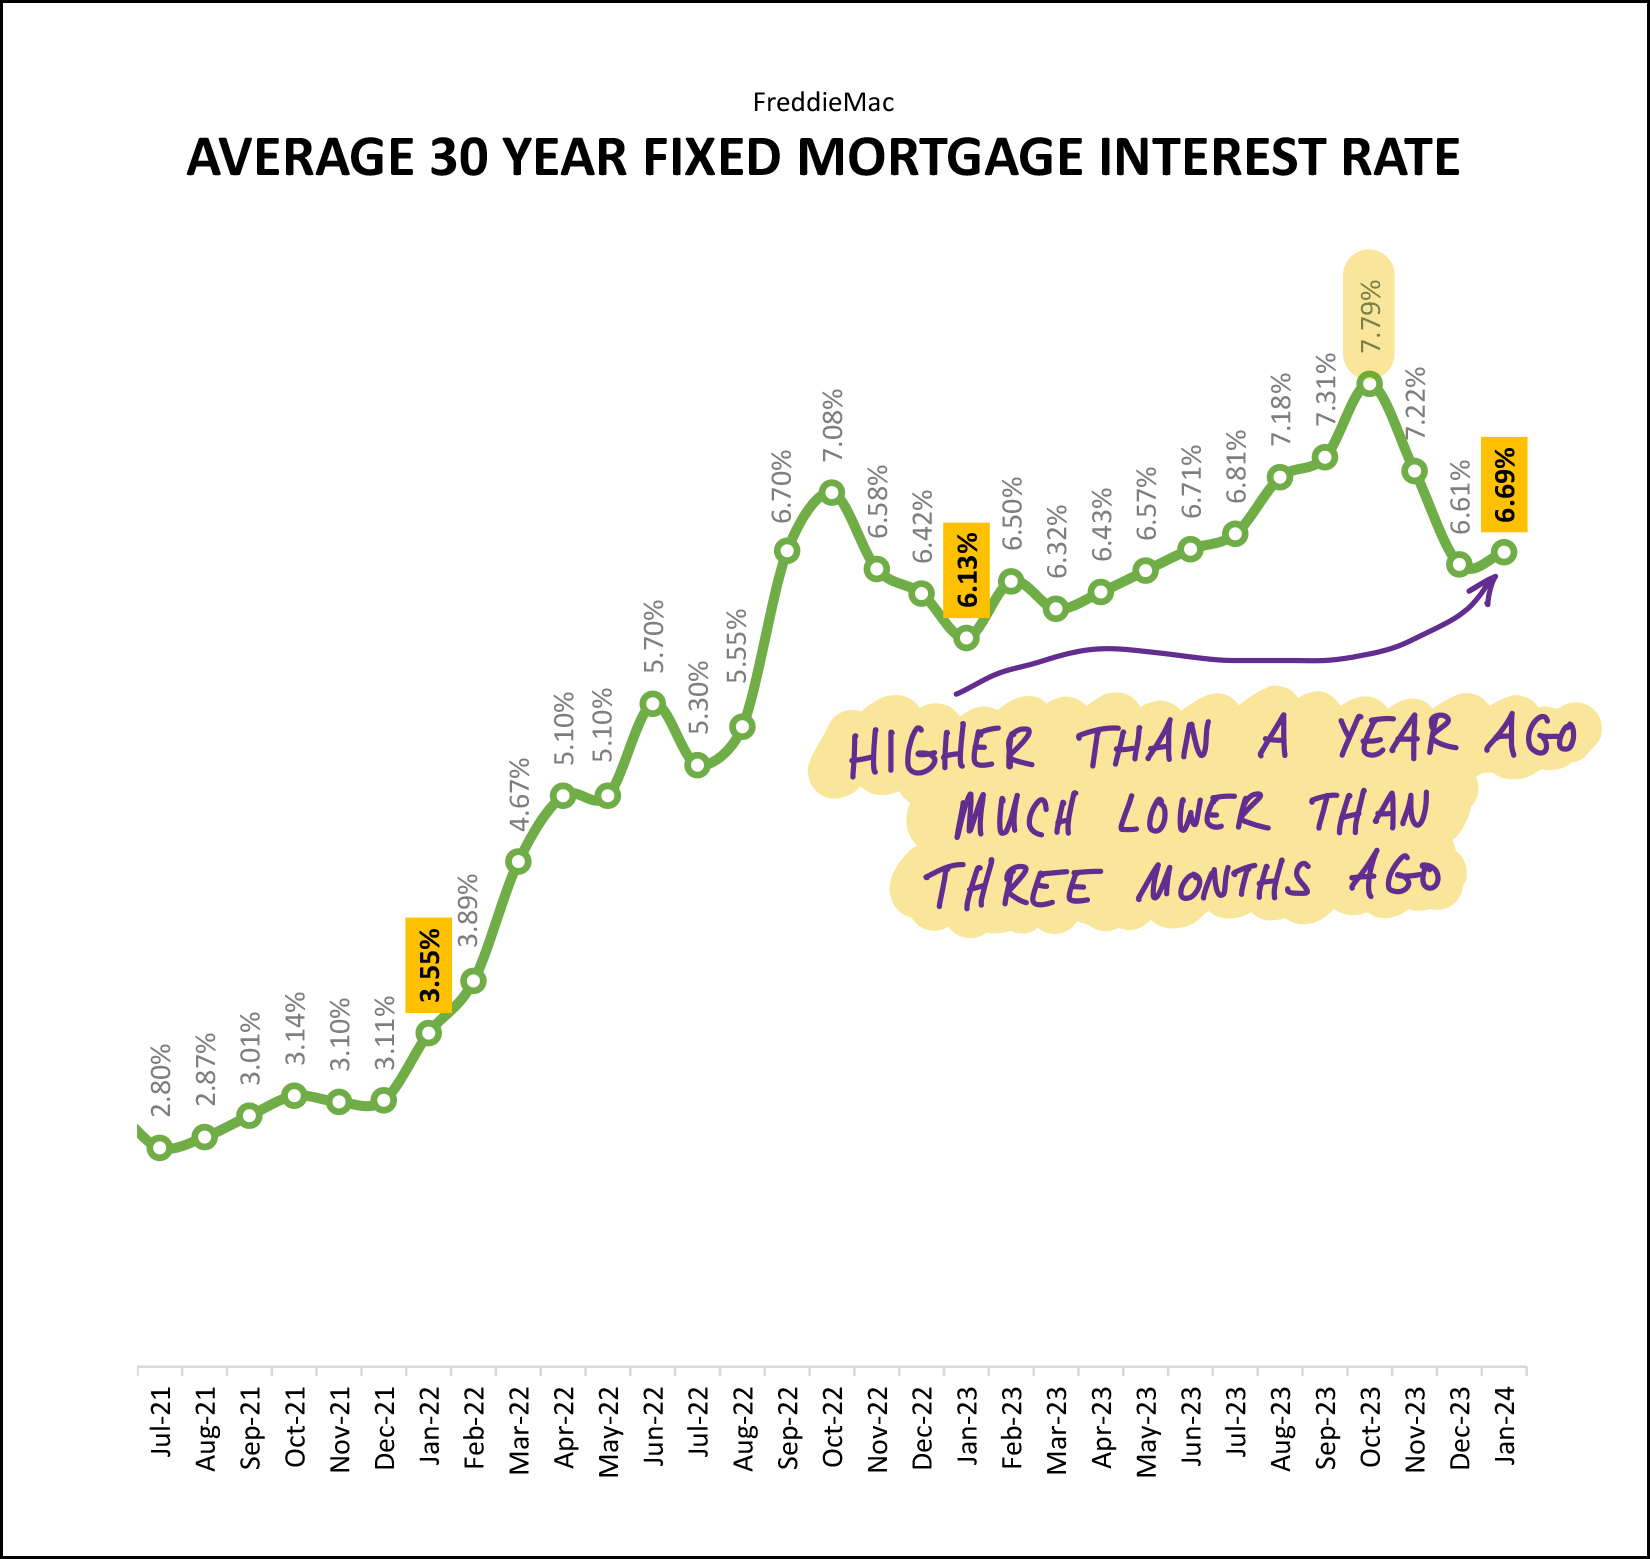 One of the main causes for the decline in the number of home sales in 2023 was rising mortgage interest rates. In 2022 mortgage interest rates rose from 3.11% to 6.42%. Then as 2023 went on, they rose even further, up to a peak of 7.79%. Can you blame buyers for not wanting to buy with a mortgage interest rate above 7%... or for sellers not wanting to sell and then have to buy with an interest rate above 7%? Over the past few months we have started to see mortgage interest rates decline, back to around 6.7% by the end of January. If we continue to see declines in mortgage interest rates in 2024 that will likely encourage further buying activity, though I don't expect that they will get all the way down 6% by the end of the year. And there we have it, very much a mixed bag of market metrics this month. More home sales, fewer contracts but more pending sales, higher inventory levels, higher days on market. All of that likely adds up to 2024 being yet another interesting and not entirely predictable year in our local housing market. If you plan to buy this year - talk to a lender soon and then frequently over time to understand how changing mortgage interest rates affect your budget and monthly payment. If you plan to sell this year - prepare your home well, price it in line with recent similar home sales, and know that your home might be on the market for more than a few days. If you own a home and do not plan to sell it - this will likely be another good year for you with your home increasing in value and another year of paying down a mortgage that likely has a very low interest rate. And to each of you -- if I can be of any help to you with real estate or otherwise, don't hesitate to reach out. You can contact me most easily at 540-578-0102 (call/text) or by email here. I hope you have a wonderful Valentine's Day! XOXO -Scott | |
2023 Recap On Our Local Housing Market Shows 23% Fewer Home Sales At 10% Higher Prices |
|
 Happy New Year, Friends! I hope your 2023 wrapped up nicely and that you had some time with family and friends over the holidays! I had a wonderful time over the past few weeks making tons of great memories with family (including my brother and his family visiting from out of state and so many others), eating lots and lots of delicious food (including plenty of Christmas cookies), relaxing, sleeping in, and I closed out the year by running in (and badly spraining my ankle in) the New Years Eve Glow Run. My ankle buckled after about 2.5 miles (I think when I landed on some uneven ground?) and I managed to cut up my knee as I rolled off the path... so I had to fake my way to the finish line with a bloody knee...  As a result, I have found myself limping and hobbling my way into the New Year -- but beyond this temporary mobility setback, I couldn't be more excited for the year ahead. ;-) Below I have outlined a variety of trends we are currently seeing in the local real estate market, but before we get started with the numbers and charts and graphs... each month I provide a giveaway, of sorts, for readers of my monthly market report. This month I'm highlighting one of my favorite sandwich spots downtown... Lola's Delicatessen. They create some amazing sandwiches and are a great spot to stop for lunch in downtown Harrisonburg. If you haven't checked out Lola's -- you should -- and click here to enter your name for a chance to win a $50 gift certificate to Lola's Delicatessen! Now, let's take a look at some data on our local housing market... 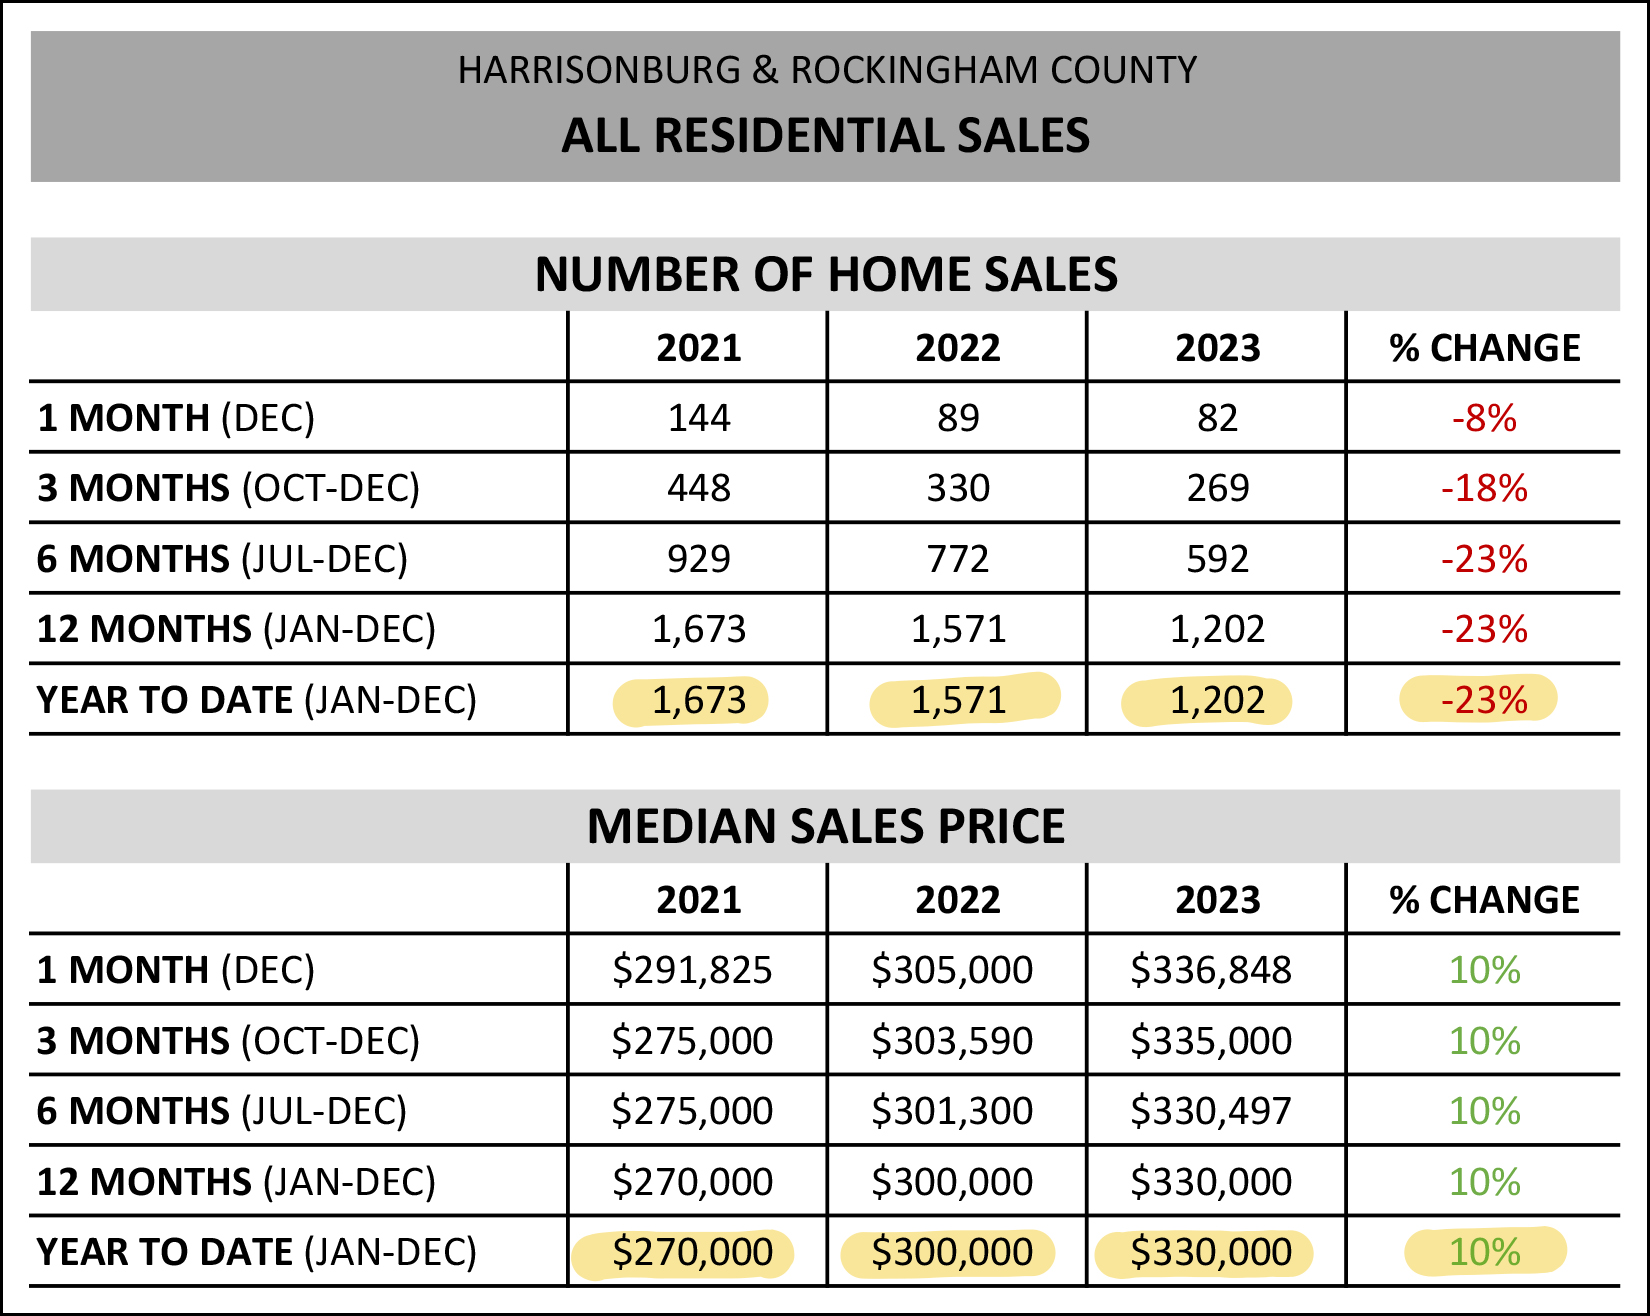 First up, the big picture of where we ended up after a full year of real estate data in Harrisonburg and Rockingham County in 2023... We continue to see fewer homes selling in Harrisonburg and Rockingham County. After a 6% decline in the number of homes selling between 2021 and 2022... we saw a much larger, 23%, decline in the number of homes selling in our market in 2023. As we'll see on a later graph, this is the lowest number of homes selling in quite a few years. The prices of those homes that are selling continue to rise, quickly. After an 11% increase in the median sales price in 2022, we saw a very similar, 10%, increase in the median sales price in 2023. As we'll see on a later graph, this is the highest median price we have seen in this area, ever. Let's now use that 23% drop in the number of homes selling and that 10% increase in median homes prices as a benchmark against which to understand other similar but slightly different trends in 2023... 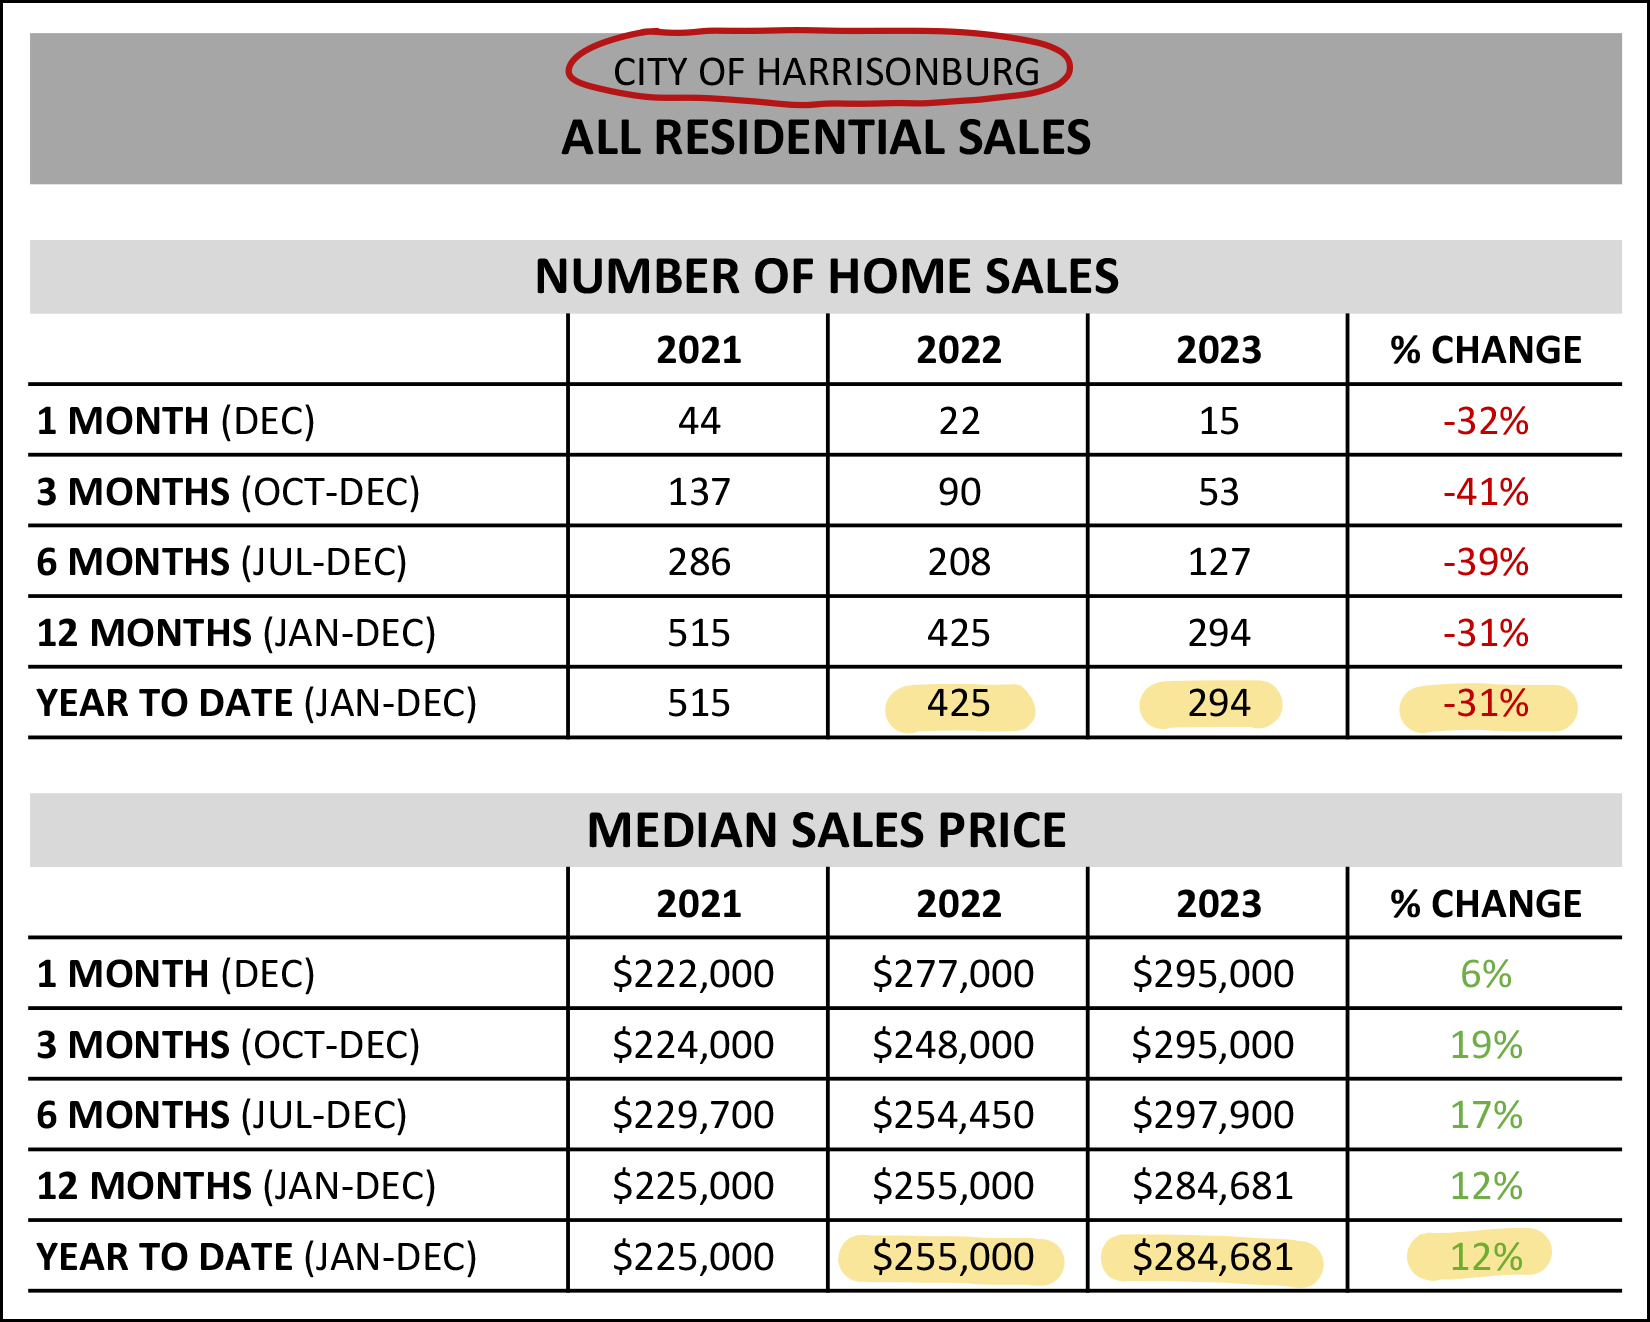 The chart above analyzes the sale of only homes located in the City of Harrisonburg. Compared to the market-wide 23% drop in number of homes selling and 10% increase in median sales prices... [1] The number of homes selling in the City of Harrisonburg declined even further (31%) than the market-wide (23%) change in home sales. [2] The median sales prices of homes selling in the City of Harrisonburg increased even more (+12%) than all homes in the market (+10%). Now, beyond location, let's break things down briefly by property type... 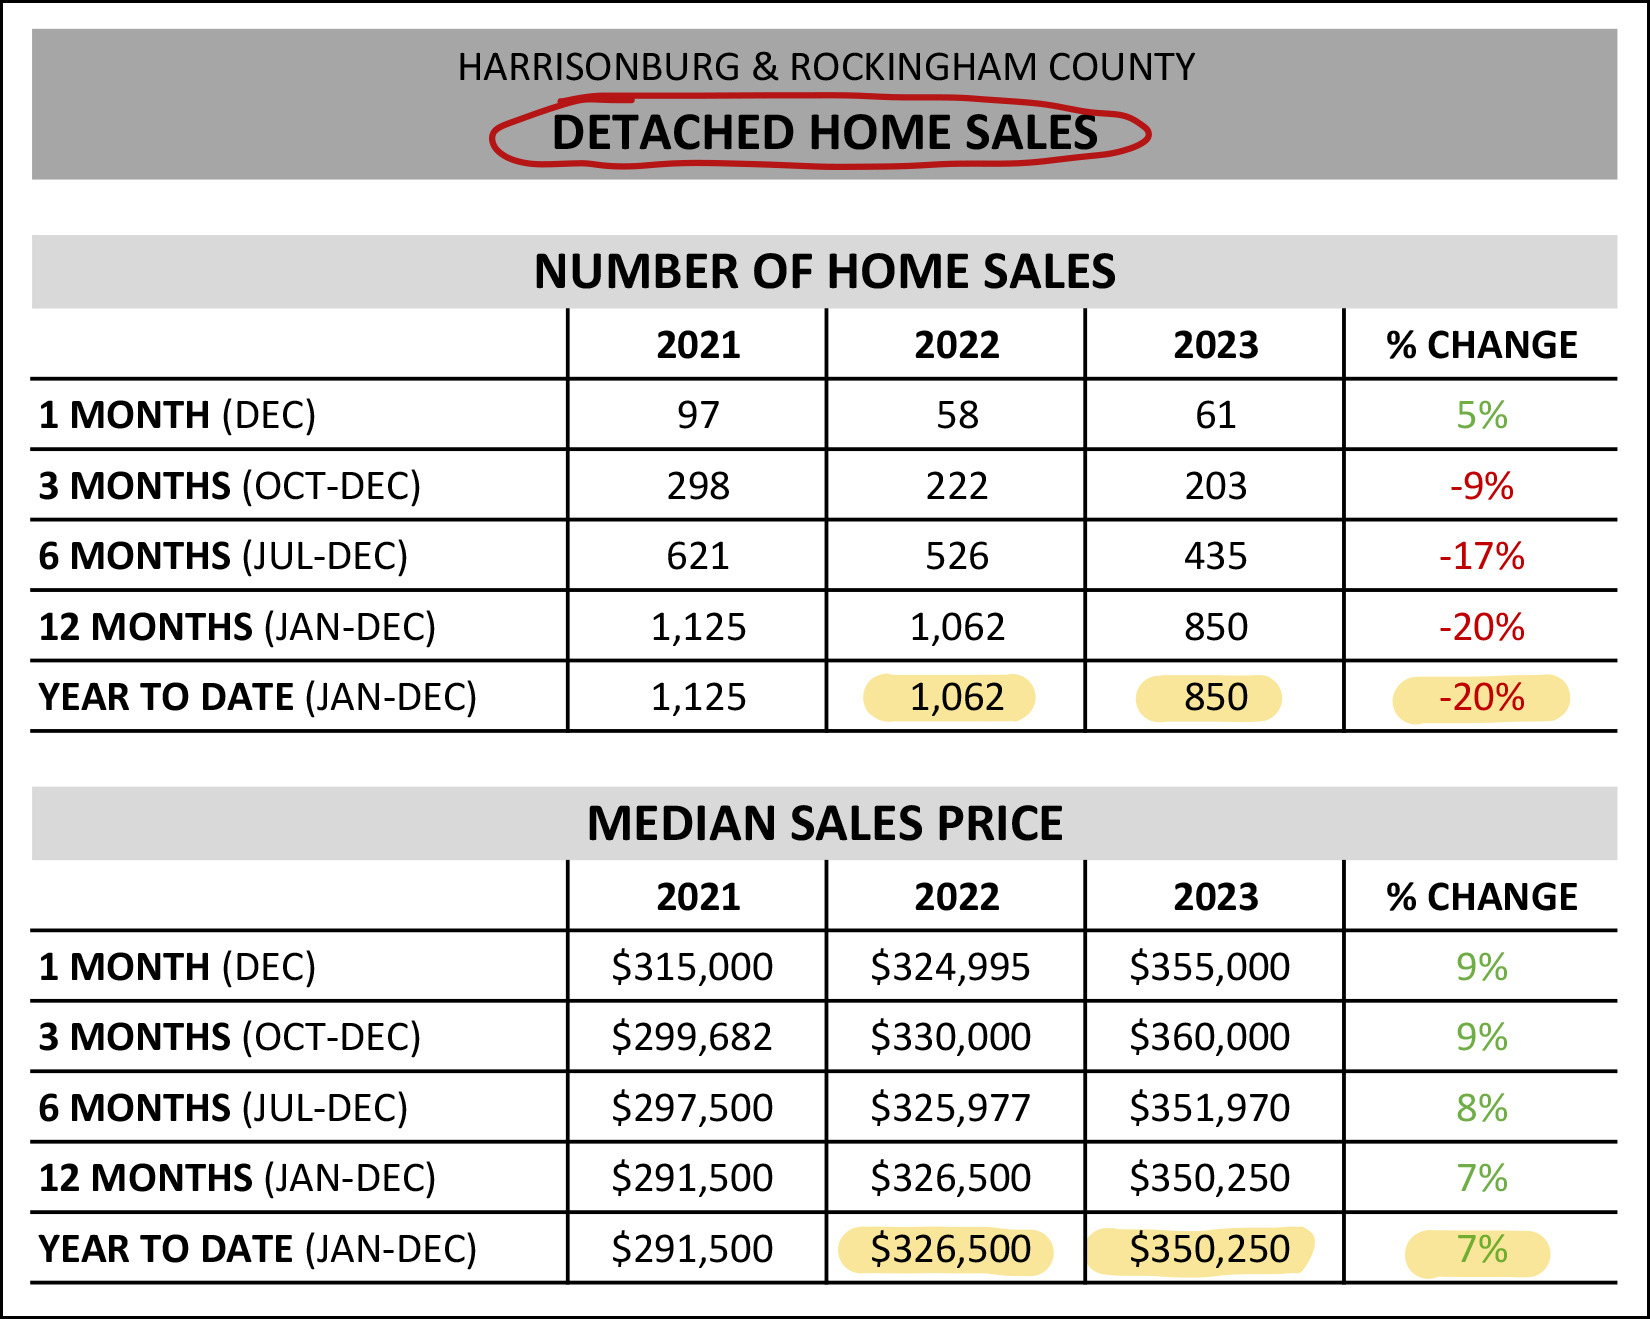 The chart above evaluates only detached homes (single family homes) in the City of Harrisonburg and Rockingham County. Compared to the market-wide 23% drop in number of homes selling and 10% increase in median sales prices... [1] The number of detached homes selling didn't decline quite as far (-20%) as the market overall (-23%) in 2023. [2] The median price of detached homes only increased 7% over the past year, as compared to the market-wide increase of 10%. This a good example of why every homeowner in Harrisonburg and Rockingham County shouldn't necessarily assume that their home's value increased by 10% over the past year. If you own a detached home that change may very well have only been 7%. And how about those attached homes? 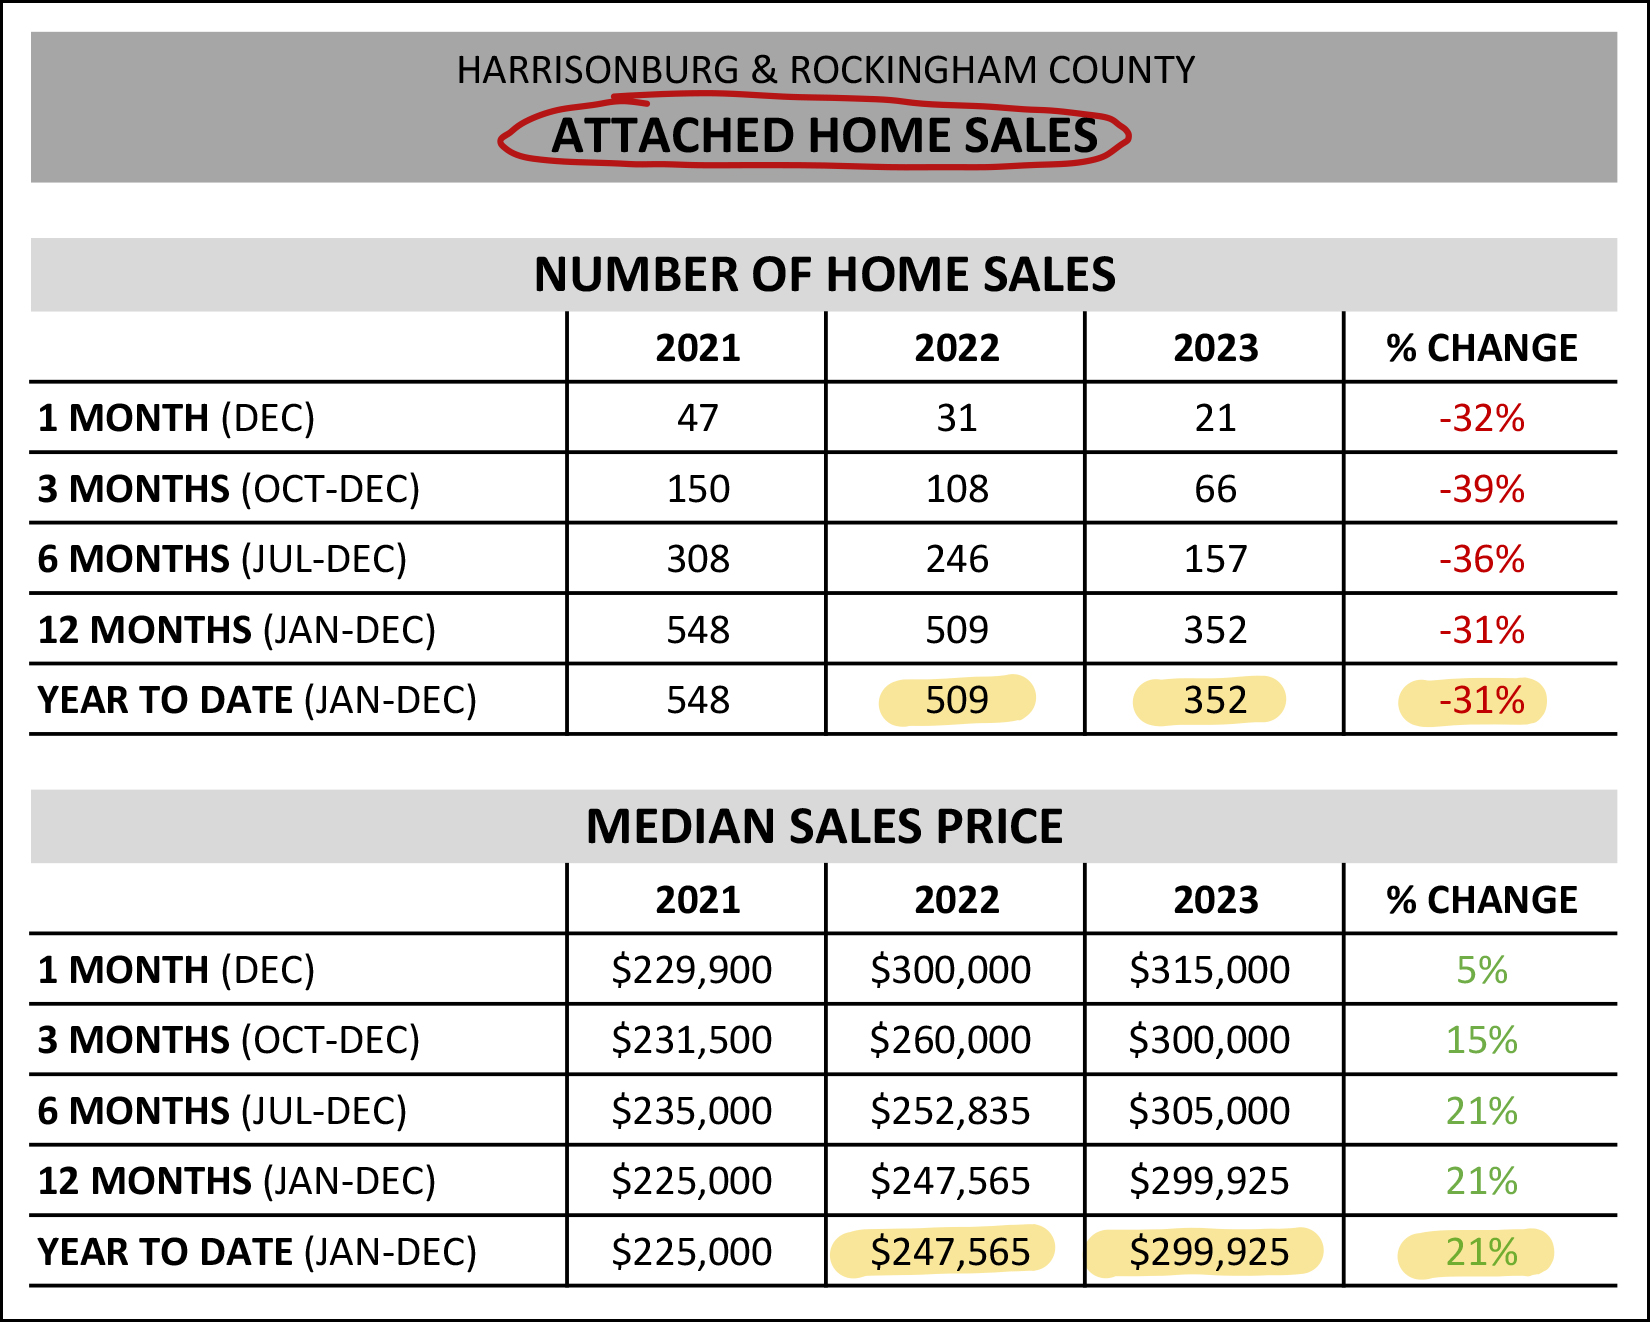 The chart above evaluates only attached homes (duplexes, townhomes, condos) in the City of Harrisonburg and Rockingham County. Compared to the market-wide 23% drop in number of homes selling and 10% increase in median sales prices... [1] We saw a somewhat larger decline (-31%) in the number of attached homes selling in 2023 compared to the overall market (-23%). [2] We saw a much (!!) larger increase in the median sales price of these attached homes (+20%) as compared to the overall market (+10%). But... before you assume that your attached home increased in value by 20% over the past year... remember that plenty of these attached homes were new homes, thus selling at higher prices, thus helping elevate this median sales price. Speaking of new homes, let's look at how things trended for just the existing homes in our market... 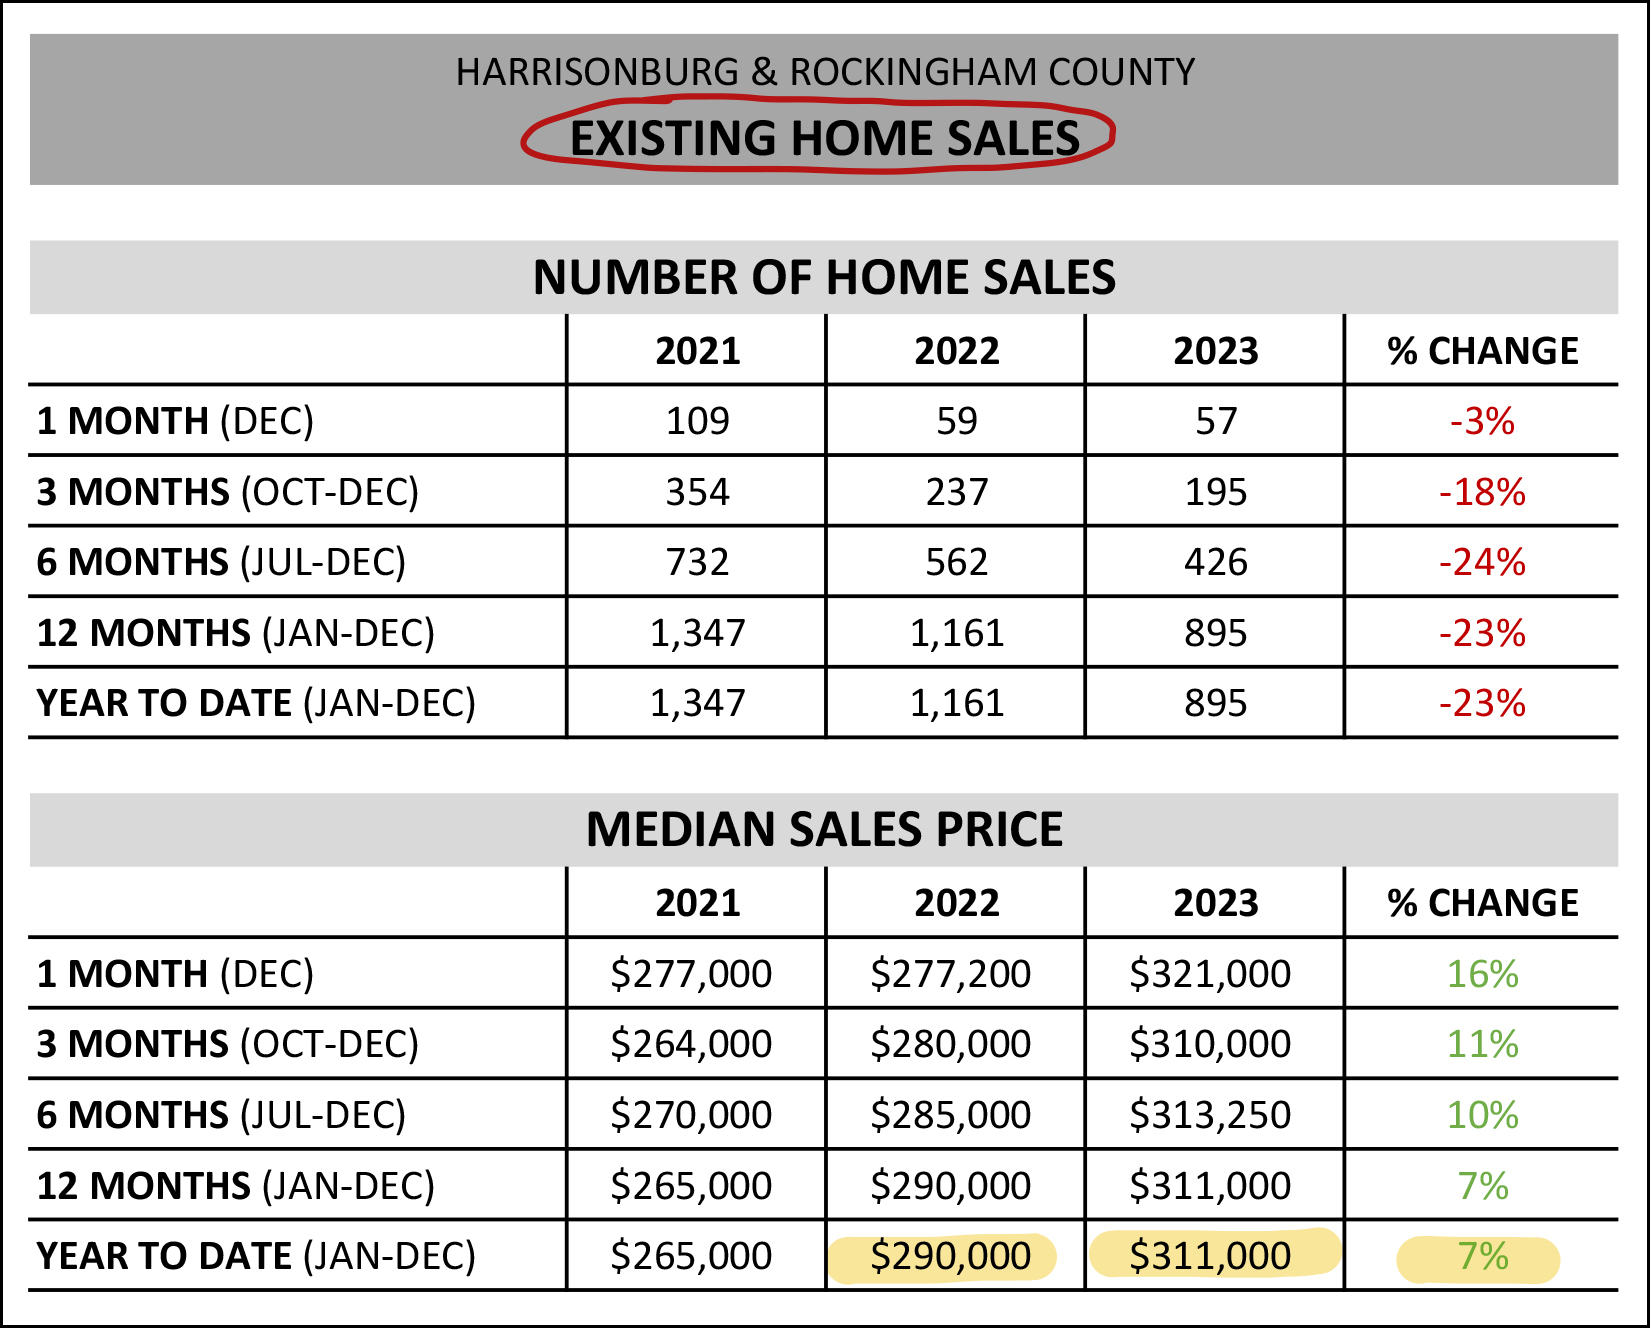 When looking at only existing home sales (not sales of new homes) we find... [1] The decline in existing home sales is exactly in line (-23%) with the overall market. [2] The median sales price of existing homes only rose 7% over the past year, compared to the market-wide increase of 10%. If you love the data and want to dig into these charts and related charts even further, you can do so here. :-) Now, let's see if some pictures (graphs) can help us further understand the current state of our local housing market and where we might be heading next... 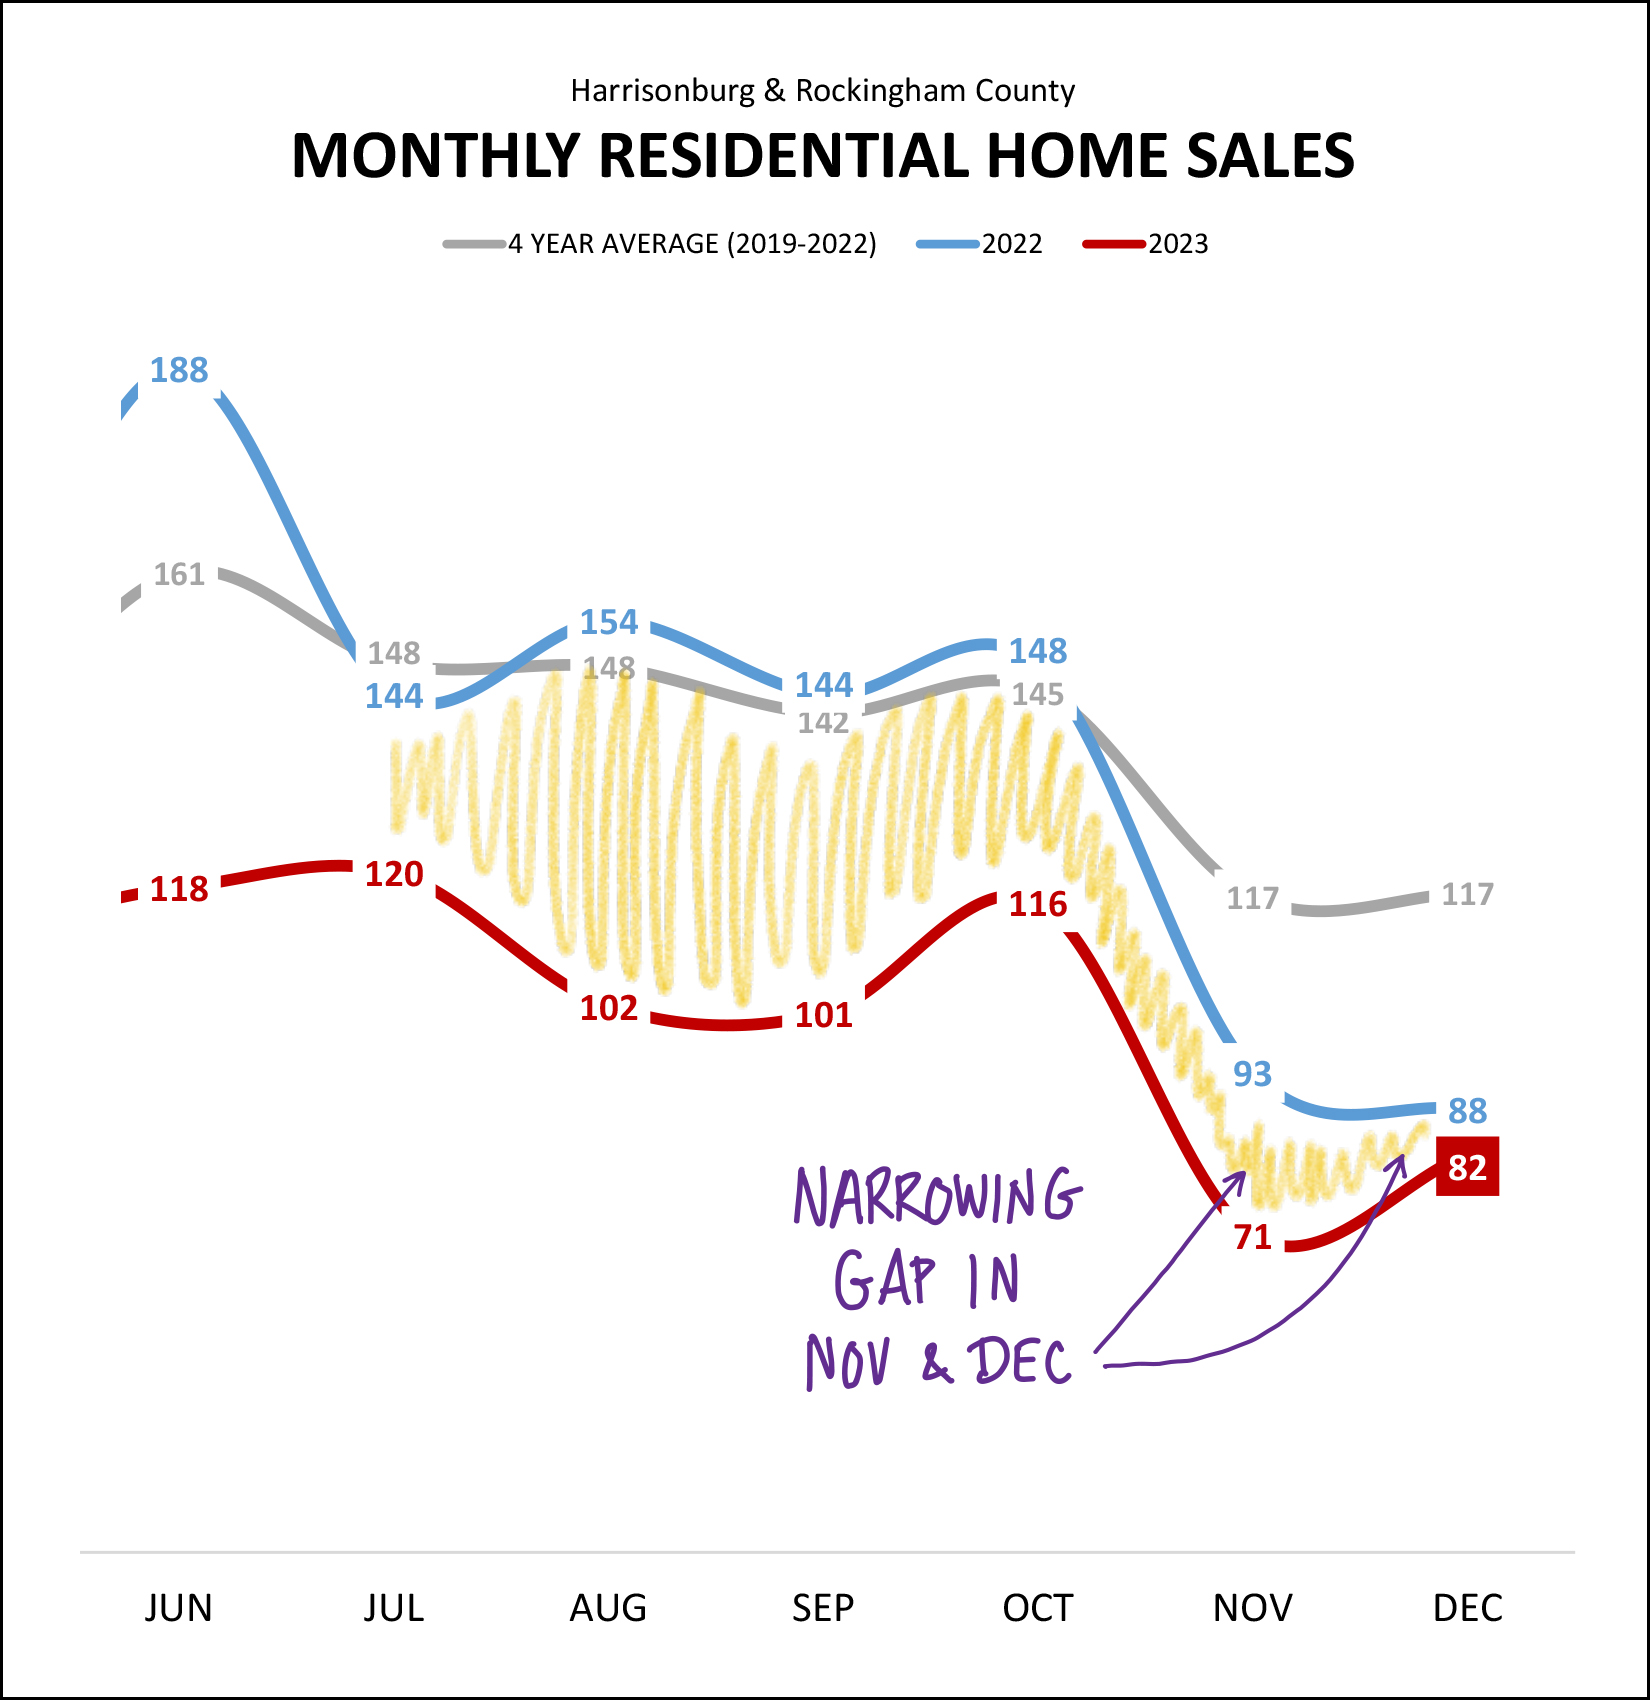 The graph above tracks the number of home sales that took place each month in 2023 (red line), 2022 (blue line) and the average number taking place per month over four years (2019-2022). As you can see from the shaded yellow area, all through the summer and through most of the fall we were seeing monthly home sales at levels quite a bit below last year's levels. But... then came November and December. In those final two months of the year we started to see the most recent year of home sales (2023) almost catching back up to the same month of home sales in 2022. To put things into an even longer / broader perspective... 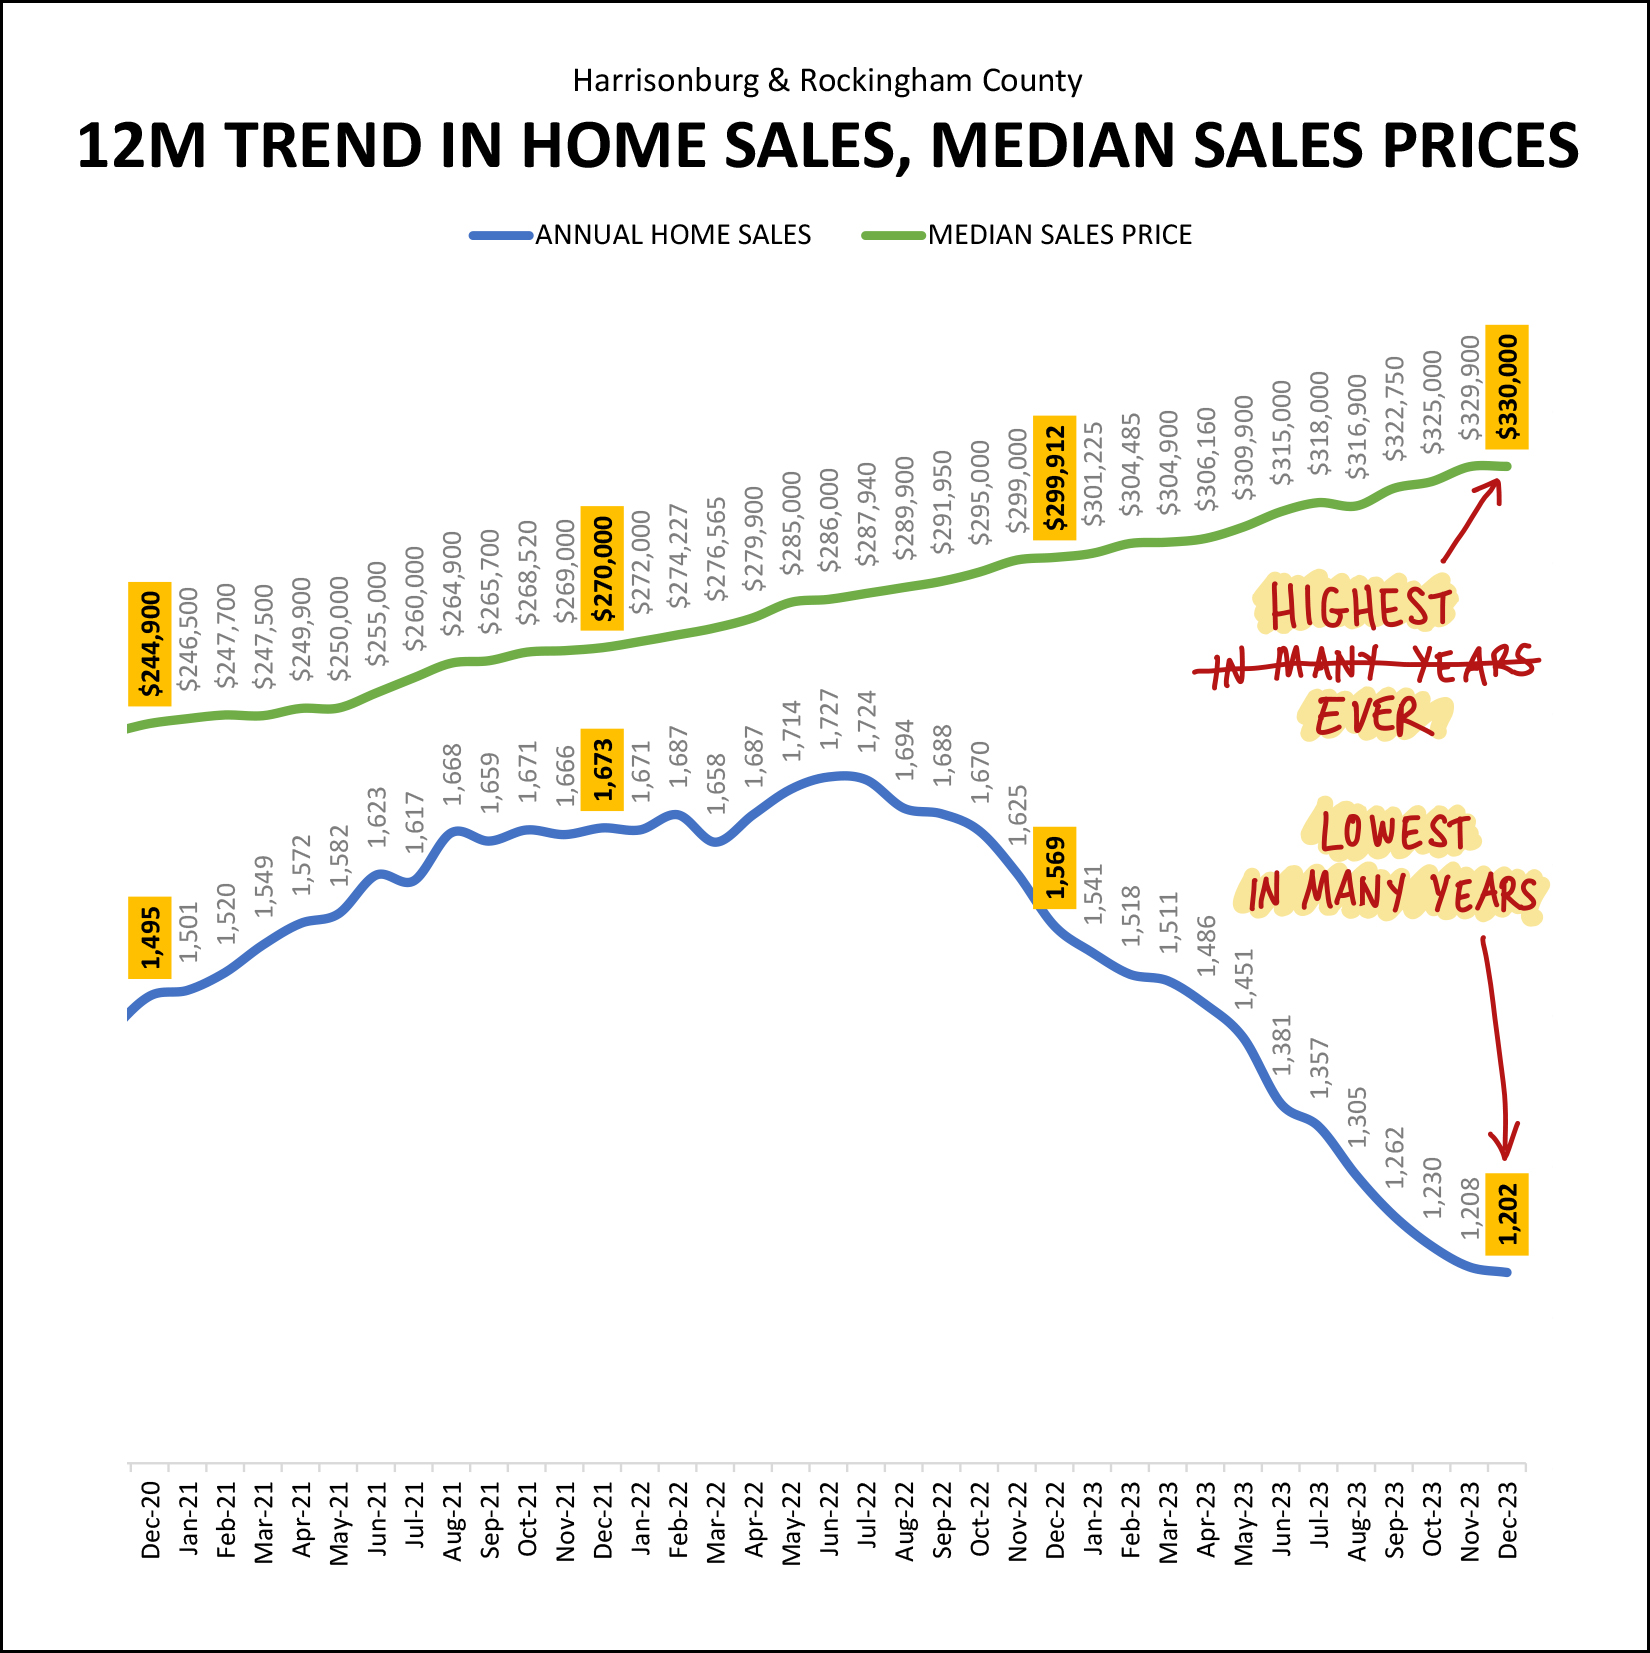 The current annual trend of home sales in the City and County has been falling (blue line) for the past year and a half. This annual sales pace peaked at 1,727 home sales in a year back in June 2022... but has been falling ever since. The current pace of 1,202 home sales a year is the lowest in many years! The current annualized median sales price in the City and County has been rising for just about a decade now, and at $330,000 it is at the highest point point it has ever been in our local area. To be clear, we've been setting new annual records for the median sales price for each of the past five (+) years -- so the "highest ever" isn't a new phenomenon -- it has been happening year after year since 2018. If you own a home, look at the next graph. If you don't... maybe don't look at the next graph? :-/ 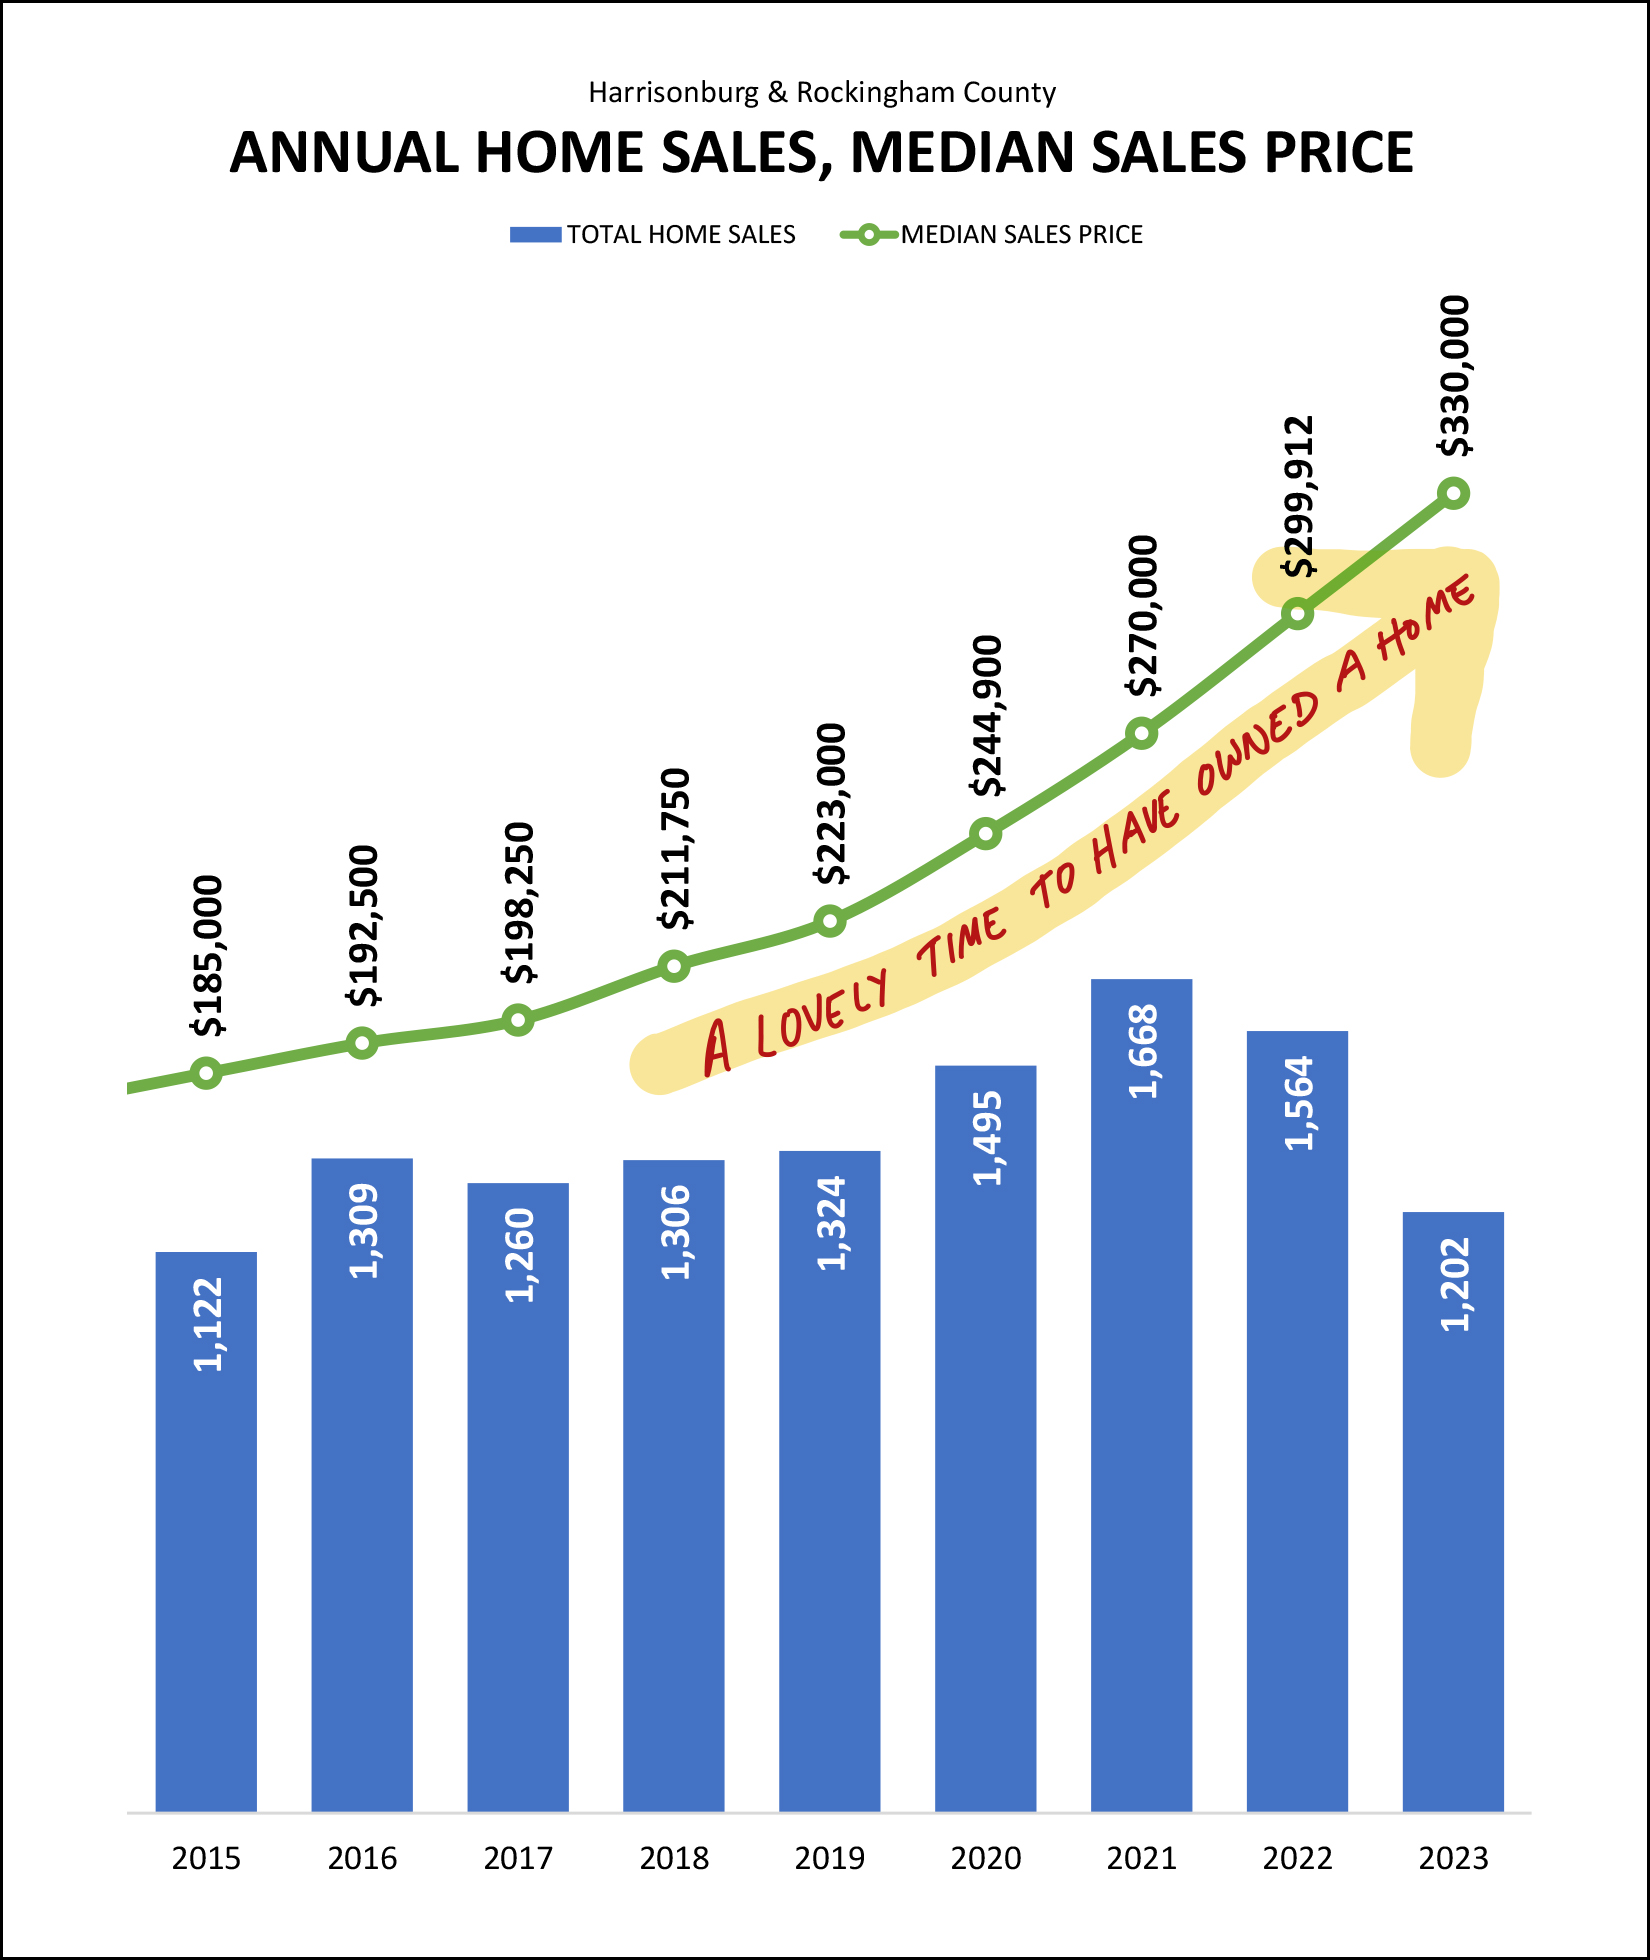 As shown above, it has been a LOVELY time to have owned a home over the past five years. Home prices have been blazing their way upward between 2018 and 2023 with a total of a 56% increase in the median sales price during that timeframe! What happens next, you might ask? I think it is highly unlikely that we will see another 56% increase in the median sales price over the next five years... but home values do seem poised to continue to increase in our local area over the next few years, even if not as quickly. And now to help you visualize the faster than the overall market increases in the median sales price of attached homes... 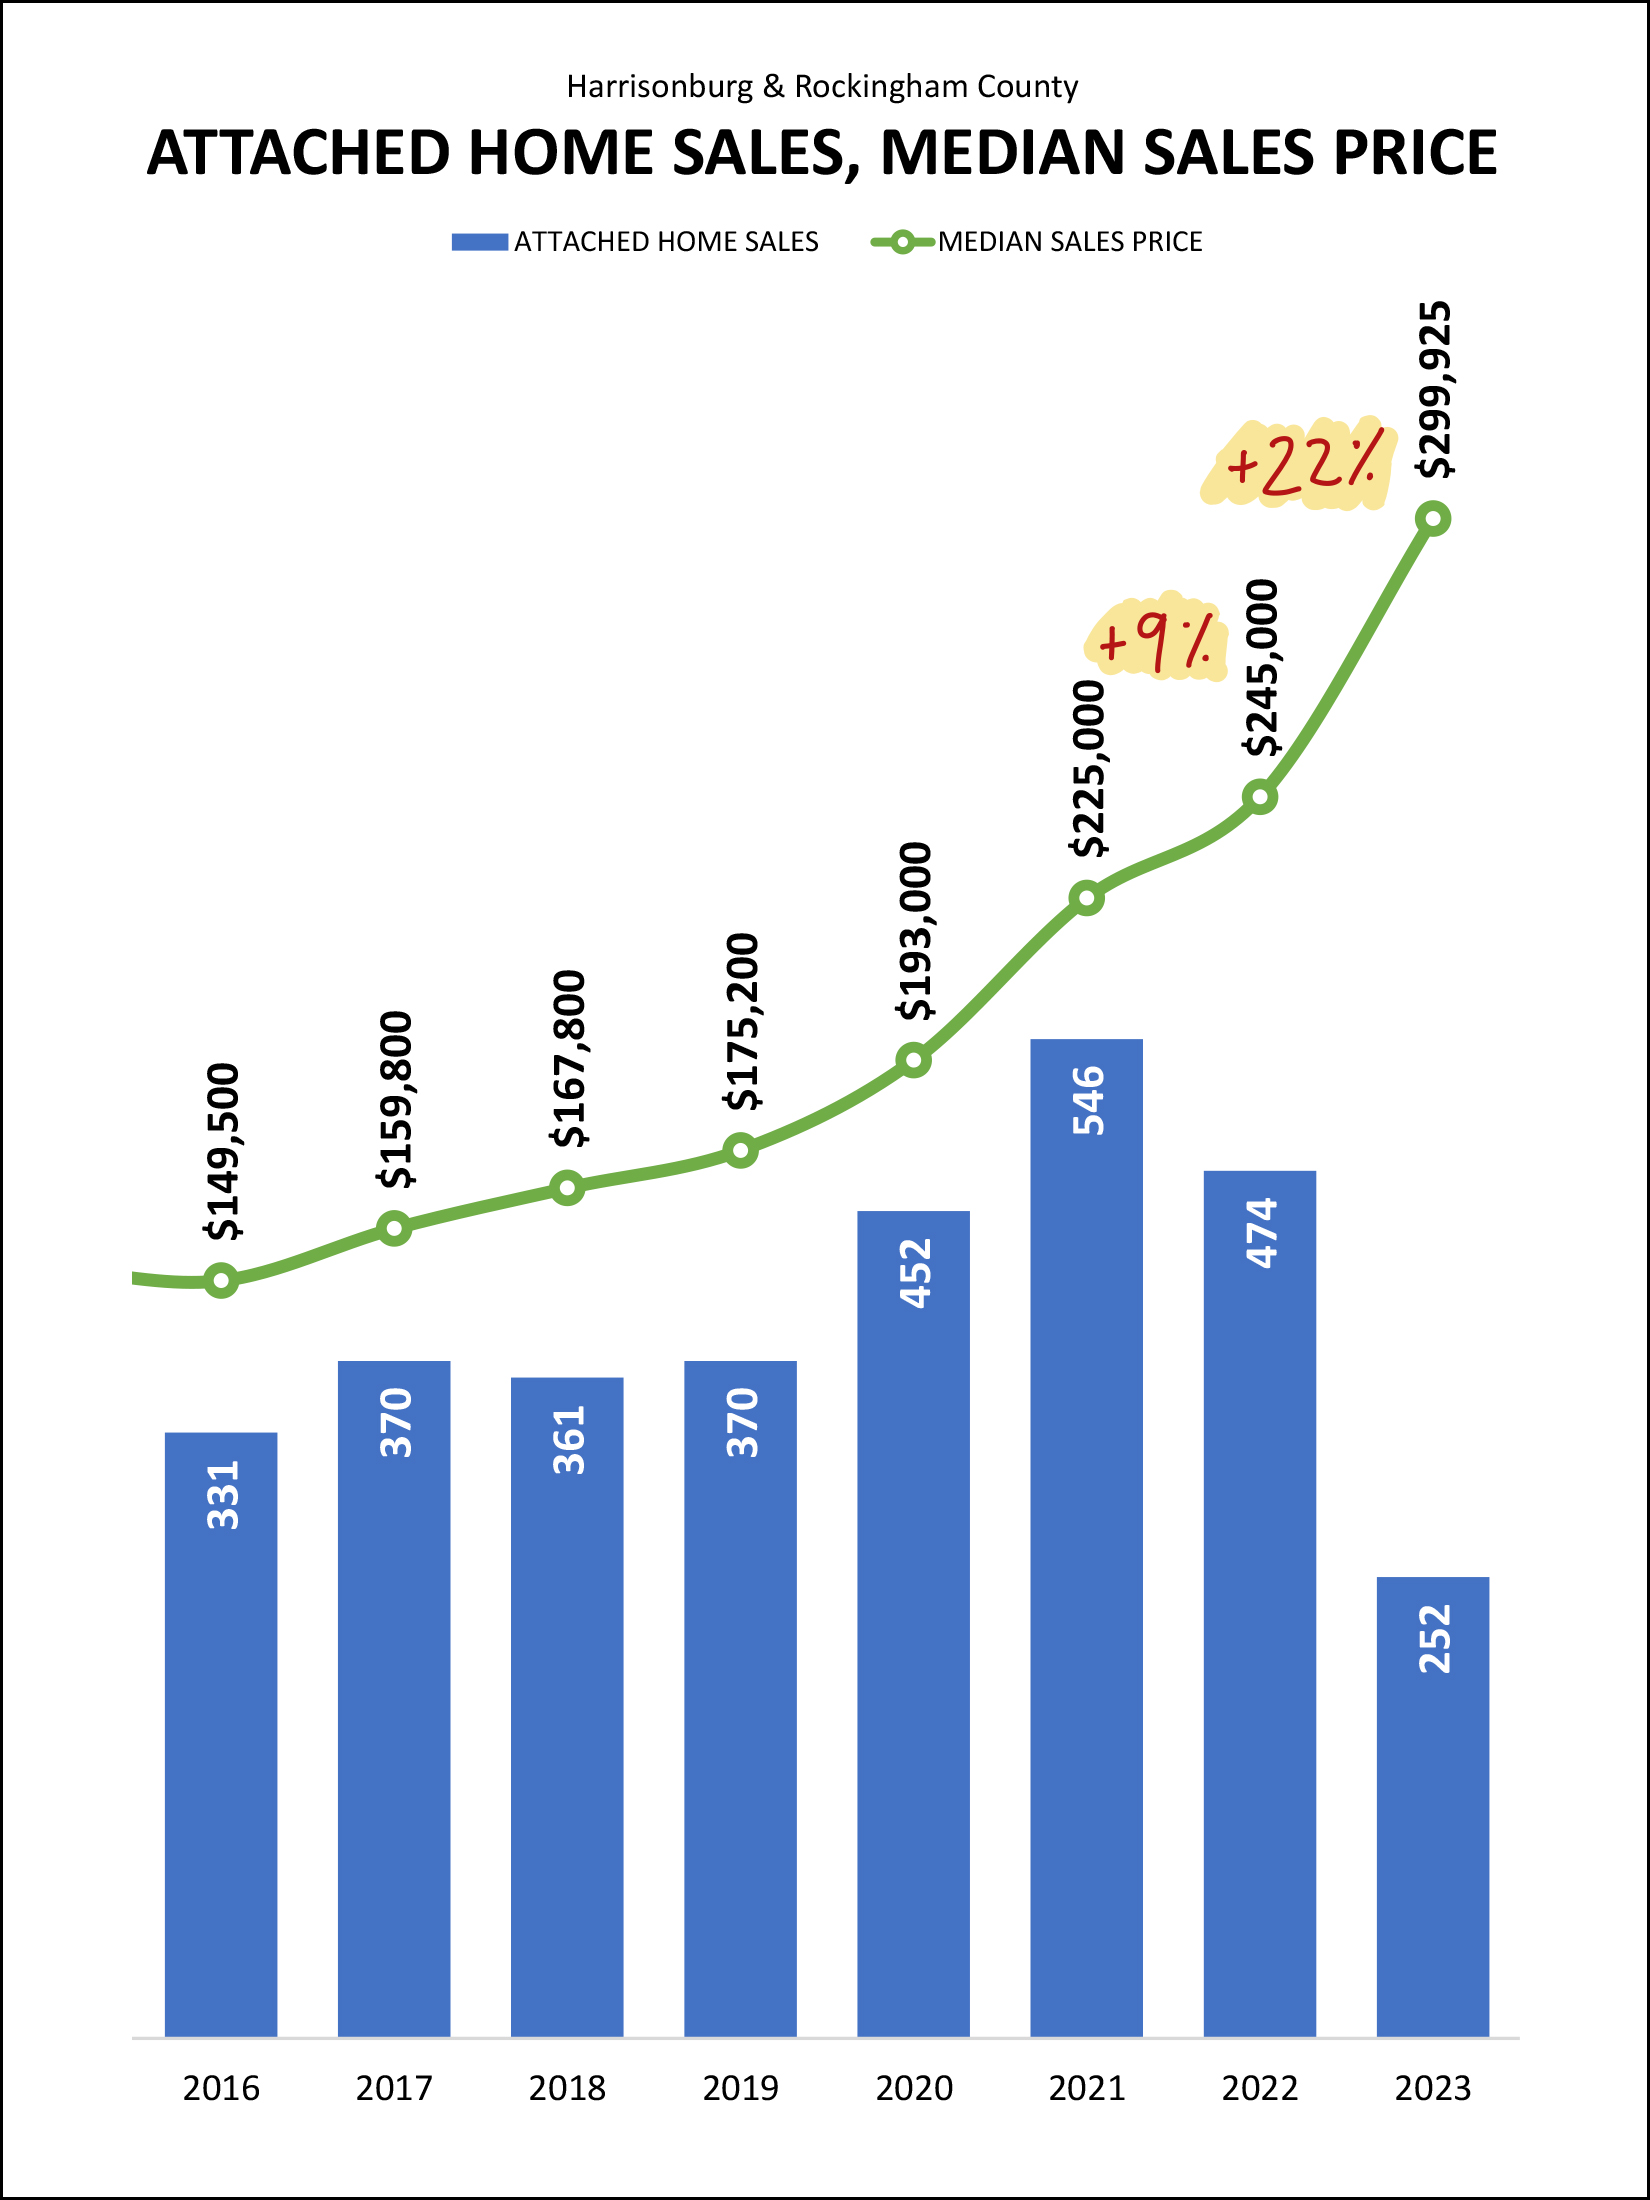 Indeed, as shown above, the median sales price of attached homes (townhouses, duplexes, condos) is increasing QUICKLY! Between 2021 and 2022 we saw a 9% increase in the median sales price of attached homes in Harrisonburg and Rockingham County. In 2023, we saw a 22% increase in this median sales price! Again, at least a portion of this is the influence of higher prices of new attached homes -- but regardless of how you slice and dice the data, the price of attached homes is rising, quickly. This next graph looks at new (vs. existing) home sales -- in two ways... 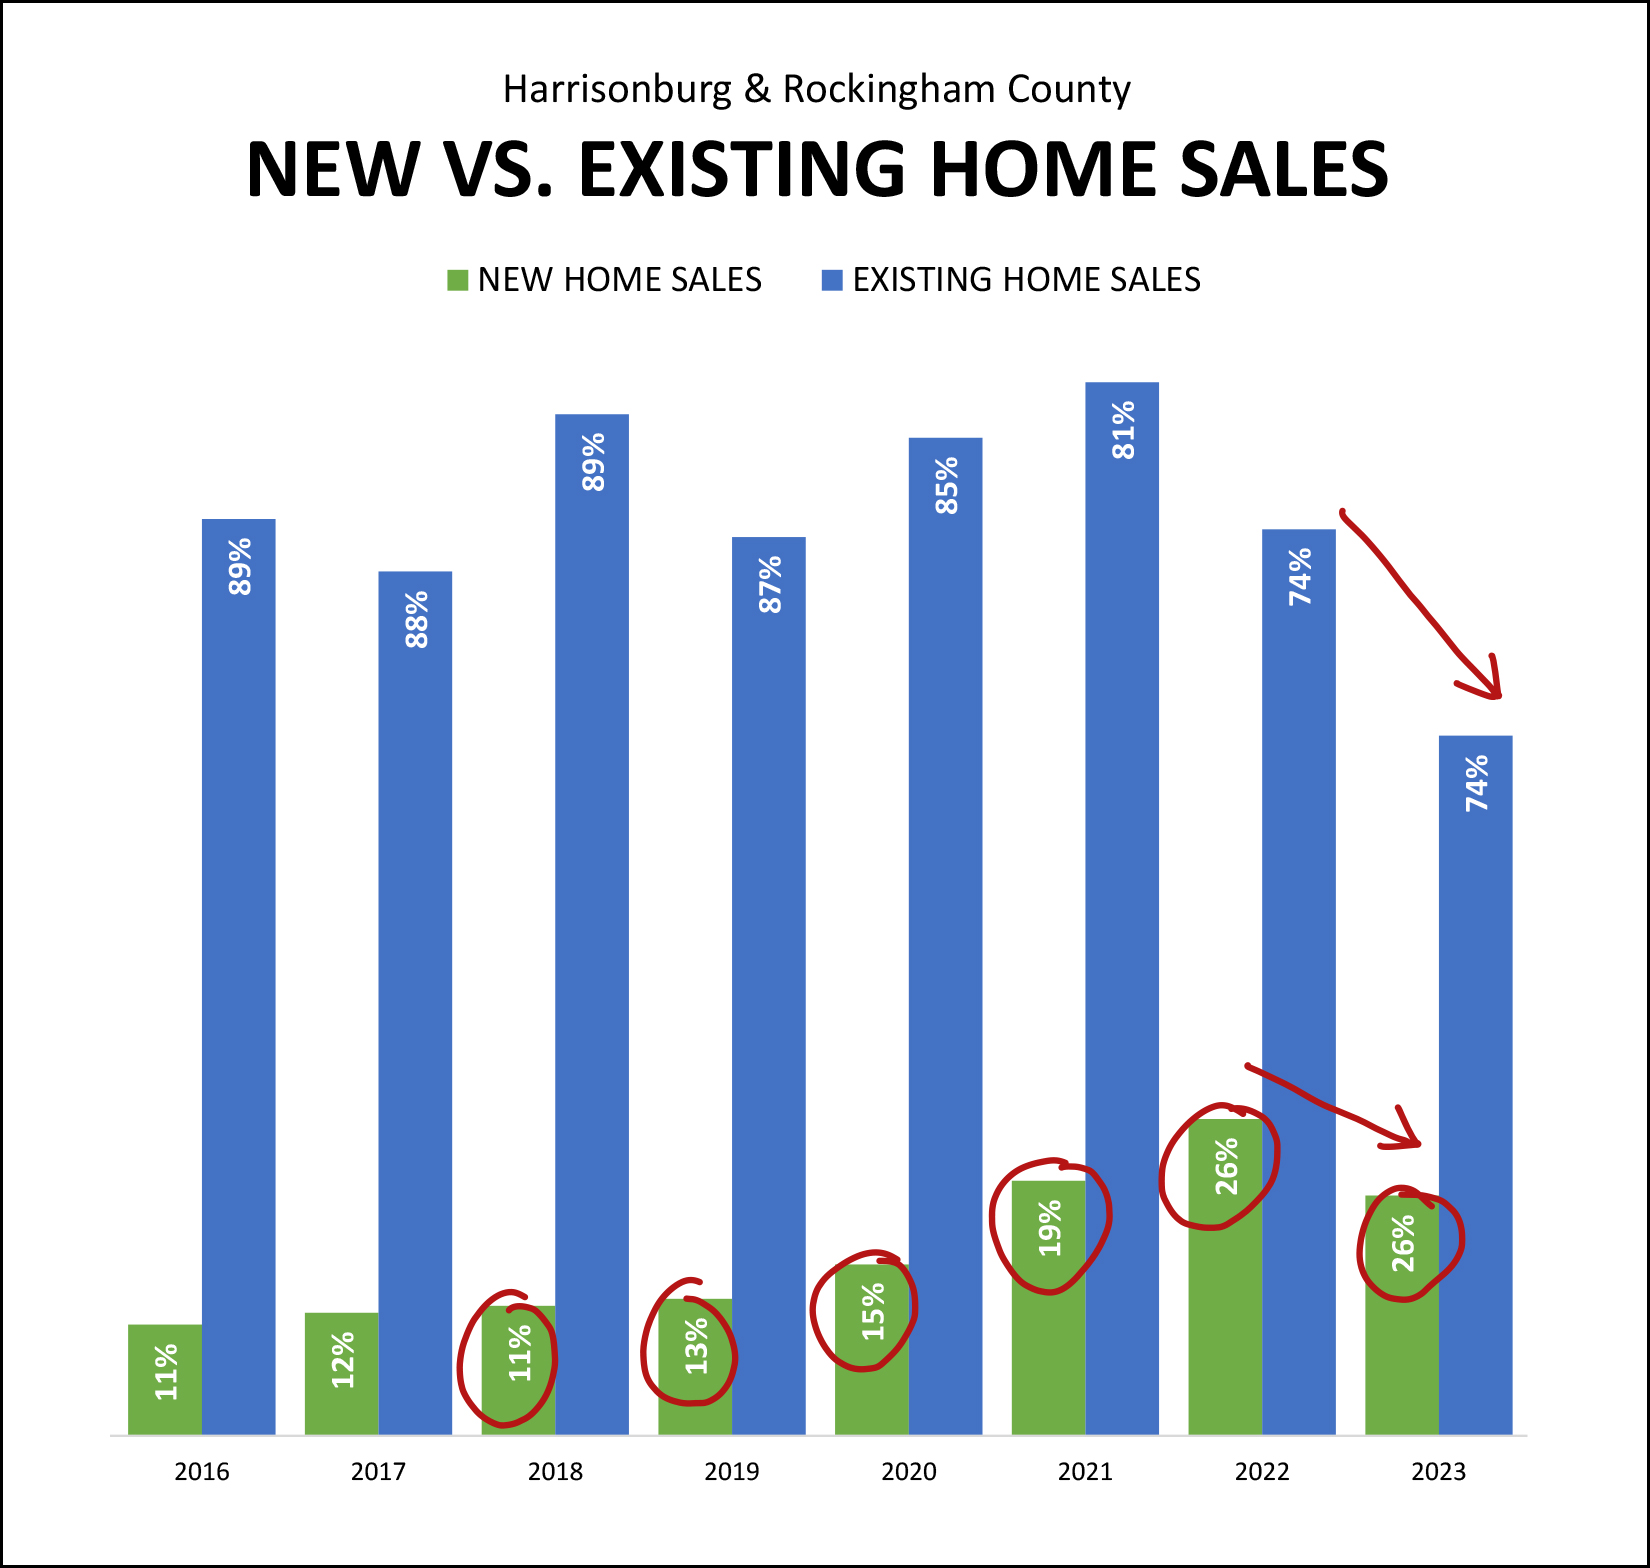 First, we should note that the number of both existing homes (blue bars) and new homes (green bars) declined between 2022 and 2023. We saw fewer sellers selling and buyers buying -- both existing homes and new homes. But... five years ago new home comprised 11% of the total number of home sales in 2018... and this past year new home sales made up a much larger 26% share of overall home sales. I expect that we will continue to see a significant share of total home sales being new home sales... especially since so many existing homeowners (would be sellers) have very low fixed mortgage interest rates and won't be all that excited to sell their homes while interest rates are still at/above 6%. Now, looking at some of the most recent market activity... contracts being signed... 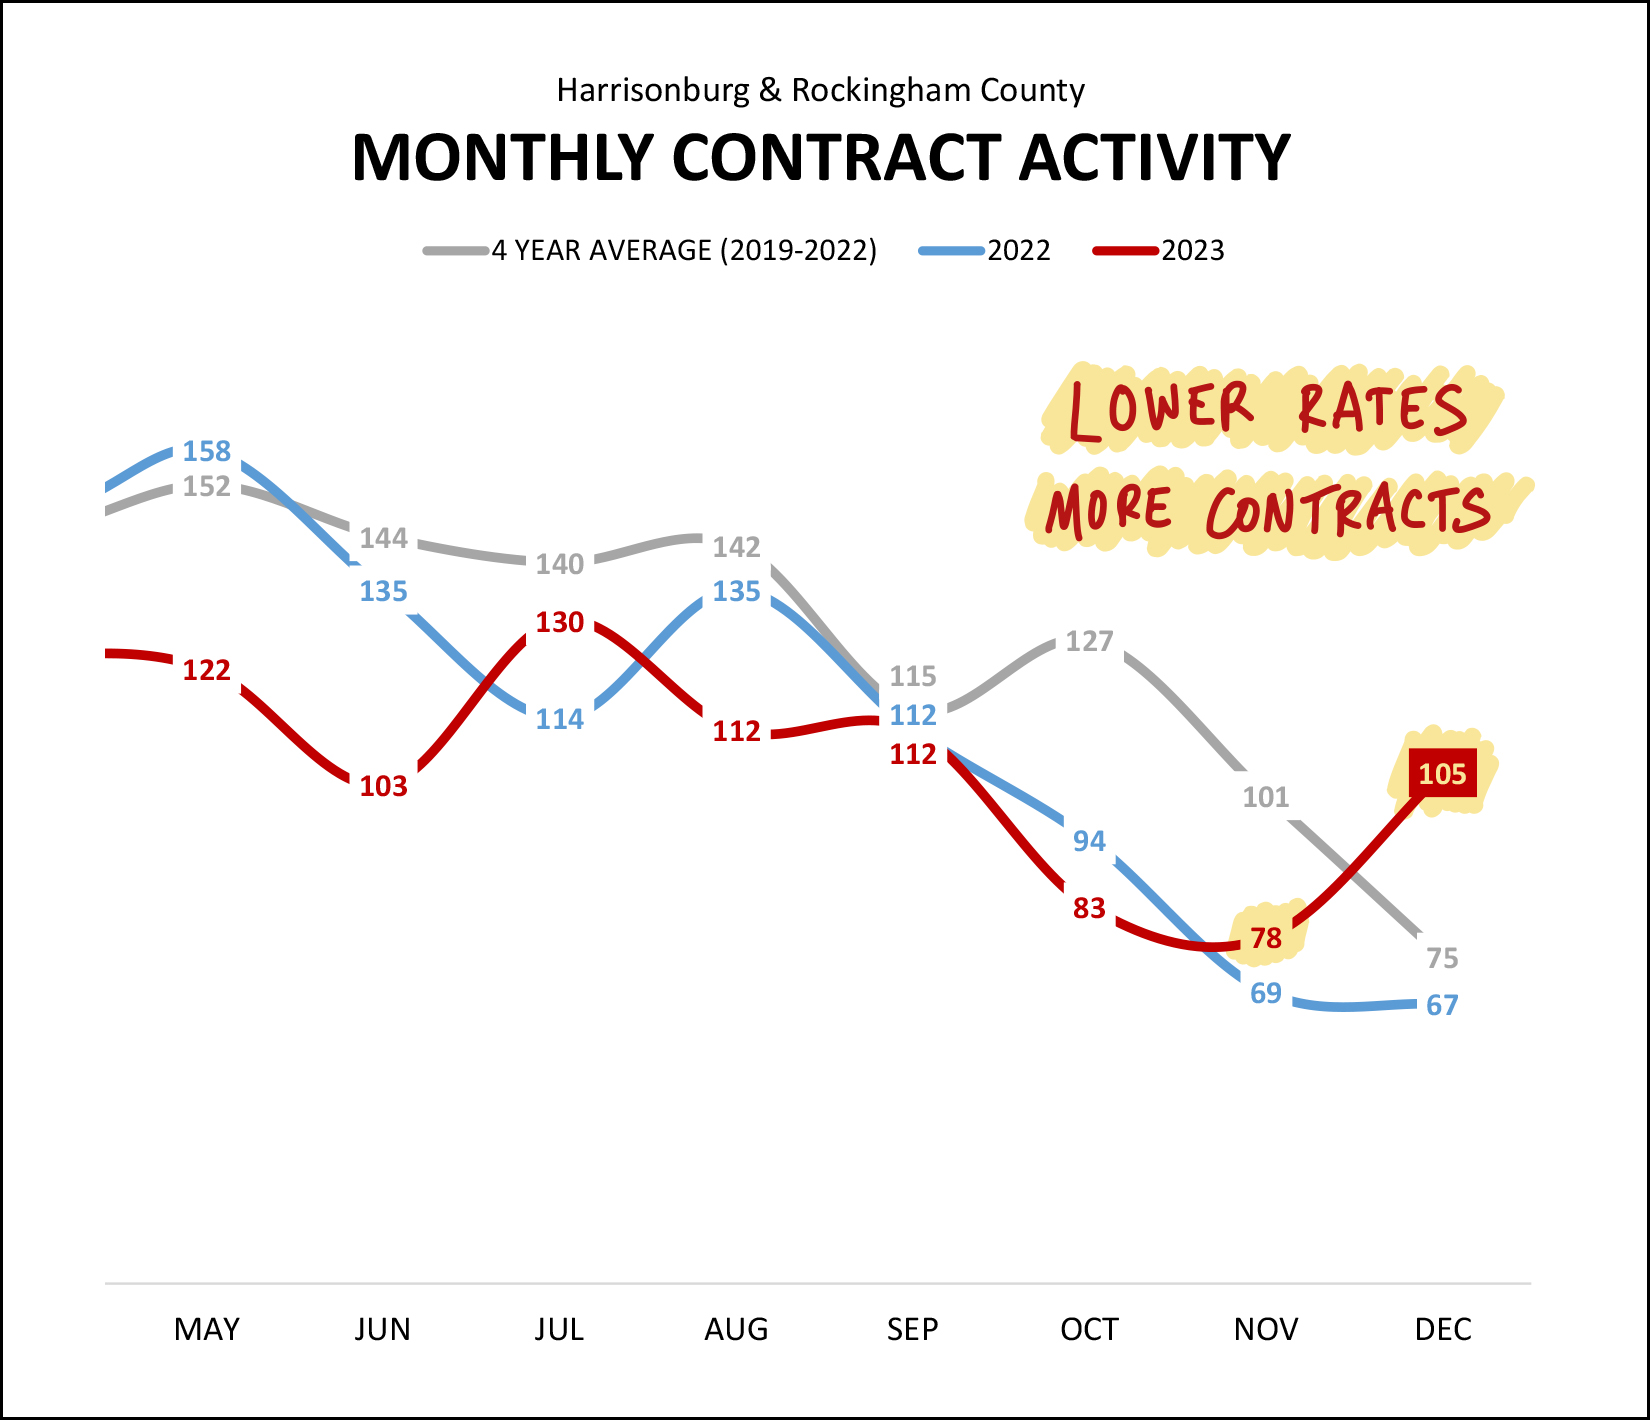 The red line above shows the number of contracts signed per month compared to the same month last year in a blue line. You'll note that most of this year's (red) data points are a good bit below last year. But... not November of December. Contract activity this November snuck (barely) past last November... and contract activity this December blasted past last December with 105 contracts this December (2023) compared to only 67 the prior December (2022). And, as you might imagine, the increased pace at which contracts were signed in those two months pushed the "pending sales" numbers past where we were a year ago... 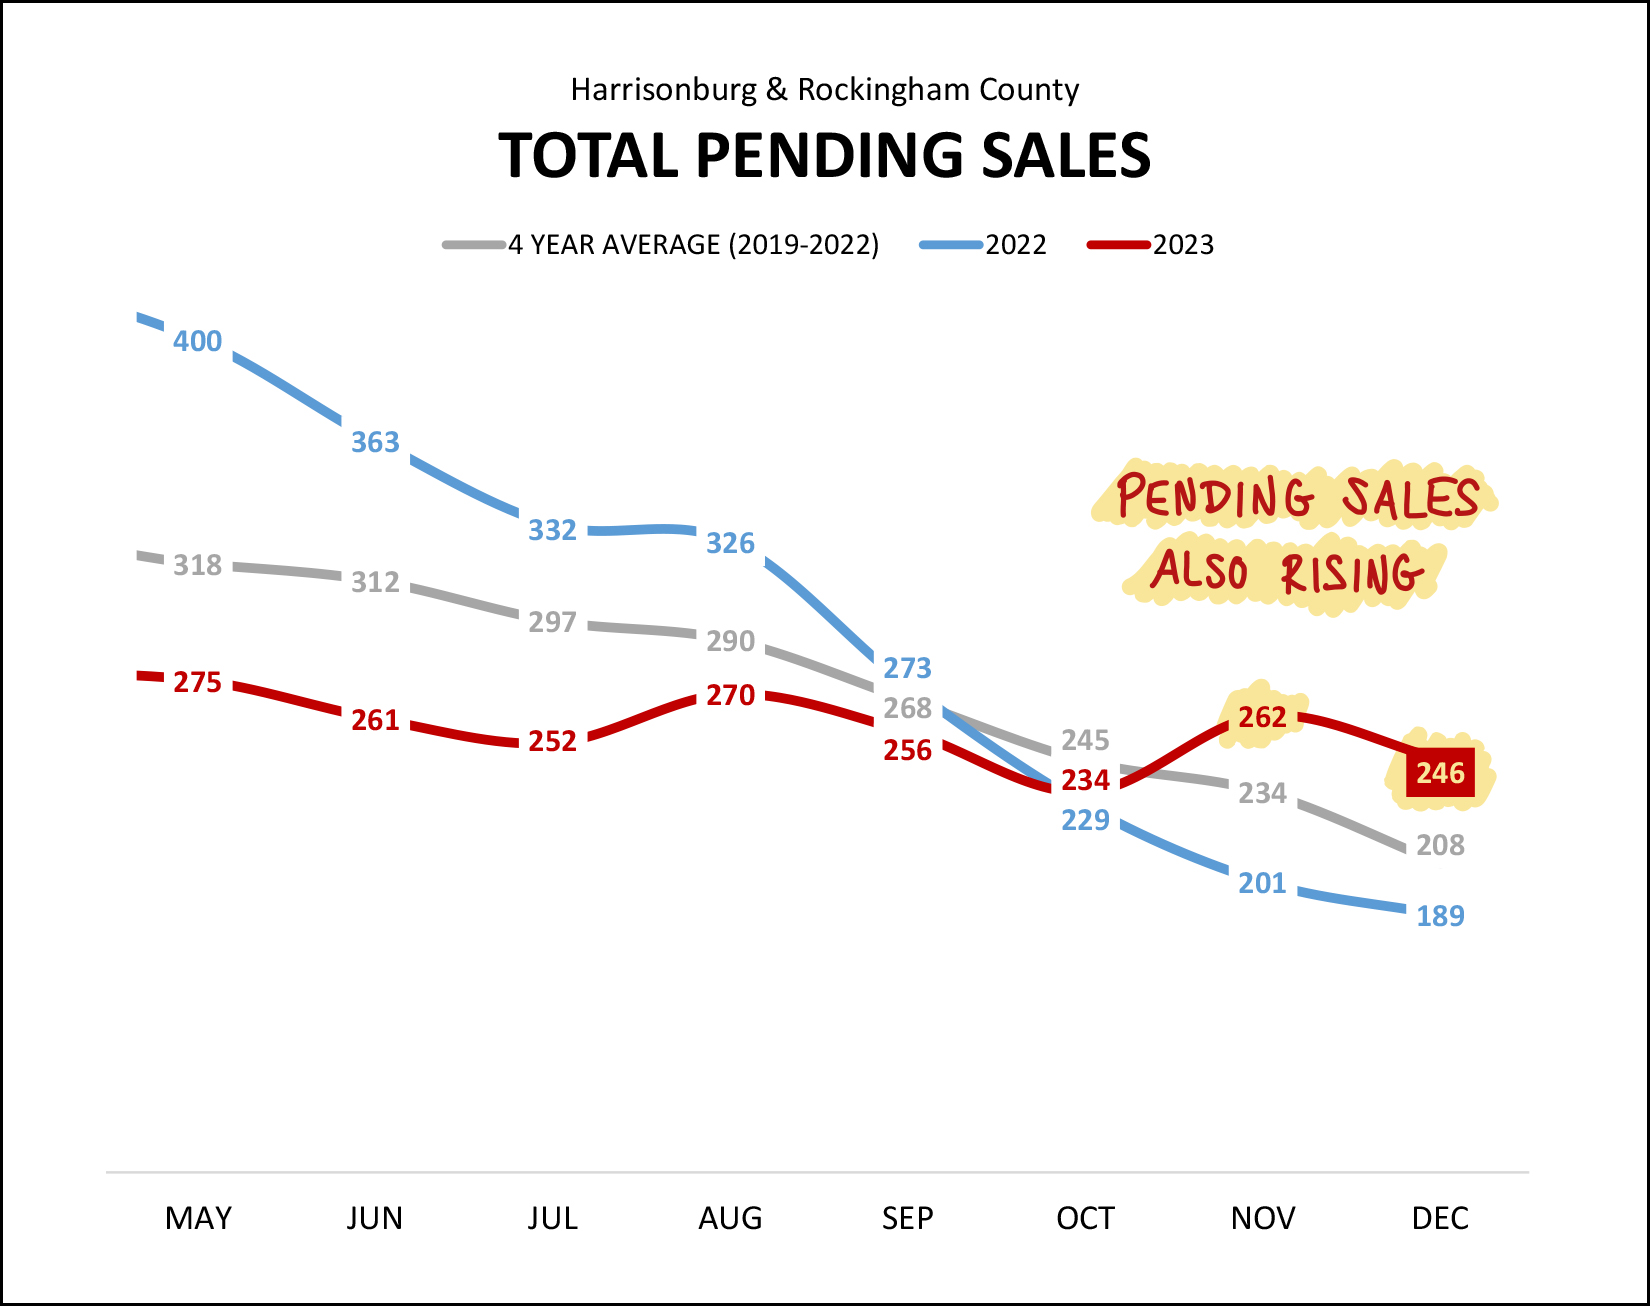 For most of 2023 we saw pending sales levels (total number of under contract properties) below where they were in the same month last year. But... that changed in October 2023 and contract activity in November and December pushed the pending sales numbers well ahead of where things were a year ago. We closed out 2022 with 189 properties under contract... compared to 246 properties under contract in December 2023! Have these contracts being signed start to make a dent in inventory levels that were otherwise rising? Good guess... 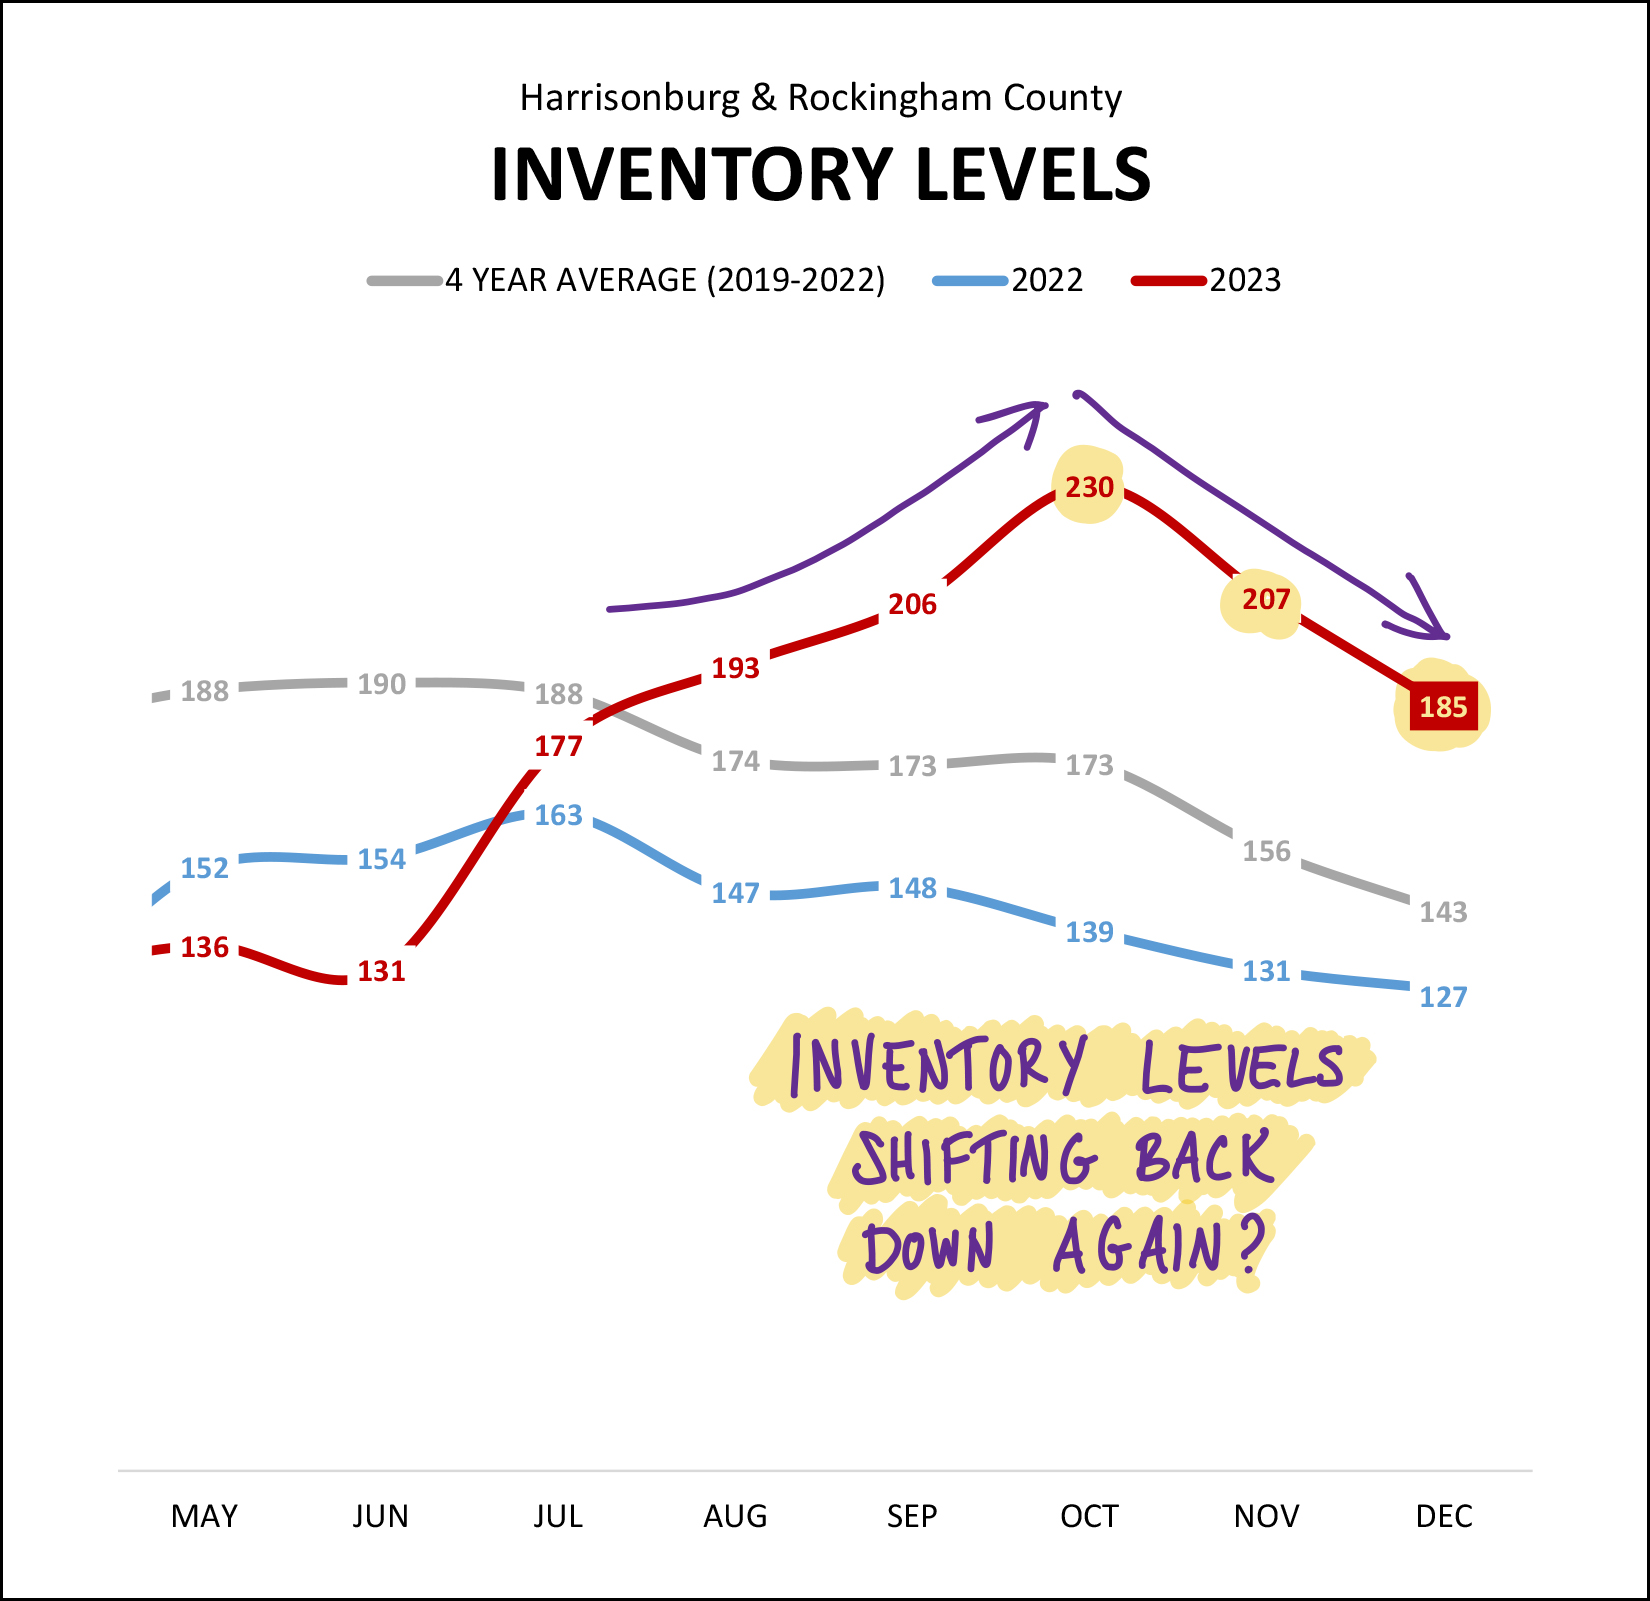 After seeing steady (rather rapid) increases in inventory levels between June 2023 and October 2023 (131 up to 230) those inventory levels started to decline again in November (to 207) and followed that trend in December (down to 185). Certainly, a higher than expected number of buyers signing contracts goes a long way towards reducing inventory levels. Was there anything else that declined, similarly, in November and December 2023? Let's see... 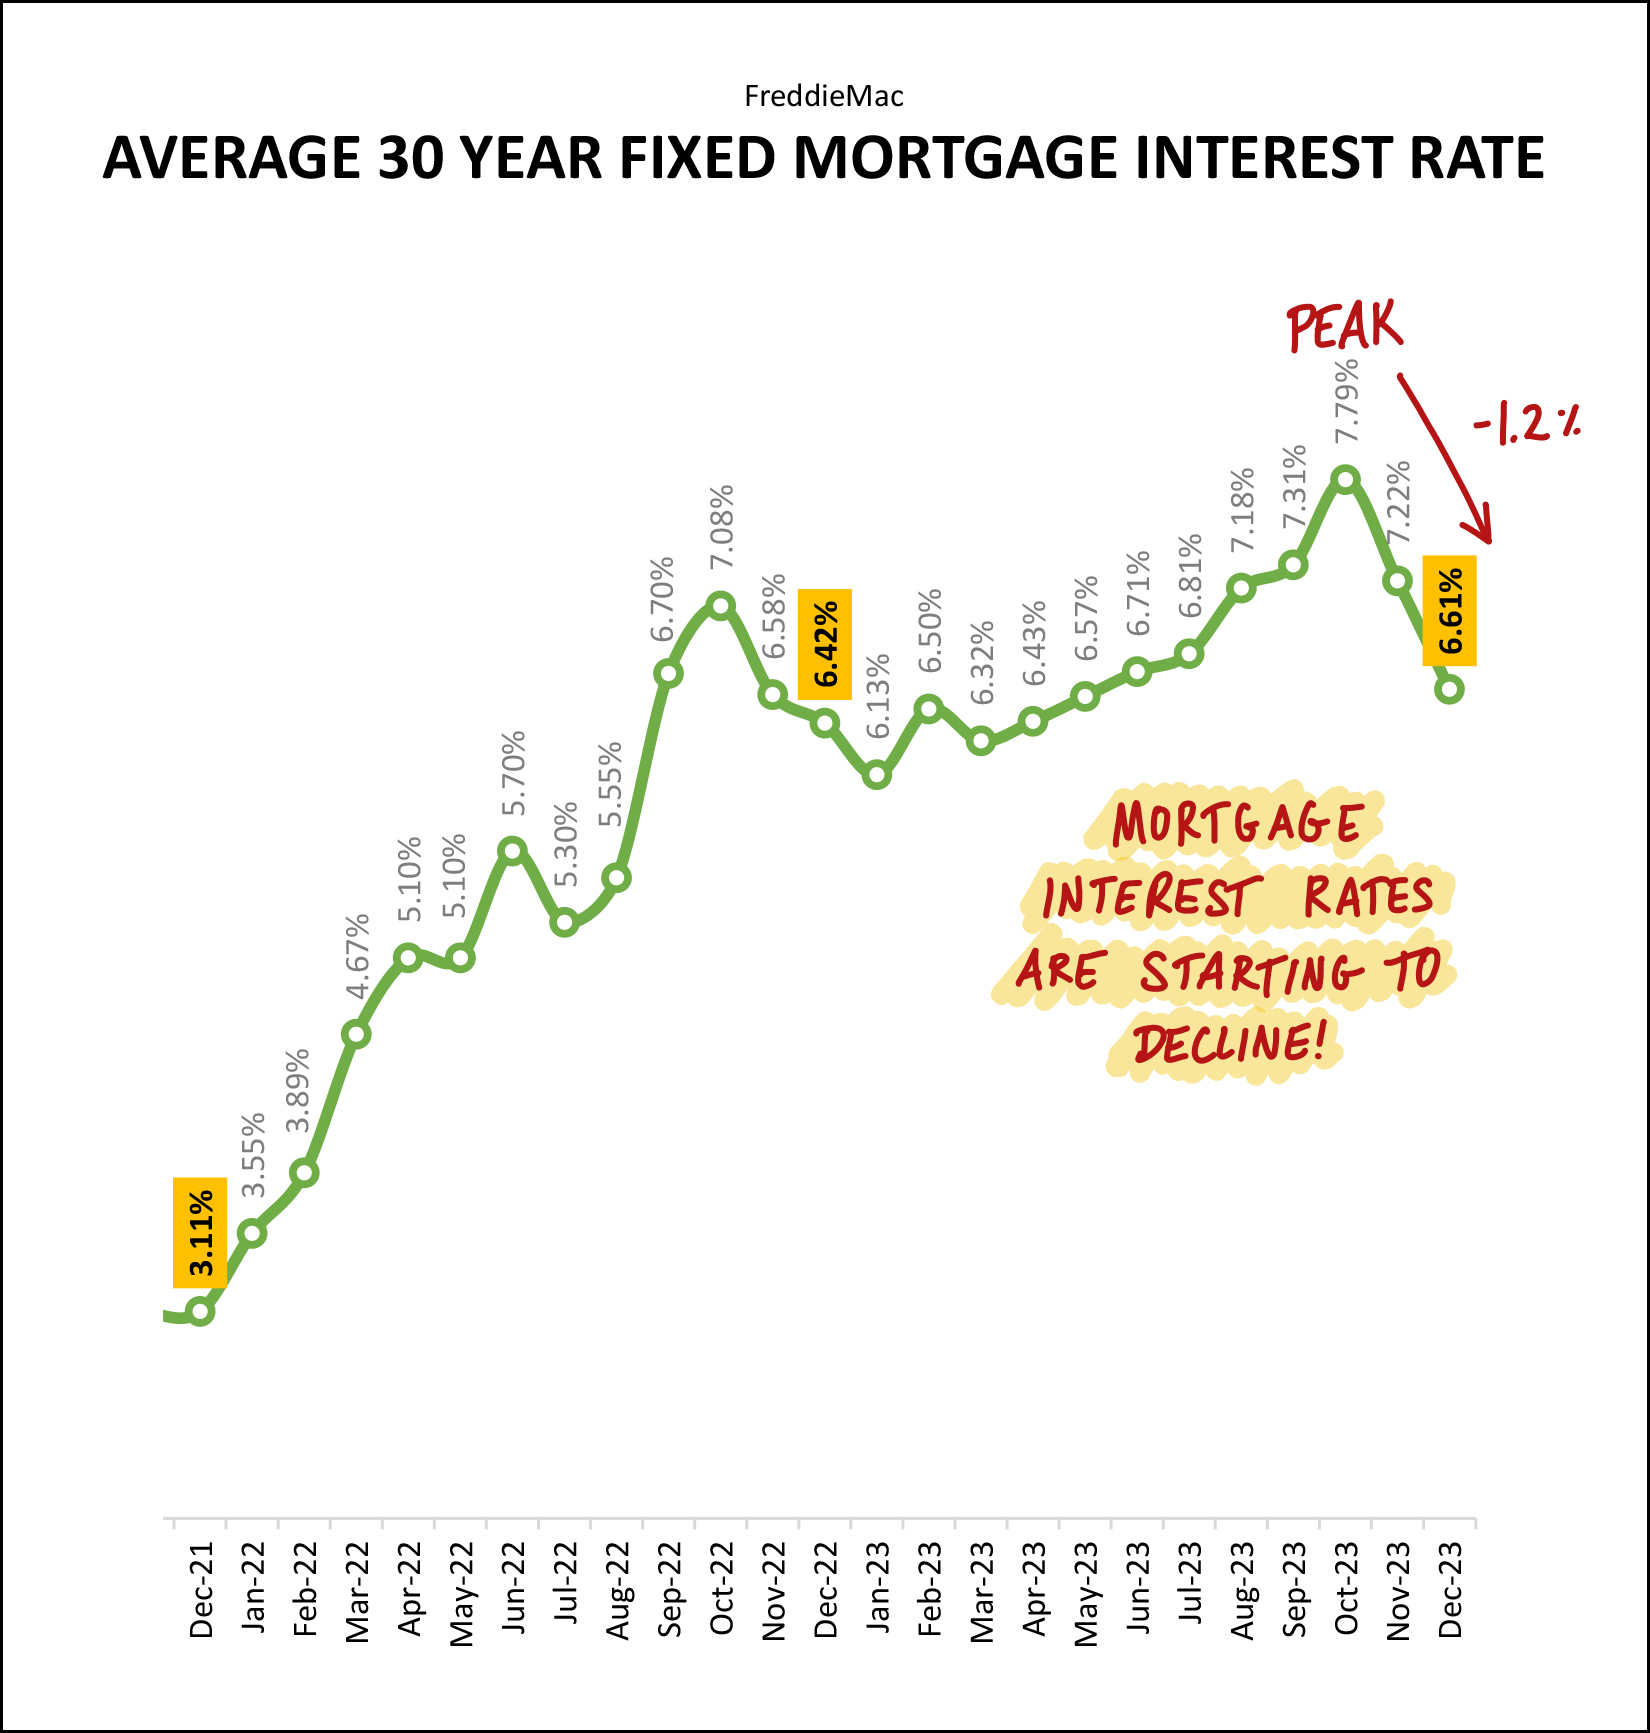 Indeed, if we're looking for at least one of the answers to why contract activity rose and inventory levels decline in November and December -- it's likely that we are looking at it above. Mortgage interest rates rose throughout most of 2023 from a low of 6.13% in January all the way up to a peak of 7.79% in October. But... they have been falling steadily since that time -- and in just two months they have dropped all the way back down to 6.61%. I suppose it's no surprise, then, that we saw contract activity start to tick back up in November and December -- it became (slightly, relatively, progressively) more affordable to do so in November and again in December! That, then, brings us to the end of the charts and graphs. So, let's take a look at what various people ought to be focusing on as they look ahead to the remainder of 2024. If your home is on the market now but not yet under contract... Lower mortgage interest rates seems to be bringing new buyers to the table for many properties. Let's hope that is the case for your home, but let's also examine our current pricing and determine whether an adjustment might be necessary to make your house attractive enough to buyers. If you plan to sell your home in 2024... Preparing your house well will likely be more important than ever this year so let's start developing and implementing those plans sooner rather than later. We'll also need to make sure to price your home appropriately to sell for the best possible price for you -- but also in a timeframe that works best for you. If you plan to buy a home in 2024... If it's been a few months since you talked to your lender, do so again soon. Mortgage interest rates have dropped quite a bit and your projected monthly payments will likely be lower than you had anticipated. Keep in mind that many new listings are likely to go under contract very quickly again in 2024, so be ready to go see new listings quickly and be prepared to make a speedy-ish decision about buying. If you own your home and don't plan to sell it anytime soon... Congrats to you on your (likely) ever increasing home equity. Enjoy the ride, and enjoy the likely low mortgage interest rate on your mortgage. :-) If you're me... Try really, really hard not to run for at least the next few weeks in order to follow the doc's orders and to avoid further injury to my ankle. And for ALL OF YOU reading this market report... If I can be of help to you related to real estate, or otherwise, don't hesitate to reach out. You can contact me most easily at 540-578-0102 (call/text) or by email here. I'll send you another update in about a month... now, who wants to guess how much snow we'll see between now and then? A foot? A few inches? None??? | |
Despite Fewer Home Sales, We Are Seeing Higher Prices, And Recently, More Contracts And Lower Inventory Levels |
|
 Happy Friday afternoon, Friends! I hope that your week has gone well and that you are looking forward to the next few weeks - presumably with some holiday celebrations, rest, relaxation and time with family and friends! Whether you are staying here or traveling afar, I hope it is a fulfilling and meaningful time for you and that you are able to spend some time with your loved ones! Before I dive into the housing data, I'd like to invite you to join me at a fun concert in January. The Steel Wheels are putting on an album release show with special guest Lindsay Lou on Saturday, January 20th at 7:00 PM in JMU's Wilson Hall. You can buy tickets online from JMU here, or... click here to enter to win the pair of free tickets I'm giving away! Regardless of whether you win the pair of free tickets, or buy your own tickets, I hope to see you in Wilson Hall in January to hear The Steel Wheels and Lindsay Lou! And now, on to the housing data and trends in our local market, starting with a few key indicators for our overall market... 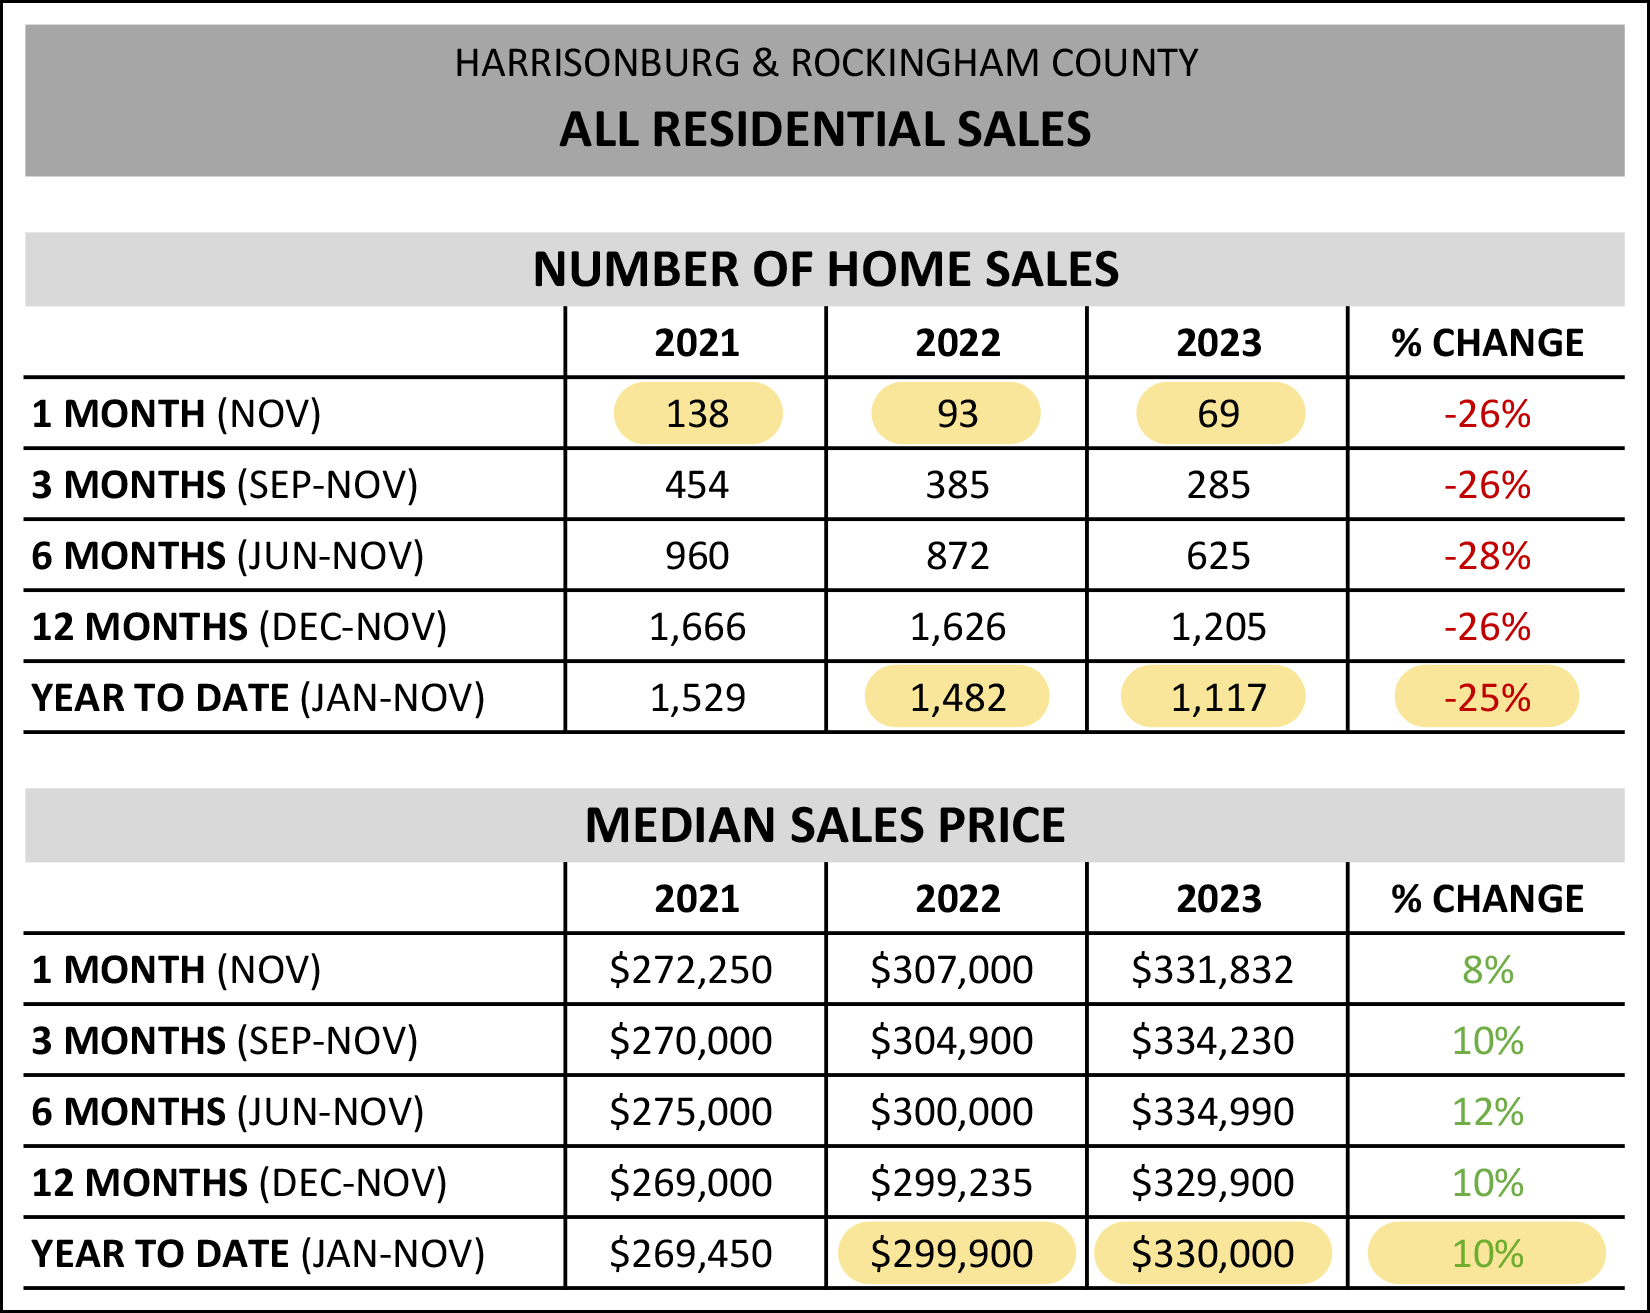 A few observations related to the data above... [1] Looking just at November sales data, we see a striking year over decline from 2021 through 2022 to 2023 when examining the number of homes that are selling each November. Two years ago there were 138 November home sales... last year only 93... and this year just 69 home sales in November. While it's only one month of sales data, that is a 50% decline over the past two years. It was a particularly slow November. :-) [2] When looking at the first eleven months of the year (the year is almost over!?) we see that there have been 25% fewer home sales this year (1,117 in 2023) as compared to last year (1,482 in 2022) in Harrisonburg and Rockingham County. It was markedly slower year this year than last. [3] Despite fewer home sales taking place this year, home prices keep on rising. The median sales price of all homes sold in the first eleven months of last year was $299,900... and this year it was 10% higher at $330,000. So, fewer home sales, but higher prices. Next up, one particular segment of our local market that has seen a particularly striking change... the City of Harrisonburg... 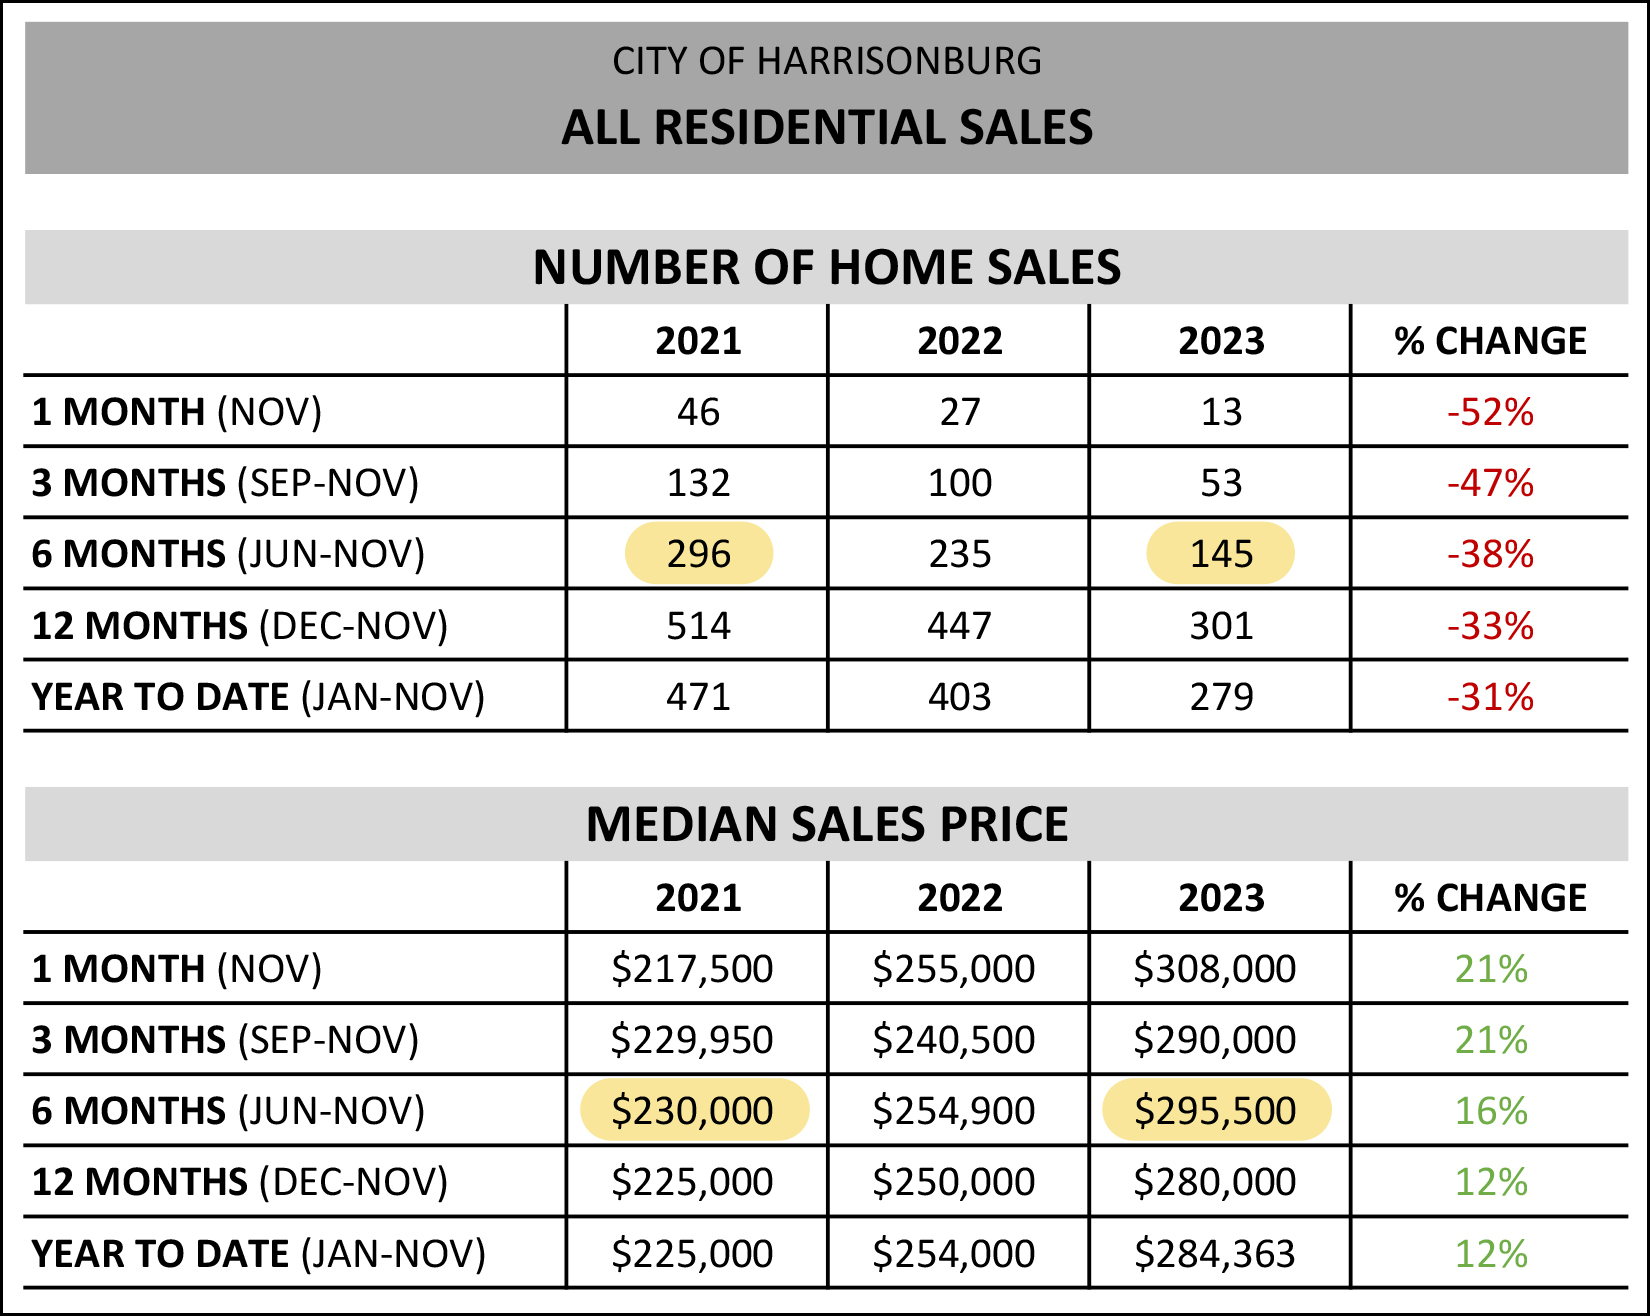 I suppose I should have highlighted one other bit of data on data table above -- the first row. Pretend it is highlighted too... [1] With only 13 home sales in the City of Harrisonburg this November, we have seen a 52% decline compared to last year and a 72% decline as compared to two Novembers ago. Again, this is just one month, but still. If you want to buy a home in the City of Harrisonburg, it has been a tough time to try to do so. Very few homes are selling in the City. [2] A few lines down in the data table you'll see I have highlighted the data for the past six months. Over the past six months of this year we have seen 145 home sales in the City... compared to 296 in the same six months two years ago. Again, a rather striking decline... of 52% over two years. As I alluded to above, this is mainly a supply issue... there aren't enough sellers willing to sell this year to allow the same number of City home sales to take place. [3] In that same two year period I have referenced above, the median sales price of a home sold in the City has increased from $230,000 to $295,500! That is a 28% increase in the price of homes selling in the City... over a span of just two years. Now, let's look at existing home sales only (excluding new home sales) to contextualize the 10% increase in home sales prices in the overall market that I referenced earlier... 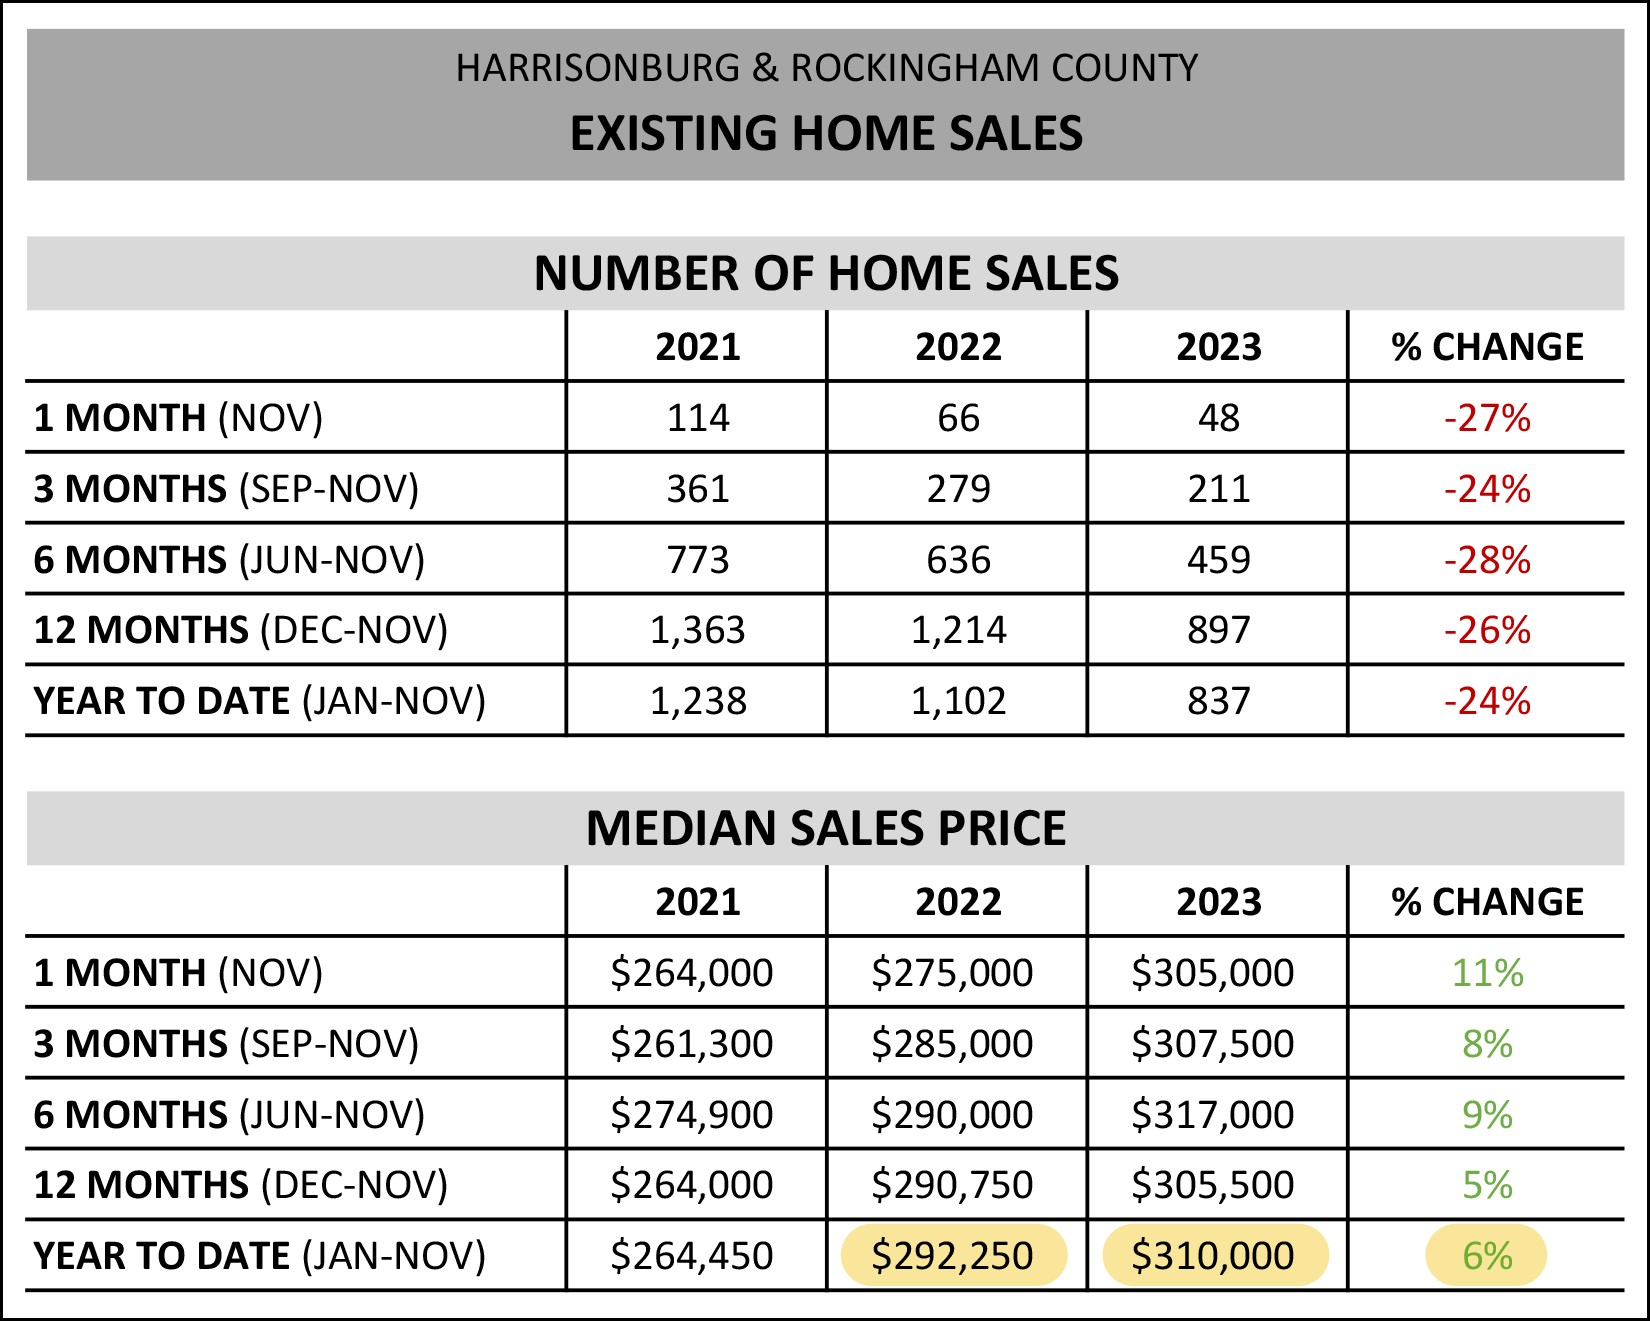 All the way at the bottom of the data table above you'll note that when we look at the median sales price of existing homes only, it has risen by only 6% over the past year, not 10%. What does this mean? [1] The value of existing homes has not necessarily risen 10% over the past year in Harrisonburg and Rockingham County as was suggested when looking at the entire market of existing and new home sales. Existing homes (resale homes) prices have only actually increased by 6% over the past year. [2] The increases in new home sales prices over the past year, and the number of new versus existing home sales, have combined to drive the overall median sales price of all homes (new and existing) up 10% over the past year. Let's simplify things... for all you homeowners out there... [1] Don't assume that your home has increased in value by 10% over the past year, because the existing home median sales price has only increased by 6% over the past year. [2] Don't assume that your home has increased in value by 6% over the past year. It might have. Or, that increase might be somewhat larger, or somewhat smaller. The change in the median sales price is a general indicator of changes in the overall market, not a specific indicator that each and every home in a market area has shared that same change in value. Now, let's reflect on a moment on what a slooooooowwww November it was as far as the number of homes selling in Harrisonburg and Rockingham County... 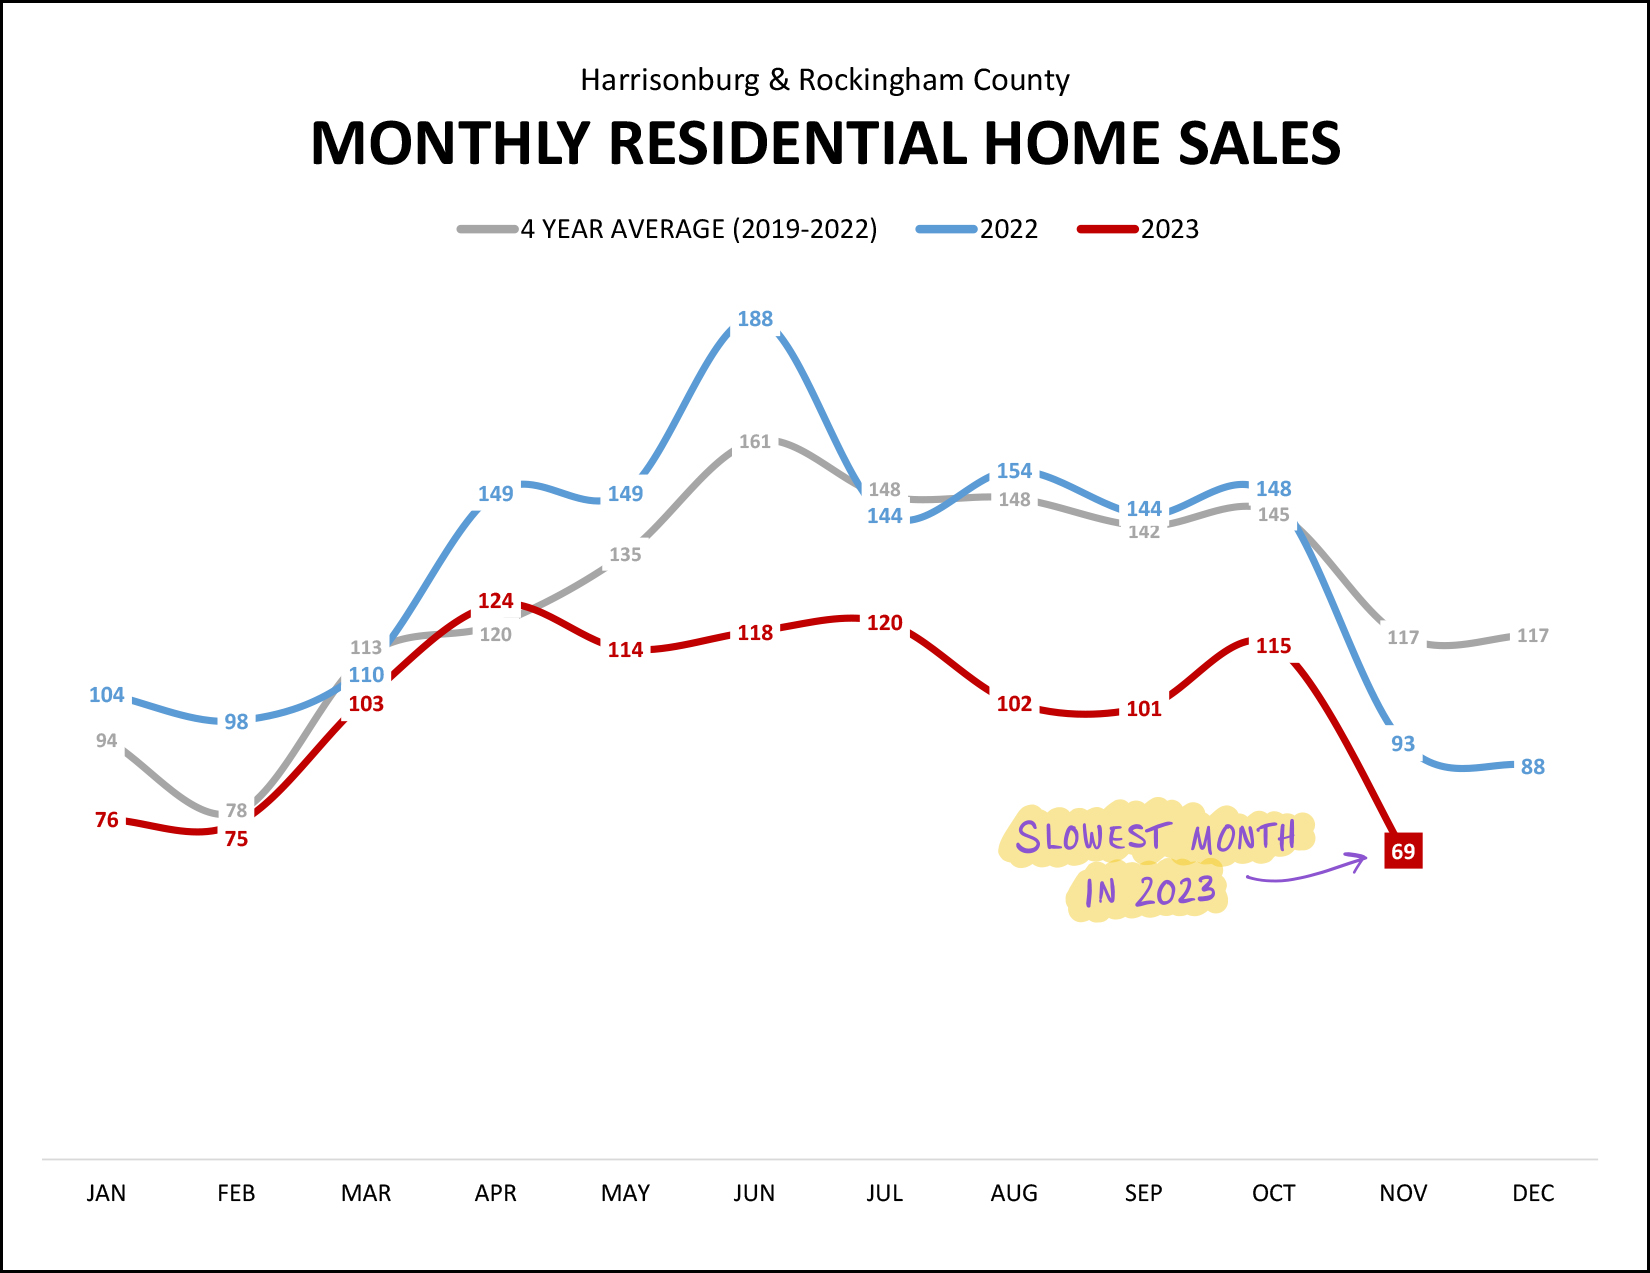 There were fewer home sales in Harrisonburg and Rockingham County in November 2023 than in any other month in 2023... and fewer than in any month in 2022... and fewer than in any month in 2021. But, keep on reading for some signs that perhaps we are seeing a slight reversal of this slow down. First, here's that downward ski slope (blue) of the number of homes are selling in a year's time in Harrisonburg and Rockingham County... 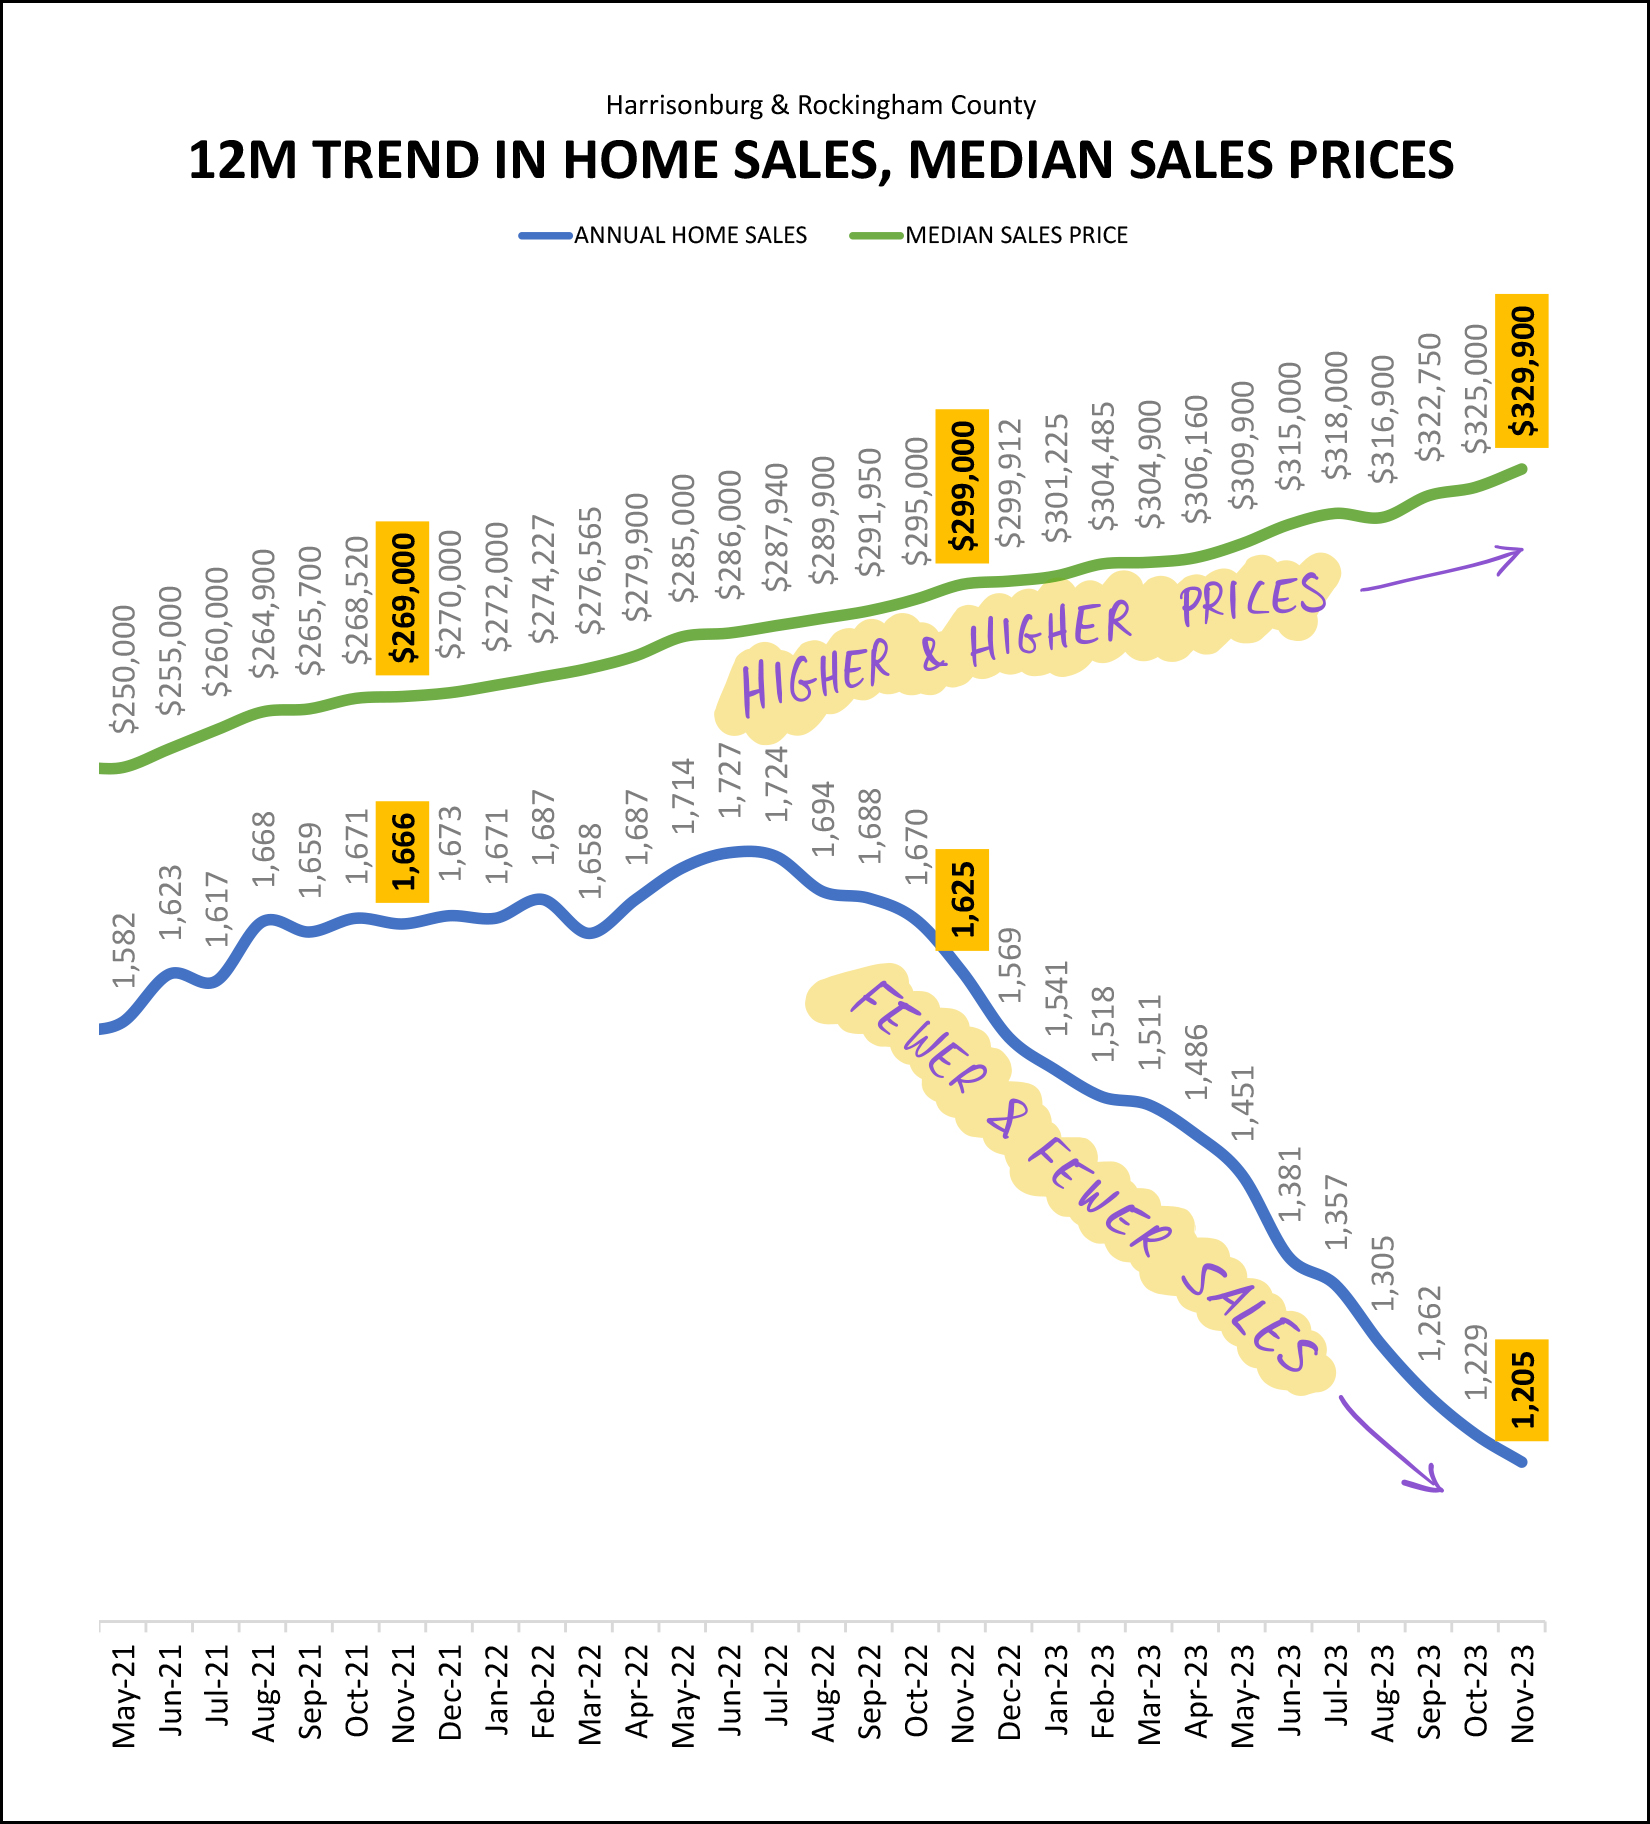 The annual pace of home sales in the City + County has now declined to 1,205 home sales... which is the slowest annual rate of home sales in over five years! But yet, as we have seen for quite some time now... fewer home sales is not causing home prices to also start declining... in fact, the further home sales have declined, the higher sales prices have increased! These two trends are an indicator that while there are certainly fewer buyers buying, it is likely at least partly a result of fewer sellers being willing to sell. If we were seeing a decline in buyer interest and we were seeing the same number of sellers wanting to sell, then we could more reasonably think home prices might start to decline -- but that's not where we are right now in the local housing market. Let's say you sold your house in 2019 and left town and decided to move back just four years later in 2023. Oof. Here's what you'd find... 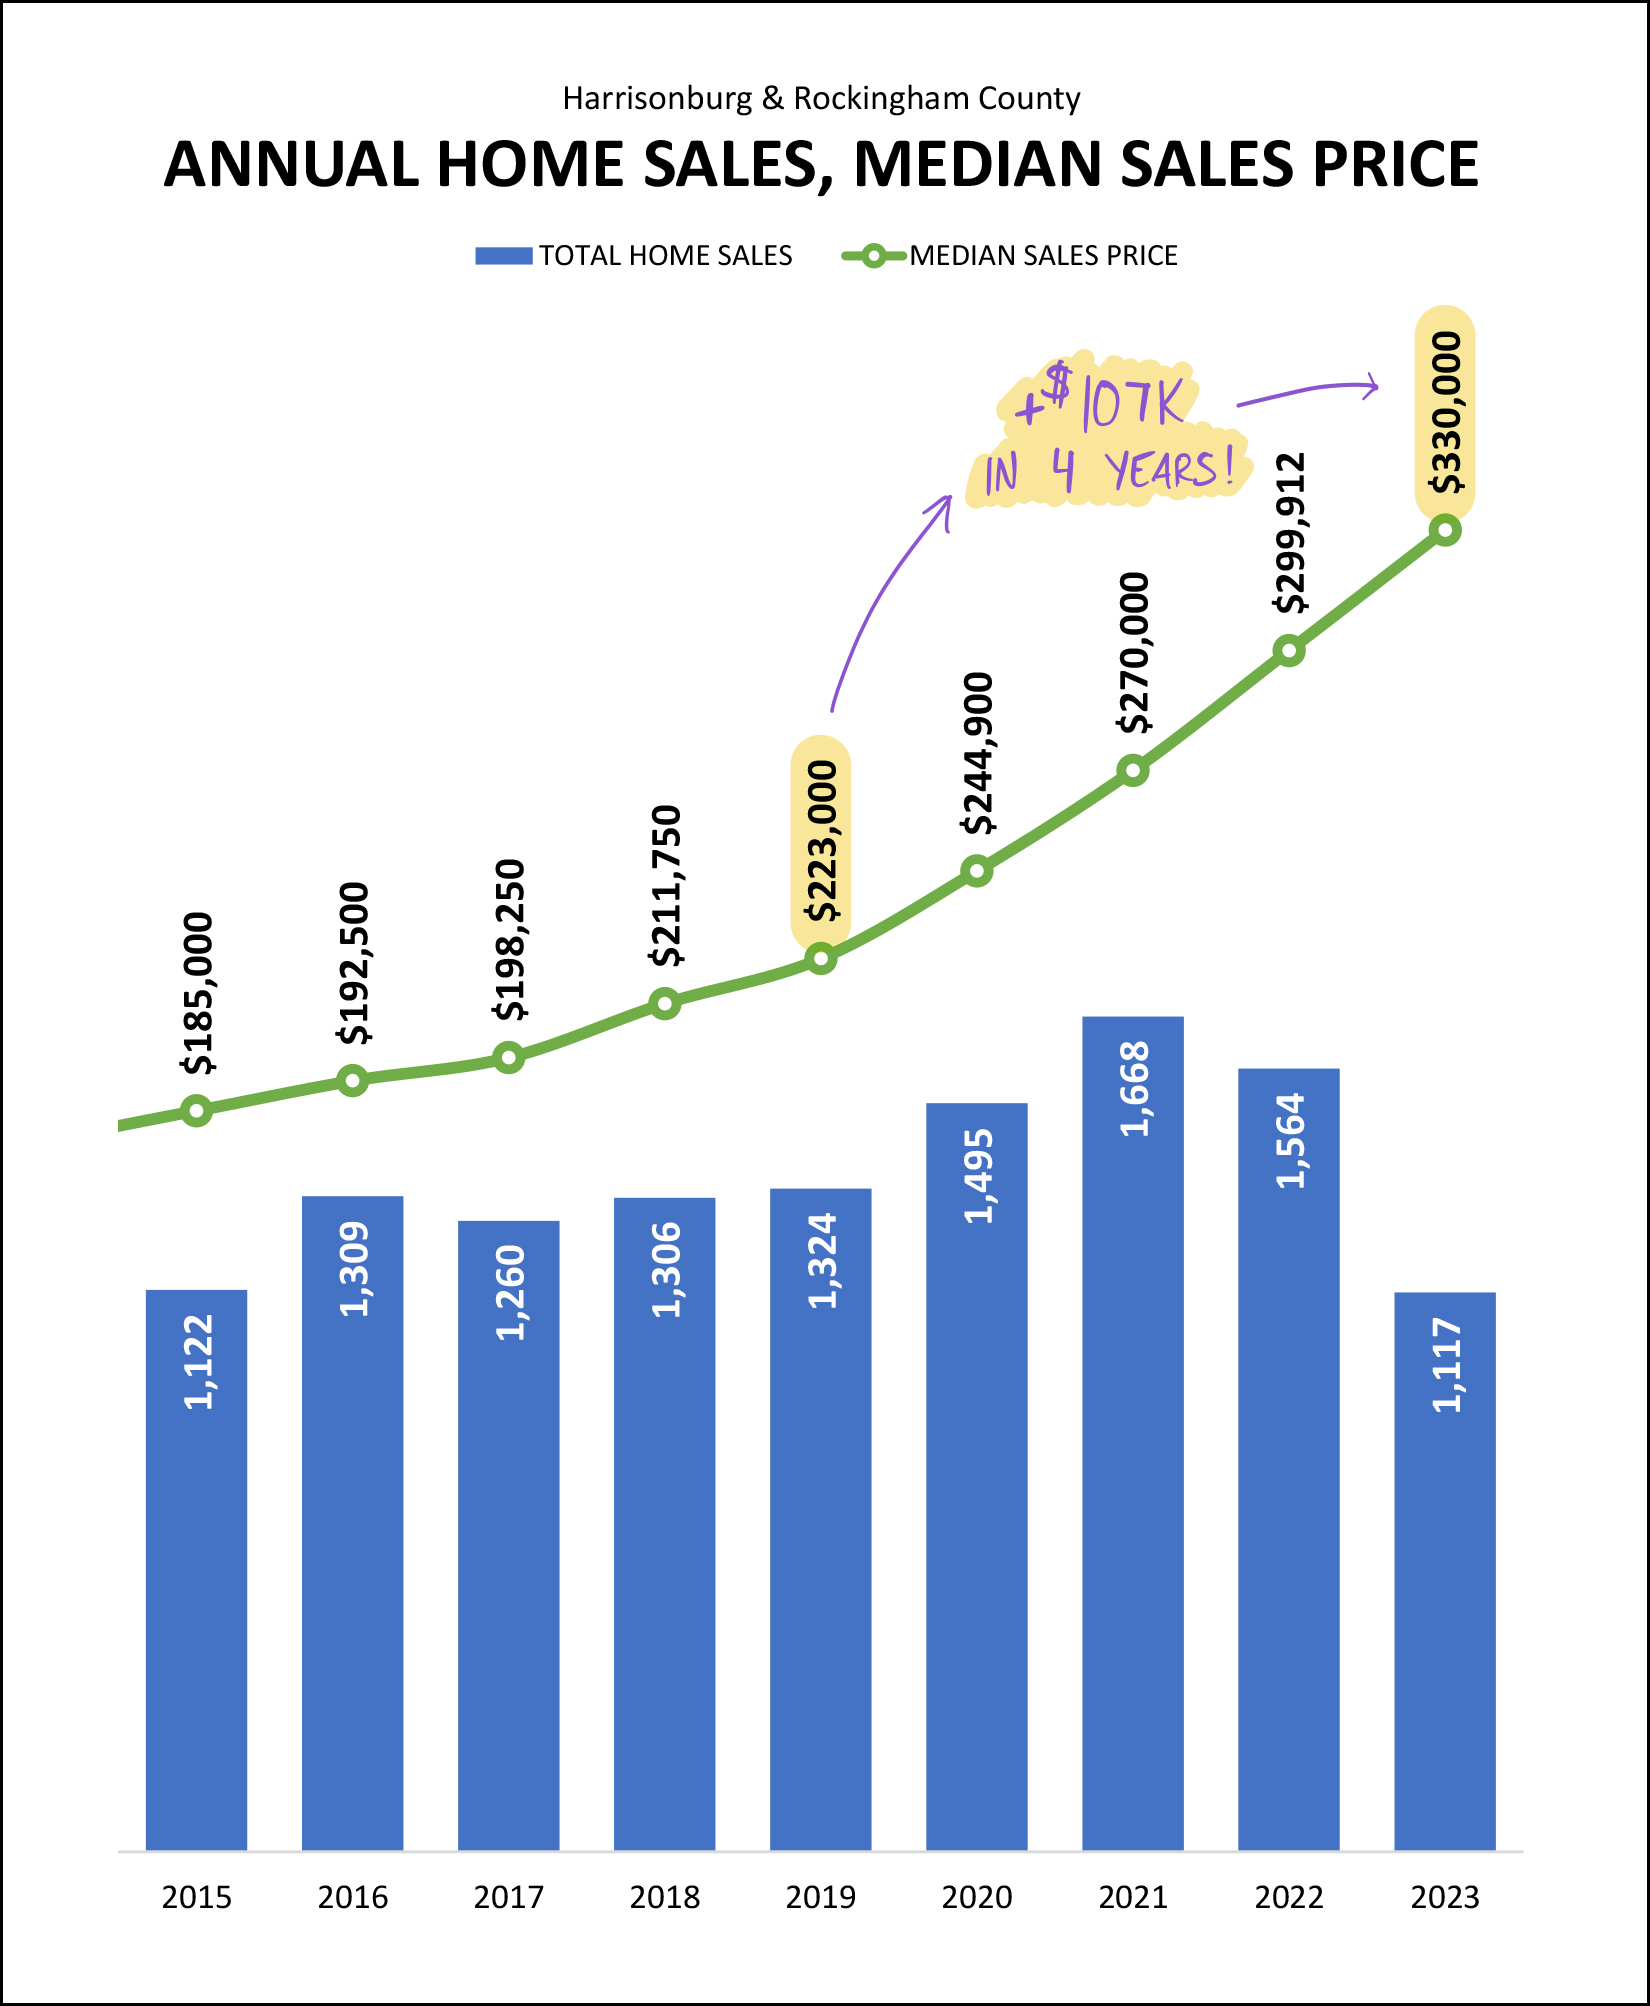 When you (the imaginary you) left town in 2019 the median sales price of homes in Harrisonburg and Rockingham County was only $223,000. Now... just four years later, that median sales price has shot upwards to $330,000. That is a $107K increase in just four years. This is yet another view into some tricky timing aspects of when folks bought or didn't buy a home in this area... [1] If you bought your home in 2020 or prior, and still own it, you're in great shape. You likely paid much less for your home than it is worth now and you likely have a very low mortgage interest rate. [2] If you bought your home in 2021 or 2022, you're likely still in great shape as to how much your home value has increased, and you might have a great mortgage interest rate or not quite as great. [3] If you didn't buy a home and are working on buying one now, you are buying at the highest prices we have seen lately (until 2024 prices) and at higher mortgage interest rates than we've seen in over a decade. If you are thinking about buying a home right now, does #3 above make you want to pause and think twice before buying? If you don't buy in 2023 (yes, I know there are only 16 days left) you'll likely be paying an ever higher price in 2024 or 2025. This is not to say that everyone should buy a home right away, but many buyers who have been waiting to buy for the past few years because prices were increasing (and they hoped they would decline) likely wish they had gone ahead and bought last year, earlier this year, etc. One of the other metrics I follow is how many new versus existing homes are selling, and we have seen a bit of a shift in this break down in 2023... 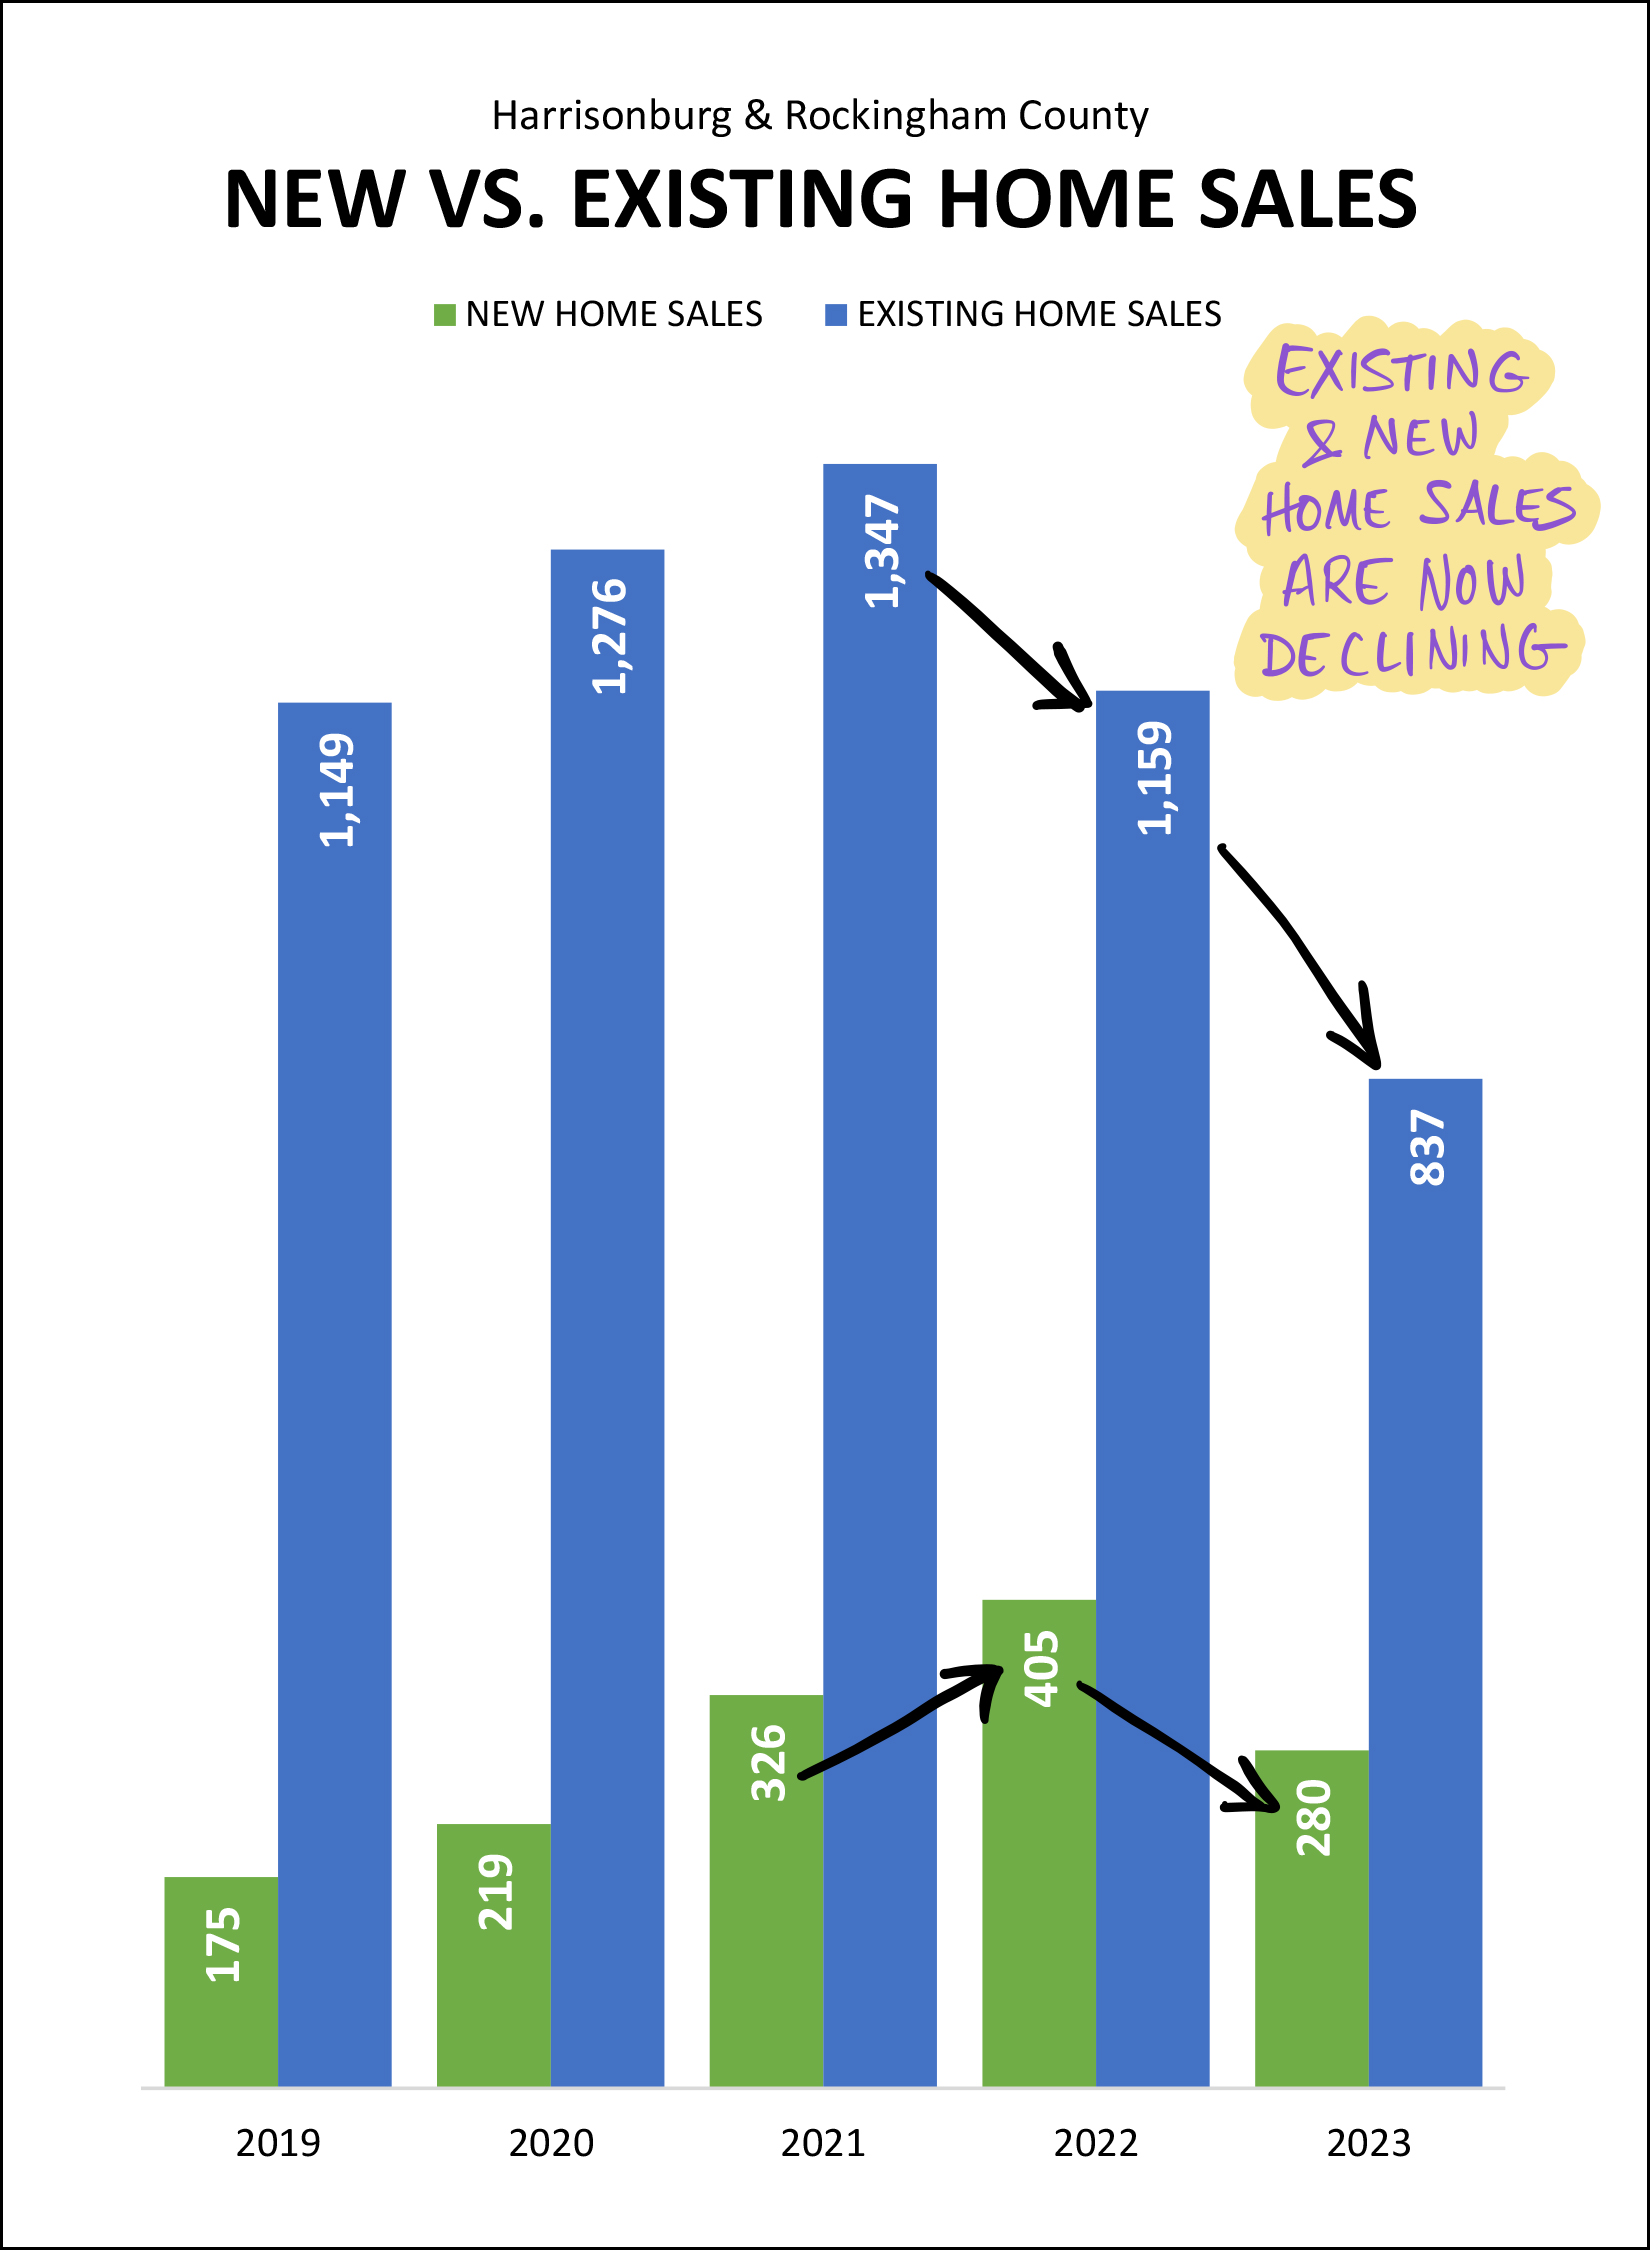 Last year, in 2022, we saw a decline in existing home sales compared to 2021... but new home sales kept on rising. Not so in 2023. When comparing this year (2023) to last year (2022) we see that existing home sales have declined... and new home sales have declined as well. We have also seen *the highest* mortgage interest rates in many (many!) years in 2023, which is likely a major contributor to this slow down in both existing and new home sales. But... what follows are a few slight changes in direction in our local market as of the past month... 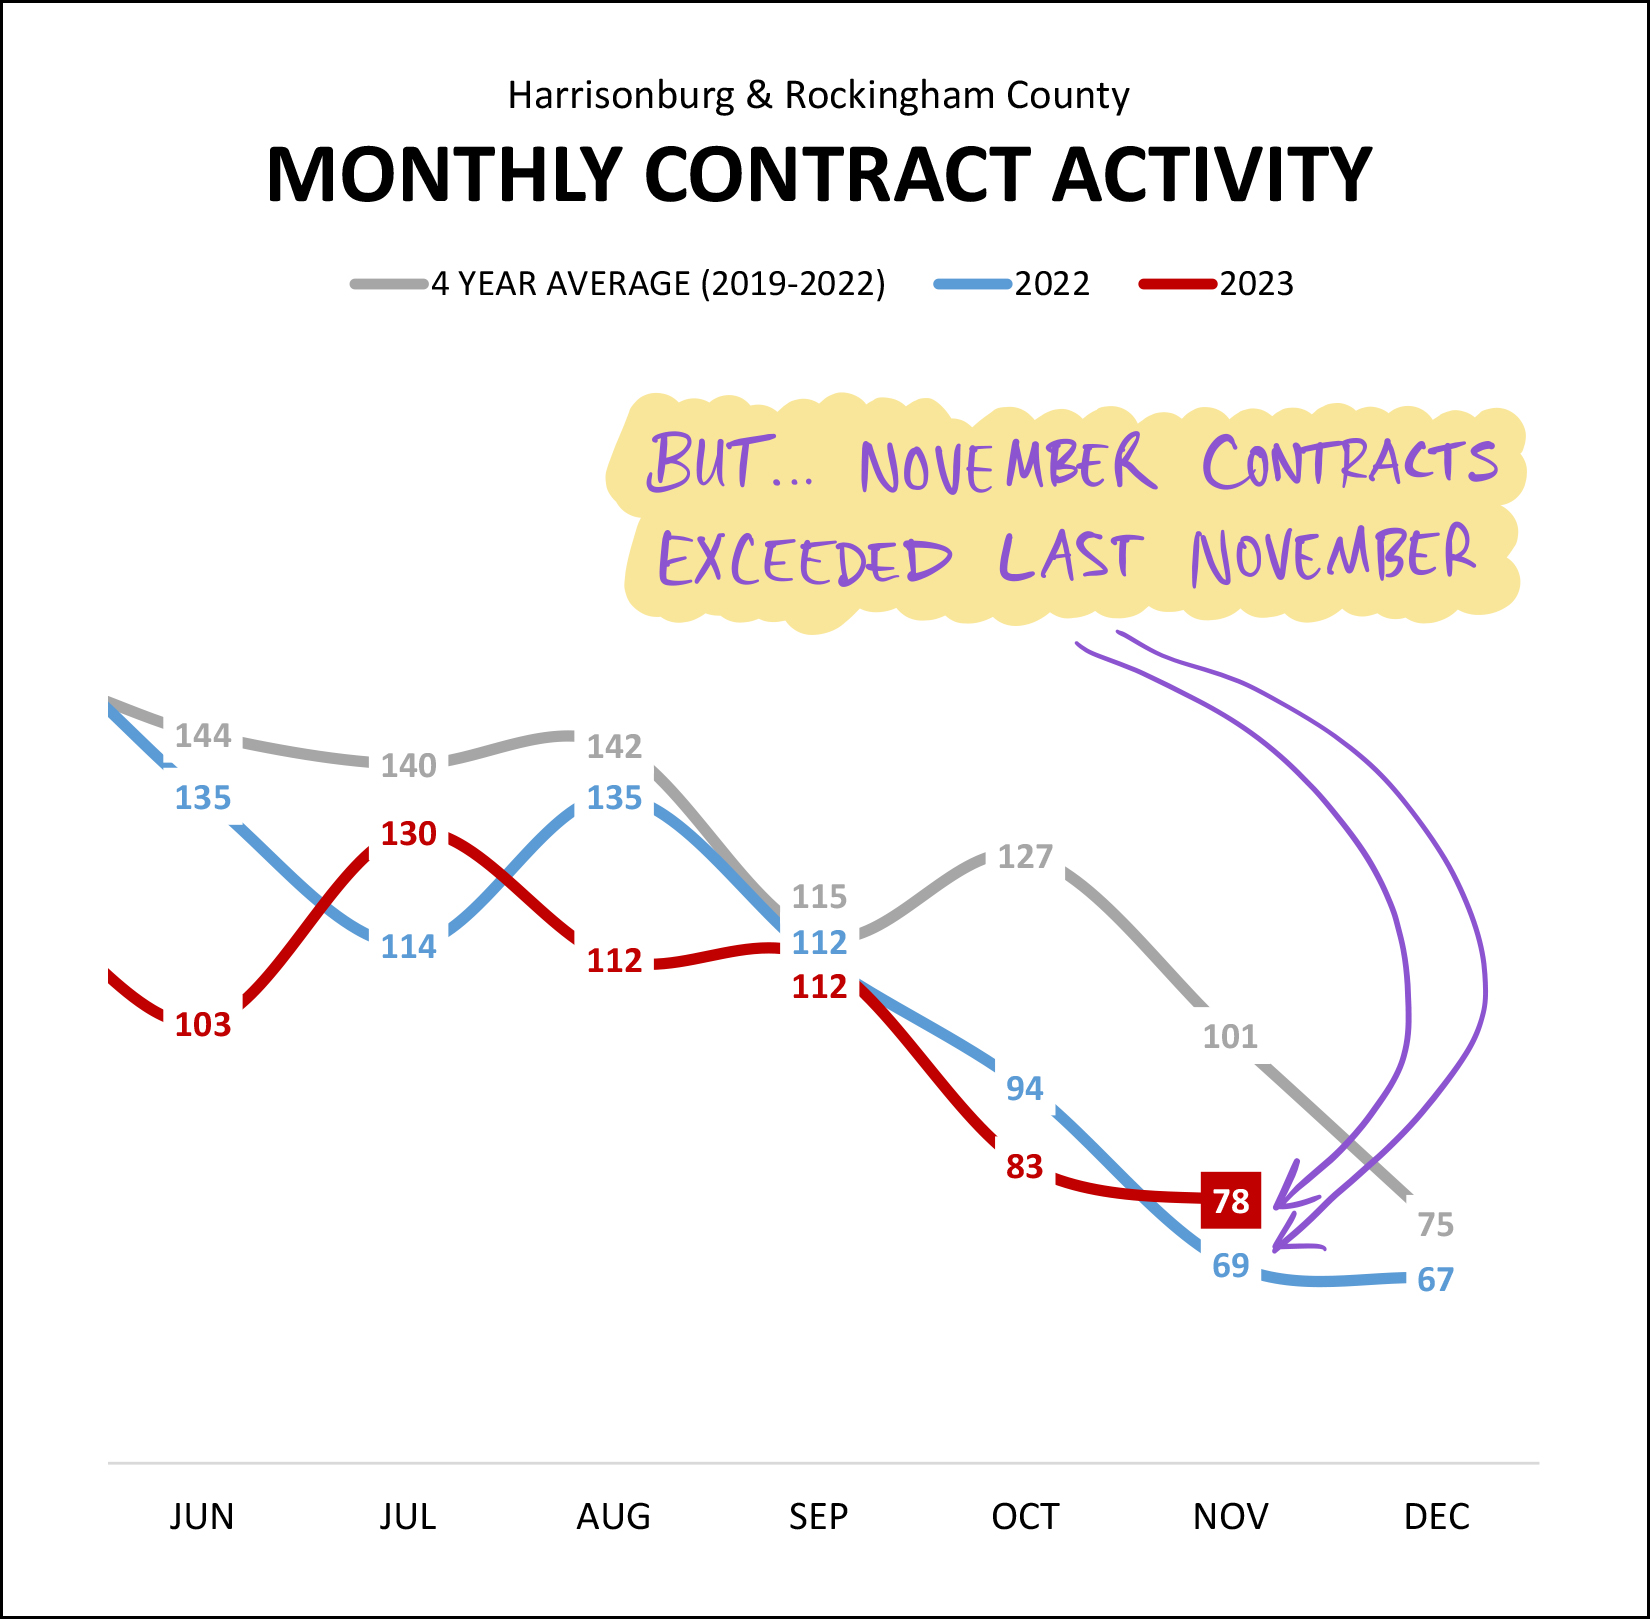 Monthly contract activity in 2023 (red line above) has been below 2022 (blue line) more often than not over the past six months, but in November... contract activity rose above where it was last November. Hmmm... why could that be... I wonder if mortgage interest rates started to decline from their 20+ year peak? And how about the number of homes that are under contract in total... 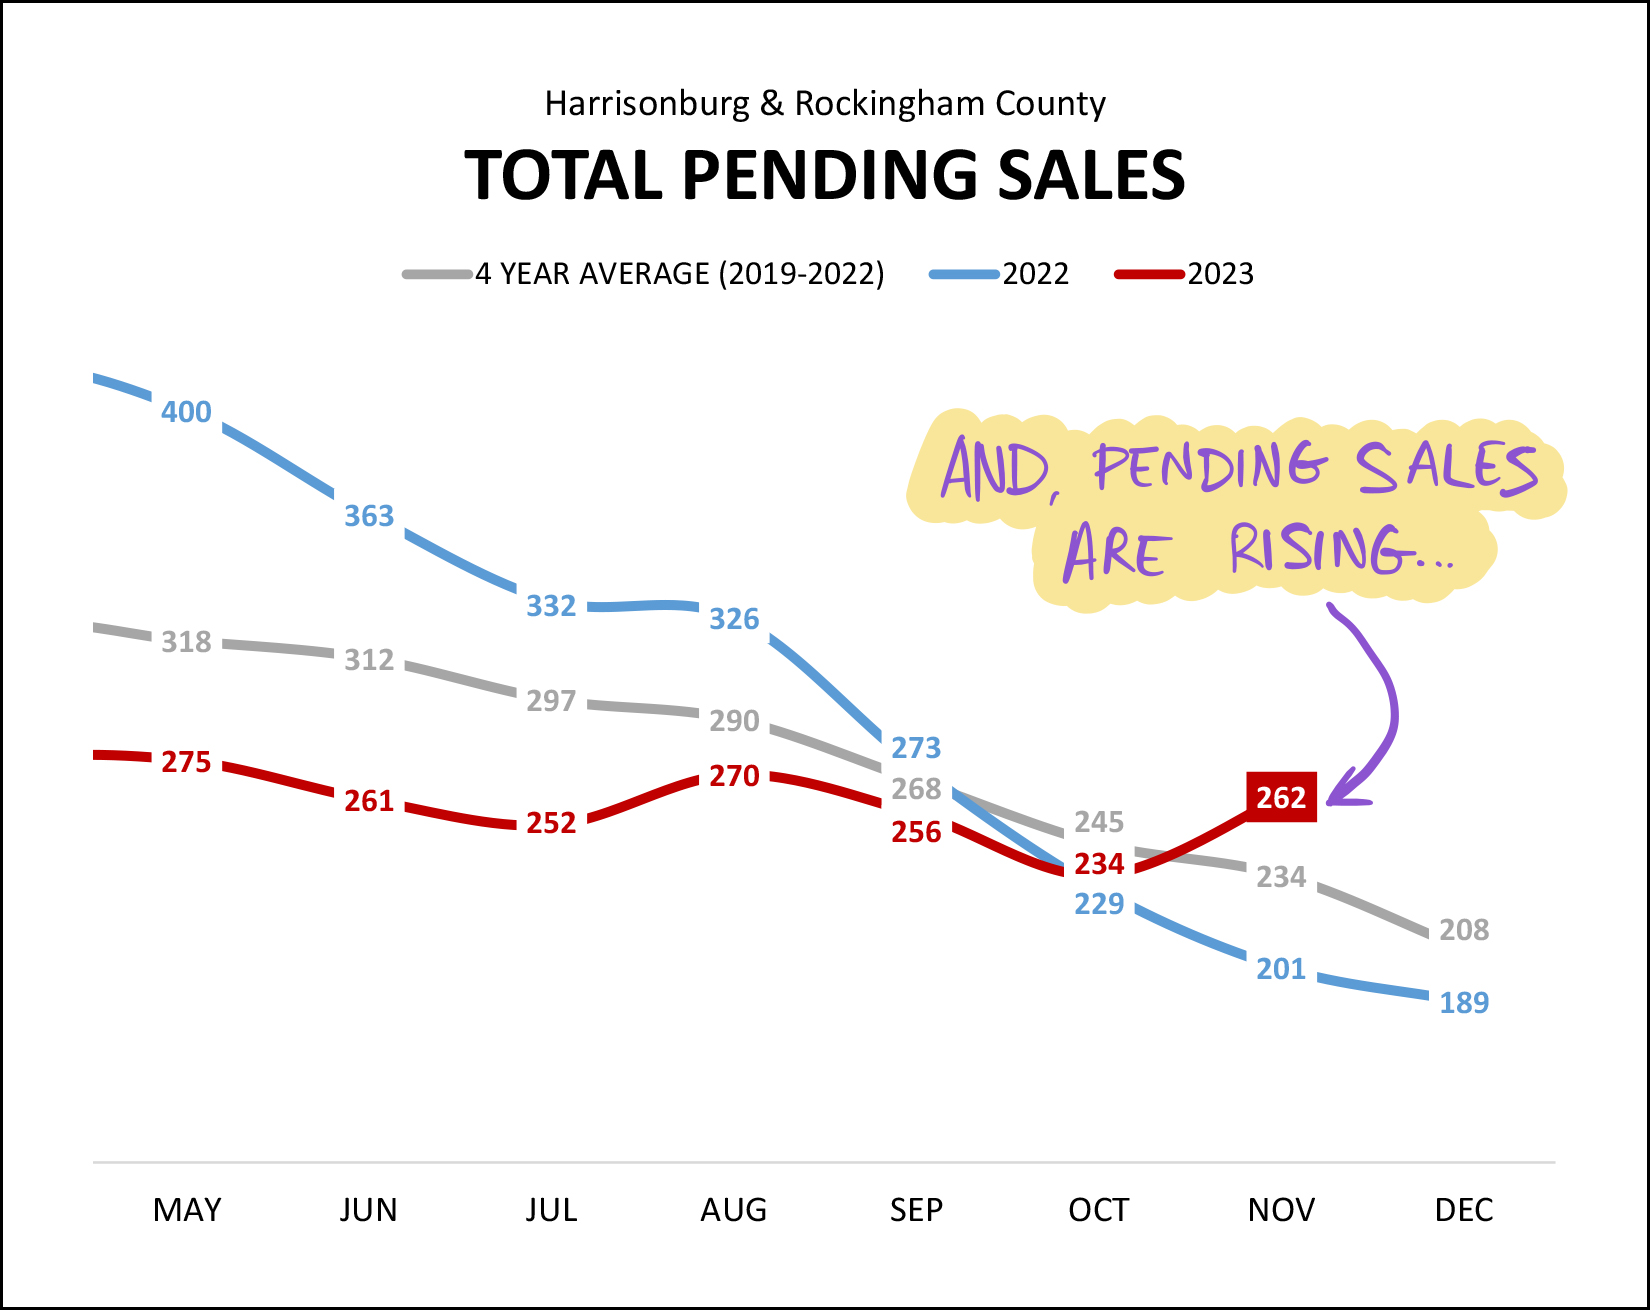 As shown above, we saw a big jump in the number of pending (under contract) homes through the month of November. There are 262 homes under contract right now, compared to only 201 a year ago. This is a significant improvement from last month when we were even with the prior year, and an even more significant improvement from the prior six (plus) months when pending home sales were lagging significantly behind last year. Hmmm... why could that be... I wonder if mortgage interest rates started to decline from their 20+ year peak? Next up (before we get to mortgage interest rates) let's look at inventory levels... 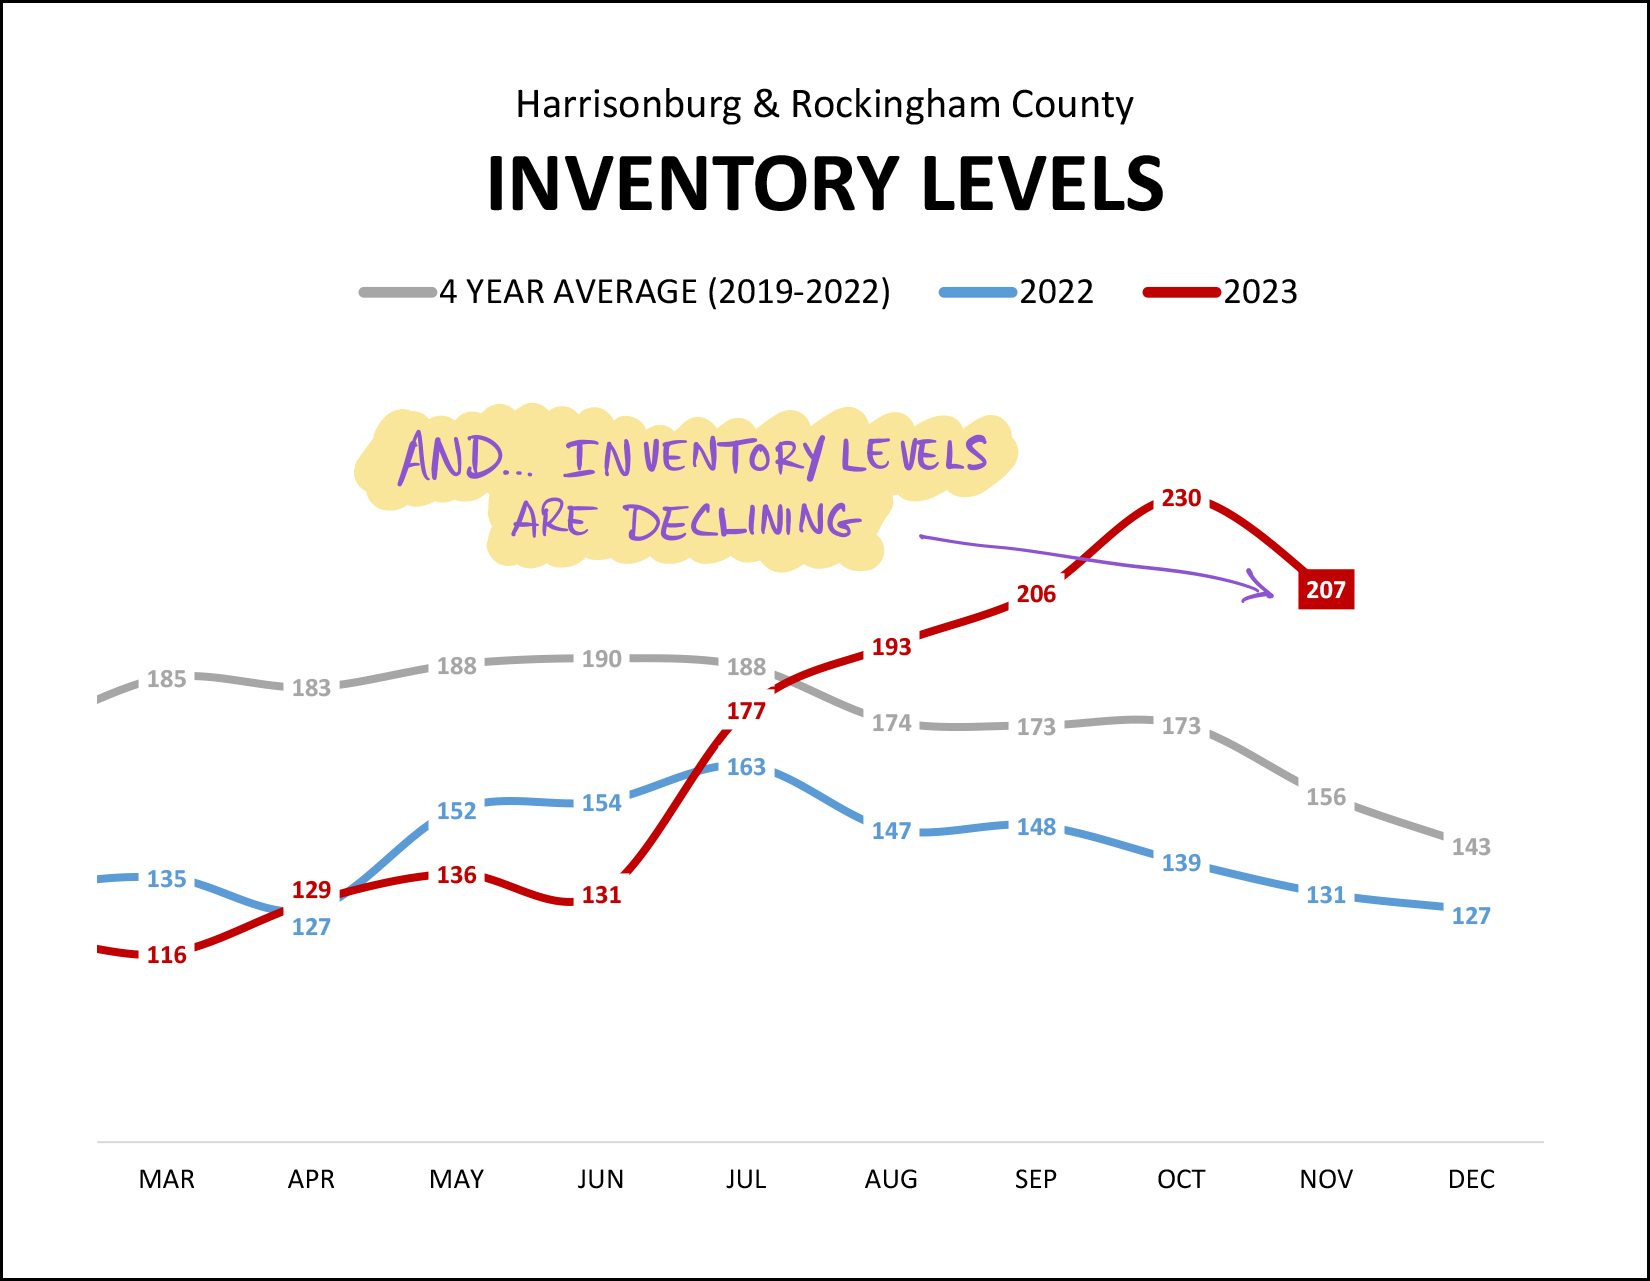 After four months of big increases in inventory levels in Harrisonburg and Rockingham County -- from 131 homes for sale up to 230 homes for sale -- we have now seen inventory levels start to decline again. Perhaps this is a result of more contract activity (causing inventory levels to drop as homes go under contract) or perhaps it is fewer sellers putting their home on the market during the holidays -- but regardless, November showed at least a temporary reversal in the trend of increasing inventory levels. Now, then, how about those mortgage interest rates... 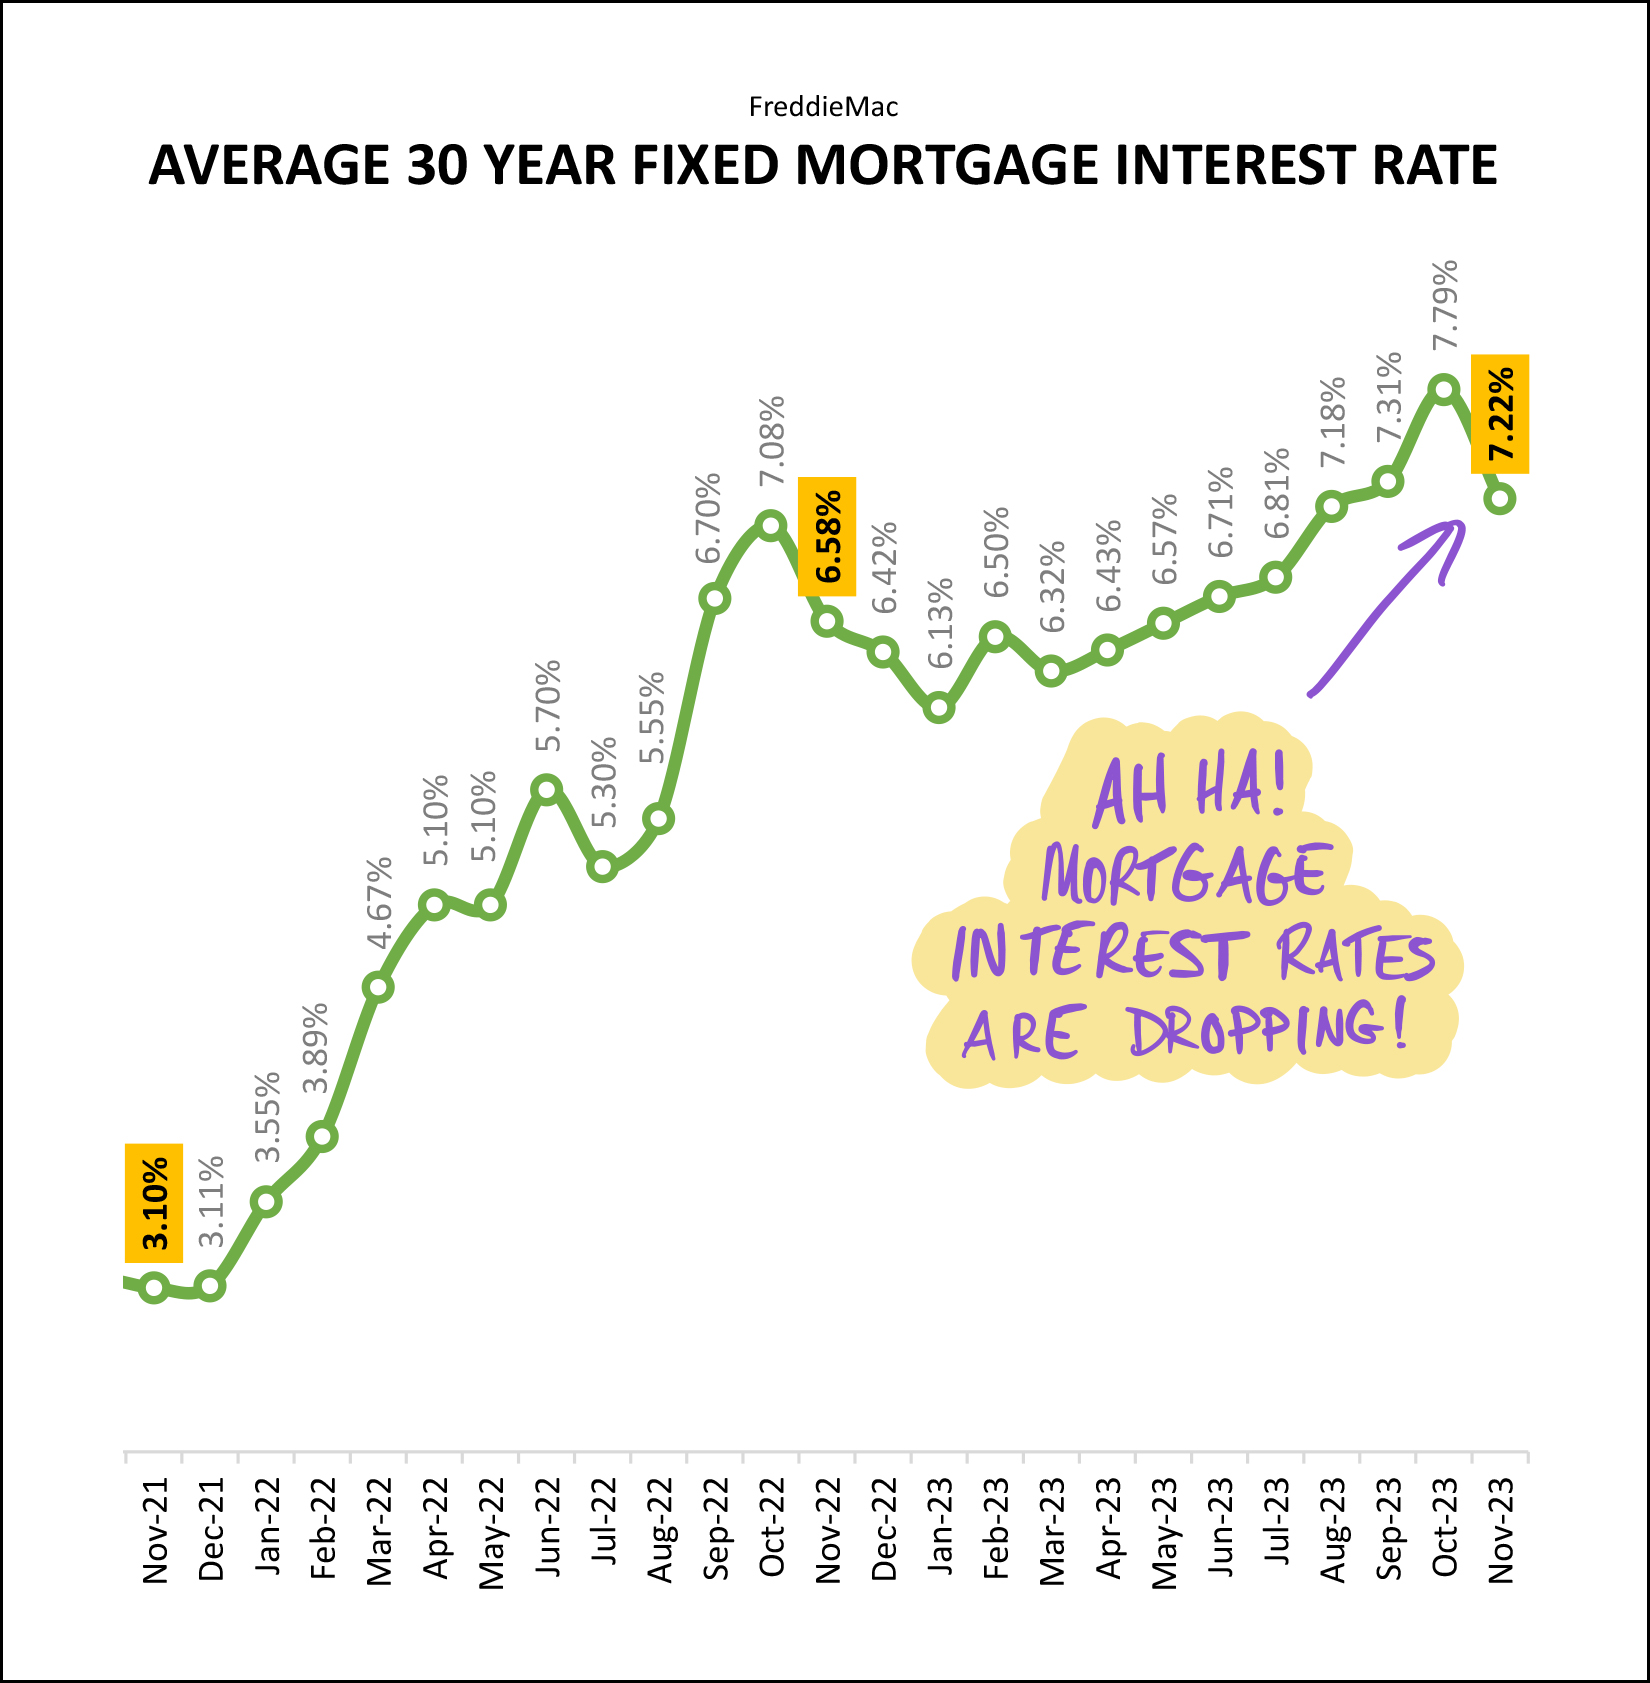 Indeed, mortgage interest rates are dropping. At this point it seems rates peaked at 7.79% at the end of October. Since that time, as shown, they dropped to 7.22%. Since the end of November, not shown, they have dropped even further... to 6.95%. Certainly, the three years or so when rates stayed below 4% were *not* normal times... and rates below 4% were *not* normal -- but it's been tough for many would be home buyers to afford a home (or to rationalize paying the requisite mortgage payment) over the past year with mortgage interest rates above 6%, and for quite a few months over 7%. The pace of sales slowed the most in Harrisonburg and Rockingham County over the past few months with mortgage interest rates over 7%. The news that they have now broken back down through that barrier to six-point-something is welcome news for home buyers as we head towards 2024. I'll wrap things up there for now, though if you want even more charts and graphs you can review them all here. At this point in our local housing market, we're mostly looking ahead towards 2024, so here are a few thoughts for a variety of positions you might find yourself in... If your home is on the market now but not under contract... You may very well find renewed interest from buyers after the first of the year, especially with slightly lower mortgage interest rates -- but you should make sure your home is priced appropriately. If a price reduction is in order, it might make sense to wait until just after January 1 to make that change since there will be less buyer activity than normal over the next few weeks. If you plan to sell your home in 2024... Let's chat sooner rather than later about pricing, preparation and timing. It's not enough any longer to simply whisper "I'm selling" out your front door to bring on the throngs of eager buyers with 3% mortgage interest rates. We'll want to make sure to price your home appropriately, prepare it well to show best to buyers and market it thoroughly from day one but knowing that the marketing may need to continue on for a few weeks or more. If you plan to buy a home in 2024... It seems very likely that you'll be financing your purchase with a lower mortgage interest rate than would have been available to you over the past few months, which is good news. That said, with home prices continuing to climb, your projected monthly payment might still be higher than you prefer. It's important to talk to a lender early in the process to understand how much you could spend and to consider how much you want to spend on your next home. If you own a home and don't plan to sell it anytime soon... Enjoy your likely increasing home value and your likely low mortgage interest rate. It's been a great few years to own a home... a much better than average, much better than normal, few years! And for any and all of you... if I can be of help to you related to real estate, or otherwise, don't hesitate to reach out. You can contact me most easily at 540-578-0102 (call/text) or by email here. I hope you and your family have a wonderful holiday season and I look forward to connecting with you in 2024! | |
Home Prices Keep Climbing Despite Fewer Home Sales And Rising Inventory Levels |
|
 Happy Monday, Friends! Before we get to the real estate news...can we just start by saying... Go Dukes!?! JMU has been on a roll over the past few weeks and months in multiple sports. The football team remains unbeaten at 10-0 and will host ESPN's College Game Day this Saturday. The men's basketball team defeated #4, Michigan State last week followed by two more wins. The men's soccer team beat #1 UCF two weeks ago. The volleyball team is entering the Sun Belt Conference tournament as the second seed of the east division. And on, and on. This has been a fun year for rooting for the Dukes. If you live locally in the Harrisonburg area I hope you have been able to get out to watch some of these exciting games at JMU... and if you're an out of the area alum, come on back to get in on the action! And now... on to the latest data and trends in our local housing market! First, an overview of a few key indicators... 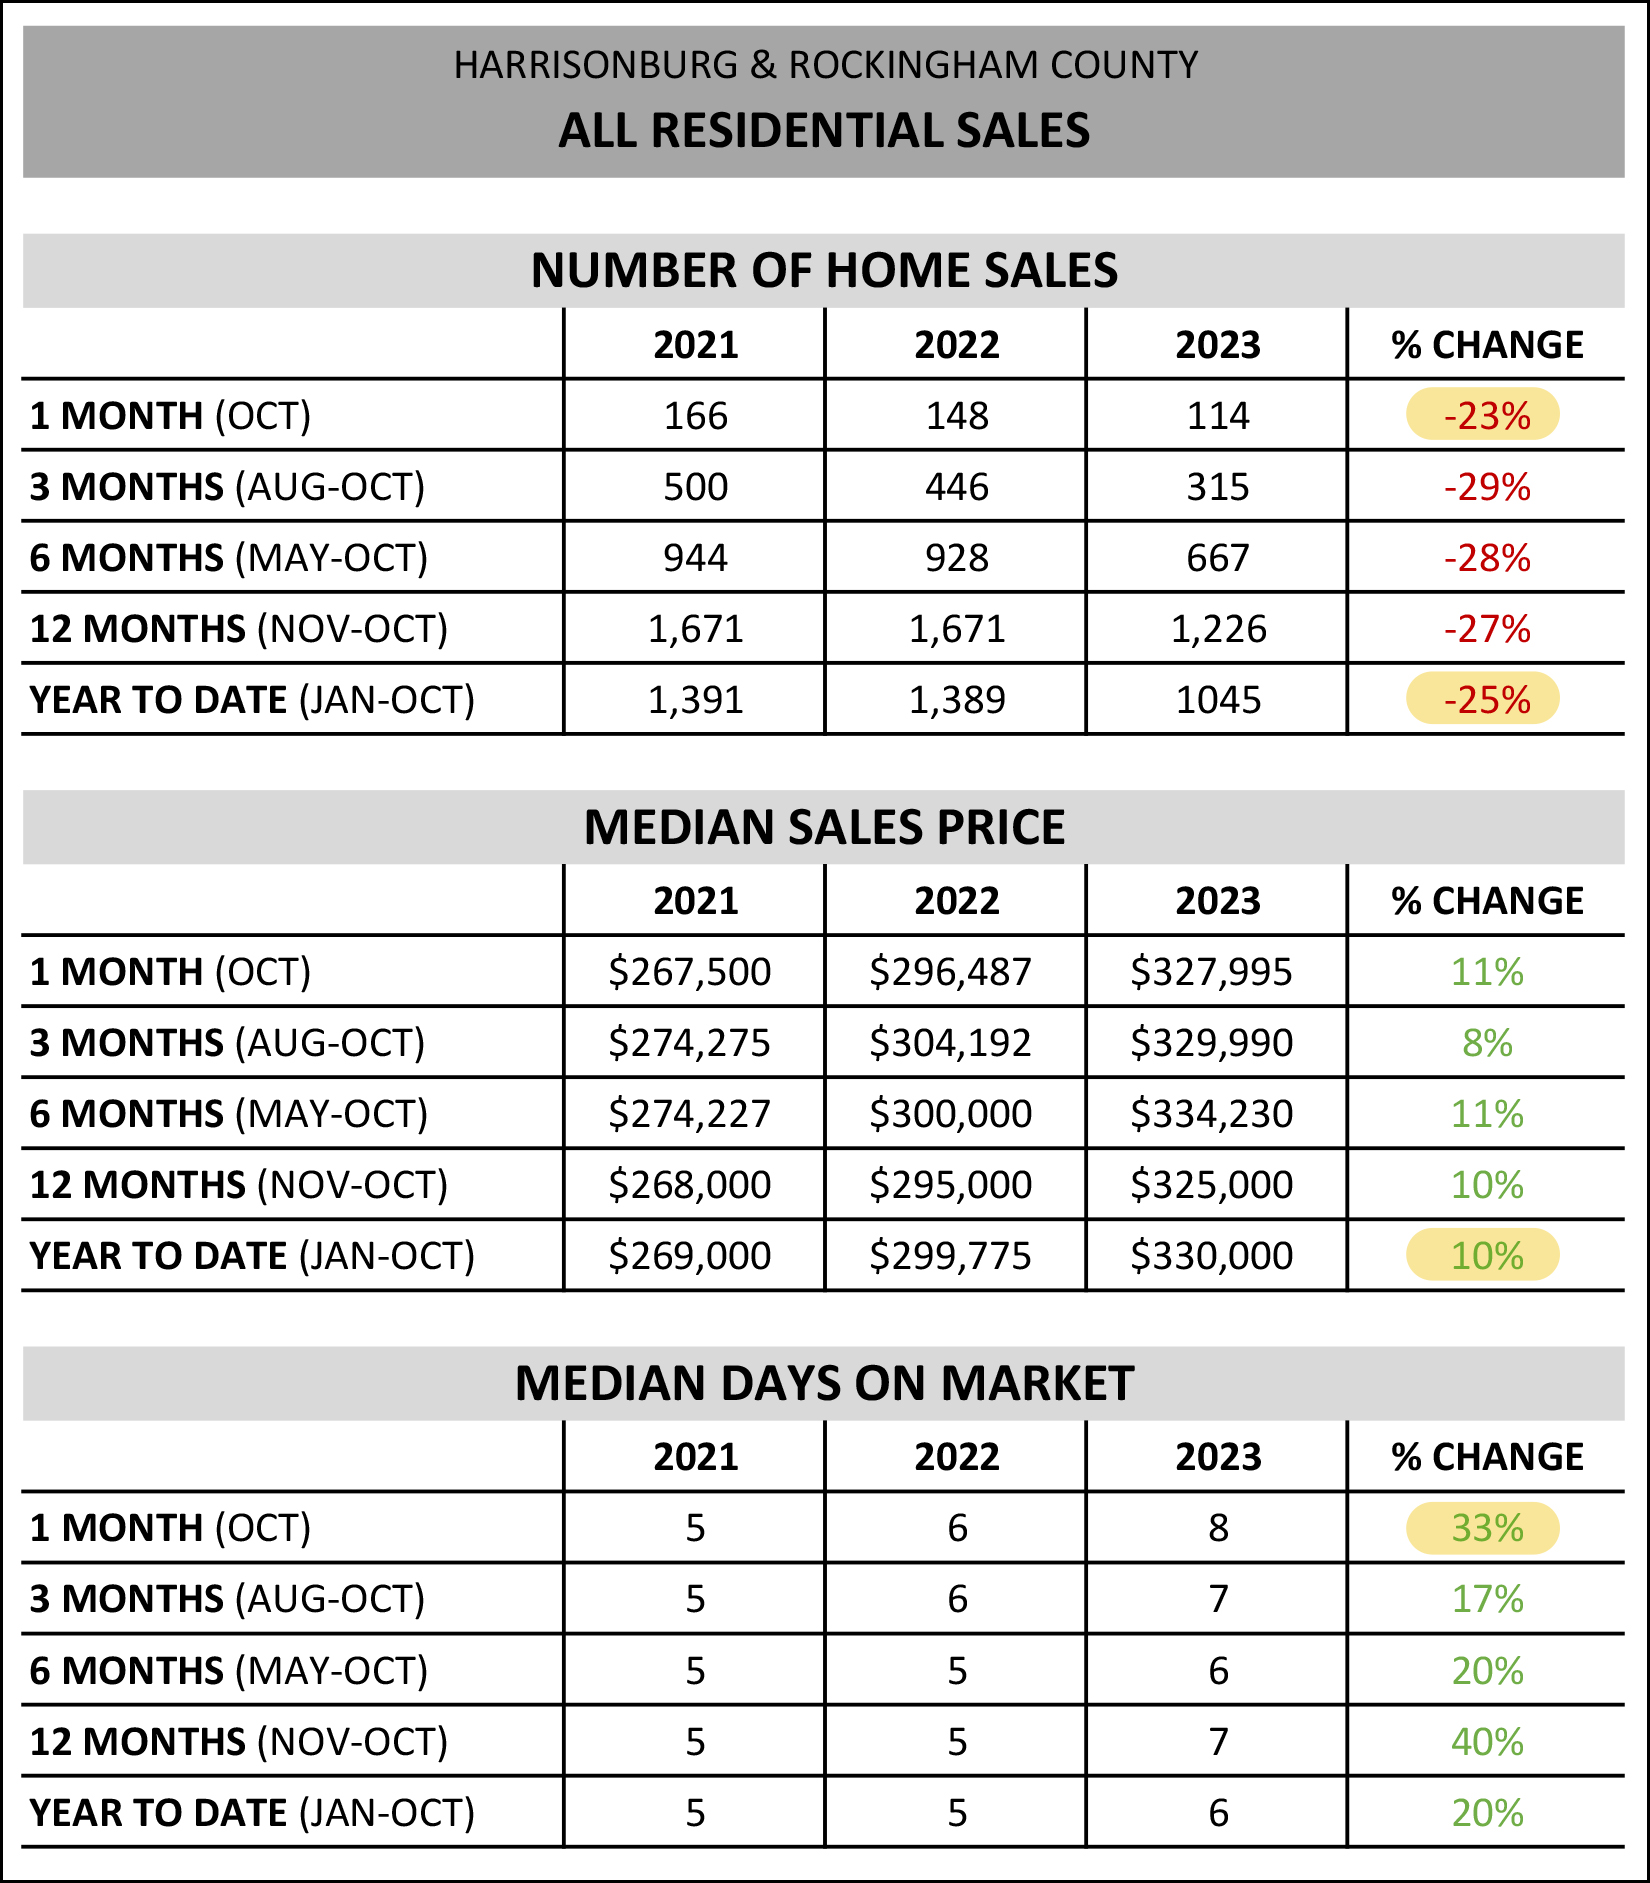 The highlighted trends above aren't all that new -- they are a continuation of what we have been seeing through most of 2023... [1] We continue to see fewer and fewer home sales in Harrisonburg and Rockingham County. This October there were 23% fewer home sales than last October. This year (Jan-Oct) we have seen 25% fewer home sales than last year during the same timeframe. [2] Despite fewer home sales taking place, home prices keep on rising. The median sales price thus far in 2023 is $330,000 which is 10% higher than the median sales price of $299,775 that we saw last year. [3] Homes are selling (as a whole) ever so slightly more slowly than last year -- even if it shows up as a 33% increase in the median days on market. Last year's median days on market in October was six days... and this year it's up 33% to eight days. So, many homes (at least 50%) are still selling quite quickly, even if ever so slightly more slowly than last year. Next up, though, let's take a look at a data table that might surprise you a bit... 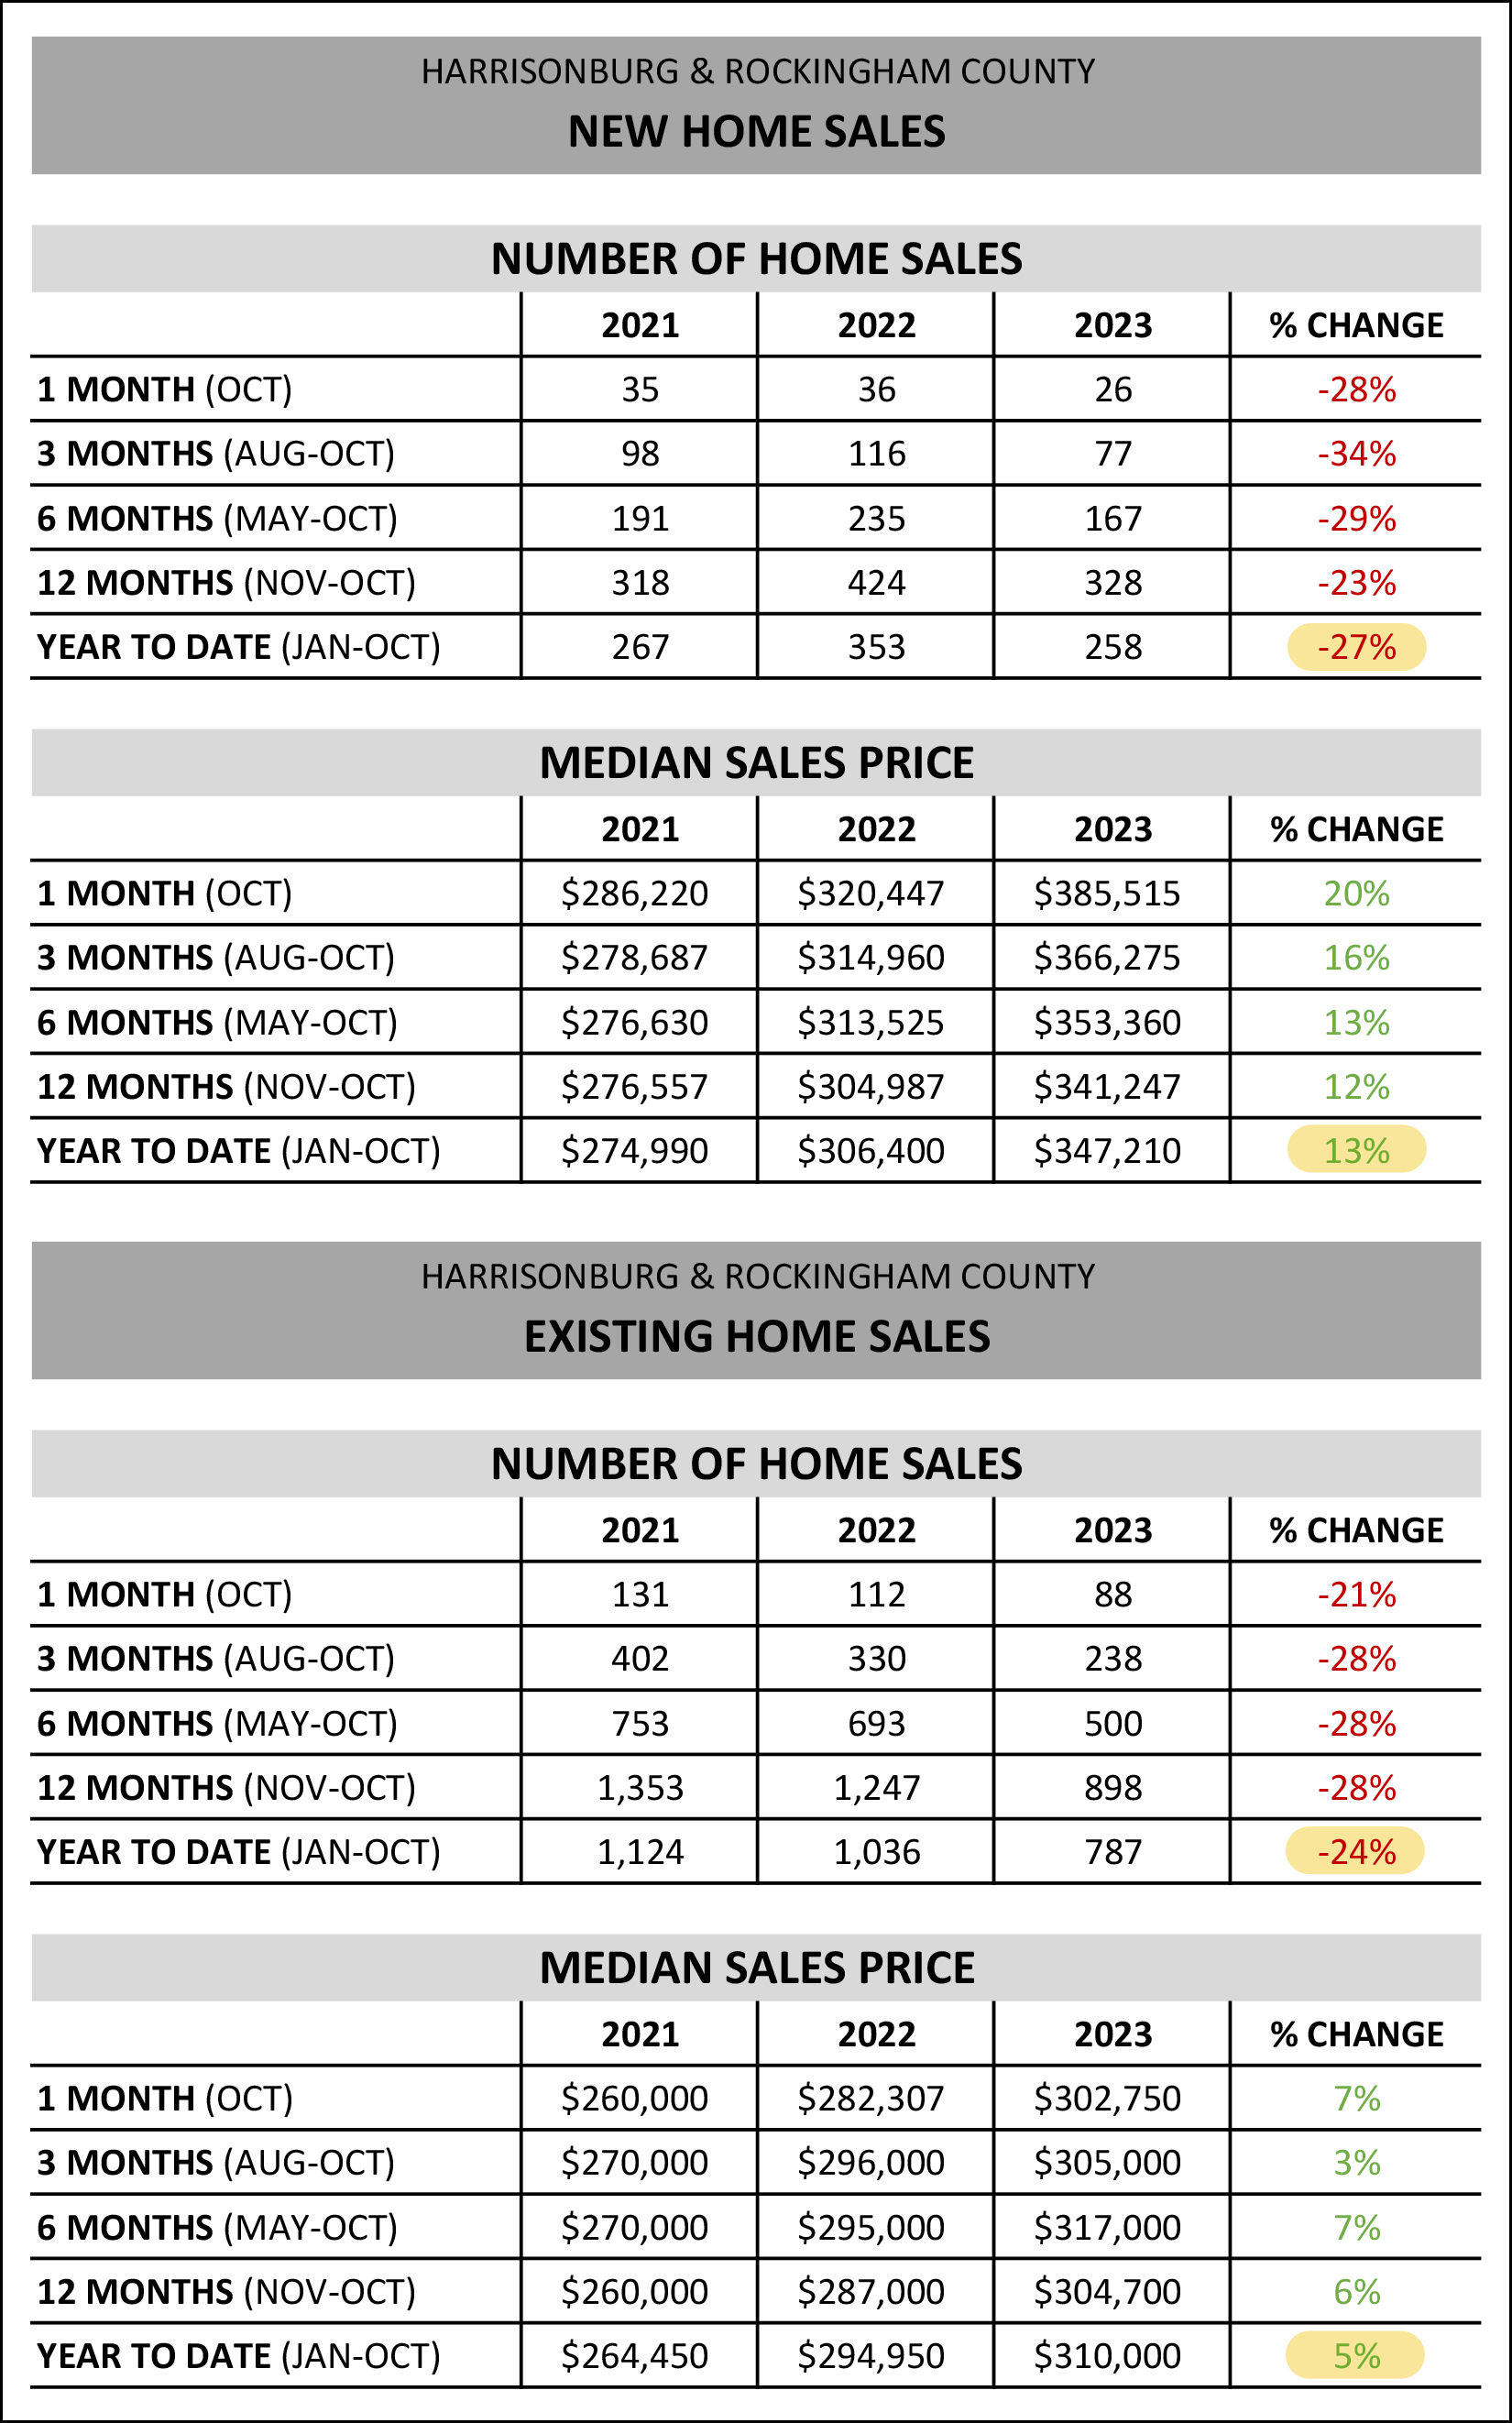 The top two tables above look only at new home sales while the third and fourth table look at existing home sales. First, the decline in the number of homes that are selling (2023 vs. 2022) is relatively similar between new home sales (-27%) and existing home sales (-24%). But... the change in median sales price over the past year is where we notice some differences. The median sales price of new homes has increased 13% over the past year -- while the median sales price of existing homes has only increased 5% over the past year. Hmmmm.... so while the market wide median sales price has increased 10% over the past year, if we strip out the new home sales (and their impact on pricing) we are only seeing a 5% increase in the median sales price. This 5% increase in the median sales price of existing homes in 2023 follows an 11.5% increase in that metric in 2022. So, perhaps the increase in (existing) home prices is slowing? Now, moving on to some visuals of the latest trends we're seeing in our local housing market for all the visual learners amongst us. First, how much slower has this year been than last year? 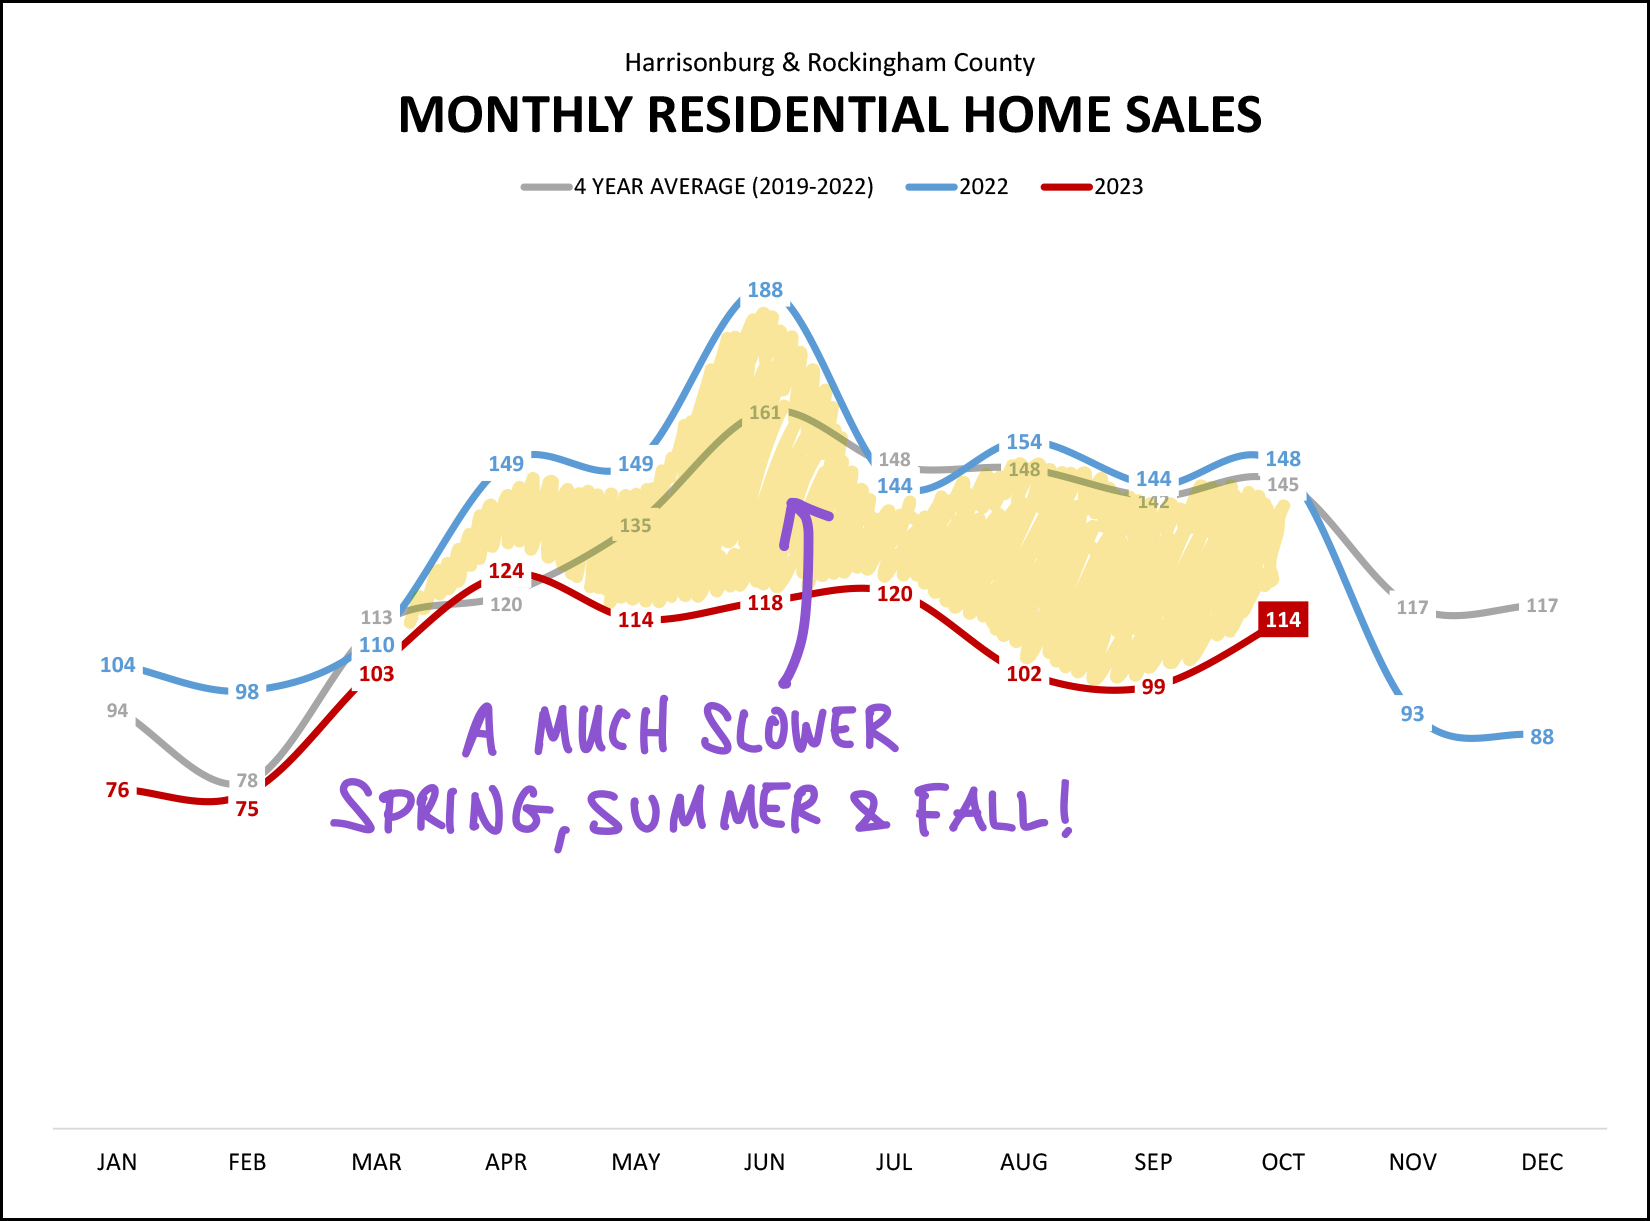 My yellow scribbles above are filling in the area between last year's home sales figures (blue line) and this year's home sales figures (red line) to show how much of a gap we have seen in home sales between March and October. Last year (Mar-Oct) we saw 1,186 home sales. This year (Mar-Oct) there have only been 894 home sales. This is a big drop (25%) and it seems to mostly be a reduction in the number of sellers selling... though we can start to re-think that a bit as we move through another month of rising inventory levels. But all that is to come... keep reading. Next up, the long term trends in the number of homes selling and the prices of those homes... 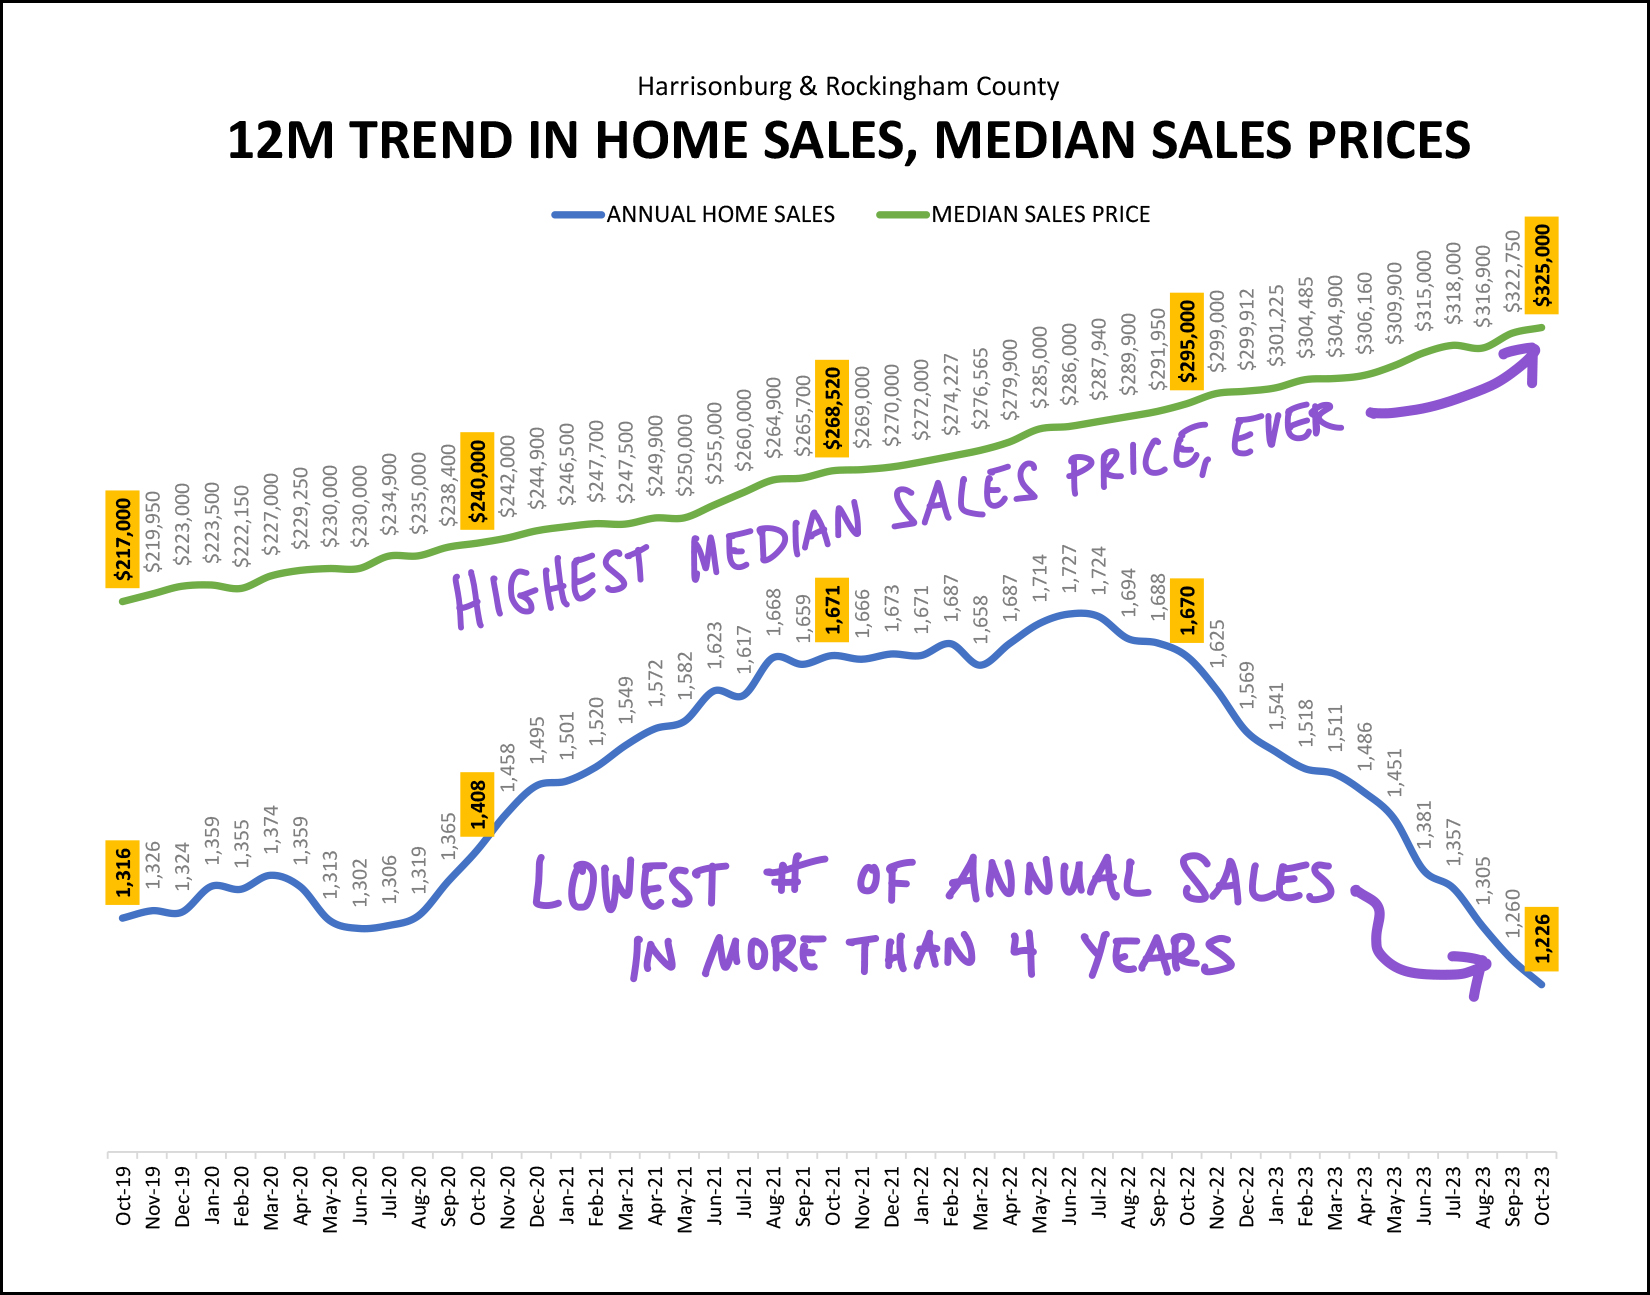 The number of annual home sales has now dropped all the way down to 1,226 home sales... which (as this graph points out) is the lowest number of annual sales in over four years. And... it's actually much longer than four years. The last time we were seeing homes sell at an annual rate lower than 1,226 homes per year was way back in July 2016... over seven years ago! With home prices being as high as they are (illustrated by the top line in the graph above) and with mortgage interest rates being so high (now) compared to rates most homeowners have on their current mortgages -- I don't think we will see this annual rate of home sales start to increase in the near future. Shifting gears a bit, let's look forward to the remainder of the final quarter of 2023 as it relates to contract activity... 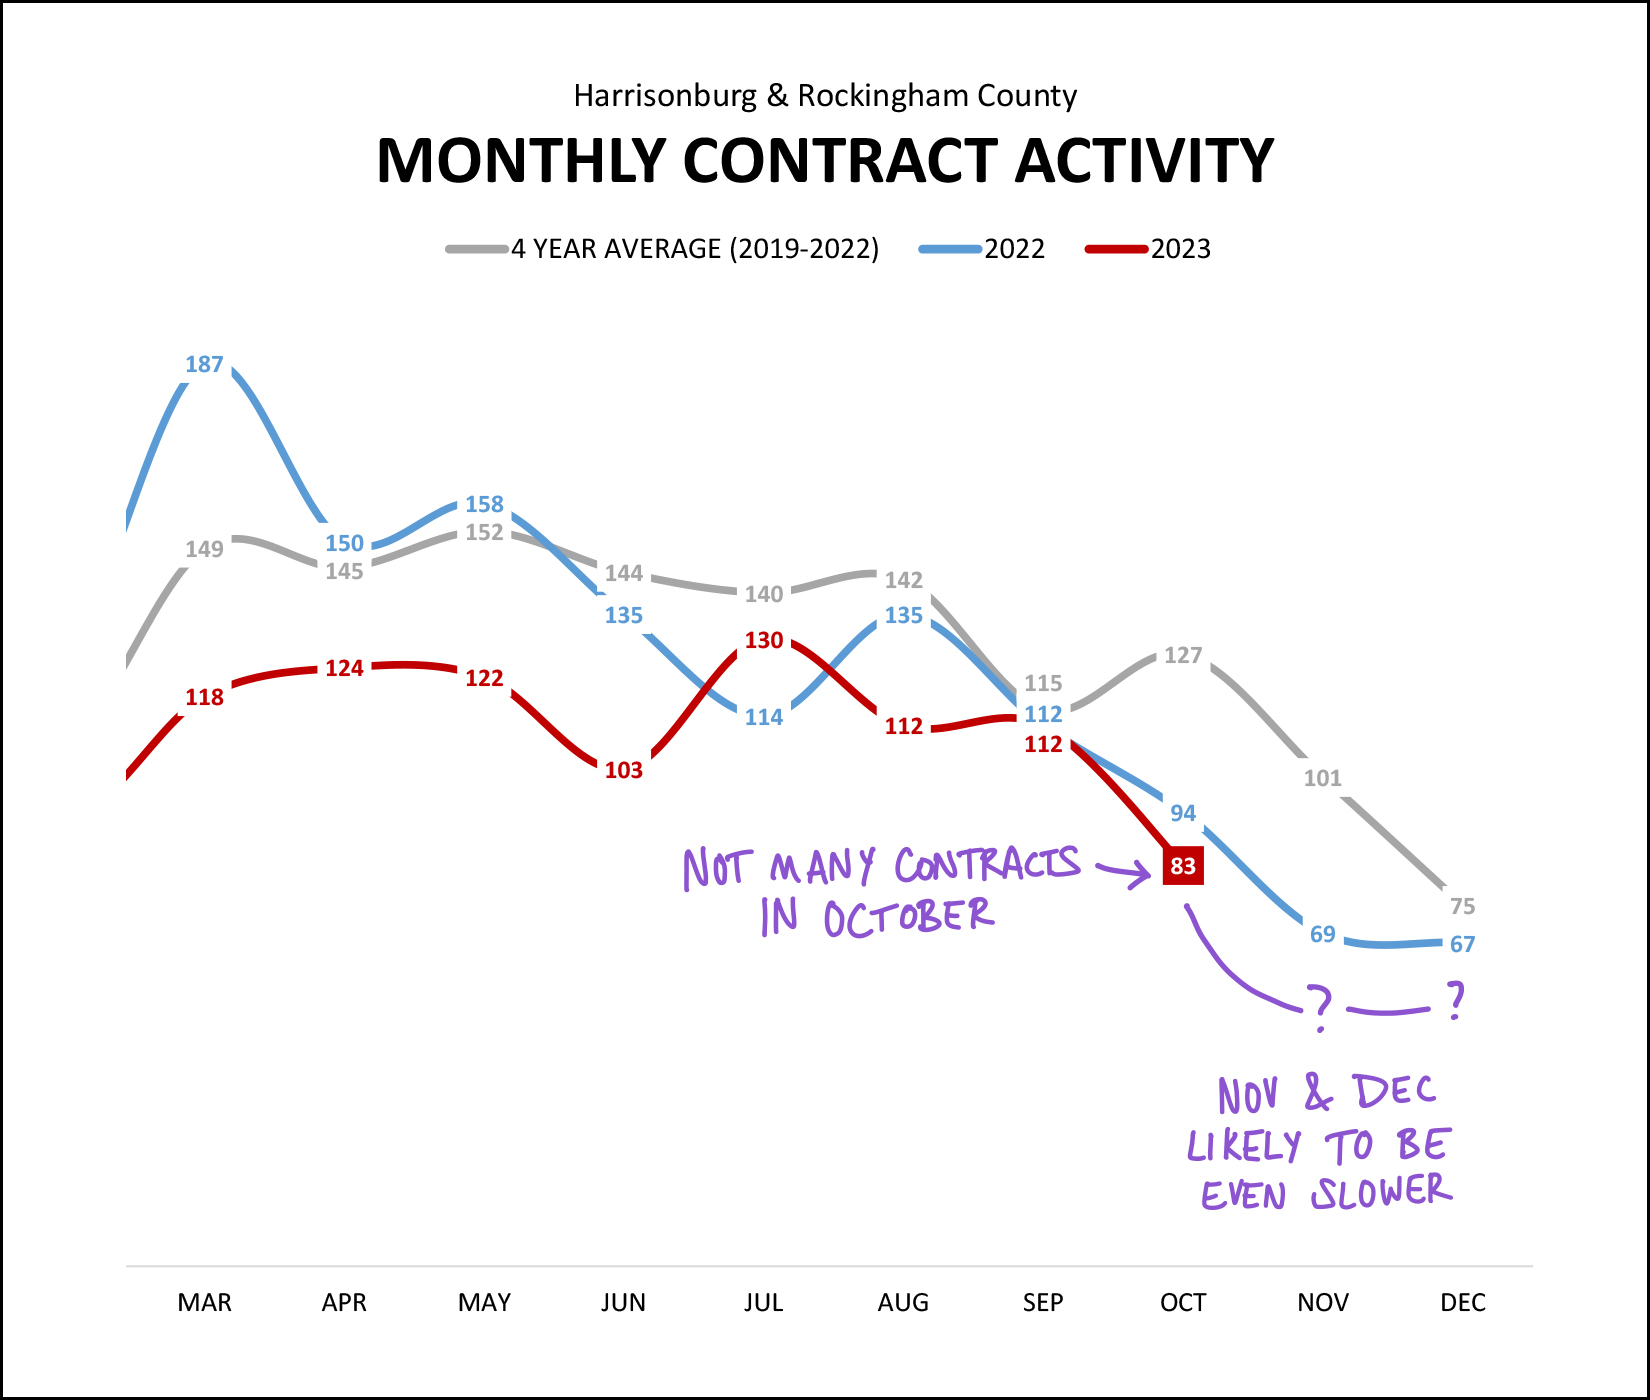 Only 83 contracts were signed in October 2023 which is slightly lower than last October (94) and significantly lower than the average October over the past four years (127). Looking ahead, it seems likely that we will see even fewer contracts being signed in both November and December. This is interesting to keep in mind when we get to the inventory graph in a bit. But before we get to the inventory numbers, here's a bit of a counter indication as to contract activity... 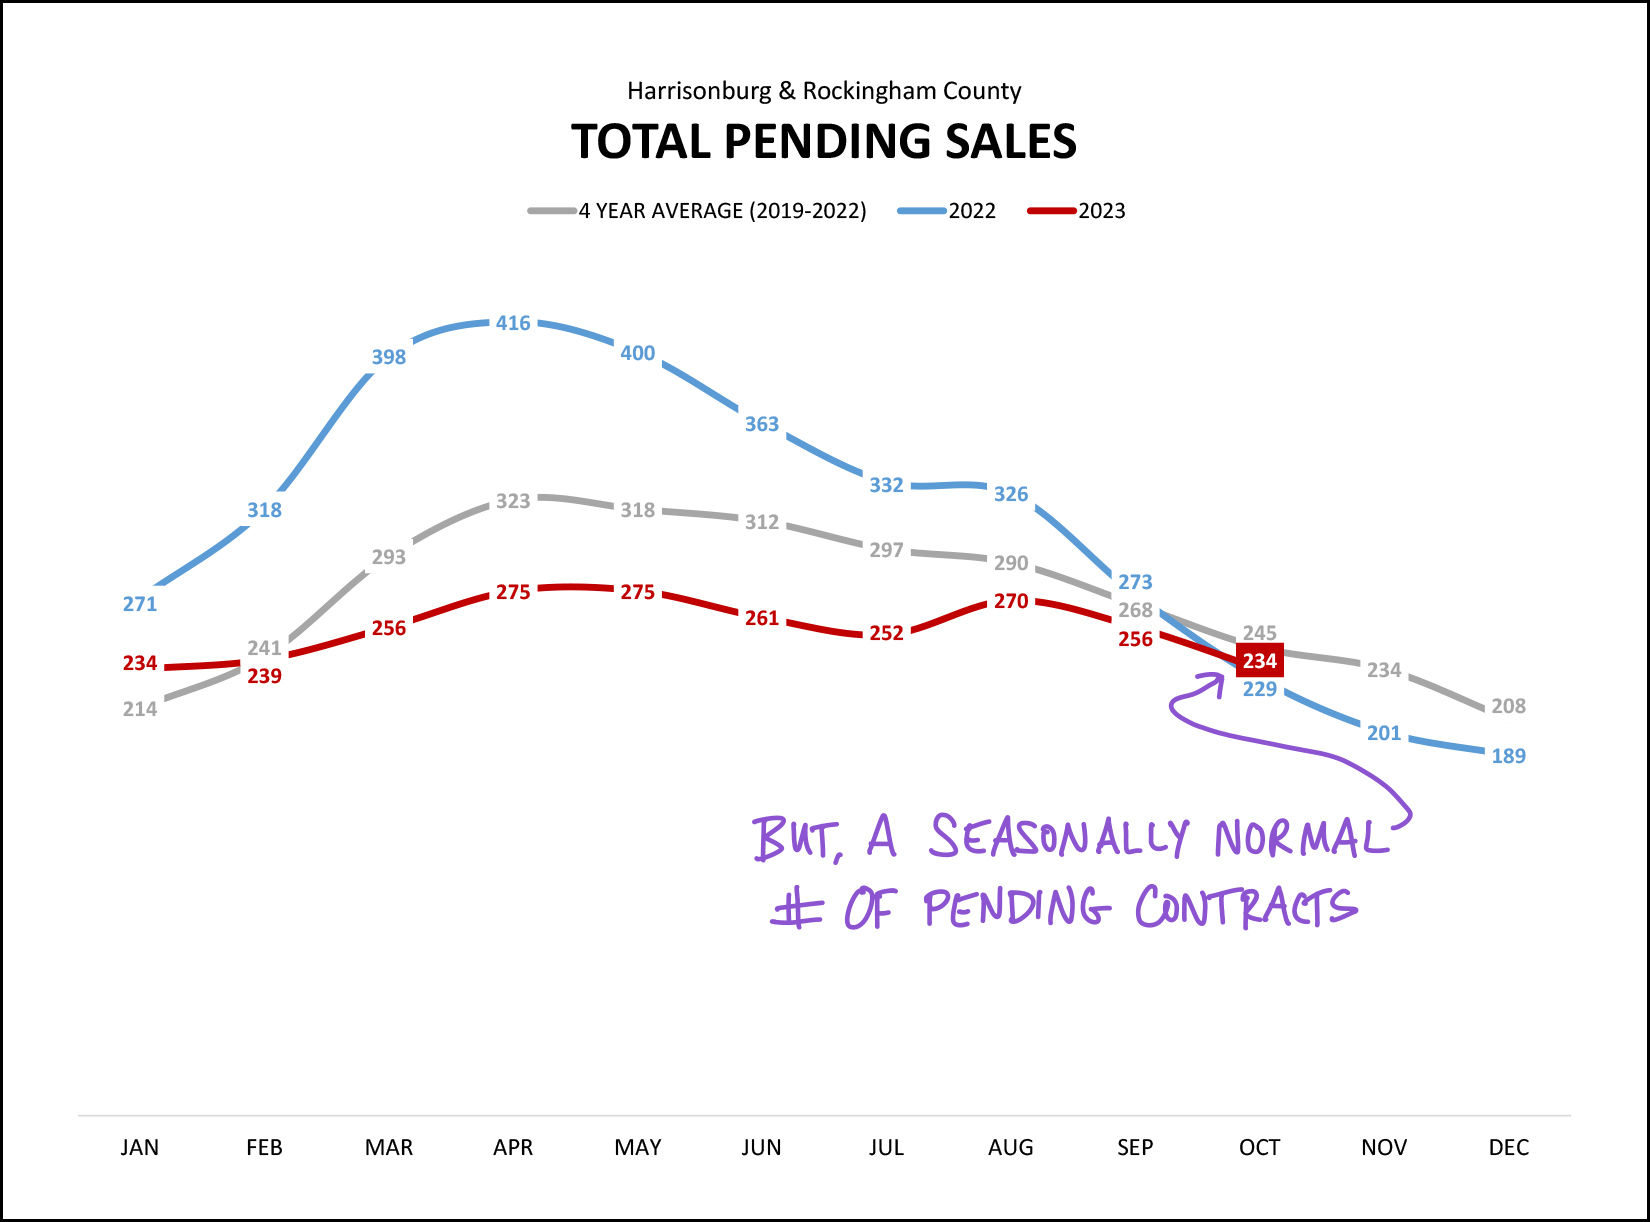 Despite slower contract activity, of late, the number of pending sales (under contract homes) is hovering around 234 contracts right now... which is very much in line with where we would expect it to be based on where we were at the end of last October (229) and the average end of October data from the past four years (245). Thus, perhaps we'll see normal-ish numbers of closed sales in November and December, given the normal-ish number of homes that are currently under contract? Now, inventory, the most interesting, unexpected and atypical indicator in this month's report... 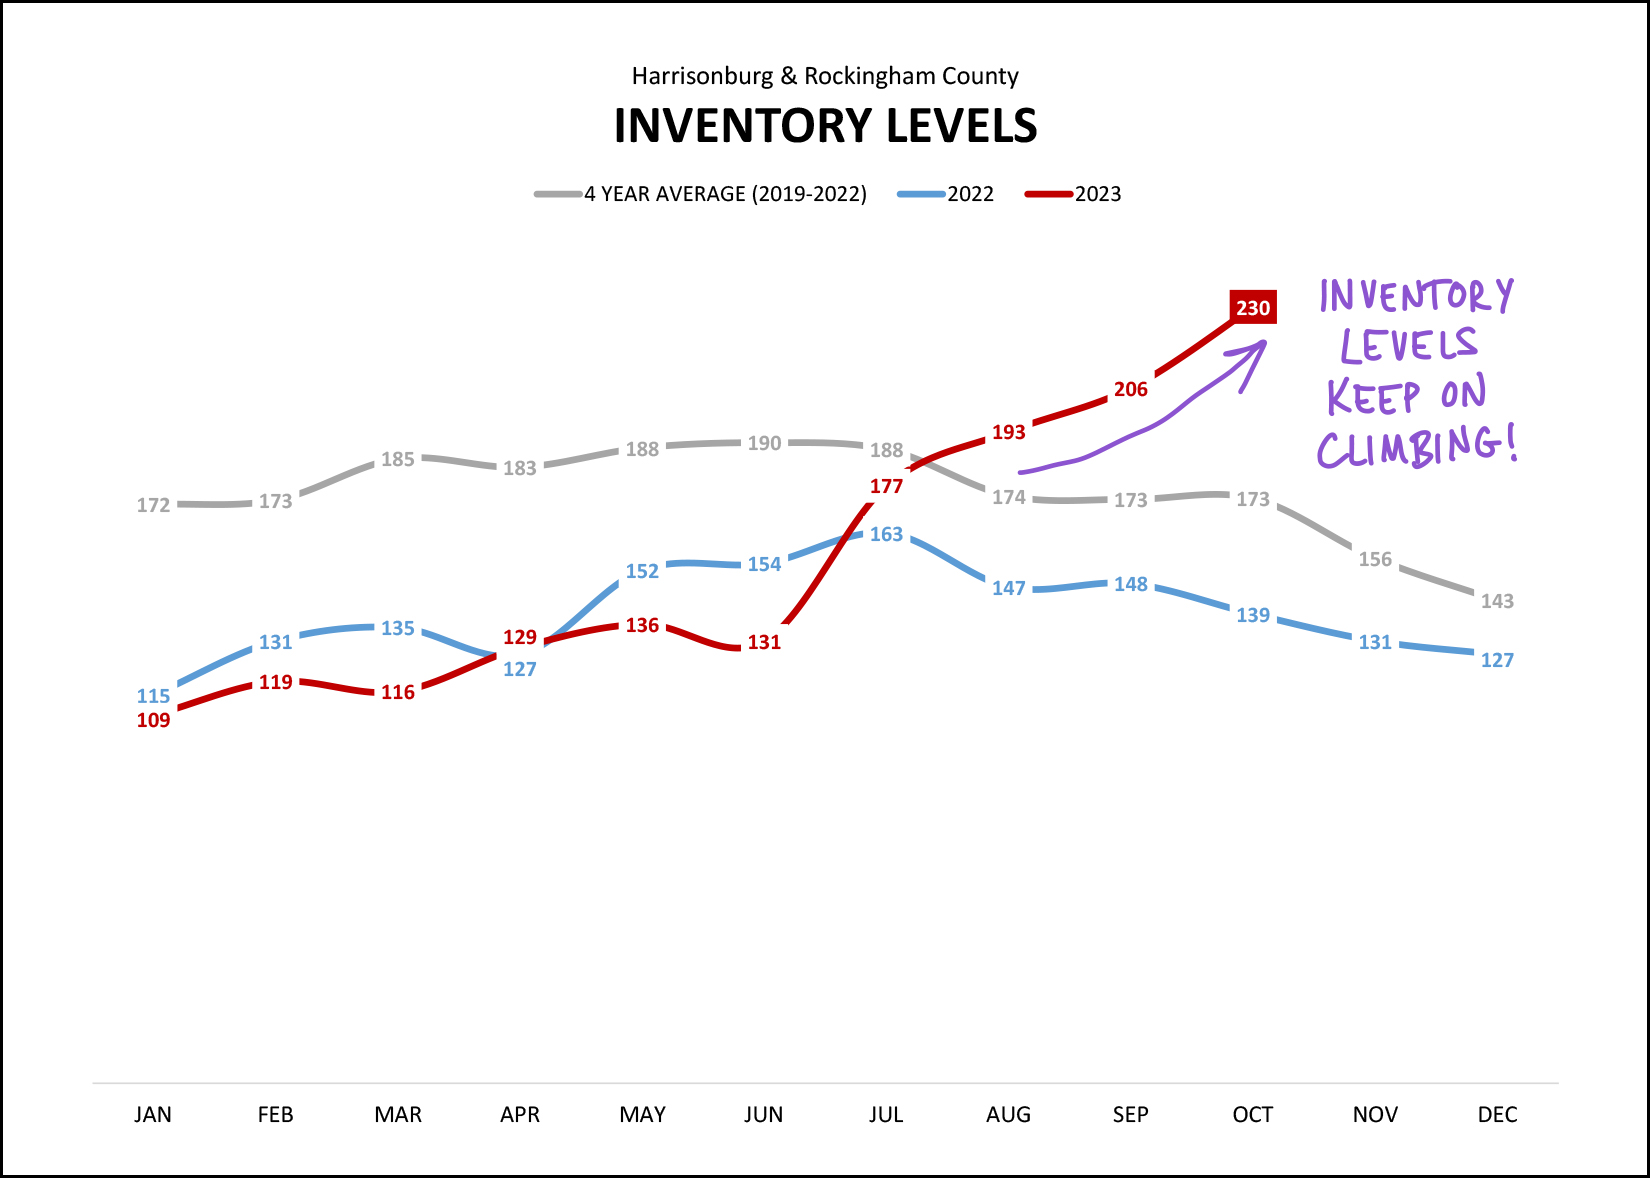 Inventory levels are continuing to climb, as they have for the past four months now. The 230 homes that are currently on the market is 65% more homes than were on the market a year ago. What does this mean? [1] While the homes that are selling are still selling rather quickly, there is an increasing number of homes that are not selling right away and that is causing inventory levels to climb. [2] If you are listing your home for sale you might see it go under contract quickly -- contributing to the low "median days on market" figure -- or you might not see it going under contract quickly -- contributing to the increasing inventory levels. Yes, I understand very clearly which group every home seller would like to be a part of -- but every home seller is not automatically a member of the "my home sold in a flash" club any longer. Circling back a bit, here's the median days on market data, showing that plenty of people are still in that "my home sold in a flash" club, with a significant caveat to follow... 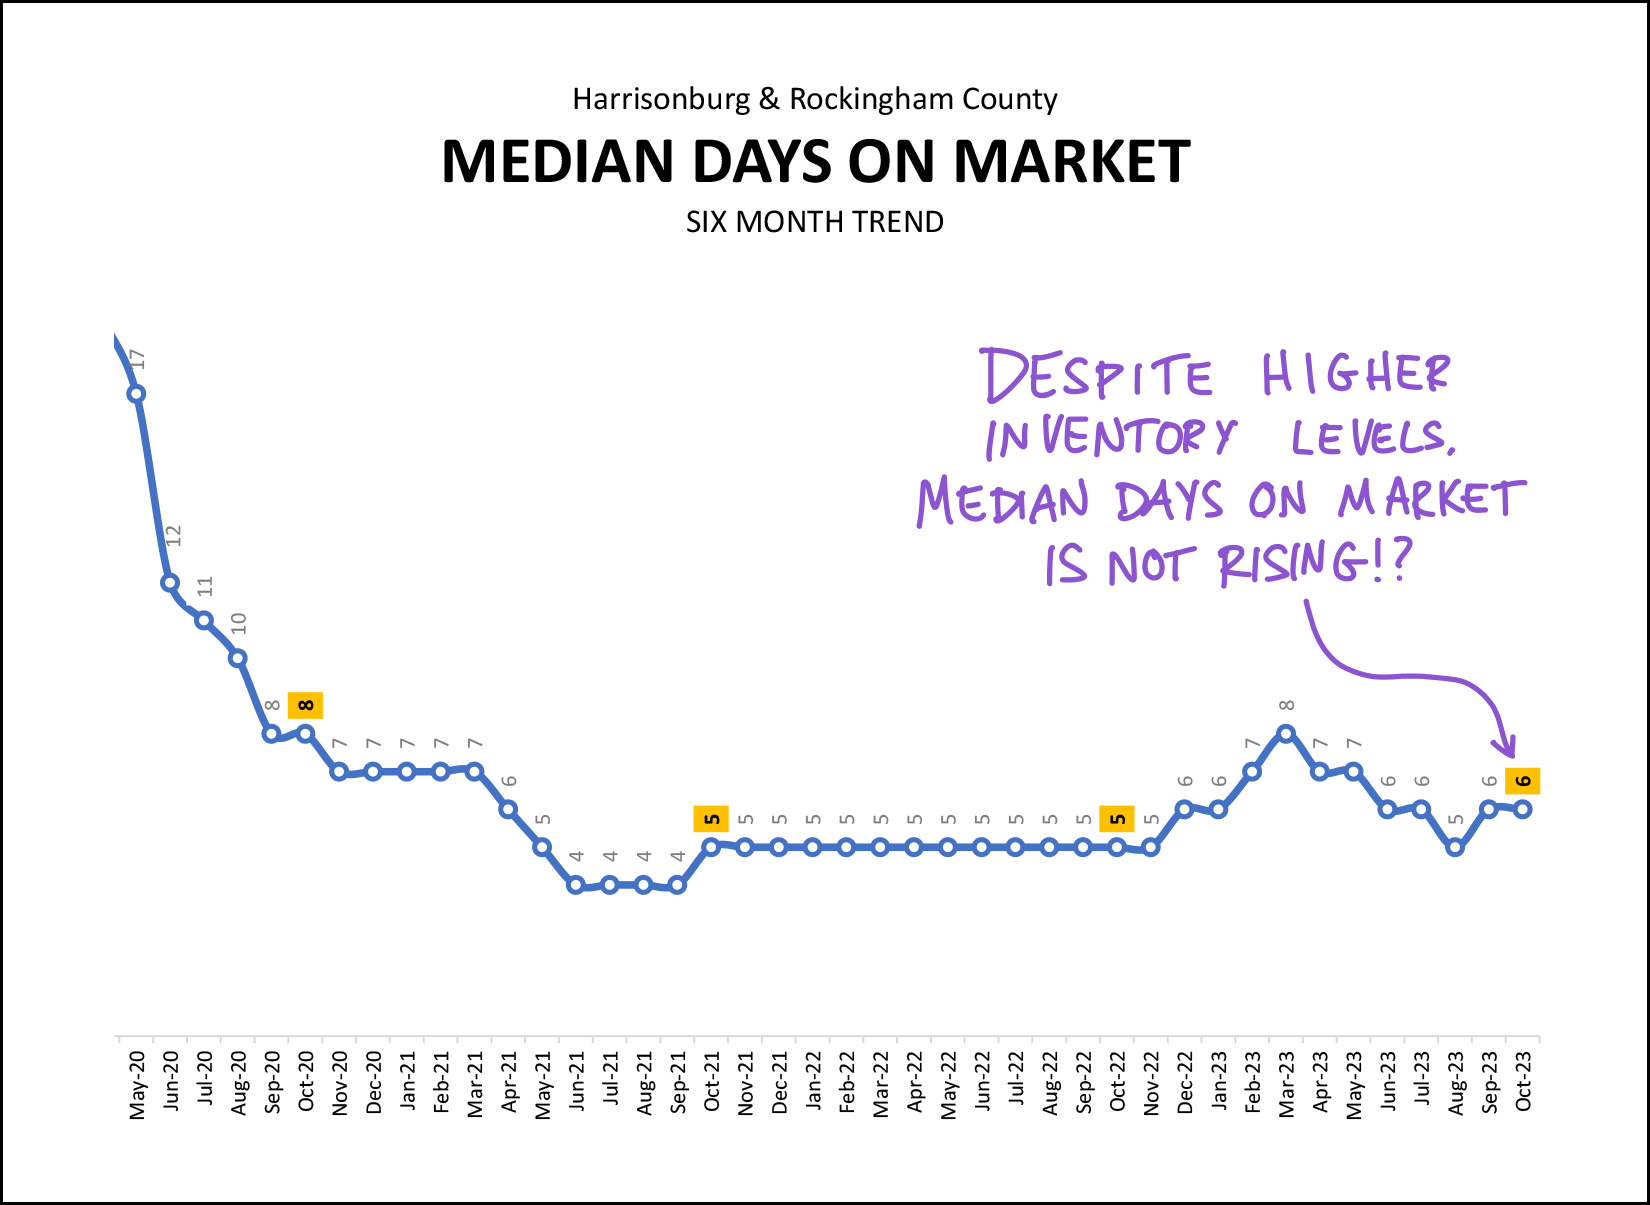 Let's be clear on what this graph (above) does and does not show... [DOES] This graph does show that half of the homes that have sold in the past six months have gone under contract in six or fewer days and half of the homes that have sold in the past six months have gone under contract in six or more days. [DOES] This graph does show that the time it is taking for homes to go under contract is about the same now as it was in the crazy times of 2021 and 2022. We were seeing a median of four to five days then, and a median of six days now. [DOES NOT] This graph does not show that all homes that are listed for sale will go under contract with a median of six days. These median days on market figures are calculated only based on homes that sell, once they have sold. I'll speak more to the "so what" or "now what" portions of these indicators a bit later. And finally, one of the main reasons for fewer home sales in 2023, those pesky high mortgage interest rates... 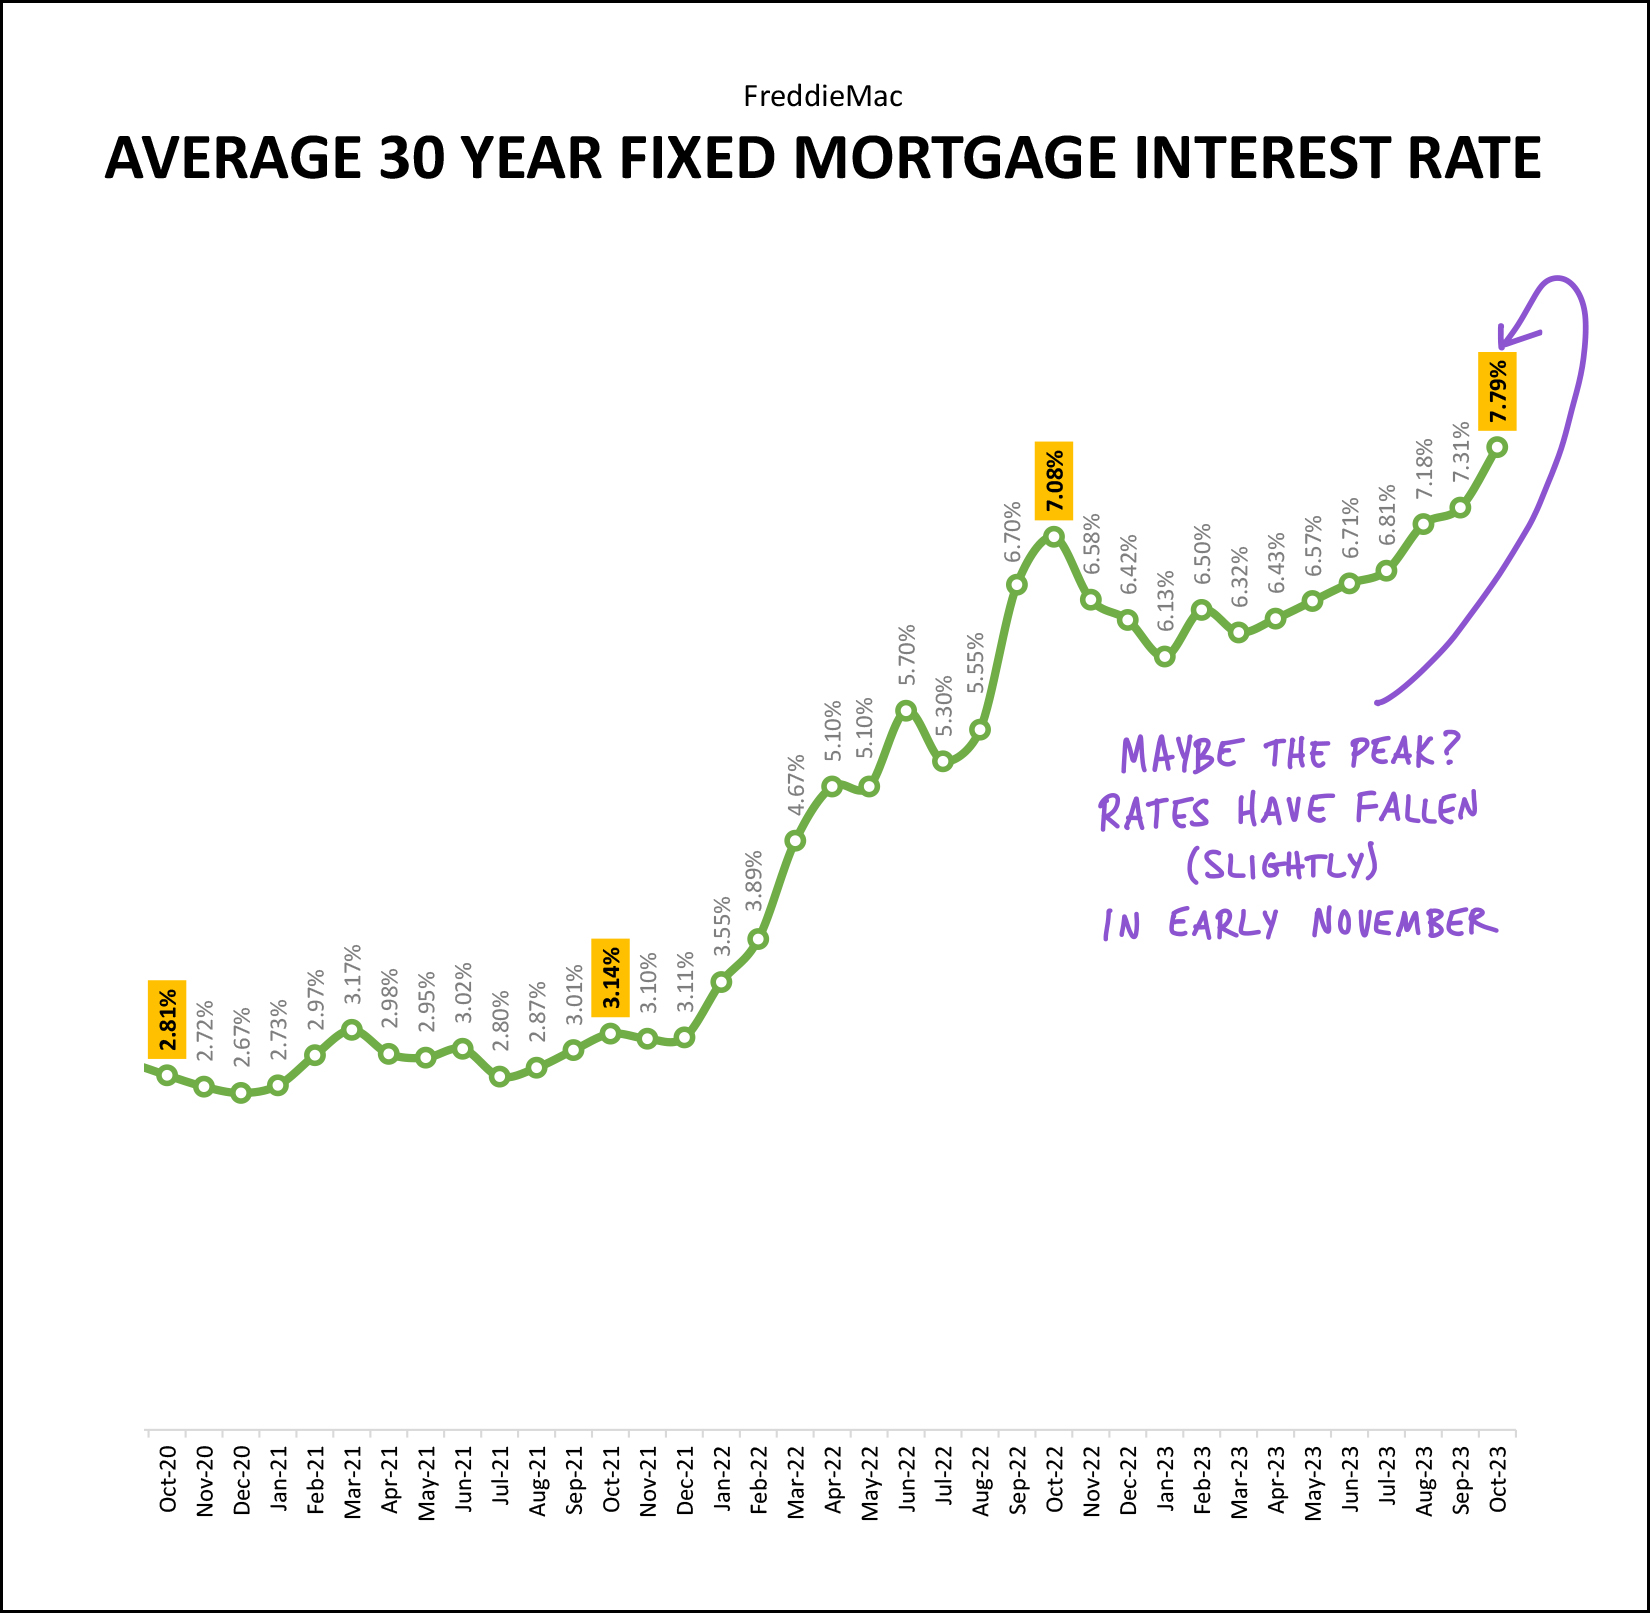 We now seen mortgage interest rates above 6% for more than a year... they have been over 7% for the past three months... and they were getting close to 8% at the end of October! These high (higher) mortgage interest rates put a damper on home sales activities... [1] Buyers think twice about buying after they calculate their monthly mortgage cost based on today's rates. [2] Sellers think twice about selling when they realize they'd be giving up their current (likely) low rate for a (likely) much higher rate today. I don't think we will see much of an increase in the number of homes that are selling until we see mortgage interest rates heading back down. It is worth noting that rates have come back down a bit in November, dropping from 7.79% down to 7.5% as of last week. Now, let's move on to the "so what" and "now what" portion of our conversation... If you plan to buy a home soon... [1] Yes, mortgage interest rates are high, so talk with a lender to make sure you have a clear understanding of your potential mortgage payment and make sure that it fits in your budget. [2] You likely are seeing more options of homes to consider now than you would have had over the past few years. Enjoy possibly having a few options at once instead of just one option at a time. [3] You might not have to make a decision about an offer within 30 minutes. Yay! Think it through, go back and look a second time, make sure you are comfortable with your potential offer and your buying decision. If you are selling your home and it's already under contract... [1] Congratulations. [2] Don't talk about it with anyone in the next category. ;-) If you are selling your home and it is not yet under contract... [1] We should take a look at how your pricing compares to other homes that buyers might currently be considering. We must make sure your pricing is competitive. [2] We should look at whether other buyers have contracted on similar homes in the past 60 days. Have buyers bought other houses -- and not your house -- or have they not been contracting to buy anything at all? [3] We will likely want to discuss if or how an adjusted list price might cause a buyer on the fence to make an offer... or a buyer looking at the fence to come view your home. ;-) [4] Sometimes the only solution is to be patient as there are no longer multiple buyers in the market, always, for every house regardless of size, location, features and price. If you plan to sell your home soon... [1] Pricing is key! Let's be super realistic (or overly realistic) with pricing so that you can join the "my home sold in a flash" club. [2] We will also need to take a look at how many buyers have purchased homes like your home over the past 60, 90 or 120 days to try to have realistic expectations for time on the market. [3] You might not have a flurry of showings in the first few days that your home is on the market. This does not mean that your home will never sell. It just means that it is not 2021 or 2022. :-) [4] Selling a home in 2021 and 2022 was a sprint... but you don't need to worry that it will now be a marathon... it is likely to be somewhere between a one mile run and a 5K. And for everyone... As all of these market trends (# sales, prices, inventory levels, time on market) adjust in our local market, it's more important than ever to delve deeper into the data related to your specific property type, price range, neighborhood, etc. - regardless of whether you are selling or buying. We must take a more thoughtful approach than ever to our selling strategy when it comes to pricing, preparation, marketing and negotiating... and a more thoughtful approach than ever to our offering strategy when buying. I'll wrap it up there for now, but feel free to reach out if you have questions about your particular housing situation -- or if you just want to talk things through. You can reach me most easily at 540-578-0102 (call/text) or by email here. | |
Fewer Home Sales, Rising Inventory Levels And Possible Slowing In Sales Price Gains |
|
 Happy October, Friends! October is one of my favorite months of the year... for quite a few reasons... 1. Cool mornings, warm afternoons and then cool evenings again. 2. Beautiful changing colors of fall leaves. 3. Pumpkin pie! 4. My birthday. ;-) 5. Coaching middle school volleyball. 6. Apple cider. 7. Watching JMU football games. Goodness, there have been some stressful ones this season, though not this past weekend!  Is October a favorite month for you as well? What would be on your list? While you're building your own list of all the reasons why October is amazing, let me mention my monthly giveaway, of sorts, for readers of this market report, highlighting some of my favorite places, things or events in Harrisonburg. Recent highlights have included Taste of Thai, Merge Coffee and Jimmy Madison's. This month I am giving away a $50 gift certificate to Hank's Grille, located in McGaheysville. I enjoyed a delicious meal this weekend of pork BBQ with baked beans and macaroni and cheese on the side, rounded out with some pecan pie. If you haven't been to Hank's Grille, you should go check it out... whether you win the gift certificate or not! Click here to enter to win a $50 gift certificate! And now... on to the data, and charts and graphs... 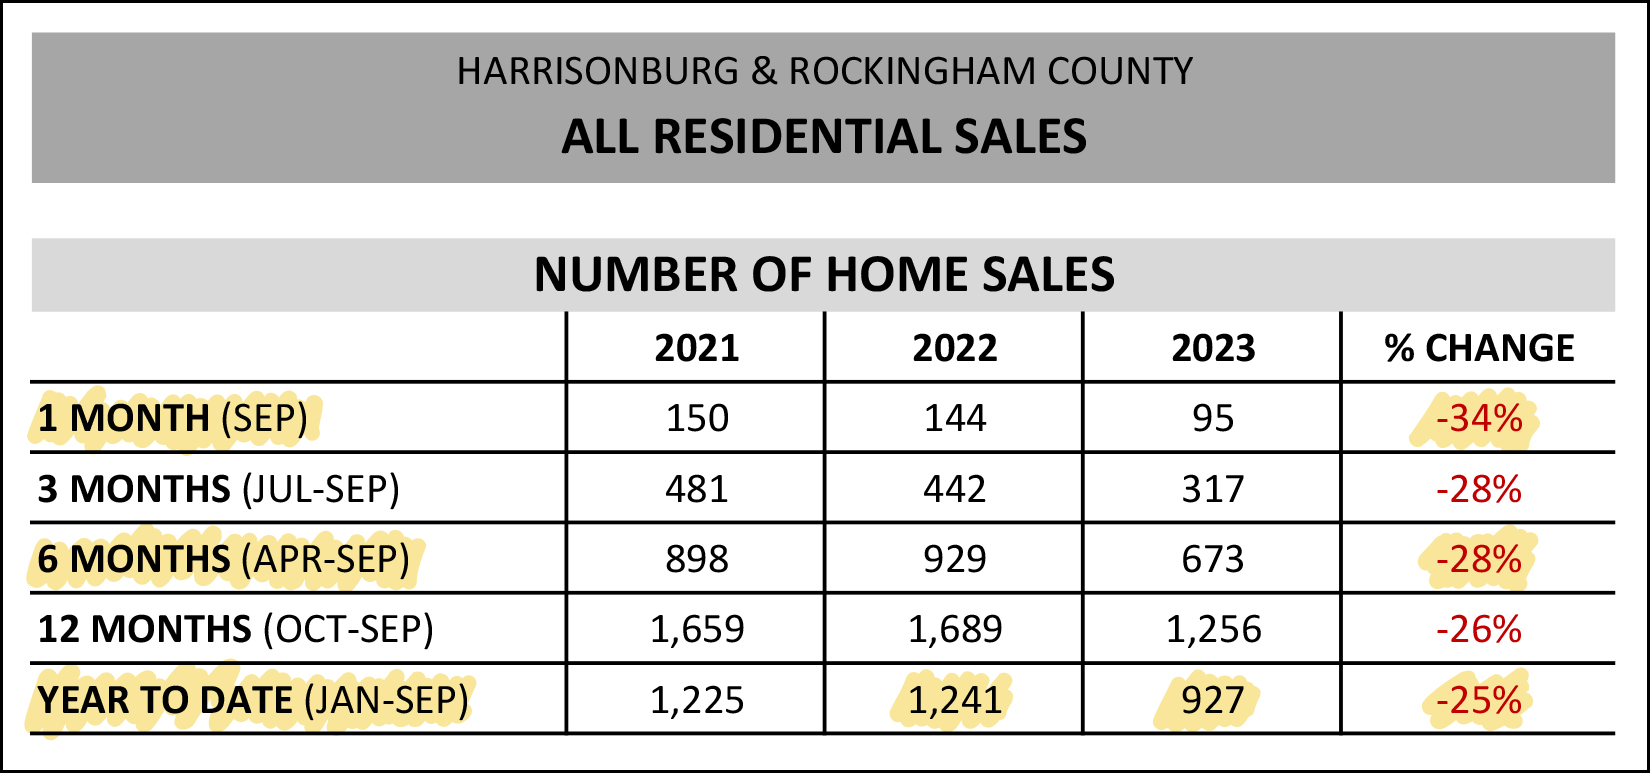 OK, my highlighting on the chart above requires a bit of explanation. Let's work our way from the bottom of the chart upwards... [1] Year to date we have seen 927 home sales, which is 25% fewer than the 1,241 home sales we saw in the first nine months of last year. [2] When we look just at the past six months (April through September) we have seen a slightly larger 28% decline in the number of homes selling in Harrisonburg and Rockingham County. [3] When we look just at September (while keeping in mind that a small data set can lead us to erroneous conclusions) we'll see a 34% decline in the number of homes that are selling. So, far fewer homes (at least 25% fewer) are selling in Harrisonburg and Rockingham County this year as compared to last. But what about the prices of those homes that are selling? 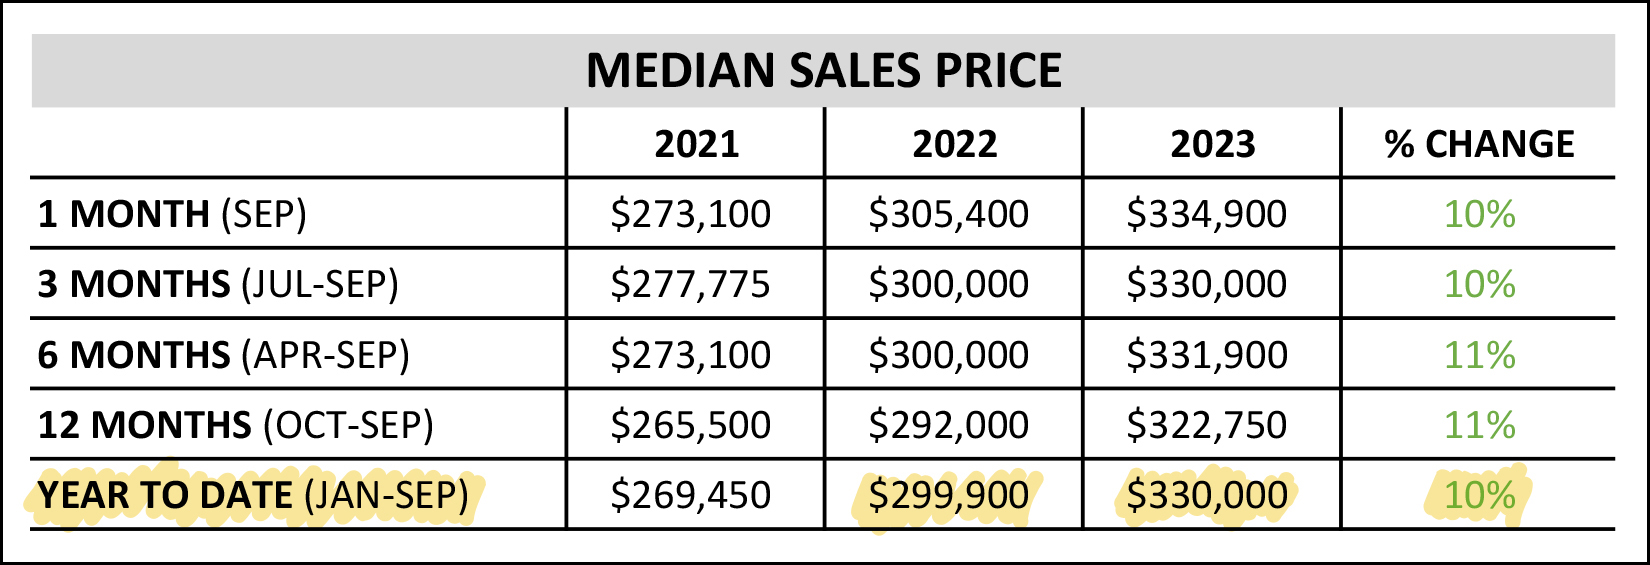 The prices, it seems, keep on rising, no matter how we slice and dice the data from a timeframe perspective. As shown above, the median sales price has increased 10% this year to date as compared to last year to date. When we look at a shorter timeframe (six months, three months, one month) we still see a double digit (10% - 11%) increase in the median sales price. All that said, later in this report I'll take a look at only detached home sales where we are starting to see a slightly different trend in median sales prices. I know... quite the build up... but don't skip ahead... keep reading. :-) These next numbers can be quite easily taken out of context... 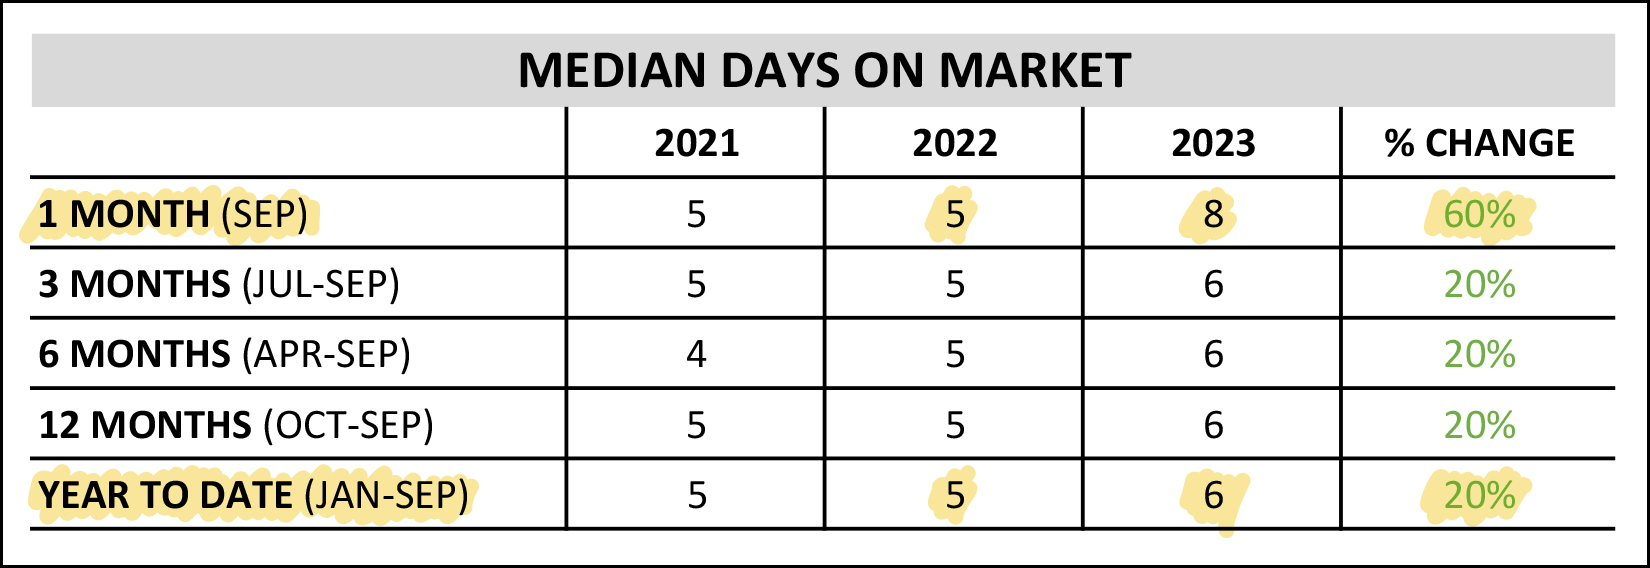 The median time that it takes for a home to go under contract (days on market) increased 60% in September 2023! Gasp! ;-) It's actually not as much of a story as you might think. Median days on market was five days last September and is eight days this September. Yes, that is a 60% increase... but eight days is still quite low and doesn't mark too much of a shift in how quickly homes are going under contract. Most sellers are just as delighted to have their home under contract in eight days even if it isn't under contract in five days. Also, above, you'll see that year to date the median days on market has only increased from five days to six days. Another graph below will put these numbers in a larger (longer) context. More suspense, I know. Now, on to some graphs for the visual learners amongst us... 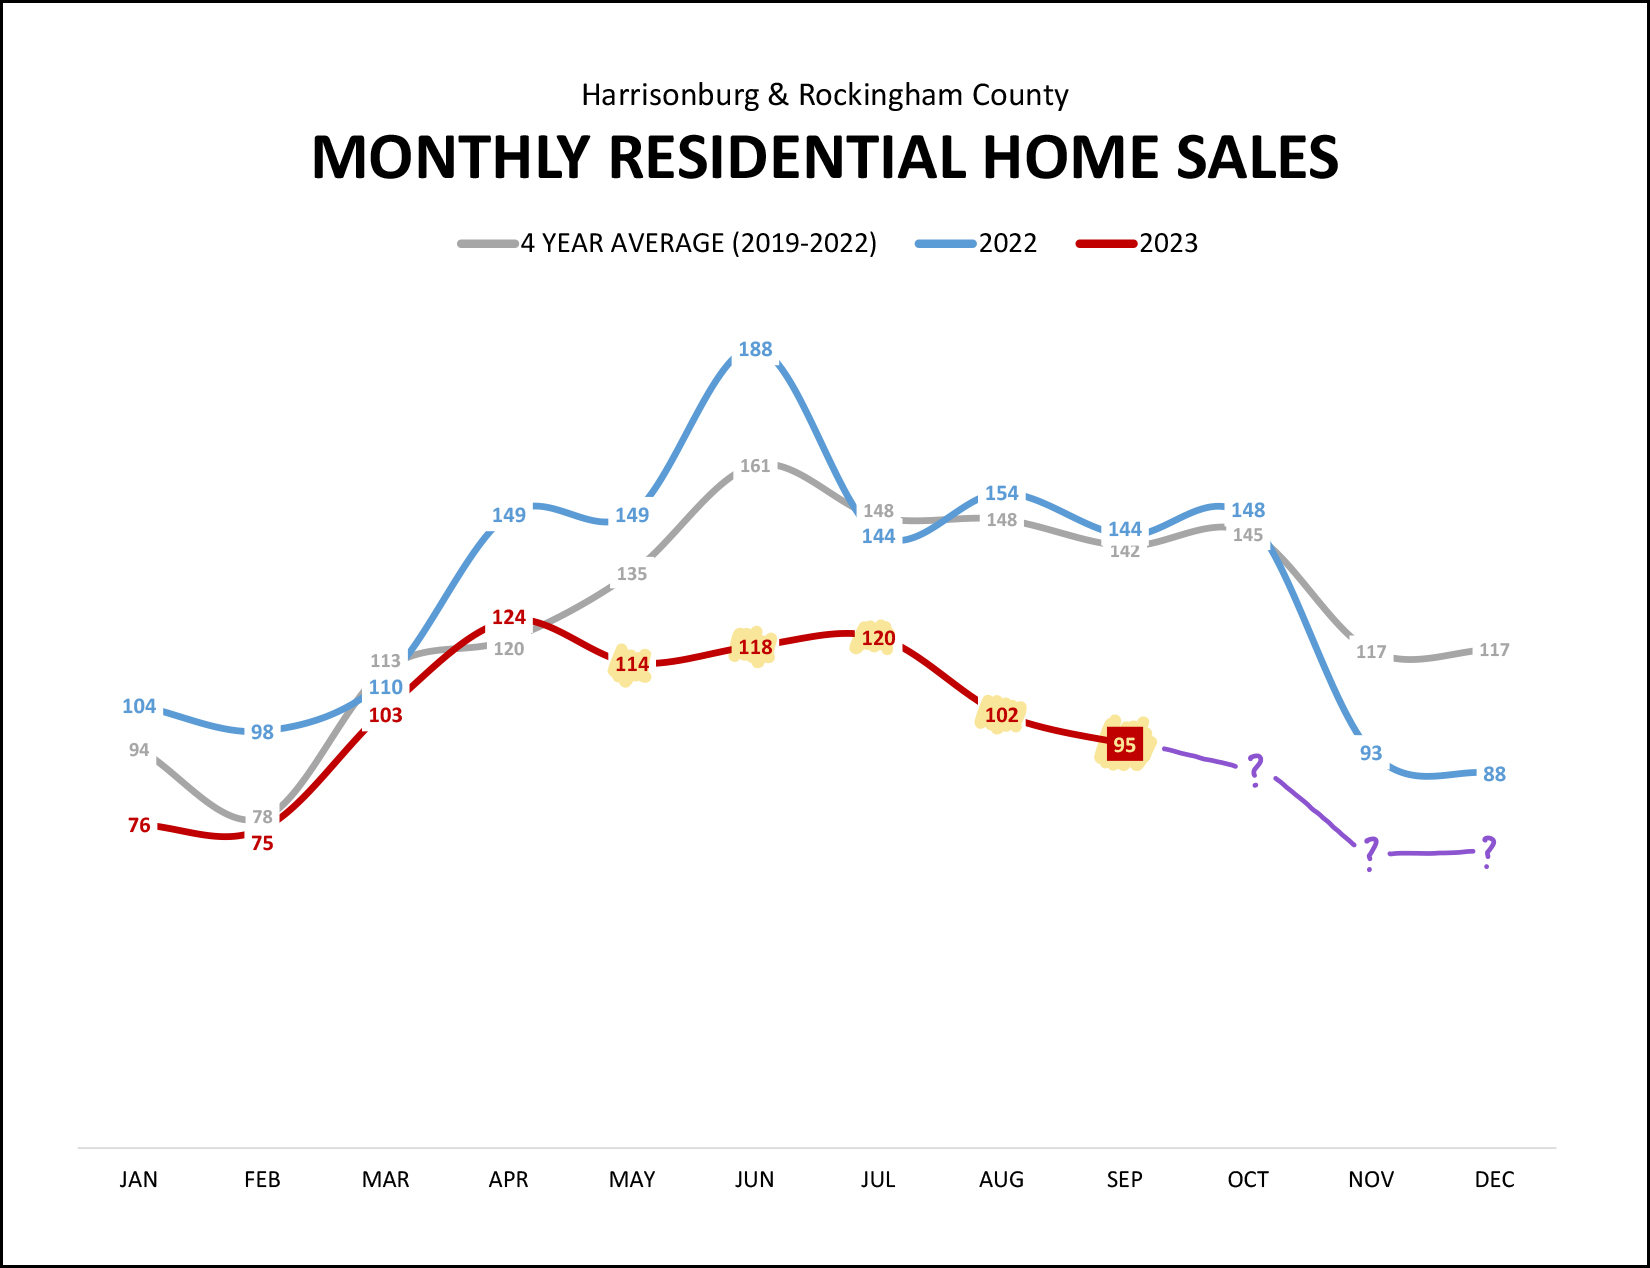 After a normal-ish January through April, we have been seeing far fewer home sales each month thereafter. May through September makes five months in a row where we saw significantly fewer home sales as compared to the same month last year (blue line) and as compared to the average of the past four years (grey line). Looking ahead, on the graph above, I think it is reasonable to assume we will continue to see slower months of home sales in October, November and December as compared to recent years. As I have pointed out in the past, this slow down in home sales seems to be a result in changes on both the supply and demand side of the housing market... SUPPLY - We are seeing fewer sellers willing to sell their homes as they don't want to give up their likely low mortgage interest rate in the 3% to 4% range. DEMAND - We are seeing fewer buyers willing or able to buy homes given the current higher mortgage interest rates in the 7% to 8% range. Now, then, for even more context... let's see how home sales have fallen... 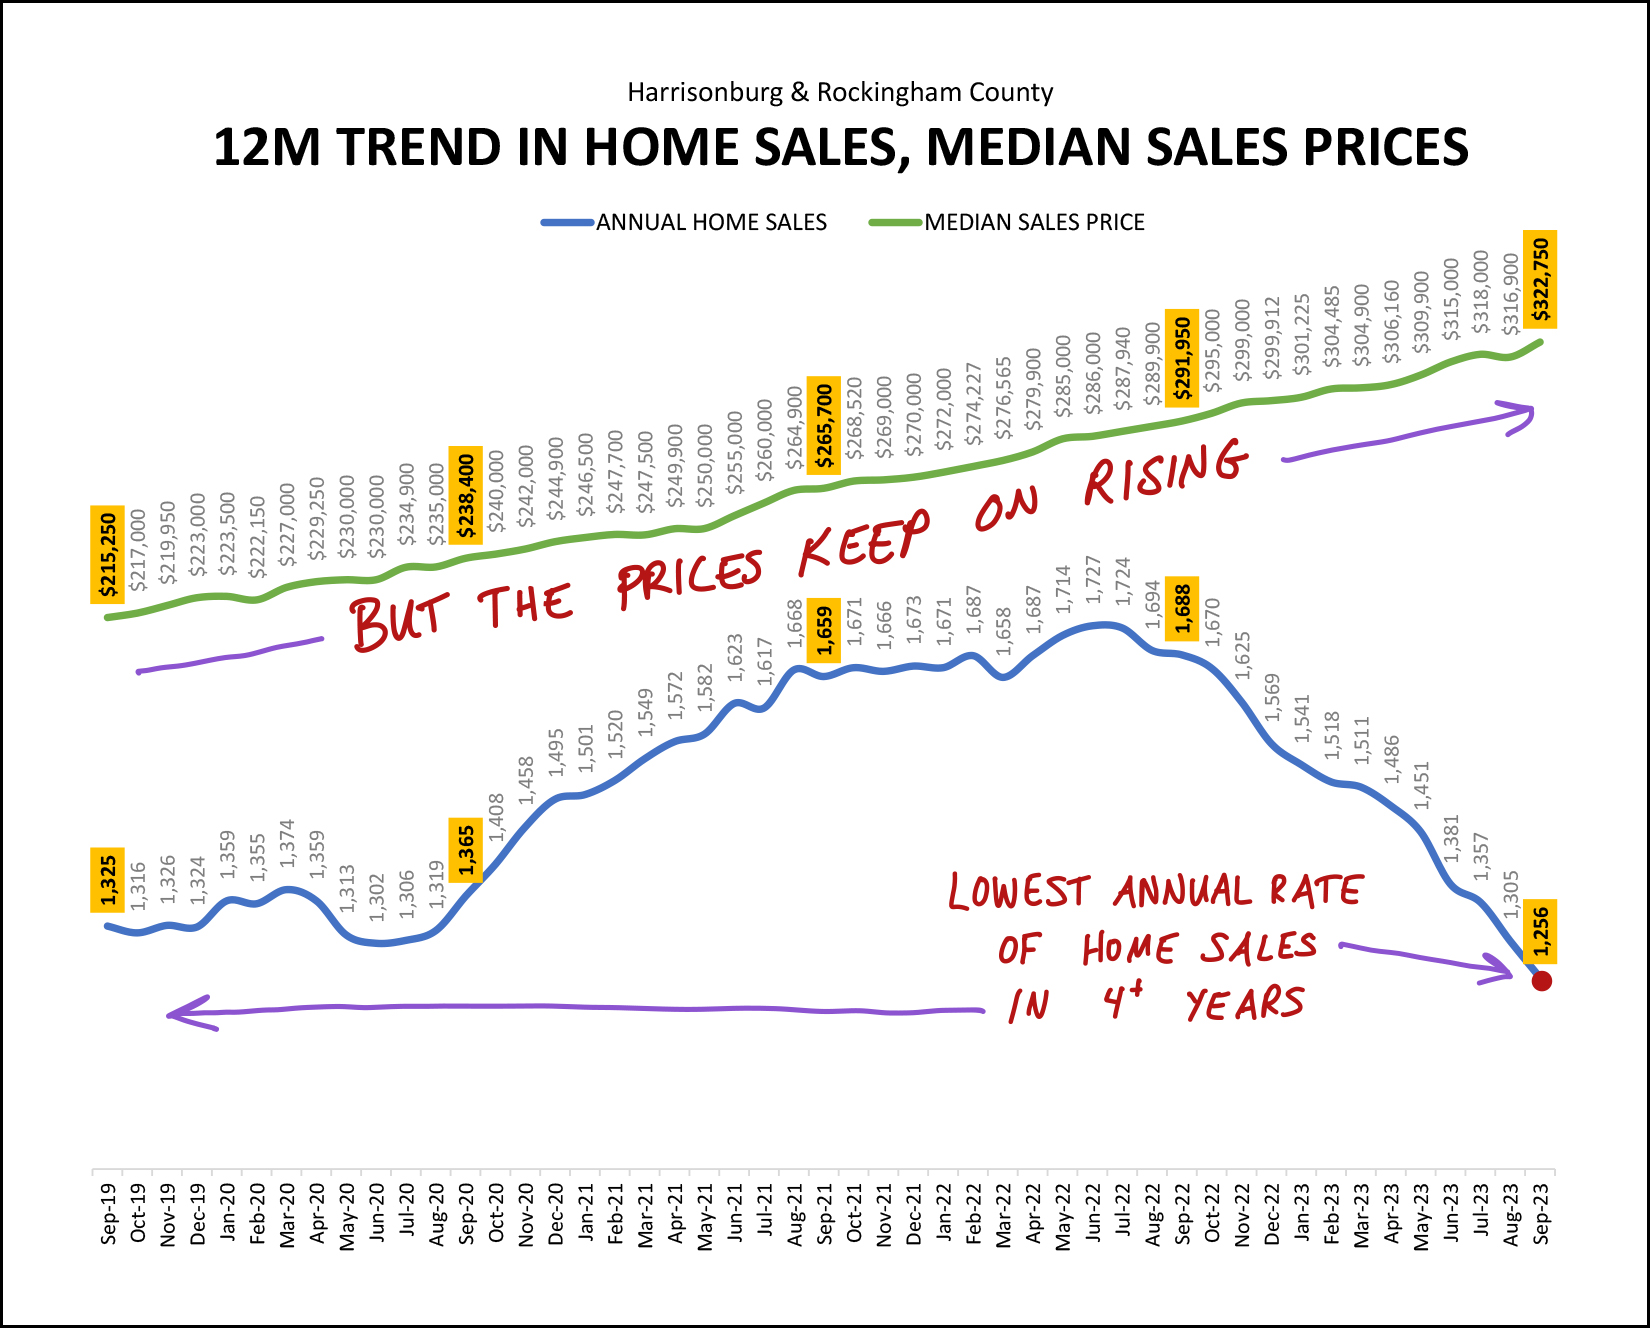 The blue line above shows the number of home sales in a year's time. That annual rate of home sales was hovering in the 1,300's pre-Covid and then surged up to a high of 1,727 in summer 2022. Now, however, we have seen the annual rate of home sales decline all the way below 1,300 home sales a year which is the lowest annual rate in over four years! But yet -- enter the green line -- the median sales price of those homes keeps on rising! However, maybe we are starting to see a slight change in the trajectory of the median sales price? See below... 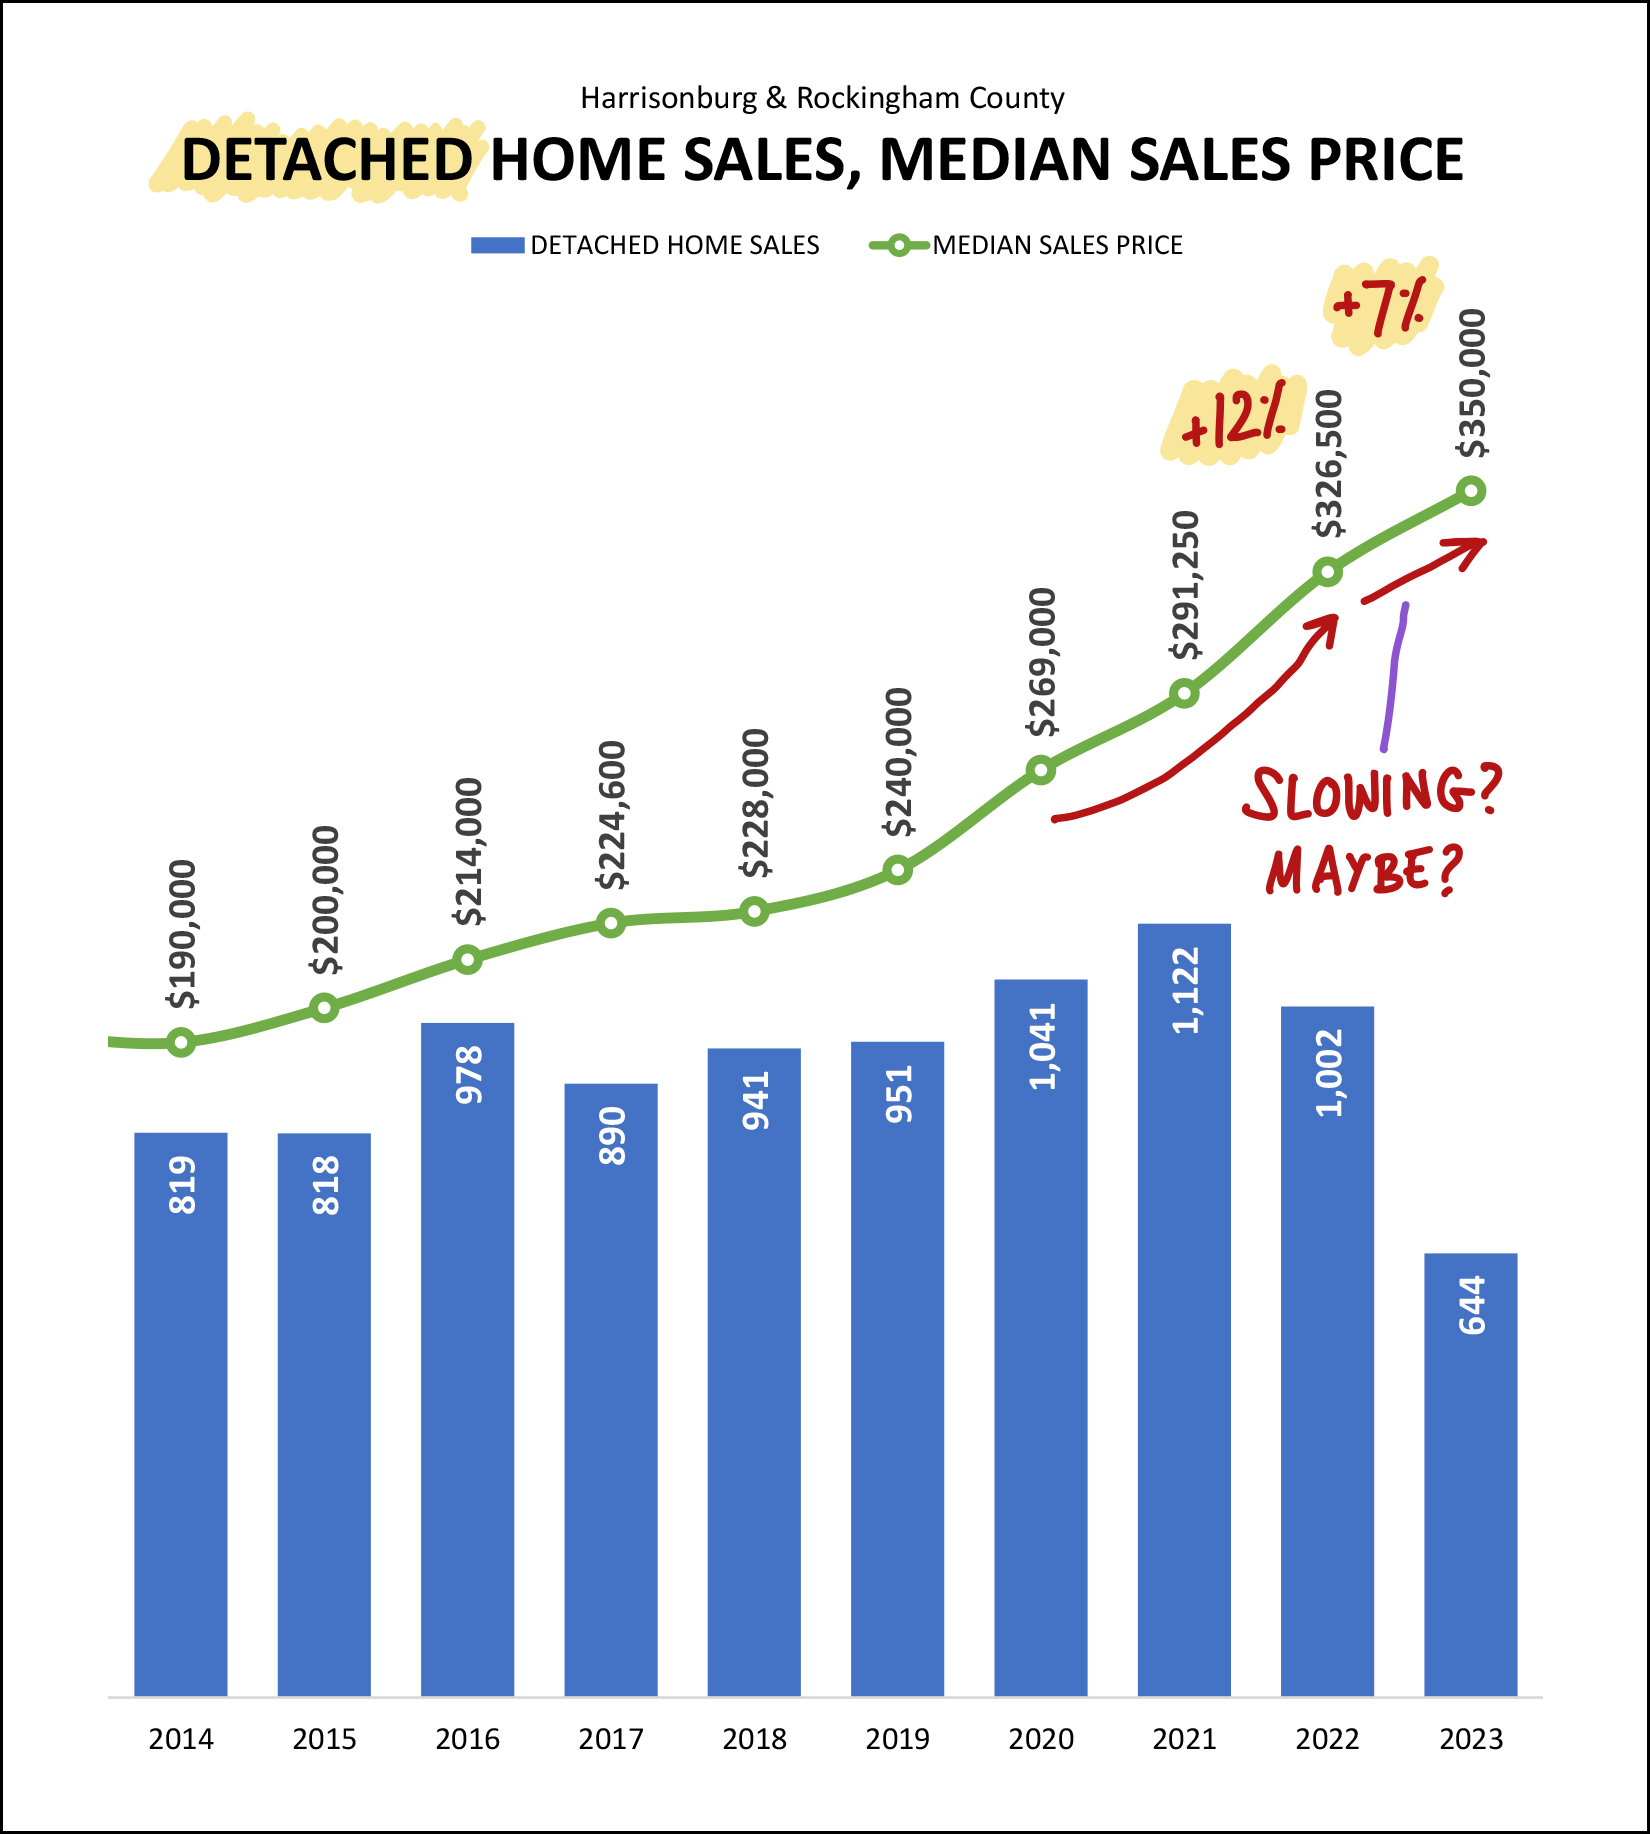 The graph above segments out only DETACHED home sales, also known as "single family homes" and excludes duplexes, townhouses and condos. Sometimes looking just at detached homes can be a more helpful or accurate view of changes in median sales prices as it removes one variable from the mix. When we're looking at market-wide changes in the median sales price the numbers can be affected by how many detached homes are selling (generally at higher prices) compared to how many attached homes are selling (usually at lower prices). Thus, I'm looking here just at the detached home sales. With all of that as context, you'll see that we saw a 12% increase in the median sales price of detached homes in Harrisonburg and Rockingham County in 2022... but thus far in 2023 we have only seen a 7% increase in the median sales price. Please note that I tried to choose my words very carefully in the latter part of my headline this month... "... Possible Slowing In Sales Price Gains" It is possible -- not certain -- that we are seeing a slowing of sales price GAINS. Sales prices are not declining, or even staying level. Prices are still rising, but they might be rising a bit more slowly now (7%) than they were last year (12%). But, yes, that's just for detached homes... because look at attached homes!?! 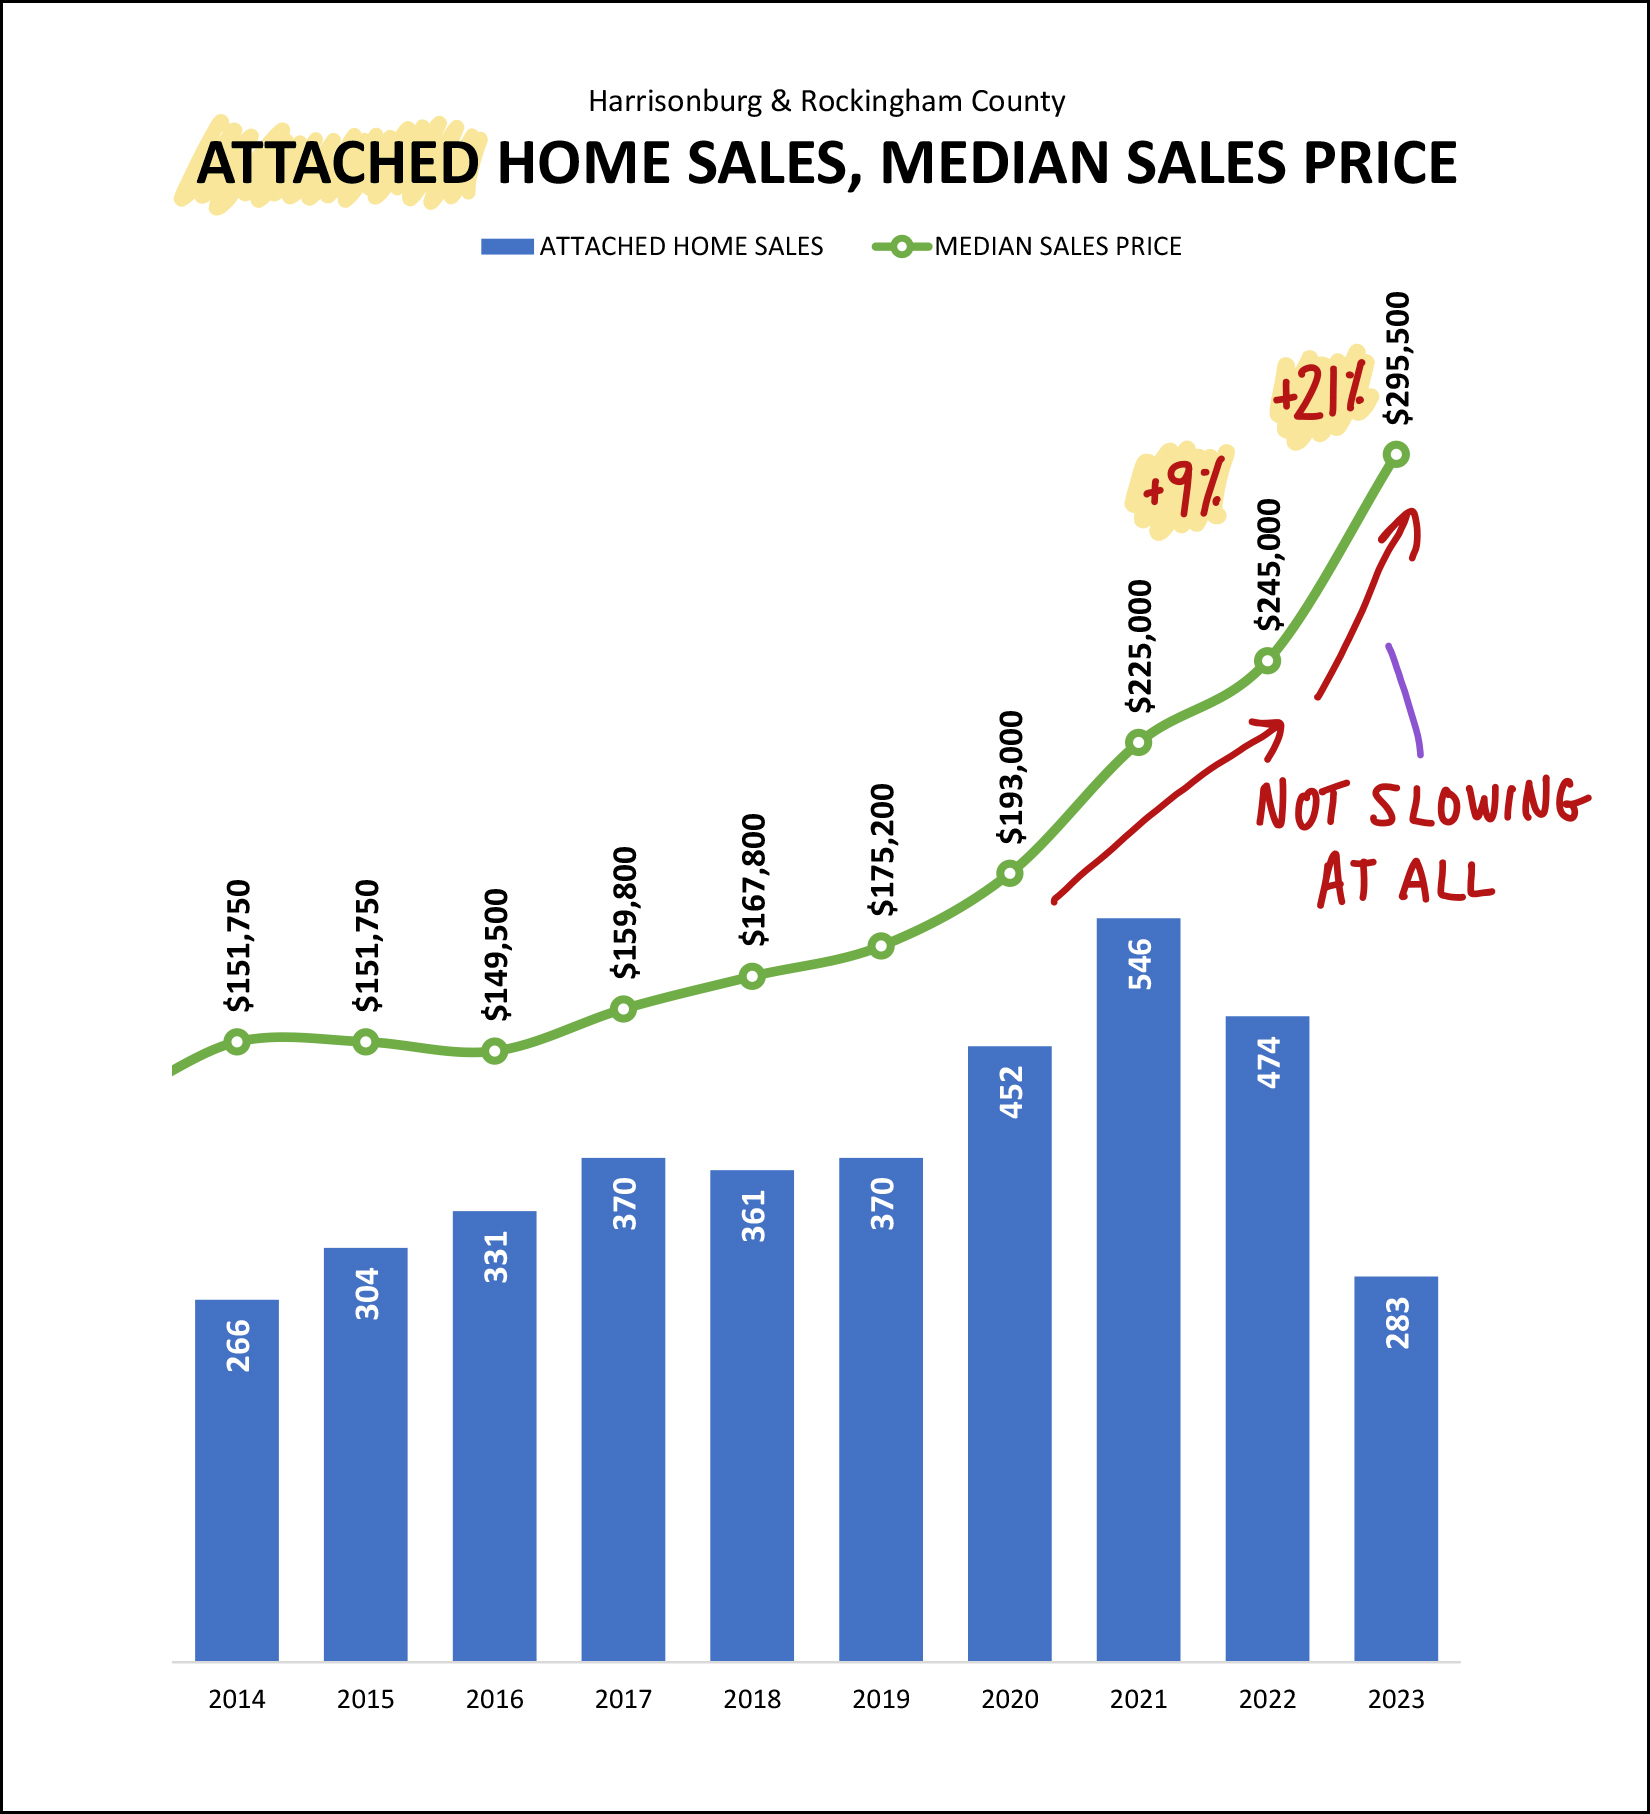 As shown above, the median sales price of attached homes is shooting upwards, quickly! After a 9% increase in the median sales price of attached homes in 2022, we are now seeing a 21% increase in 2023!?! My only theory here (thus far) is that this may be a result of more new construction (higher priced) attached homes selling this year, which might be driving the median sales price of attached homes up this quickly. I'll look into that further in the coming days. But yes, the median price of an attached home... is rising very quickly right now. Now, on to the contracts that were signed in September that might predict the home sales we'll see in October and/or November... 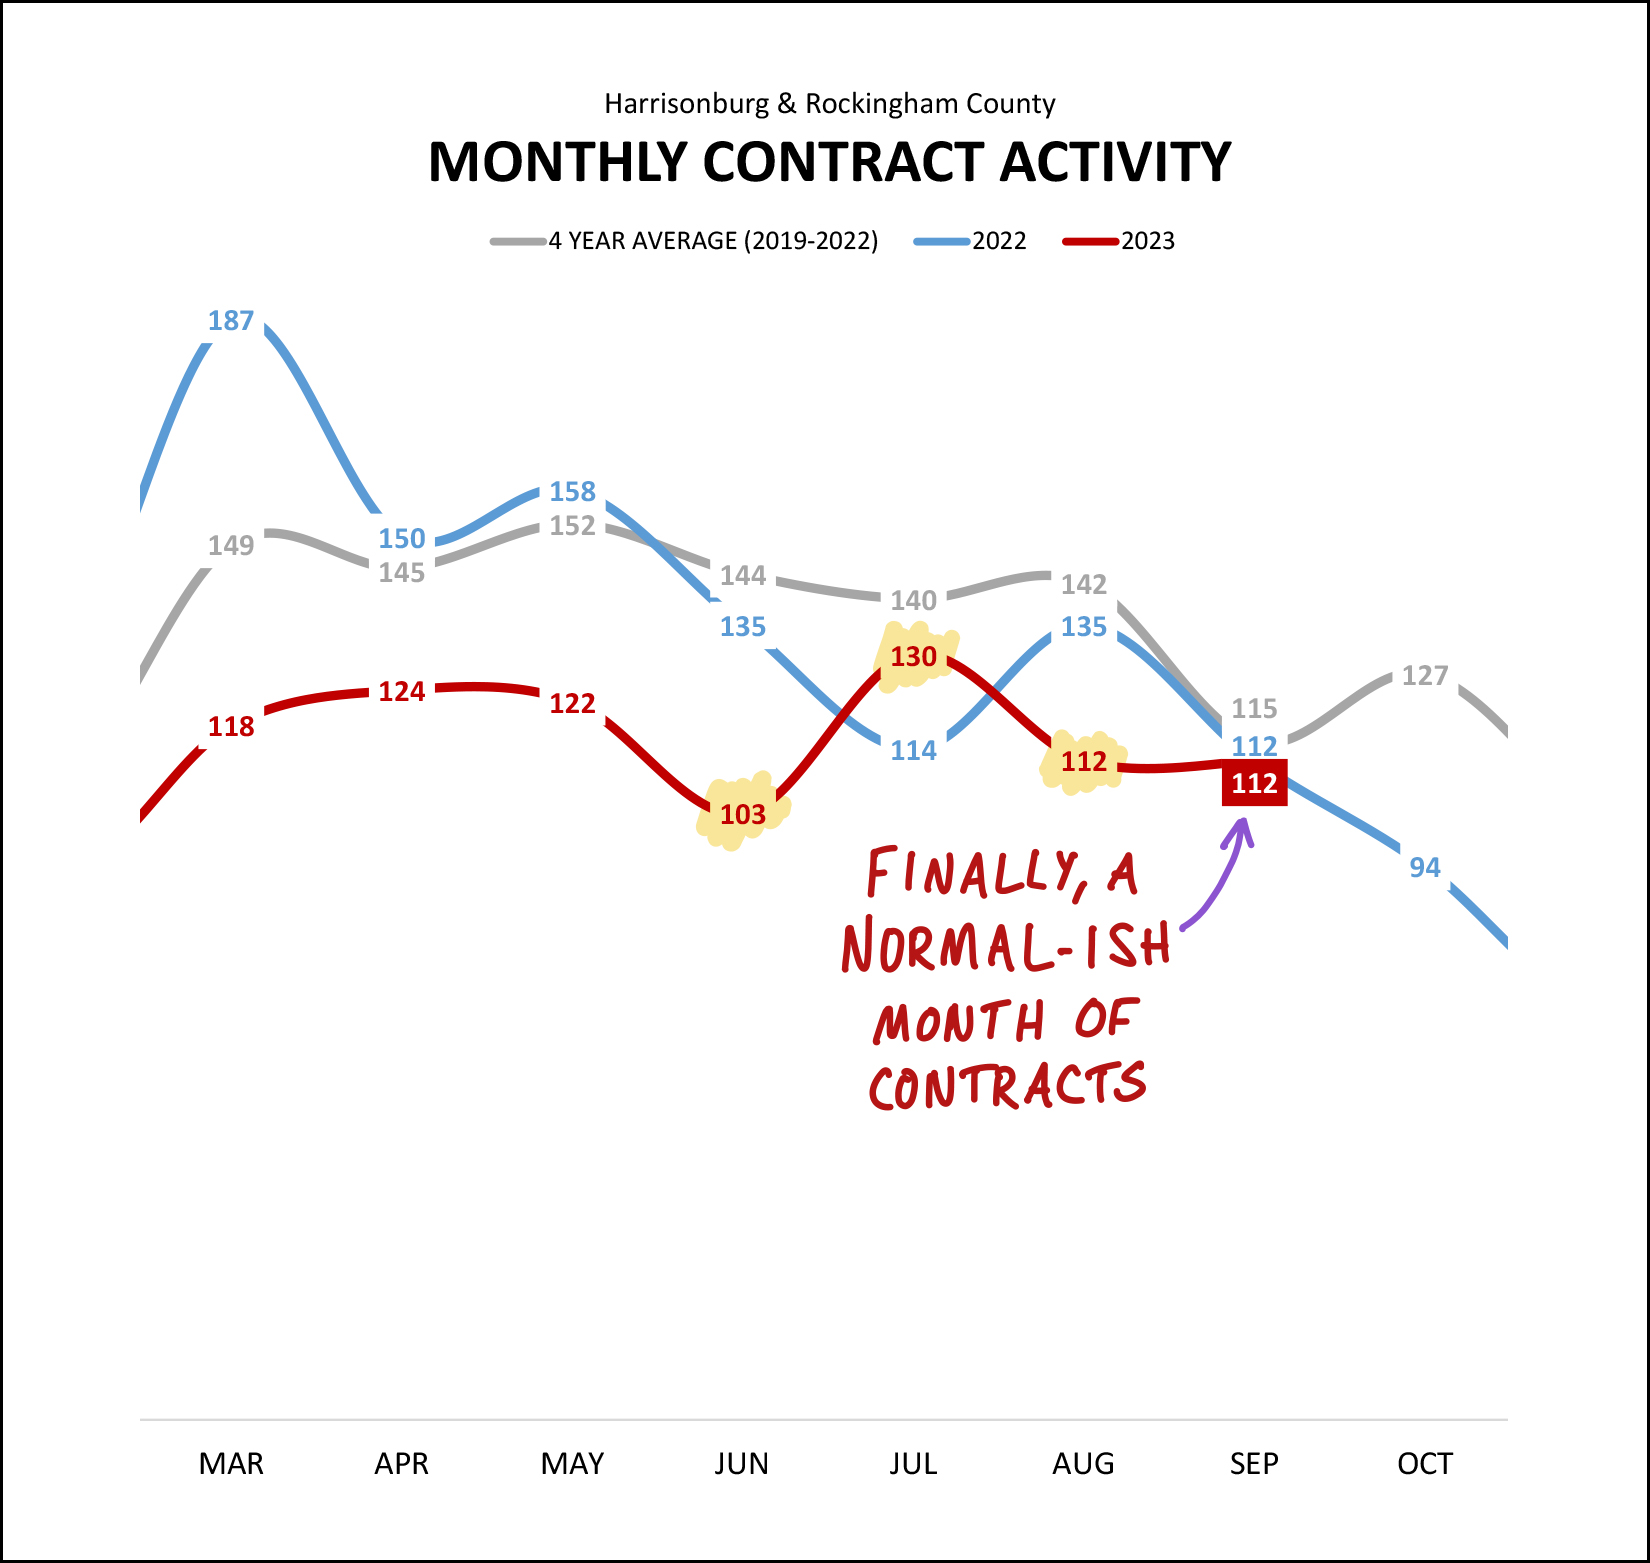 As shown above (highlighted in yellow) the rate of contracts being signed in June, July and August was a bit unpredictable. June was slower than last June. July was faster than last July. August was slower than last August. But September, it was just what we might have expected... we saw 112 contracts signed this September and 112 contracts signed last September. Now, then, the only thing I'll say looking ahead is that I expect we'll see fewer than 112 contracts signed this October and quite possibly fewer than the 94 that were signed last October. Next up, inventory levels, and as you know from the headline, they are rising... 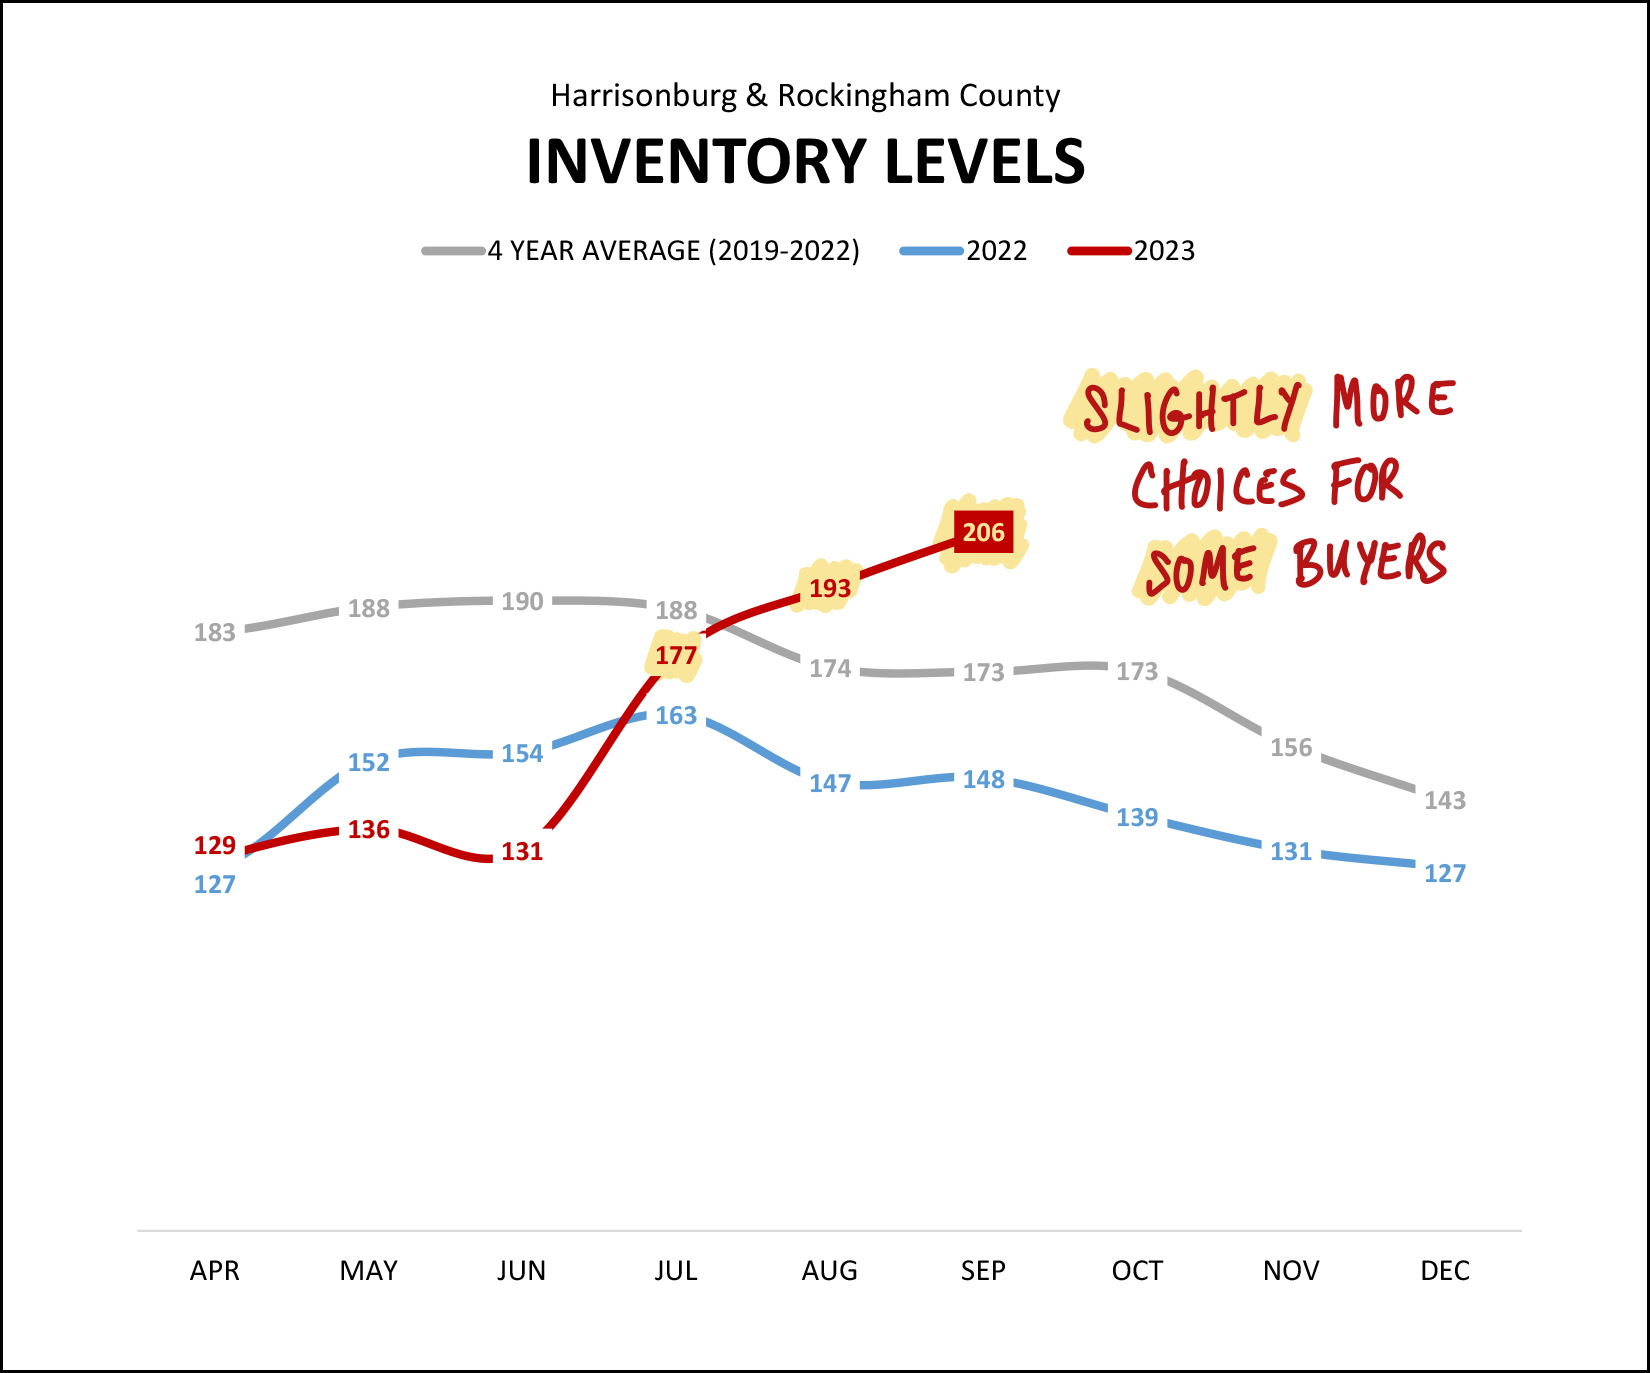 Over the past three months we have seen inventory levels rise from almost the lowest level in the past two years (131 in June 2023) to definitely and absolutely the highest level in the past two years (206 in September 2023). A few nuances to add here, though, as highlighted above... SLIGHTLY - This increase in inventory levels does put us above where we have been for the past few years (during/after Covid) but inventory levels are still well below where they were for much of the past decade. This increase in inventory levels provides slightly more choices for buyers -- not abundantly more choices for buyers. SOME - The increased inventory levels are not equally distributed across all price ranges, property types and locations. Some segments of our local market are still quite undersupplied and some are more oversupplied than others. So, some buyers have slightly more choices... but all buyers do not have slightly more choices. Now, to add a bit longer context to the recent rise in median days on market... 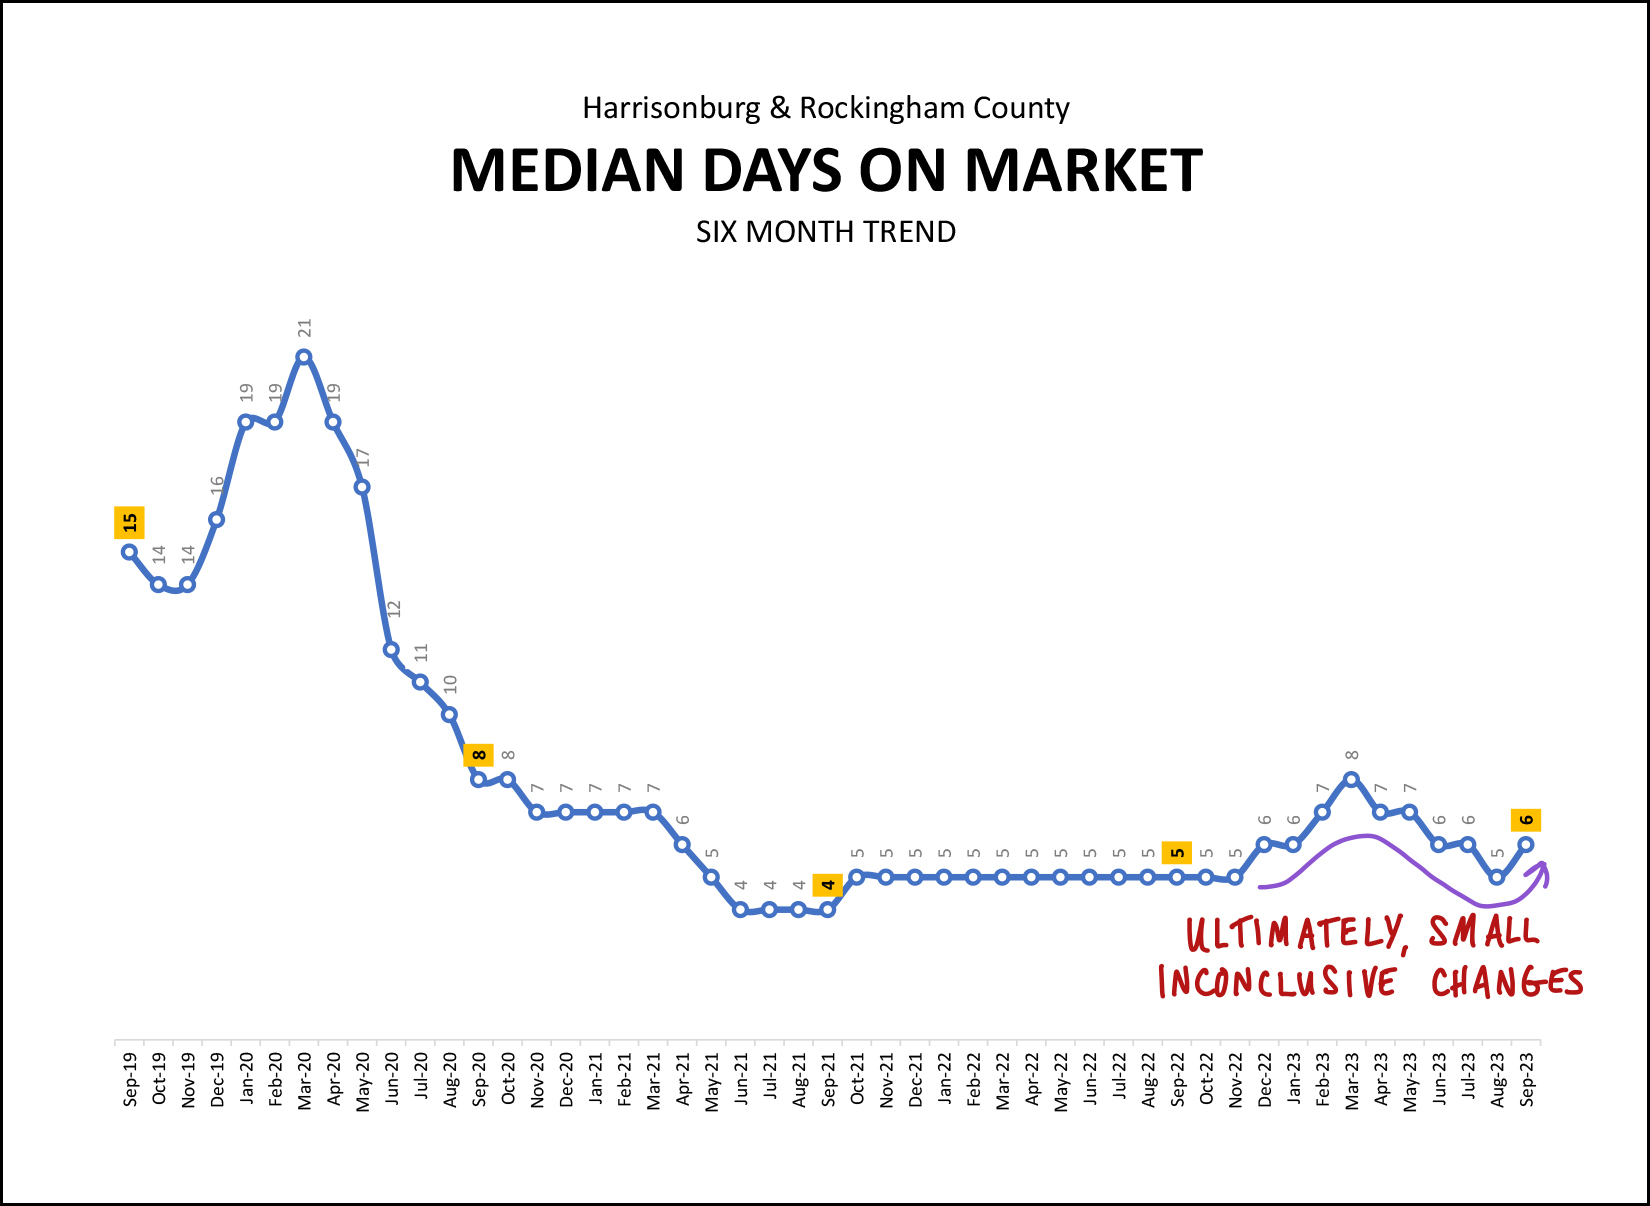 We have started to see the median days on market figure bounce around a bit in 2023... but it has remained between five days and eight days for the past year. These very small increases still keep it well below where it was in 2020 and prior. Also of note here is that while the median days on market figure is staying within that five to eight day range there are plenty of homes that are selling in fewer than five days and plenty that are selling in more (or much more) than eight days. And finally, it's time to play the blame game! :-) Why are we seeing fewer home sales right now? Why are we seeing rising inventory levels? Why might price increase gains be slowing? It's all, arguably, because of those darn mortgage interest rates... 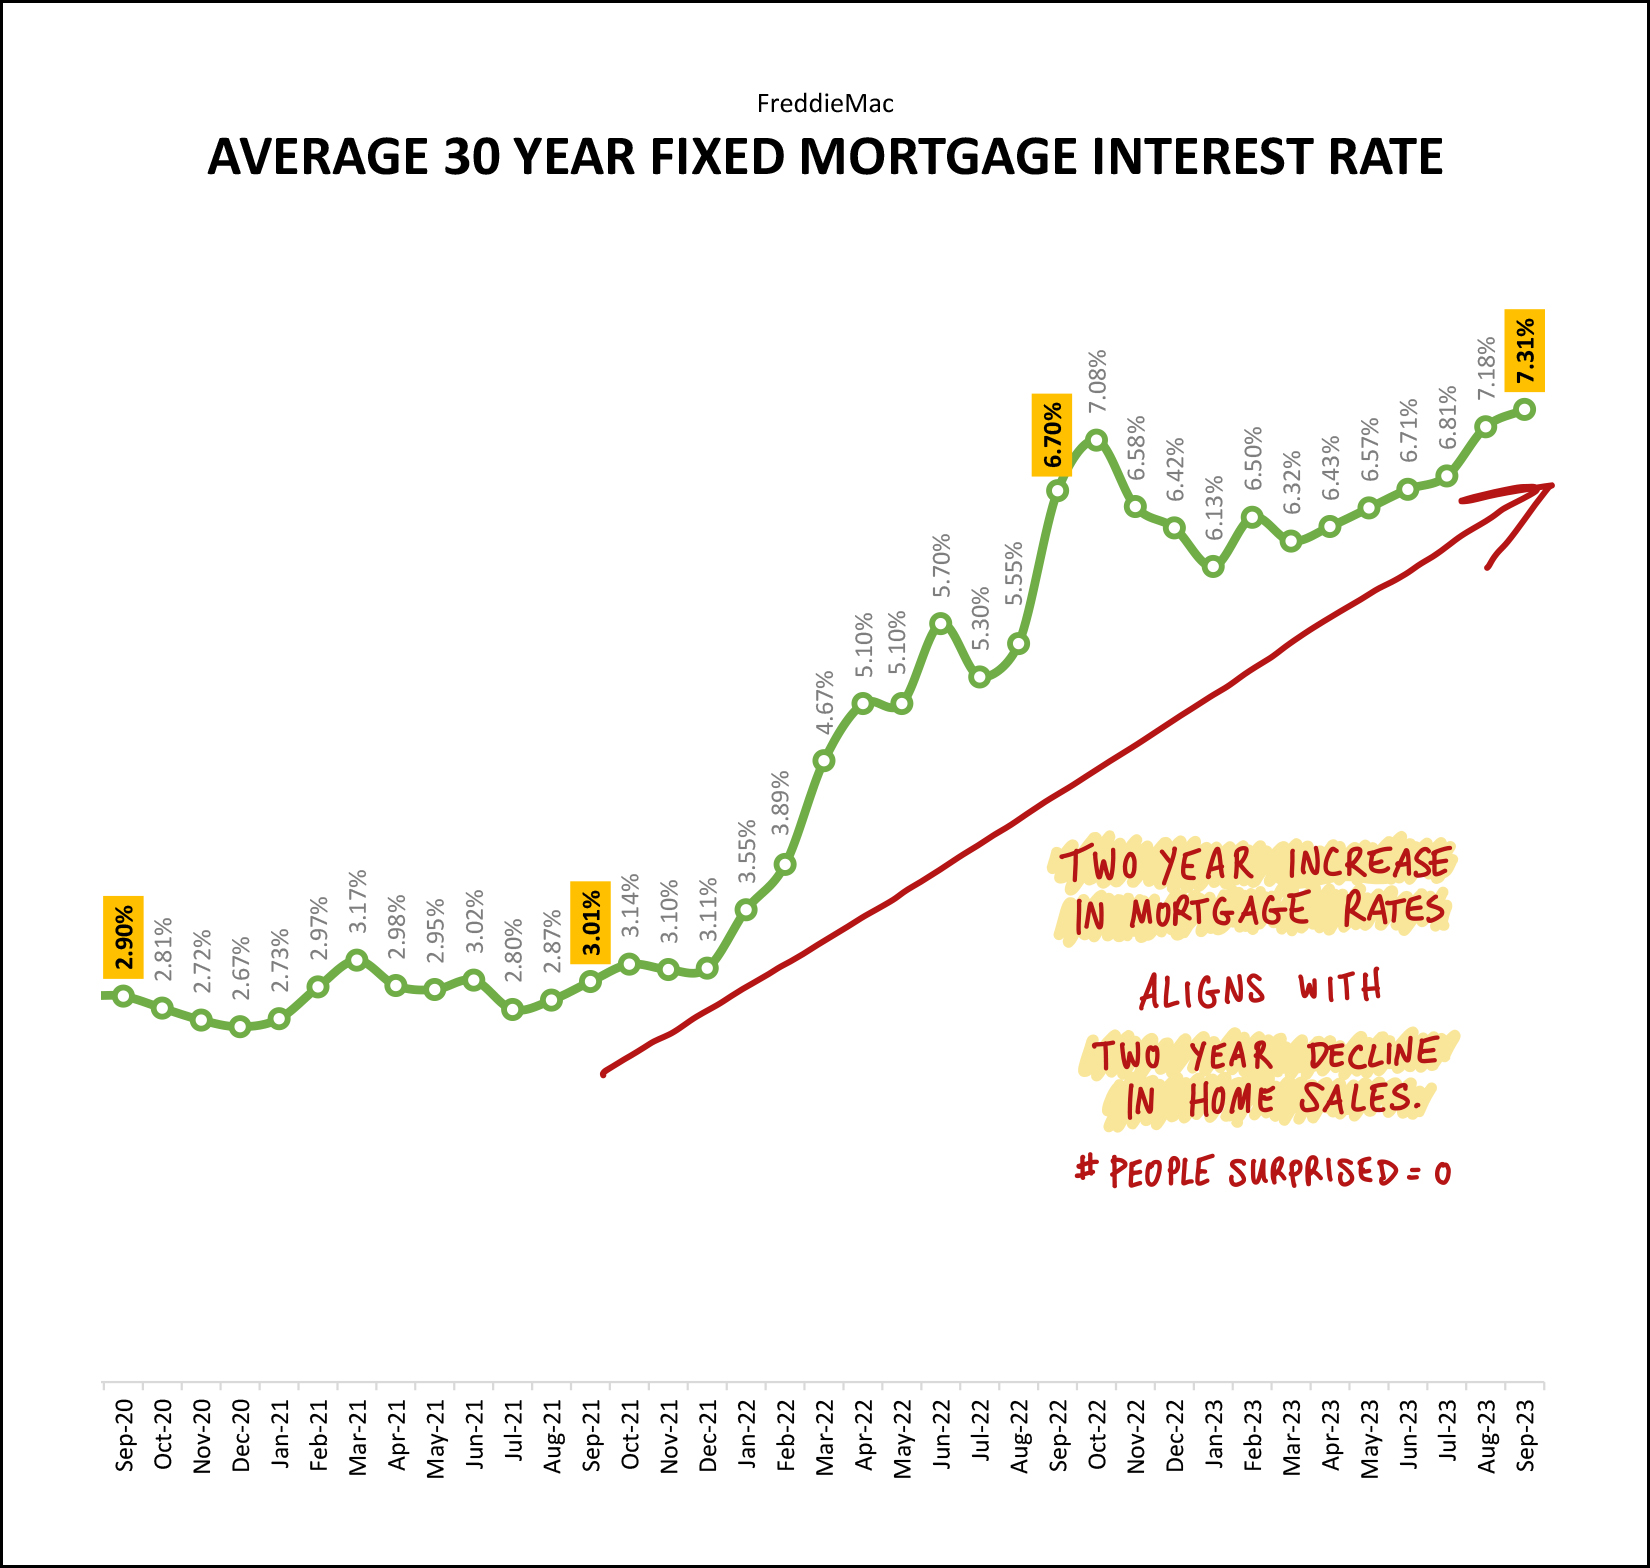 Over the past two years we have seen steadily increasing mortgage interest rates. Over the past two years we have seen steady declines in the annual rate of home sales. Coincidence? Probably not. Higher mortgage interest rates have... [1] Caused some would-be sellers to decide not to sell as they do not want to give up their low mortgage interest rate. [2] Caused some would-be buyers to decide not to buy as they can't afford (or don't want to pay) the monthly payment associated with the house they would like to buy. Where, then, will we likely see the market headed through the remainder of 2023 and into 2024? I believe we'll see... [1] Continued high mortgage interest rates, at or above 6.5%. [2] Continued declines in the annual rate of home sales, though I suspect the declines will slow. [3] Continued increases in the median sales price, though I suspect the increases will slow. [4] Sustained higher inventory levels that might continue to creep upward. So... if you plan to engage in this current real estate market as a home buyer or a home seller... BUYERS - You might see a few more choices of homes to purchase at any given time over the next few months. Your monthly housing costs will likely still be high given continued high interest rates. Waiting a year probably won't result in a lower monthly payment as rates likely won't drop considerably and prices don't seem likely to drop. SELLERS - Prices are still high, and rising, but those prices convert into an ever higher monthly housing cost for buyers. As such, you'll likely have fewer showings on your house and fewer offers. Prepare your house well, price it appropriately, market it thoroughly, and bear in mind that you might have to negotiate on price and terms with a buyer depending on your home's price range, property type, location, etc. If you're thinking about buying or thinking about selling but don't know what to think... feel free to reach out. I'm always happy to talk things through with you to try to help you clarify your goals and priorities and to figure out if now is the right time to make a move. You can reach me most easily at 540-578-0102 (call/text) or by email here. | |
Fewer Homes Are Selling, Though Prices Keep Rising, And Now Inventory Levels Are Rising Too!? |
|
 Happy Thursday morning, friends in and around Harrisonburg and beyond! After I process all the data... and create all of the charts and graphs... and doodle on them to notate trends... I then go back and review it all again in order to write the headline of my monthly market report. As it turns out, this month's headline ended up being pretty similar to last month. Fewer home sales... higher sales prices... but also... higher inventory levels. We are definitely seeing some shifts in our local market, though it is not yet clear how significant of an impact those changes will have. But we'll get to all of that real estate data... First, whether you are a teacher, a student, a professor, a school administrator, a staff member at a local college, or a parent, I hope your school year has had a great start. On our end, Luke has started his first semester of classes at Wake Forest and Emily is a few weeks into 10th grade. It has been a fun but busy start to the year, and we're looking forward to visiting with Luke at WFU Family Weekend soon! Secondly, a few listings of potential interest to you... 9926 Goods Mill Road - A modern farmette on 3.3 acres with awesome mountain views in the Spotswood High School district for $575,000. 3986 Dixie Ridge Road - A spacious four (or five) bedroom home with the primary bedroom suite on the main level for $475,000. 3211 Charleston Boulevard - A like-new, upscale townhouse in Preston Lake with a two-car garage with access to many community amenities for $375,000 Congers Creek Townhomes - Three-level, new construction townhomes across Boyers Road from Sentara RMH Medical Center for $306,900 and up. And thirdly, each month I offer a giveaway, of sorts, for readers of this market report, highlighting some of my favorite places, things or events in Harrisonburg. Recent highlights have included Merge Coffee, Jimmy Madison's and Red Wing Roots tickets. This month I am giving away a $50 gift certificate to a delicious local restaurant, Taste of Thai. I'm writing this report on Wednesday evening... you'll get it Thursday morning... and my writing this evening is powered by one of my go to dishes at Taste of Thai... Massaman Curry. Are you a fan of Taste of Thai as well? Click here to enter to win a $50 gift certificate! And now... on to the data, and charts and graphs... 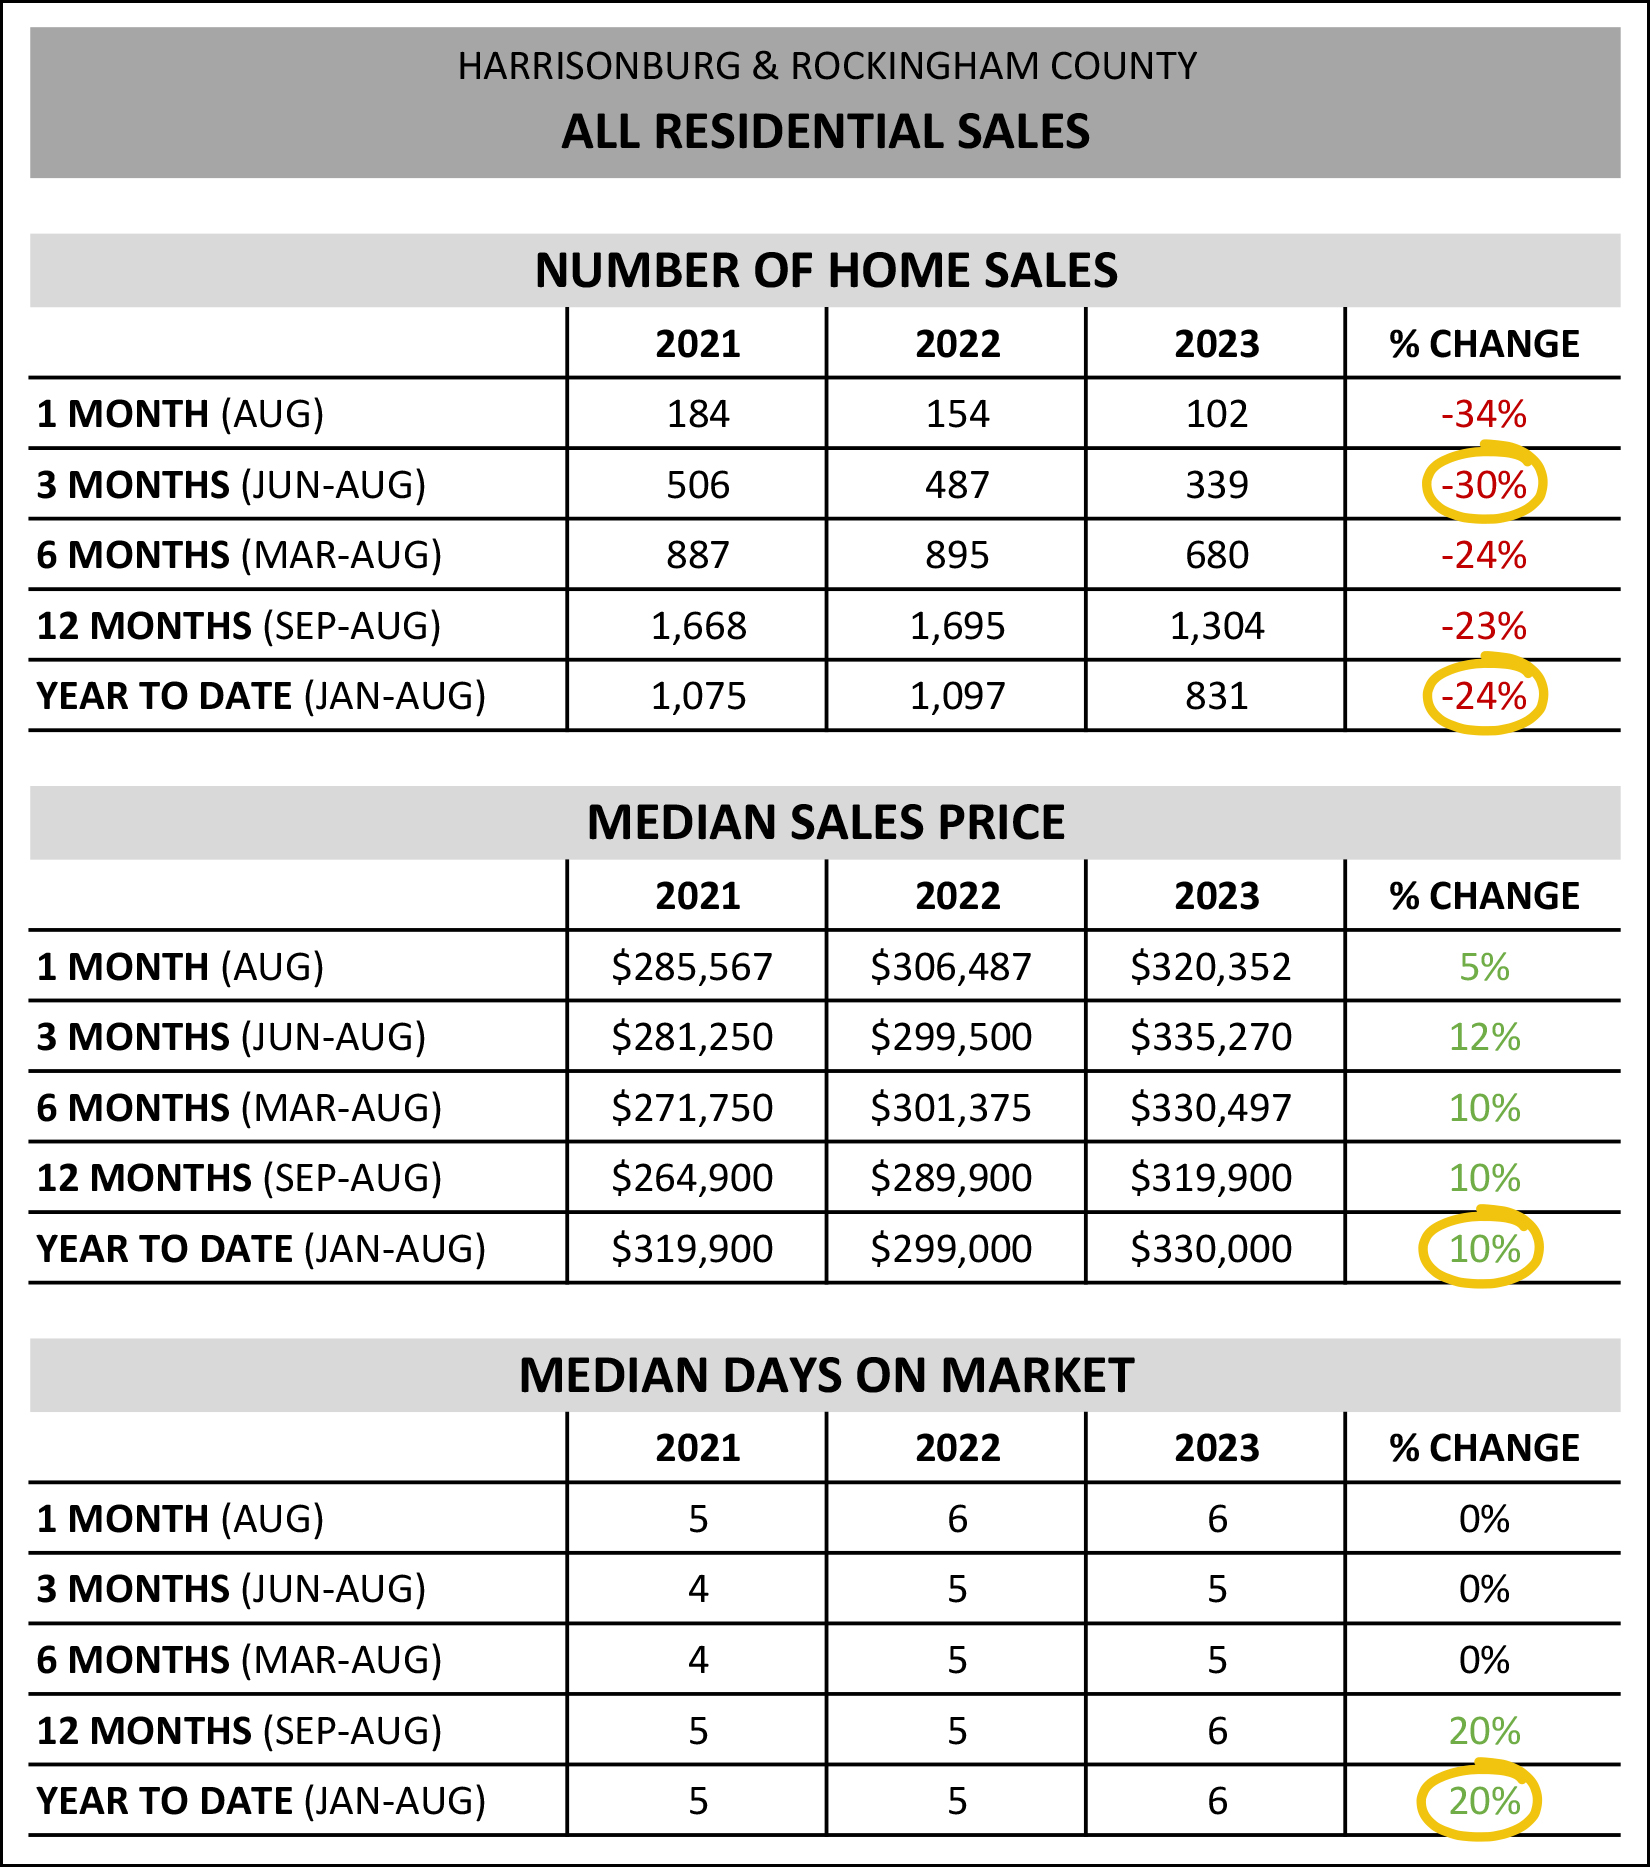 This first data table above shows much of what we've seen for the past year or so now... [1] We're seeing fewer home sales now than we were a year ago. In the first eight months of this year (Jan-Aug) we've seen 24% fewer home sales than in 2022. If we look only at the summer months (Jun-Aug) we see a slightly larger 30% drop in the number of homes selling. [2] The median sales price continues to rise... it's up 10% in the first eight months of this year (Jan-Aug) as compared to the same timeframe in 2022. [3] Homes are still going under contract rather quickly with a median days on market of six days, which is just a smidge ahead of last year's median of five days. As alluded to above, the summer months were a good bit slower this year than last... 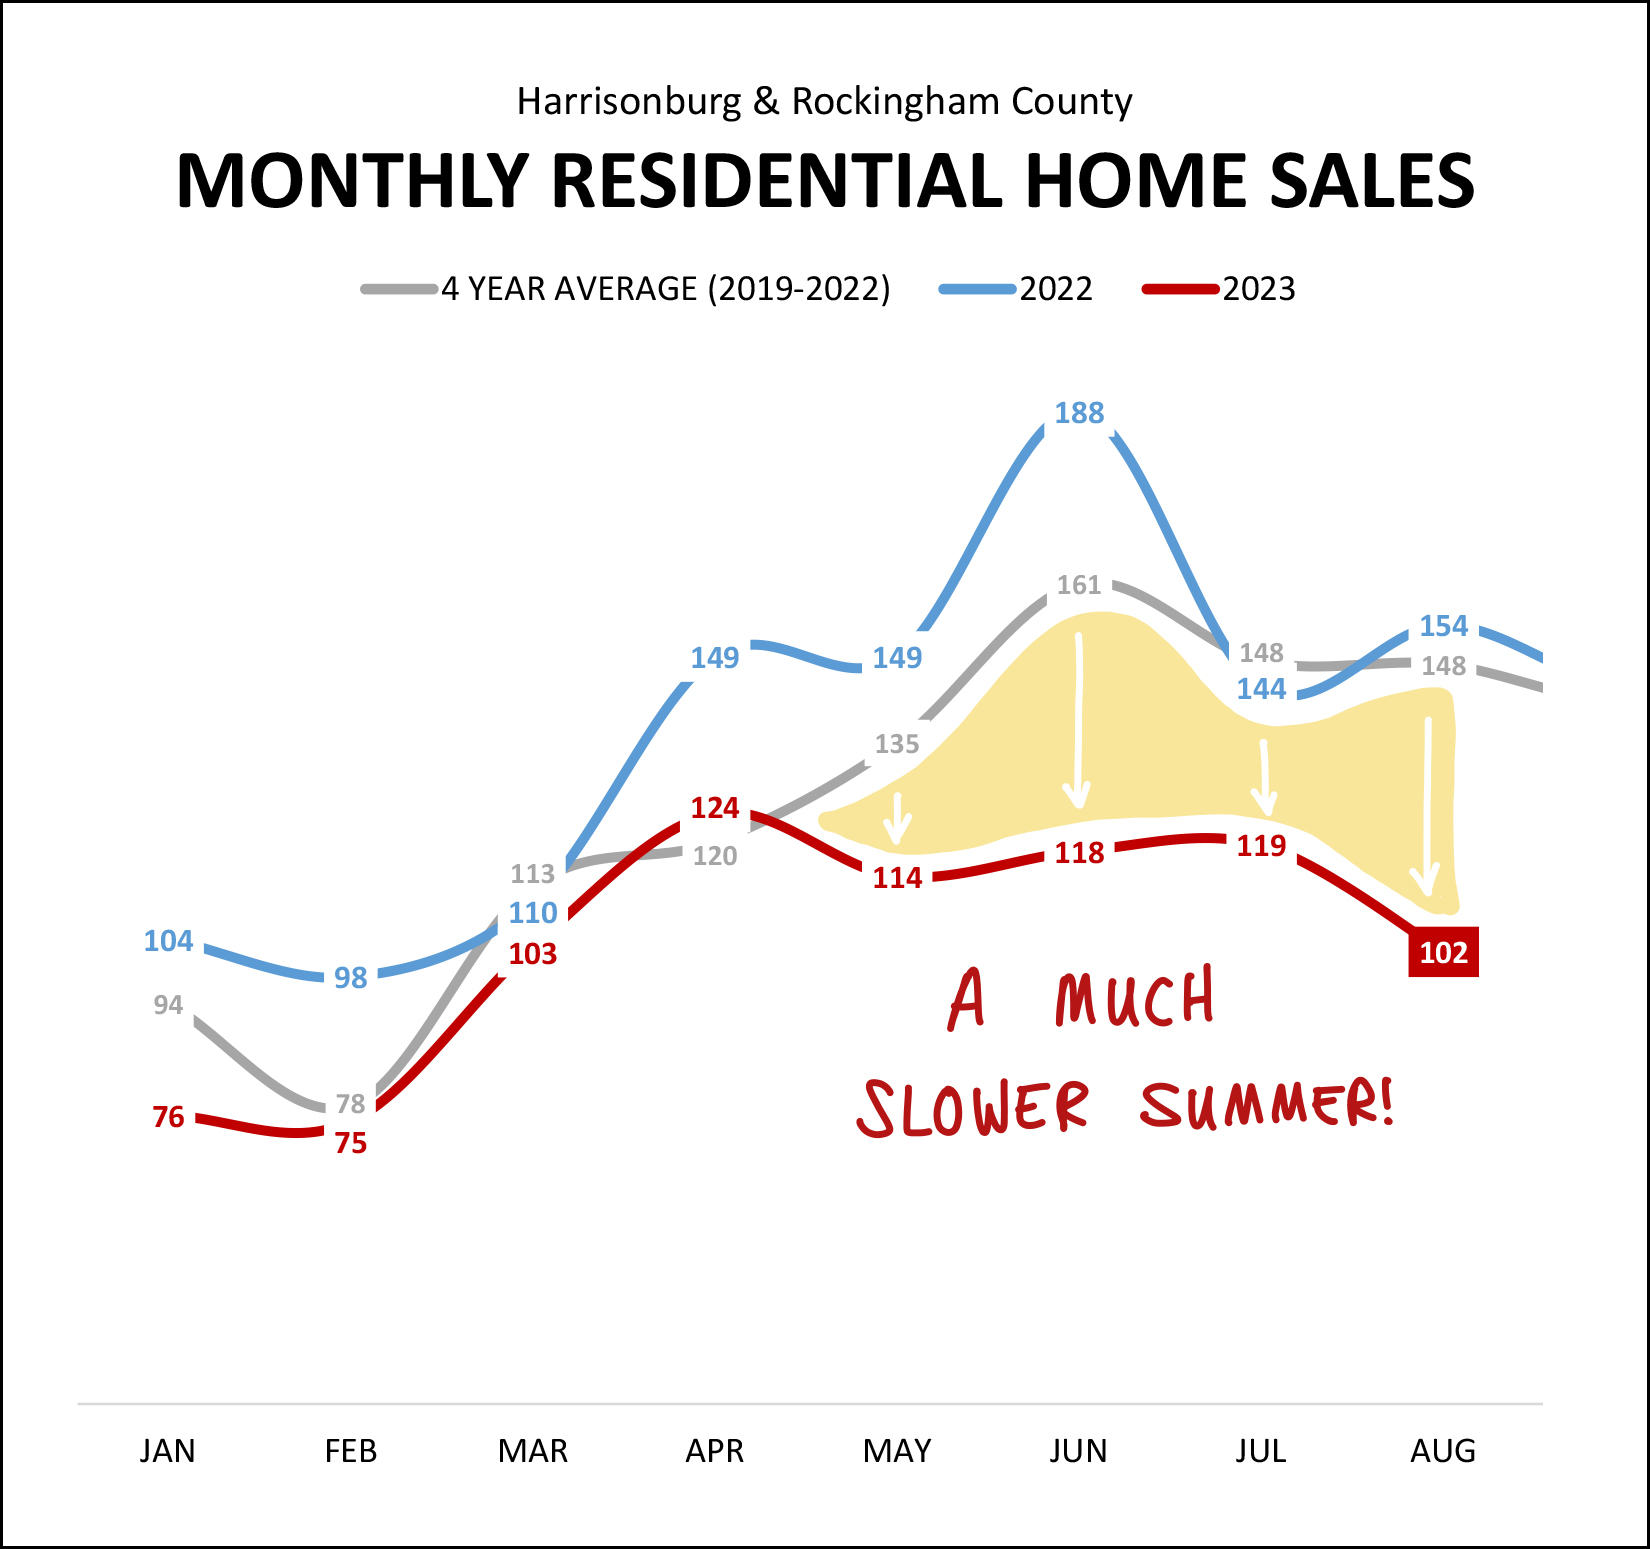 The three lines shown above are as follows... Red = This Year Blue = Last Year Grey = Average of Past Four Years As such, home sales in the summer (+/-) of 2023 were well below the average of the past few years, and even farther below last summer. We saw 102 home sales in August 2023... which is slightly less than we saw in... January 2022. That's actually sort of surprising... a summer month that we would expect to be rather active was slower than a winter month that we would expect to be rather slow. High mortgage interest rates -- we'll get to those below -- likely play a significant role in slowing down the number of homes that are being sold and purchased these days. Now, putting the lower and lower number of home sales in context... 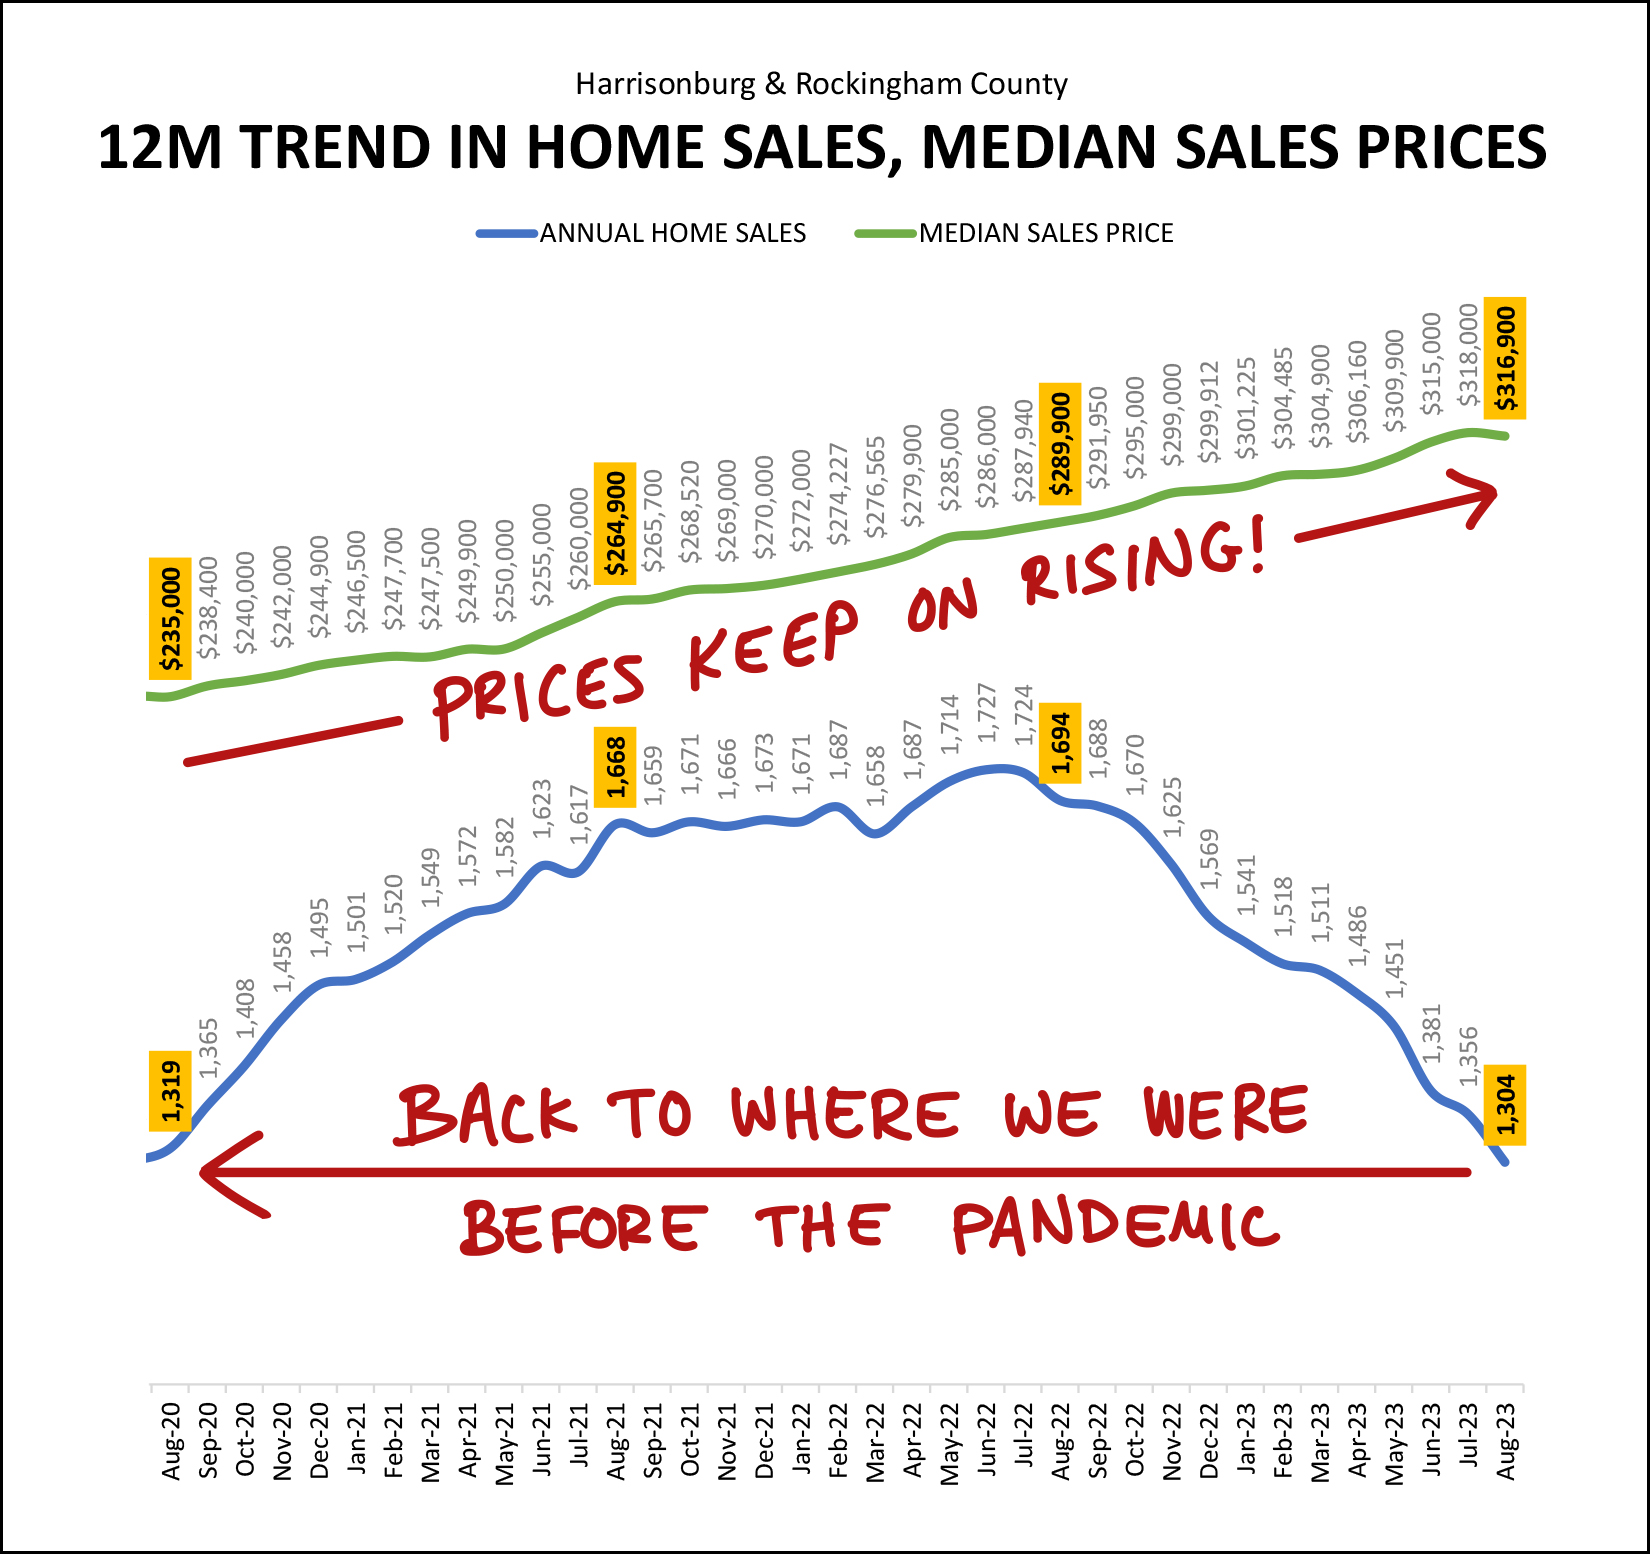 We have seen the number of home sales in a 12 month period drop from about 1700 home sales (summer 2021 through summer 2022) down to only 1300 home sales. But... looking back a bit further, this just takes us back to... where things were at the start of or just before the pandemic. So... yes, we're seeing significantly fewer home sales right now... compared to the significantly higher number of home sales seen in 2020, 2021 and 2022... which were likely high points fueled by low mortgage interest rates and lots of buyers rethinking what they needed in a home during the pandemic and thereafter. And yes, despite the rapid increase (1300 to 1700) and then rapid decrease (1700 to 1300) in home sales, we've seen home prices steadily march on along, upward, during the entirety of the past three years. Looking back a bit further than three years puts the change in median sales price in an even wilder context... 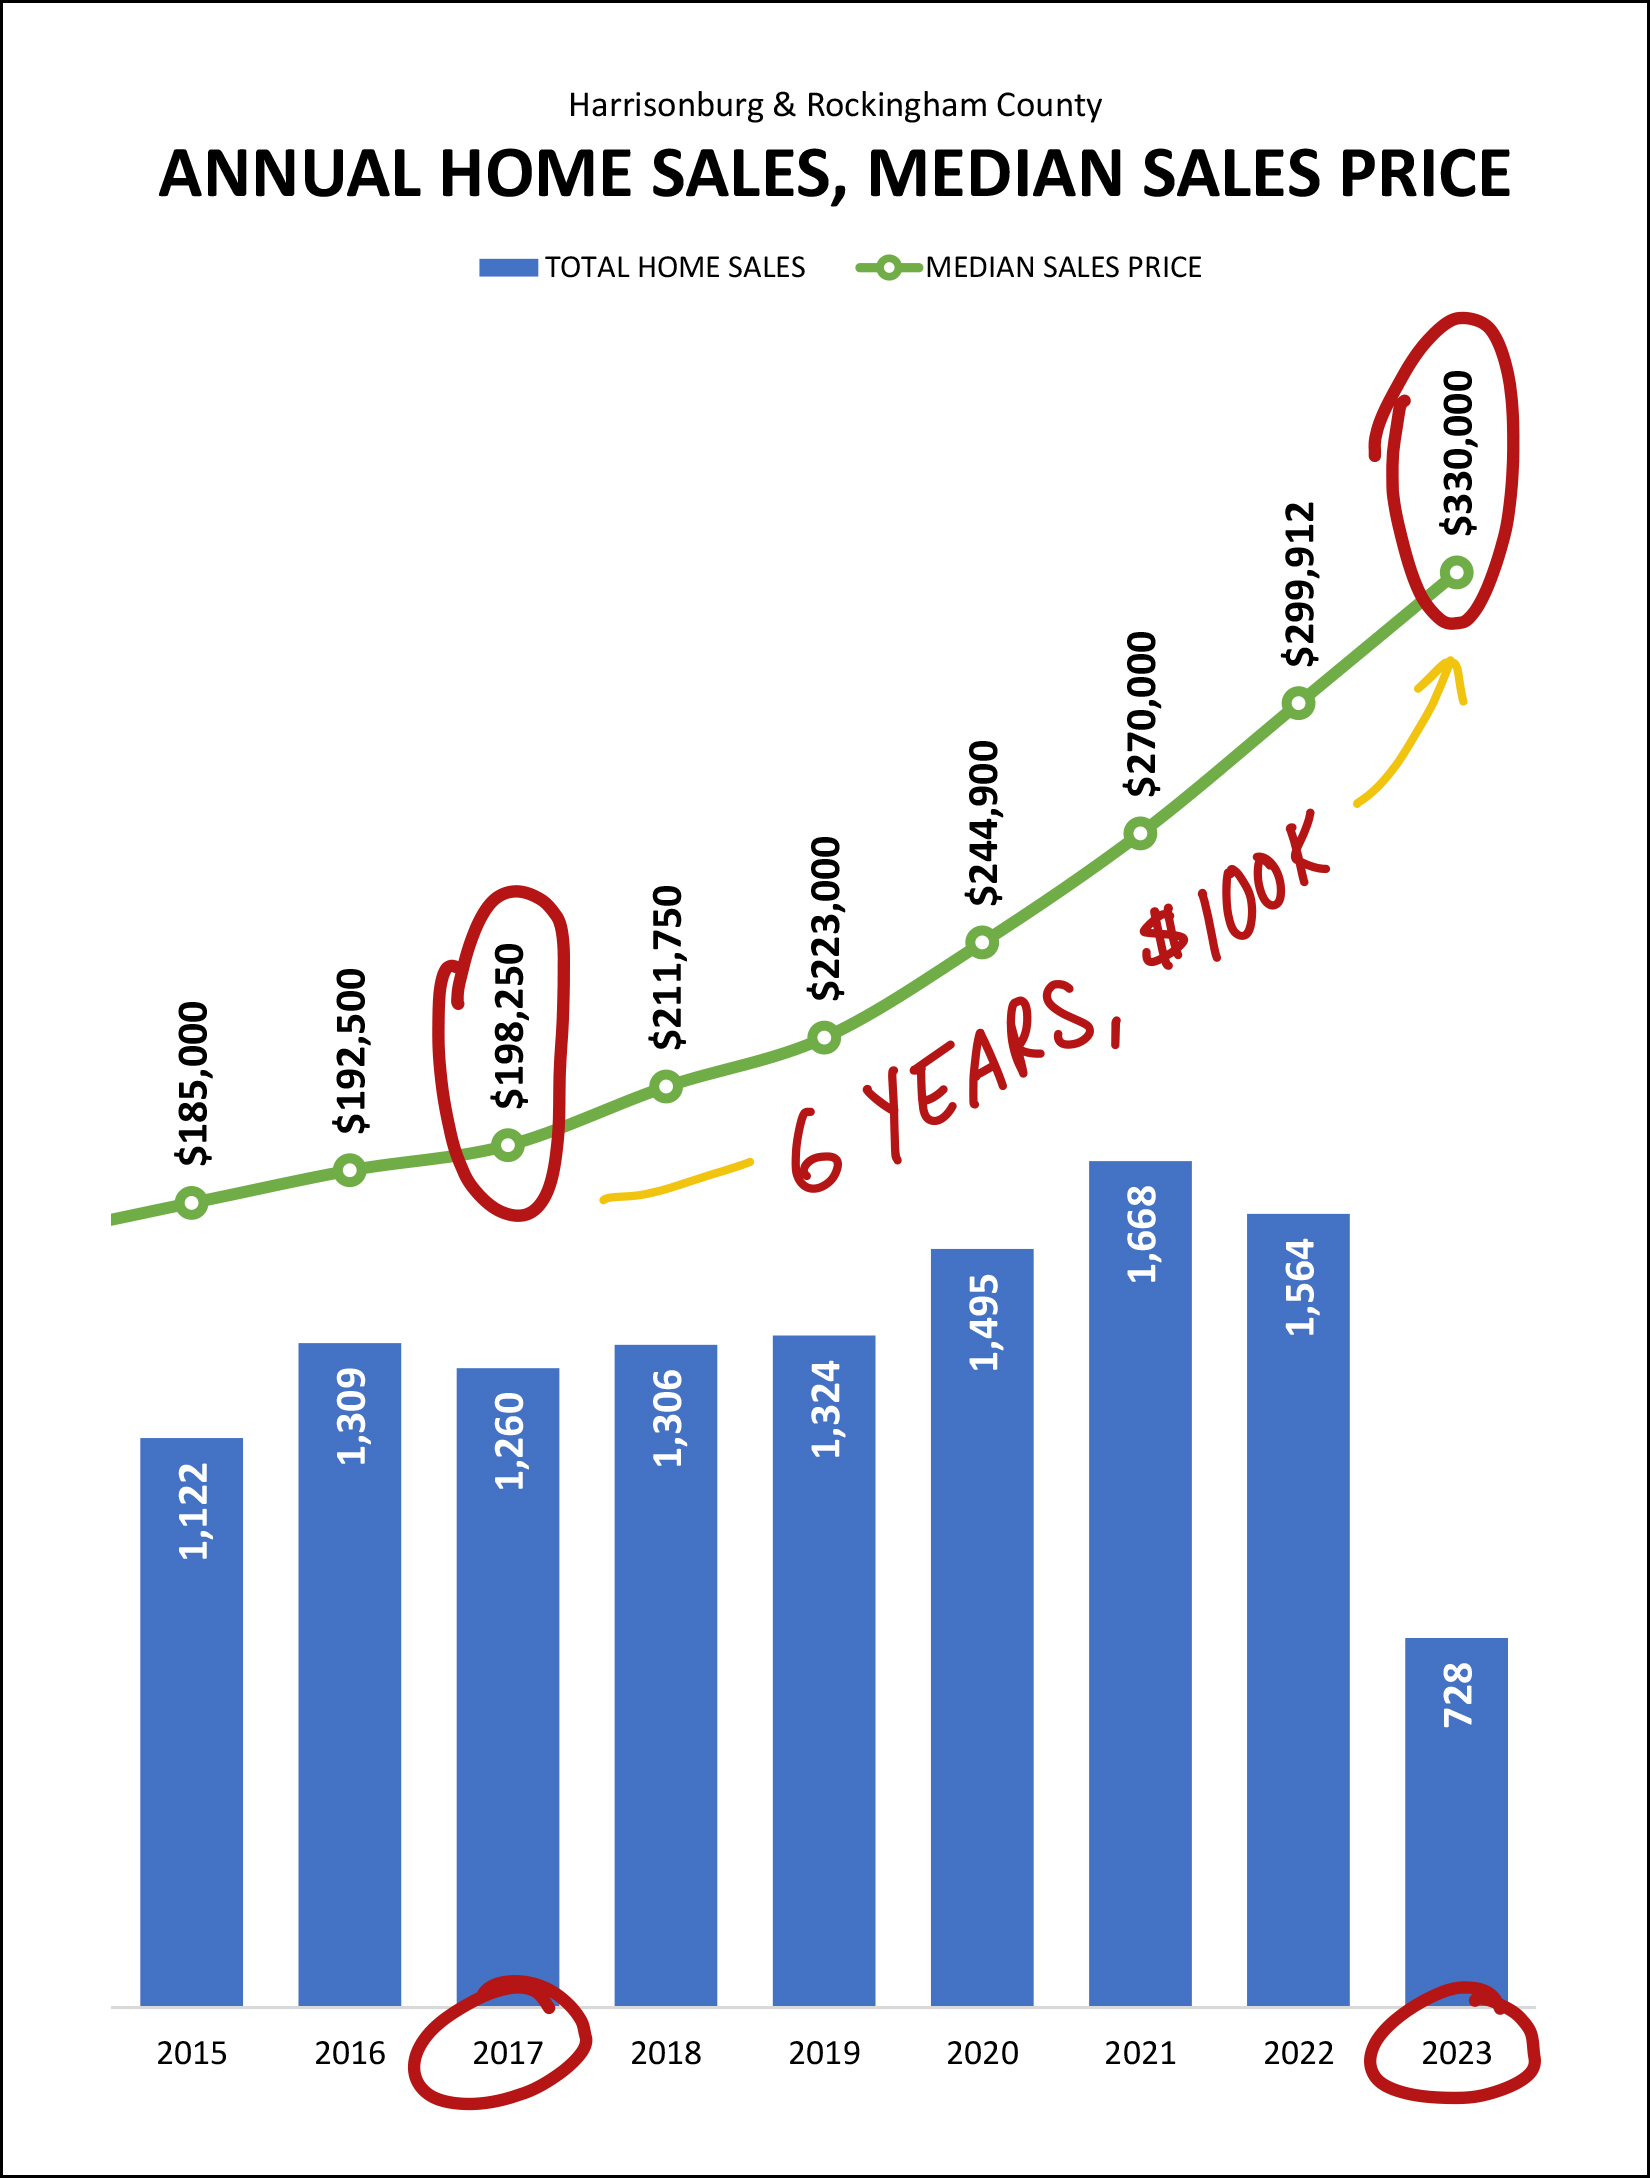 Not too long ago (2017) the median sales price in Harrisonburg Rockingham County was just below $200K. This year (2023) that median sales price is now above $300K. That $100K(+) jump over the course of six years has significantly changed what it looks like to be a first time buyer (or a move up buyer) in our local market. Certainly, the higher mortgage interest rates we have seen in 2023 (and 2022) haven't helped either. The combination of higher sales prices and much higher mortgage interest rates have resulted in much, much higher housing payments for buyers in today's market. Looking for a trend that is heading in two different directions at once? Here's one... 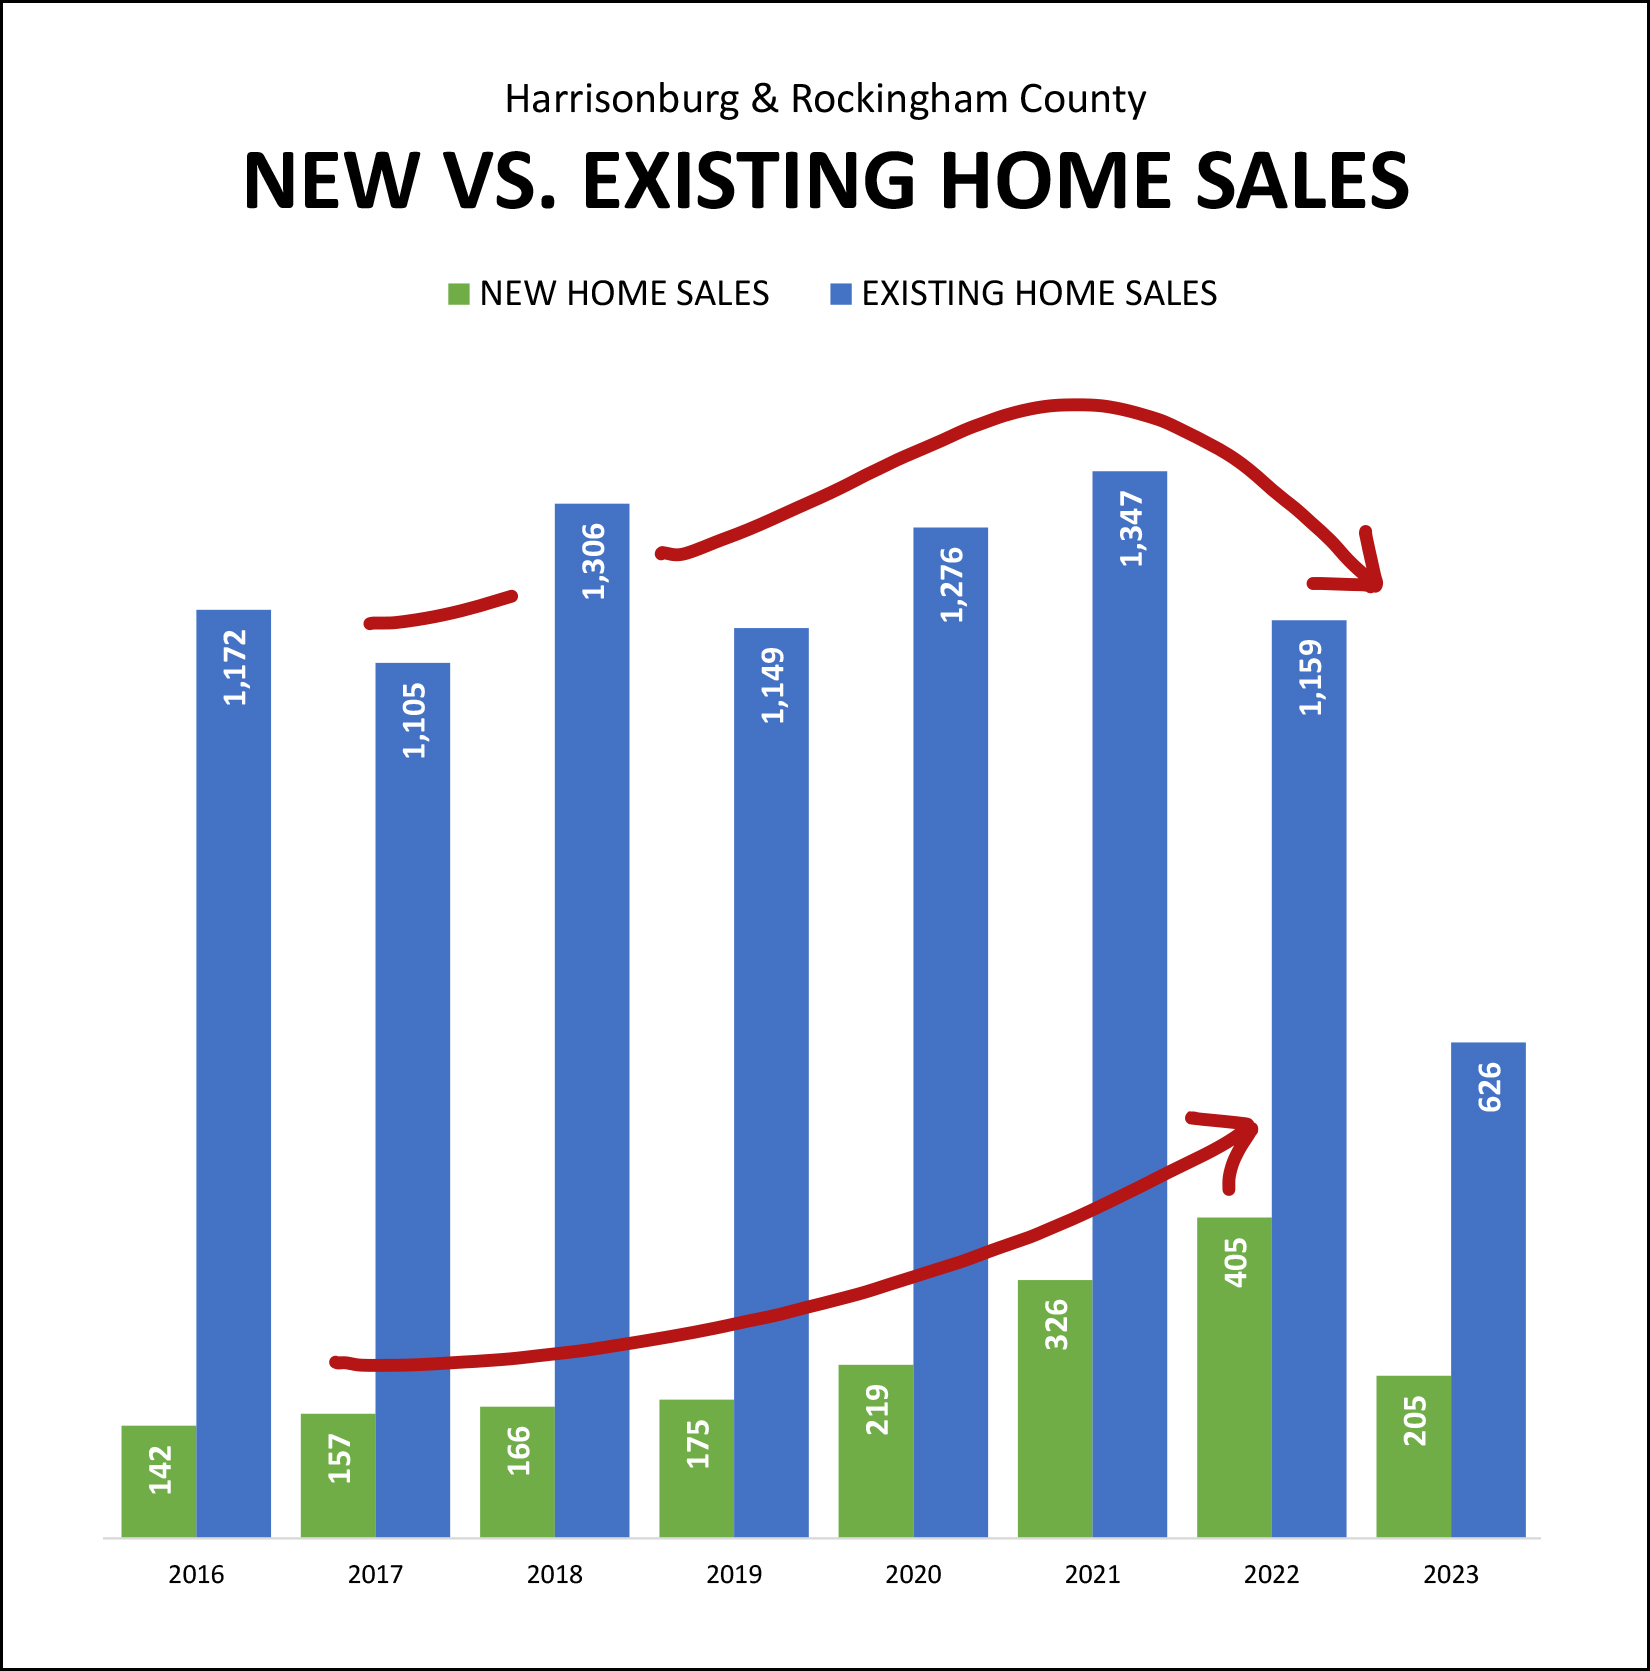 We are currently seeing a downturn (blue bars) in the number of existing homes selling in Harrisonburg and Rockingham County... while at the same time seeing an increase (green bars) in the number of new homes selling in our market. Higher mortgage interest rates are causing many homeowners to have no interest in selling... which is resulting in fewer existing homes being on the market for sale. Thankfully, there are builders helping to add housing stock in our area, resulting in more new homes selling over the past few years. Shifting gears a bit to the here and now... the freshest data to watch for the most recent trends is contract activity... 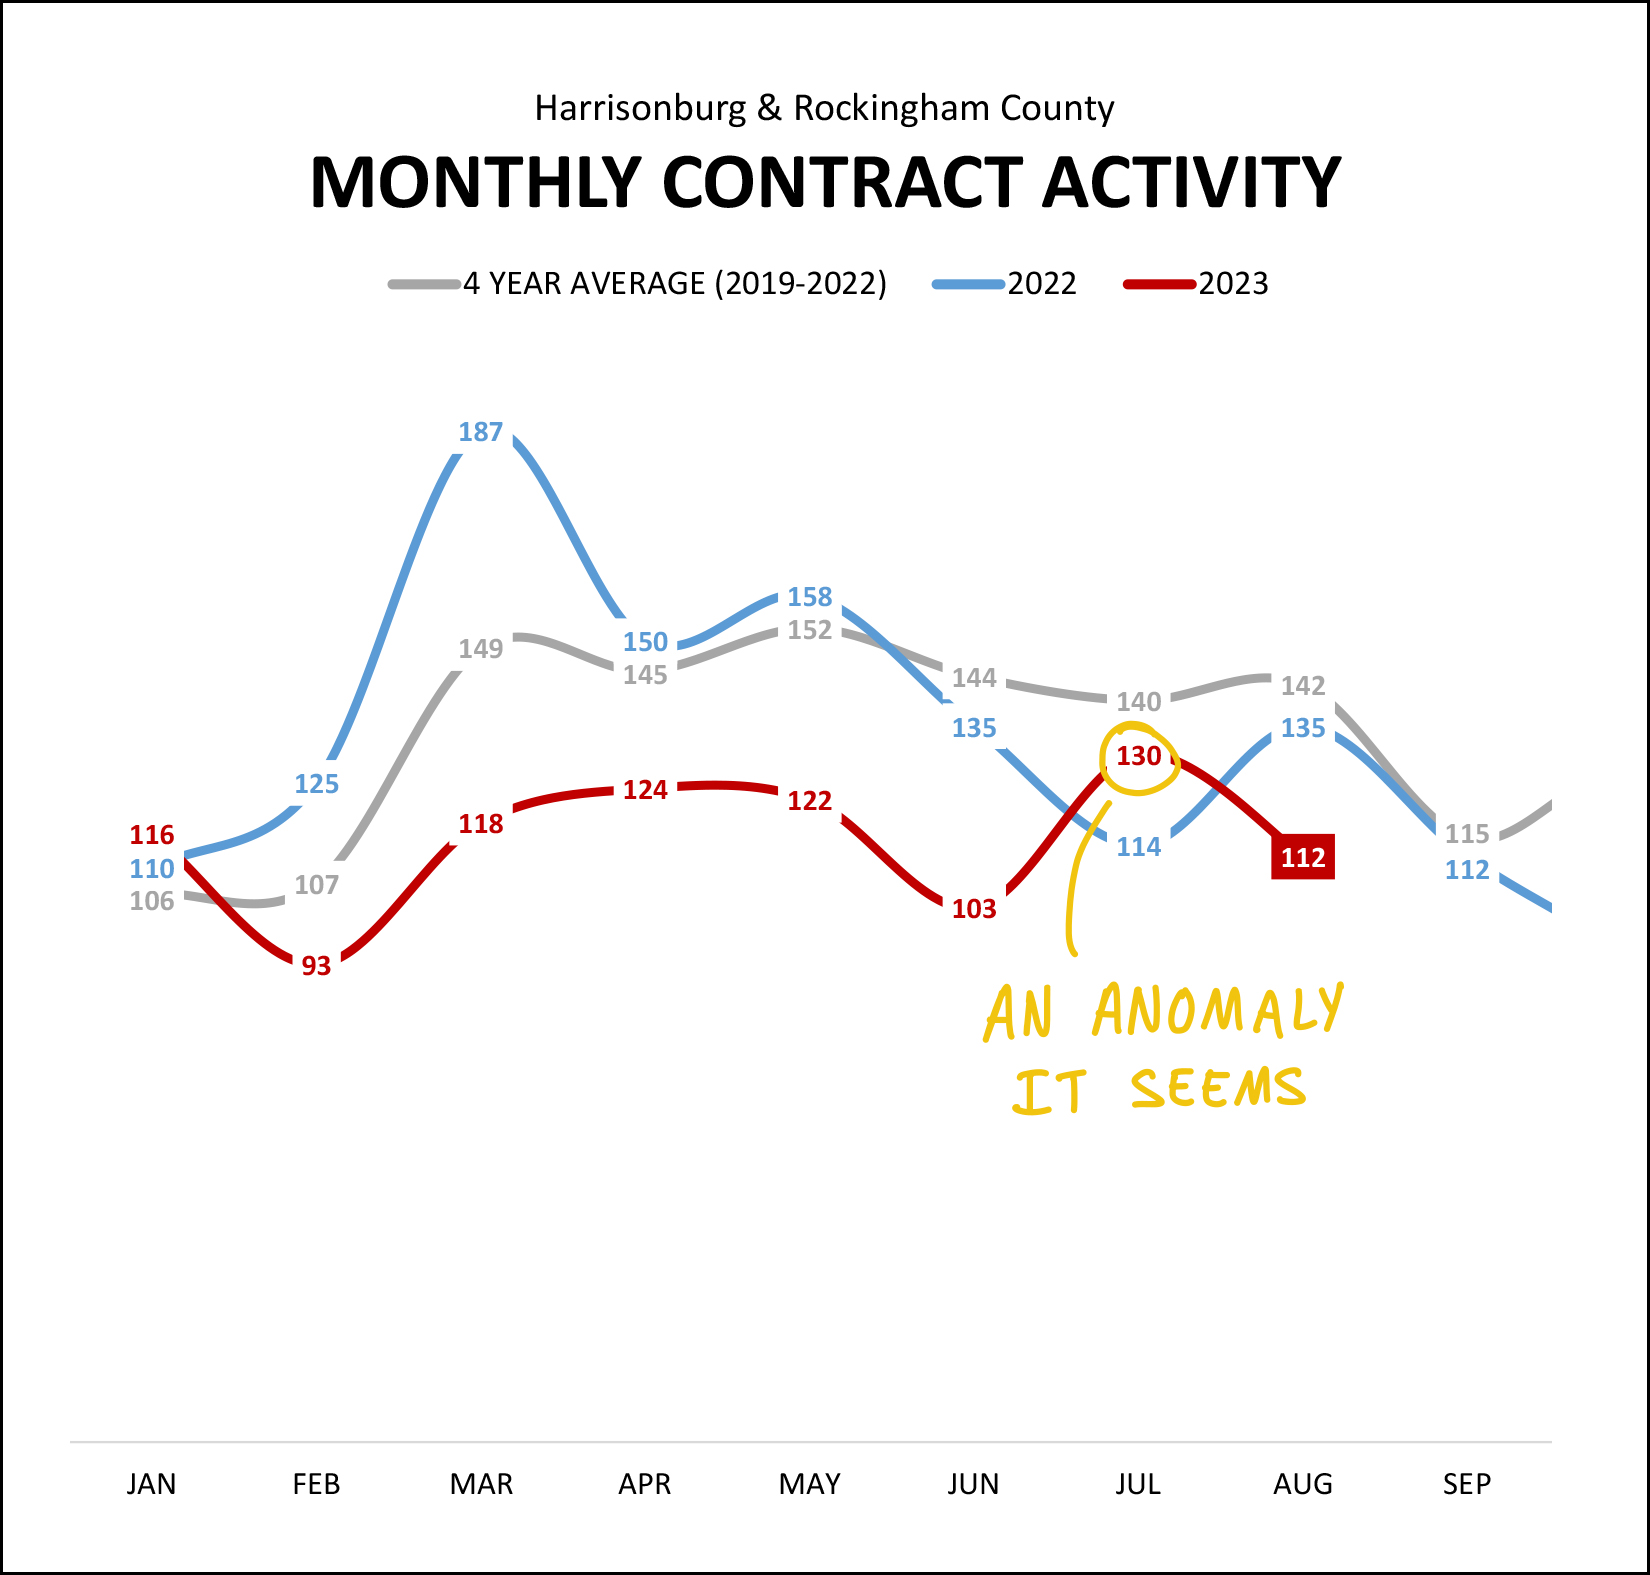 Last month we saw an increase in contract activity... with 130 homes going under contract, compared to only 114 in the same month last year. It seemed that maybe we would see a sustained surge of buyer activity. But... maybe not. With only 112 contracts signed in August 2023, it seems that the surge of contract activity in July 2023 was an anomaly, and we will still see smaller numbers of contracts being signed in 2023. Darn. And here's the most interesting graph of them all, in my opinion... 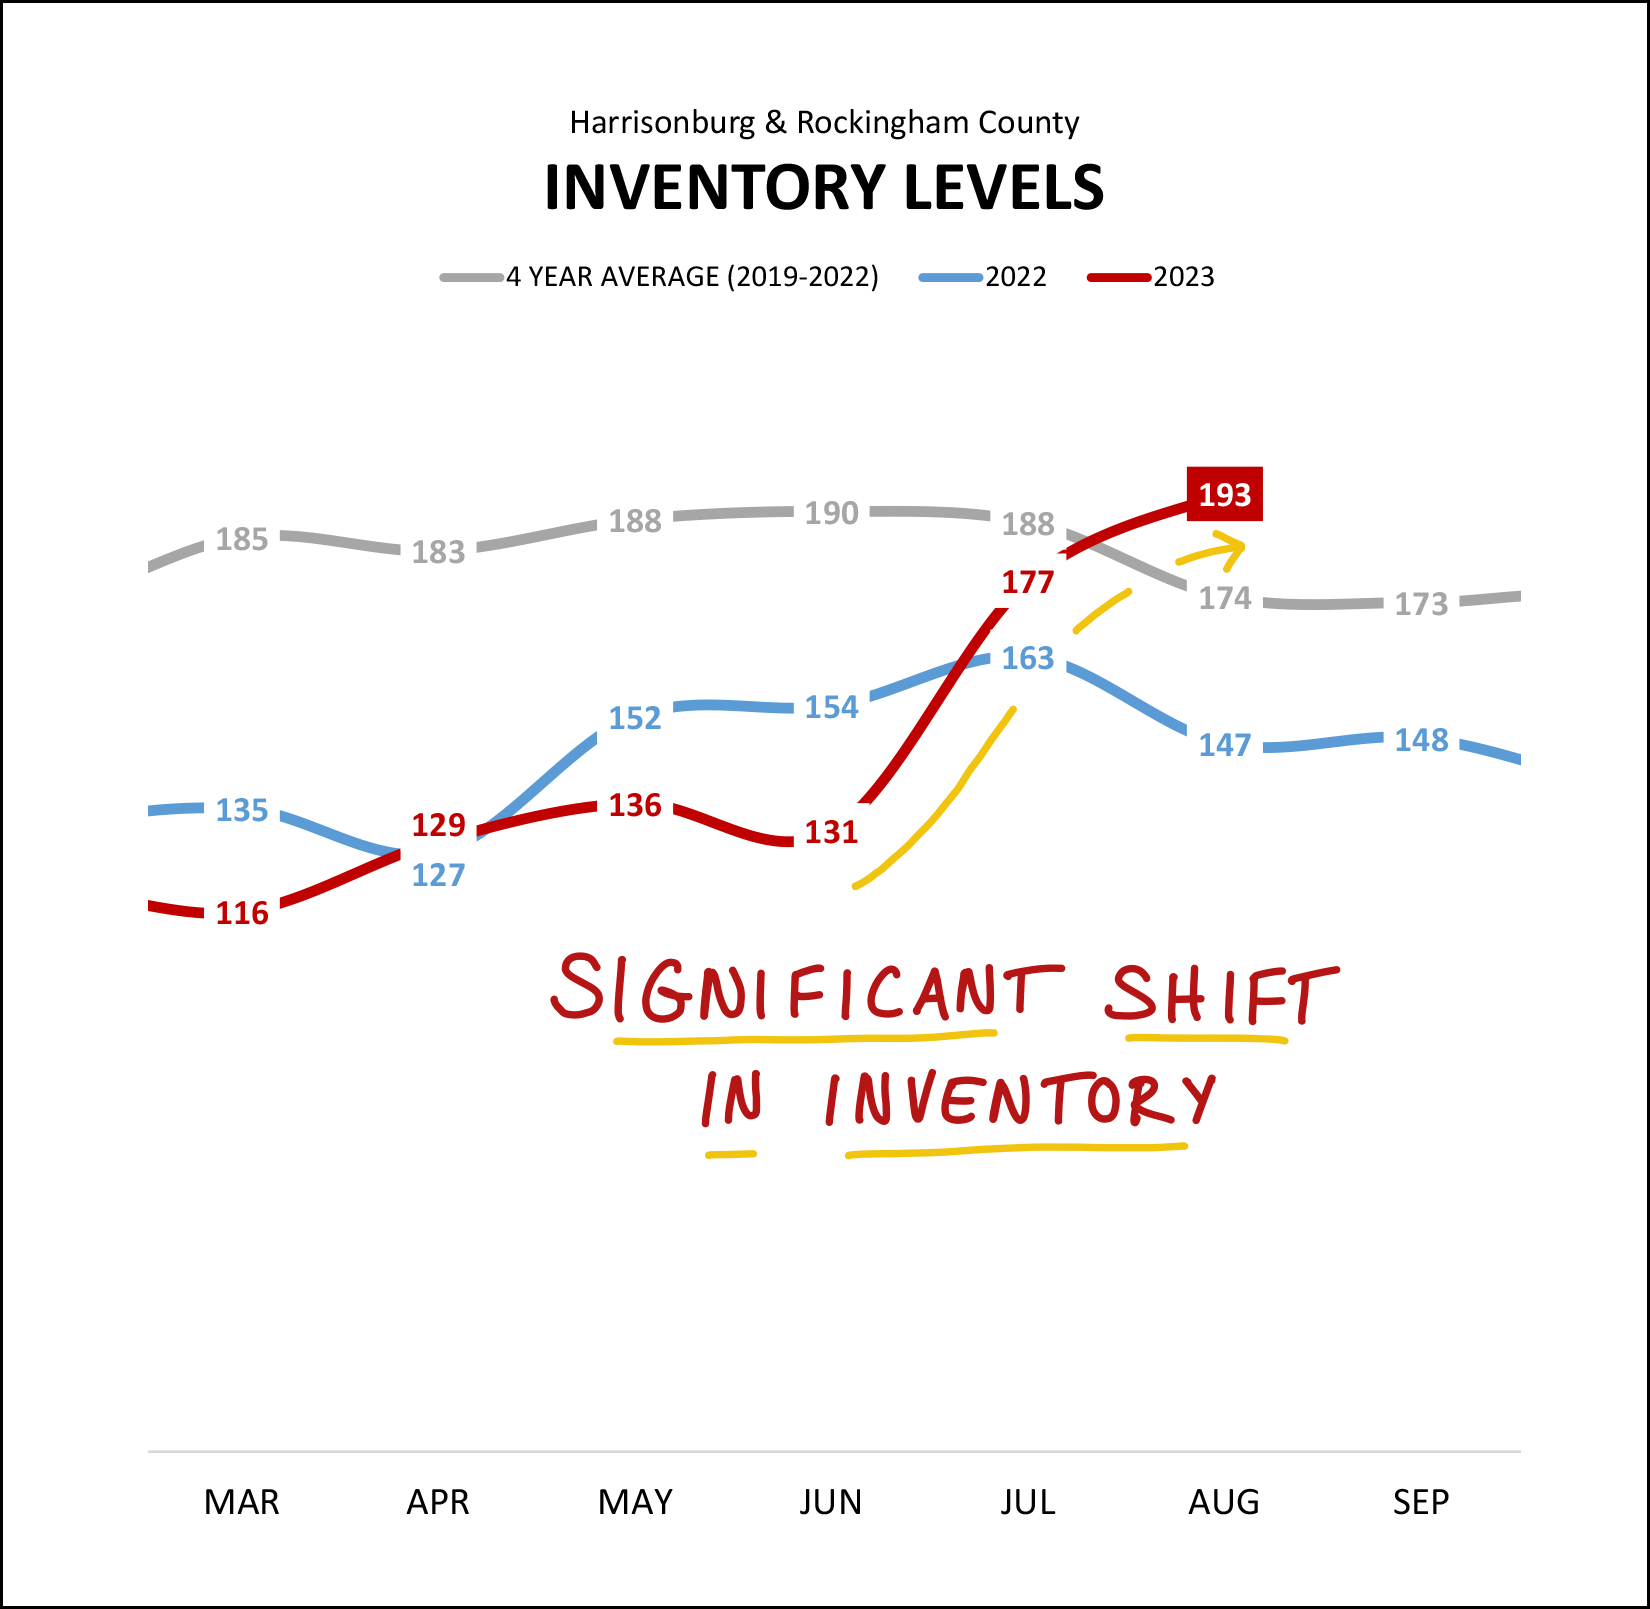 Over the past two months we have seen a significant shift in inventory levels -- the number of homes available for sale in Harrisonburg and Rockingham County. For most of this year (red line) we have seen even fewer homes for sale than last year (blue line) but that all changed in July 2023. Over the past two months we have seen inventory levels build up beyond (above) where they have been for the past several years. These higher inventory levels are resulting in... [1] Buyers have slightly more choices of homes to go view. [2] Homes sometimes staying on the market a bit longer than before. [3] Many sellers seeing fewer showings than they expected. [4] Plenty of homes not going under contract in the first few weeks. Will higher inventory levels eventually translate into a higher number of home sales, bringing inventory levels back down? Maybe. Will higher inventory levels eventually lead to some sellers being more flexible on price, and a leveling out of the median sales price, or even a decline in the median sales price? Maybe. I'll continue to monitor inventory levels with interest as higher inventory levels can start to make it a slightly more favorable market for buyers than it has been for the past few years. As already mentioned in this report, despite higher inventory levels, we're still seeing prices rise... and most (50%+) homes are still going under contract quite quickly... 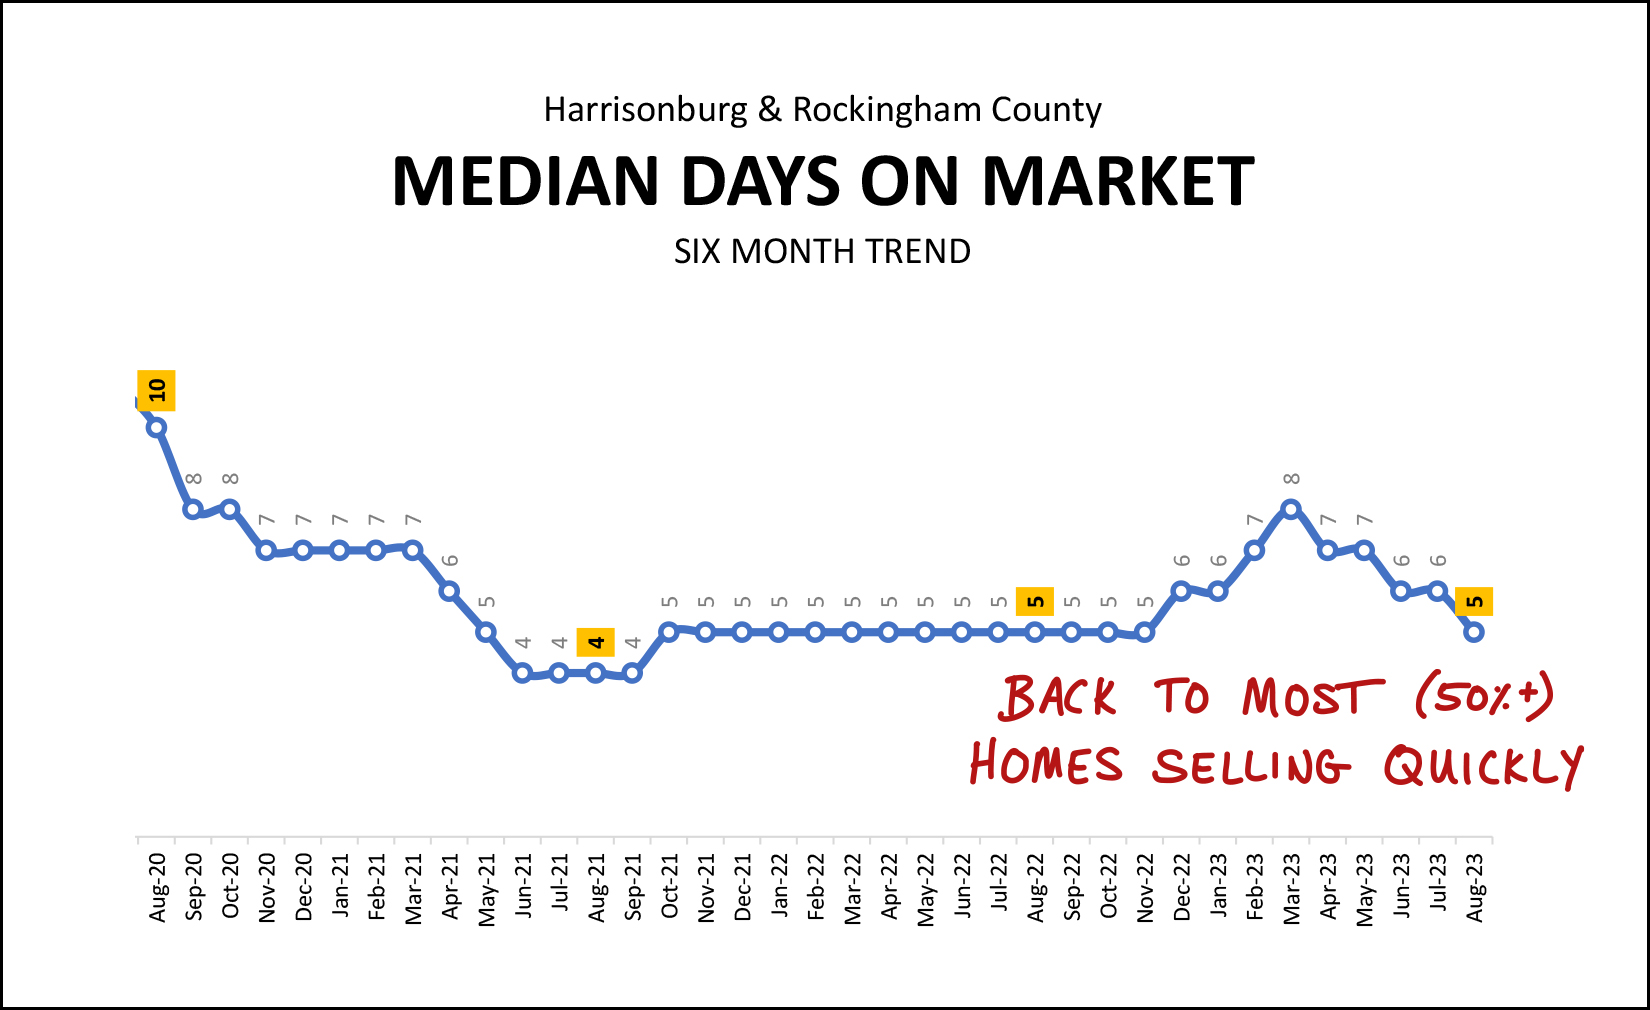 Just to translate the graph above into words... over the past six months the median "days on market" of homes that have sold was five days. Of note... that only measures the median days on market for sold homes... not those that are still on the market for sale. Furthermore, this is just a median -- it's not saying that all homes are going under contract in five or less days. As per how a "median" calculation works... 50% of homes are going under contract in five or fewer days... and 50% are going under contract in five or more days. And finally... I have mentioned higher mortgage interest rates so many times in this market report that you're probably wondering how high they are... 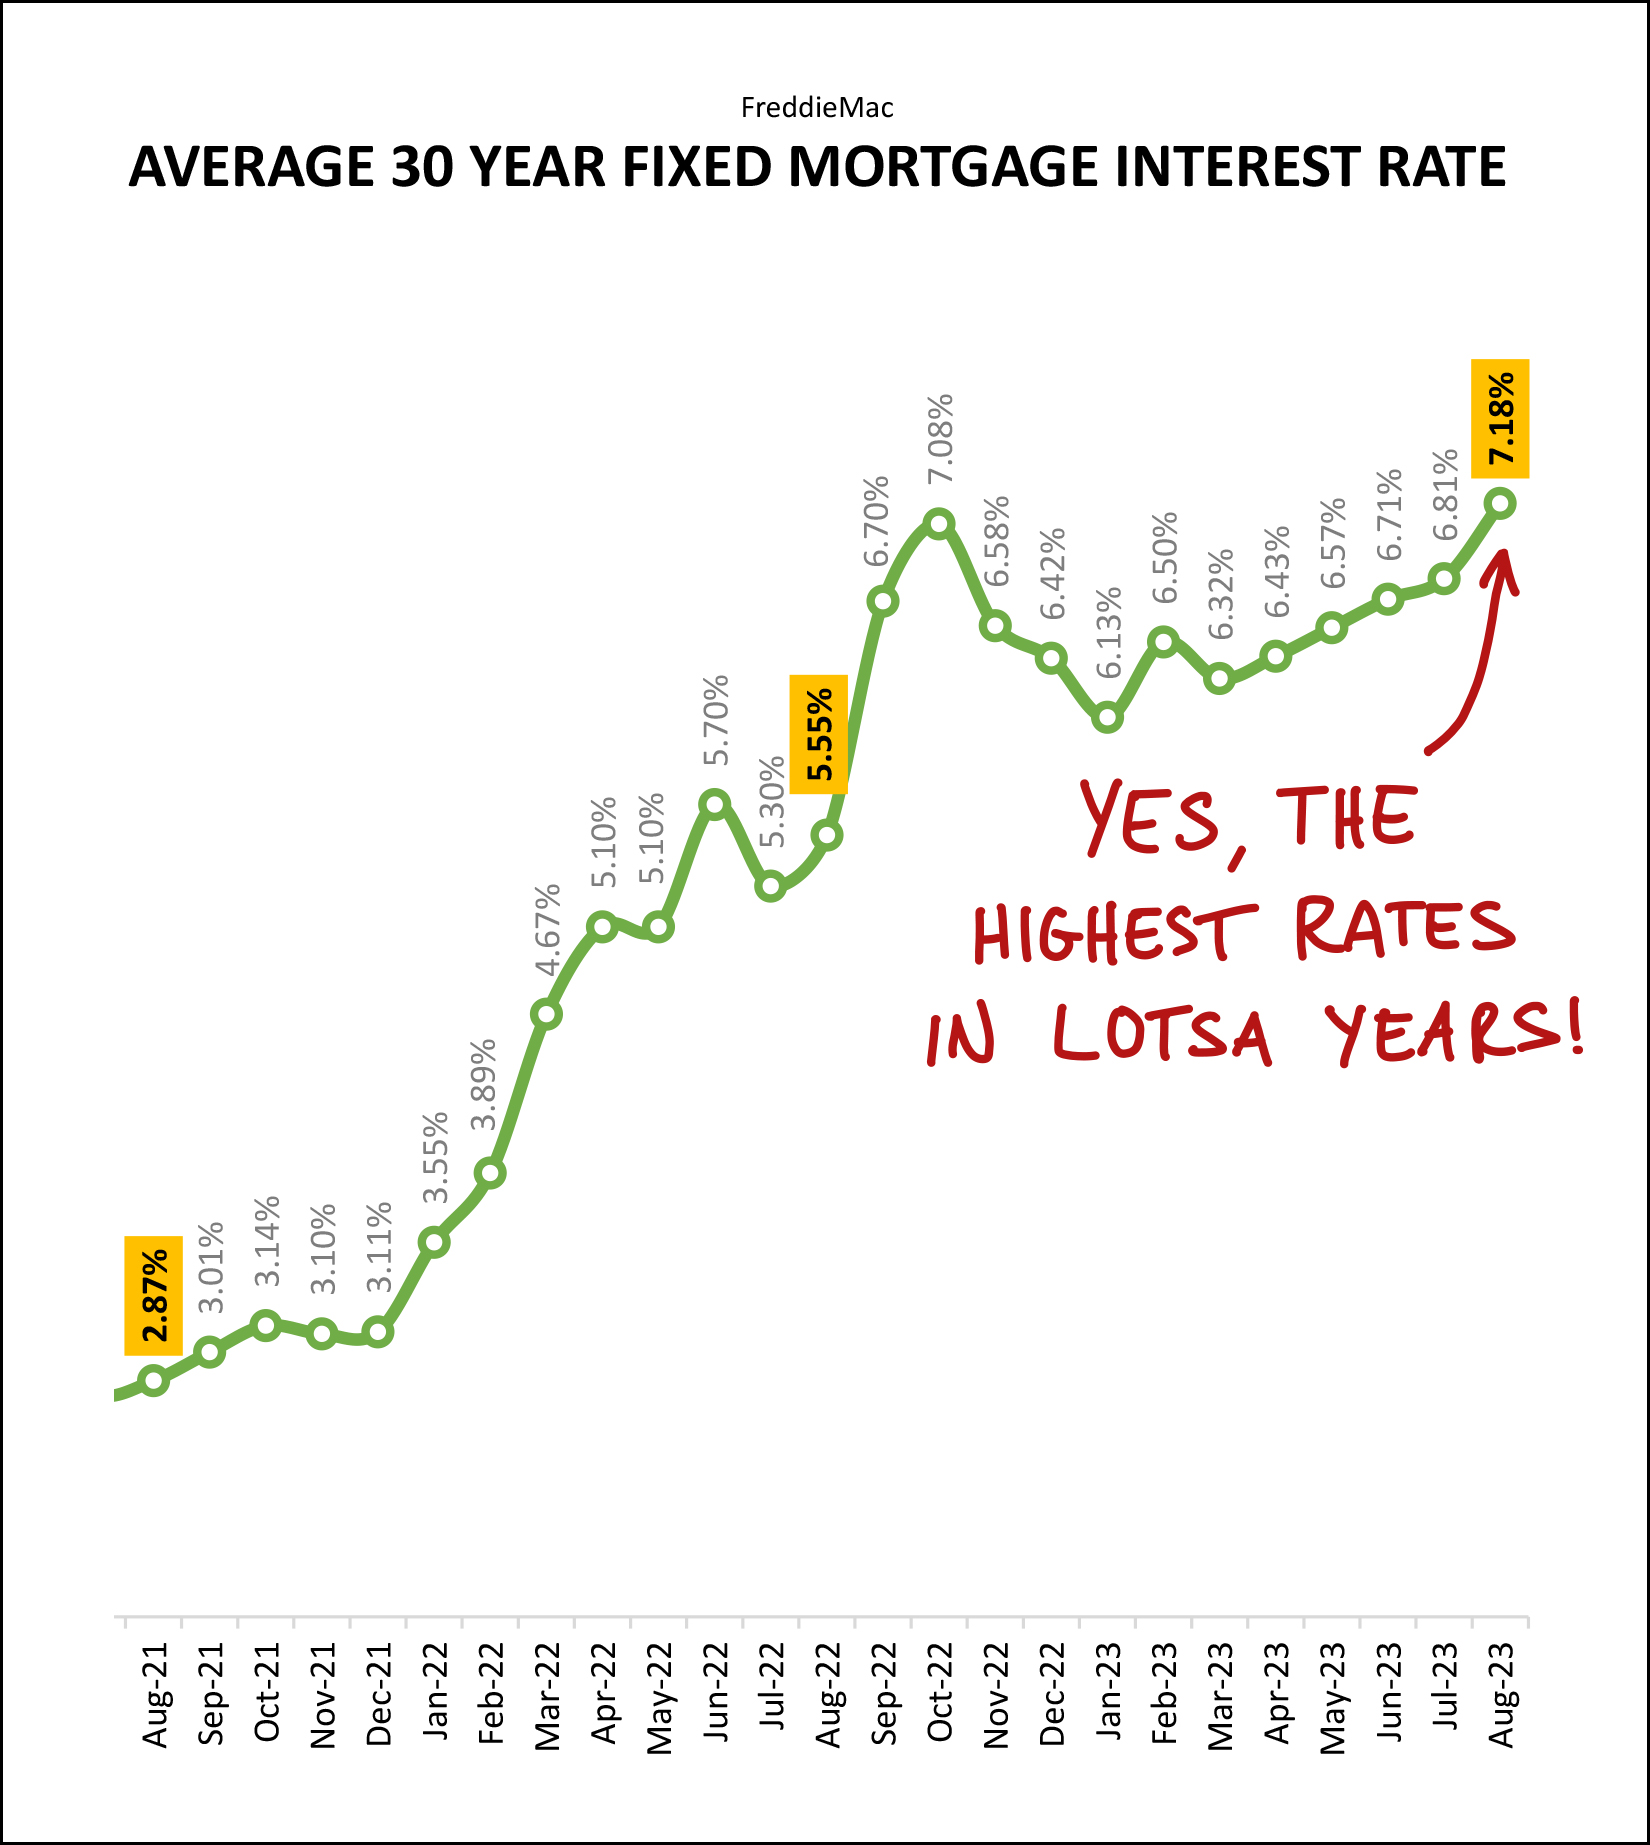 They are QUITE high... higher than they have been in many years... higher than they have been in several decades. It seems quite possible that mortgage interest rates will edge back down below 7% in the coming months... but I'm guessing we'll see mortgage interest rates above 6% for the next year or two. These higher mortgage interest rates significantly affect housing costs for buyers making a decision to buy in today's market. If mortgage interest rates were lower, we would likely see more sellers being willing to sell, and more buyers able to and interested in buying. And just like that, we've breezed our way through all of the charts and graphs I have for you today. My advice to buyers and sellers is relatively similar to recent months gone by, but I'll reiterate it here... Home Buyers -- You might be able to wait a day (or even two) to go see a new listing now, but don't assume that many or most will be there three or four days after they hit the market. Plenty of homes are still going under contract very quickly, particularly those in more desirable price ranges, locations, etc. Talk to a mortgage lender to understand your potential housing costs and get going to see some new listings as they hit the market. Home Sellers -- All homes won't go under contract within five days. Your home might be on the market for a few weeks or even a few months depending on it's condition, location, price range and other attributes that are appealing to either a wide or narrow pool of buyers. Price your home competitively, prepare it well for the market and market it thoroughly and professionally and you should still have success in securing a contract with a buyer -- but it won't necessarily happen overnight like it seemingly always was over the past few years. If you have a real estate question... reach out anytime. It's never too early to have an initial chat about your possible plans to buy, sell or move. I'm happy to provide feedback and input to help you think some things through and make a plan for your housing transition when you're ready to do so. You can reach me most easily at 540-578-0102 (call/text) or by email here. | |
Fewer Home Sales, But Prices Are Rising!? More Contracts But Inventory Levels Are Rising!? |
|
 Happy Monday afternoon to you, friends! This monthly market report is one of some enigmas, some contradictions, some puzzlement. Some of these will be familiar, some new, some unrelated to real estate... [1] How can it be that we are seeing fewer home sales, but higher prices!? [2] So, contract activity is increasing, but inventory levels are also rising!? [3] How can I feel so young, yet have a son heading off to college this Friday!? :-)  Indeed, Luke heads off to Wake Forest University this Friday! We are tremendously excited for this next step in his life and educational journey, but we will miss him and his friends greatly as they head off in new directions. Swiveling quickly back to real estate before I spend too much time thinking about the aforementioned major life transition (!!) I'll point you towards a few of my current listings that might be of interest... 9926 Goods Mill Road - A spacious home / farmette on 3.3 acres with wonderful mountain views in the Spotswood High School district. $585,000. 150 Autumn Bluff Drive - A like-new, upscale, custom-built, single-level home in Autumn Breeze on a large corner lot. $445,000. 1210 King Edwards Way - A four bedroom home in the City with an attached two car garage and a large back deck. $389,500. 3211 Charleston Boulevard - An upscale townhouse in Preston Lake with a two-car garage with access to many amenities. $375,000 Congers Creek Townhomes - Three-level, new construction townhomes across Boyers Road from Sentara RMH Medical Center. $306,900 and up. And finally, before we get to the real estate data... Each month I offer a giveaway, of sorts, for readers of this market report, highlighting some of my favorite places, things or events in Harrisonburg. Recent highlights have included Jimmy Madison's, Red Wing Roots tickets and The Little Grill. Now, then, on to the data. You can likely skim this chart of data rather quickly to get a sense of what I'm going to say... 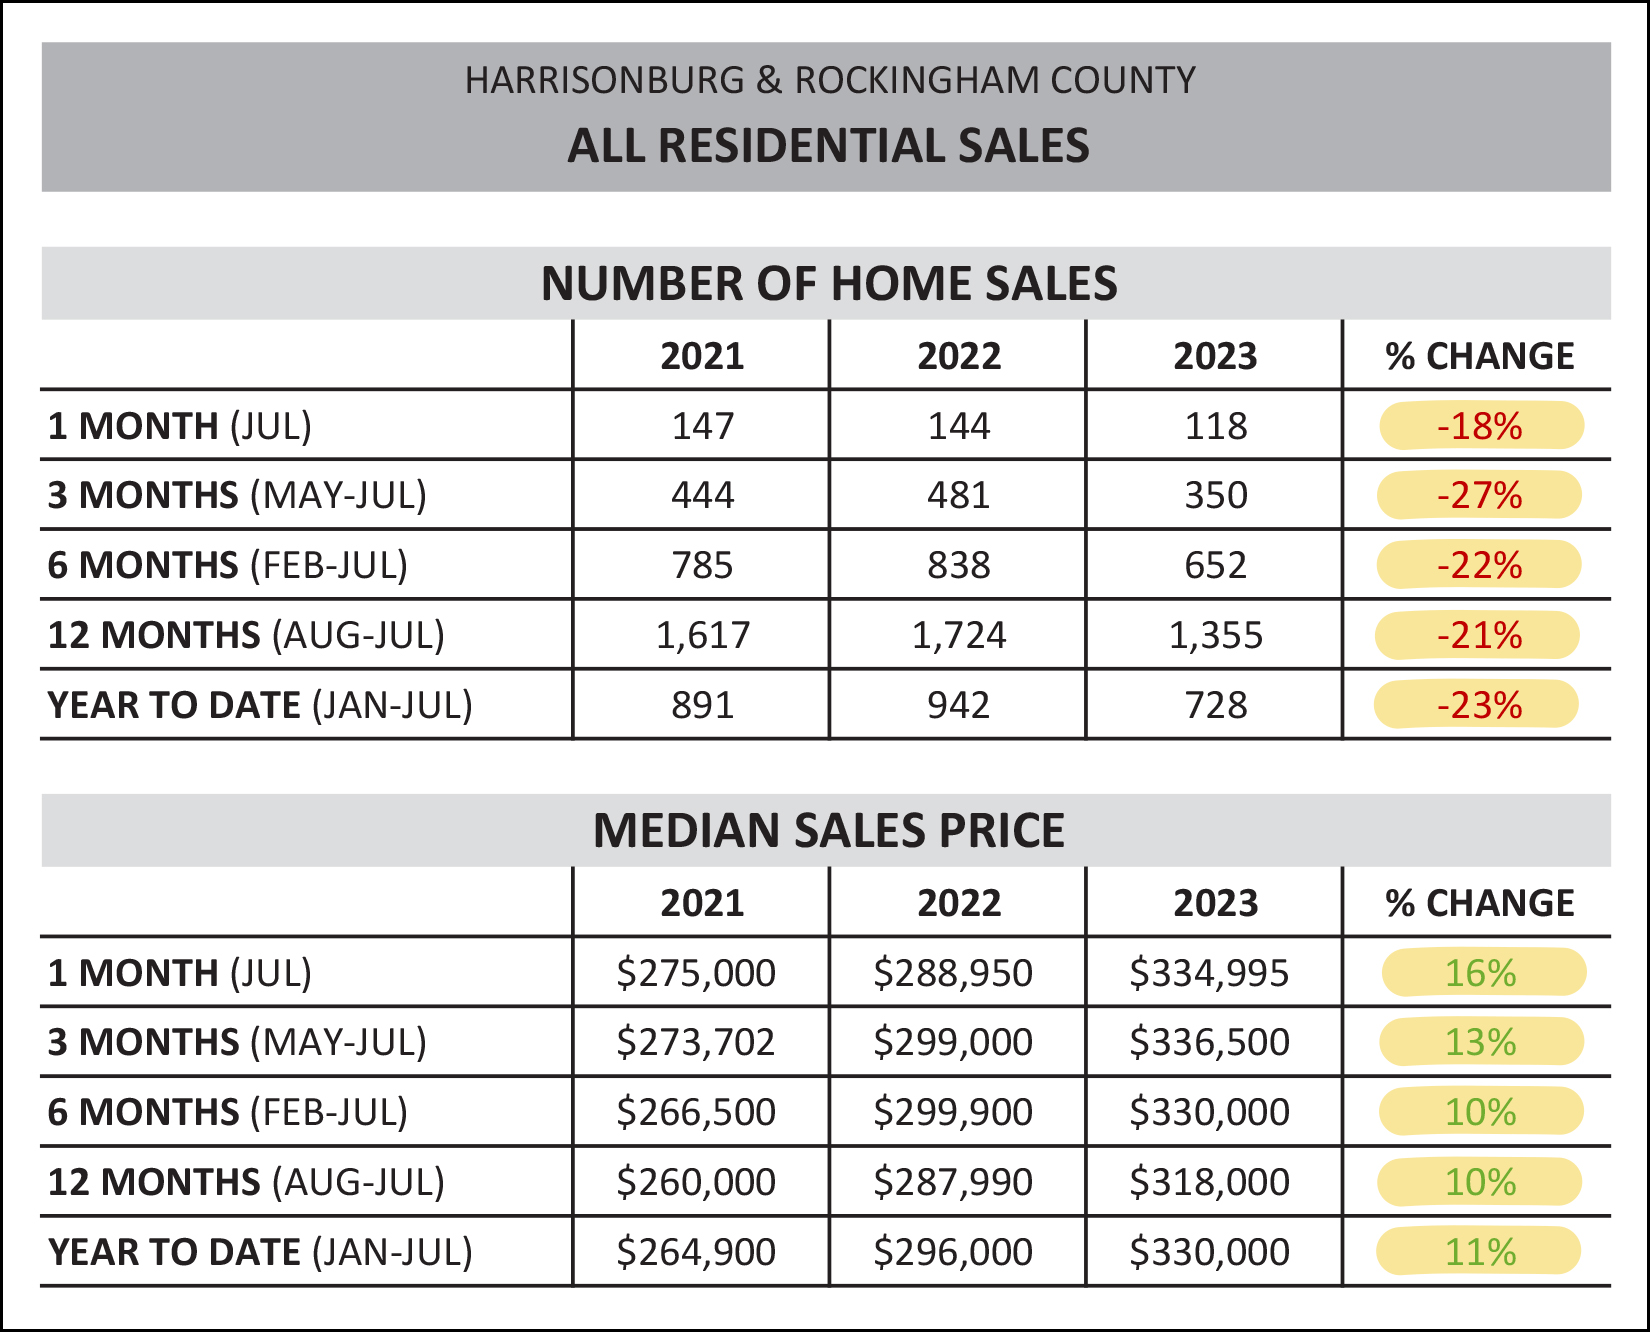 Regardless of the timeframe outlined above... [1] We are seeing fewer homes selling now than in the recent past in Harrisonburg and Rockingham County. Year to date (Jan-Jul) we have seen a 23% drop in the number of homes selling as compared to last year. [2] We are seeing higher and higher sales prices in Harrisonburg and Rockingham County. Year to date (Jan-Jul) we are seeing a median sales price that is 11% higher than a year ago. Here's a month-by-month visualization of those slower sales we're seeing this year... 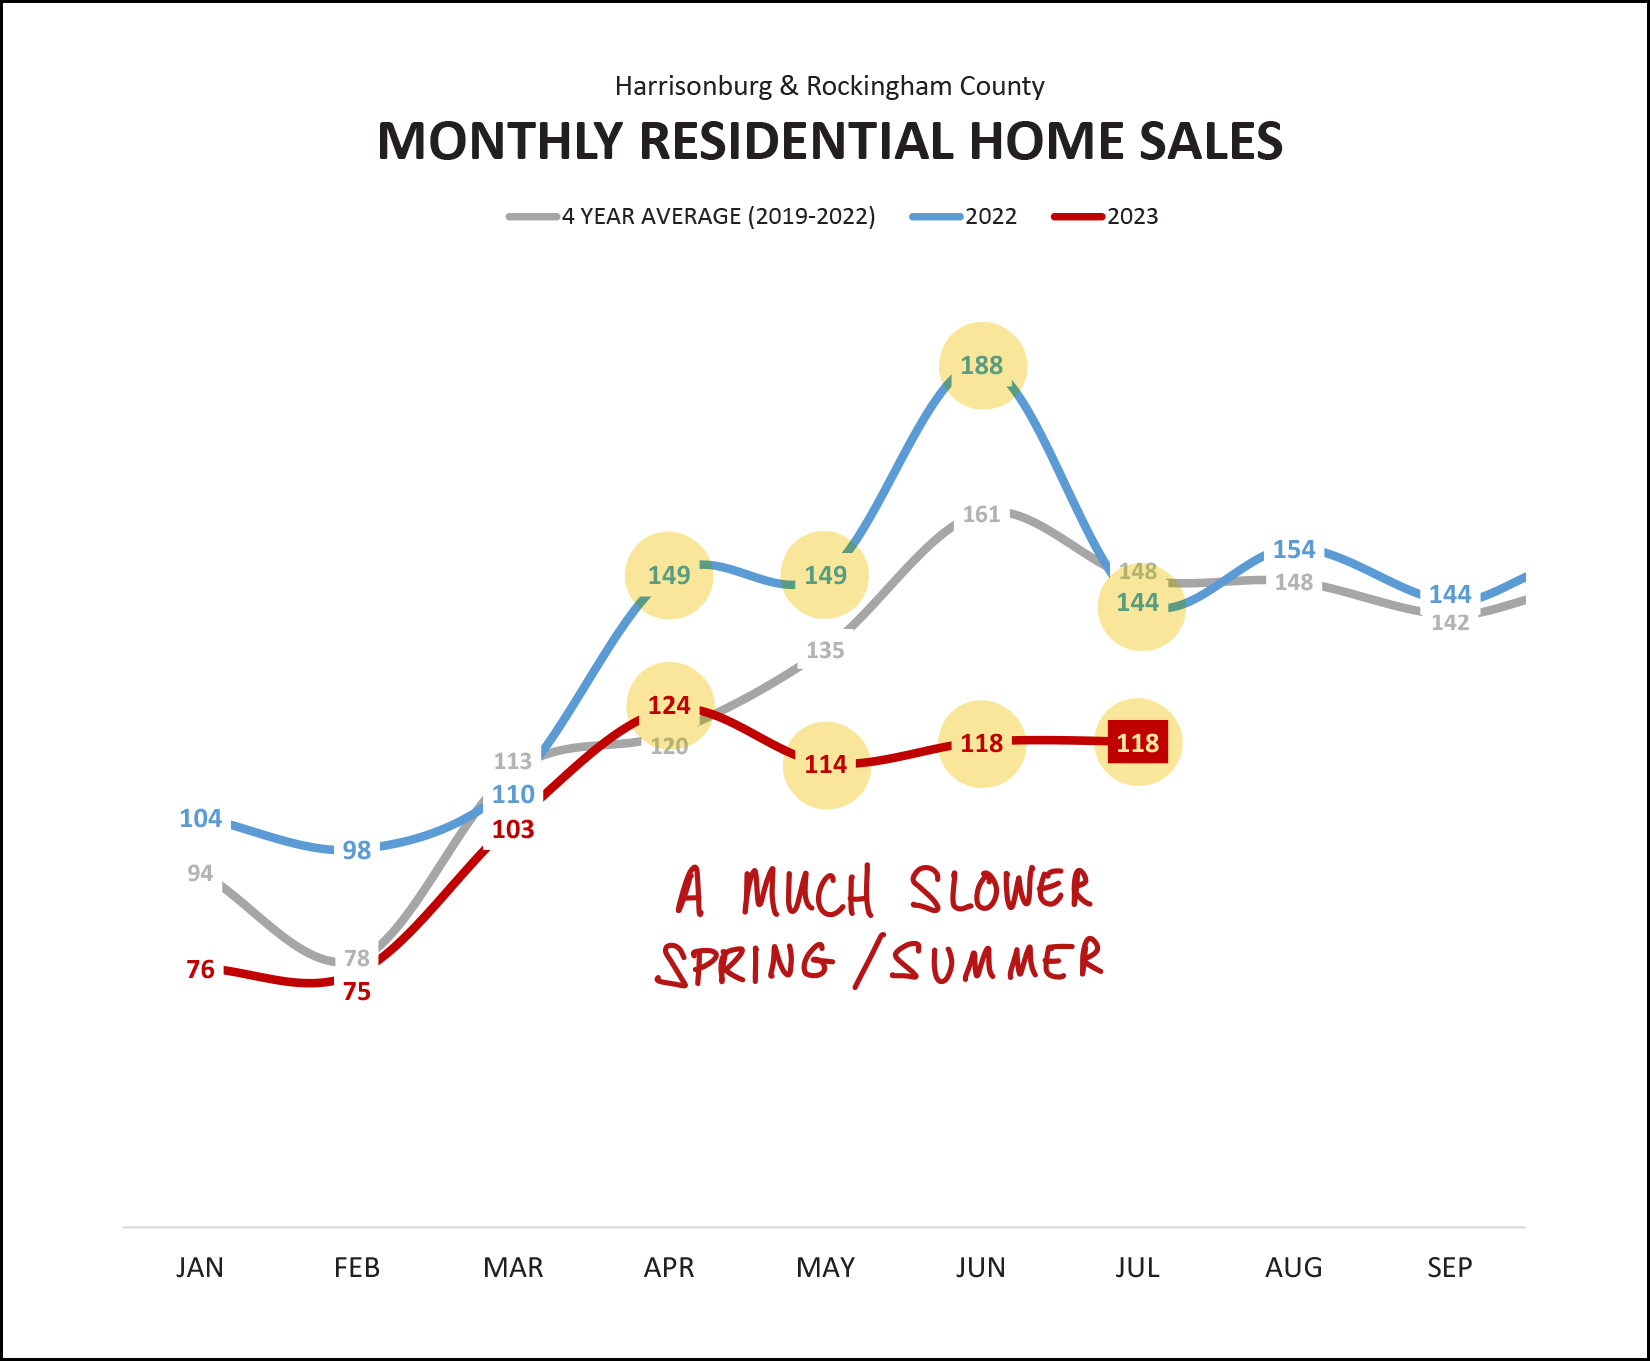 The grey line above shows the average number of home sales per month between 2019 and 2022. You'll note that a typical trend is to see more and more home sales (closings) as we move from April through June before starting to see things decline a bit in July. The blue line above shows last year, when April, May and June were well above where we might have expected them to be. Then, there's this year... the red line. We just haven't seen the typical boost in home sales during April, May and June that we would usually expect to see. In fact, July was the third month in a row of between 110 and 120 home sales. So, this year is not a typical year. We are experiencing a much lower spring and summer in the local real estate market. Why, you might ask? Likely because of mortgage interest rates -- which are quite a bit higher than over the past few years -- and because there aren't as many homeowners selling their homes. Stacking all of those months on top of each other, you can see how this year compares to previous years, thus far... 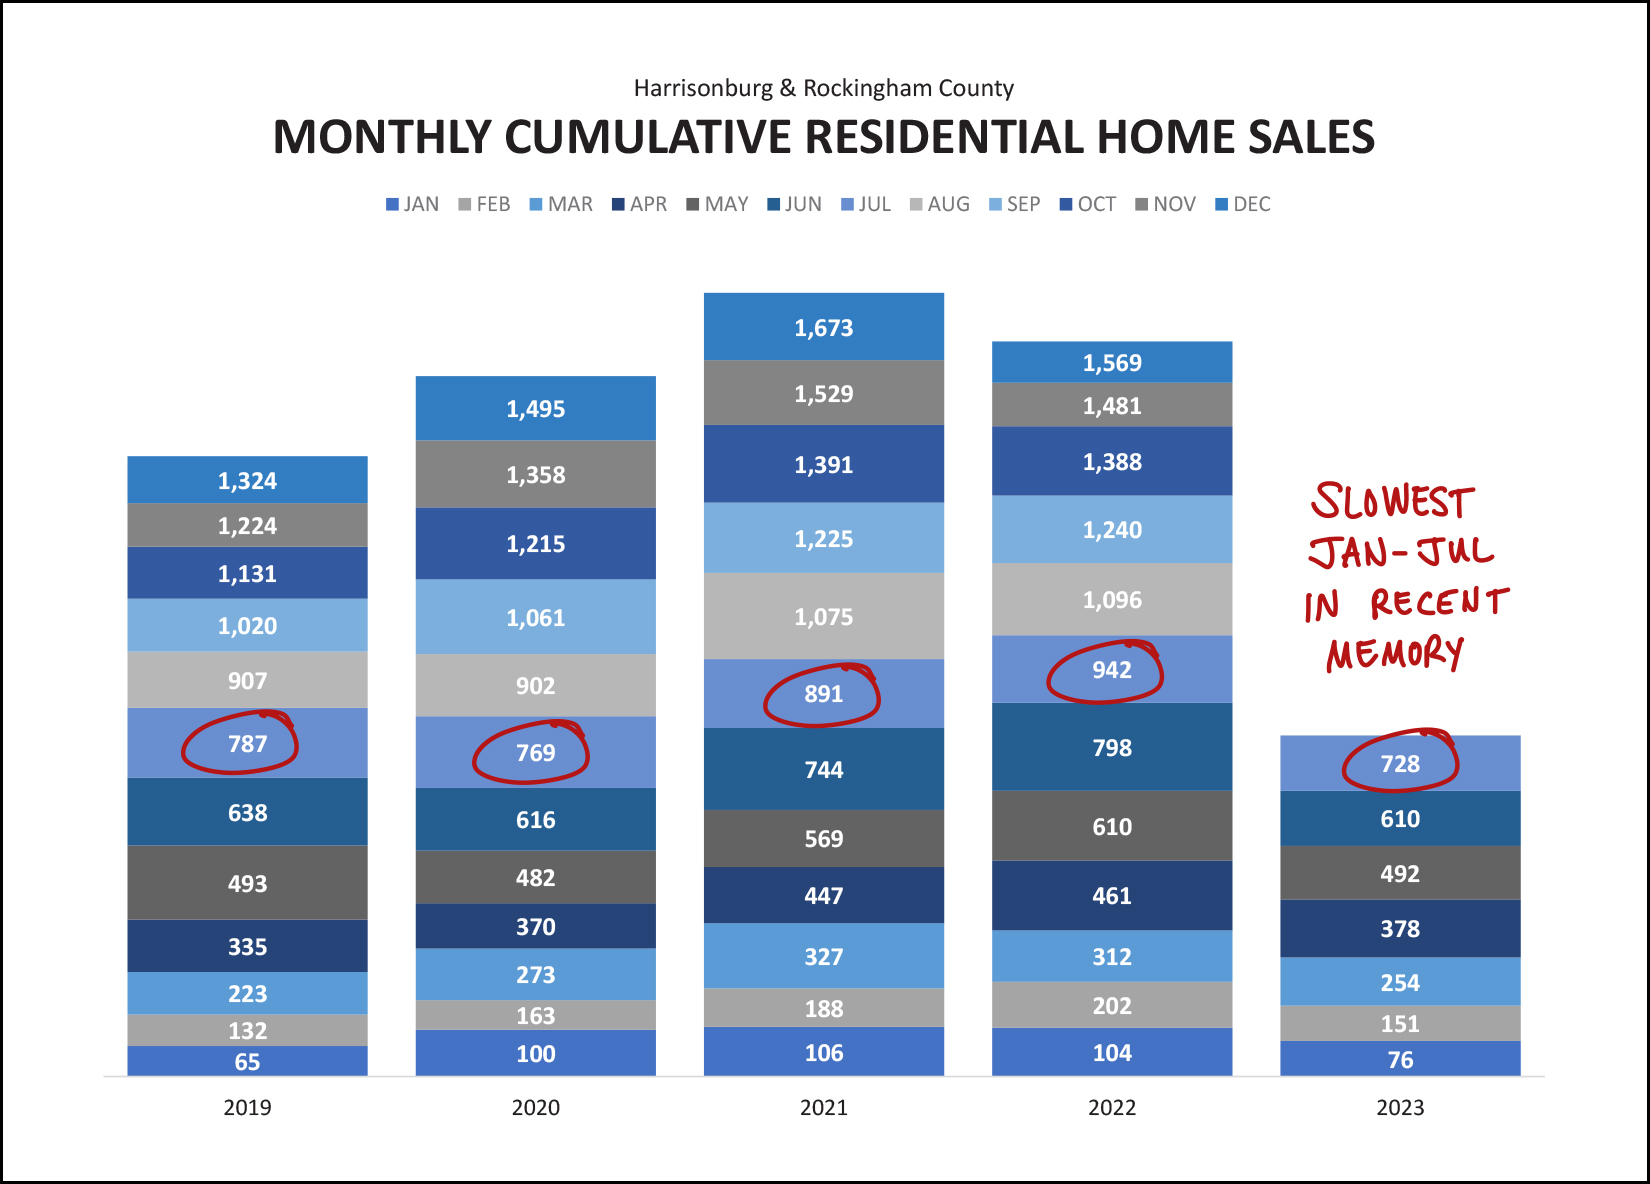 Clearly, this year seems unlikely to come anywhere near the level of sales seen over the past few years (2021 and 2022) and we're likely to finish out the year with fewer home sales than in 2019 and 2020 as well. Here's an illustration of that puzzling increase in sales prices and decline in the number of homes selling... 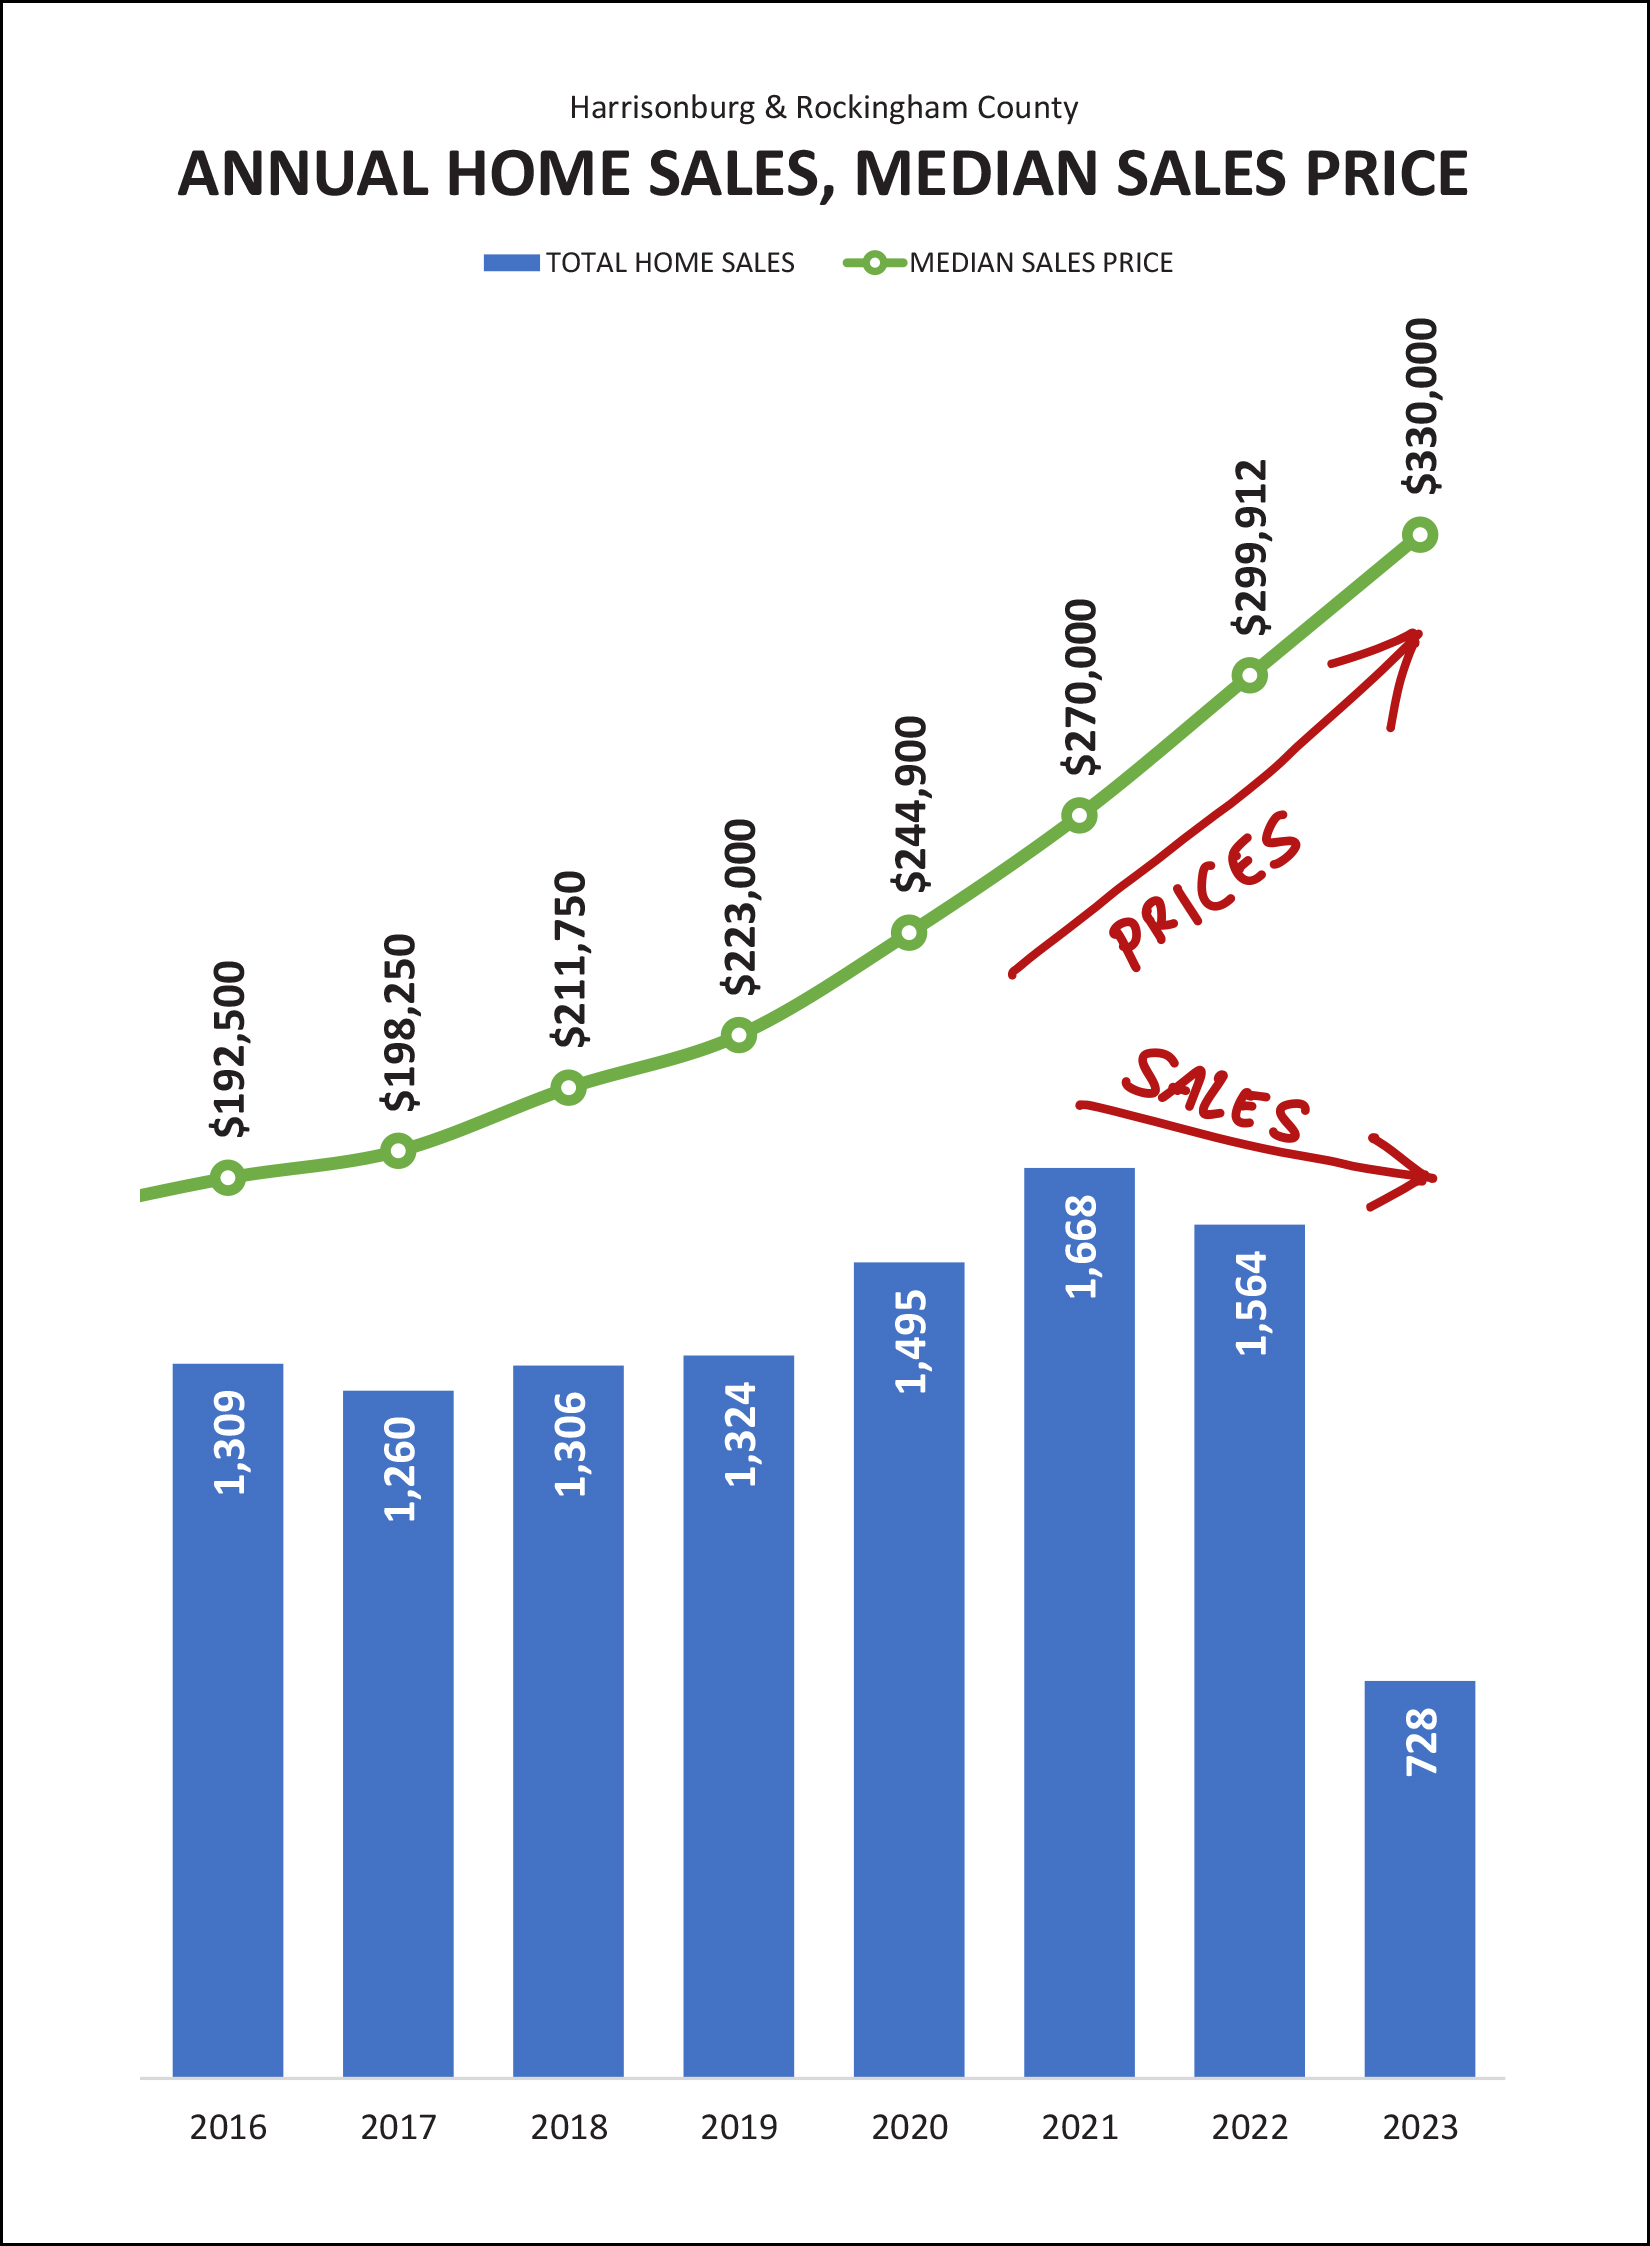 This is, as some of you would undoubtedly point out, both puzzling... and not. Typically, if demand decreases, sales decrease, and prices decrease. But despite fewer home sales (as shown above) we are not seeing prices decline. Which means... we are not seeing a net overall decrease in demand... but rather... a decrease in supply. So long as home prices keep climbing, I think the decrease in the number of home sales can be almost entirely attributed to fewer sellers selling. Given fewer homeowners being willing to sell, we're likely going to need new construction homes to fill in the gap to help meet buyer demand... 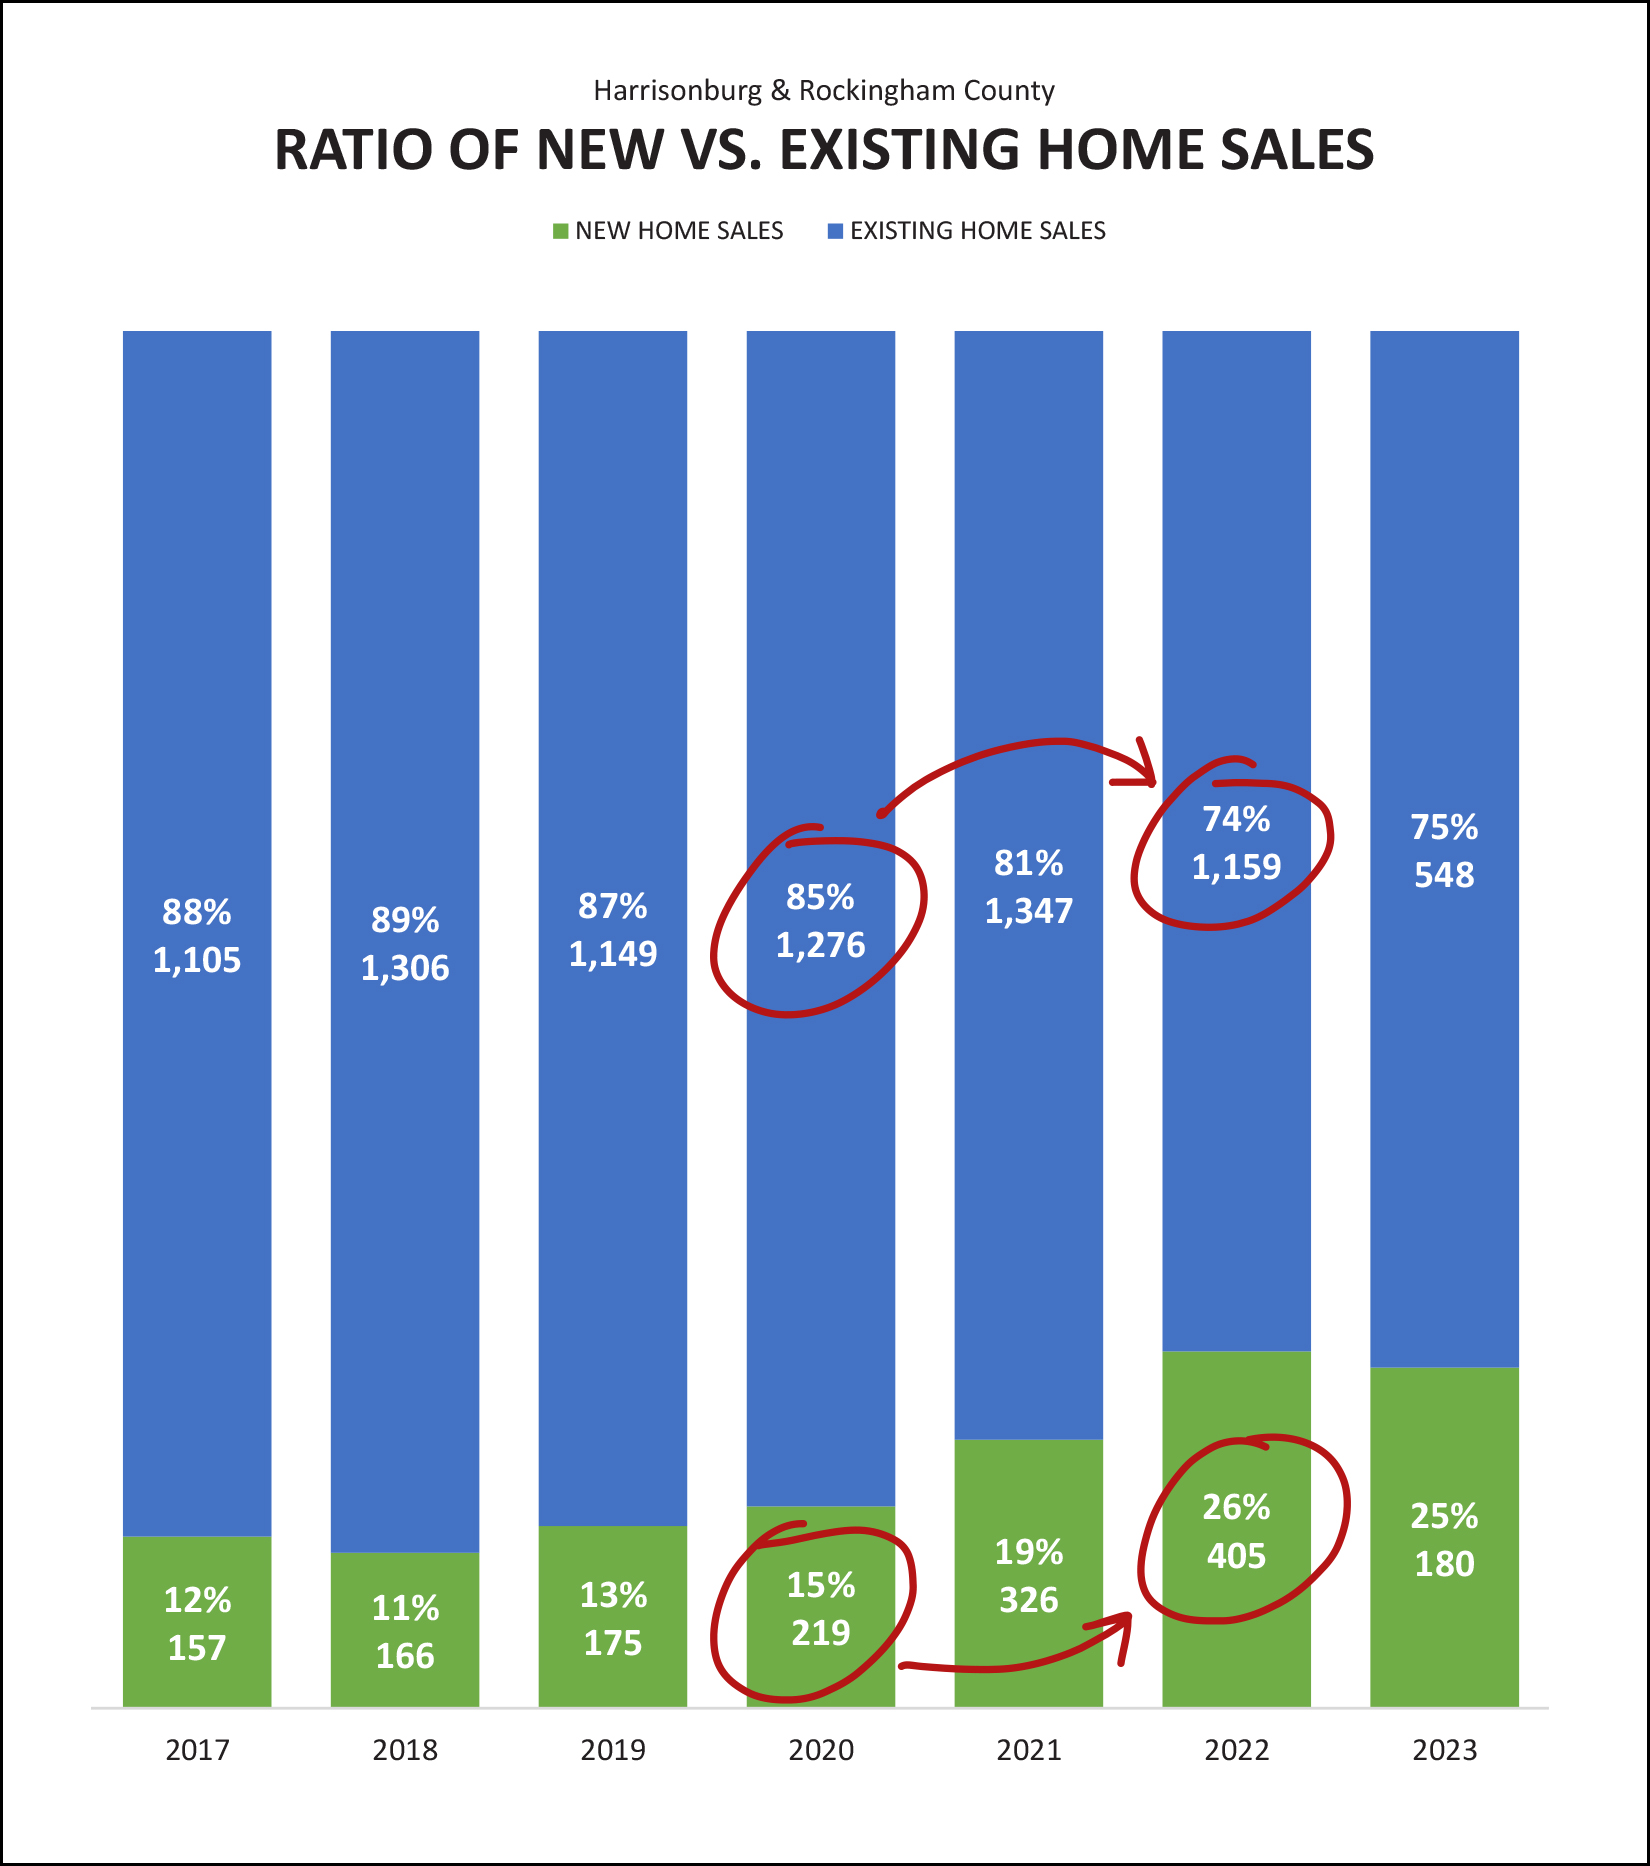 Overall, over the past few years, we have seen new home sales (green bars above) increasing. After only 219 new home sales in 2020, that climbed to 405 in 2022... leading to one in four (26%) homes selling being new homes. We are still seeing similar (75% / 25%) numbers this year. During that same timeframe (2020-2022) we saw a decline in existing home sales... from 1,276 existing home sales in 2020 down to 1,159 existing home sales in 2022. I expect we will see even fewer existing home sales in 2023 based on data from the first seven months of this year. Now, here comes a surprise this month... 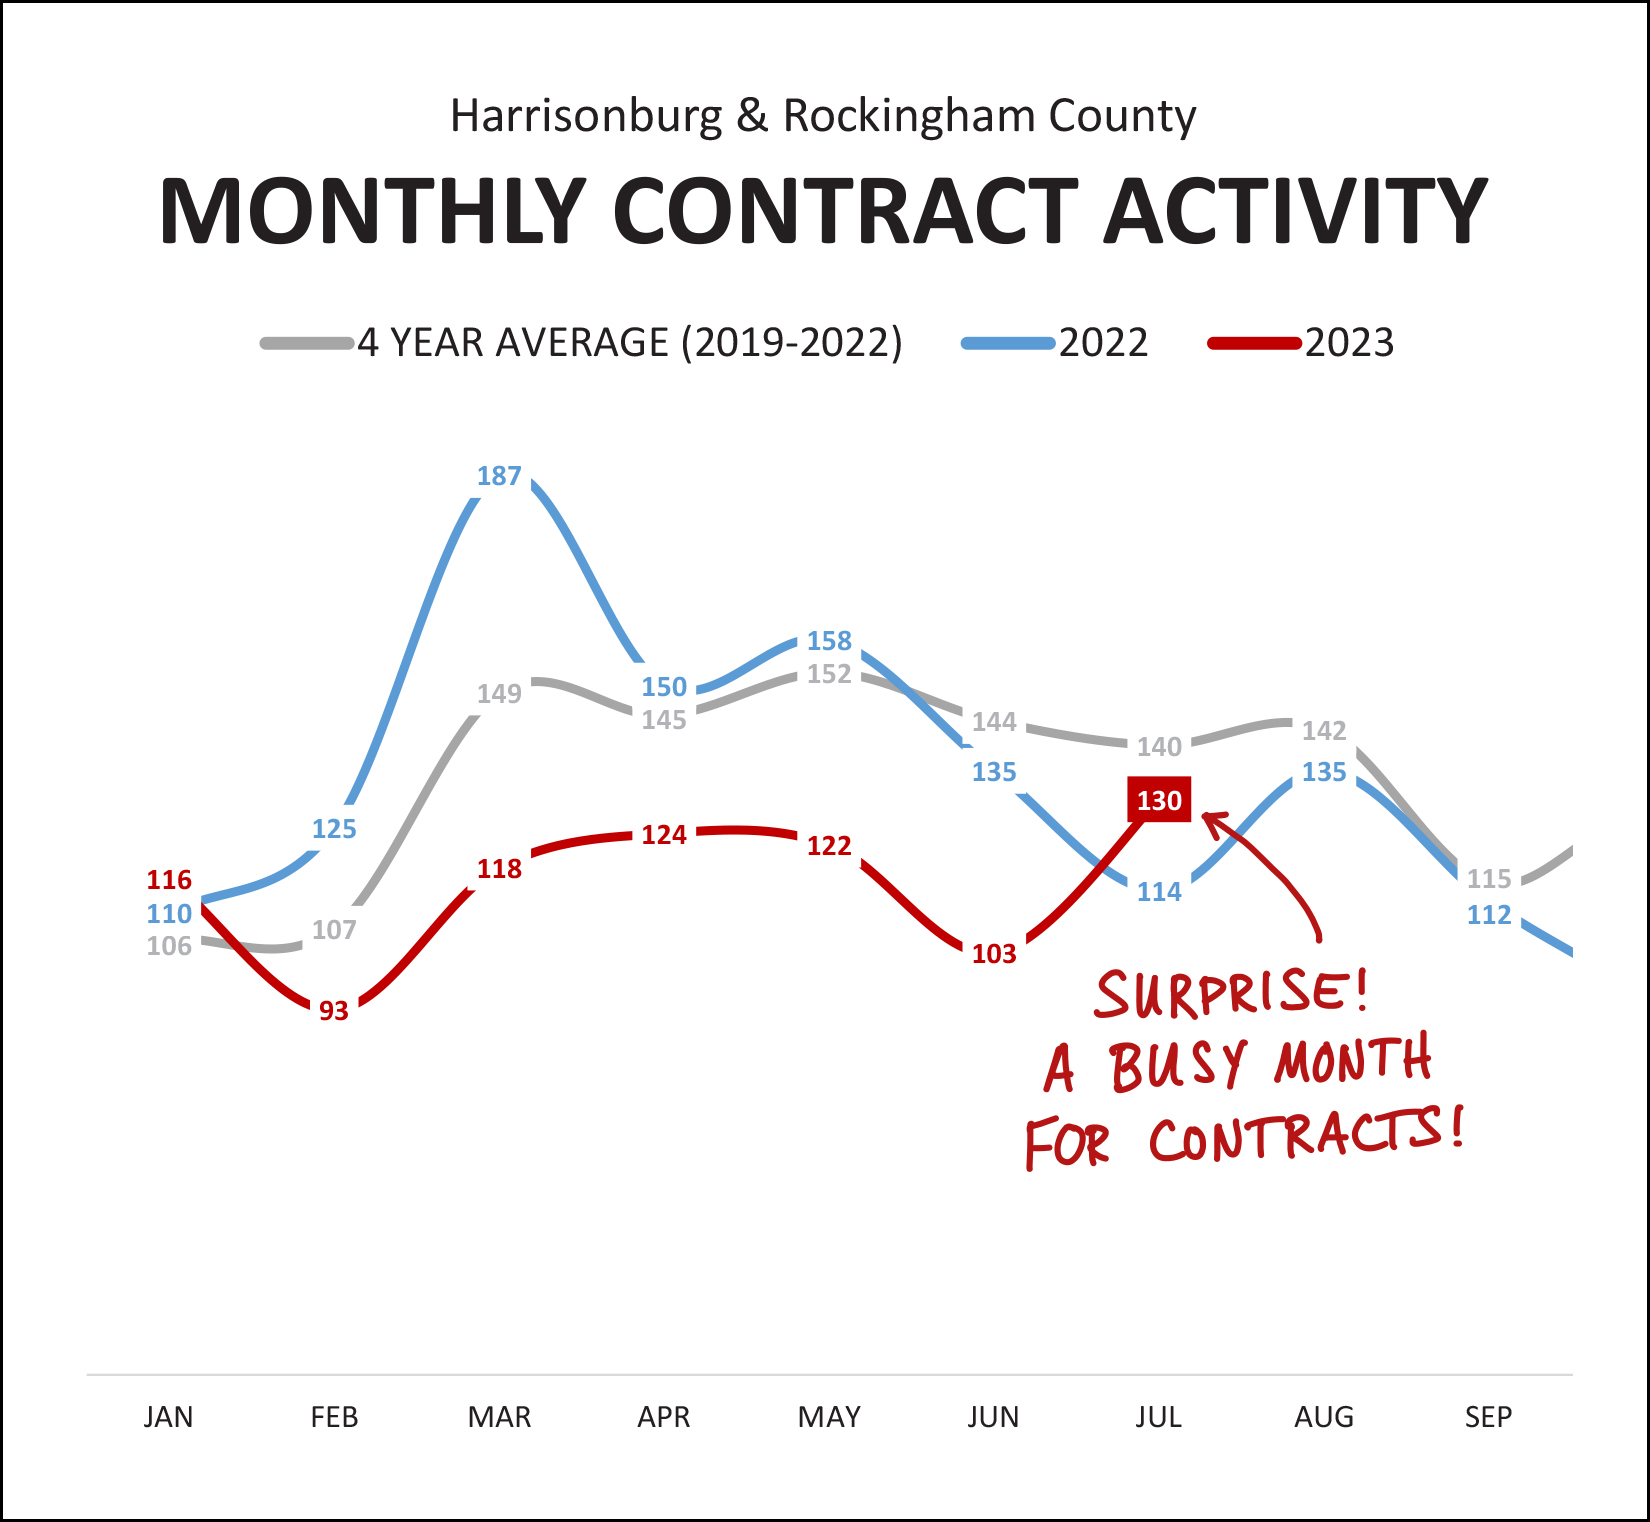 Last year we saw a month after month decline in contract activity as we moved from May through July. This year we started to follow that same trend as we saw fewer home sales in June that in May. But, then, July. Contract activity was quite a bit higher than I expected it would be in July 2023. In fact, this was the month with the largest number of contracts signed thus far in 2023. And yet, two other indicators keep me scratching by head a bit... 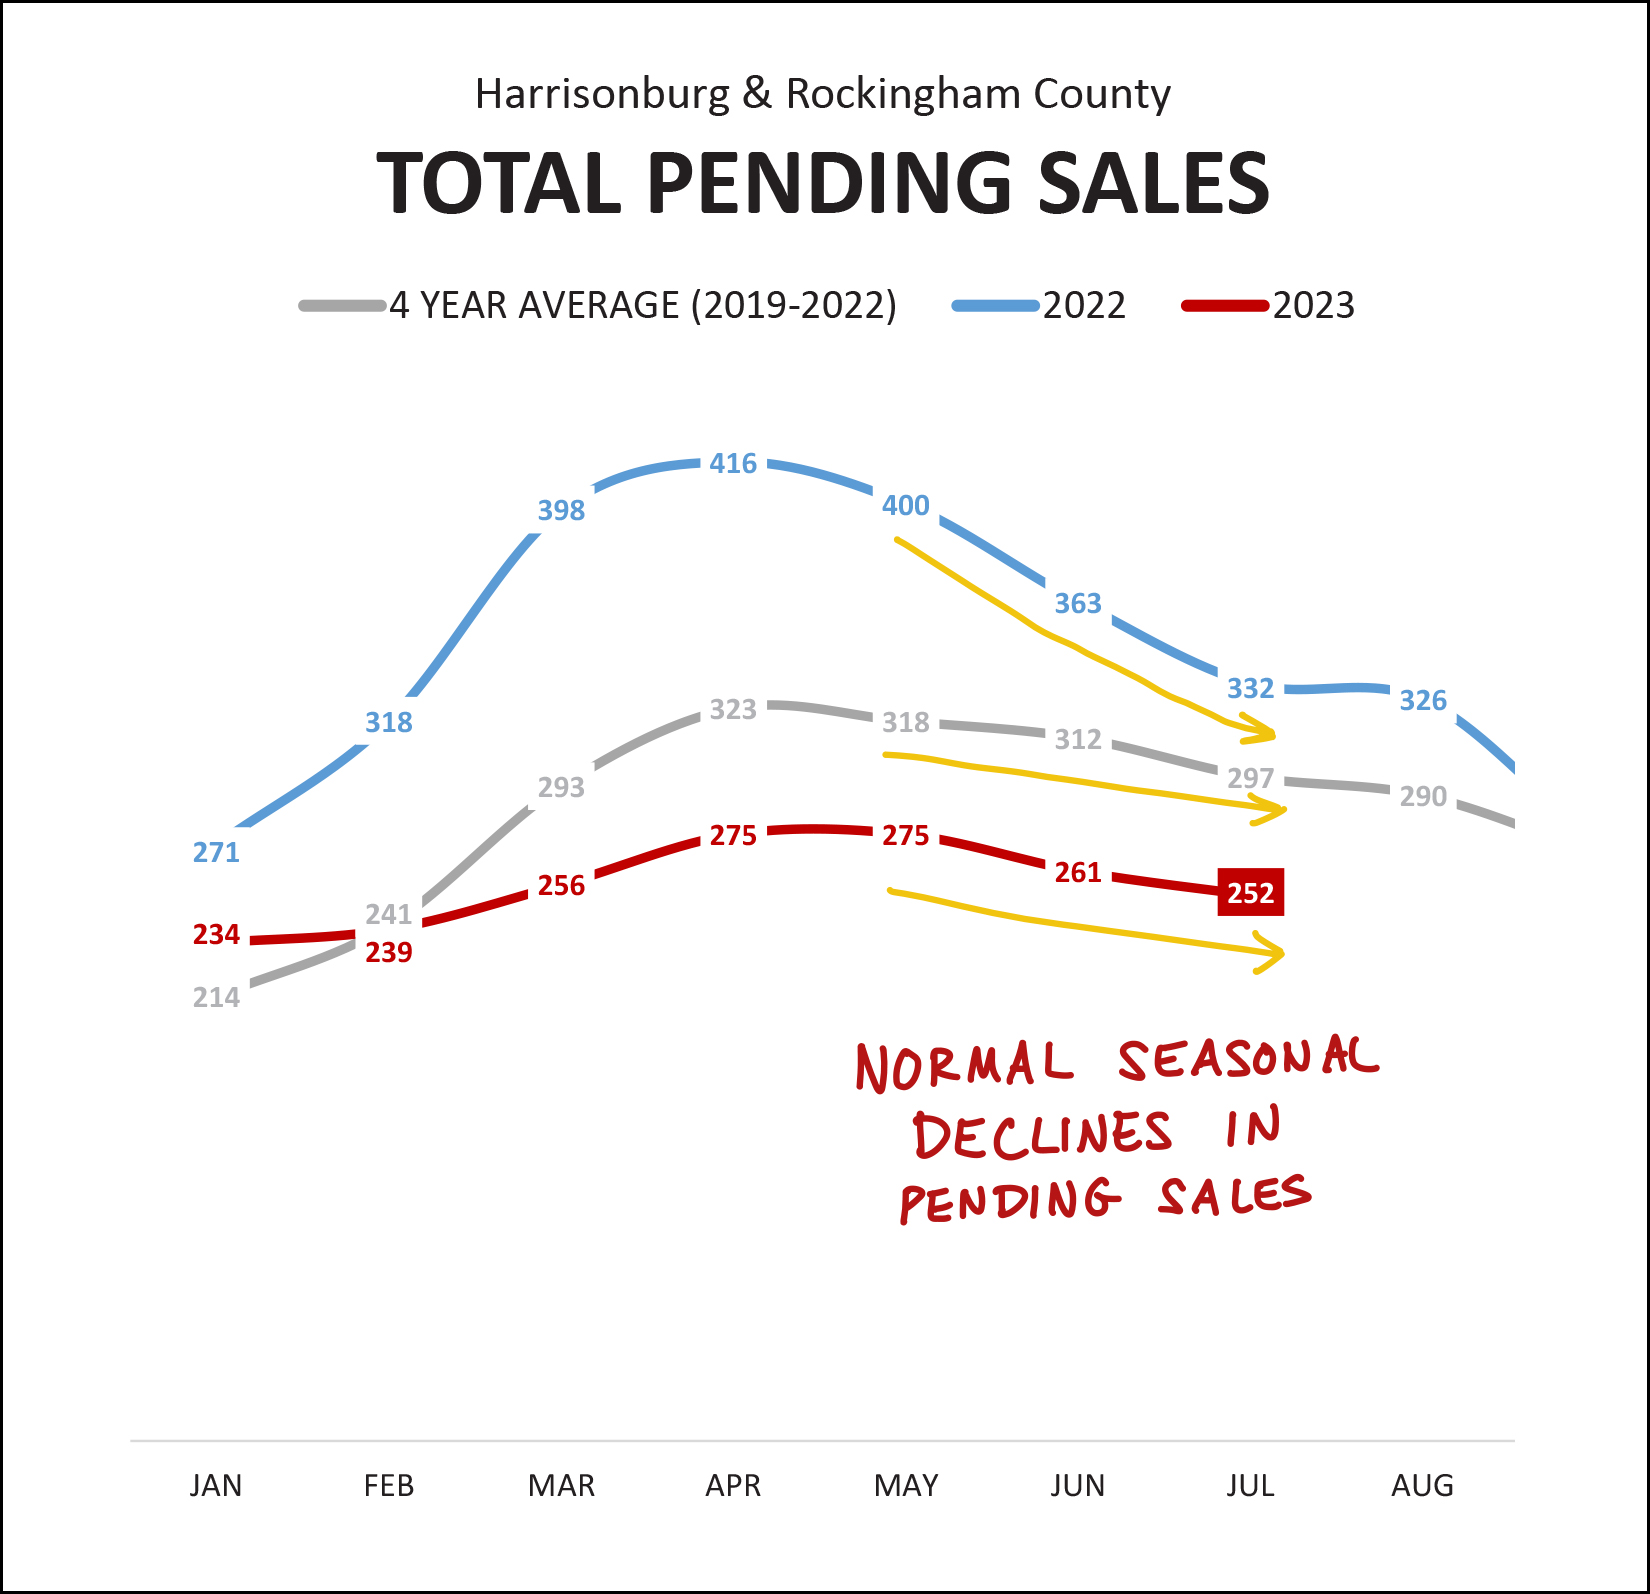 Despite that uptick in contracts being signed in July 2023... the number of pending (under contract) homes followed its normal seasonal trend of declining slightly between May and July. There are (as shown above) 252 homes under contract in Harrisonburg and Rockingham County right now... which is lower than a month ago (261) and lower than a year ago (297). Furthermore... 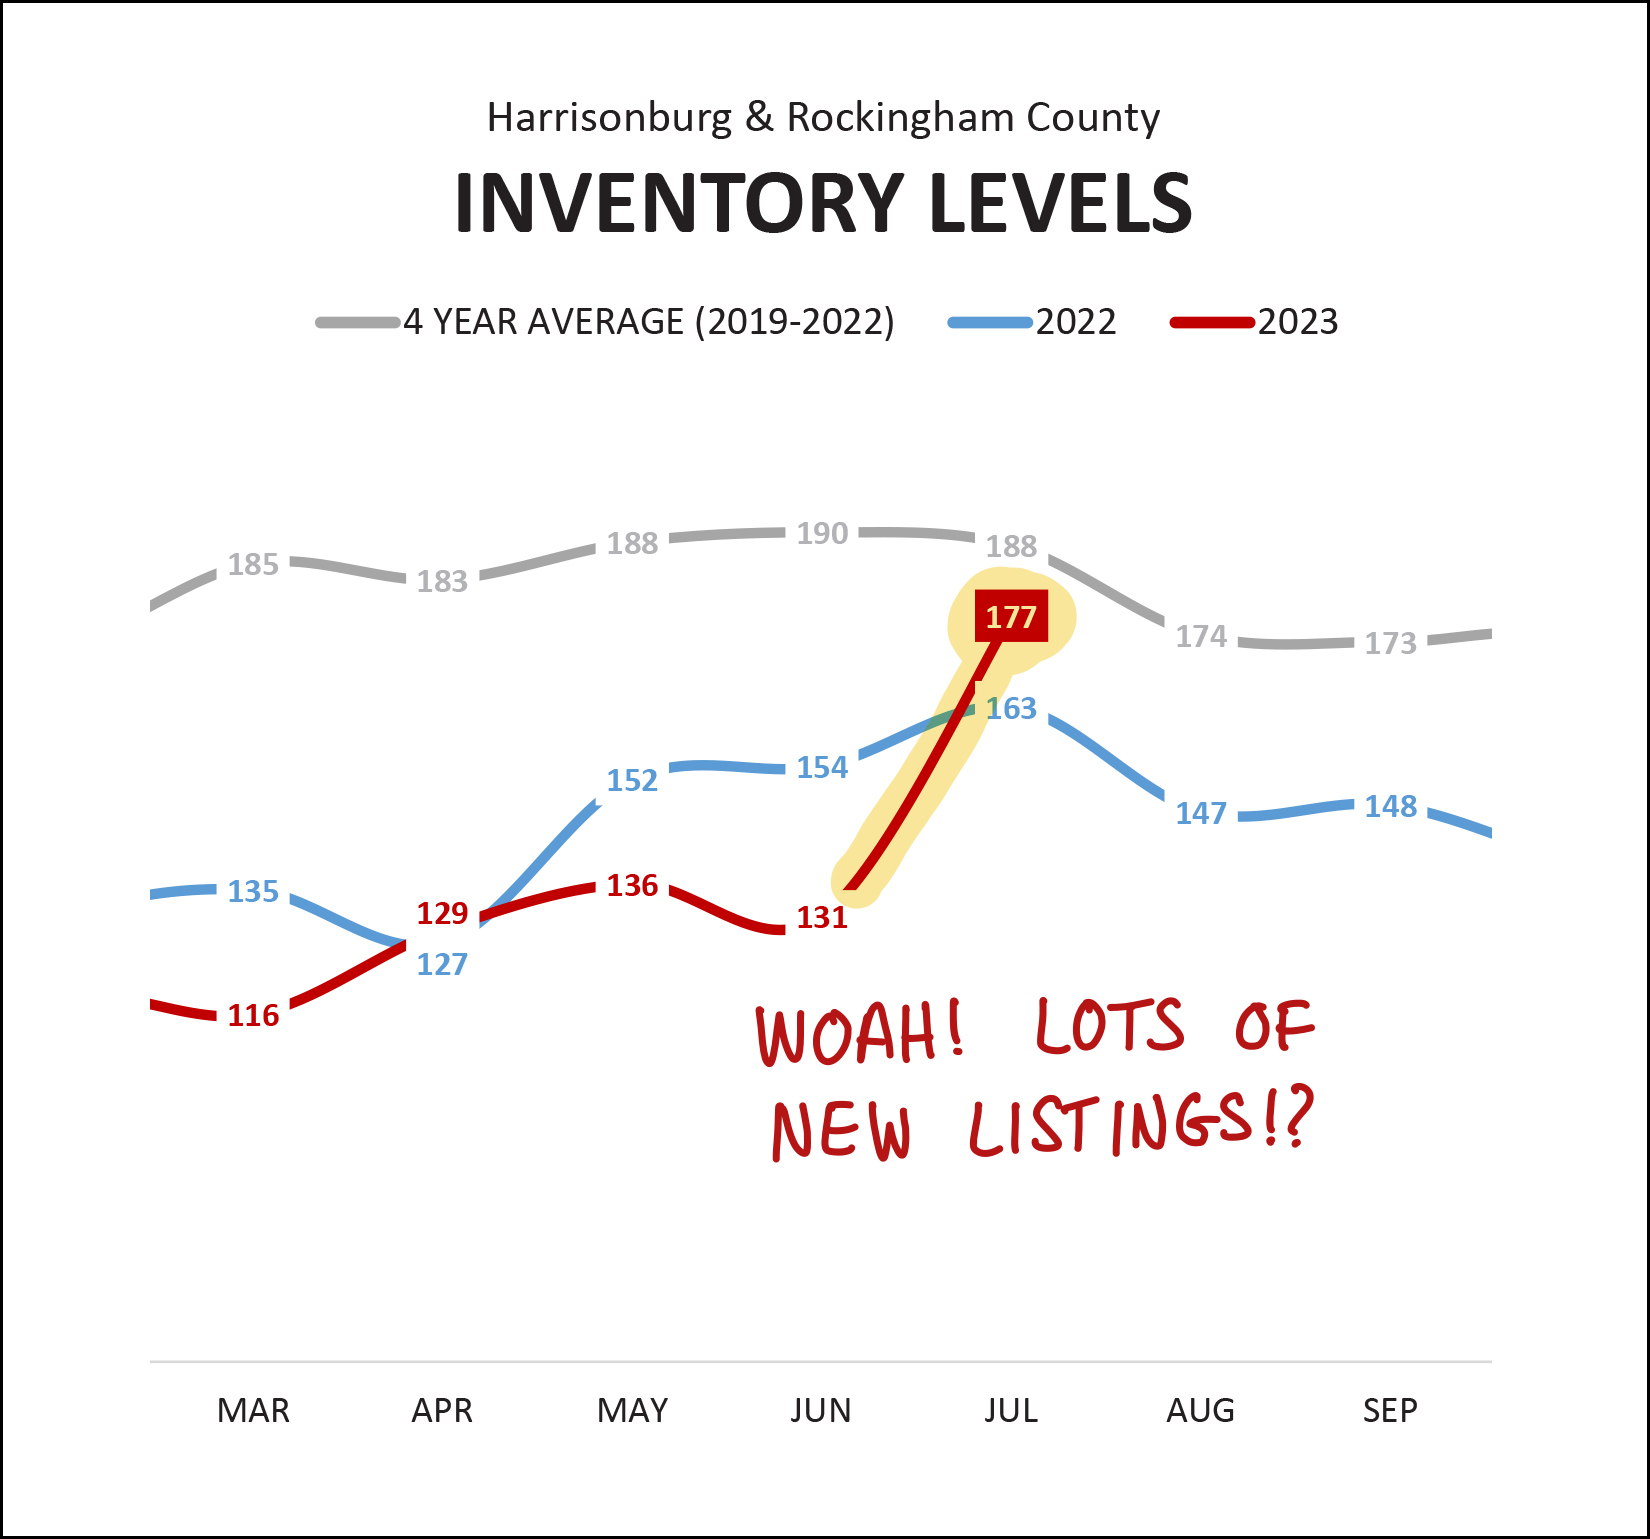 Despite lots of homes going under contract in July... inventory levels jumped up quite a bit (131 to 177) in a single month's time. This brings current inventory levels to the highest point that we have seen anytime in the past year. I'll take a closer look at some of these overall trends in the coming days to try to dial in whether there is another story to be told and understood. For now, it's clear that there are quite a few more listings on the market now than anytime of late. Moving through the next few months, it will be interesting to watch... [1] Will inventory levels bounce back downward after buyers have a chance to contract on some of these new listings? [2] Will we see more price reductions on listings as sellers have slightly more competition from other sellers in some price ranges and with some property types? [3] Will we see homes staying on the market longer than they have in the past? I don't know that we need to instantly jump to any conclusions about this increase in inventory levels, but the data over the next few months will help color in the picture of whether we are seeing any sort of a transition in our local housing market. Speaking of median days on the market... is it starting to rise? 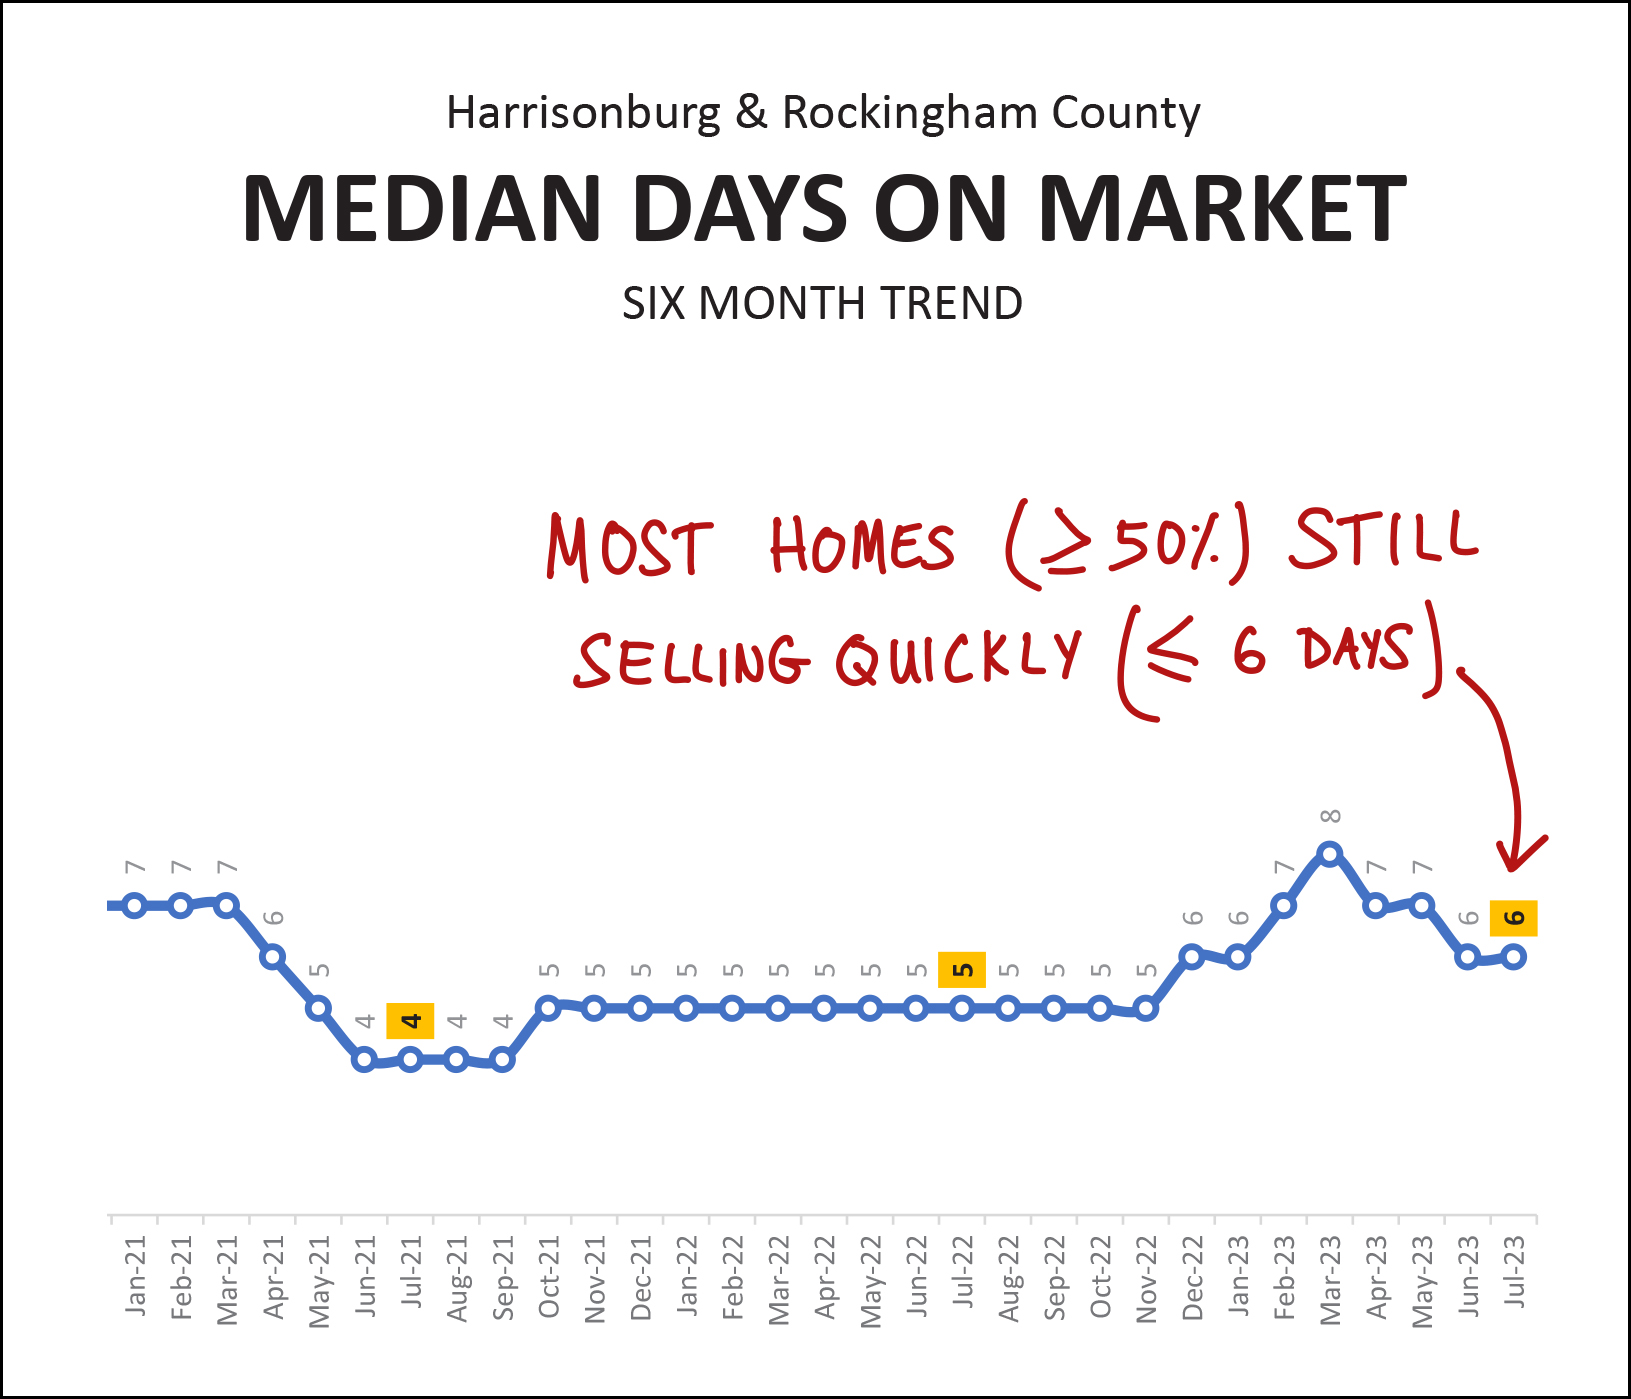 Mmmm... nope. Most homes (at least half of them) are still going under contract very quickly (in six days or less) in Harrisonburg and Rockingham County. This metric will continue to be helpful to gauge whether buyer enthusiasm is slowing at all in the local market. What could slow buyer enthusiasm, you ask? How about those mortgage interest rates!? 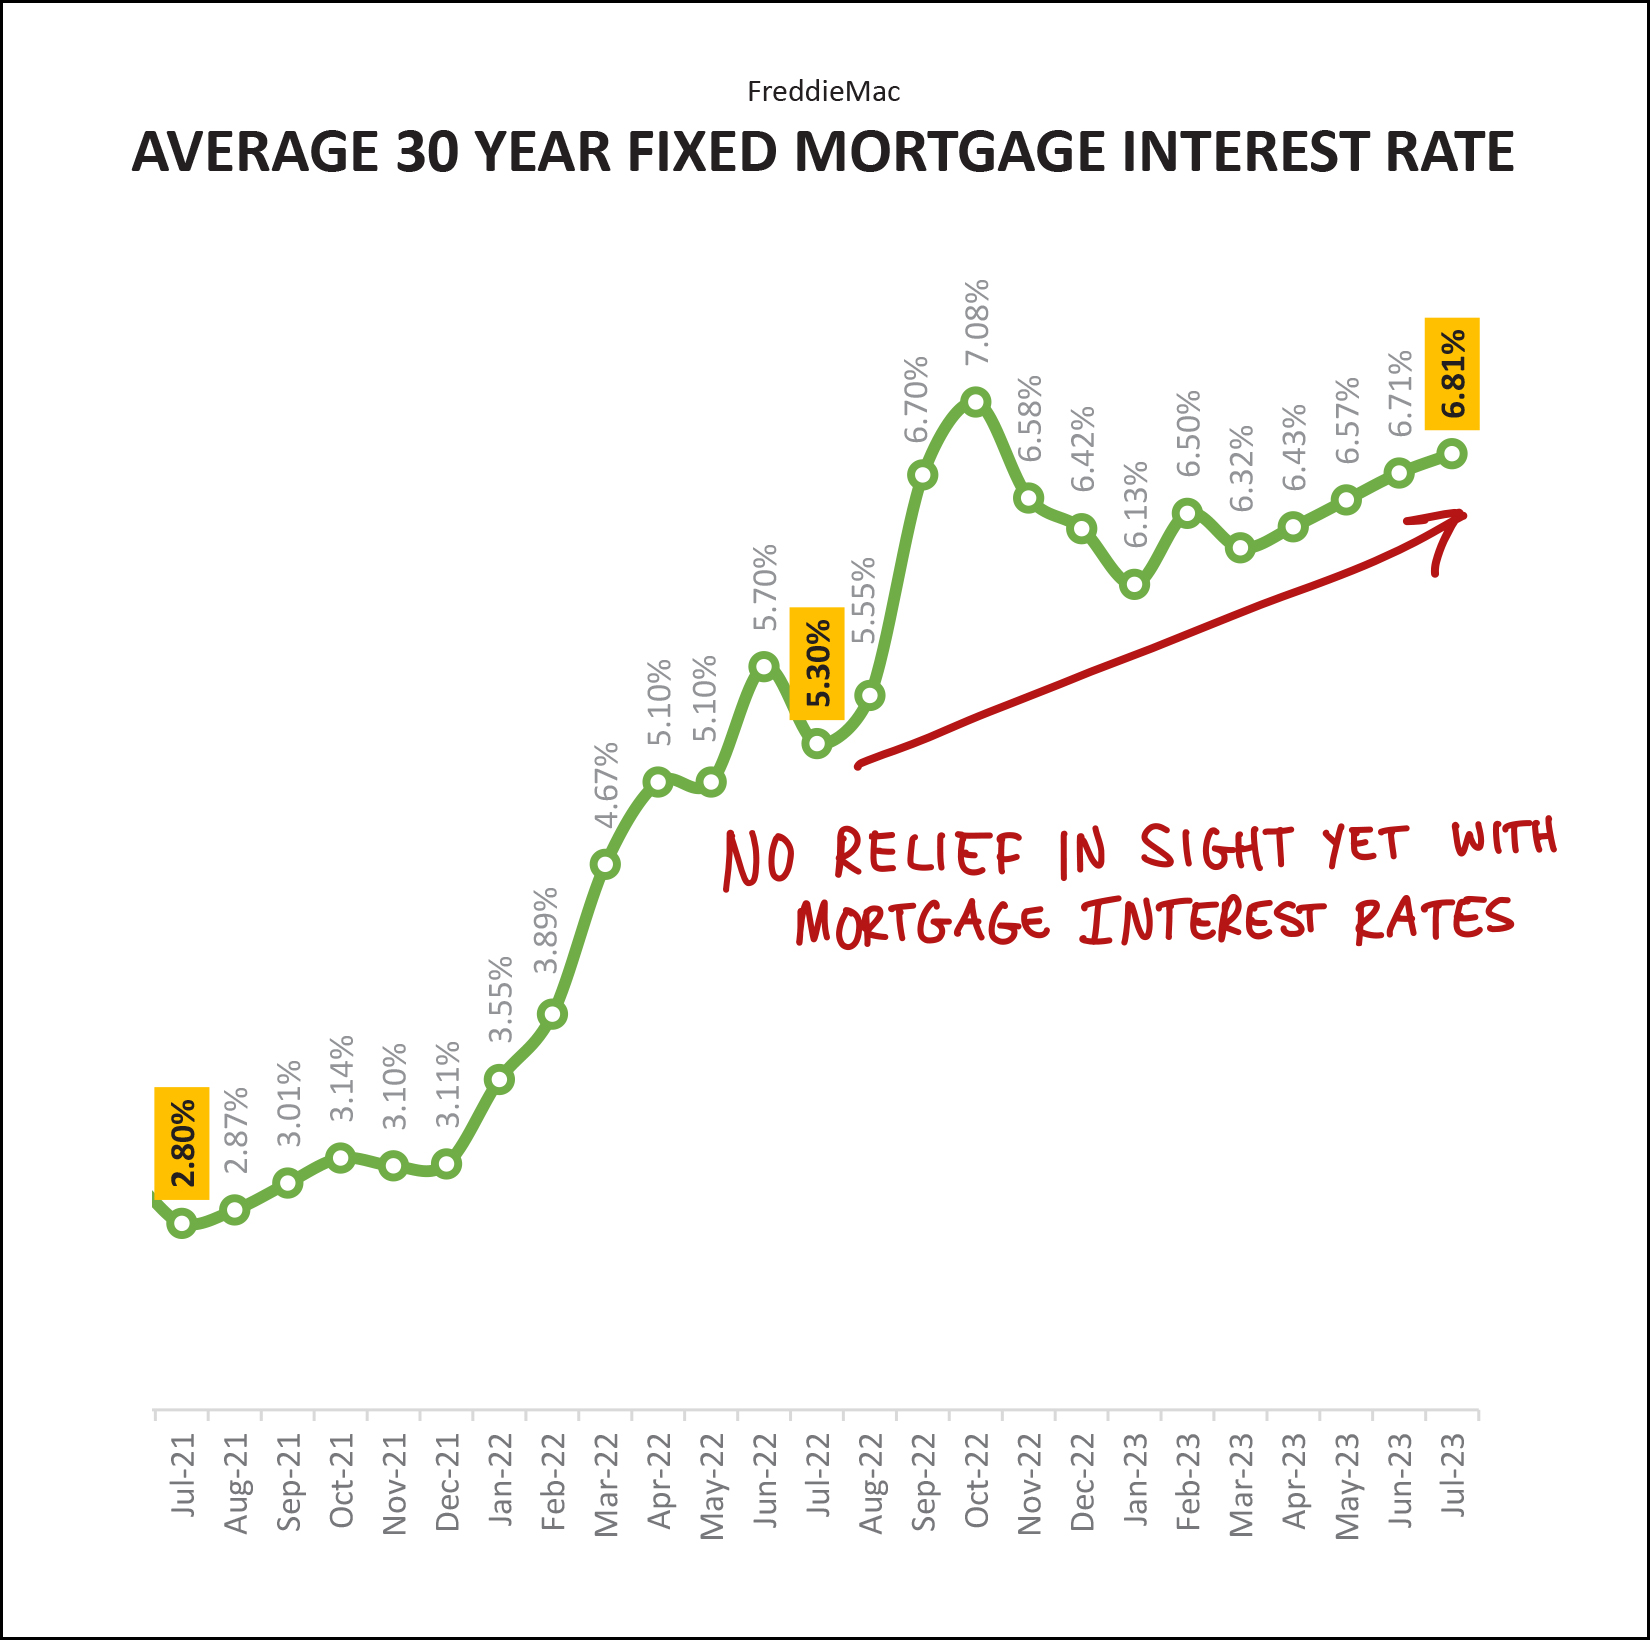 Don't look too far back on the chart above or you'll note that 2.8% mortgage interest rate two years ago. Wow! Even if we ignore the first year (first half) on the chart above, we still see a significant increase in mortgage interest rates over the past year... from 5.3% to 6.8%. We still aren't seeing any relief in sight with mortgage interest rates. Yet. I am hopeful that we move through the remainder of 2023 we'll start to see mortgage interest rates settle down a bit... but I'm guessing they will almost certainly stay above 6%. So, given all of the data above, what should you be thinking about if you are a home buyer, seller or owner? Home Buyers -- Many new listings are still seeing plenty of action... so you very likely may still find yourself in a competitive offer situation... but not always. Understand how current mortgage interest rates affect your potential monthly mortgage payment... and get out there quickly to see new listings. Home Sellers -- You might talk to friends who saw their home go under contract within three days with multiple offers. You might talk to other friends who have had their home on the market for three or four weeks without an offer. Both of those market realities currently exist... and it varies based on price range, property type, location, and many other factors. We need to take a close look at your corner of the local real estate market to devise a reasonable and realistic pricing and marketing strategy for selling your home in a timeframe that suits your needs. Homeowners -- Enjoy your ever increasing home value. If you're talking to a friend who is trying to buy a home, don't mention your mortgage rate, or how glad you are that you already own a home. ;-) And... that's all for today. I hope that the remaining days or weeks of your summer break (if you had one) are enjoyable, and that the start to the school year goes well for you if you are a parent, teacher or administrator. As always, feel free to reach out to me if I can be of any assistance to you as you make plans to buy or sell. You can reach me most easily at 540-578-0102 (call/text) or by email here. | |
Two Startling (Nationwide) Stats That Show Why Many Homeowners Are Not Likely To Sell Within The Next Few Years |
|
 Current mortgage interest rates for a 30 year fixed rate mortgage are averaging at 6.9% per Freddie Mac. Here are the two startling statistics as reported by Business Wire as well as by many others over the past few months... [1] 82% of homeowners have a mortgage interest rate below 5%. An enormous share of homeowners have super low mortgage interest rates on their homes because they bought their home between 2020 and 2022 when we were seeing ridiculously low, historically low, mortgage interest rates -- or they refinanced their mortgage during that time. Most of these 82% of homeowners with a mortgage interest rate below 5% are rather unlikely to sell their home (and pay that off) and buy a new home at current mortgage interest rates that are near 7%. [2] 60% of homeowners with mortgages have lived there for four years or less. We saw record numbers of home sales between 2020 and 2022, as the Covid-19 pandemic (and super low mortgage interest rates) prompted lots of folks to buy a home. Many homeowners eventually find that their home doesn't work as well for them -- based on size, layout, features, etc. -- but that doesn't usually happen within four years. As such, many or most of these 60% of homeowners who have been in their homes for less than four years are not likely to be selling anytime soon. What does all of this mean for our real estate market? We are likely to continue to see low numbers of resale homes coming on the market over the next few years as more homeowners opt to stay put rather than selling their home that likely has a super low mortgage interest rate - and that likely is a home they purchased in the past few years. | |
Homes Still Selling Quickly, At Record High Prices, Despite Decline In Total Home Sales |
|
 Happy Monday morning, friends! They say summer doesn't start until June 21st, but the 85 degree temps yesterday certainly felt like summer. Regardless of the formal start of the season of summer, most students have finished out their school year now, which also certainly makes it feel like summer. One such student who finished up his school year is this guy, below. Luke has now officially graduated from high school! :-) We are delighted for his accomplishment of this major milestone, and are excited for all that lies ahead. And yes, Emily also finished up 9th grade! These kids they sure do grow up quickly!  Looking for a new (to you) house this summer? Look no further than this brand new listing (just listed this morning) in the City of Harrisonburg... Find out more about this spacious four bedroom City home on a large lot by visiting 3121HorseshoeLane.com. And finally, one last item of business before we get into the real estate data. Each month I offer a giveaway, of sorts, for readers of this market report, highlighting some of my favorite places, things or events in Harrisonburg. Recent highlights have included The Little Grill, Cuban Burger and Taste of India. This super relaxing and family friendly music festival from June 23 - 25 at Natural Chimneys Park in Mt Solon features wonderful music (on multiple stages throughout the weekend), great food, lots of activities (hiking, biking, running, yoga, kids events), and all around great fun with family and friends. Have you considered going to Red Wing but haven't been yet? Maybe this summer is the time for you to make it one of your favorite family traditions. I am looking forward to being there with my family and I'm hoping you'll join in on the fun... from June 23rd through 25th. If you're interested in going to Red Wing but don't have tickets... I'm giving away a pair of three-day general admission tickets. Click here to enter to win the tickets... I'll pick a winner later this week. Now, on to the real estate data... 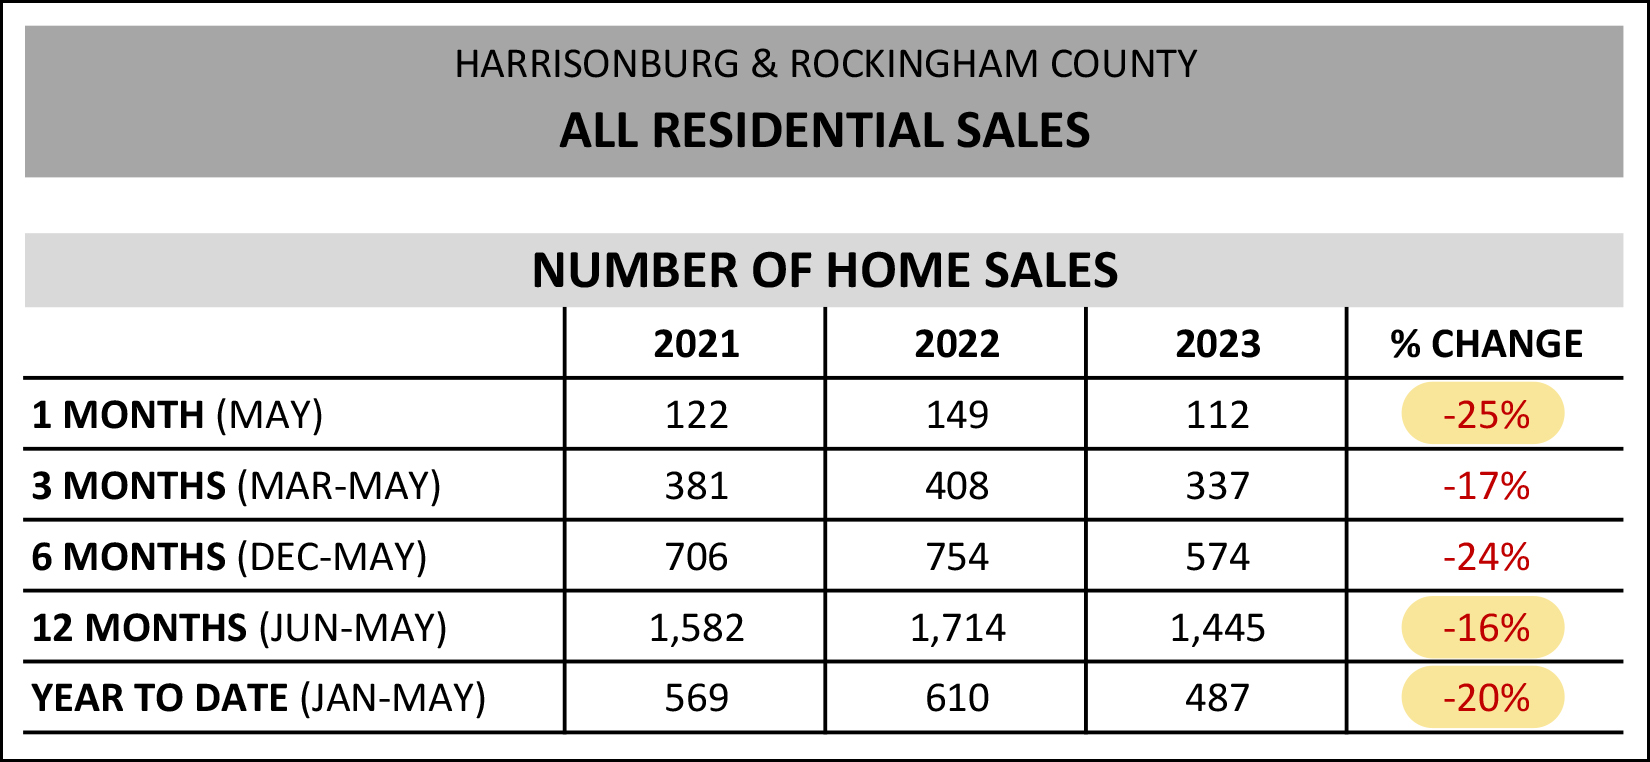 As mentioned in the headline, and as shown above, we're seeing far fewer home sales this year than last... [1] This past May (last month) we saw 112 home sales in Harrisonburg and Rockingham County, which marks a 25% decline from last May. [2] When looking at the first five months of this year, there has been a 20% decline in home sales compared to last year during the same (Jan-May) timeframe. [3] When looking at a full year of data (June - May) the number of homes selling in our area has declined 16%. A year ago we were seeing an annual pace of 1,714 home sales... and that metric has now declined to an annual pace of 1,445 home sales! But... fewer home sales has not resulted in lower sales prices... 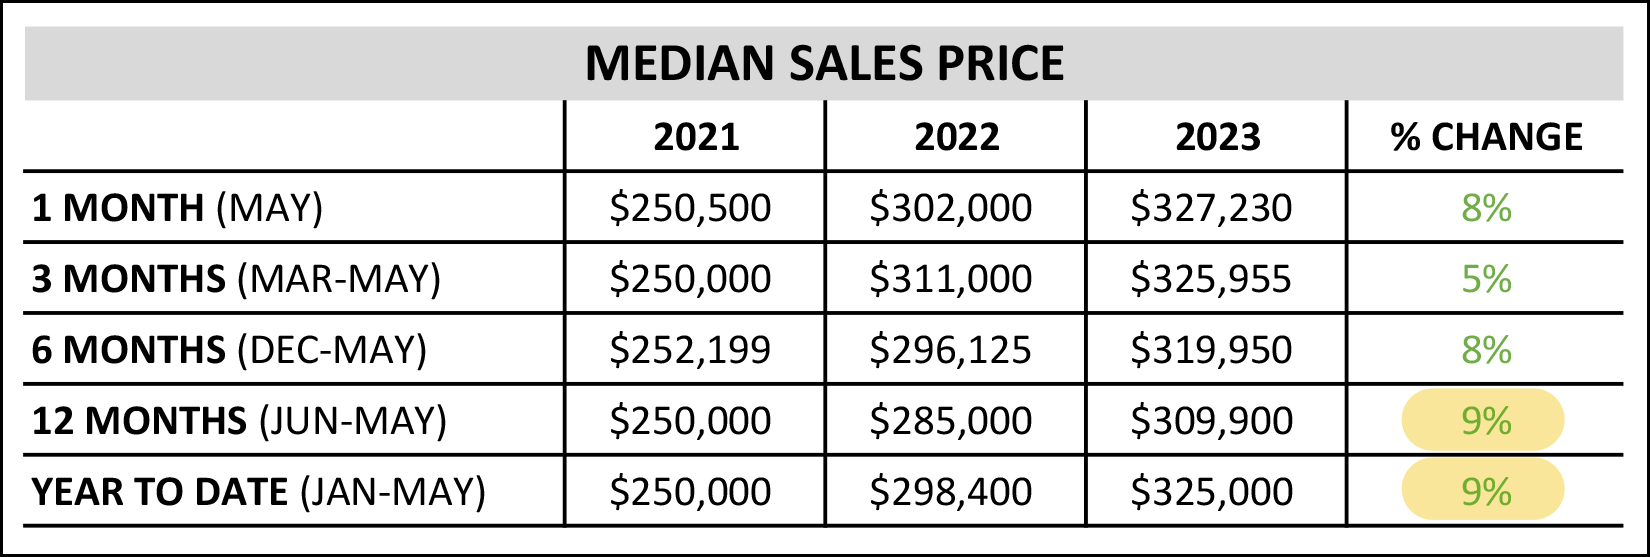 As home sales have started to decline, some folks speculated that prices would also start to decline. That hasn't been the case, and I believe it's because the decline in sales is a supply side issue, not a demand side issue. There seem to be plenty of buyers still wanting to buy... but fewer sellers willing to sell. We need both a buyer and seller in order for a home sale to happen... so fewer sellers results in fewer home sales... but the continued ready supply of buyers is keeping competition fierce for most new listings, which is causing home prices to keep on rising. As shown above, the median sales price thus far in 2023 ($325,000) is 9% higher than it was a year ago ($298,400) and when we look at 12 months of data (June - May) we also see a 9% increase in the median sales price over the past year. I should point out that each month I prepare many more charges and graphs than make it into this report. You can also view those over at HarrisonburgHousingMarket.com including this month's charts and graphs here. One of the data subsets I dive into in the extra charts and graphs at the link above is the breakdown of new home sales vs. existing home sales... 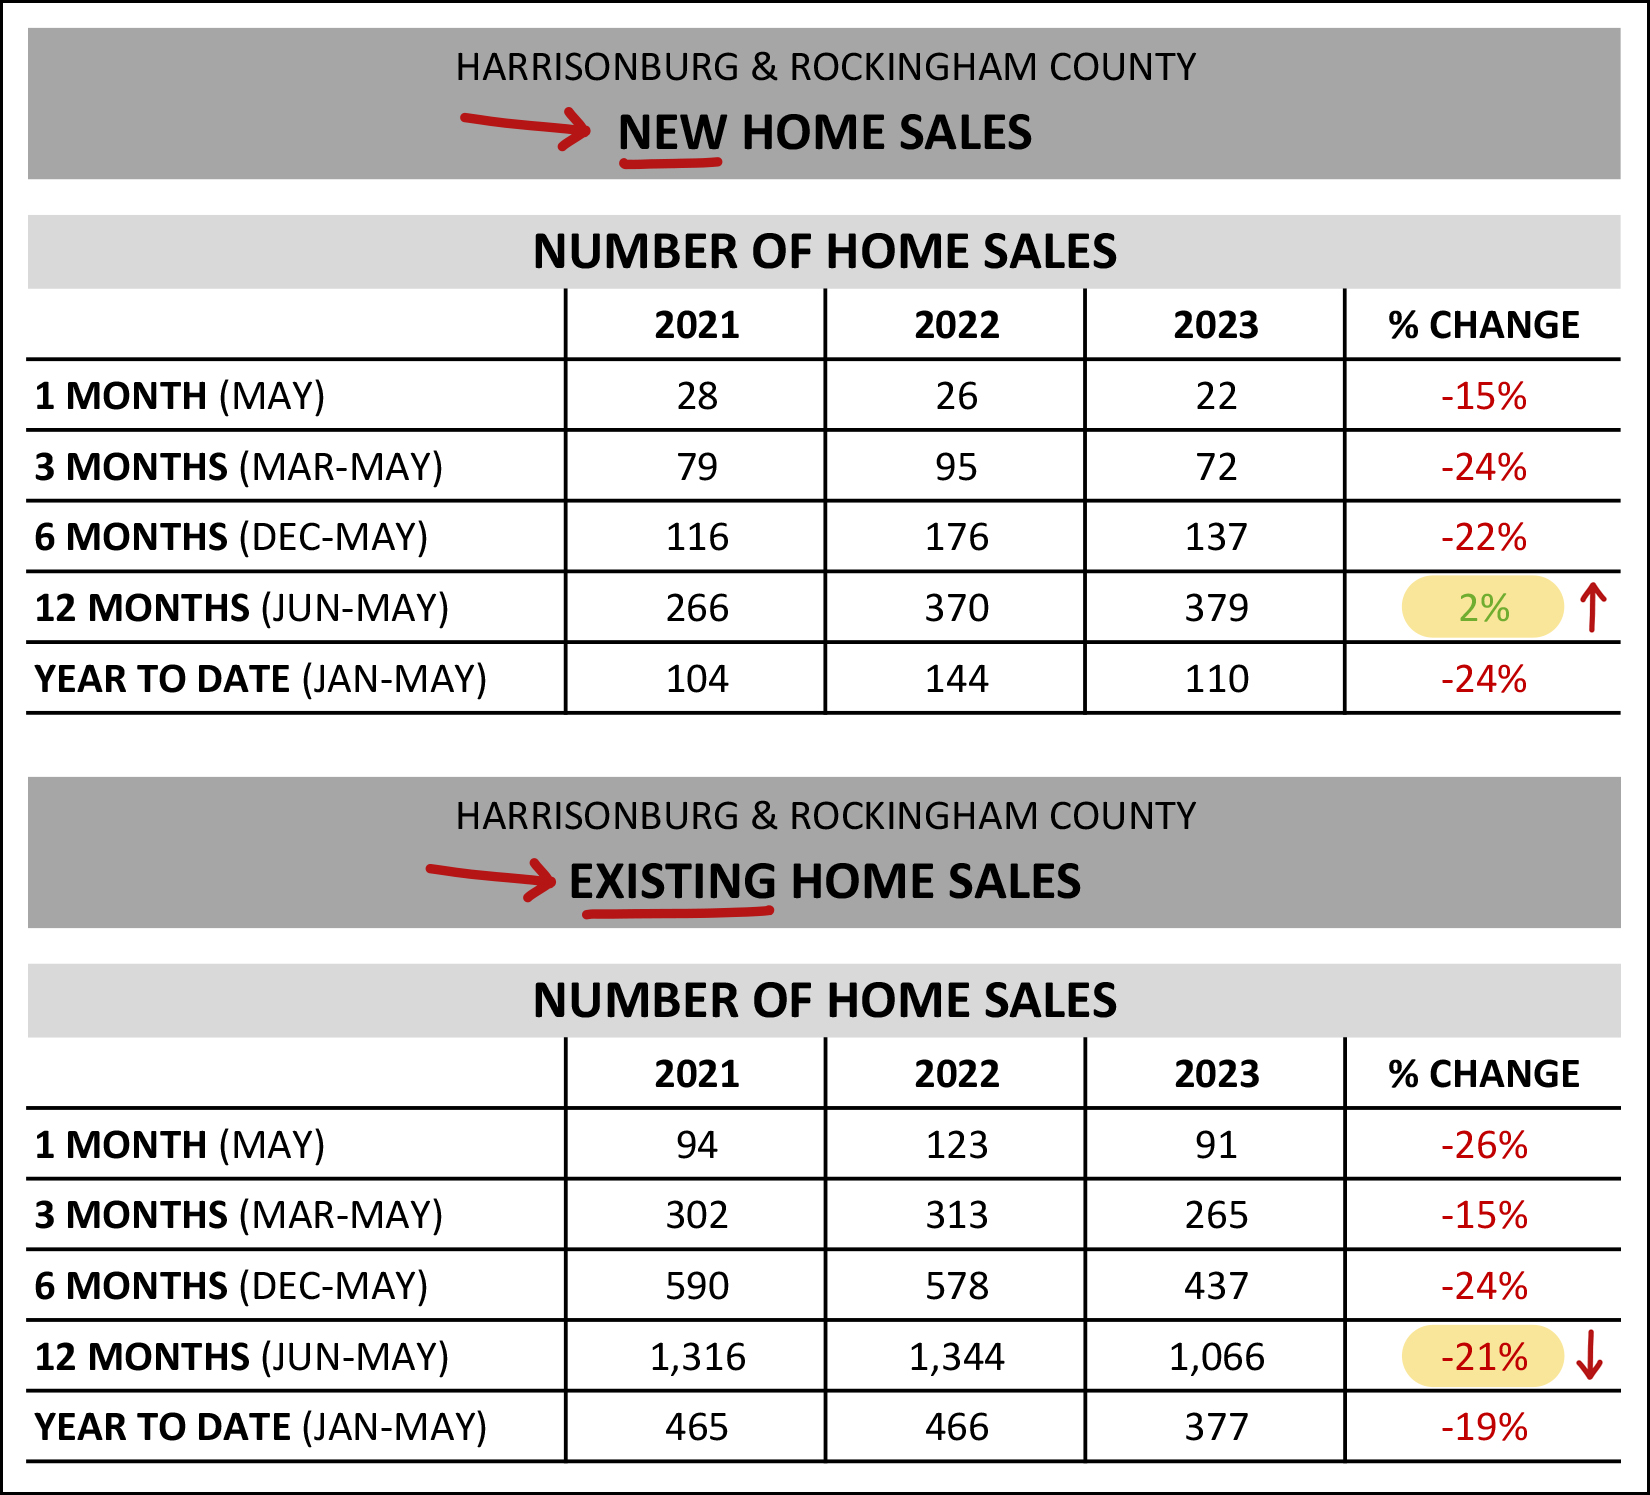 As shown above, when we look at the past 12 months we see slightly different trajectories when it comes to new vs. resale homes... [1] There have been 2% more new home sales over the past 12 months as compared to the previous 12 months. [2] There have been 21% fewer existing home sales over the past 12 months as compared to the previous 12 months. Certainly, when we look at other timeframes above, we see declines in sales activity of both new and existing home sales, but it's worth nothing that a significant cause of fewer home sales in our market... is a lower number of homeowners who are willing to sell their existing (resale) homes. Why, might you ask? Mortgage interest rates are likely a key piece of the puzzle. Most homeowners have current mortgage interest rates under 5%, and many under 4%... compared to current mortgage interest rates that are above 6%. As such, the difference in mortgage payments is quite significant for a homeowner who would sell their home and pay off a mortgage with an interest rate under 4% (for example) to then take out a mortgage with an interest rate above 6%. I expect we will continue to see lower numbers of homeowners willing to sell their homes throughout the remainder of 2023. Getting into some visuals now, here's how slow May was... 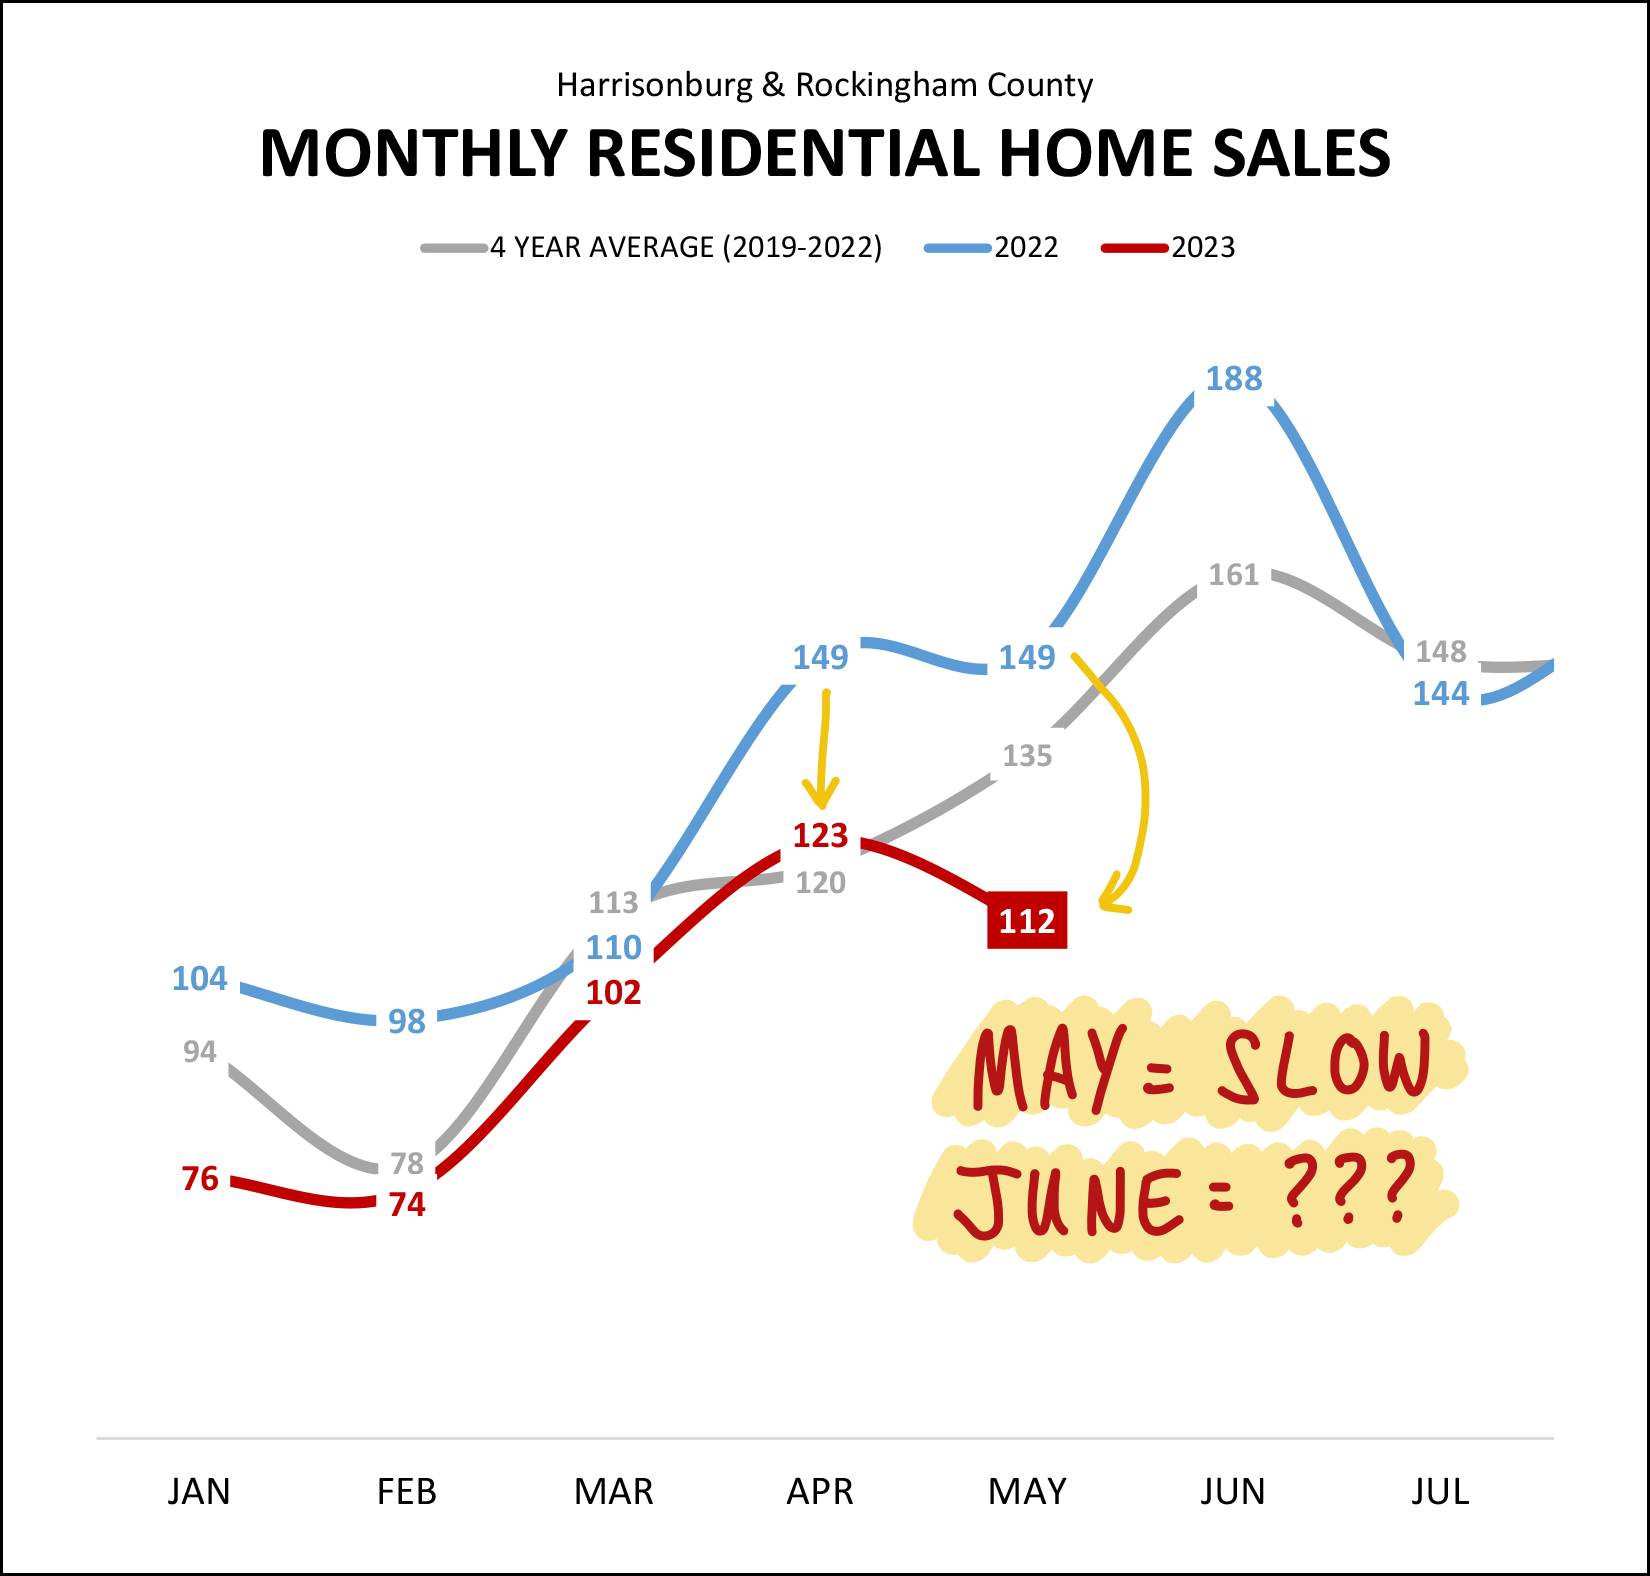 After a 17% decline in April home sales (149 to 123) we then saw a 25% decline in May sales (149 to 112) which is almost certainly going to result in an even larger decline in June home sales... since there were a LOT of sales in June last year. As I have already mentioned, sales prices keep on climbing, so a decline in the number of homes selling isn't really a concern for home sellers, or homeowners, but it is not as exciting of news for would-be home buyers. We are likely to continue to see fewer home sales throughout the remainder of 2023 in Harrisonburg and Rockingham County... and it will be a result of fewer homeowners being willing to sell... not a result of fewer would be home buyers being interested in buying. Here's another visual of the general trends we're seeing in our local housing market right now... 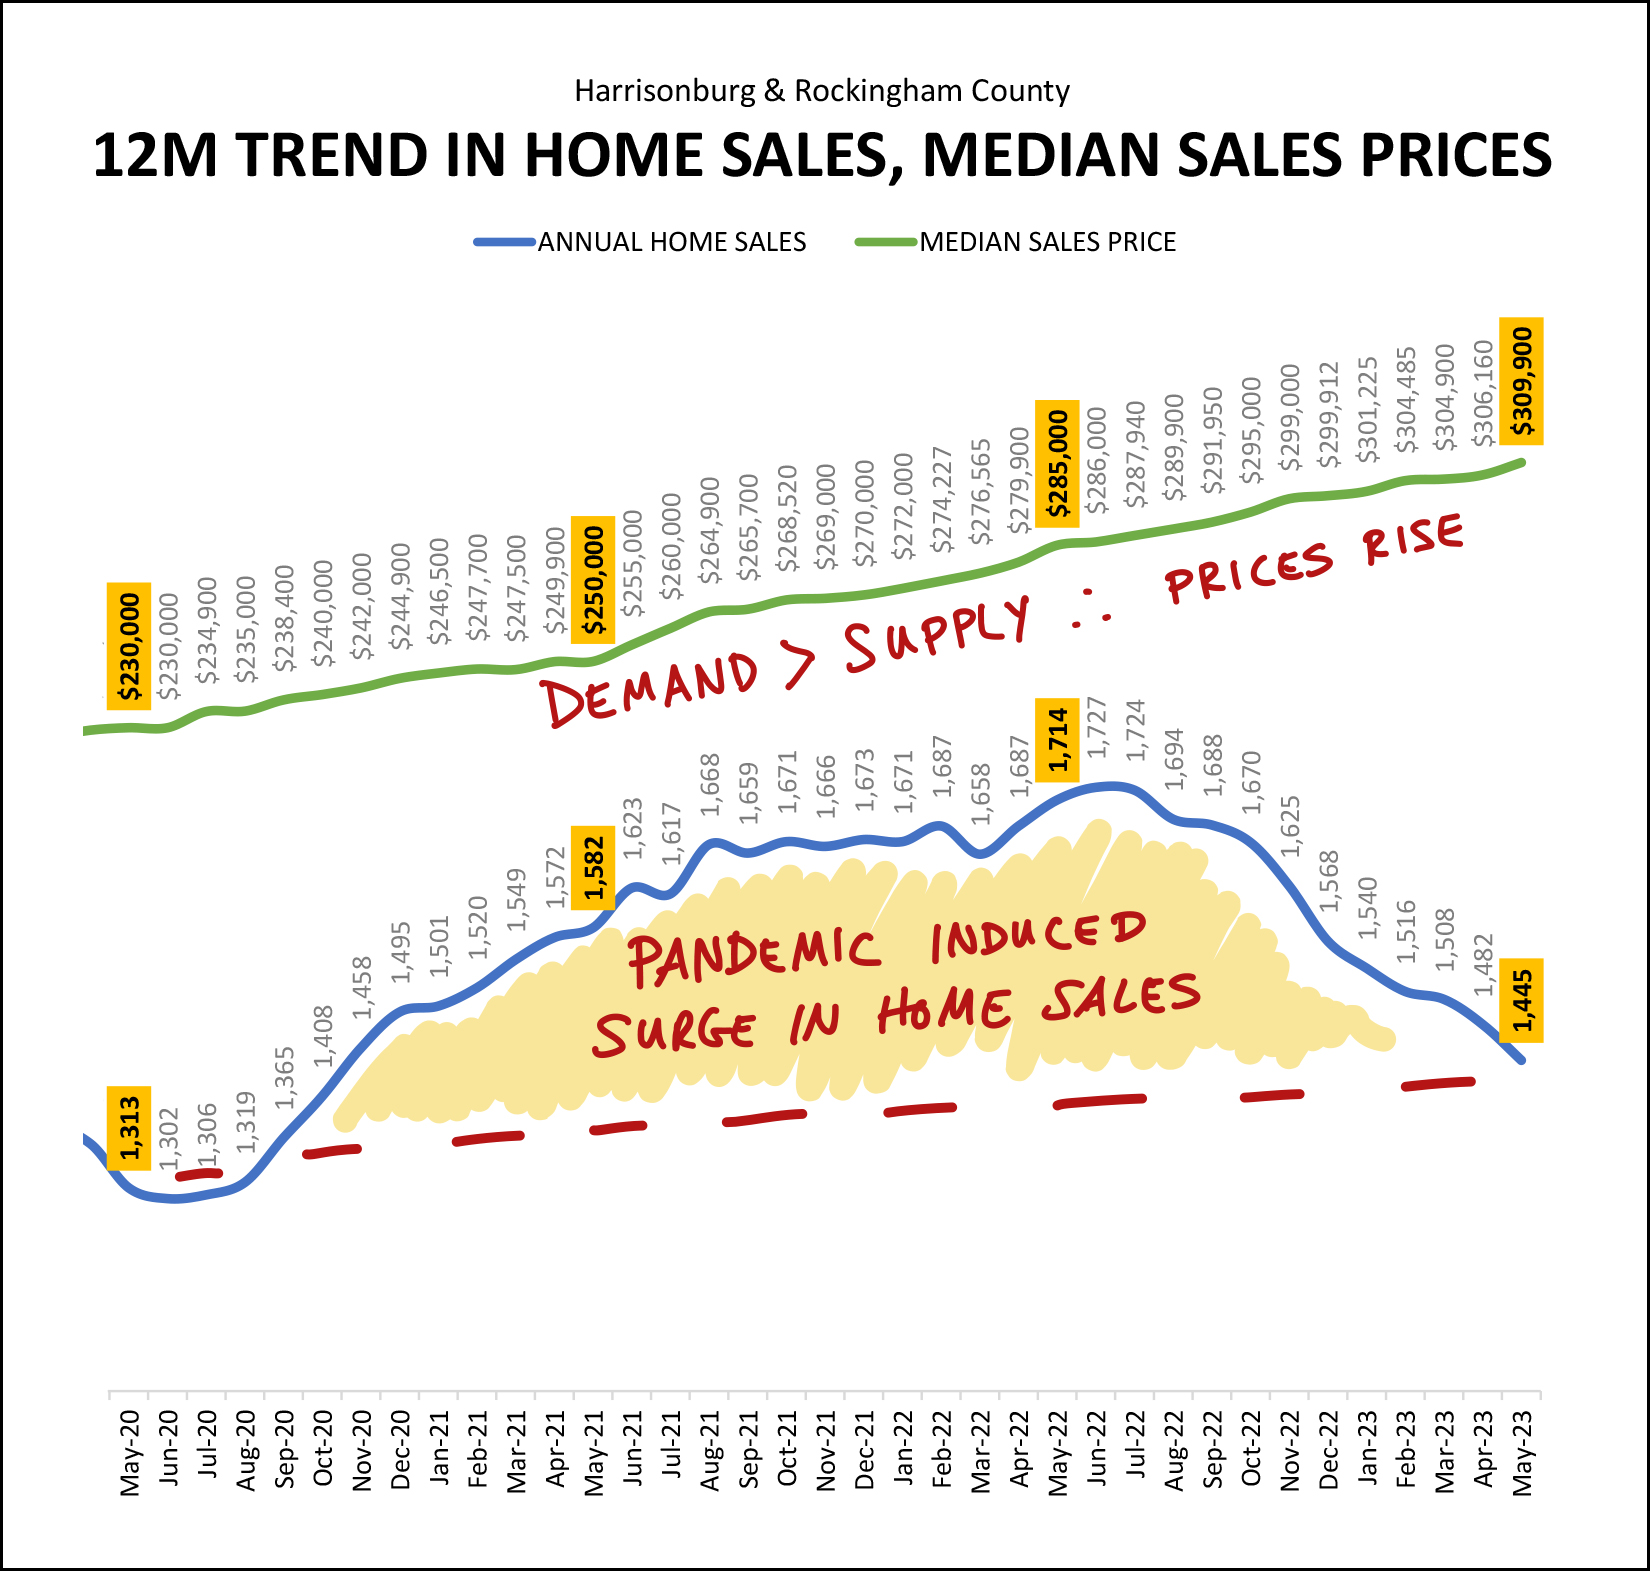 We're still seeing a general increase in the number of homes selling per year if we compared pre-pandemic (early 2020 and prior) and post-pandemic (2023) but we've seen a steady decline in annual home sales over the past year, from 1,714 sales/year to 1,445 sales/year. So, after a steady increase in home sales during the pandemic (largely brought on by the pandemic - with super low mortgage interest rates and everybody needing their home to serve more functions than before) we have now seen a steady decrease in home sales as the pandemic has come to a close. We're returning to where we were pre-pandemic as far as how many homes are selling a year... with the home sales trendline being dragged down by a limited number of home sellers being willing to sell. There seem to still be plenty of buyers ready and willing and able to buy. With continued high levels of demand, but lower levels of supply, we have continued to see steady increases in sales prices as shown by the top line. That trendline (rising prices) seems unlikely to change course significantly anytime in the near future. But even if we aren't likely to see home prices stop rising, or to see them decline, perhaps we'll see a slight tapering off of the surge in sales prices? 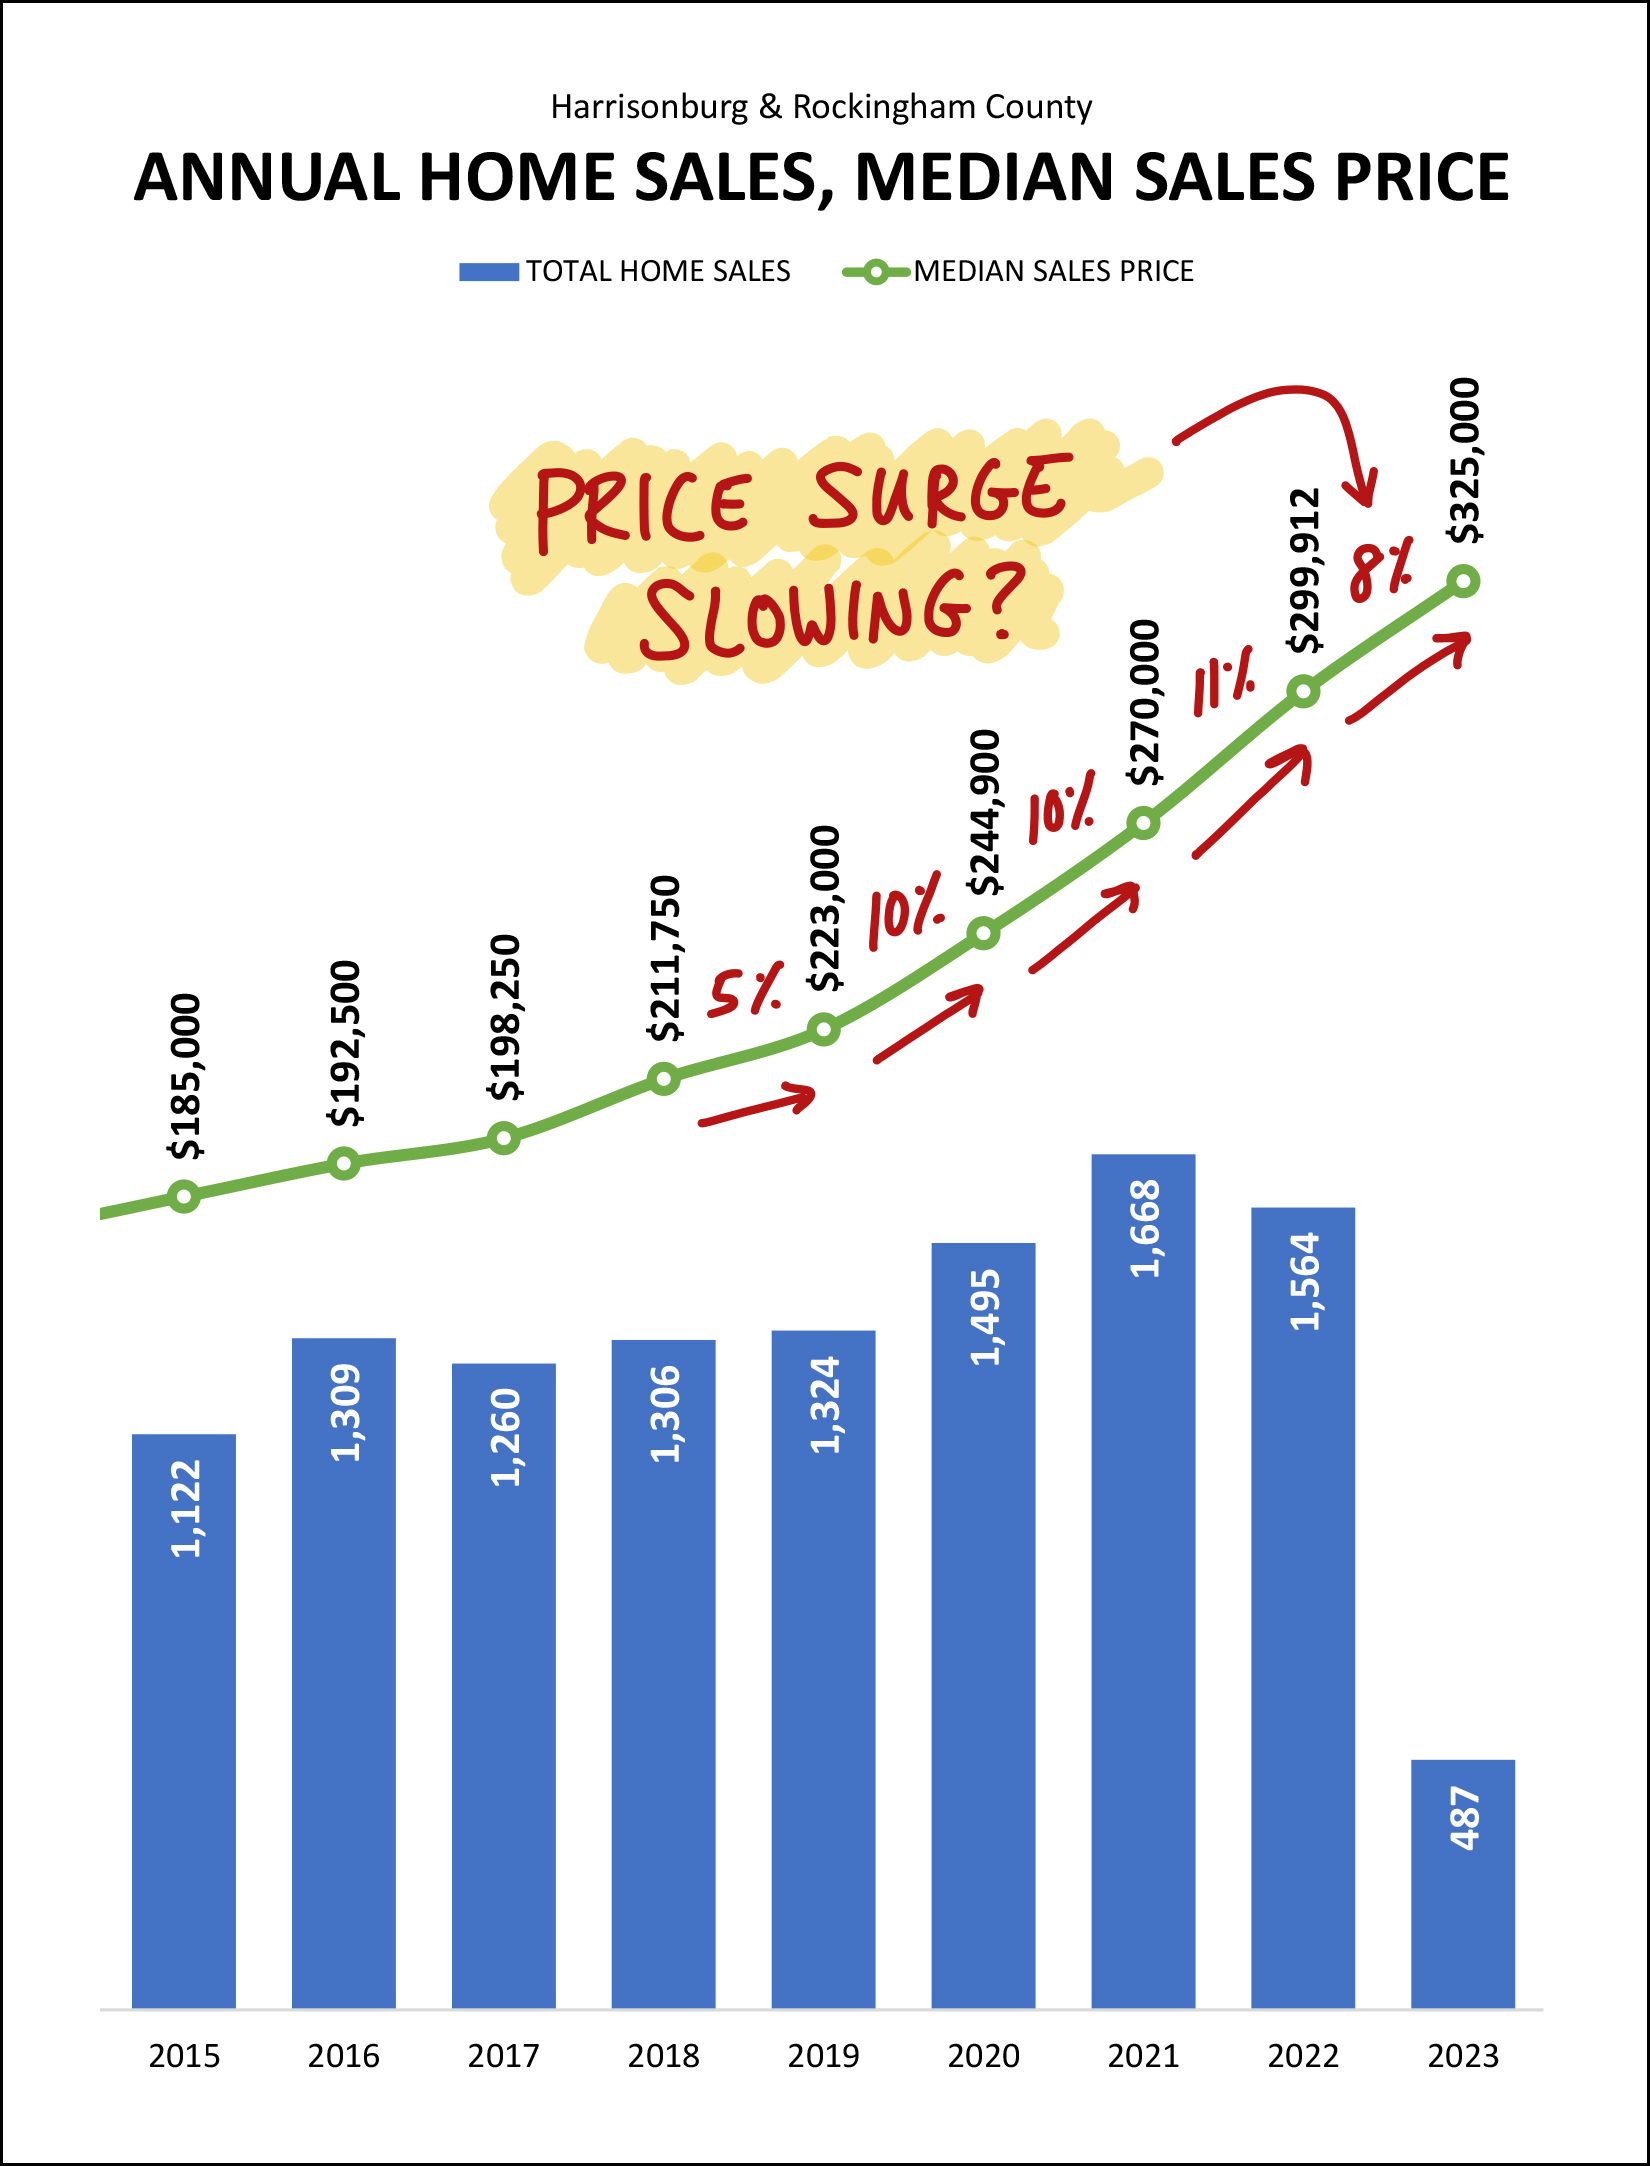 In the last full year before the pandemic (2019) we saw a 5% increase in the median sales price in Harrisonburg and Rockingham County. Then, we saw three years of double digit increases in the median sales price with a 10%, 10% and 11% increase in 2020, 2021 and 2022. Thus far in 2023, we are seeing a slightly smaller increase in that median sales price, with an 8% increase through the end of May. Of note... sales prices are not declining... they are just increasing slightly more slowly than they have over the past three years. Stay tuned to see how this metric does or does not continue to change as we move through the next few months. Looking ahead, though, contract activity is our best indication of what we are likely to see in the way of closed home sales over the next few months... 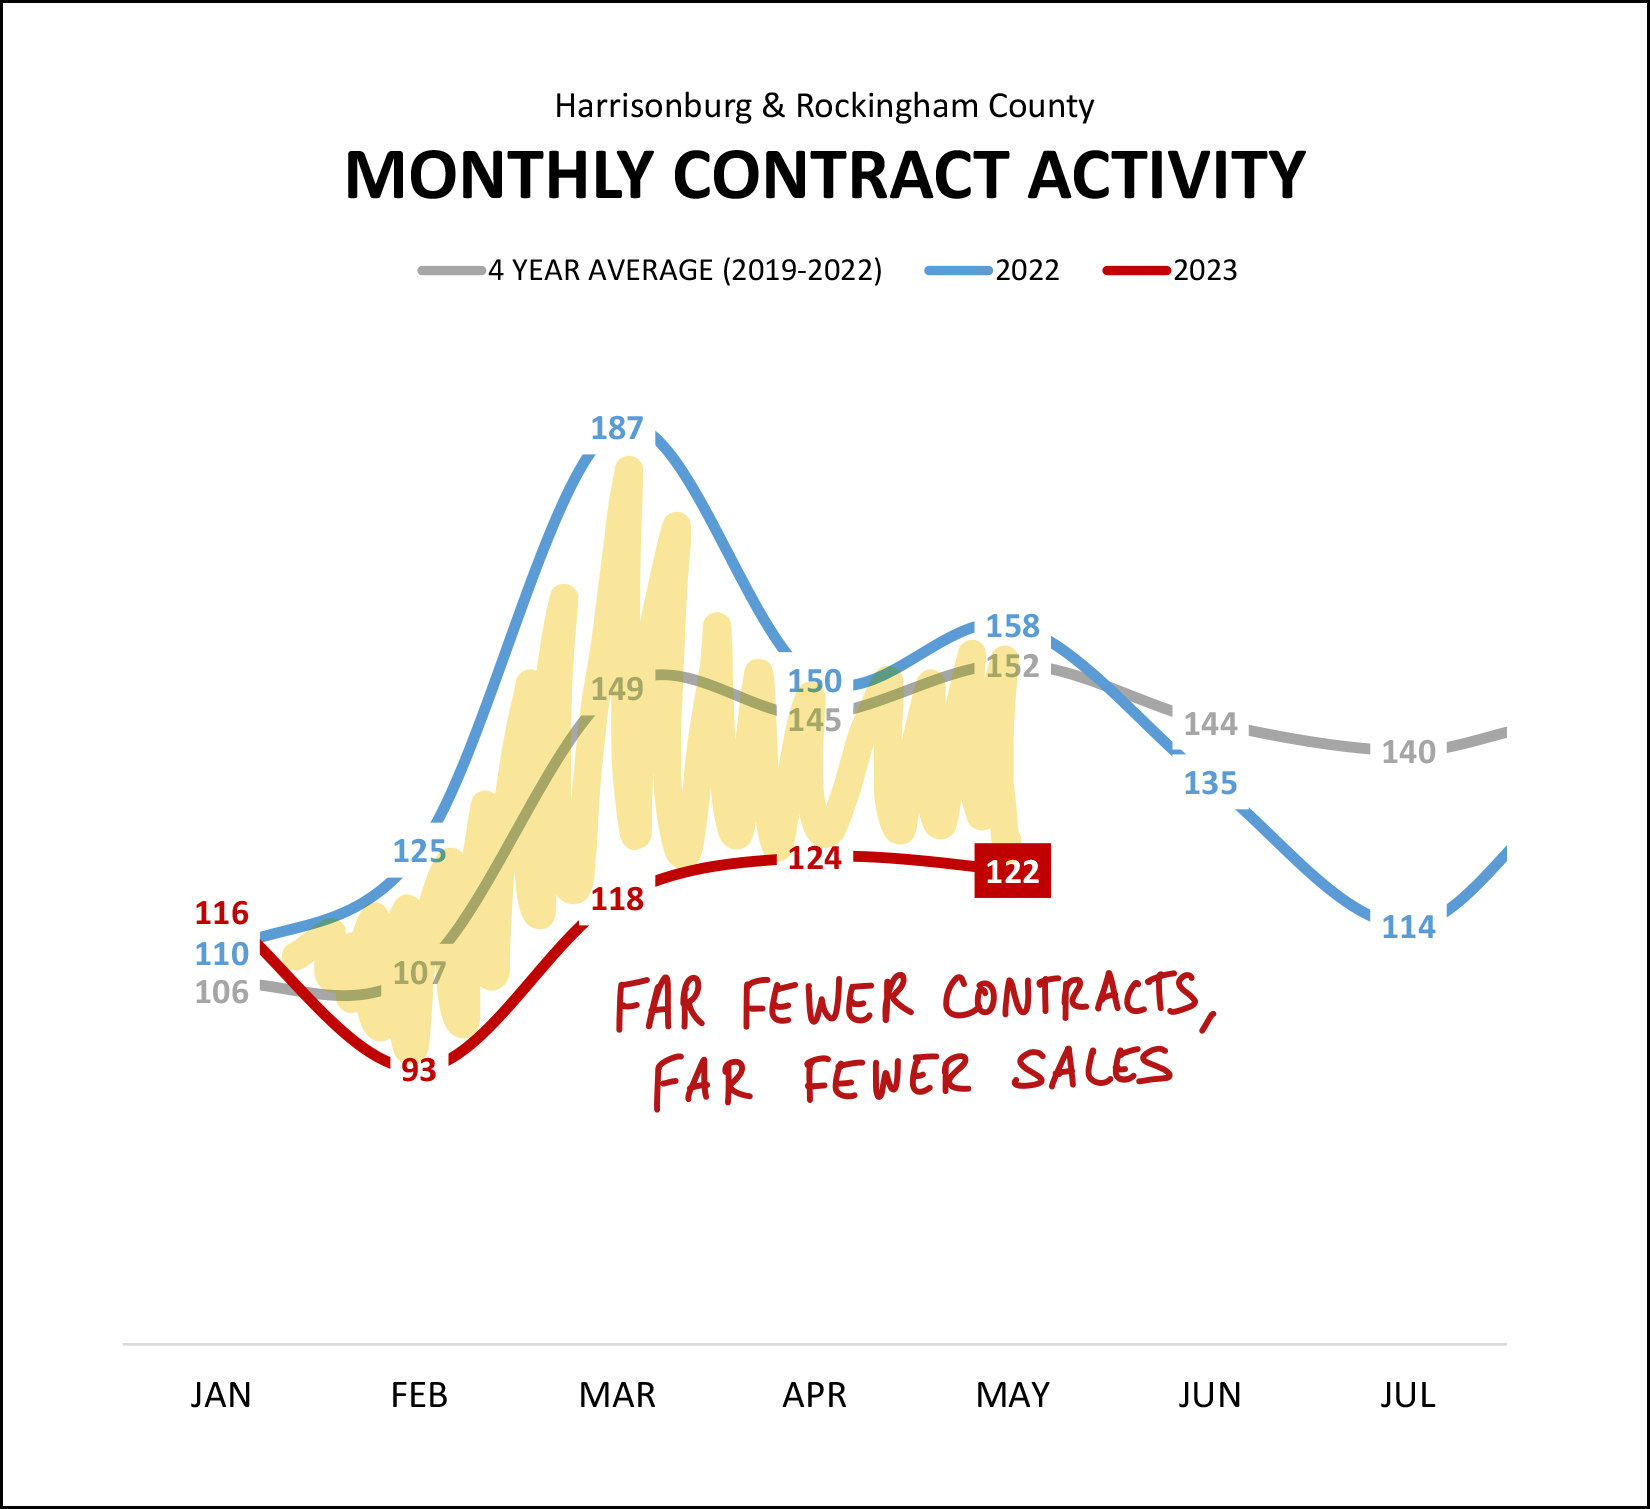 As you can see, we have now closed out the fourth month in a row of significantly lower levels of contract activity in Harrisonburg and Rockingham County. The red line is measuring contracts signed per month this year, and the blue line shows the same months last year. As such, we are likely to continue to see lower levels of closed sales over the next few months, given lower numbers of contracts being signed. And finally, here's a visual of the supply side of the market... 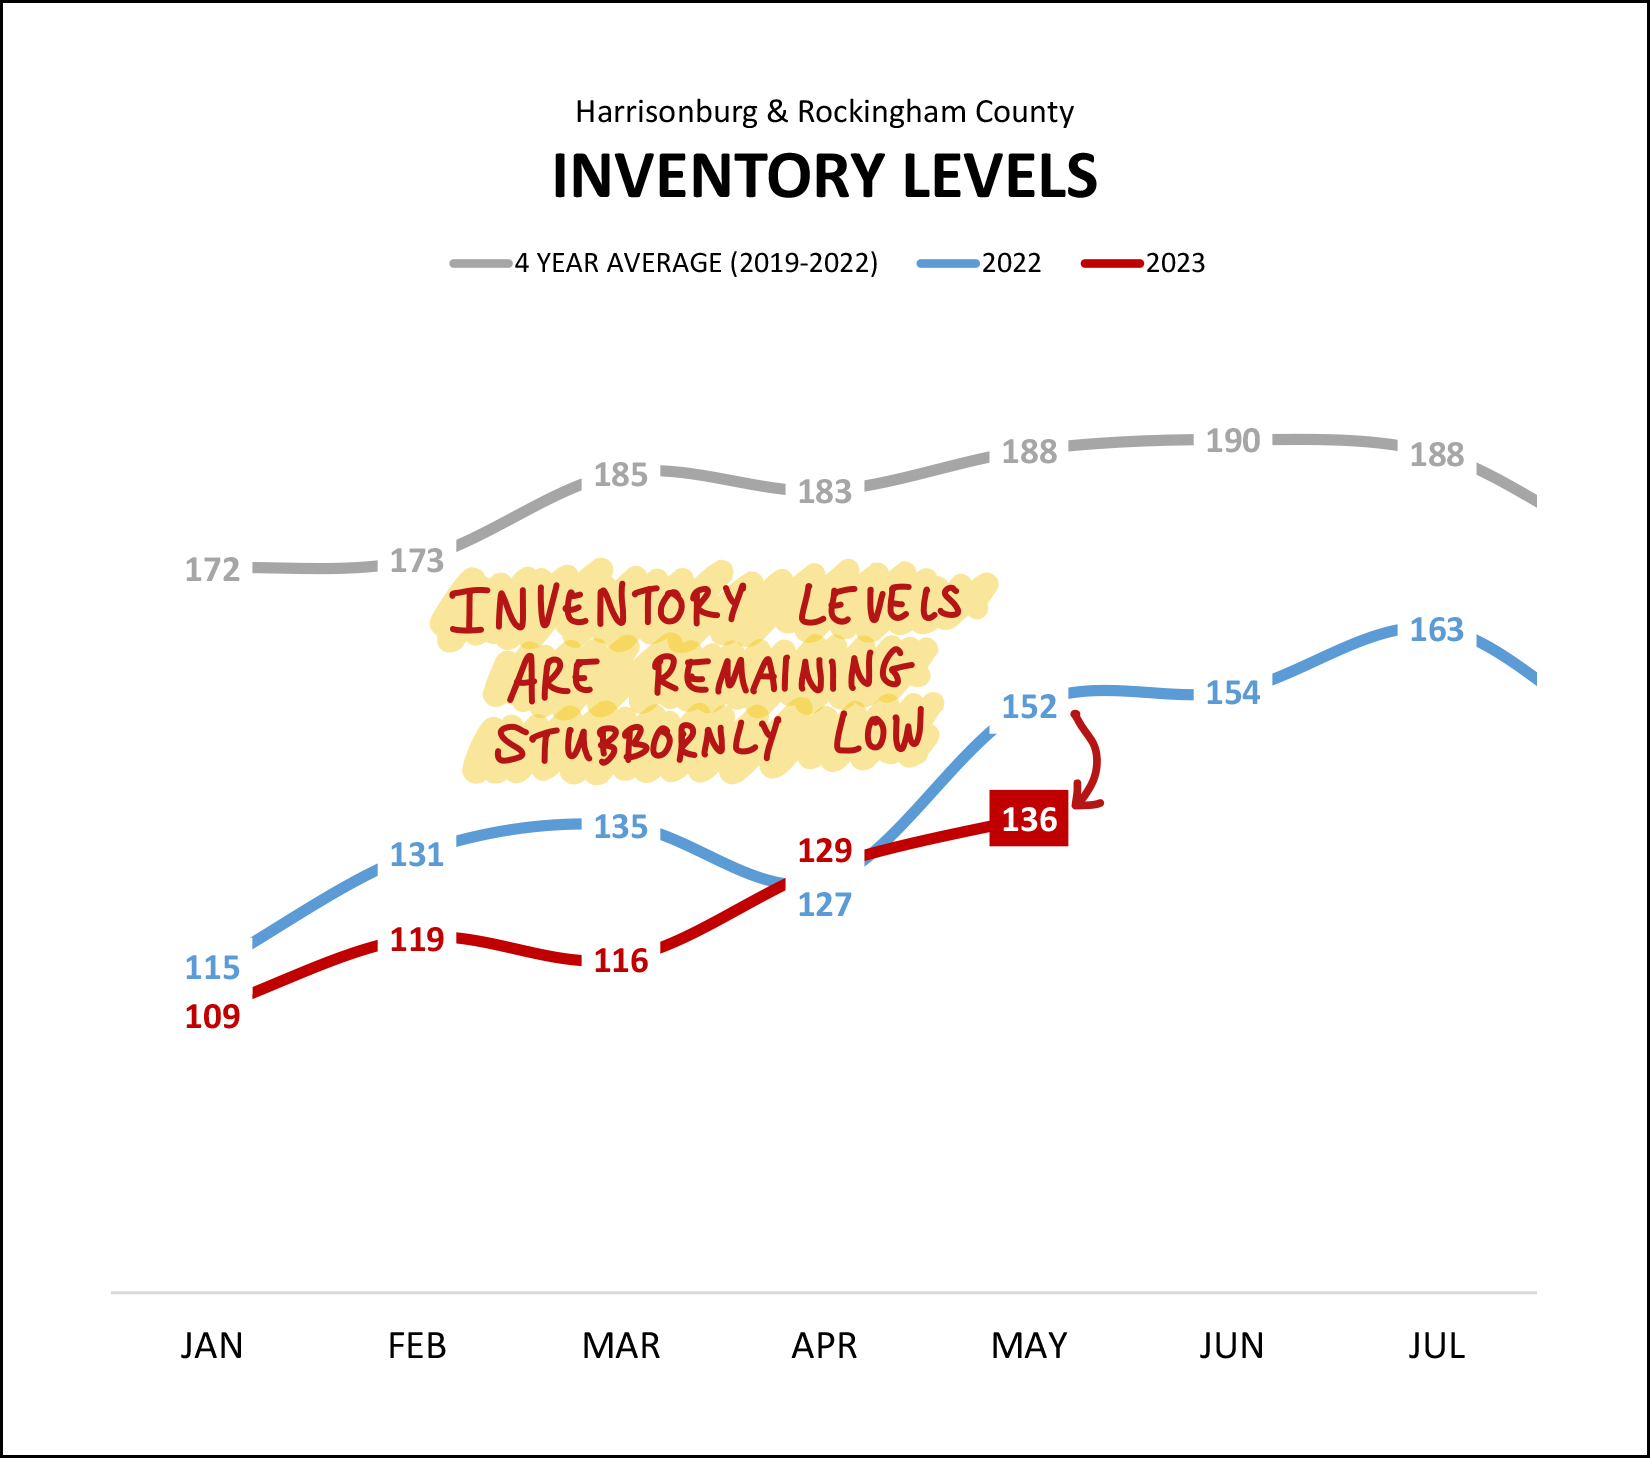 Despite 20% fewer home sales this year... inventory levels are lower than they were a year ago. The red line above shows inventory levels this year, compared to last year in blue. If we were seeing a shift in the market, with demand softening, we would start to see inventory levels increasing. We're just not seeing that. As such, the 20% decline in home sales seems almost certainly to be a result of an insufficient number of homes being available for buyers to buy. Now, for all the stats folks out there, here's the statistic that could be the most misleading... 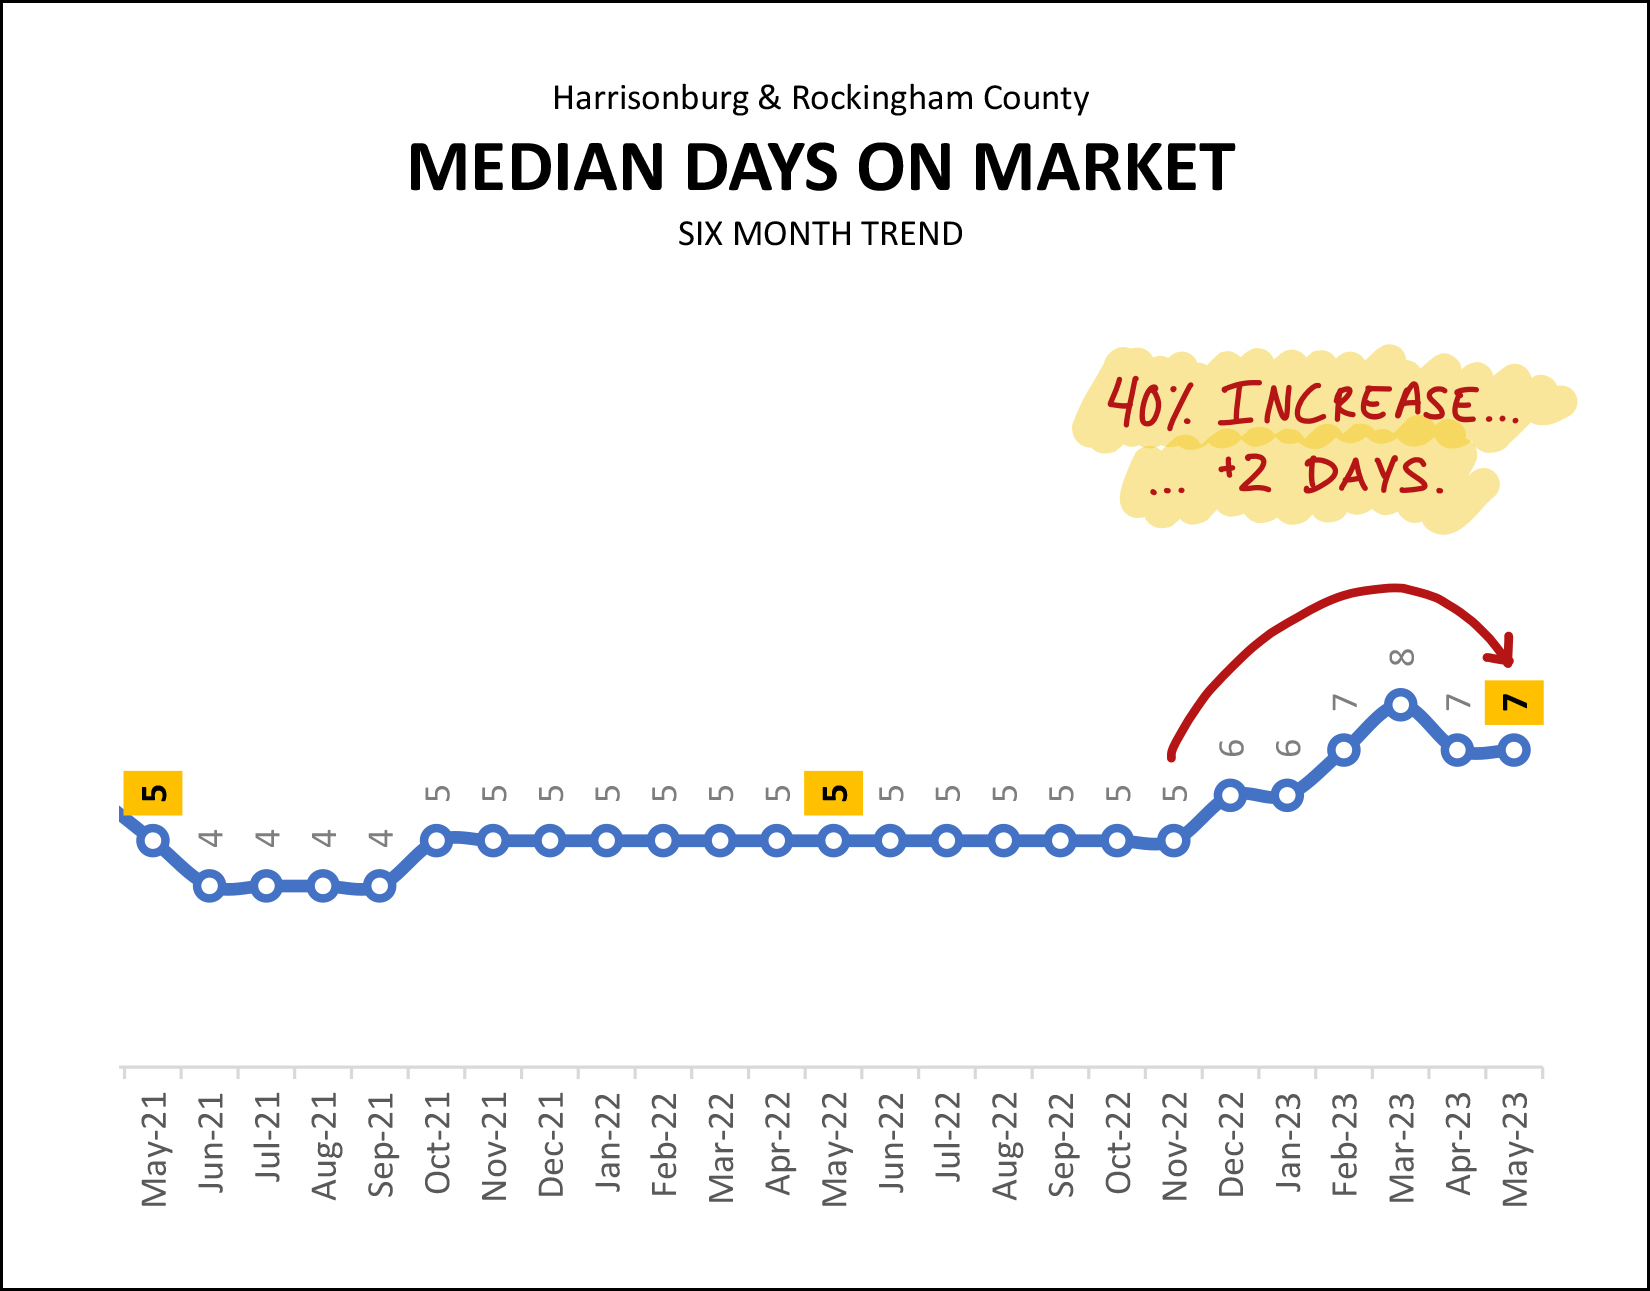 We have seen a 40% increase in the time it takes for a house to go under contract in Harrisonburg and Rockingham County! Gasp! Oh my! But wait... that just means that it is taking seven days for a house to go under contract... instead of five days? Yes, that is correct. The 40% increase in the median days on market is an increase from five to seven days. Ask just about any would-be buyer and they will report that this doesn't measurably change how quickly they need to act on seeing and pursuing new listings. And another interesting phenomenon in our current market, mortgage interest rates... 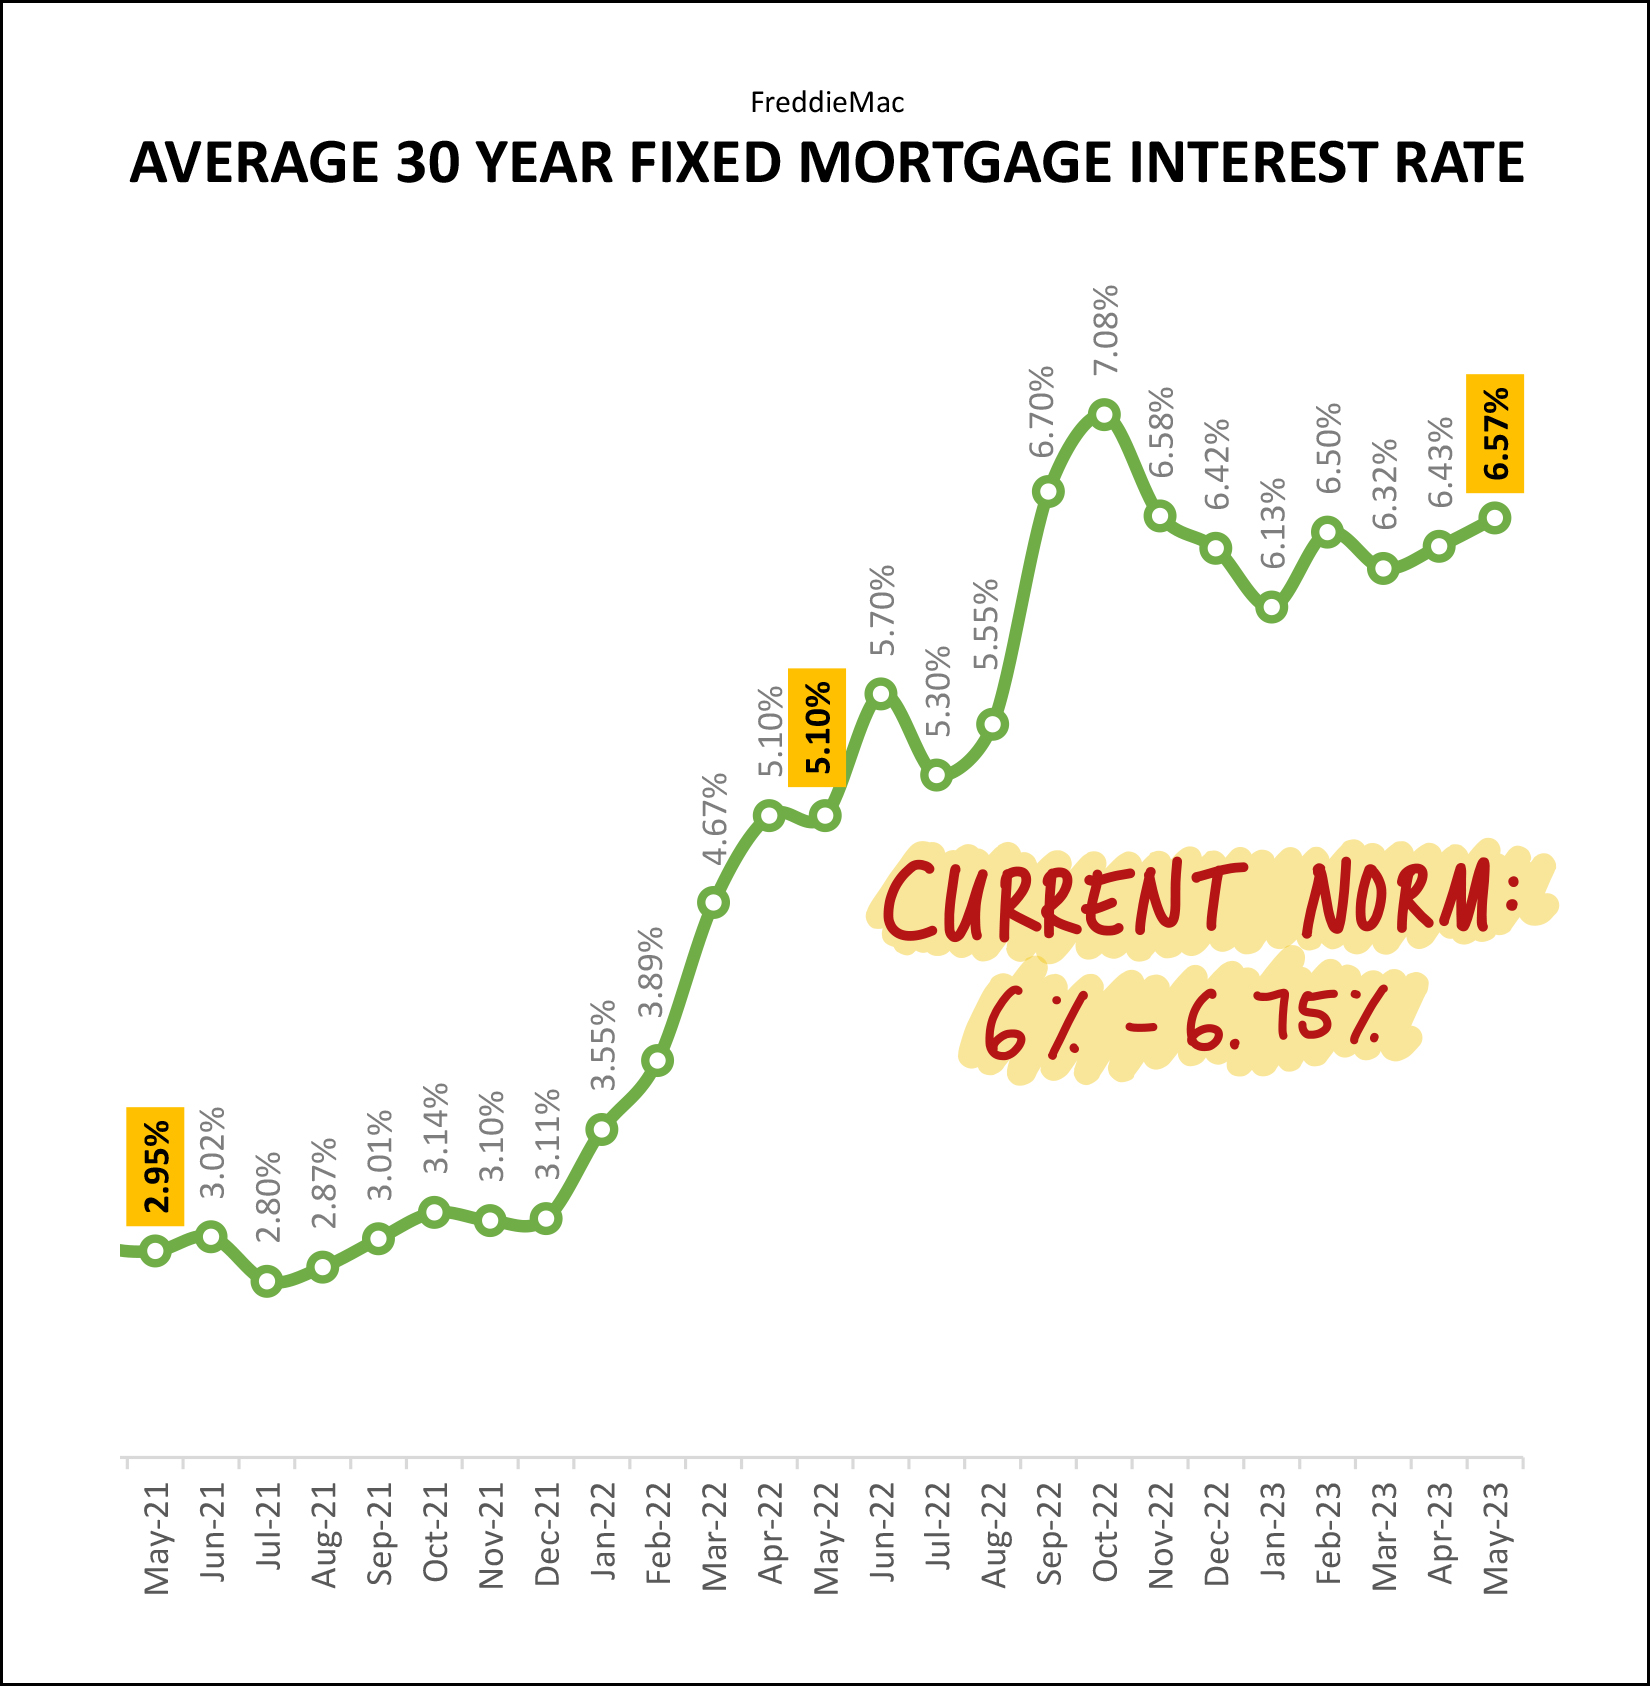 Despite fewer homes selling... sales prices keep rising. Despite higher mortgage interest rates... sales prices keep rising. Two years ago the average mortgage interest rate was around 3%. A year ago that had risen to 5%. Now, it is bouncing around between 6% and 7%. And yet, buyers keep buying, and they are paying ever higher prices for the homes they are purchasing. As you can imagine, that means that mortgage payments are higher than ever for today's home buyers -- as a result of both higher sales prices and higher mortgage interest rates -- but these higher rates haven't seemed to have impacted buyer interest enough to then impact sales prices. So, given all of the data above, what does this mean for you? If you are planning to sell... you'll likely still have plenty of interest from buyers, you're likely to sell at a very favorable price, and your home is still likely to be under contract within a week. If you are hoping to buy... you'll need to see homes quickly when they come on the market, you will still have stiff competition from other buyers, and you should talk to a lender to understand mortgage payments based on current mortgage interest rates. If you own a home and aren't planning to sell... lucky you. Home values keep on increasing, and you likely have a low or low-ish mortgage interest rate. I hope this overview of the latest trends in our local housing market has been informative and helpful, especially if you are gearing up to buy or sell soon. Feel free to reach out to me if I can be of any assistance to you as you make those plans. You can reach me most easily at 540-578-0102 (call/text) or by email here. Until next month, I hope you enjoy the start to summer, and perhaps I'll see you at Red Wing! | |
Median Sales Price Up 10% In 2023 Despite 19% Decline In Home Sales |
|
 Happy Tuesday morning, friends! We are now -- wait for it -- more than a third of the way through 2023!? How can it be!? And how's the market you might ask? Fewer homes are selling this year, but at higher prices than last year!? Again, how can it be!? -- This whirlwind of a start to 2023 has involved a rather busy few months in the Rogers household -- with a soon-to-be-graduating high school senior (Luke) attending a Junior-Senior banquet and playing in his last few baseball games, and an ever-speedier ninth grader (Emily) running (and jumping) in multiple events on the track team. Whatever is keeping you busy and running all around town this Spring, I hope it is just as fun and fulfilling as it has been for Shaena and I to see our kids growing up over these recent years. Time surely does fly by quickly! -- But, back to real estate. Below I'll delve into all the juicy details of the latest happenings in our local housing market... after I make you hungry... Each month I offer a giveaway, of sorts, for readers of this market report, highlighting some of my favorite places, things or events in Harrisonburg. Recent highlights have included Cuban Burger, Taste of India and A Bowl of Good. -- OK, now, I'm really getting to the real estate. Jumping right in to where my headline began... home sales (not prices) are declining, rather significantly in Harrisonburg and Rockingham County right now... 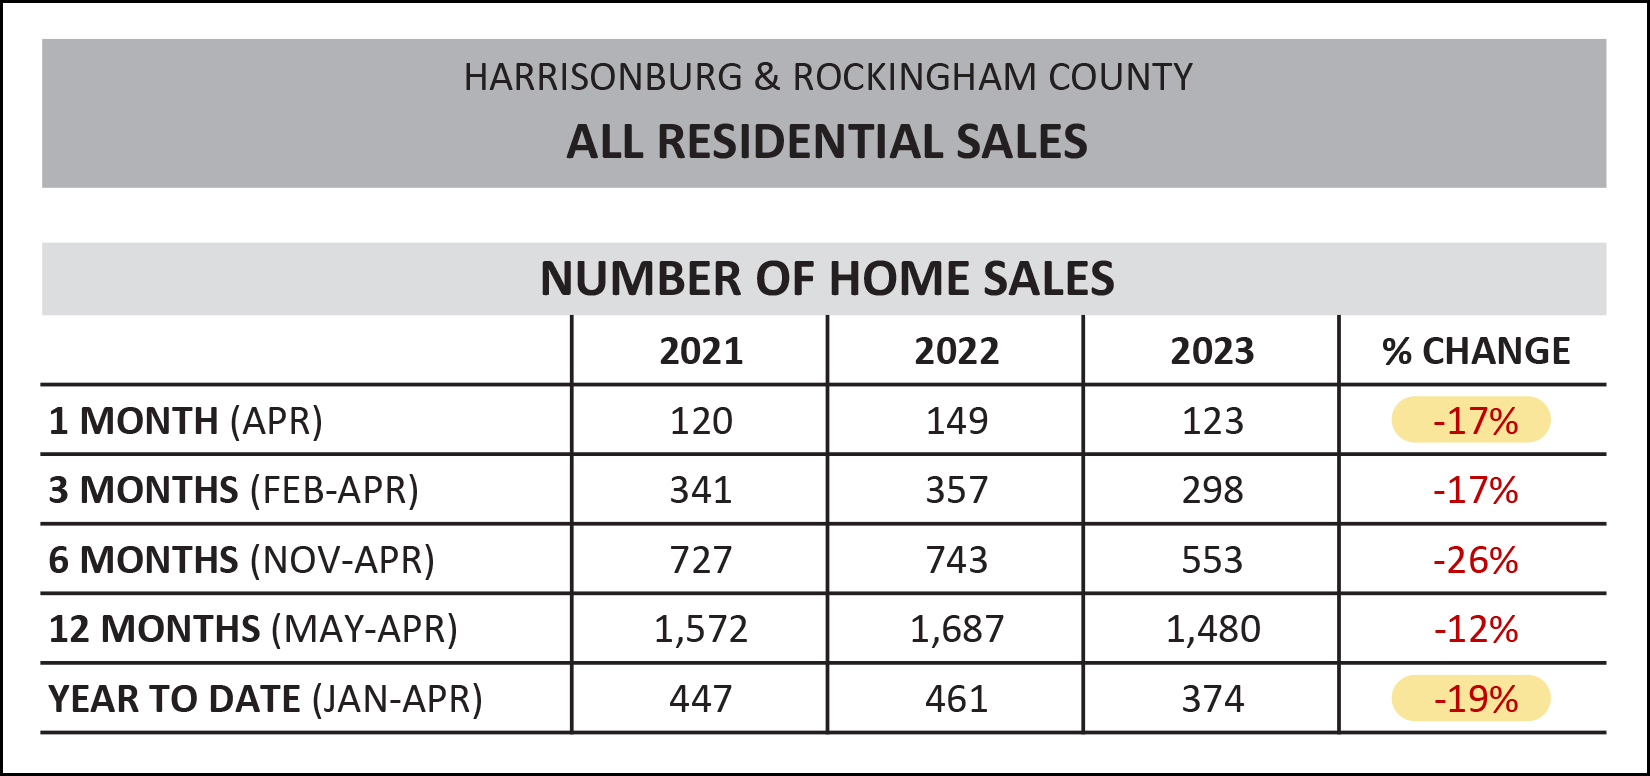 As shown above... [1] There were 17% fewer home sales in April 2023... which I suppose isn't too much of a surprise given several other recent months of slower home sales. [2] Looking at the year thus far (Jan - Apr) home sales have declined 19%. During the first four months of 2022 we saw 461 home sales in Harrisonburg and Rockingham County while there have only been 374 home sales thus far in 2023. Generally, there are two reasons why home sales decline: [1] Fewer buyers want to buy. [2] Fewer sellers want to sell. In our local market, the 19% decline in home sales seems to be almost entirely a result of fewer sellers wanting to sell. I come to this conclusion based on continued low inventory levels, which we'll get to in a bit. Despite the 19% decline in the number of homes that are selling, as the headline referenced, we're still seeing home prices rise in Harrisonburg and Rockingham County... 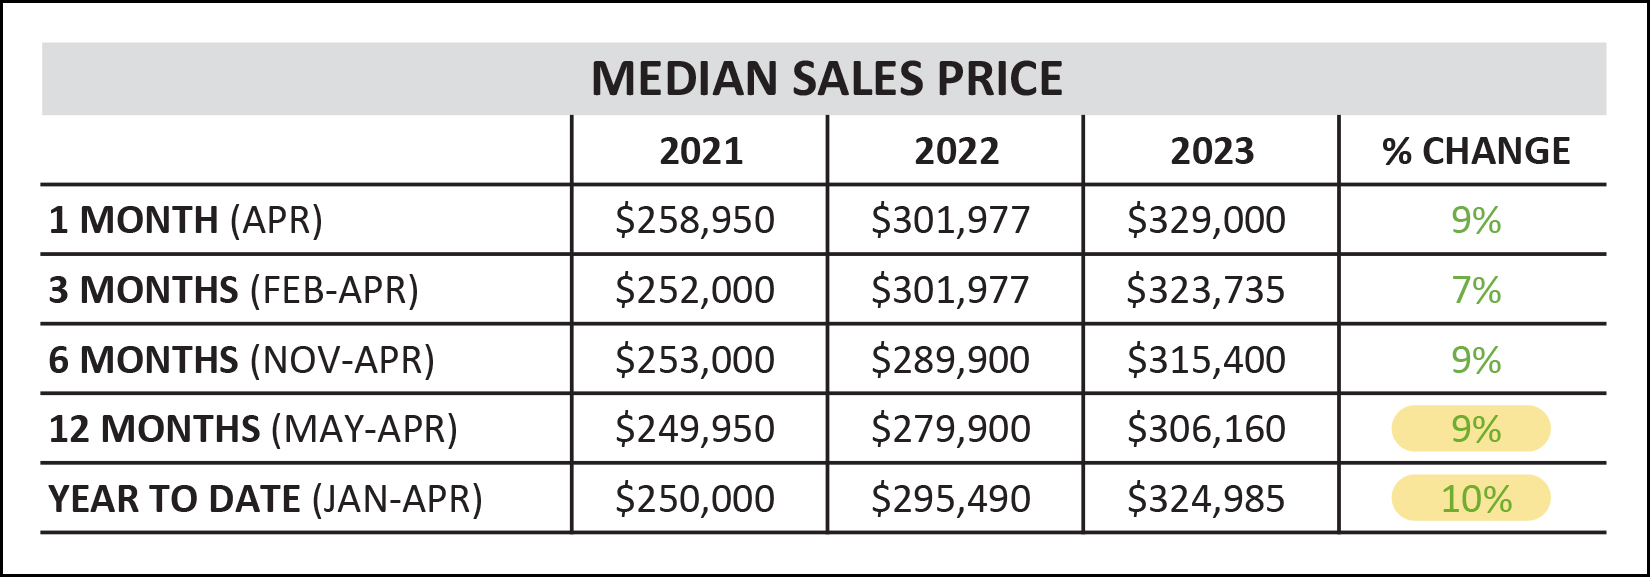 Indeed, when analyzing multiple different timeframes, we are consistently seeing increases in the median sales price in our local area... [1] The median sales price over the past 12 months ($306,160) is 9% higher than it was in the previous 12 months ($279,900). [2] Looking just at the first four months of the year, the median sales price is 10% higher this year ($324,985) than last ($295,490). Will home prices keep rising forever? I can make no promises, but generally speaking, so long as demand (buyers wanting to buy) continues to exceed supply (sellers wanting to sell) we are likely to continue to see prices rise. Will home prices keep rising at a rate of 10% per year? This seems less likely, especially given higher mortgage interest rates right now... though I've been saying this for at least six months now, and thus far, home prices are still rising at about 10% per year. One metric that is running slightly contrary to most others is the time that it takes for a home to go under contract once listed for sale. We have actually seen a slight increase in this "median days on market" statistic over the past year... 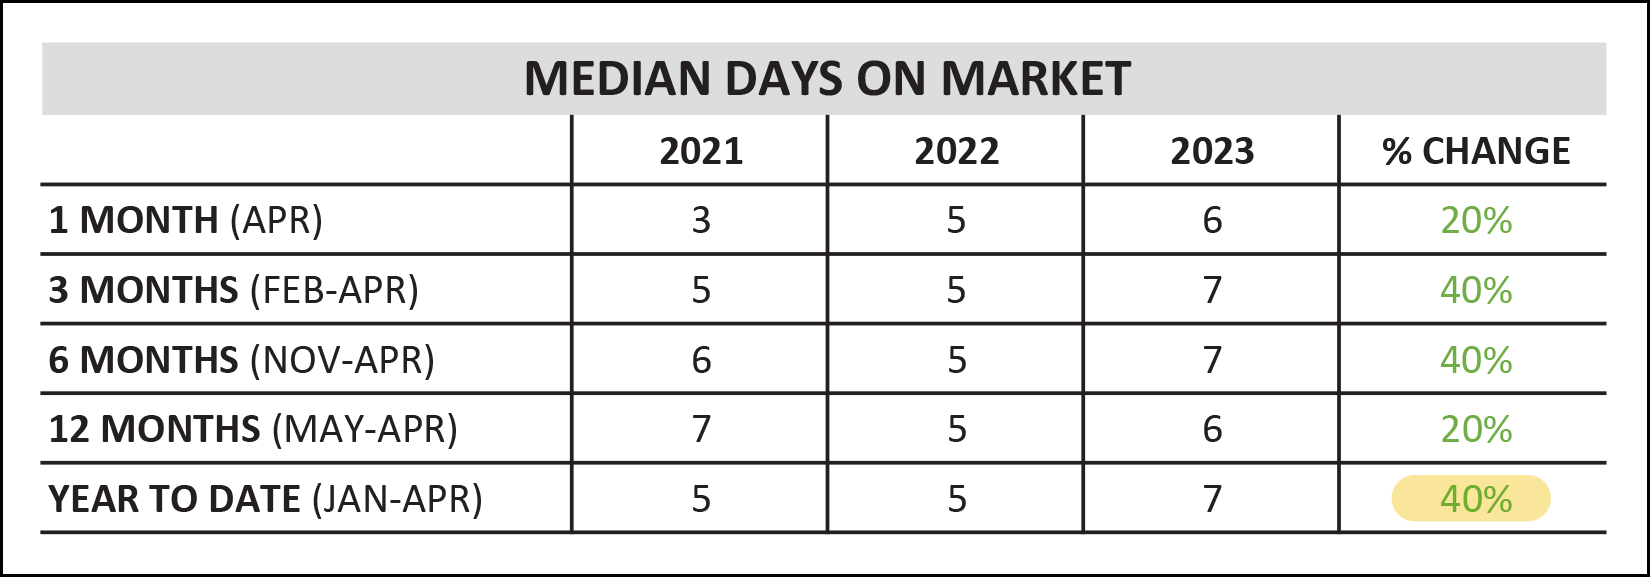 I suppose the "gotcha" headline would be that it is taking homes 40% longer to go under contract now as compared to a year ago. :-) But... this was a change from a median of five days to a median of seven days... and seven days is still mighty speedy. I should also note that this slight (two day) slow down is not much consolation to would-be home buyers who are frustrated by how quickly the market is moving right now. Pausing for a moment, as you may or may not know, I compile a bunch of data that is not highlighted in this monthly market narrative. You can find lots of other data tables and graphs over here. Pulling from the variety of other charts and graphs that I generate each month, let's take a peek at one subset of our overall market... home sales within the City of Harrisonburg. 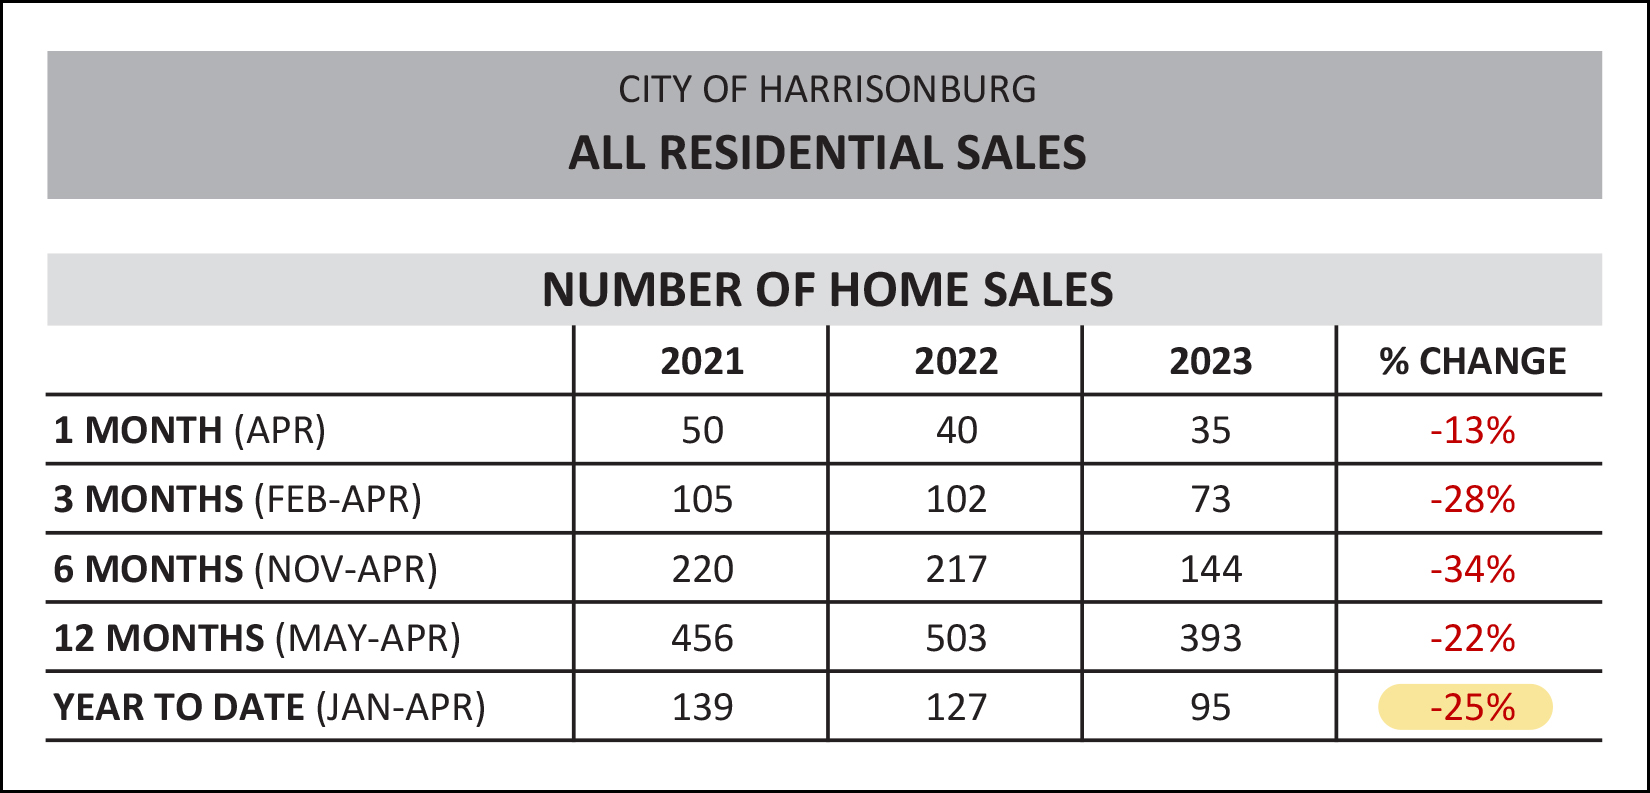 Home sales actually declined *even more* in Harrisonburg than in the market as a whole. The entire market (City + County) has seen a 19% decline in home sales in the first four months of the year... but the City alone has seen a 25% decline. If you're hoping to buy a home in the City of Harrisonburg, it's a tough time to do so based on very limited inventory of homes offered for sale. Now, moving past these charts, to some graphs, for the visual learners amongst us... 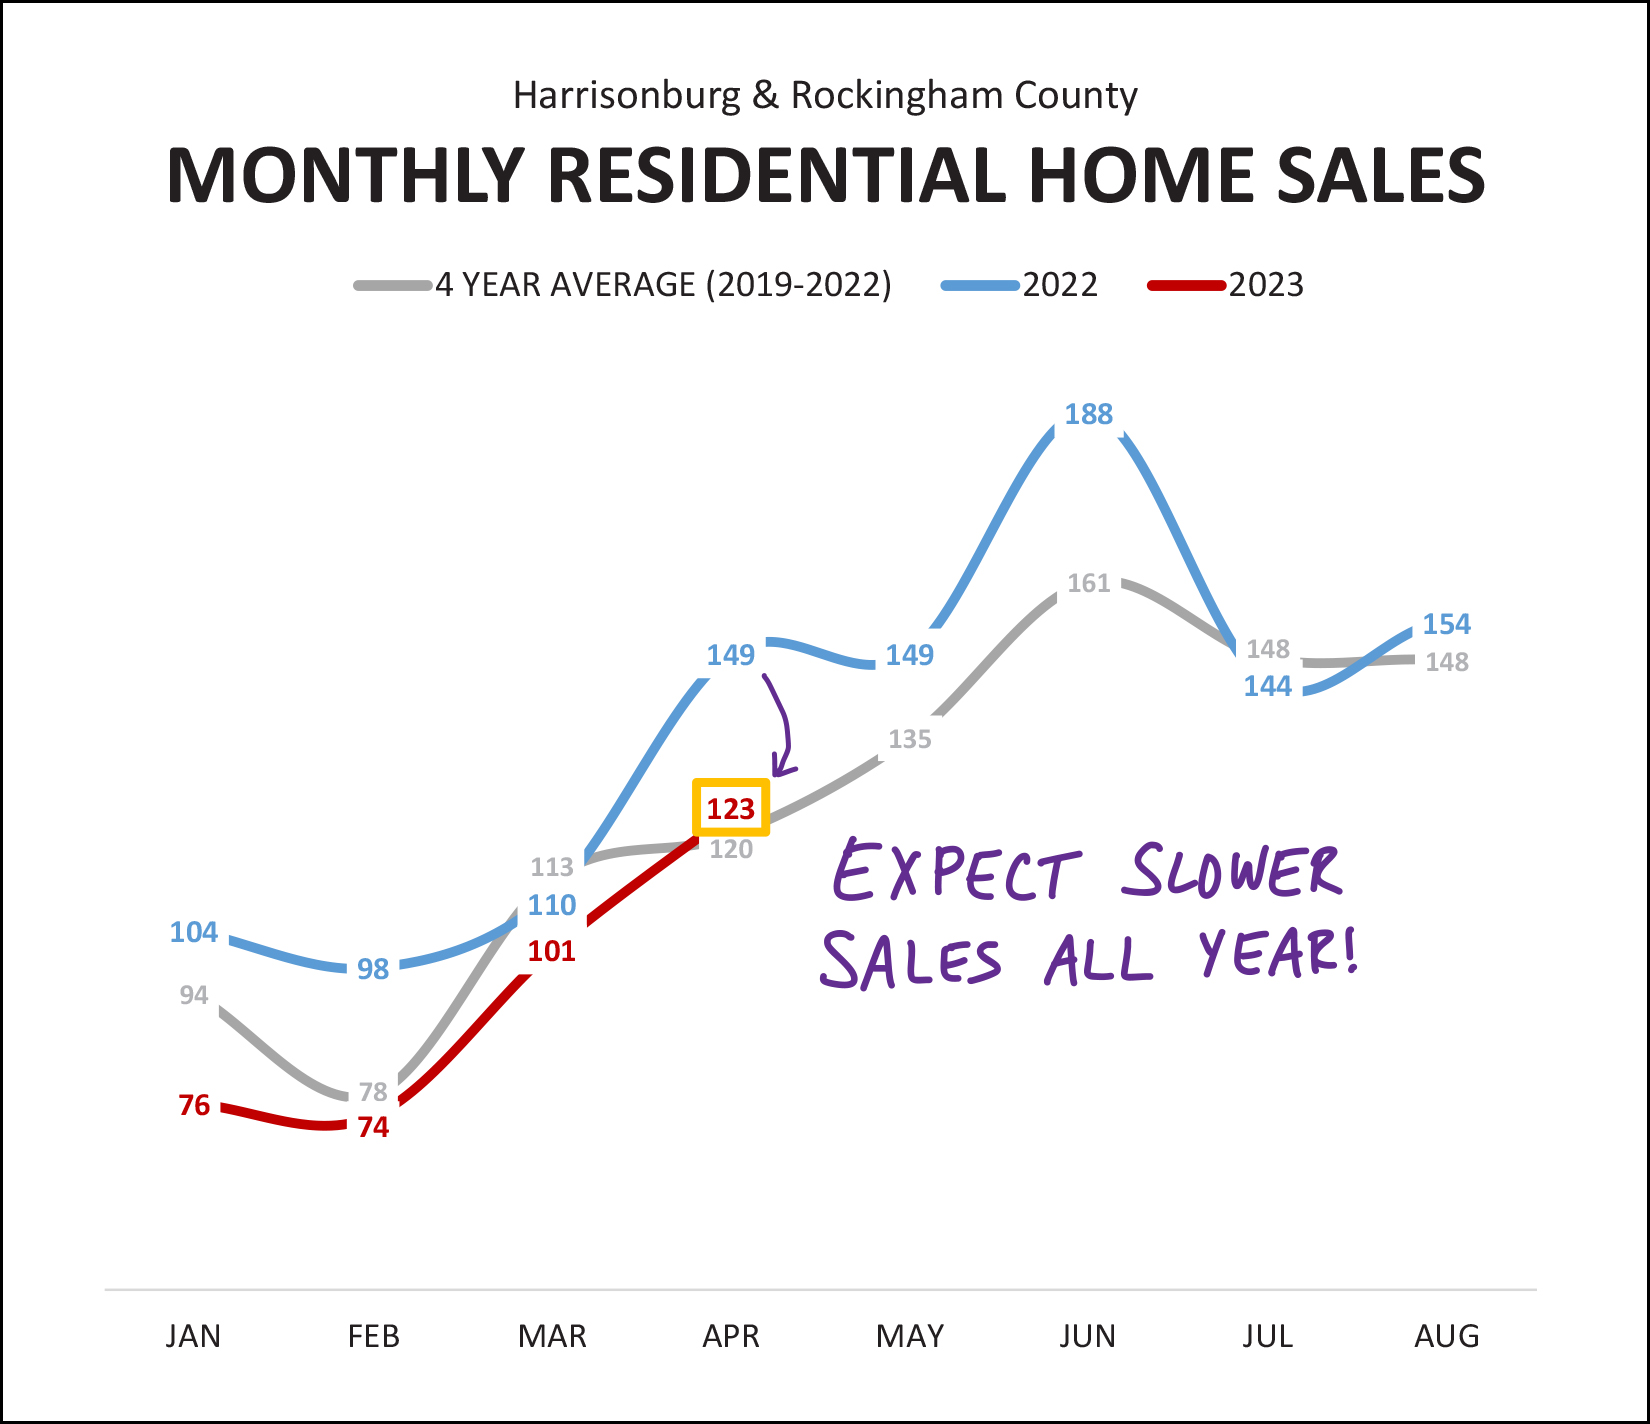 Follow the red line on the graph above to see each month of 2023 home sales in Harrisonburg and Rockingham County and you'll find that it is lower than each month on the blue line, which represents home sales last year. March 2023 came close to March 2022 (101 vs. 113) but the gap widened again in April (123 vs. 149) and I am expecting we'll continue to see slower home sales (fewer home sales) for most or all of 2023. I'll talk more about mortgage interest rates further down in this report, but it's worth noting that higher mortgage interest rates seem to be limiting the number of home sales that we're seeing right now -- but it might be stopping just as many sellers from selling as it is stopping buyers from buying. Many homeowners aren't all that interested in selling their homes with mortgages in place with a three-point-something interest rate, to then be replaced by a new mortgage at a six-point-something interest rate. I can't blame them. This is only one of the factors limiting the number of homes that are selling, but I don't think we should overlook its impact. So long as mortgage interest rates stay high, we are likely to continue to see a lower number of home sales this year as compared to last year. Moving on to the opposing trends of price and pace of home sales... 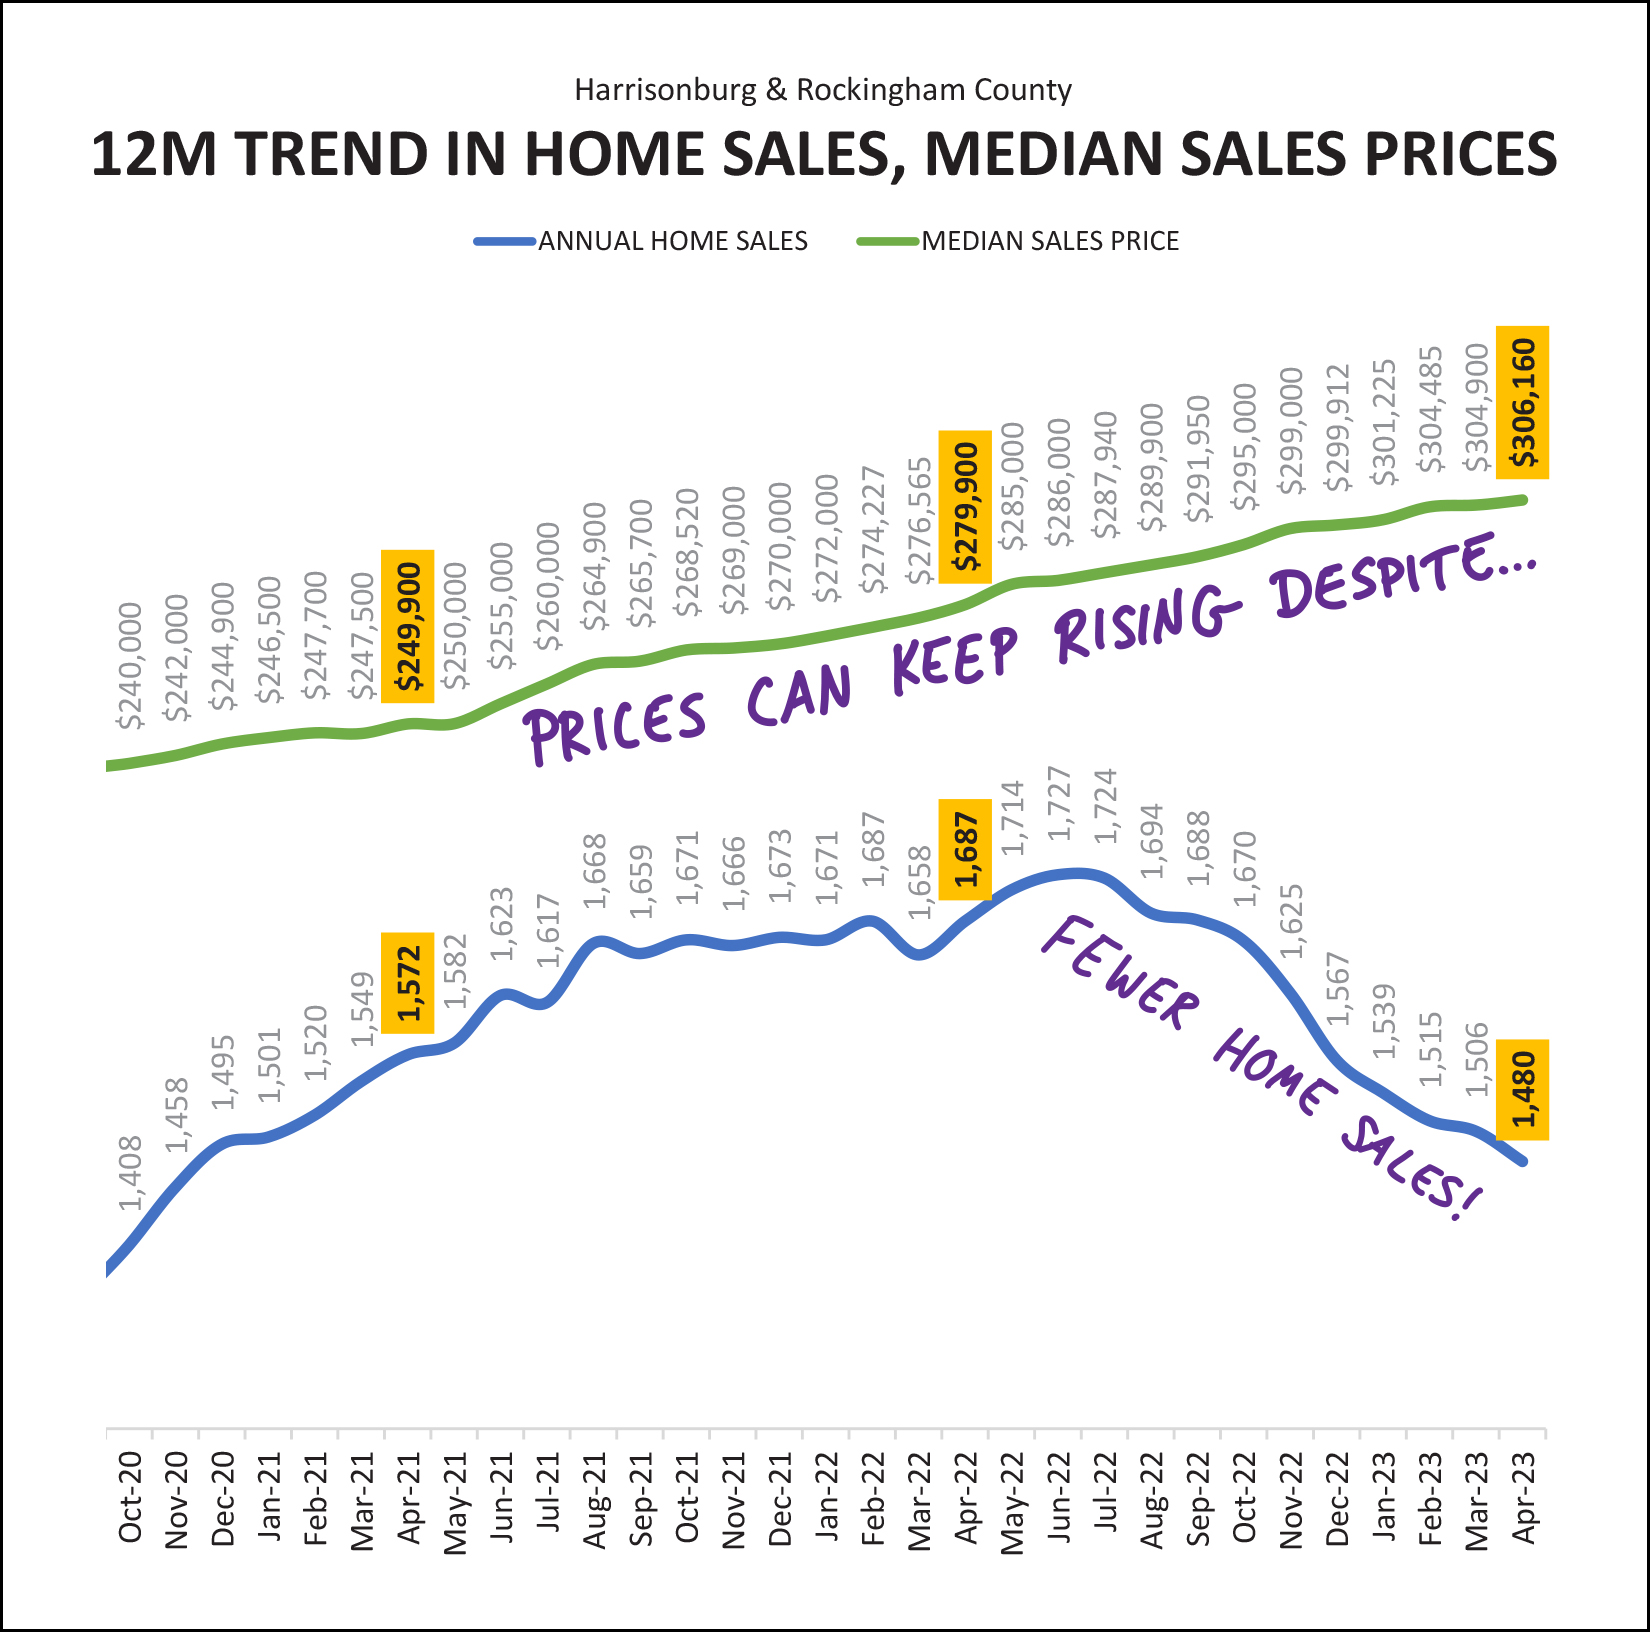 Many assumed that if home sales started to decline (they definitely have) that home prices would be sure to follow. Not so. It seems that the combination of continued strong levels of buyer demand, paired with a smaller number of sellers willing to sell, has resulted in fewer home sales, but higher prices. Over the past year we have seen 1,480 home sales in Harrisonburg and Rockingham County. Back the clock up a year and we were seeing 1,687 home sales a year. That's a rather significant change in the pace of home sales activity in our local market. Over the past year the median sales price has been $306,160 in Harrisonburg and Rockingham County. A year ago, the median sales price was only $279,900. This is, again, a rather significant change, though in the opposite direction (up) that we're seeing when it comes to the number of homes selling (down). Looking at the change in median sales prices a bit differently, here's a startling change over a relatively short timeframe... 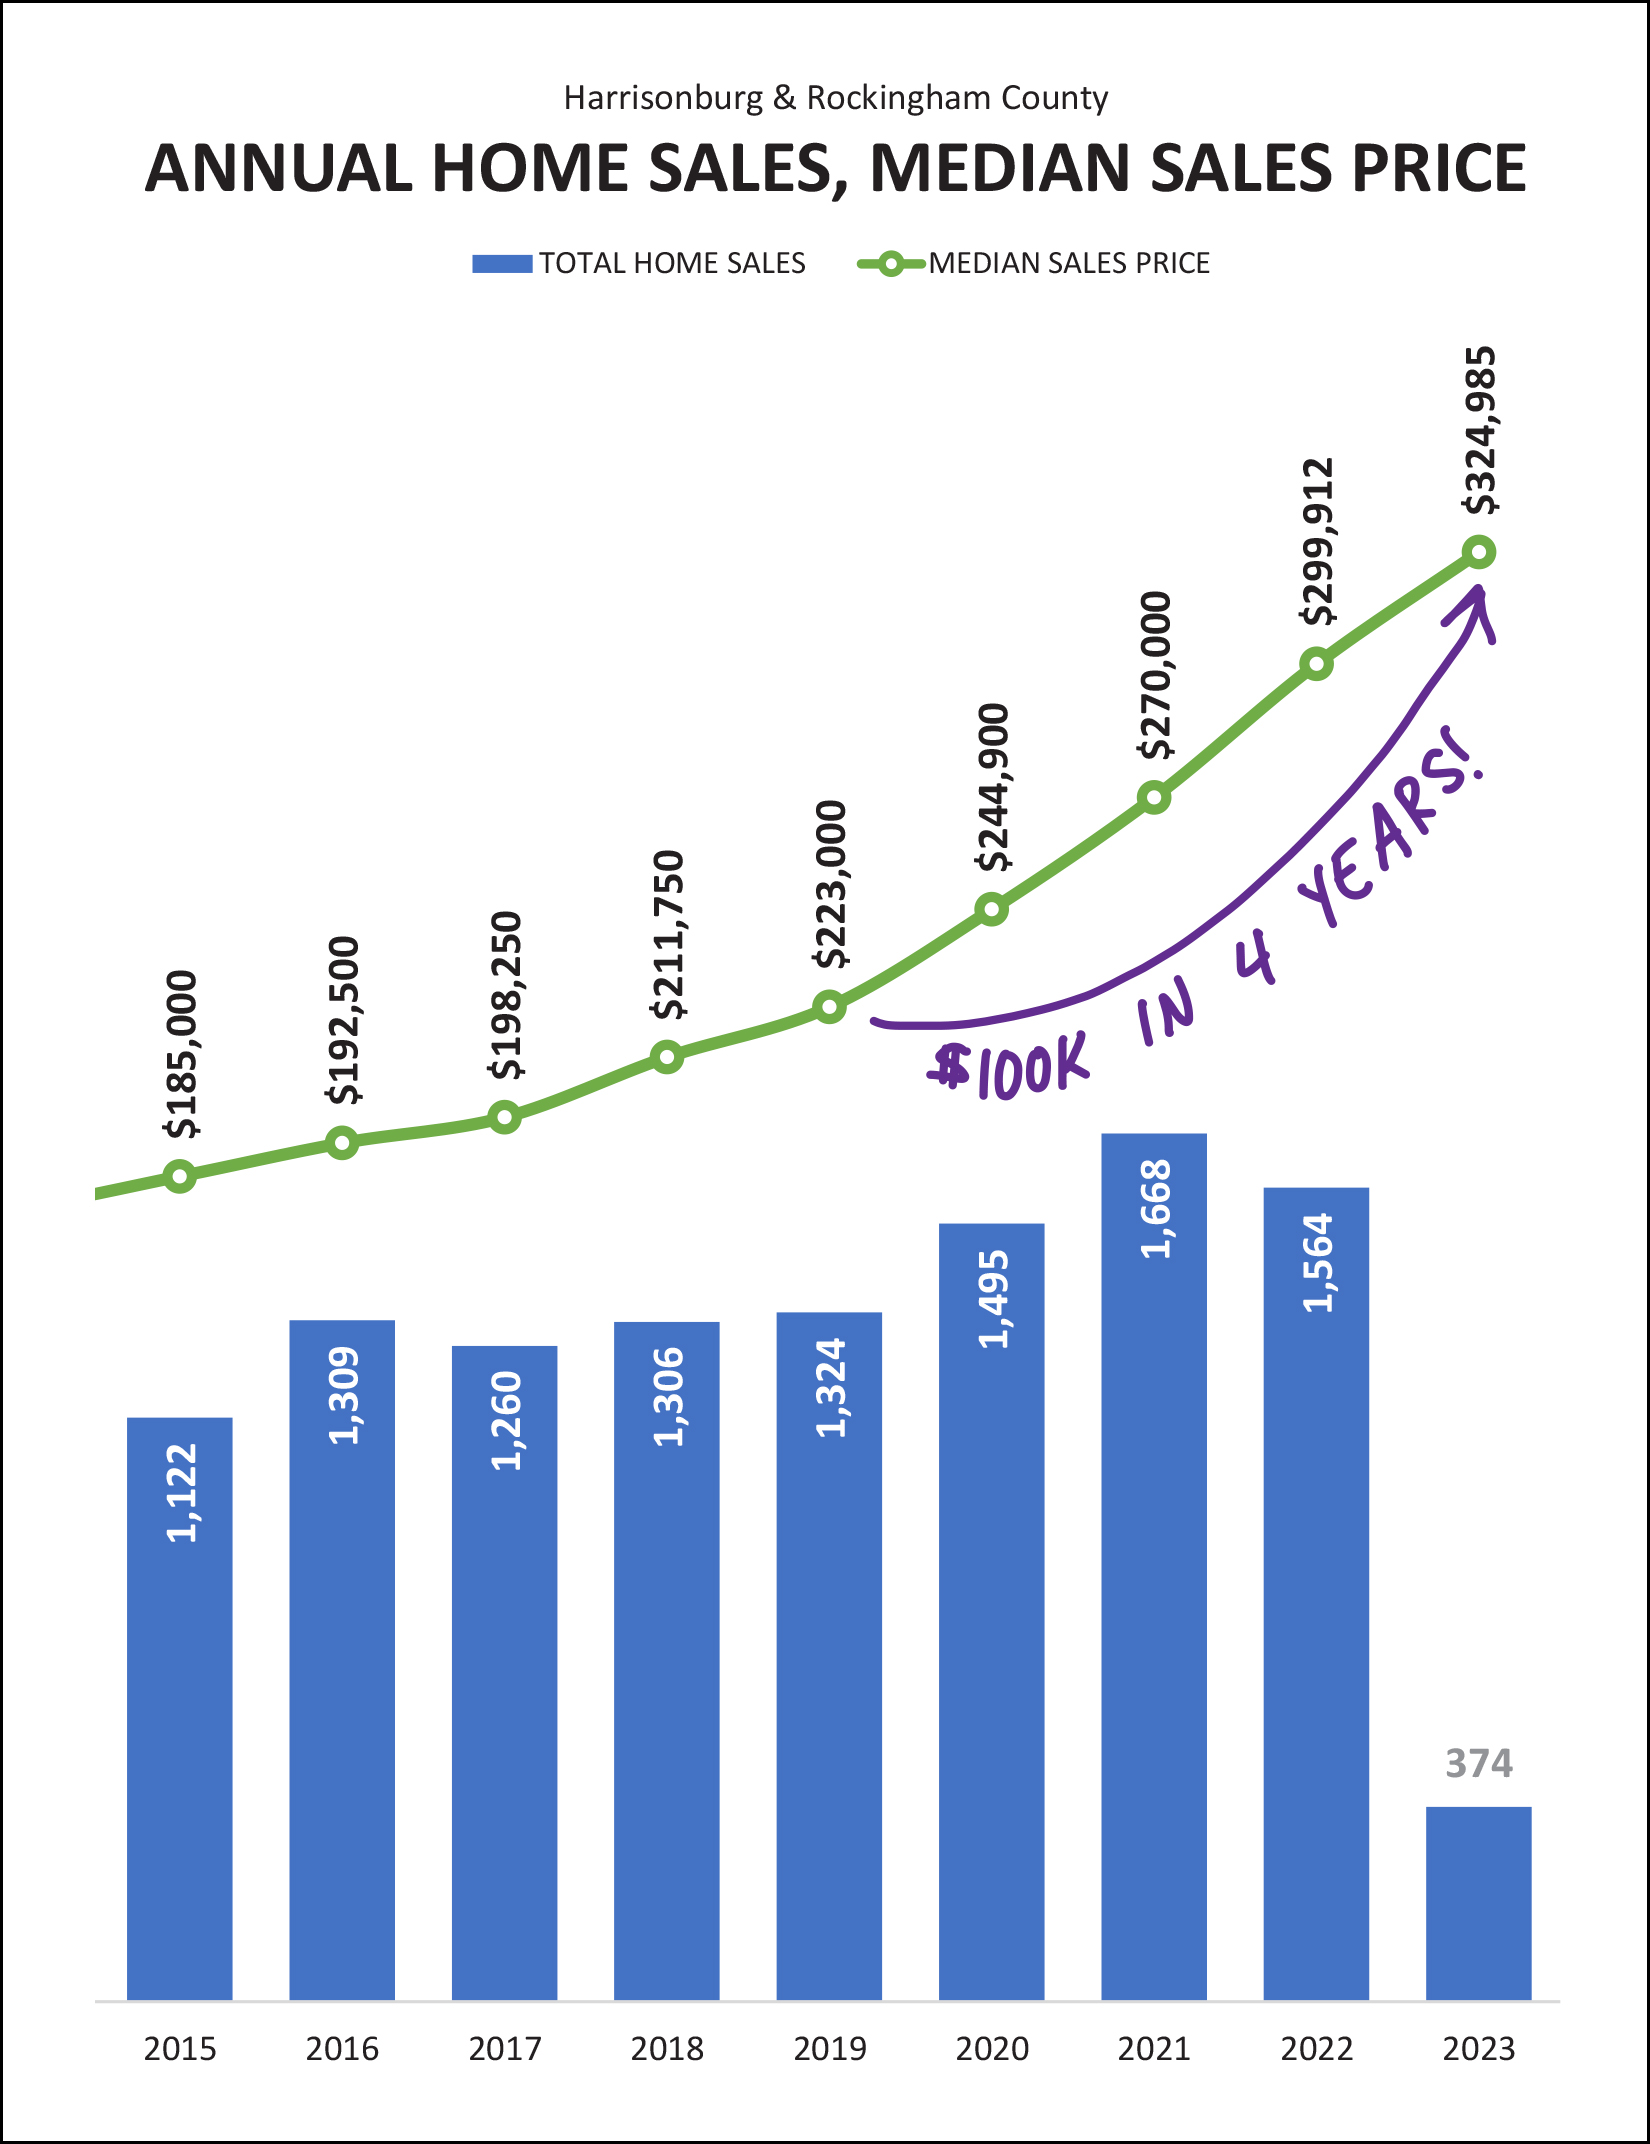 If you bought a median priced home four years ago, that home may very well be worth $100,000 more today!?! Now, before you get too excited about this newly discovered six figure pile of equity in your home, keep in mind that these numbers ($223K in 2019 to $325K in 2023) are simply showing overall market-wide trends. Some homes certainly have appreciated by $100K over the past four years -- but not all homes. That said, almost universally, homeowners have been shocked to see how much their home value has increased over the past four years! Now, let's try to guess at where things might go from here over the next few months... 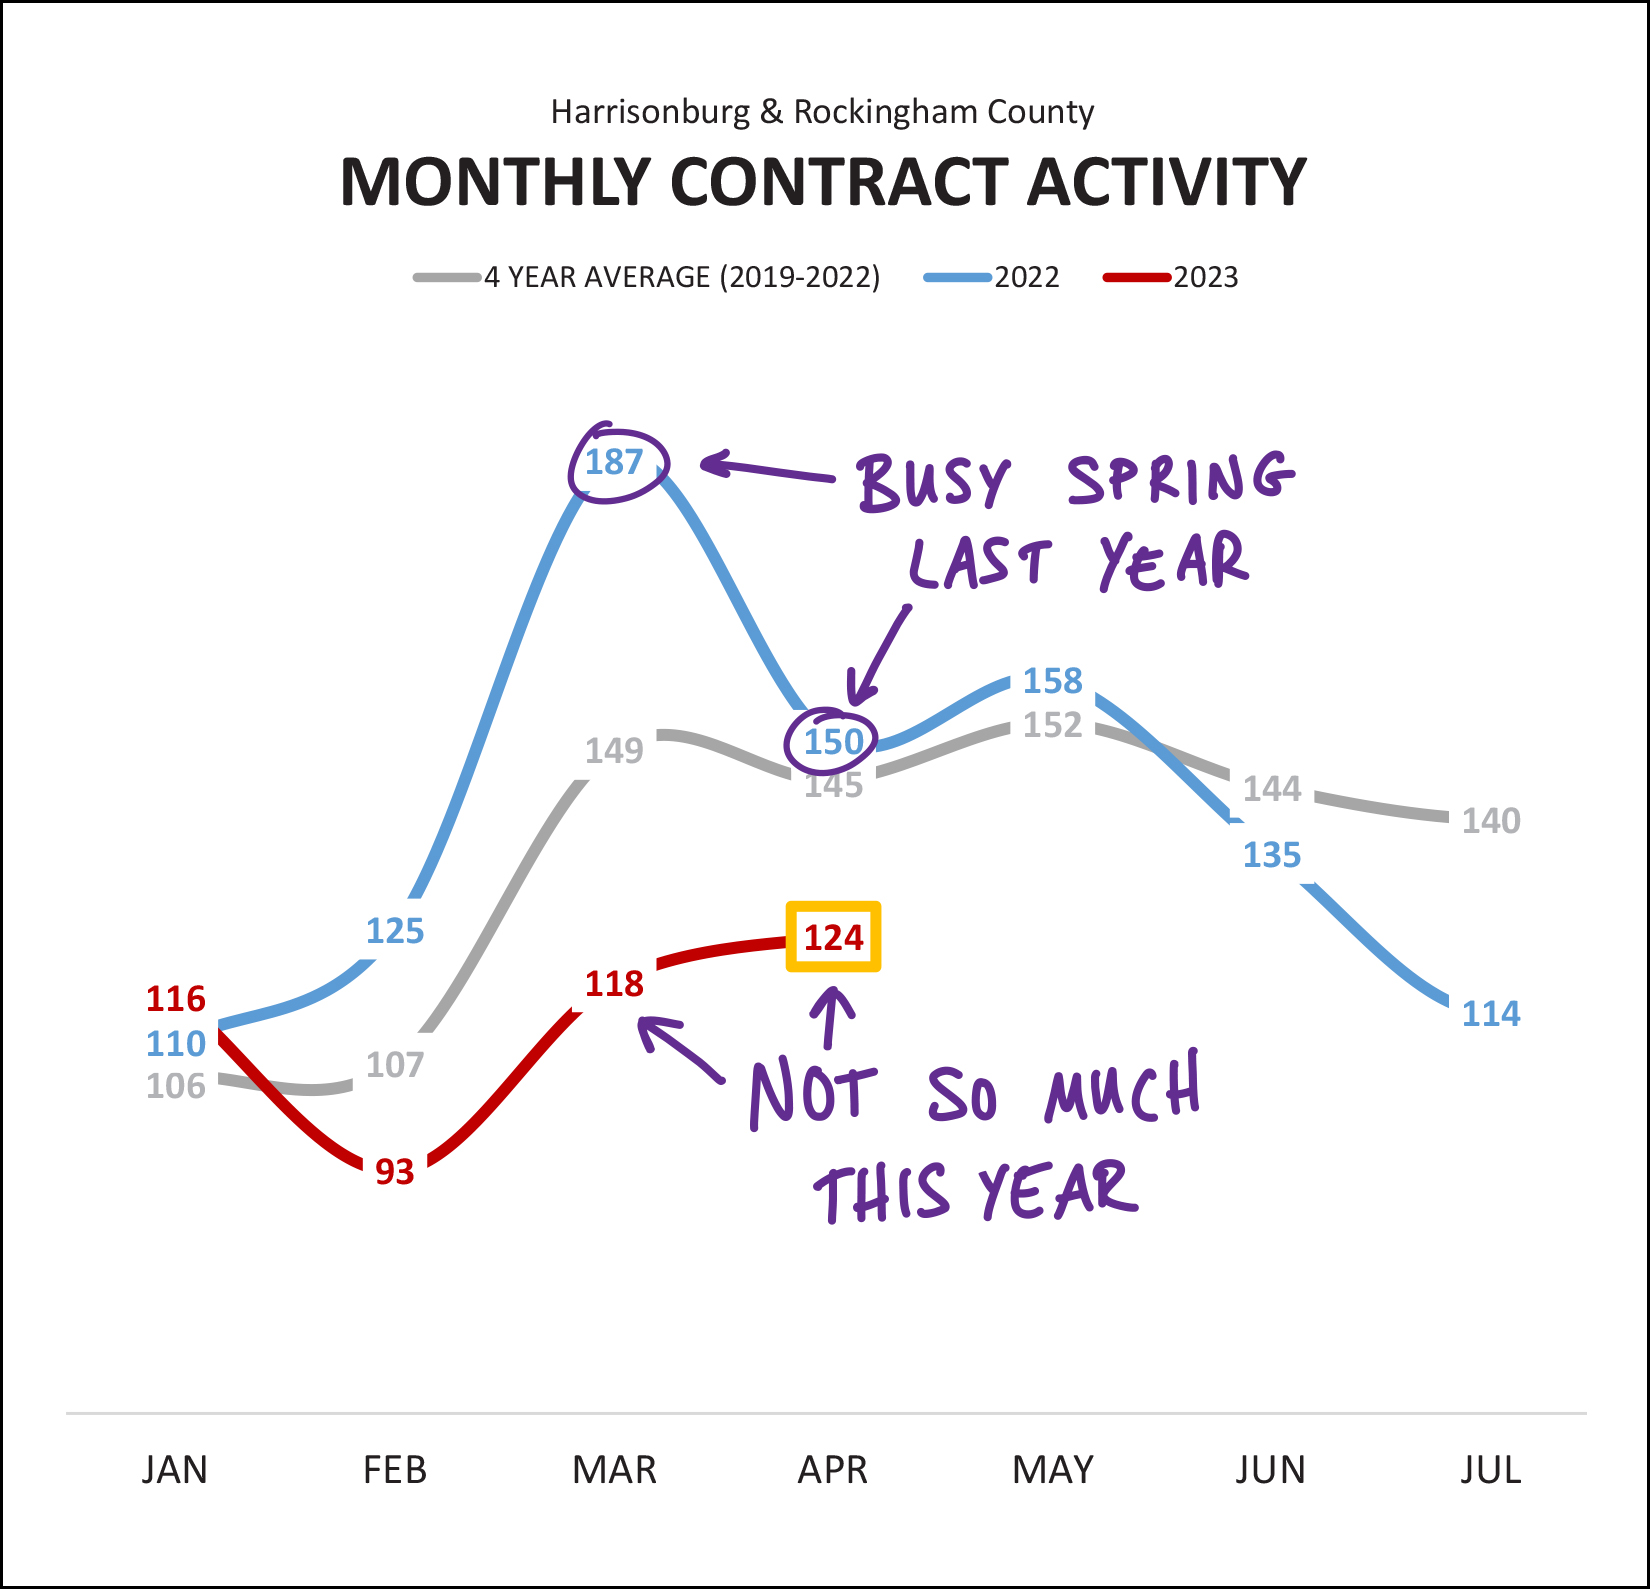 This first graph is showing the number of contracts being signed per month, as compared to previous graphs that showed the number of home sales taking place each month. Over the past two months we have seen 242 contracts signed for buyers to buy (and sellers to sell) in Harrisonburg and Rockingham County. This is quite a decline compared to last year when we saw 337 contracts signed during the same timeframe. Bottom line... this spring (red line) has just not been as active of a "spring market" as last year (blue line)... and it also hasn't kept pace with recent historical trends (grey line). These lower contract numbers have lead to fewer properties being under contract and waiting to get to closing... 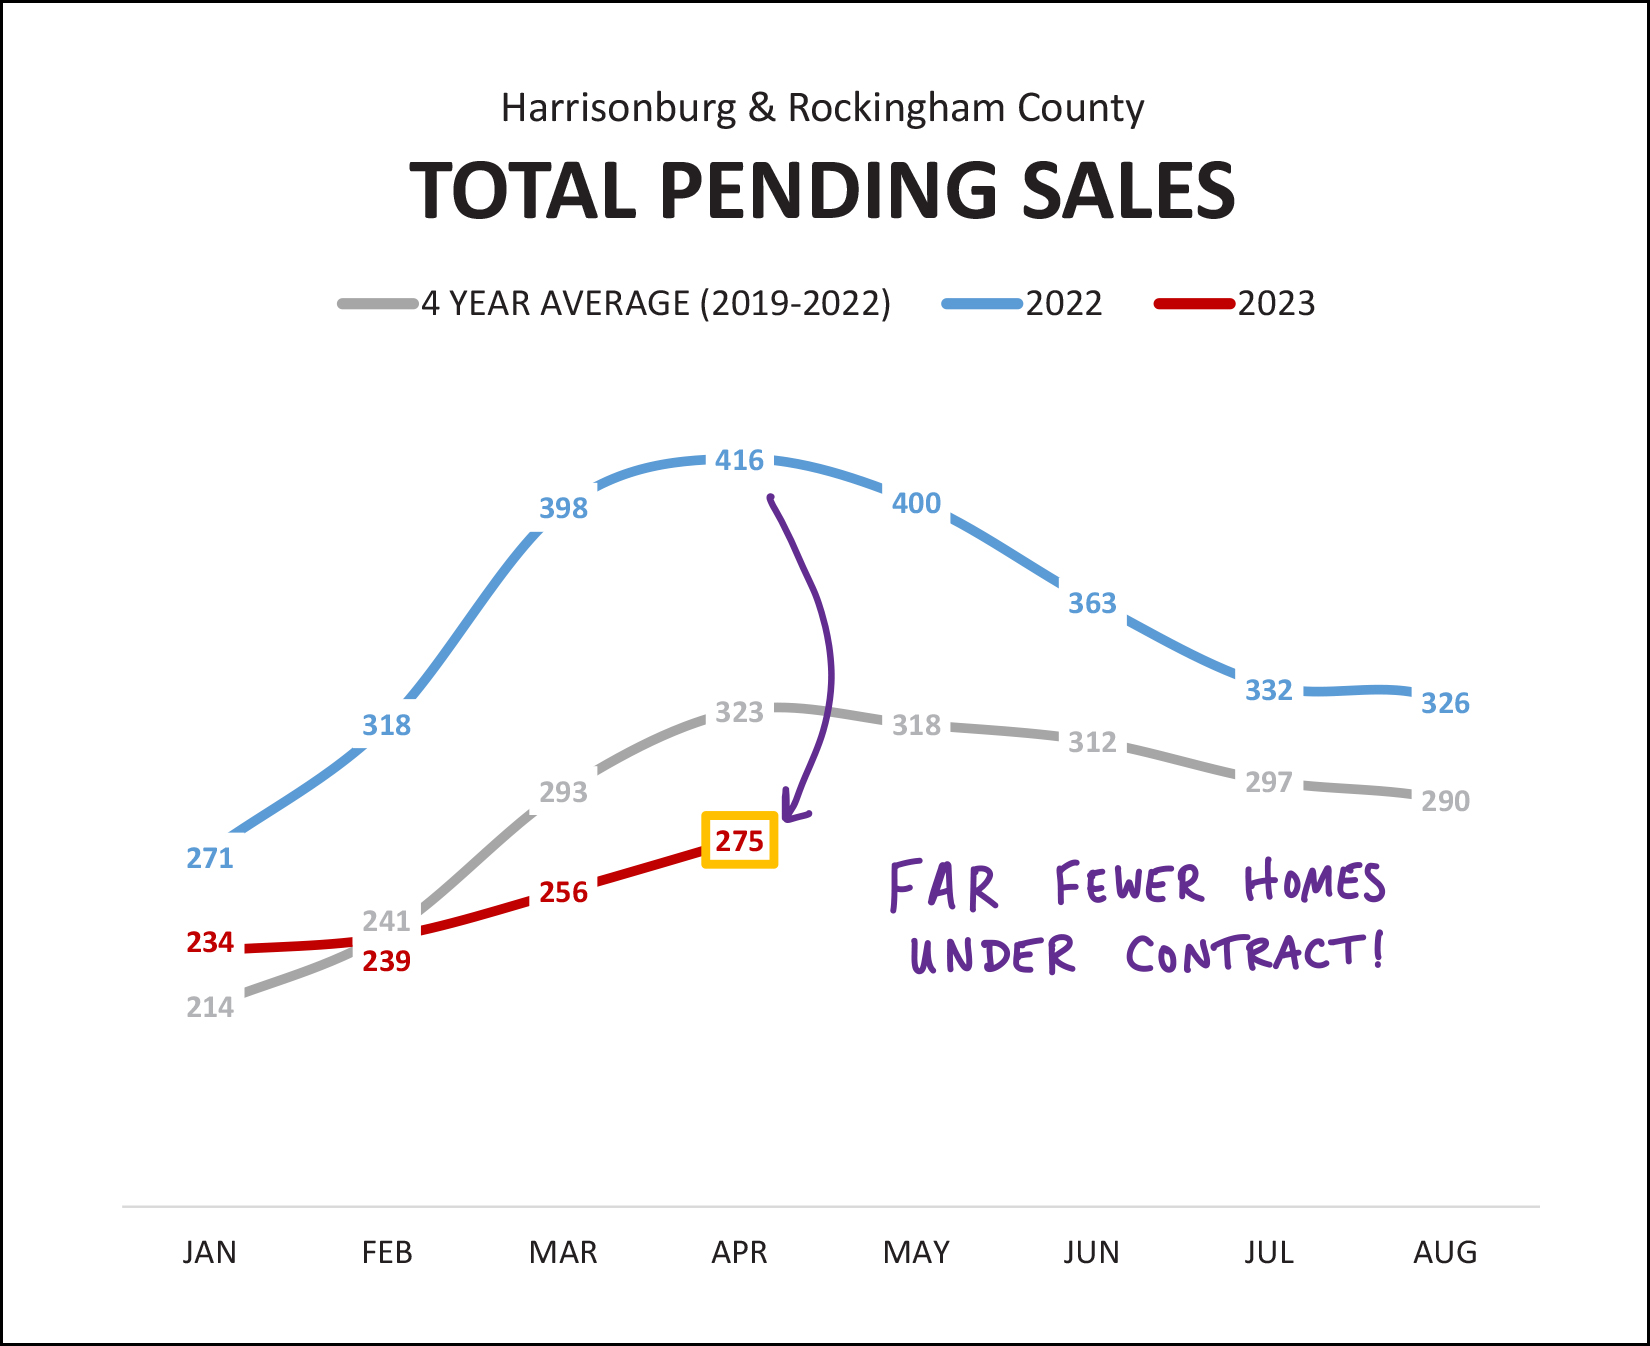 One year ago, there were 416 properties under contract just waiting to get to closing. Now, that "pending sales" figure is only at 275. This is the clearest predictor we can get as to the slower months of home sales that seem to be headed our way in May and June. With such a significant decline in contracts signed, and with a much lower number of properties being under contract, are we seeing ever higher inventory levels of homes available for sale? 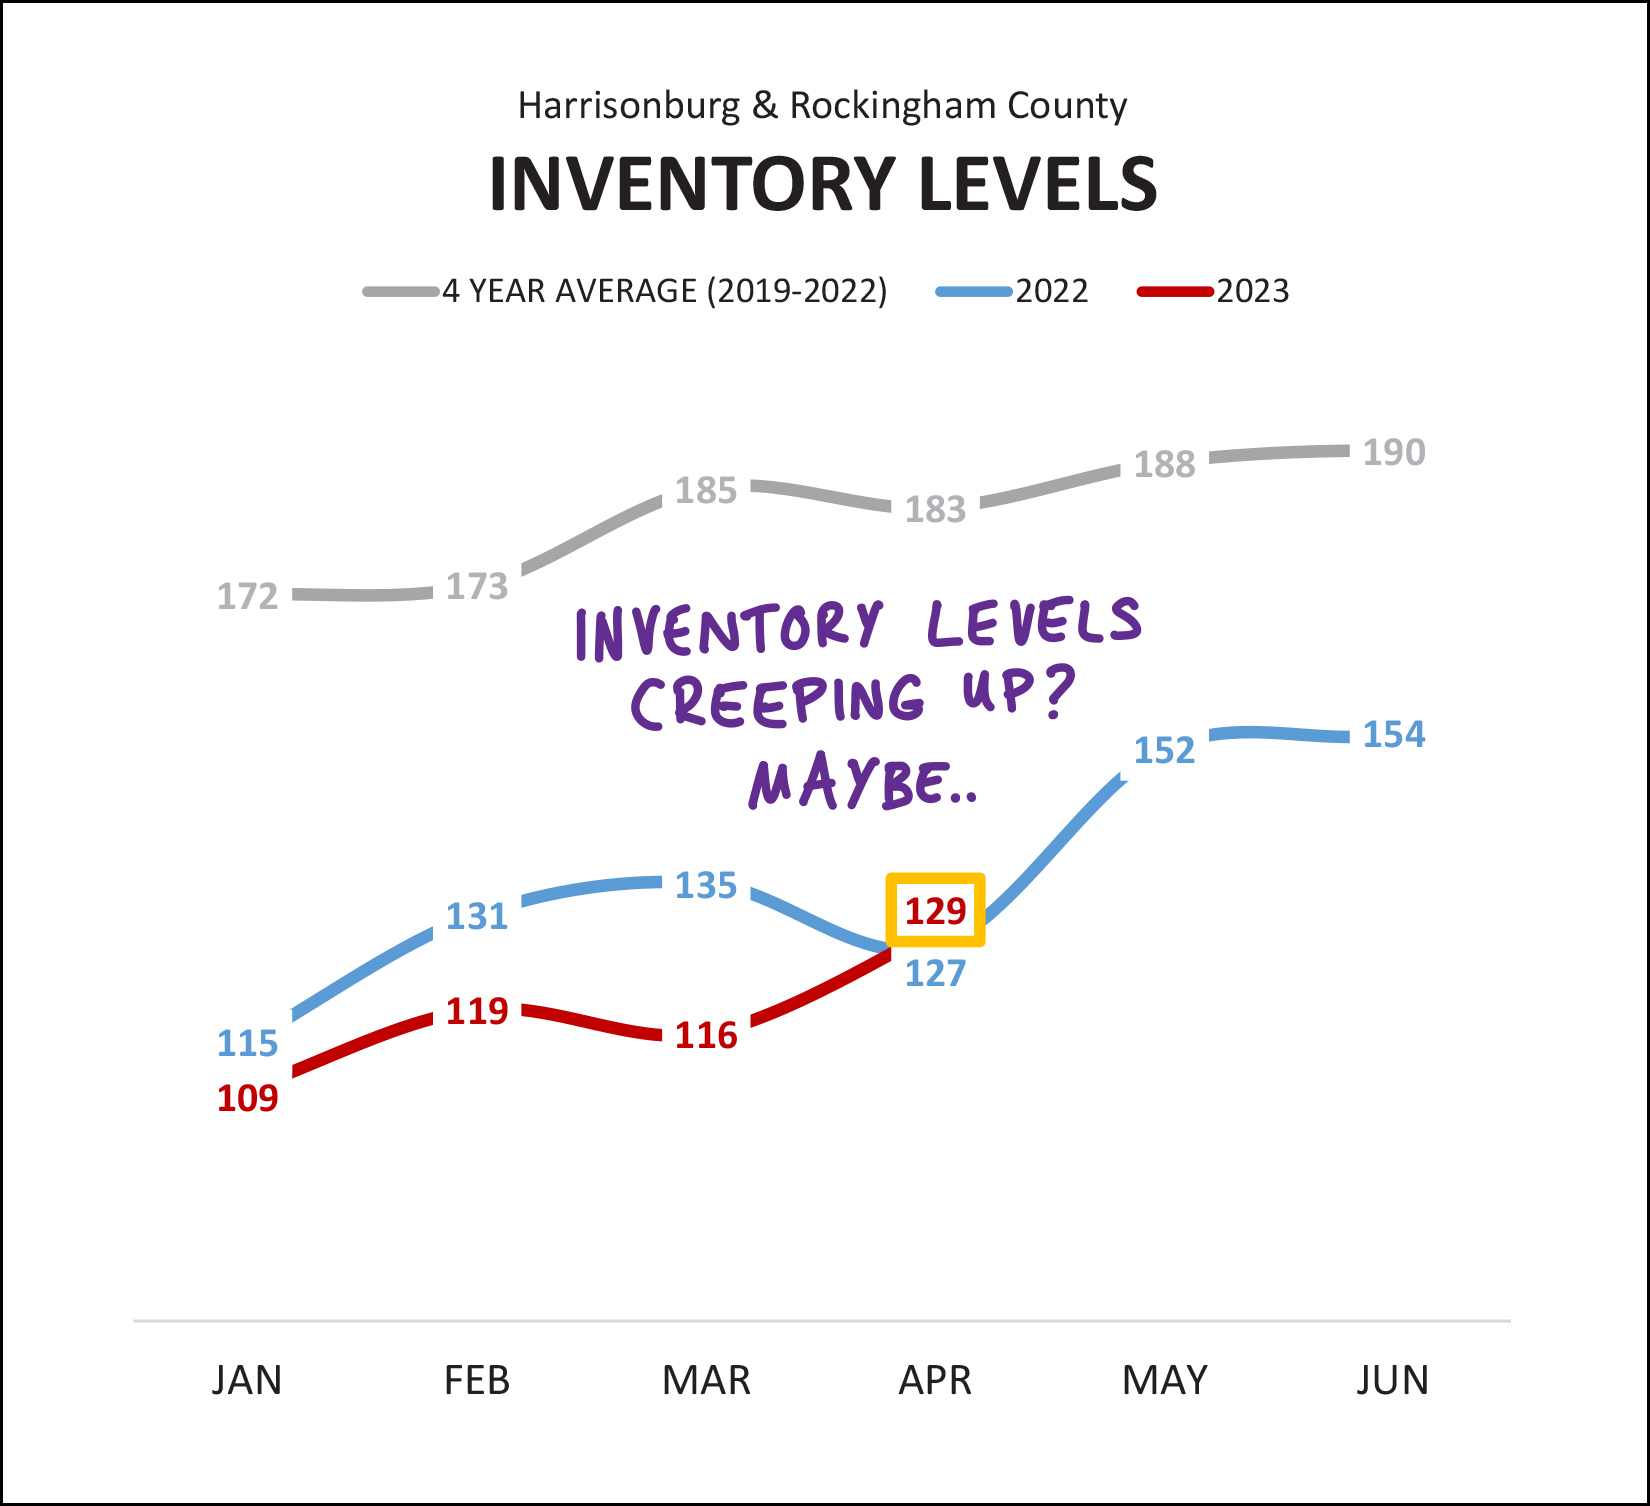 Mostly, no. Over the past four years (2019-2022) the average number of homes for sale at this time of year (early May) has been 183 homes. Today, that number is 129 homes for sale. So, despite fewer sales and fewer contracts, we are still seeing inventory levels that are well below where inventory levels have been over the past few years. That said, for the first time this month we are seeing the inventory level of homes for sale (129) sneaking past (just barely) the number of homes for sale (127) a year ago. Is this significantly? Give it another month or so to see how things shake out. Keep in mind that to continue this trend (more homes for sale in 2023 than in 2022) we'd have to see inventory levels climb above 152 homes for sale over the next month. Stay tuned. Earlier I mentioned that homes are taking an extra day or two to go under contract right now, as compared to a year ago... 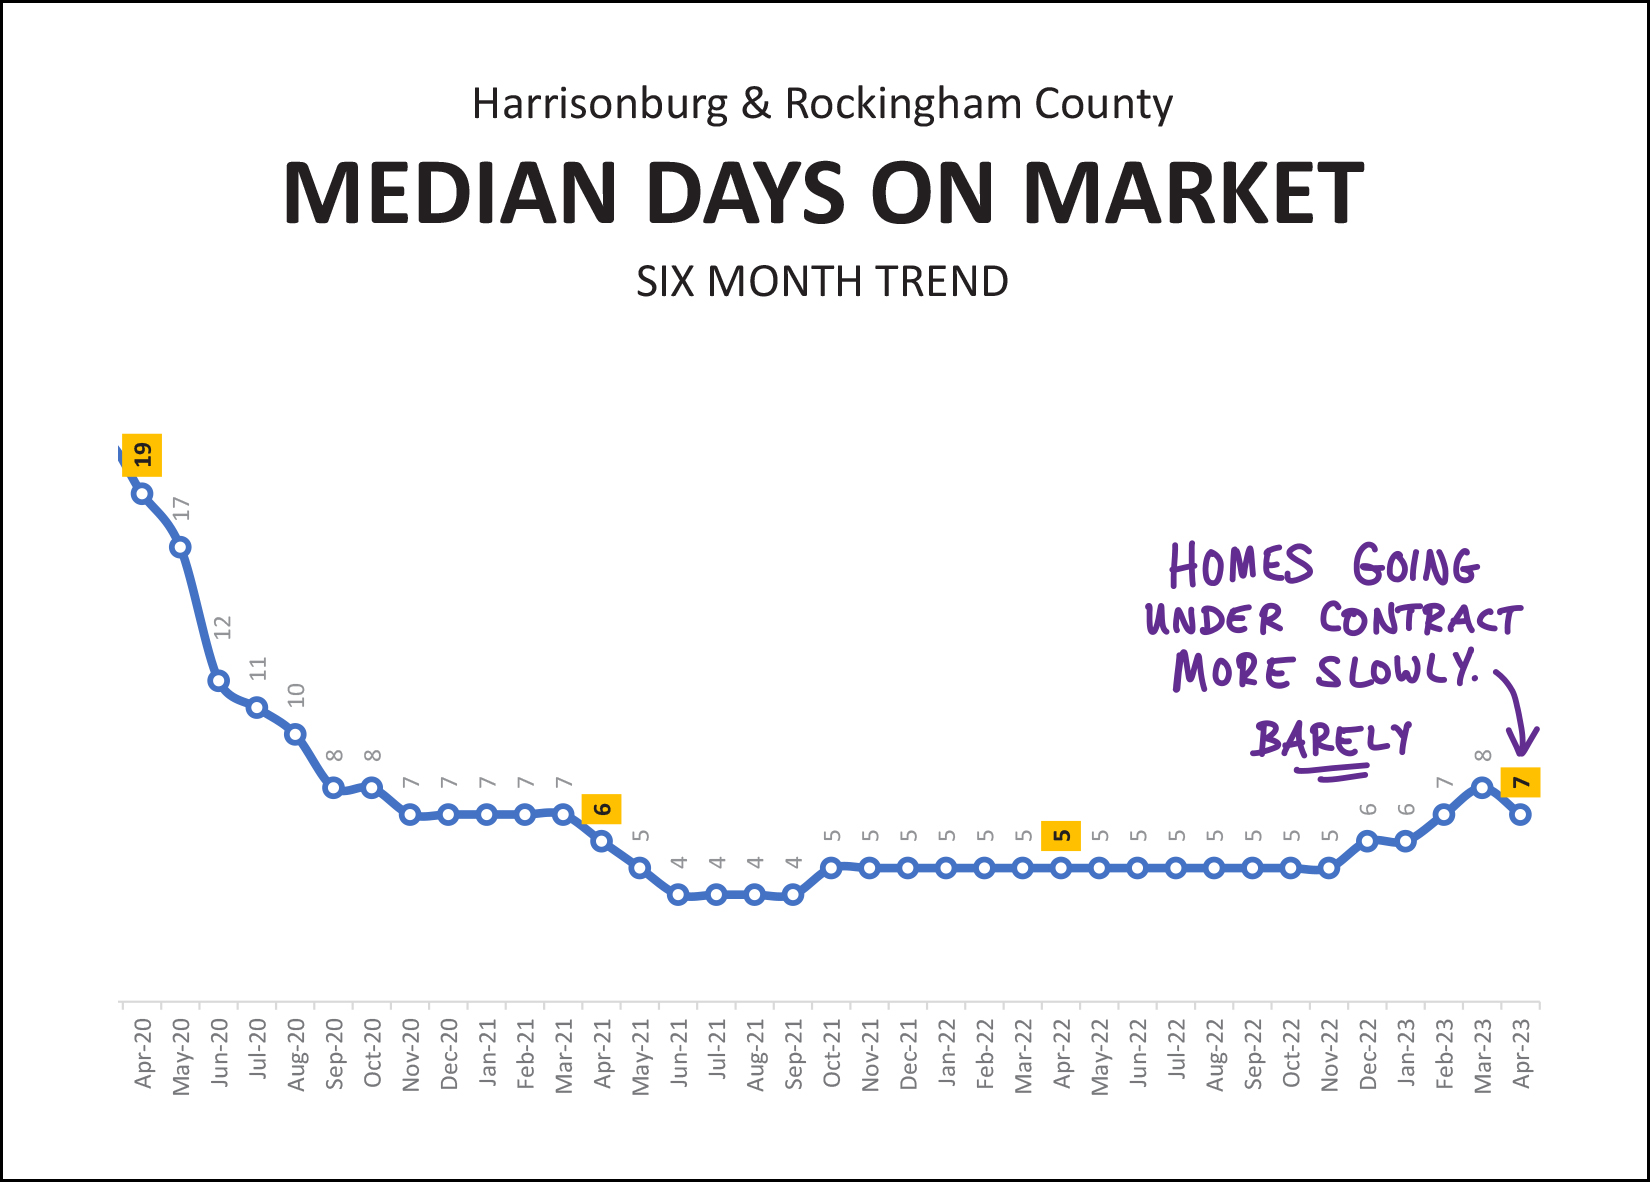 Indeed, after about a year of the median "days on market" statistic hovering right at five days... we have now seen the pace at which homes go under contract slowing, slightly, over the past five months. If I had to hypothesize as to why this number has risen (barely) I would guess it is related to higher mortgage interest rates. I am seeing three things happen when new listings hit the market right now... [1] Slightly fewer showings than we would have seen a year ago. [2] Fewer offers than we would have seen a year ago. [3] Many buyers needing to take a day or two to run numbers with their mortgage lender before making a decision about making an offer. The speed at which homes are going under contract certainly varies quite a bit based on the price range, location and property type -- but as shown above -- it is taking an extra two days (ish) for homes to go under contract right now. This is slightly slower than in 2022, but drastically faster than just about anytime prior to 2021. Finally, mortgage interest rates, which have been mentioned (and blamed) throughout this report... 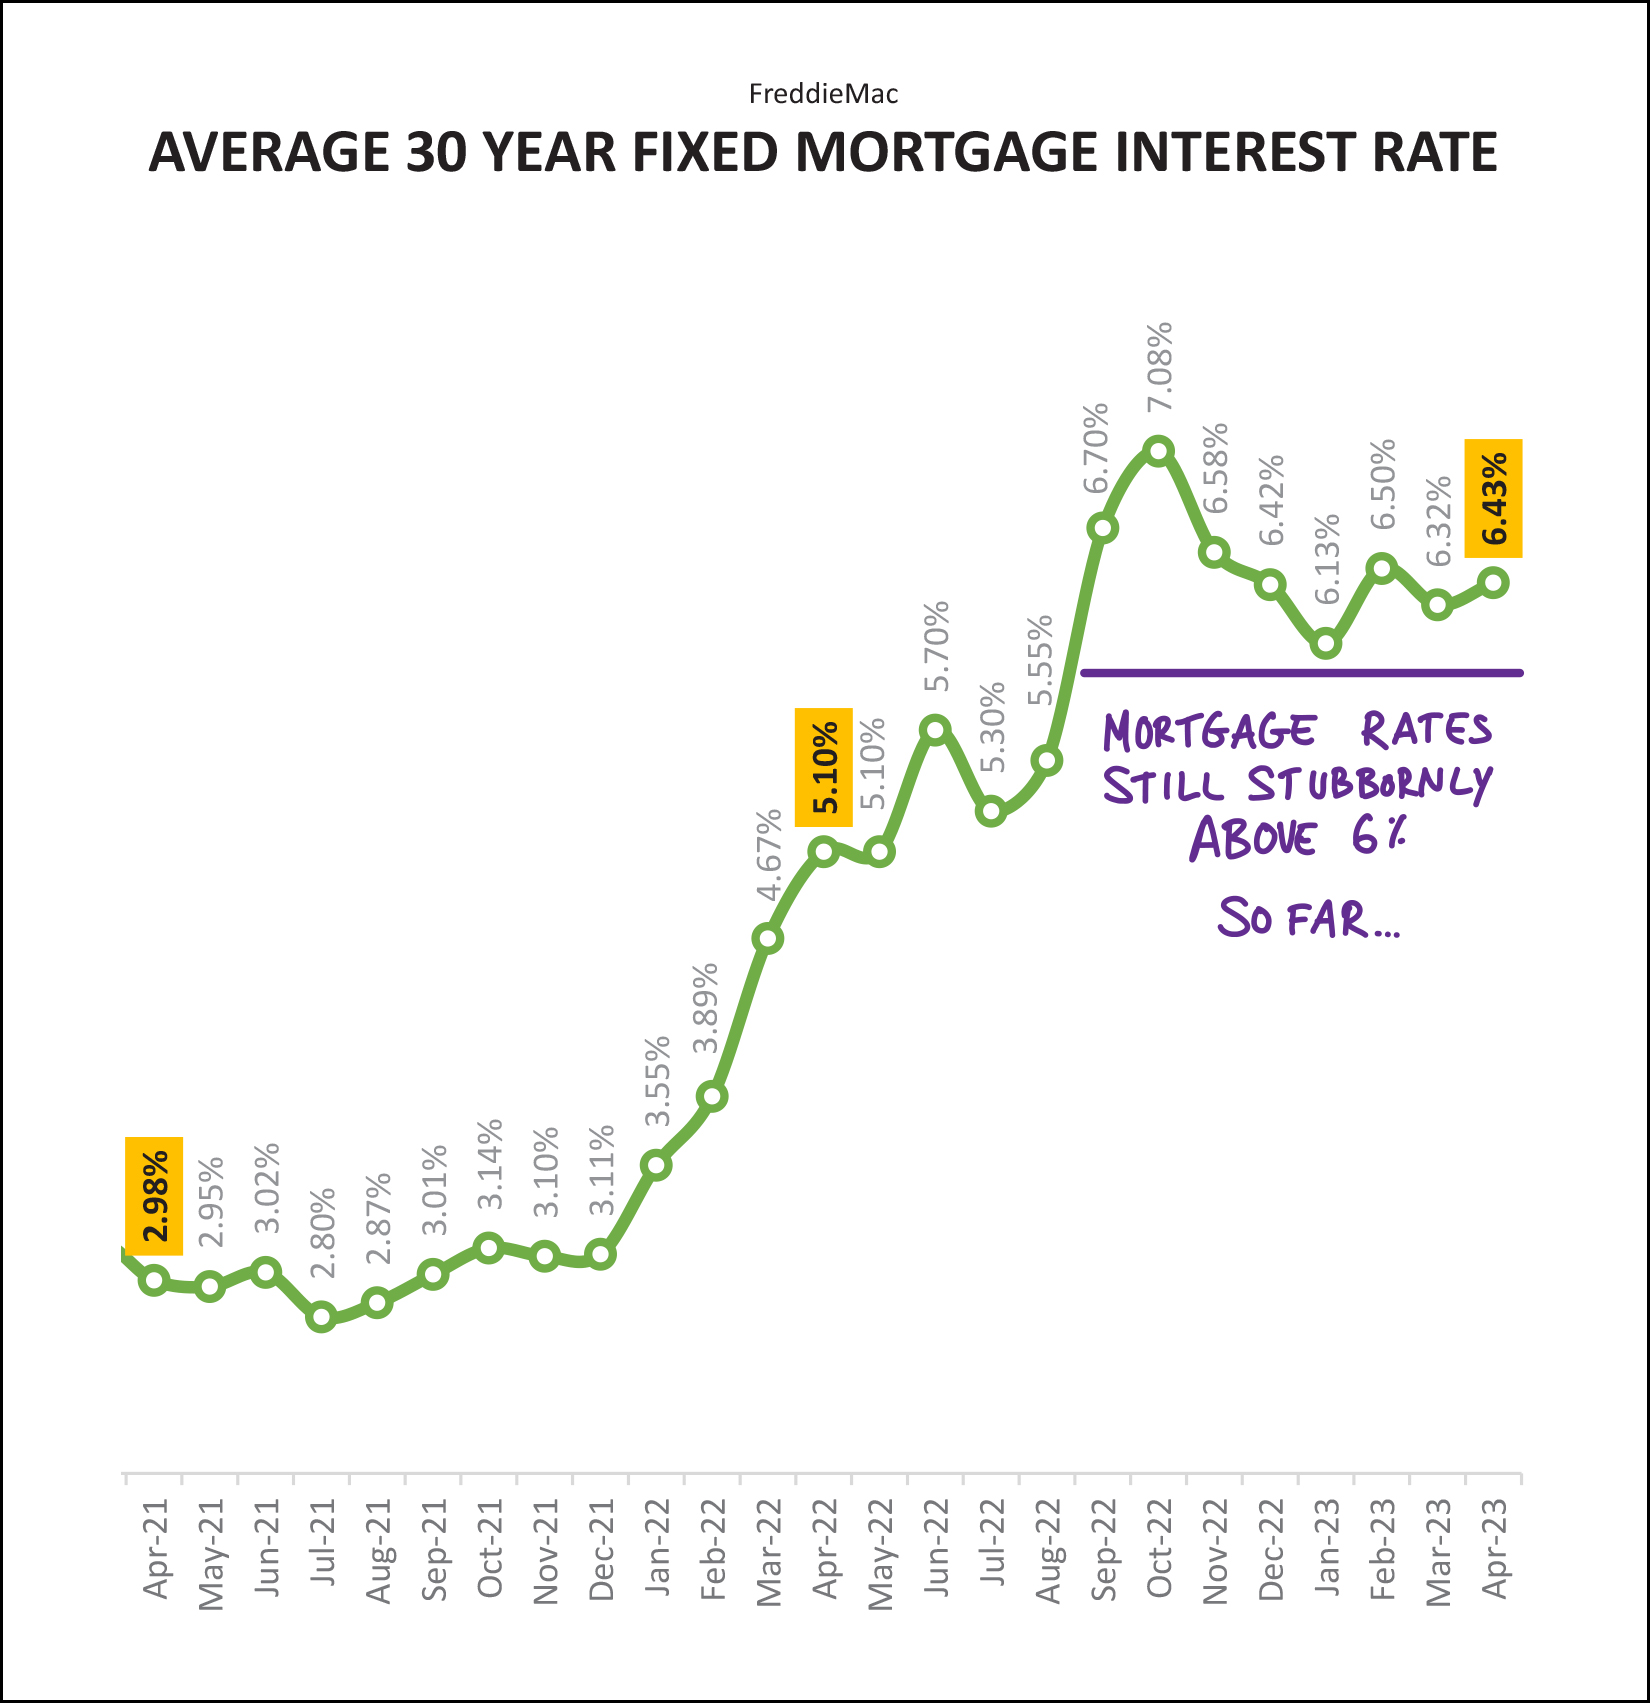 After multiple years of mortgage interest rates below 4%, we saw them climb quickly through the 5% range (within six months!) and they have stayed above 6% since that time. We are now entering the ninth month of most buyers likely buying homes with mortgage interest rates above 6%. These higher mortgage interest rates, combined with higher sales prices, are significantly increasing the monthly housing cost for any would-be home buyer considering a purchase in 2023. Will mortgage interest rates edge back down below 6%? I think there's a chance they will later in 2023, but it is certainly not... certain. ;-) So... given all of this data, given all of these trends, where does this leave us? Home buyers should still be prepared to go see new listings quickly when they hit the market, and must have their lender on speed dial to confirm a potential mortgage payment given ever changing mortgage interest rates. Depending on the popularity of the home you will be buying, we may very well still be competing with multiple other offers and considering which contingencies you might be willing to omit from your offer. You'll be buying in a challenging market for buyers -- with limited inventory and increasing prices. Buying a home in 2023 is definitely still possible, but it will require patience and perseverance. Home sellers are still in good (great) shape with lots of buyer demand in many or most price ranges... but home sellers should *not* assume that they will definitely have multiple offers, over asking price, with limited contingencies. That might be the situation you find yourself in (hooray!) but if you only have one offer, at the asking price, with some "normal" contingencies - I'll encourage you to still be excited. Pricing your home appropriately, preparing it thoroughly and marketing it professionally are just as important as ever in 2023. That's all for today, friends. I hope you now consider yourself a bit more informed about our local housing market, and a bit hungrier for a delicious meal at The Little Grill. ;-) The next month or so is a busy time for many of us with school years ending, summer beginning, and many other changes. Even as the days inevitably seem to start moving by more quickly than ever, I hope you are able find the time to slow down and meaningfully connect with the people who are important in your life. Send a friend, family member, neighbor or colleague a quick text to check in - or give them a call just to say hello. Make the time to make those connections, and I'm confident you will be glad that you did so. As always, please reach out anytime if I can be of help to you -- with real estate or otherwise. You can reach me most easily at 540-578-0102 (call/text) or by email here. | |
Home Prices Still On The Rise Despite Fewer Home Sales In 2023 |
|
 Happy Thursday afternoon, friends! The spring real estate market is upon us -- though it looks and feels a bit different than it did over the past few years. Read on for stories of fewer home sales, rising prices and stubbornly low inventory levels. Speaking of spring... if you're looking for a home with landscaping that really pops each March, check out this beautiful, four bedroom, brick home over on Meadowlark Drive that came on the market earlier this week... On a personal note, can you spot any proud parents of a soon-to-be high school graduate in the photo below? :-) Wow, the past 18-ish years have flown by quickly. Luke will be graduating in early June and Shaena and I couldn't be more proud of this guy!  << Insert Here: Quick transition to some other topic so I can stop thinking about how old I must be if my son is about to be a high school graduate!?! >> OK, then... Each month I offer a giveaway, of sorts, for readers of this market report, highlighting some of my favorite places, things or events in Harrisonburg. Recent highlights have included Taste of India, A Bowl of Good and a Steel Wheels concert. This month... I'm giving away a $50 gift card to one of my favorite lunch (or dinner) spots downtown... Cuban Burger! I almost always order the Cuban Chop Chop with Chicken, but everything on their menu seems likely to be delicious! Click here to enter for a chance to win the $50 gift card! And now... let's move on along to the most recent data on our local real estate market. First, let's see what "fewer home sales" looks like right now... 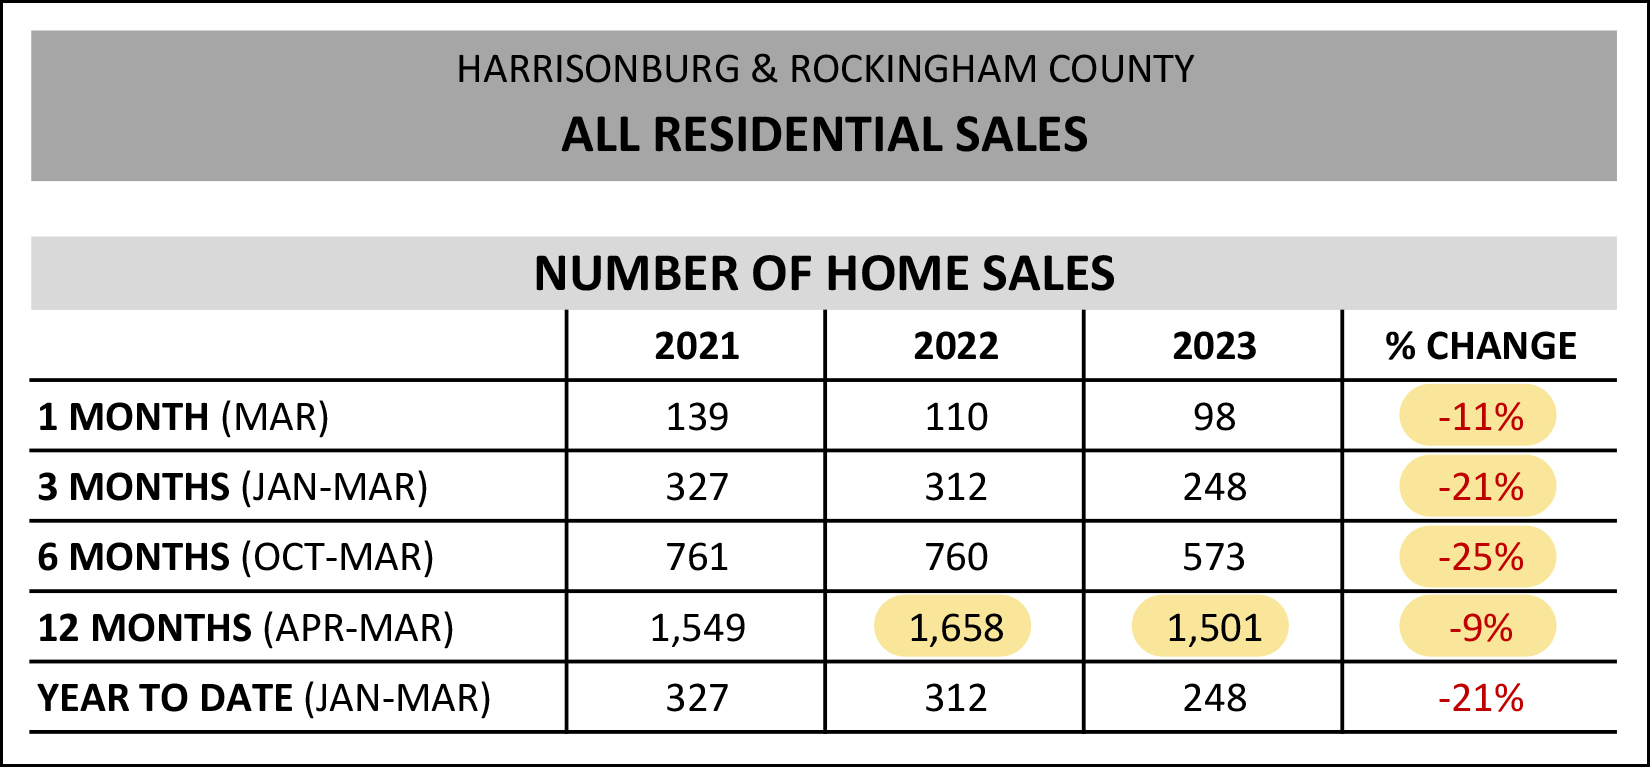 A few observations related to the chart above... [1] While the number of home sales taking place this March was 11% lower than a year ago -- that's not quite as much of a drop as we see when we look at the past three months (-21%) or the past six months (-25%). So, maybe things are picking back up -- a bit -- here in March? Maybe? [2] There have been 1,501 home sales over the past year in Harrisonburg and Rockingham County which is a 9% drop from the previous 12 months when there were 1,658 home sales. This drop of 157 home sales for the year seems almost certainly to be a one-sided supply side issue -- not enough sellers selling. You'll note later on in this report that inventory levels haven't risen by 157 homes (due to buyers not wanting to buy) so the constraint on the number of home sales is almost certainly directly tied to how many sellers want to or are willing to sell. But despite fewer homes selling, home prices keep on rising...  Yes, we could pick on the one red number on the chart above -- showing a 1% decline in the median sales price between March 2022 and March 2023 -- but the small sample size (of one month of data) means that this is not necessarily a meaningful indicator of an actual downward trend. This is made even more evident by the 10% - 11% increases in the median sales price when looking at three, six and 12 months of data in the chart above. Perhaps more importantly, yes, we're still seeing double digit annual increases in the median sales price in Harrisonburg and Rockingham County. One year ago the median sales price was $276,200. It has risen 10% over the past year, cleared $300K, and is now at $304,900. Just to refresh one's memory on what "median" signifies -- it means that half of the homes that are selling are priced at or above $304,900 and half are at or below $304,900. Prices just keep on rising! Buyers who are frustrated that they can't wait even just a day to make a decision about an offer on a hot new listing might be encouraged by these next stats...  There has been an ever so slight (ok, technically 20%) increase in the median days on market stat over the past year. A year ago homes were going under contract after a median of five days... and now that has risen to... six days. Yes, I know, that one day might not seem that significant -- but if we look at just the past three months we'll note that the median days on market has jumped up to eight days! So, some new listings are lasting an extra day (or three) on the market before they're going under contract. So, the market is slowing down... barely. It will be interesting to see if this metric continues to rise, falls again, or stays at about the same level as we move into and through the spring market. Now, as to what is actually selling, there are some interesting trends to be noted between existing homes and new homes. I have highlighted the numbers below that I think deserve attention. Here's the existing home sales data... 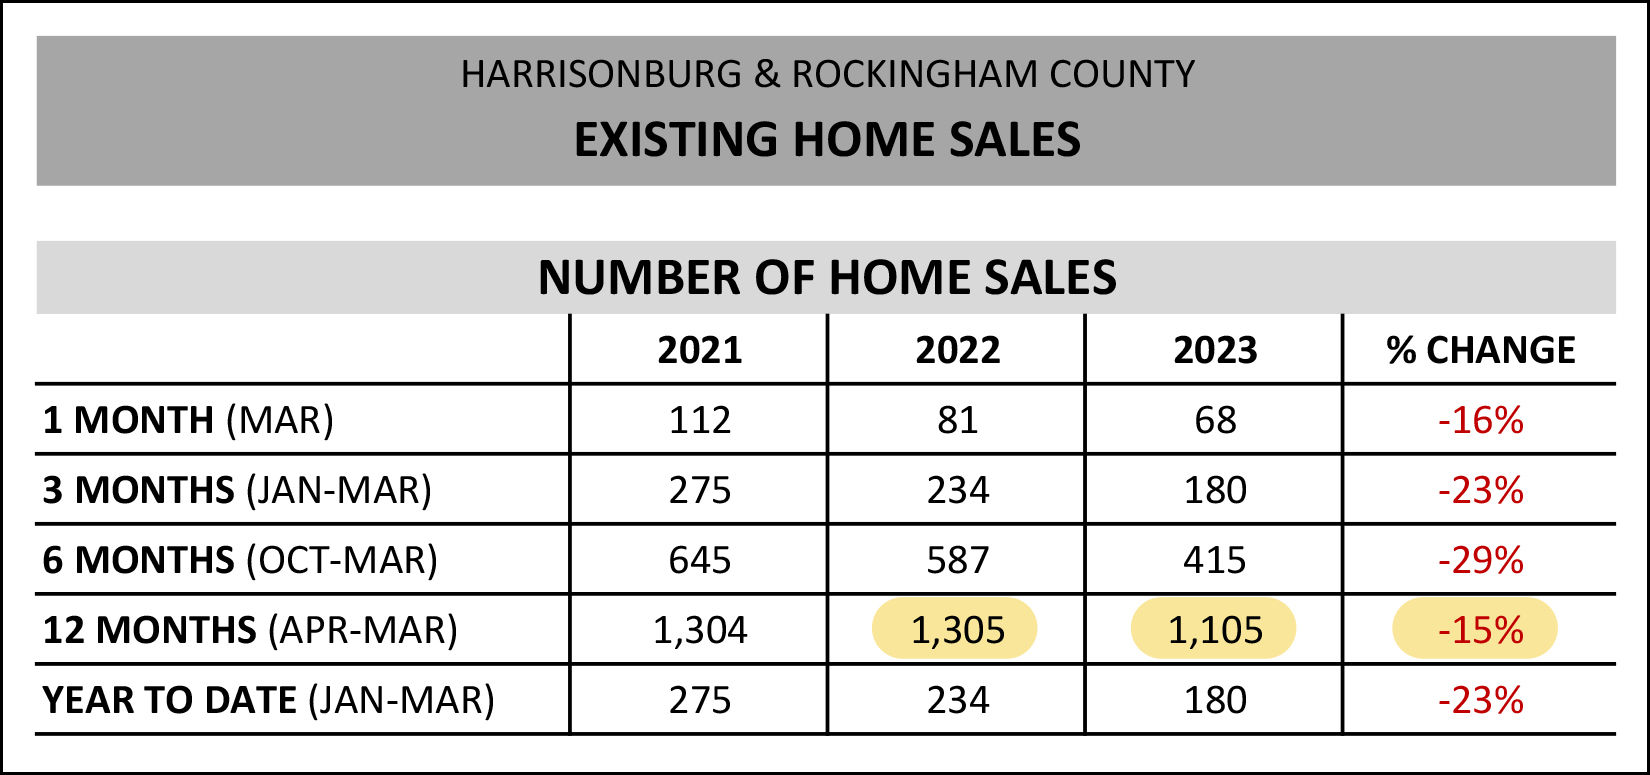 ...and here's the new home sales data... 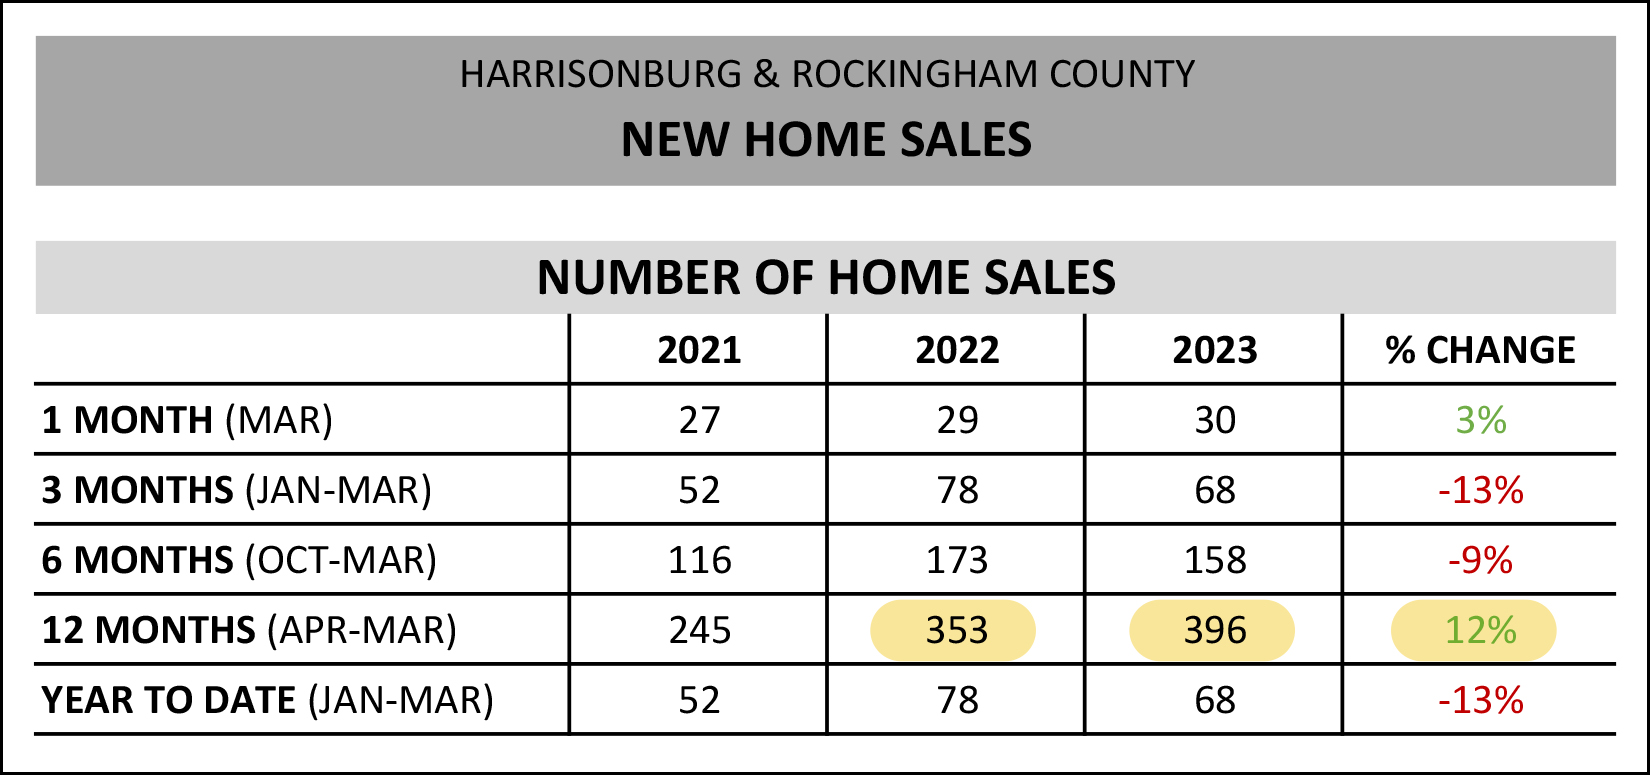 So, while the overall market has seen a 9% decline in home sales over the past year... [1] There has been a 15% decline in existing home sales. [2] There has been a 12% increase in new home sales. If you want to buy a home that is of the property type, size, price and location of one of our area's new home communities -- these trends work in your favor. If you want to buy an existing home (not a new home) in an established neighborhood -- these trends aren't all that exciting. There haven't been 9% fewer homes to buy over the past year -- there have been 15% fewer homes to buy!?! Now, circling back to the monthly data... 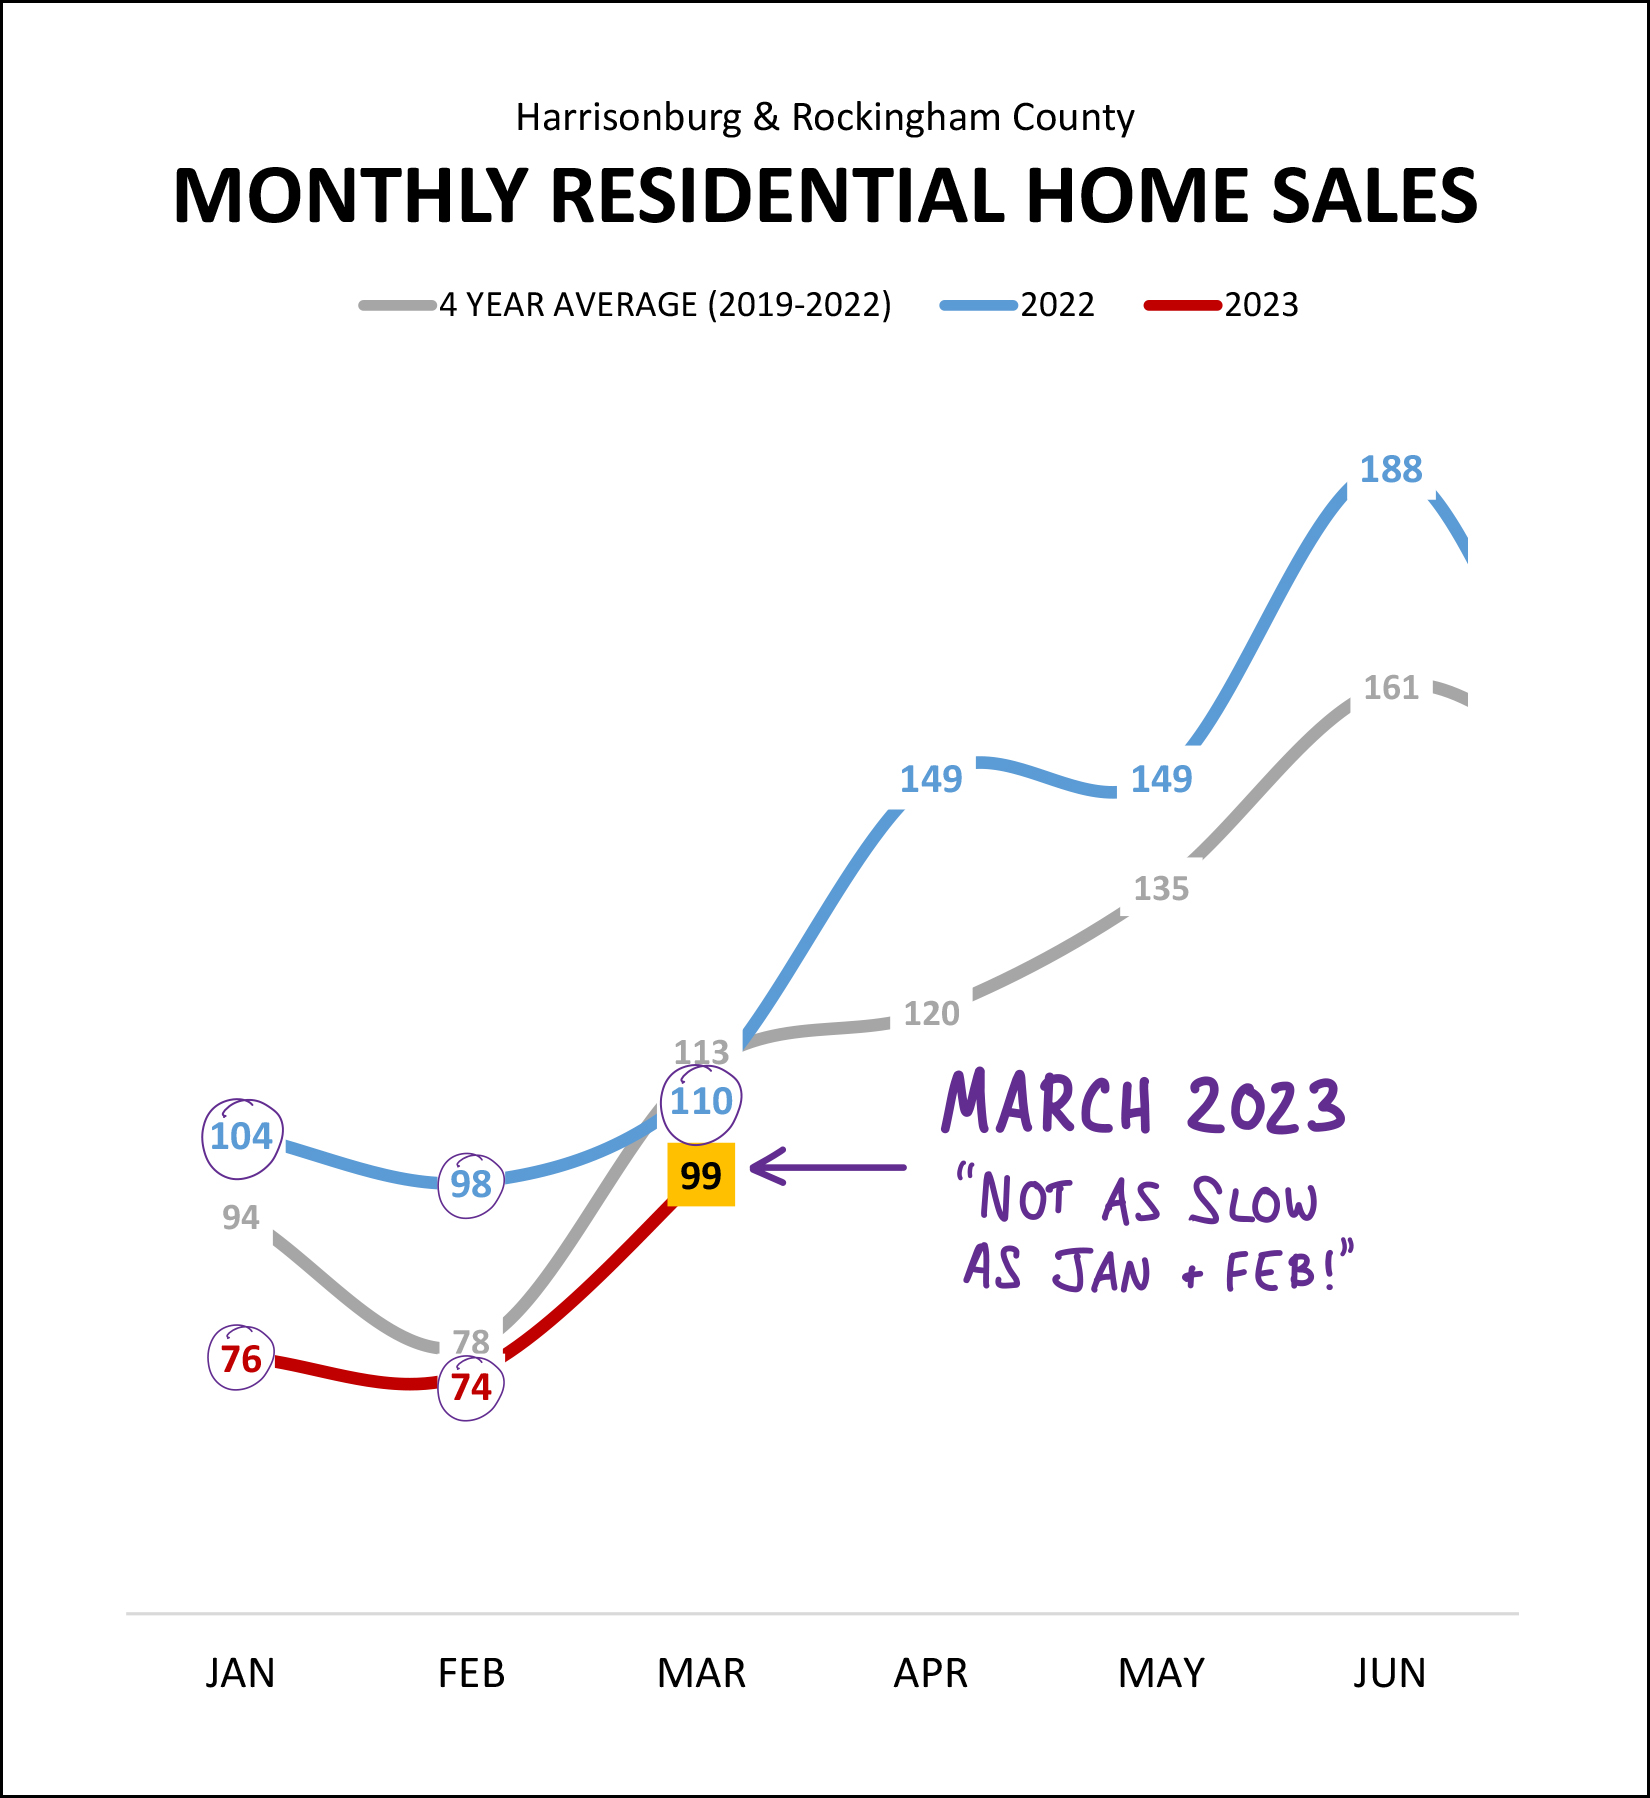 March was... not as slow as January and February!?! ;-) We saw significantly fewer home sales this past January and February as compared to the same month last year. January sales were 27% below the prior year. February sales were 24% below the prior year. March sales were only... 10% below the prior year! So, I suppose that's a bit encouraging... we're starting to see a slight increase in monthly home sales... though yes, we're definitely still well behind 2022. And for anyone who likes a good participation trophy... 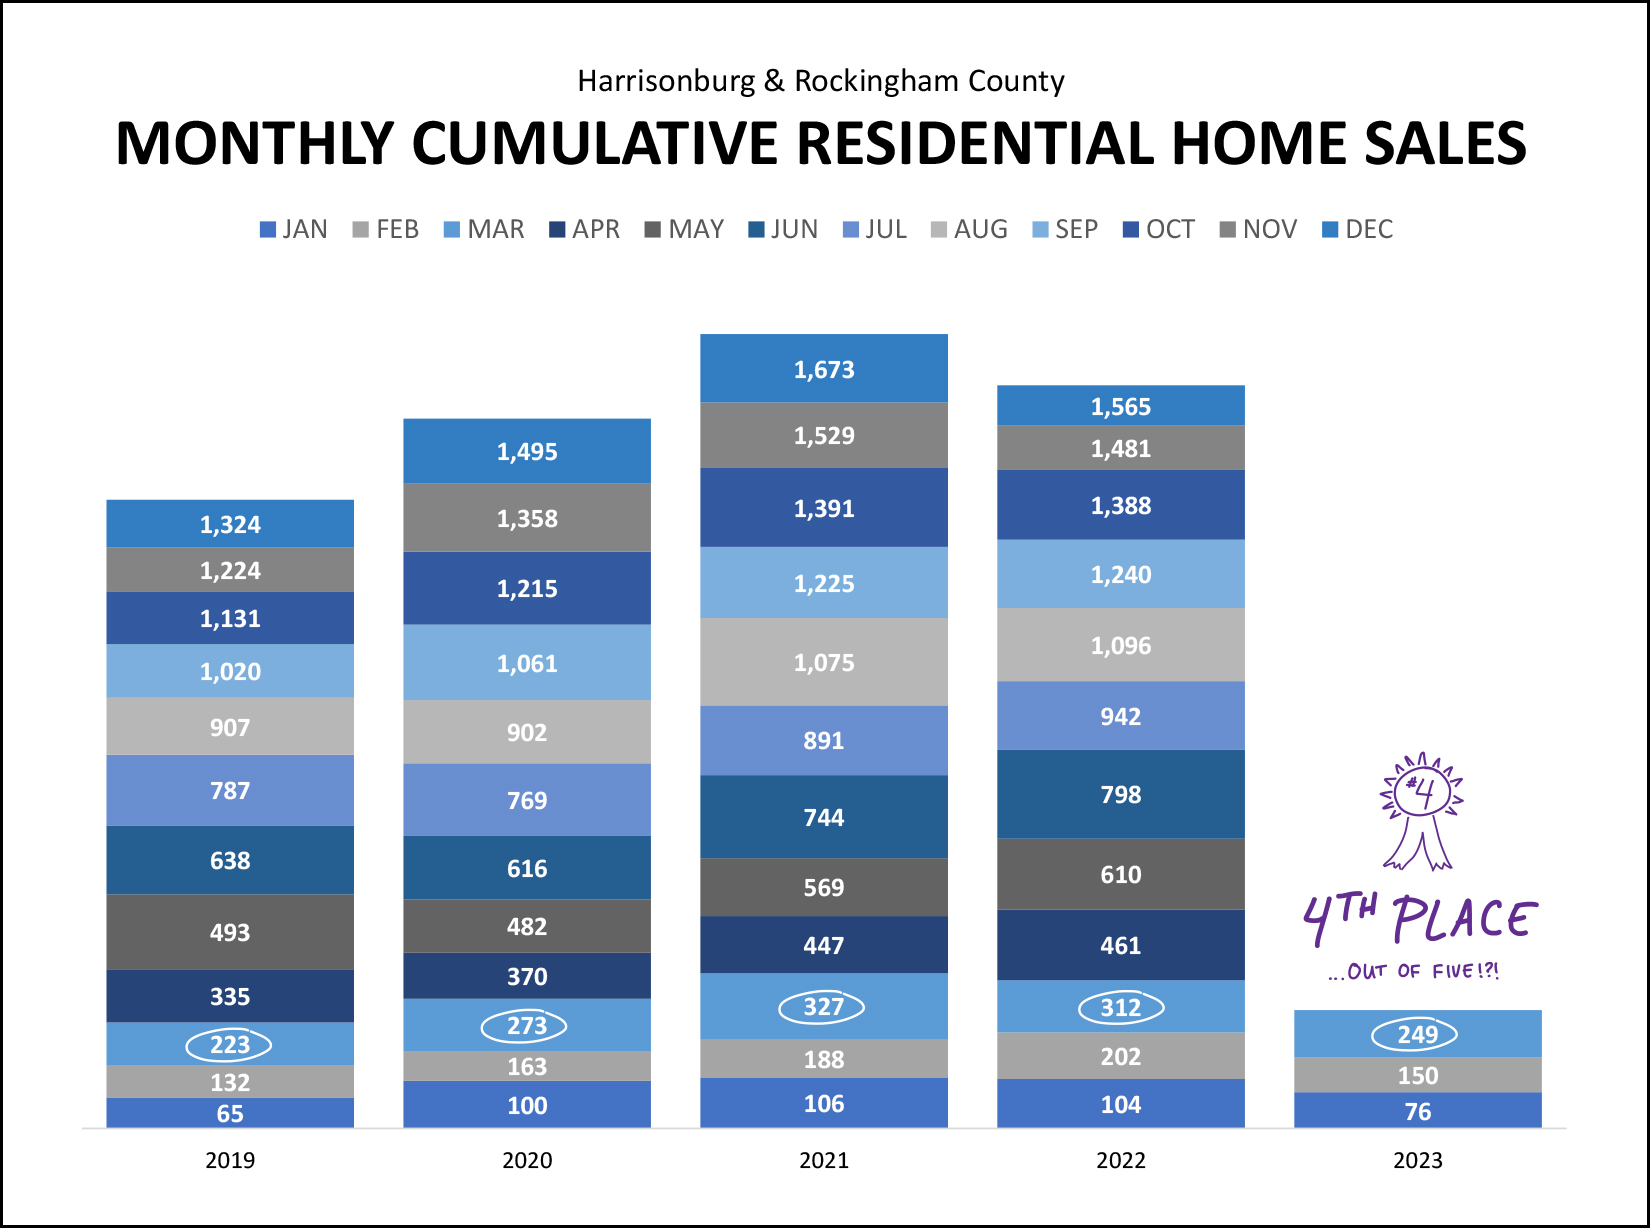 ... First Quarter Home Sales In 2023 came in at... 4th Place... oh, out of five contestants! Indeed, the 249 home sales we have seen in the first quarter of 2023 was fewer than we saw in 2020, 2021 and 2022. We are slightly ahead of the first quarter of 2019, though, so there's that... Looking at the big picture of our market over the past few years, in visual form... 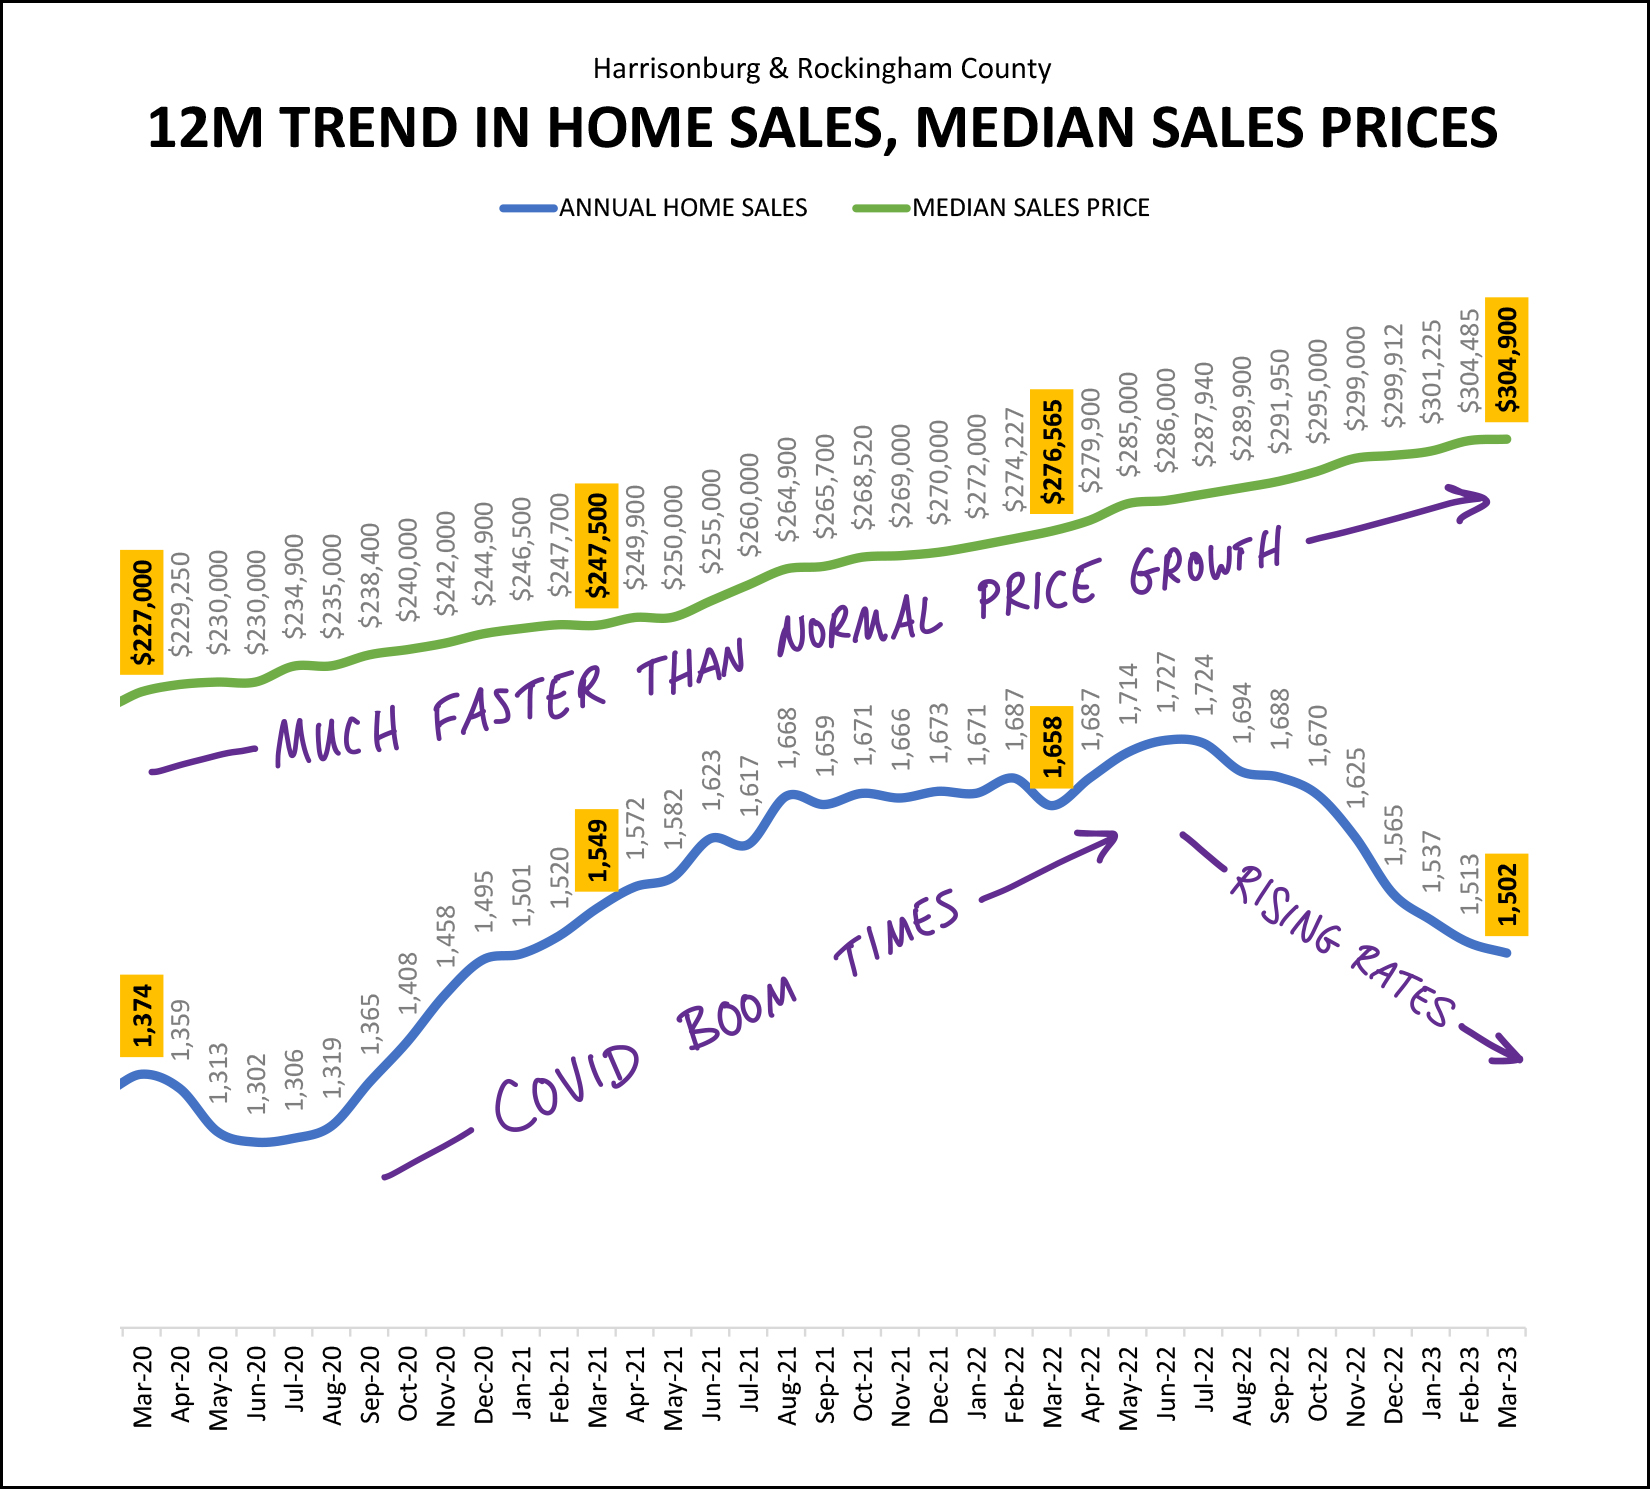 There are two main things to note in the graph above... [1] Home prices have been increasing at a much faster pace than is historically normal. We're in the third year in a row of double digit (per year) increases in the median sales price in our area. [2] After a two year boom in the number of homes selling (due to Covid and super low interest rates) we are now almost a year into a steady decline in annual home sales (from 1,727 per year to 1,502 per year) mostly related to rising mortgage interest rates. Now, let's look ahead by looking behind... 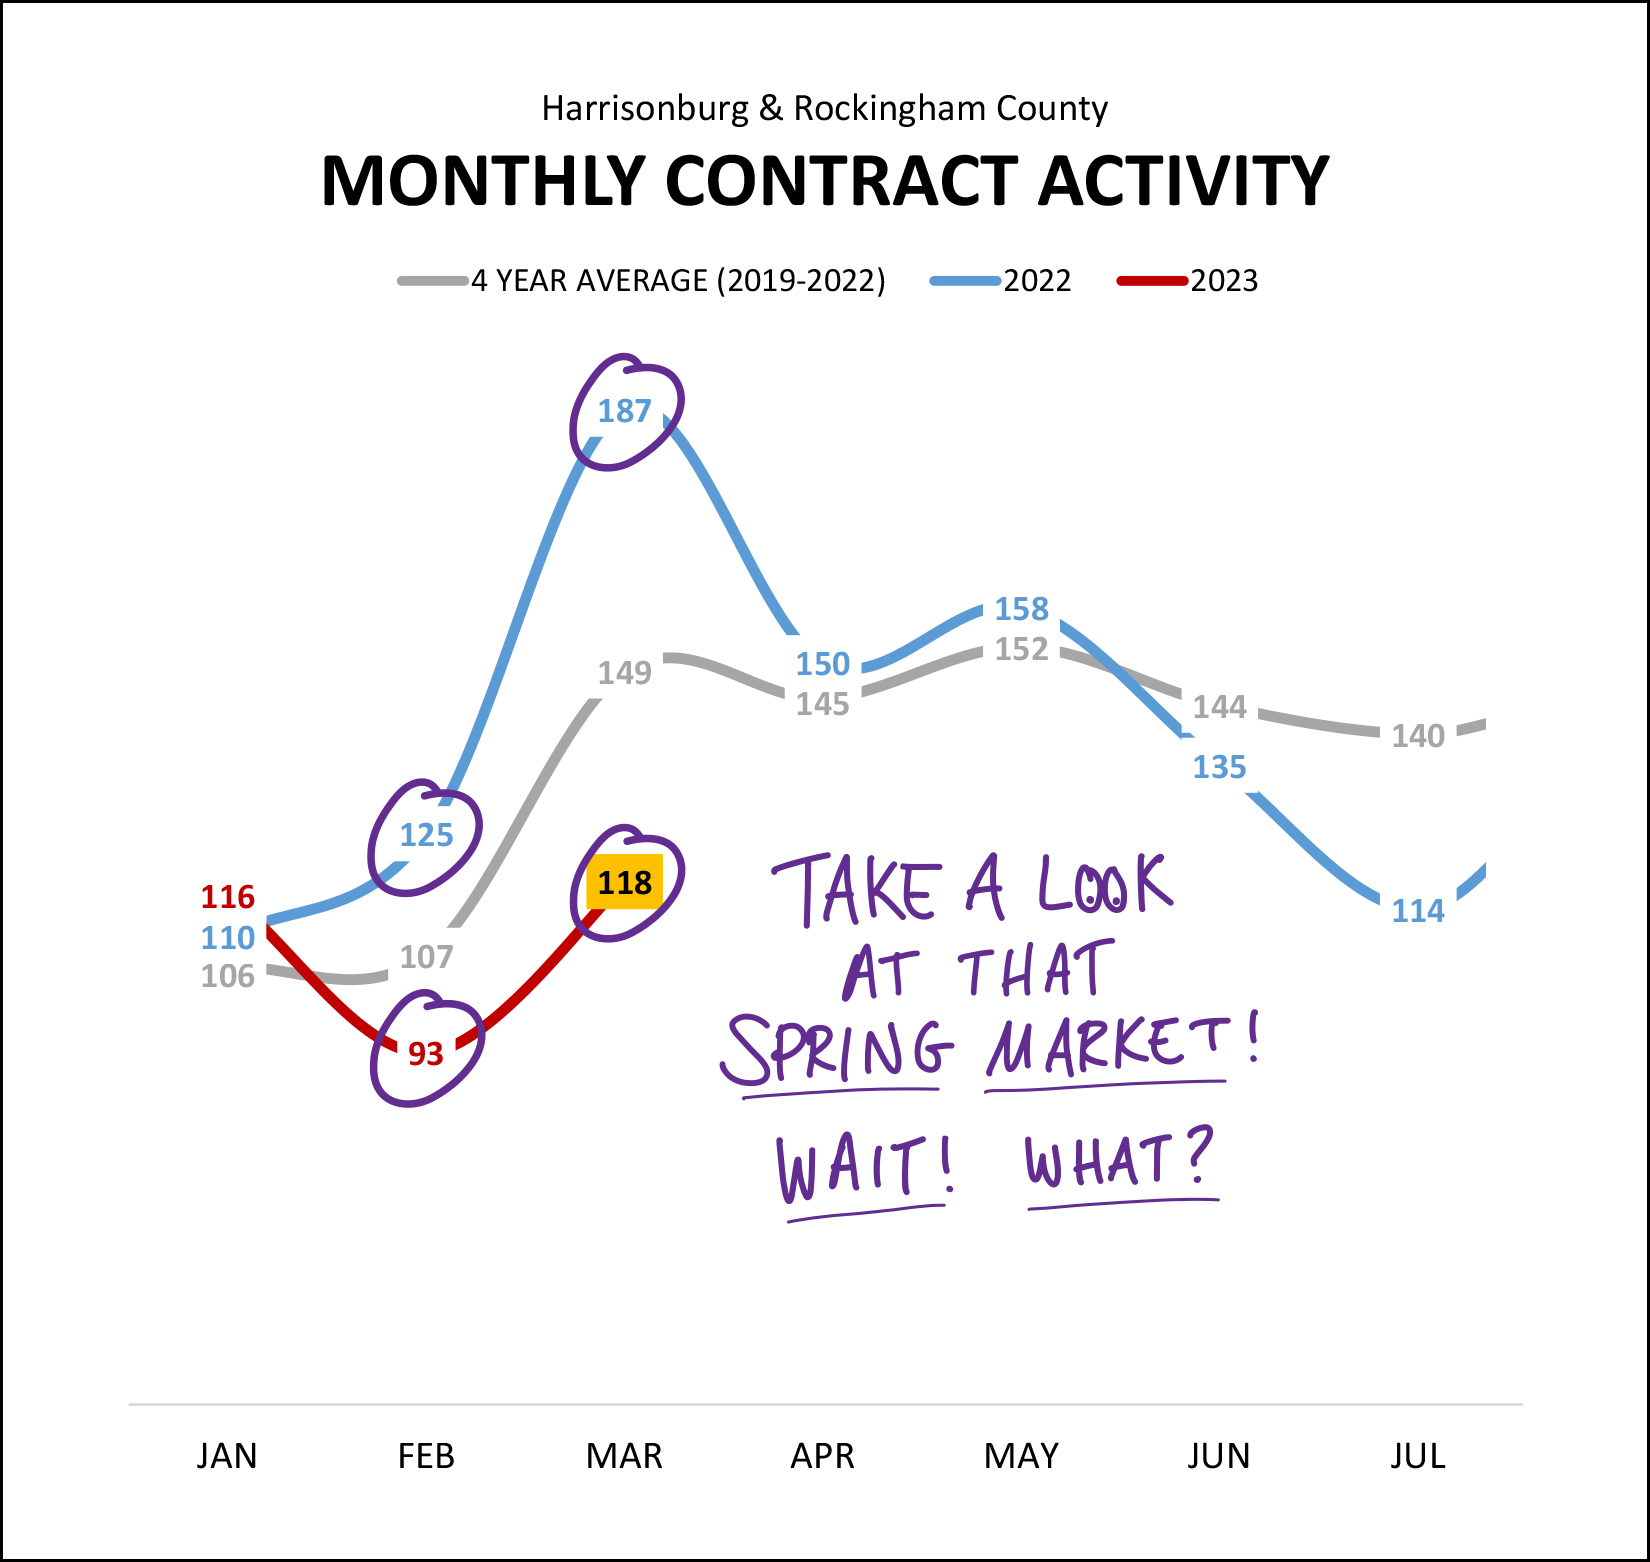 Home sales this month are most directly influenced by contracts last month. So, how did things go in the March market? Lots of sellers listing their homes for sale? Lots of buyers contracting to buy homes? Well... not really. [1] Contract activity declined 26% in February 2023 compared to February 2022. [2] Contract activity declined 37% in March 2023 compared to March 2023. So, yeah, the spring market (sooo many listings, sooo many contracts) doesn't quite seem to be showing up this year like it did last year. Maybe the buyers (and much more importantly, the sellers) will start showing up in April? Unsurprisingly, several slow months of signed contracts brings on a lower than ever number of pending sales in Harrisonburg and Rockingham County... 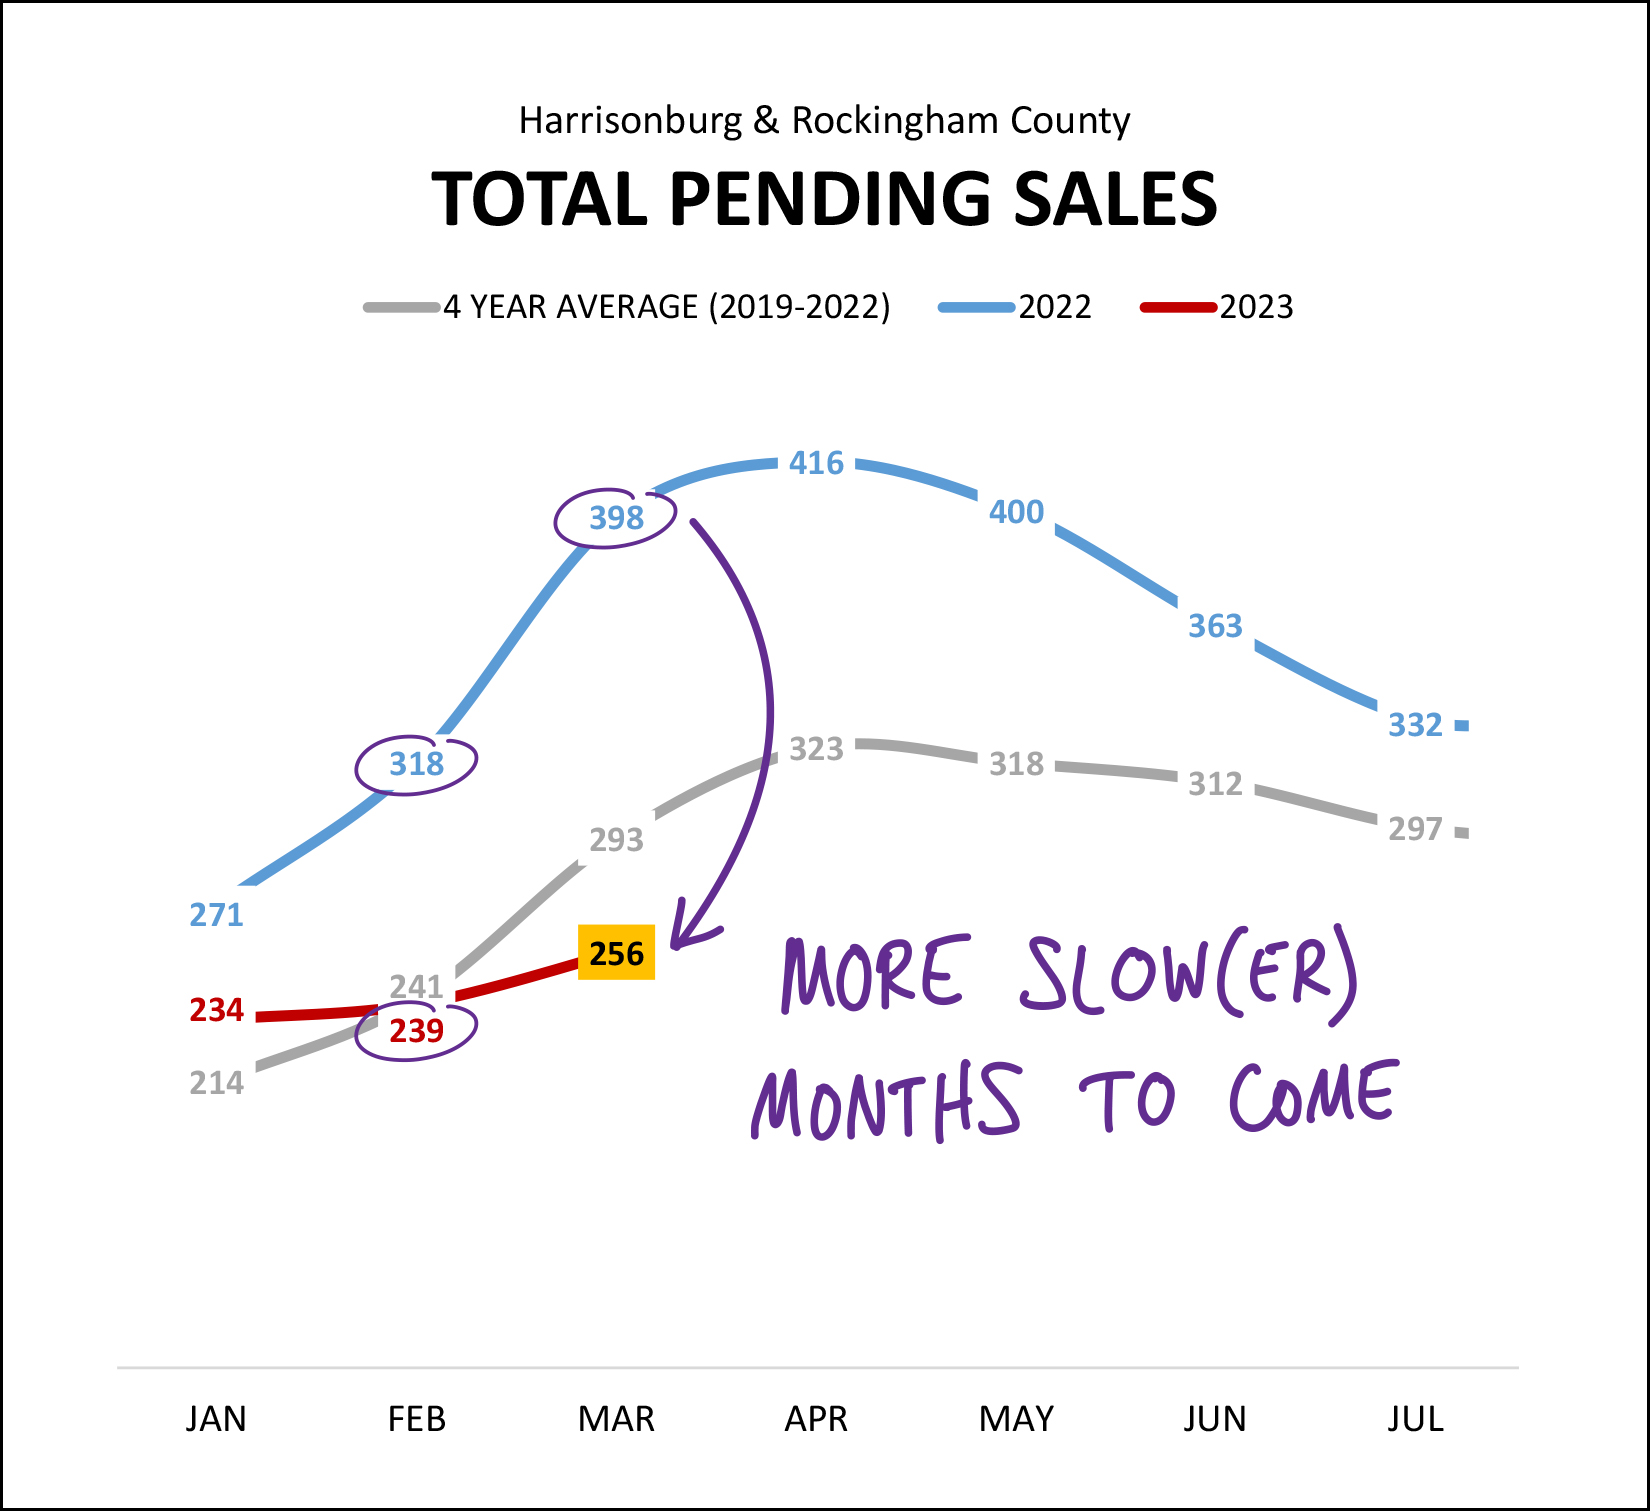 There are 256 homes currently under contract in Harrisonburg and Rockingham County. One year ago there were 398 (!!!) homes under contract. Over the past four years we've seen an average of 293 homes under contract at this time of year. So, yeah, based on the low number of pending sales right now, we are likely to see at least another month or two (or more!?) of slow(er) months of home sales. Why have there been so few homes going under contract? Are the listings pouring onto the market and buyers are just deciding not to buy? If that were the case, we'd see inventory levels starting to climb, so, let's take a look... 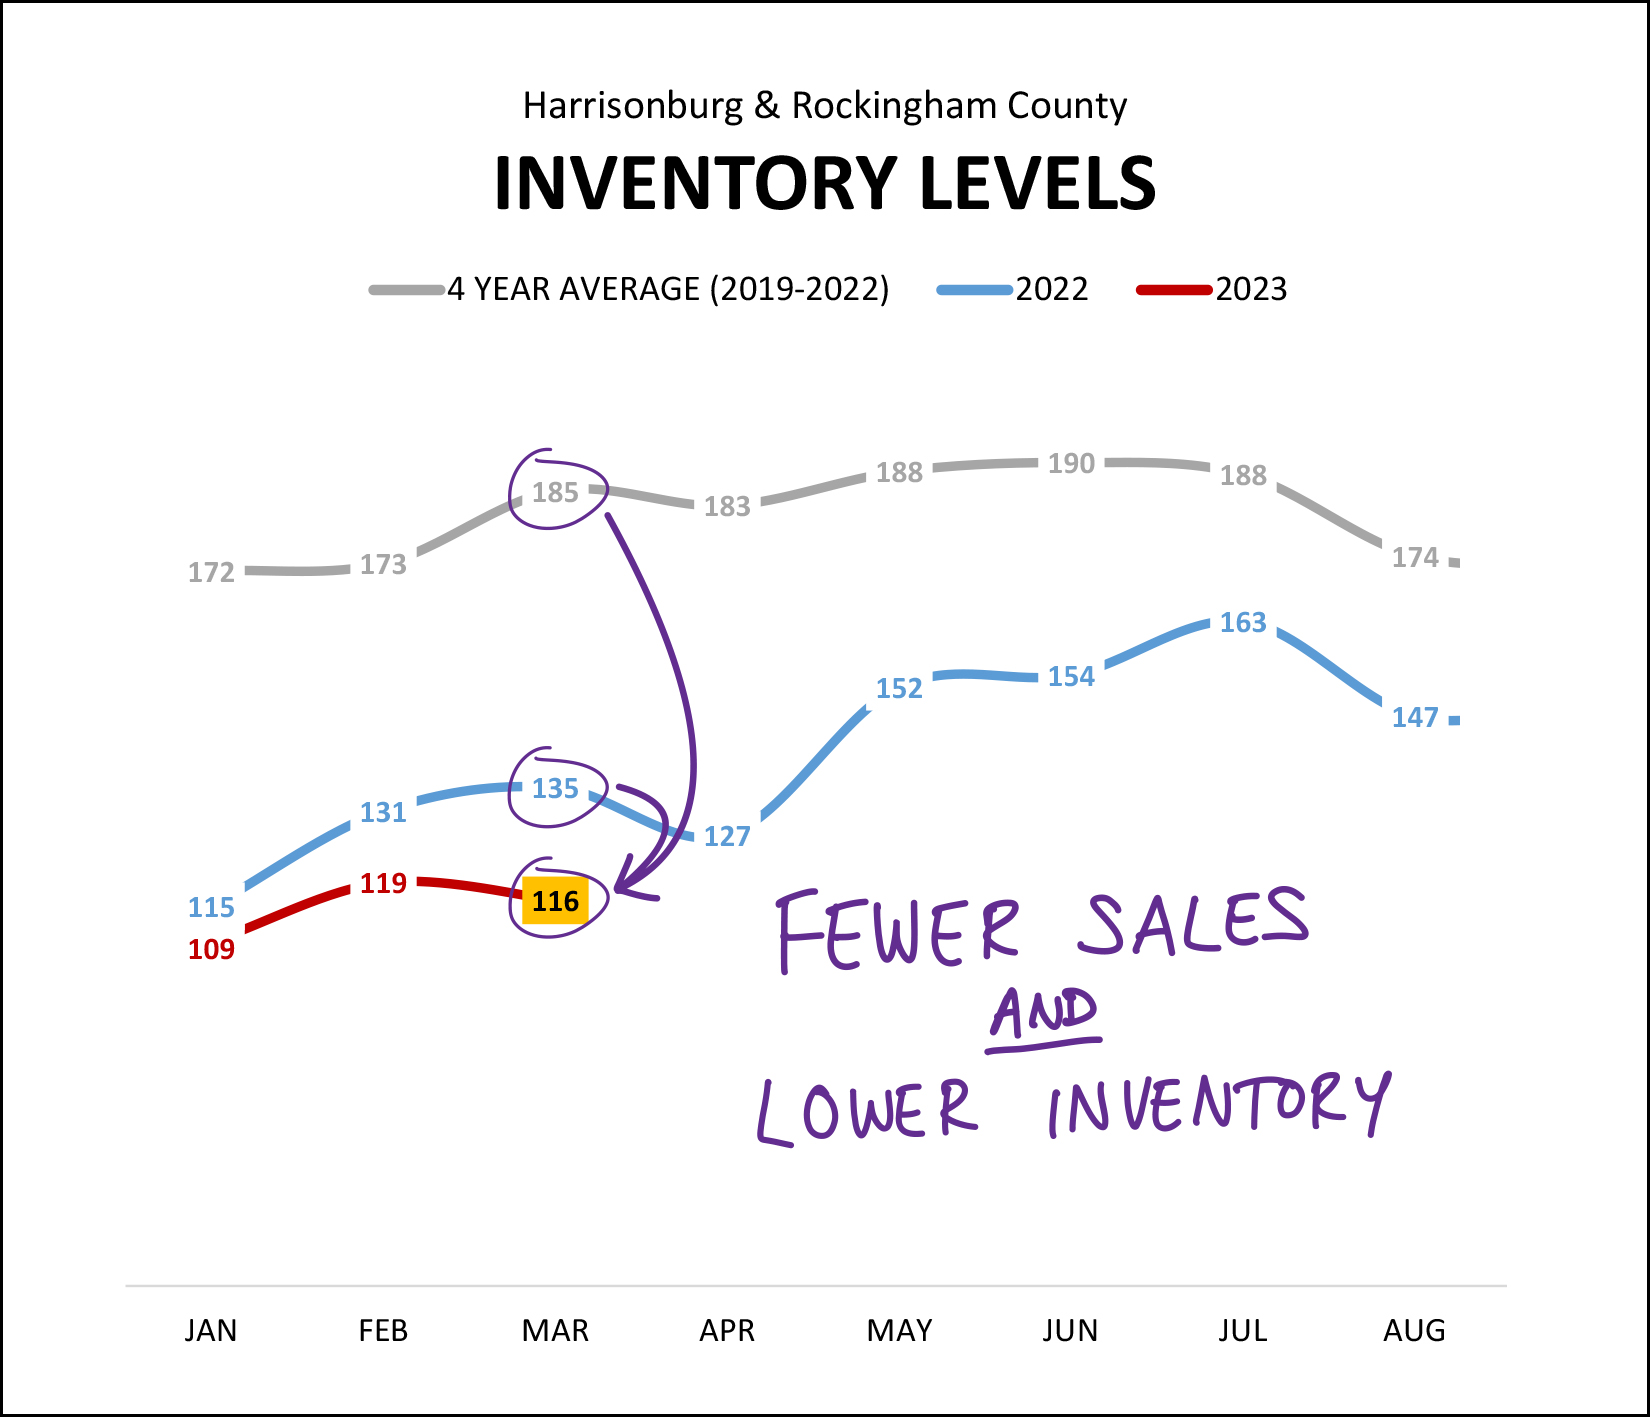 In fact, no, inventory levels are not rising. They are staying stubbornly low. There are 116 homes on the market right now (for sale, not under contract) in Harrisonburg and Rockingham County. This is compared to 135 being on the market a year ago at this time... and an average of 185 being on the market over the past four years at this time of year. So, buyers seem to not be buying because... there's nothing to buy. Or, at least, there's less to buy. Plenty of homes (-9% year over year) are still selling, but this decline in sales activity seems to still be entirely related to sellers not selling, and not related to buyers not buying. And yet, despite inventory levels staying super low, we are actually seeing a slightly change in how quickly homes are going under contract... 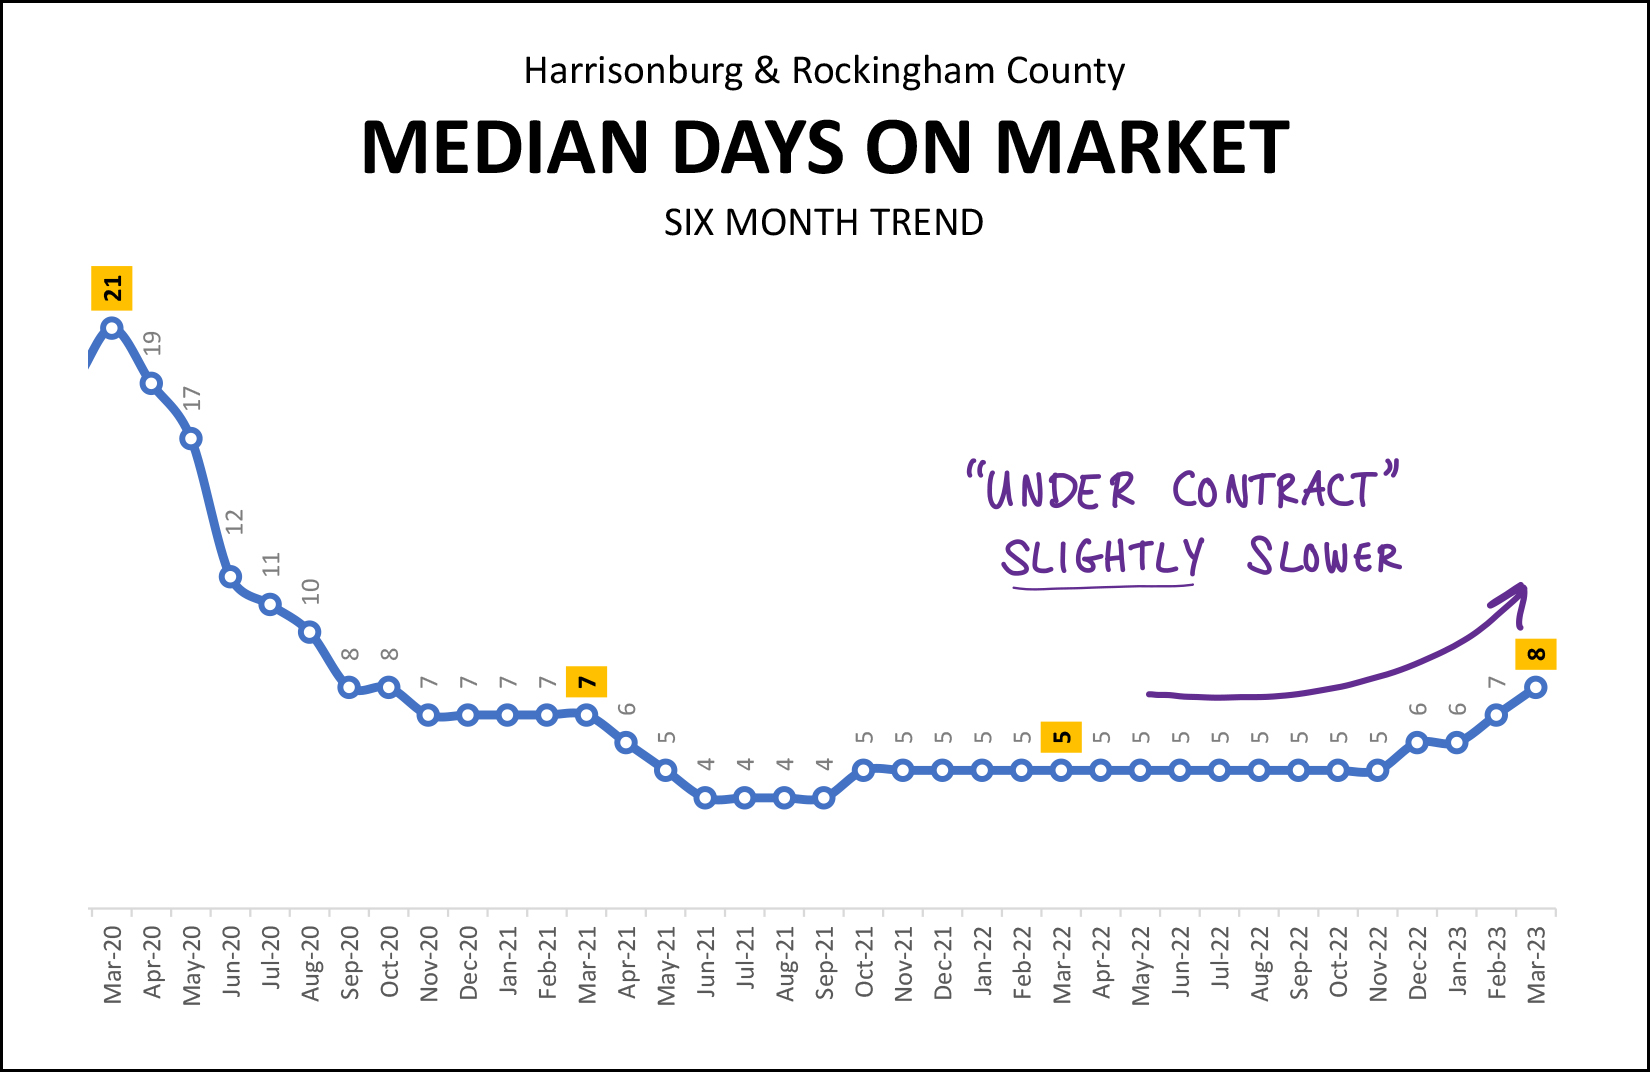 Over the past six months the "median days on market" has been eight days in Harrisonburg and Rockingham County. That means that half of the homes that have sold were under contract within eight days of hitting the market and half were under contract in eight or greater days. The change here is a slight increase from five days up to eight days over the past few months. We were seeing a median days on market of six days or less for almost two straight years (April 2021 - January 2023) but that is starting to drift upwards a bit. So, (some) listings are lasting an extra day or two (or three) on the market right now -- though these days on the market levels are still well below long term historical norms. Maybe it's taking buyers an extra day or two to make an offer because they have to keep checking in with their lender because rates are constantly jumping up and down from week to week and month to month? 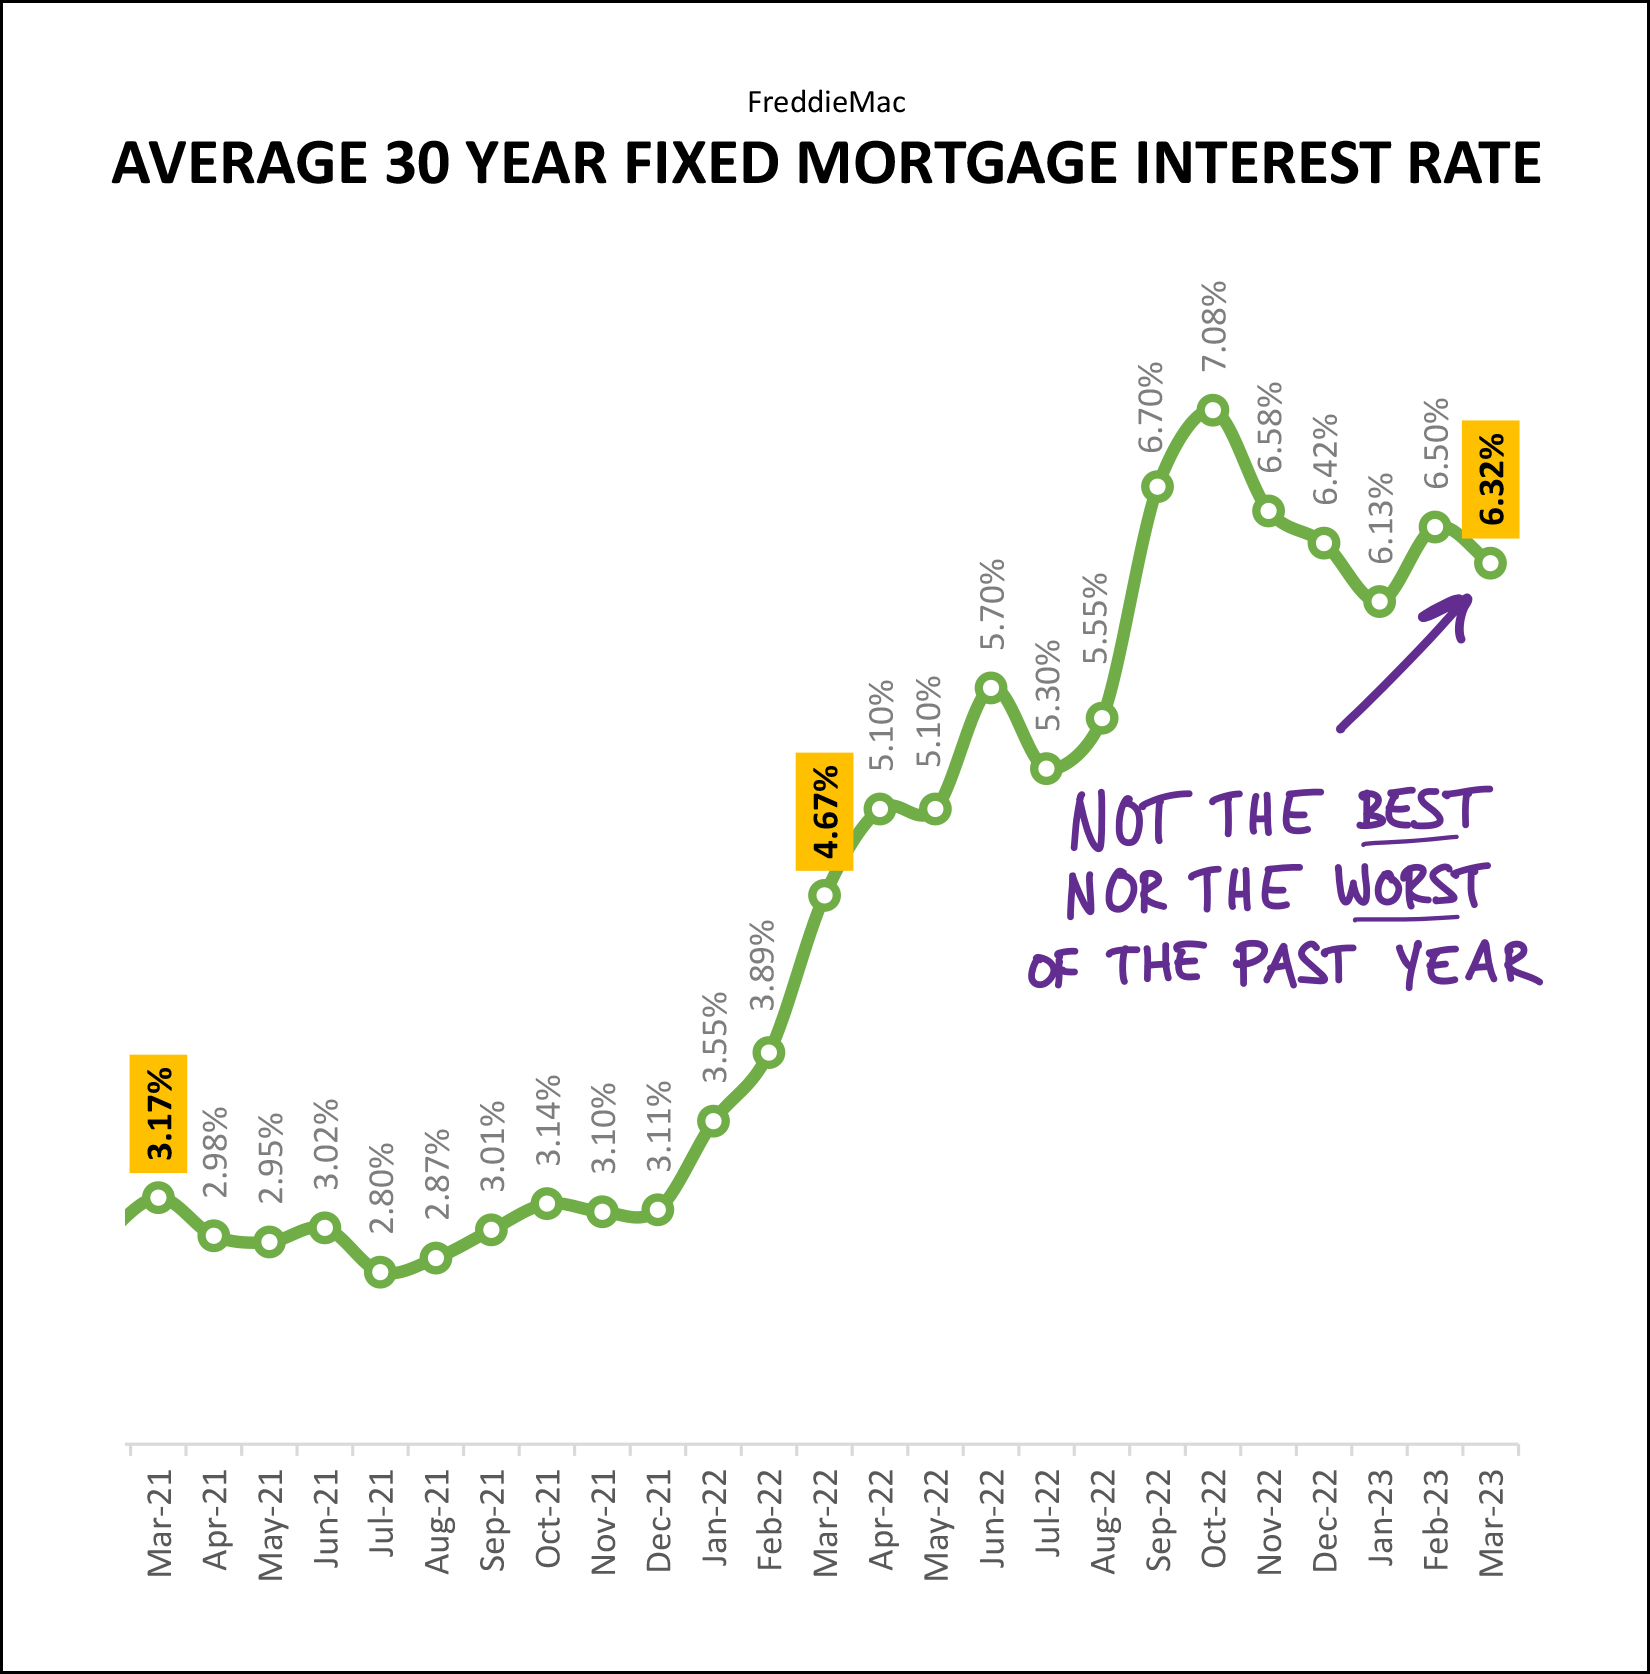 Rates dropped in March, after rising in February, after dropping in January -- you get the picture. We're currently seeing mortgage interest rates that are definitely and absolutely not the best we've seen in the past year -- but that also are a good bit below the worst that we've seen in the past year. Where mortgage interest rates go from here is anyone's guess -- but I'm thinking they will continue to fluctuate on a weekly and monthly basis for much of 2023. OK! That was a lot of data, and charts and graphs, oh my! If you made it all the way to the end, thanks for reading and I hope you are feeling more informed than ever as to the latest trends in our local housing market. If you're thinking about selling your home this spring or summer -- all of the would-be buyers of Harrisonburg and Rockingham County would REALLY like you to decide to do so. ;-) Let me know if you'd like to set up a time to walk through your home together to talk about preparations, pricing, timing, etc. If you're hoping to buy a home this spring or summer -- I'd be delighted to be in your corner helping you navigate this rapidly moving, competitive market. Let's chat about what you're hoping to buy, get you connected to a local lender to become pre-approved, and then let's try not to develop a twitch as we keep checking for new listings again, again, again and again. That's all for today, folks. I hope the balance of your month of April goes well and that you aren't struggling too much with the seasonal allergies that seem to affect so many of us at this time of year. I think the beauty of the blooming flowers and trees generally outweigh the not-so-exciting allergy symptoms that I'm currently working through. Be in touch anytime if I can be of help to you -- with real estate or otherwise. You can reach me most easily at 540-578-0102 (call/text) or by email here. P.S. If you want even more charts and graphs than I have included above, you'll find them here. | |
Fewer Home Sellers, Thus Fewer Home Buyers, But Ever Higher Sales Prices In Early 2023 |
|
 Happy Tuesday morning, friends! Indeed, February flew by quickly -- such a short month ;-) -- and now we're headed into what is typically a very busy spring in our local real estate market. Read on for an overview of everything happening right now in our local market... but first... a local highlight and an opportunity for you to be a winner! :-) Each month I offer a giveaway, of sorts, for readers of this market report, highlighting some of my favorite places, things or events in Harrisonburg. Recent highlights have included A Bowl of Good, a Steel Wheels concert, and Grilled Cheese Mania. This month... I'm giving away a $50 gift card to another of my favorite local restaurants, Taste of India. My go to order is the Chicken Tikka Masala, but you will find an extensive menu of unique and flavorful dishes at Taste of India, located on University Blvd. Click here to enter for a chance to win the $50 gift card! And now, let's move on along to the most recent data on our local real estate market... 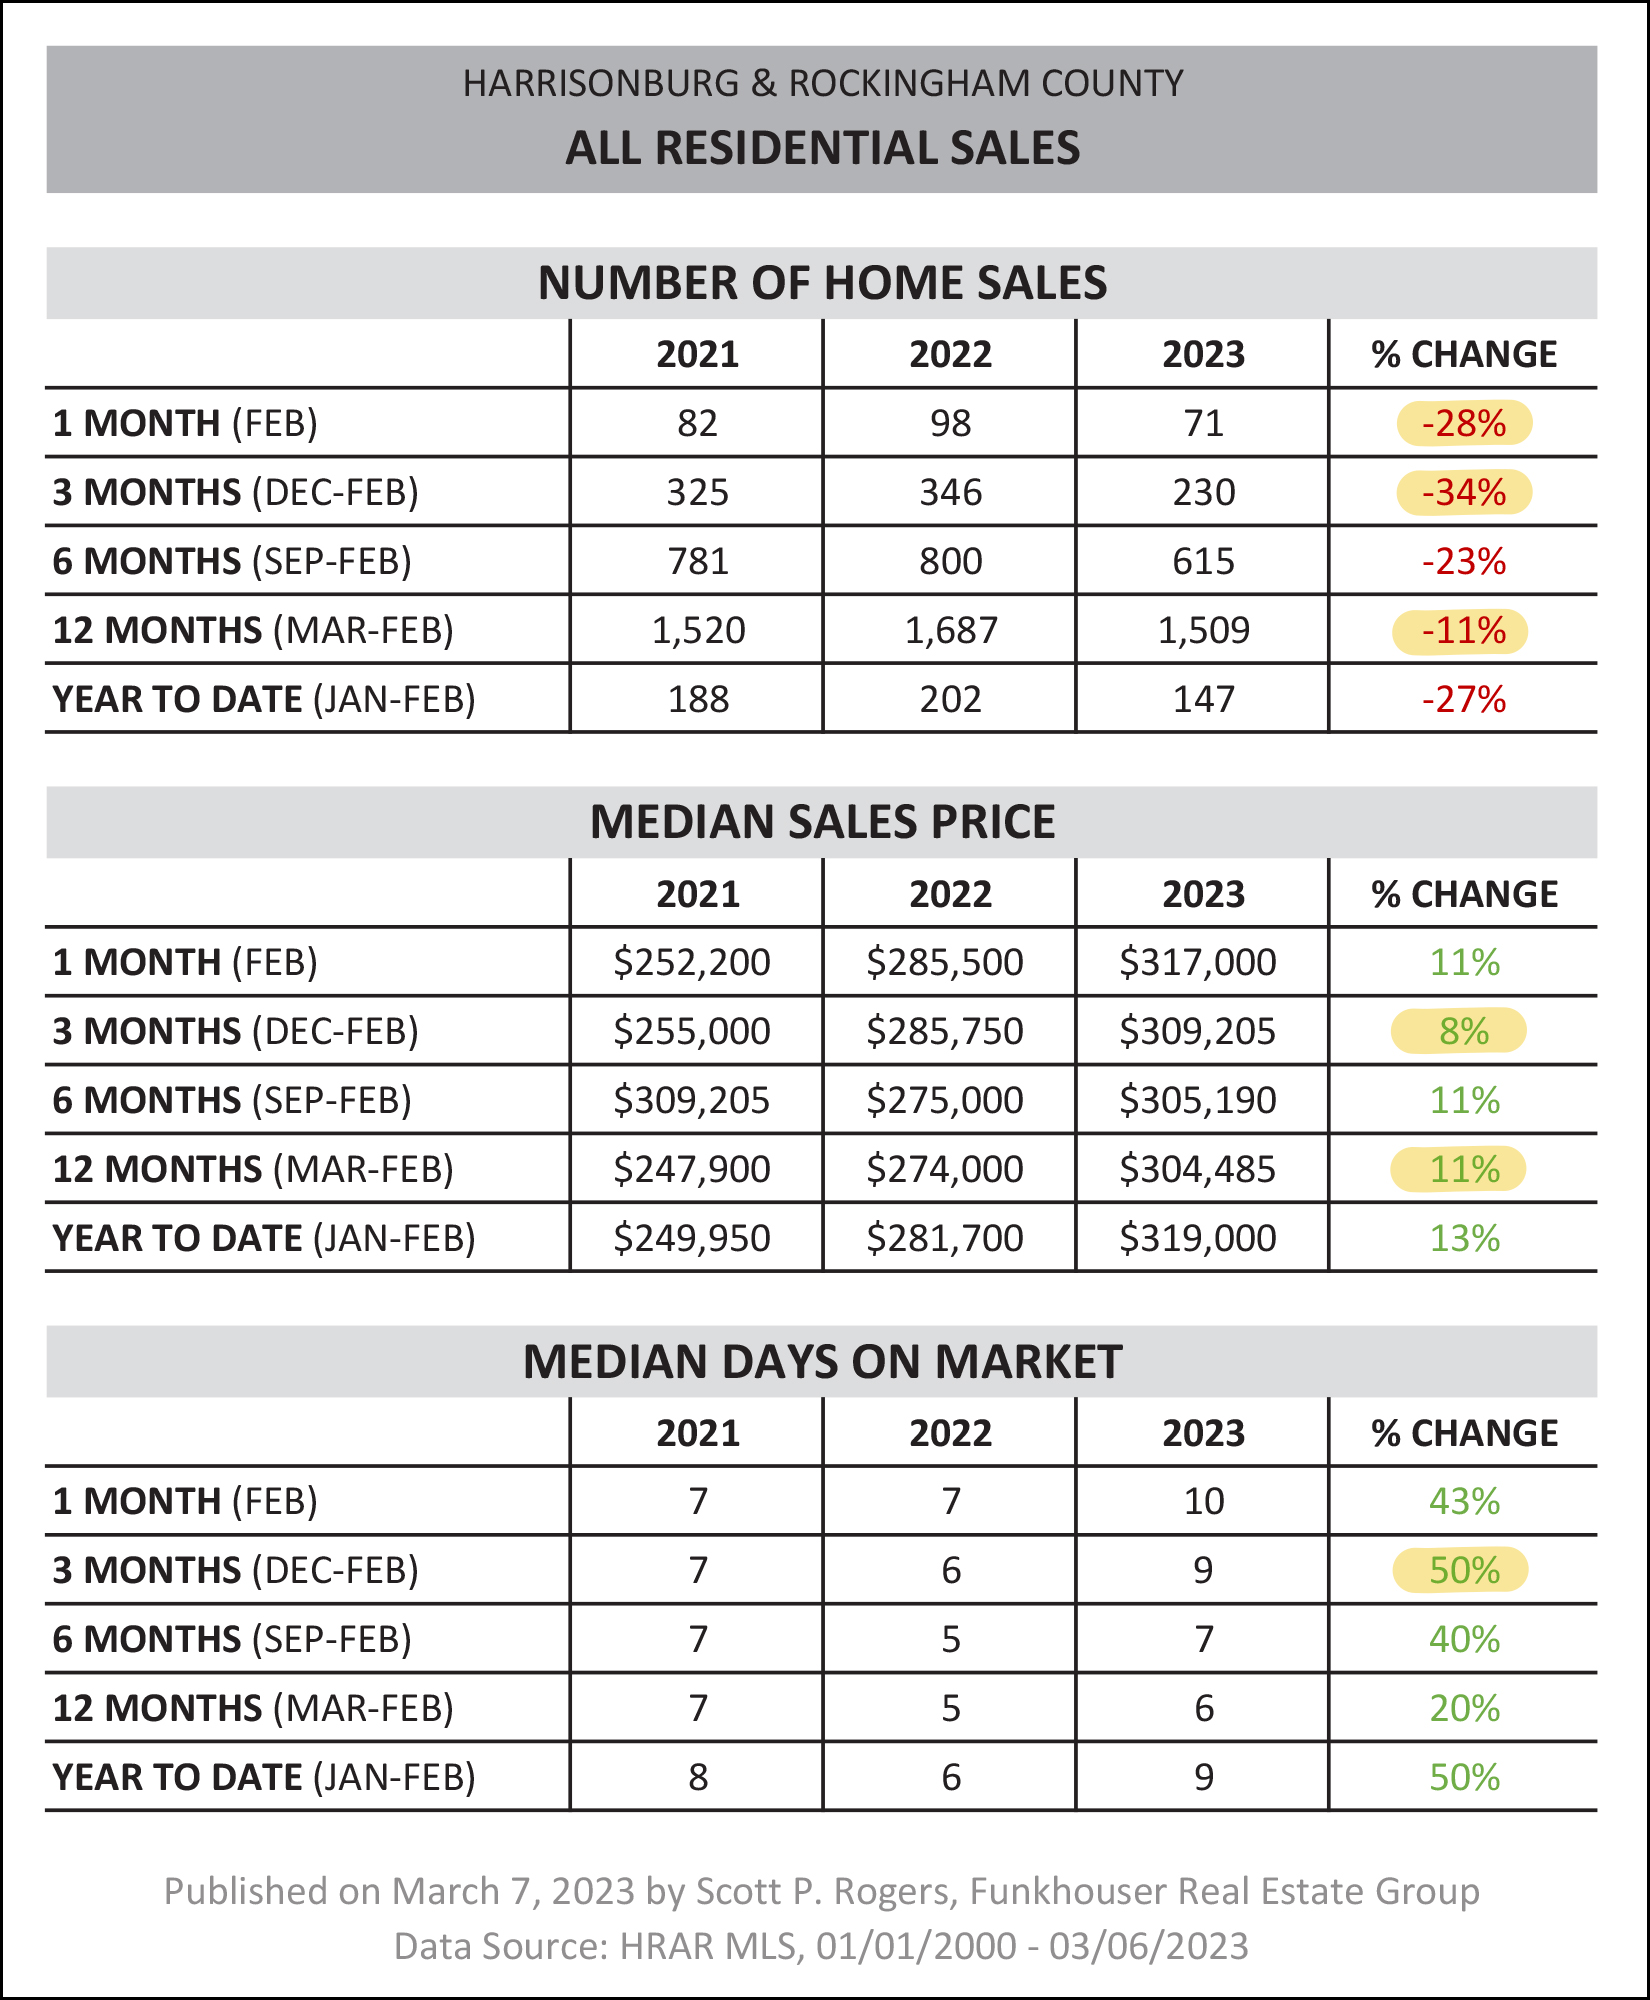 As per my headline, there are definitely fewer buyers buying homes right now, but I am fairly confident that it is a result of fewer sellers selling homes right now - as inventory levels are not rising. As shown above... [1] There were 28% fewer home sales this February (71) compared to last February (98) in Harrisonburg and Rockingham County. [2] Looking at the past three months (Dec, Jan, Feb) there was an even larger drop off in home sales... with a 34% decline from last year (346 home sales) to this year (230 home sales). [3] If we look back at an entire year of sales we will only find an 11% decline in home sales (from 1,687 sales to 1,509 sales) indicating that the majority of the slow down is in the more recent months. [4] Despite these decreases in the number of homes that are selling... home prices keep rising! The median sales price during the past three months (when the number of sales was 34% lower than last year) was $309,205... which is 8% higher than the median sales price one year ago of $285,750. [5] Looking back at the entire year again, the median sales price over the past 12 months was $304,485 which is 11% higher than in the 12 months before that when it was $274,000. [6] The number of days it takes for a home to go under contract is -- maybe, possibly -- on the rise. This (most recent) December through February homes went under contract with a median "days on market" of nine days... which is (50%) higher than the median of six days a year ago during those same three months. So, fewer homes are selling, slightly slower, but at ever higher prices!?! Now, let's look at the number of home sales January and February compared to past norms for these months... 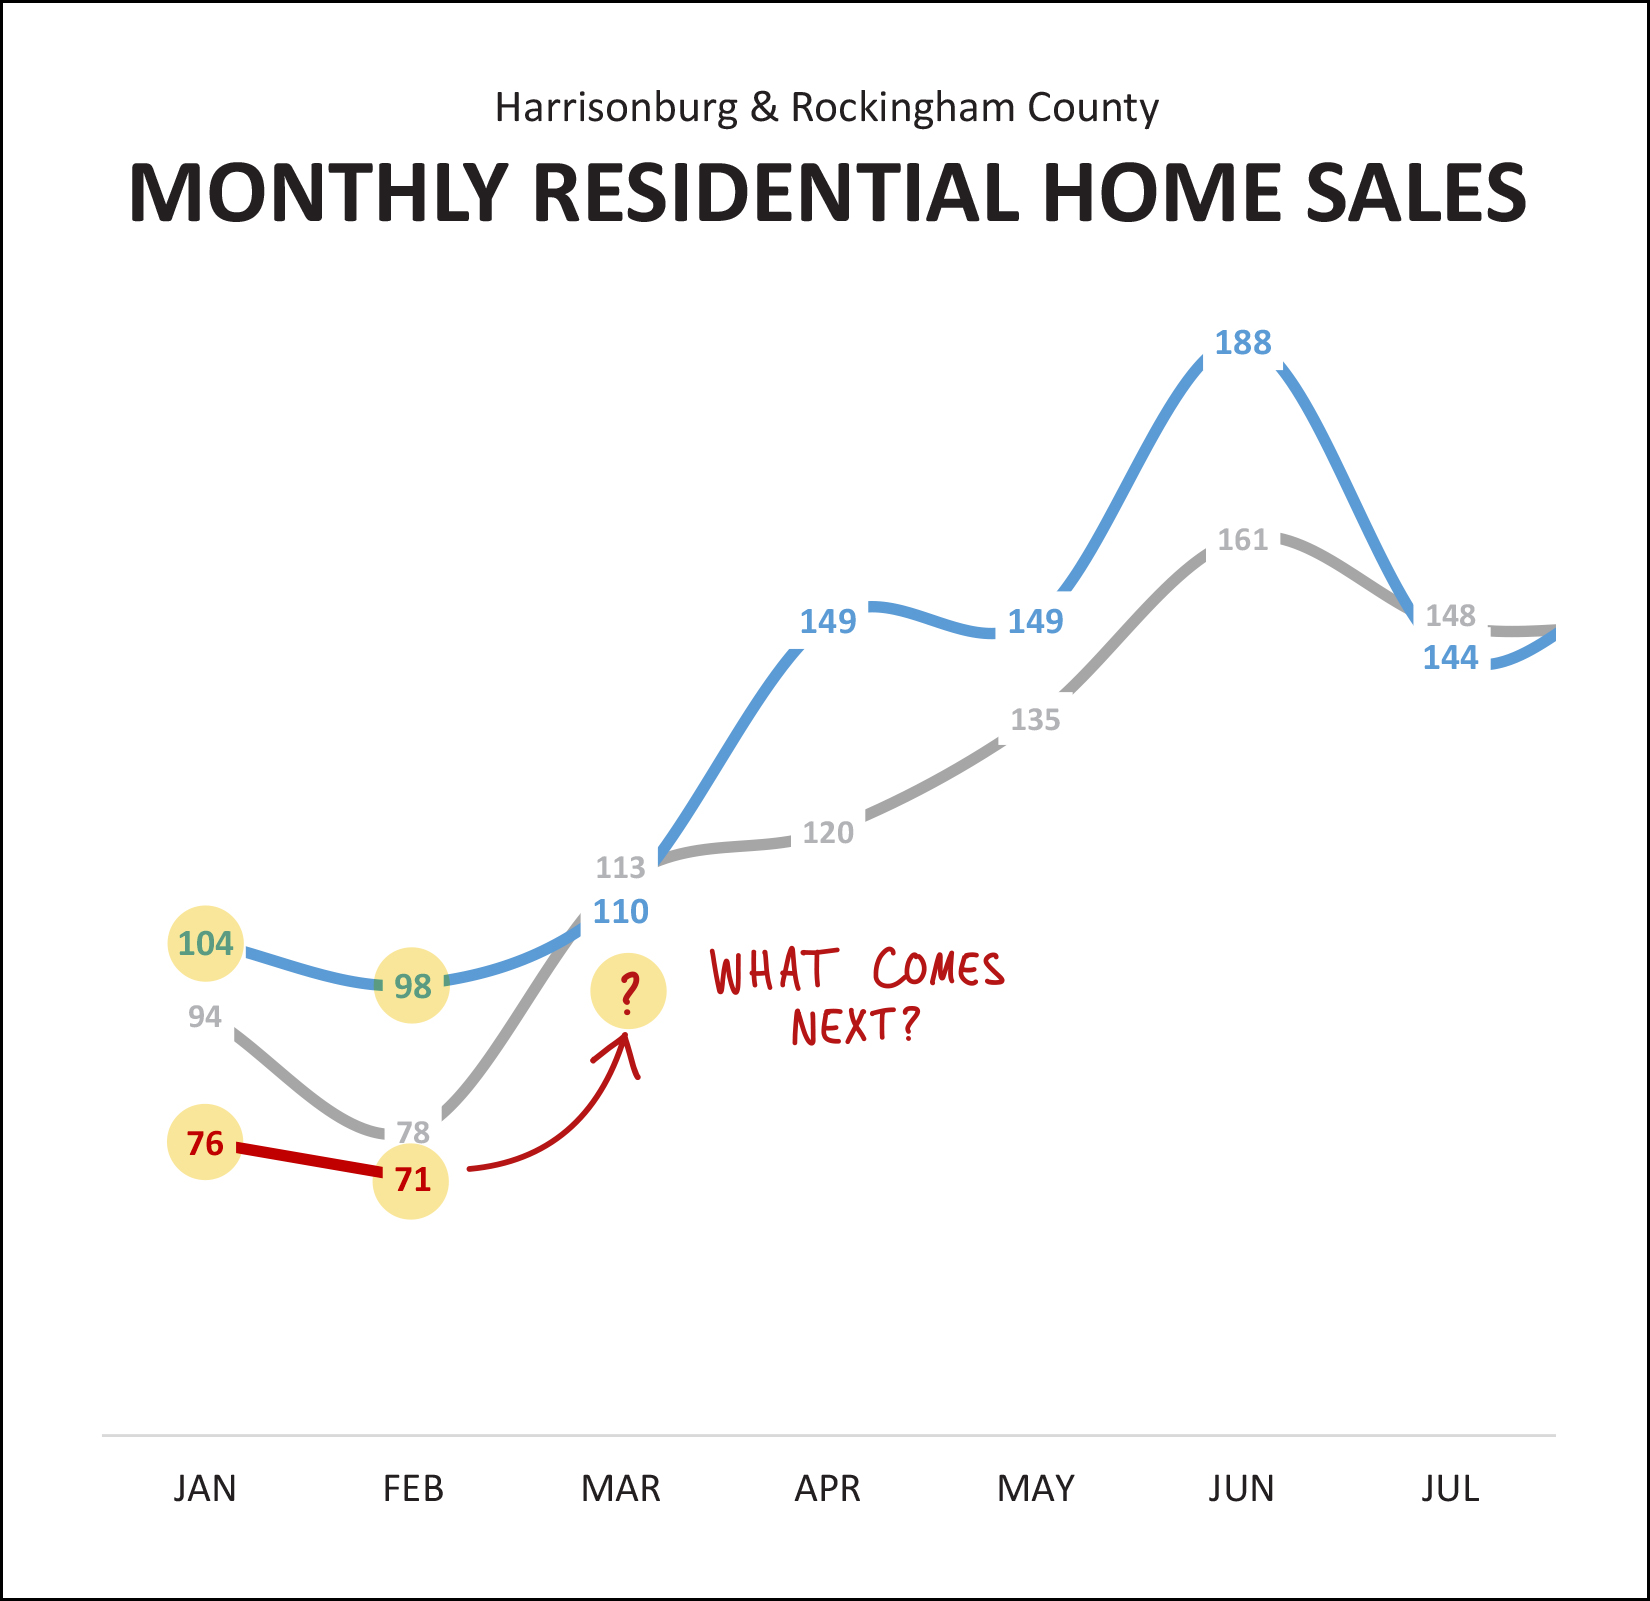 The red line above is the current year -- 2023 -- and you can see that the number of home sales in January and February is quite a bit lower than... [1] The number of home sales last January and February -- shown in blue. [2] The average number of home sales in each month over the past four years -- shown in grey. So, there have been fewer home sales this January and February than in other recent years. Thus, what comes next? I expect we will continue to see lower number of home sales per month as we move through March, April and May 2023 as compared to last year and as compared to the average of the past four years. Let's put the declining number of home sales in a bit of a historical context... 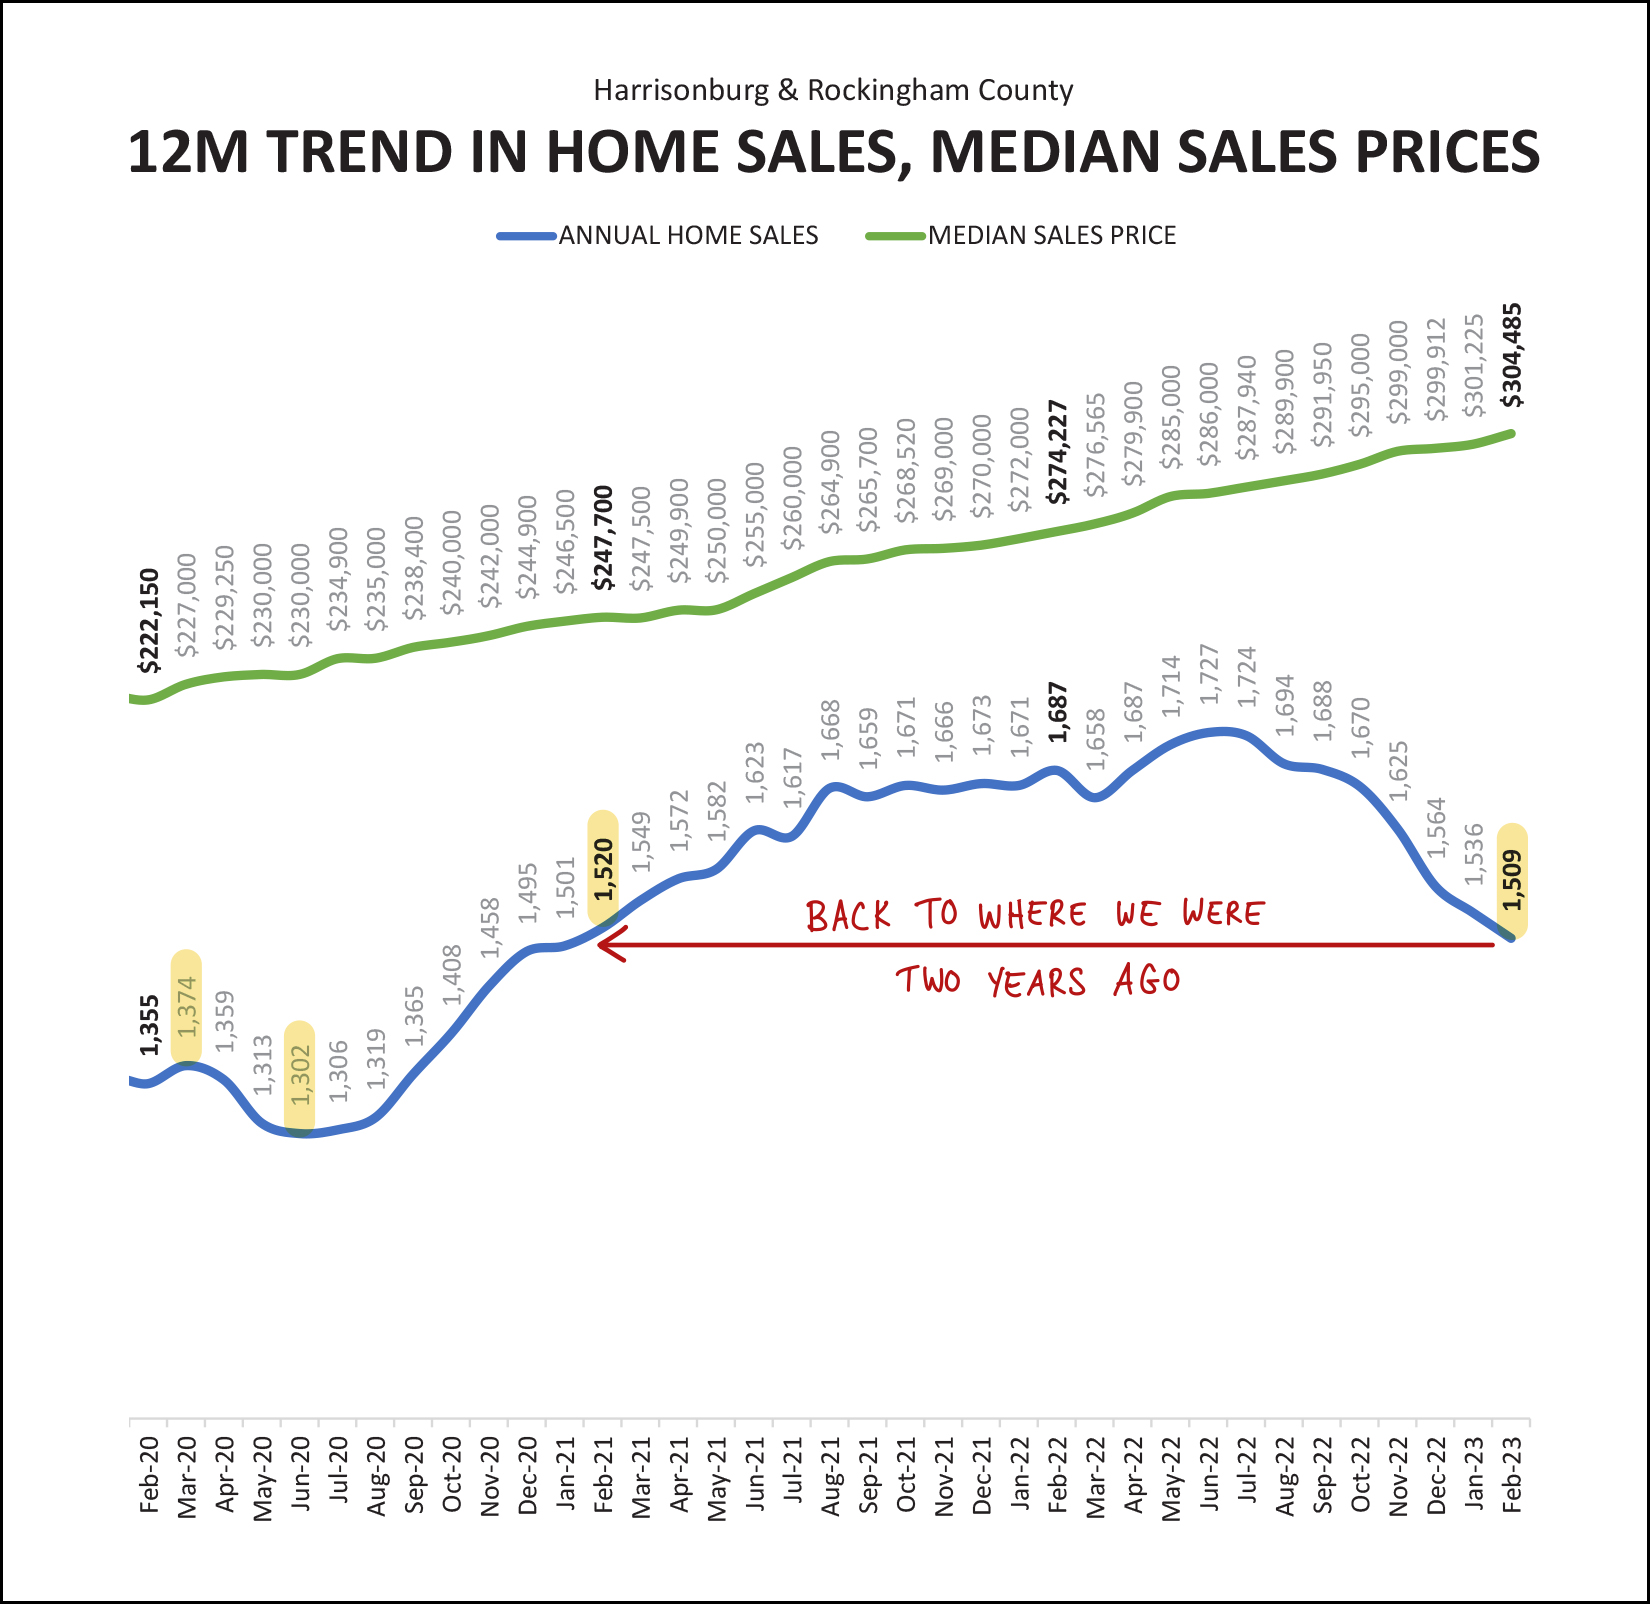 The annual pace of home sales peaked at 1,374 home sales back in March 2020 after declines in monthly home sales in early 2020 due to the start of the COVID-19 pandemic. The annual pace of home sales slowed for a few months... but bottomed out at 1,302 home sales per year just three months later. Then, the annual pace of home sales started climbing, and climbing, and climbing. Two years ago, homes were selling at an annual pace of 1,520 home sales per year in Harrisonburg and Rockingham County. Then, annual home sales accelerated all the way up to 1,727 home sales per year in in June 2022 -- before they started declining again. Now, as we close out February 2023, the annual pace of home sales (1,509) has returned to the same approximate place that we were in two years ago. I expect that this annual pace of home sales will continue to decline over the next six months. But, yes, sales prices keep on rising, as shown with a green line above. The annualized median sales price seems intent on continuing to rise, month after month. It has now risen from $222,150 to $304,485 in just three years! But, perhaps the increase in the median sales price is... slowing? 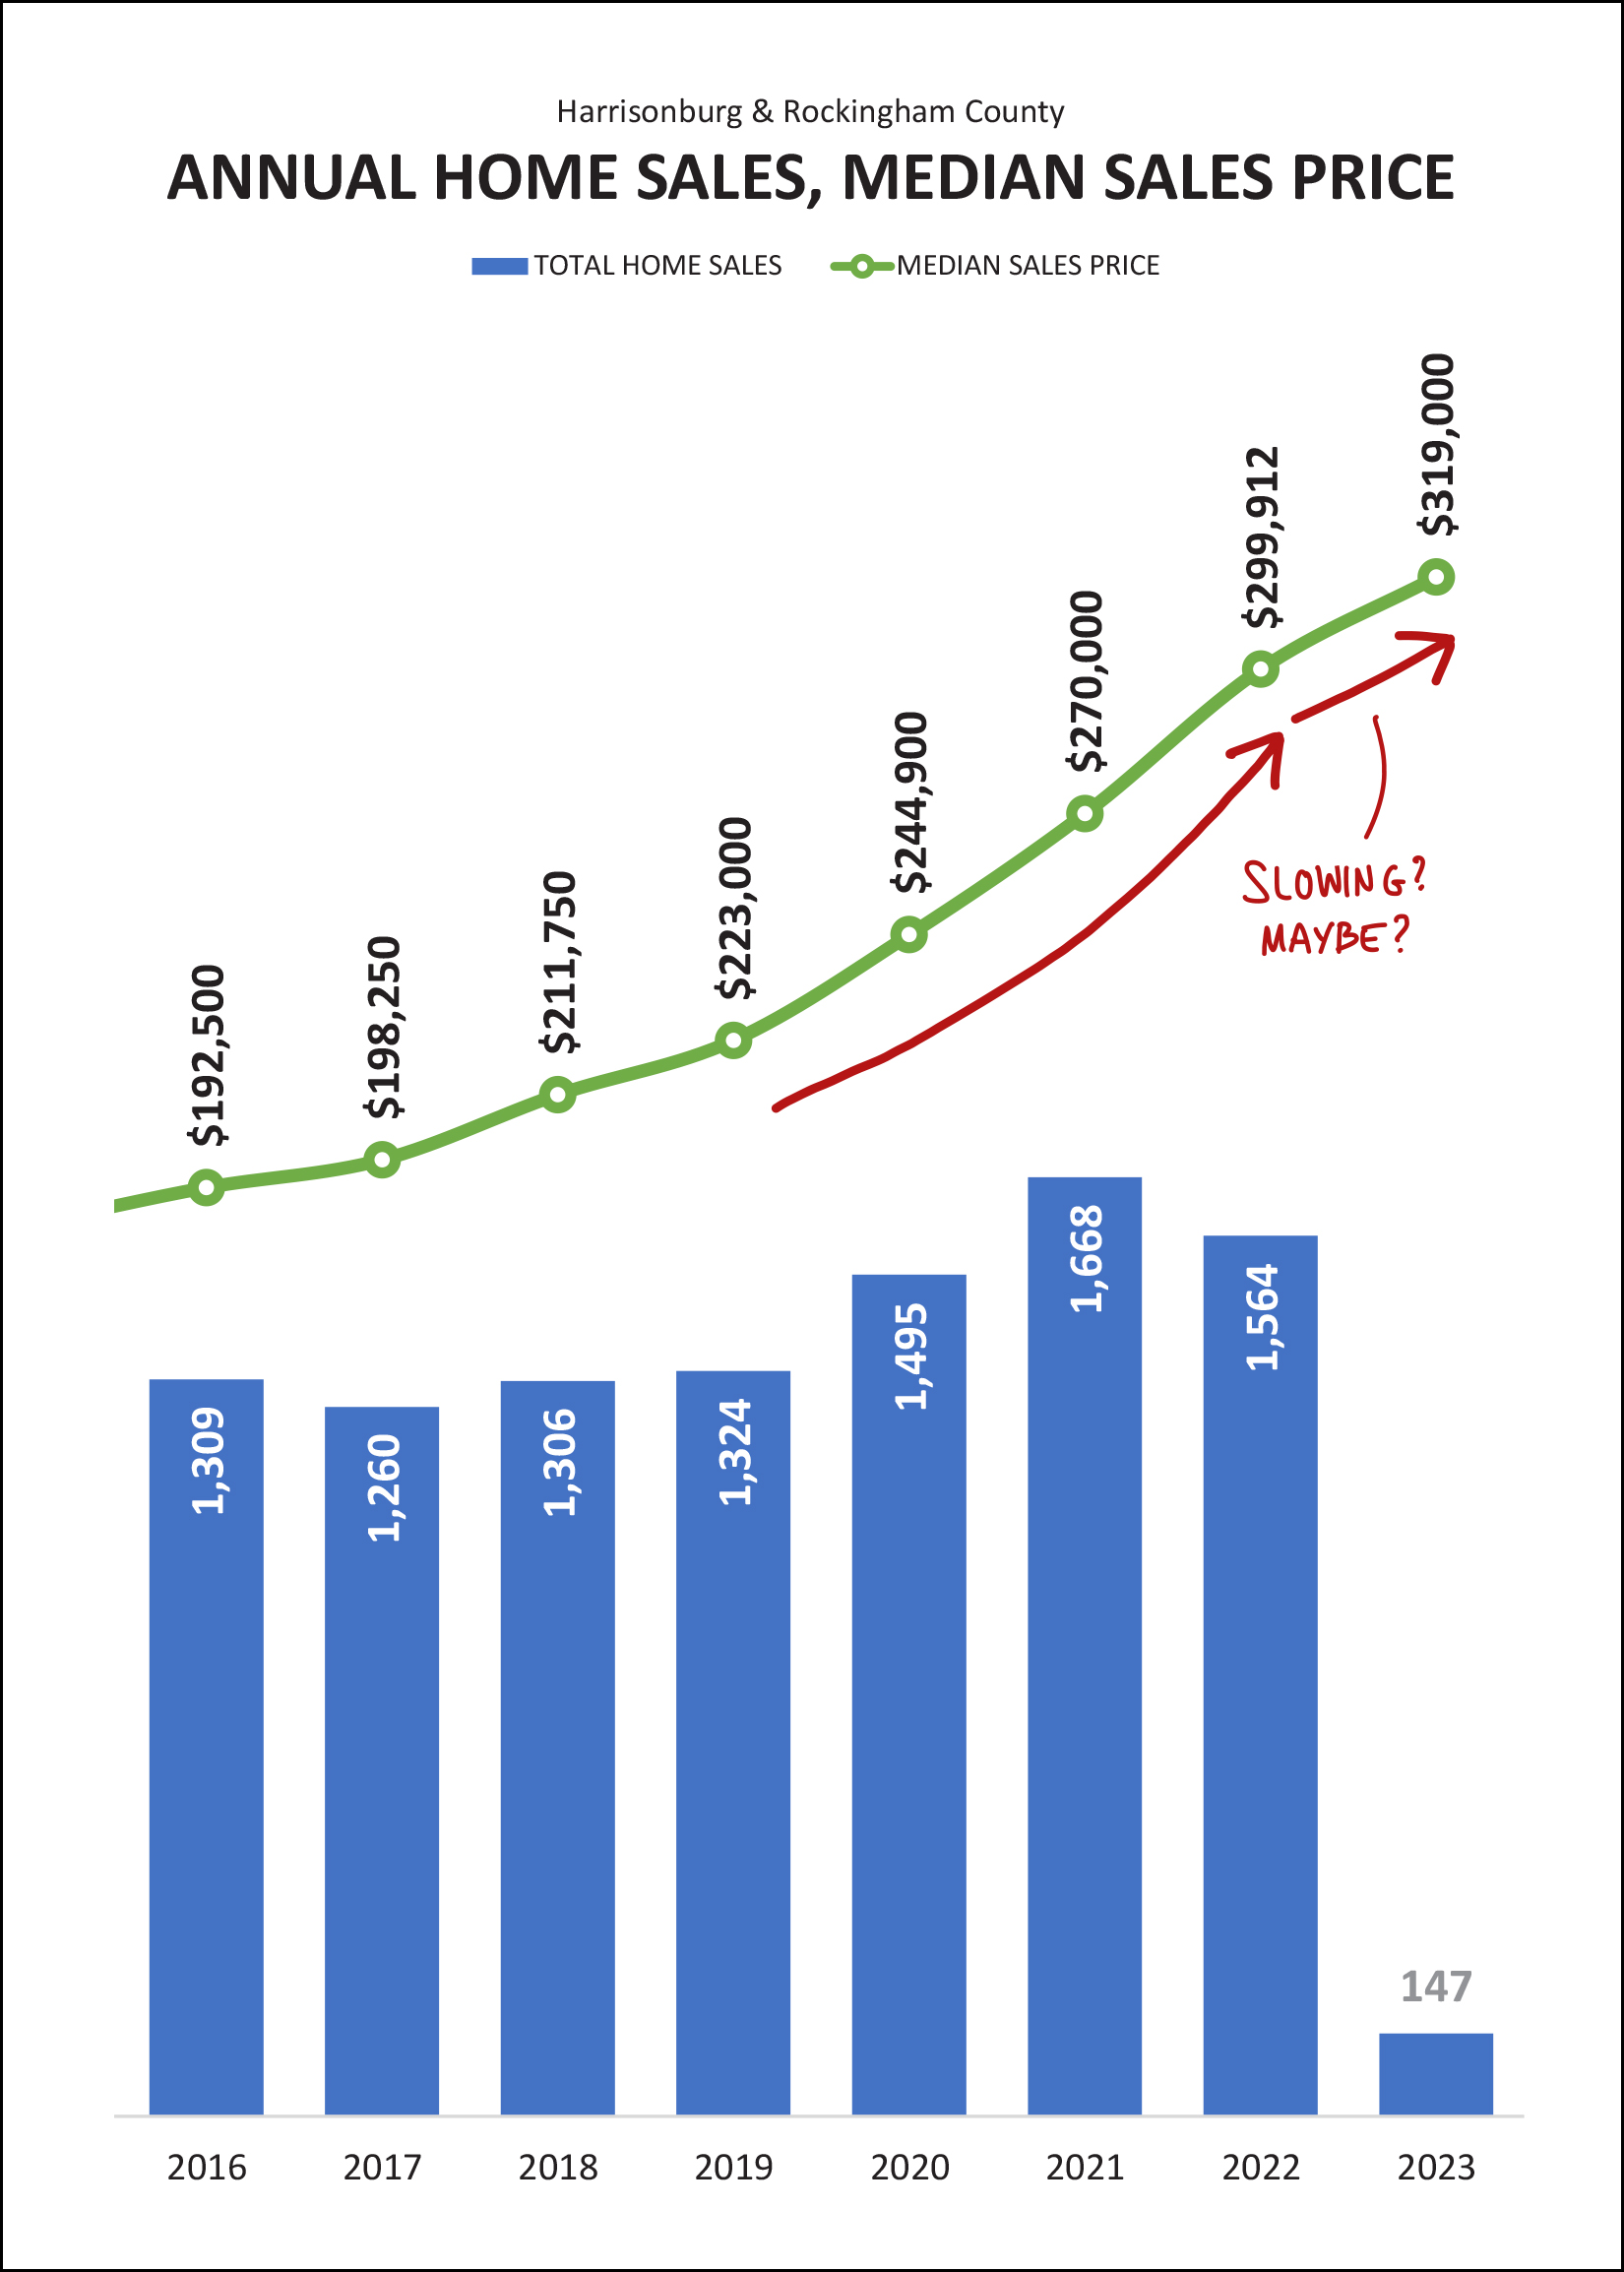 If you stare intently at the green line above, you'll see the slope changing a bit, which perhaps is an indicator that the rate of price increases is slowing. Maybe. 2020 increase in median sales price = 9.8% 2021 increase in median sales price = 10.2% 2022 increase in median sales price = 11.1% 2023 increase in median sales price = 6% Don't read this too quickly... home prices are not declining... but the pace at which home prices are increasing... might be slowing. Or, then again, maybe not. We are only working with two months of data for 2023. Stay tuned over the next few months to see how the 2023 median sales price adjusts as we move further through the year. Now, to predict where home sales might go next, let's look at contract activity... 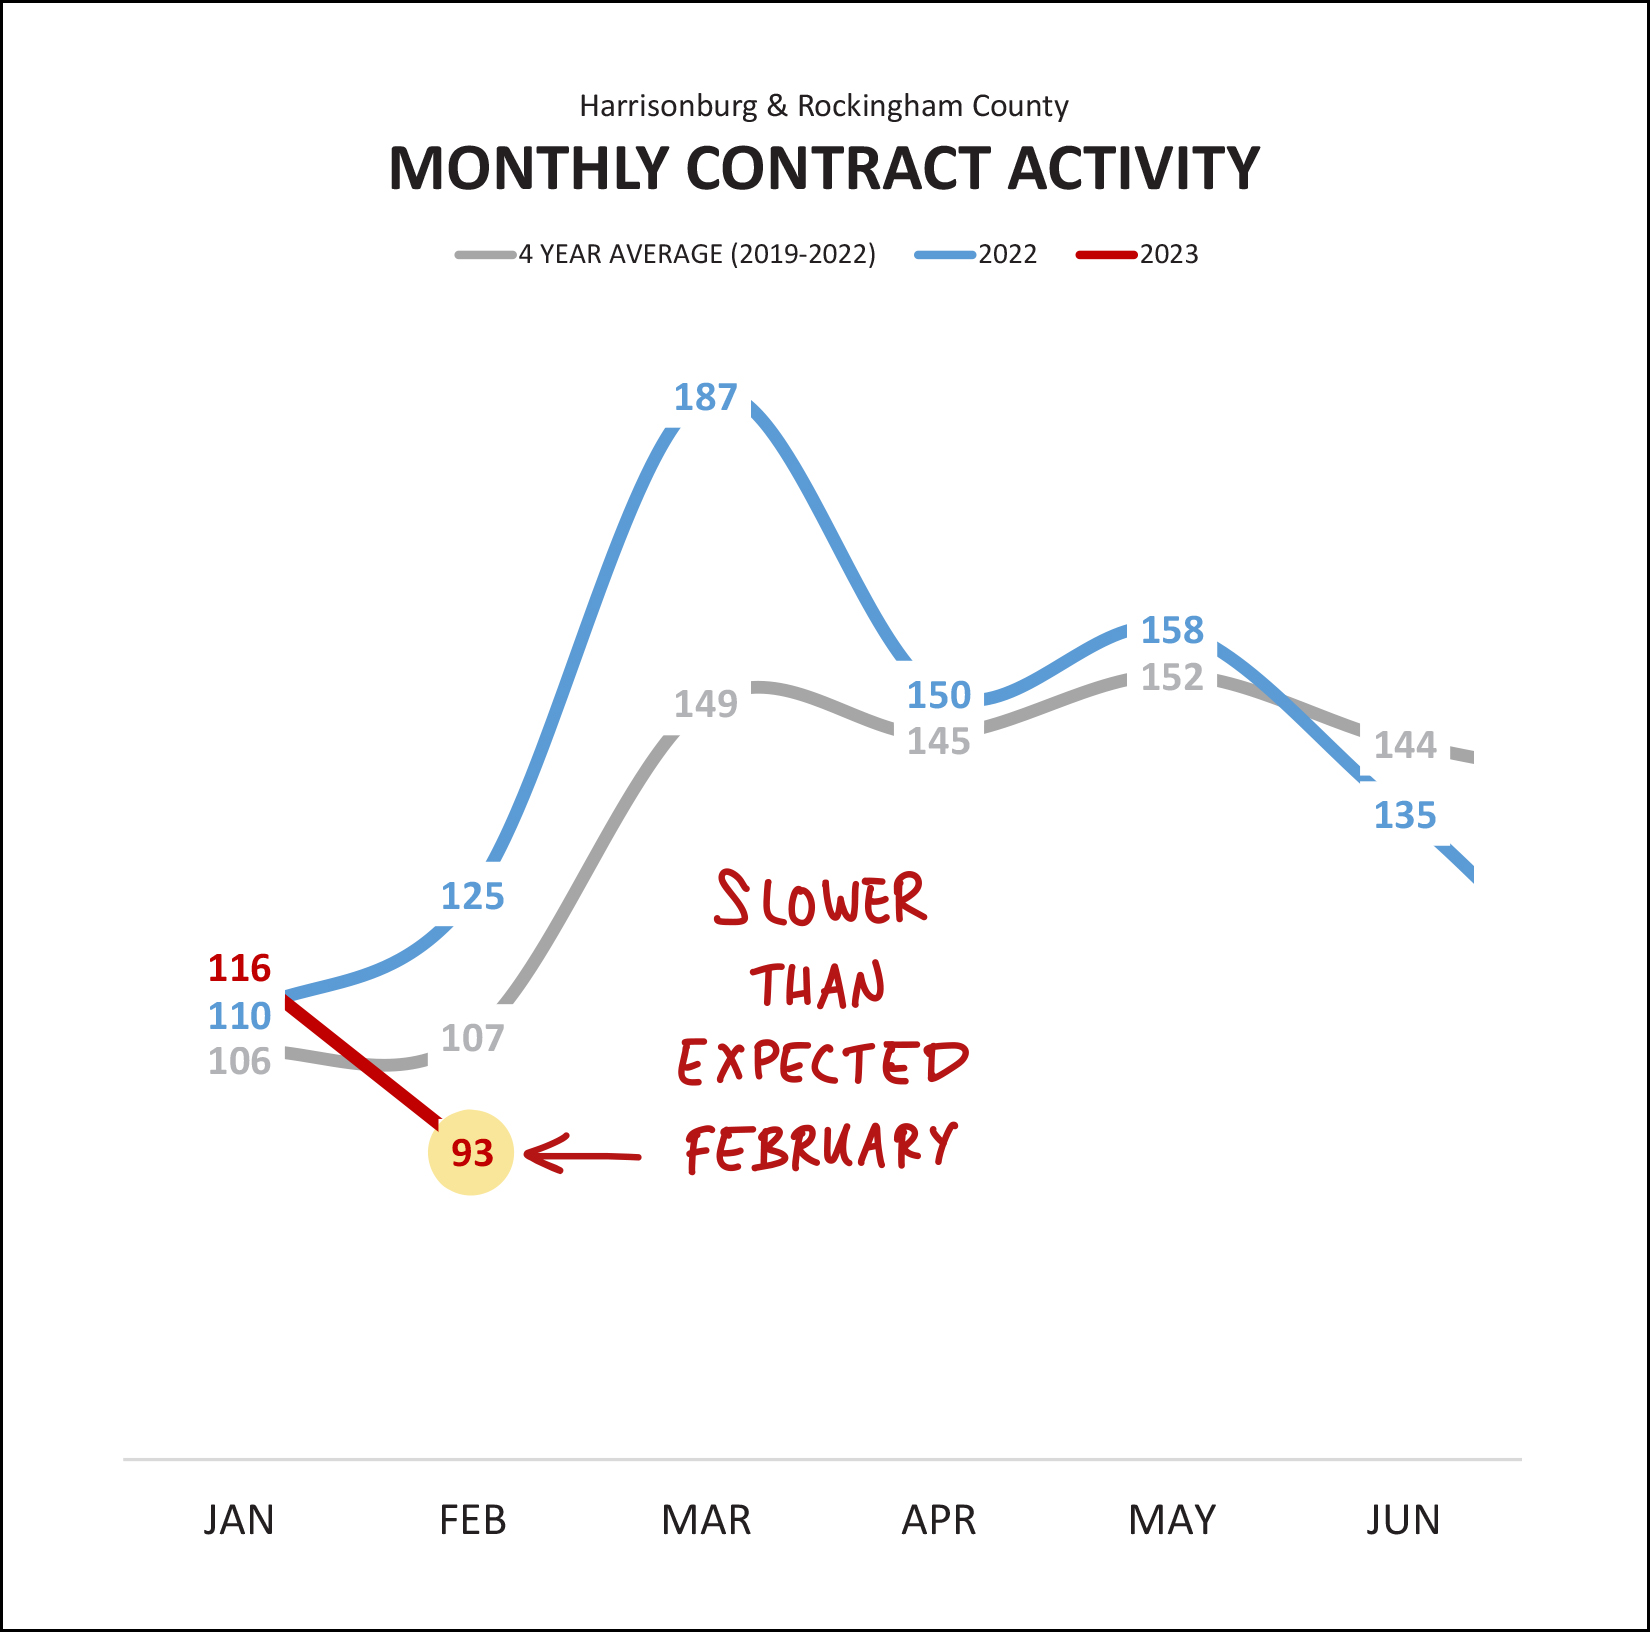 After a decent month of contract activity in January (116 this year compared to 110 last year) we saw a marked decline in contract activity in February. The 93 contracts that were signed in February 2023 was significantly lower than the 125 contracts signed last February, and also well below the four year average of 107 contracts in a typical February. Thus, it is unlikely that we'll start to see an increase in home sales in March, given the decline in contracts signed in February. Furthermore, the number of pending sales (homes under contract) also declined in February... 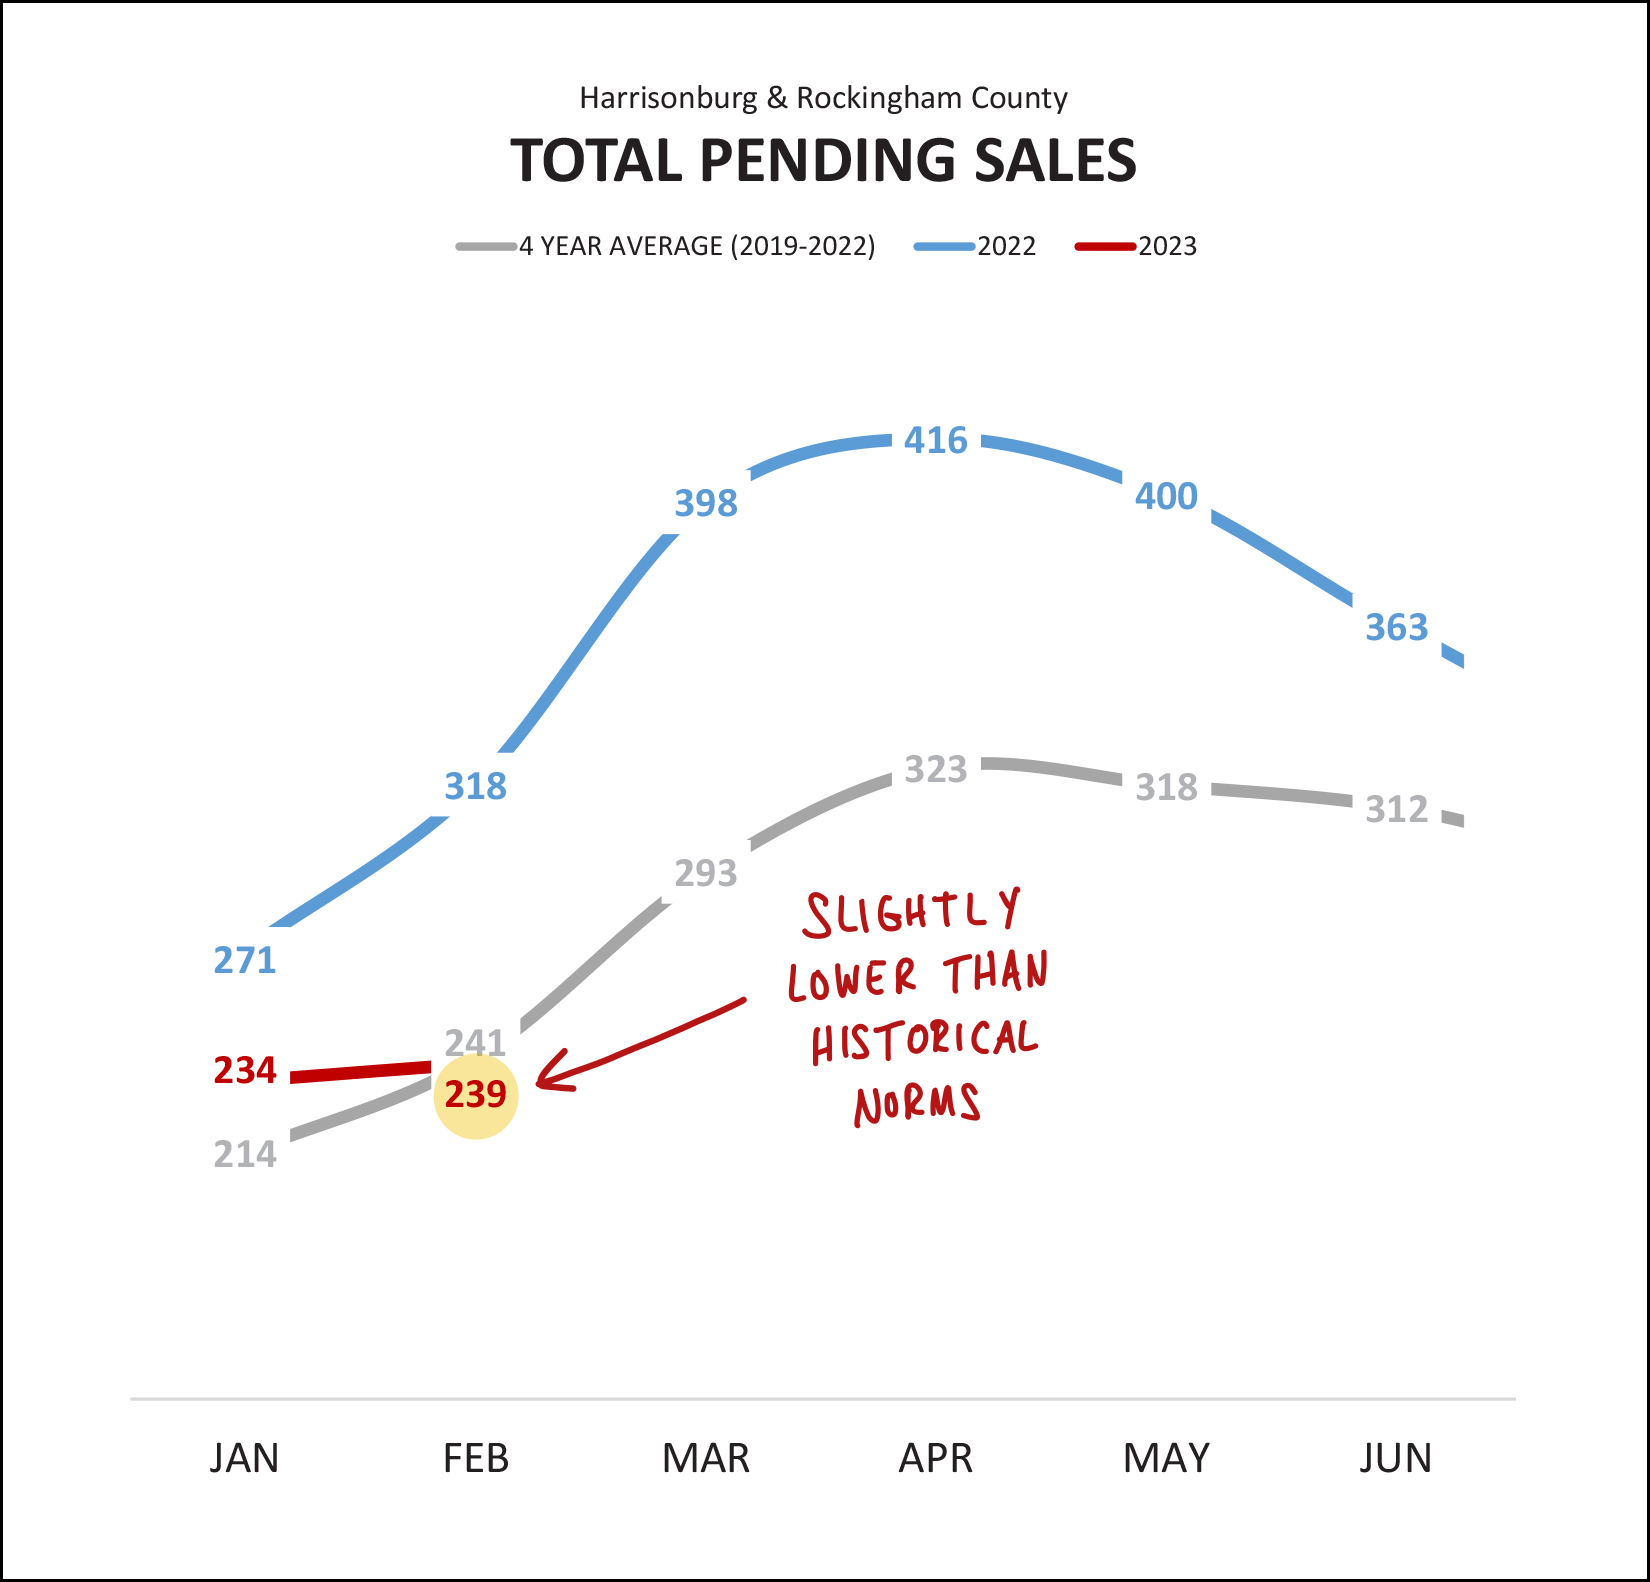 There are currently 239 homes under contract (pending) in Harrisonburg and Rockingham County which is quite a bit lower than a year ago (blue line) when there were 318 homes under contract... and is also lower than the four year average of 241 homes typically being under contract at this time of year. All of these different metrics are all showing the ways in which our market is cooling off -- as it pertains to the *number* of homes that are selling -- not as it relates to the value of homes in our area. Circling back to my headline this month... I think the cause of fewer home sales is mainly due to fewer sellers selling, which is resulting in fewer buyers buying, because... 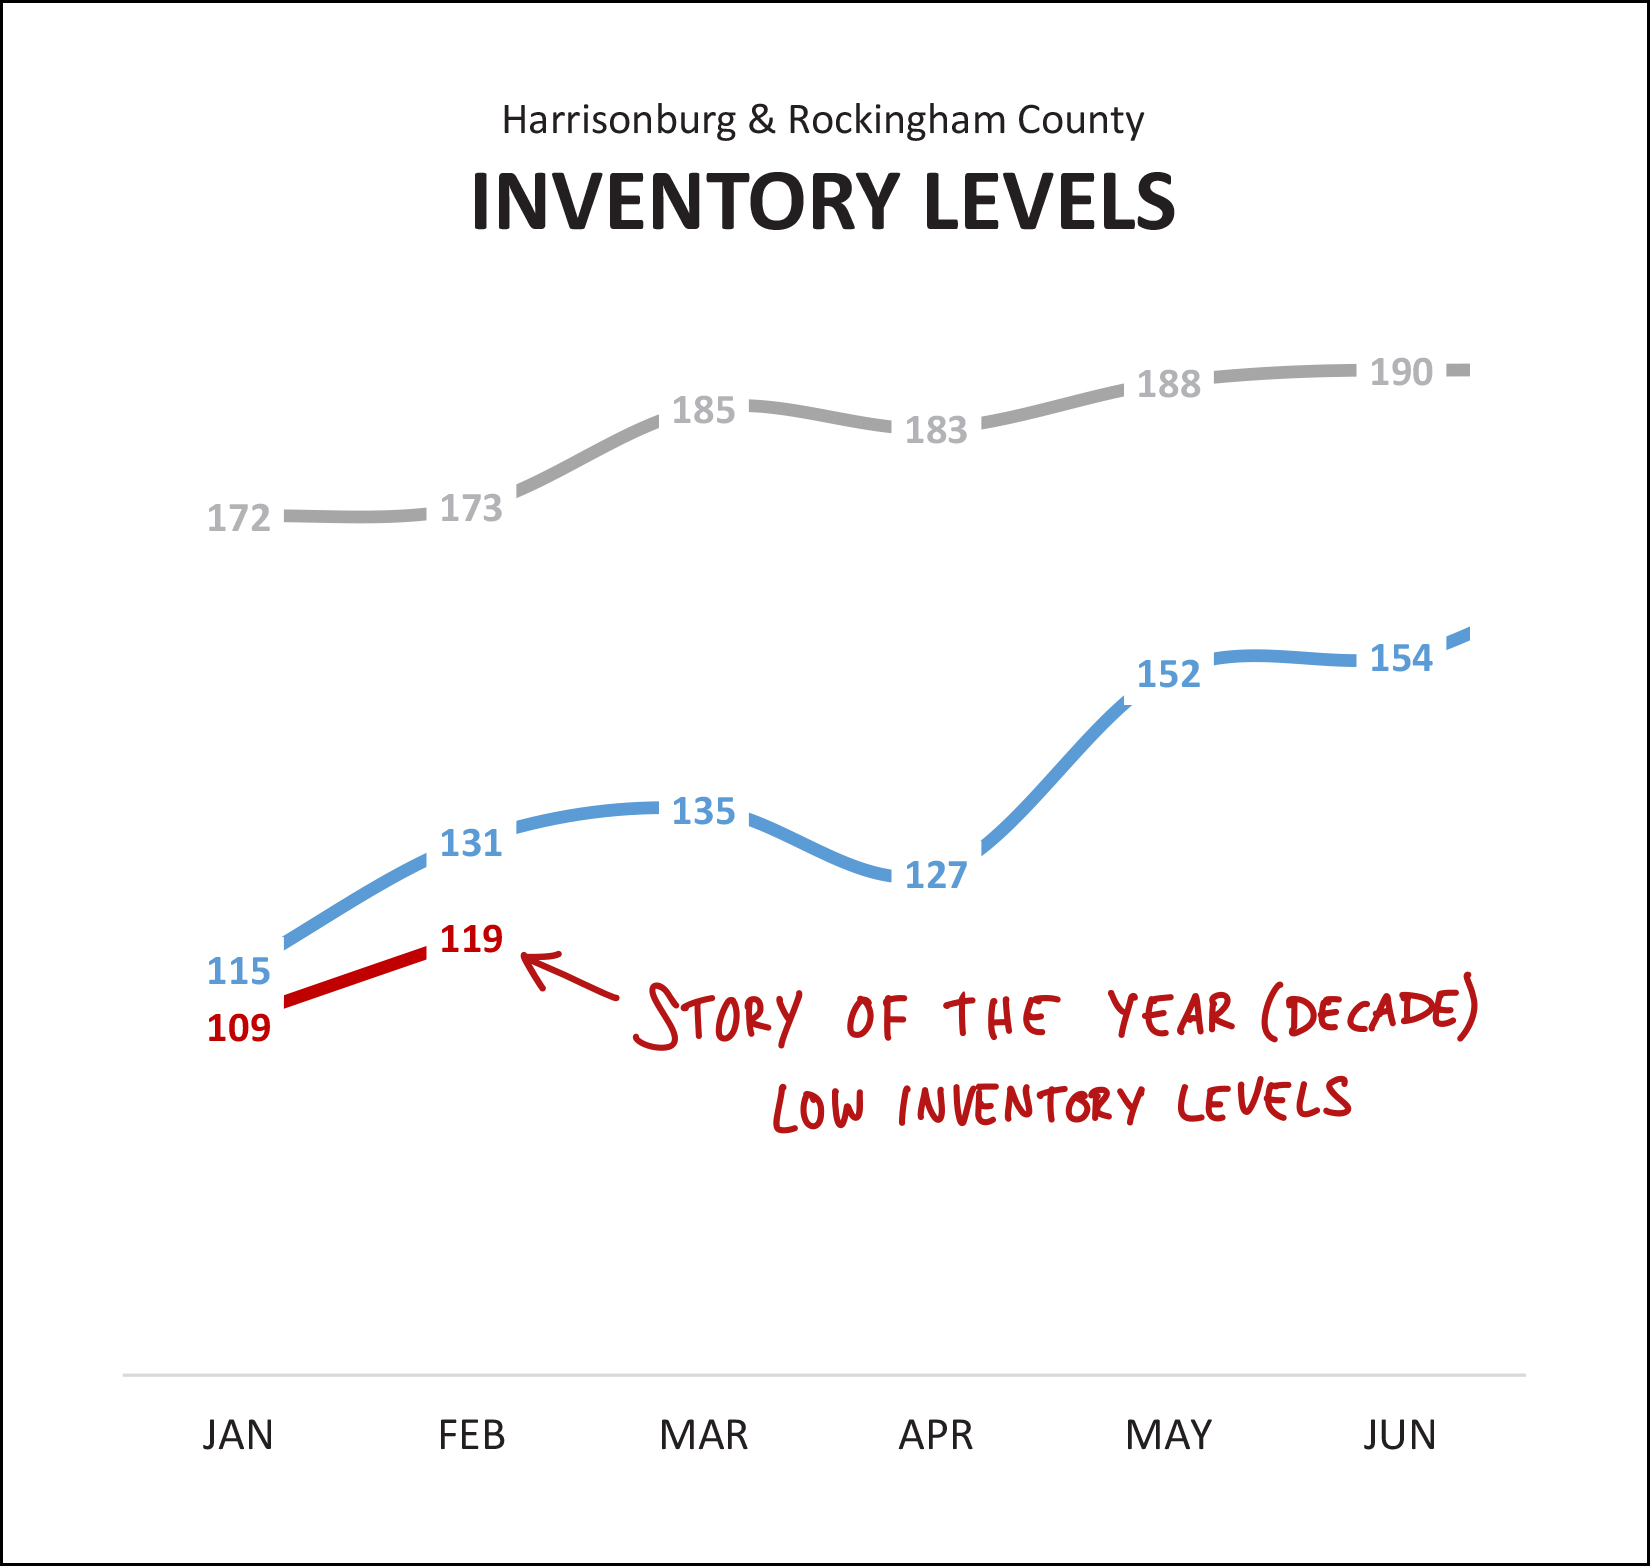 Inventory levels are lower than ever. There are currently 119 homes for sale (not under contract) in Harrisonburg and Rockingham County which is even lower than the inventory levels a year ago at this time of the year (131 for sale) and significantly lower than the four year average of 173 homes for sale at this time of year. If fewer buyers were buying... and just as many sellers wanted to sell... we would start to see inventory levels increasing. Fewer home sales, combined with ever lower home sales, is a very good indicator that the decline in the number of home sales is a result of fewer sellers being willing to sell -- more so than a result of fewer buyers wanting to buy. All that said, there is one trend in our local market that runs at least a bit counter to all of the other trends... 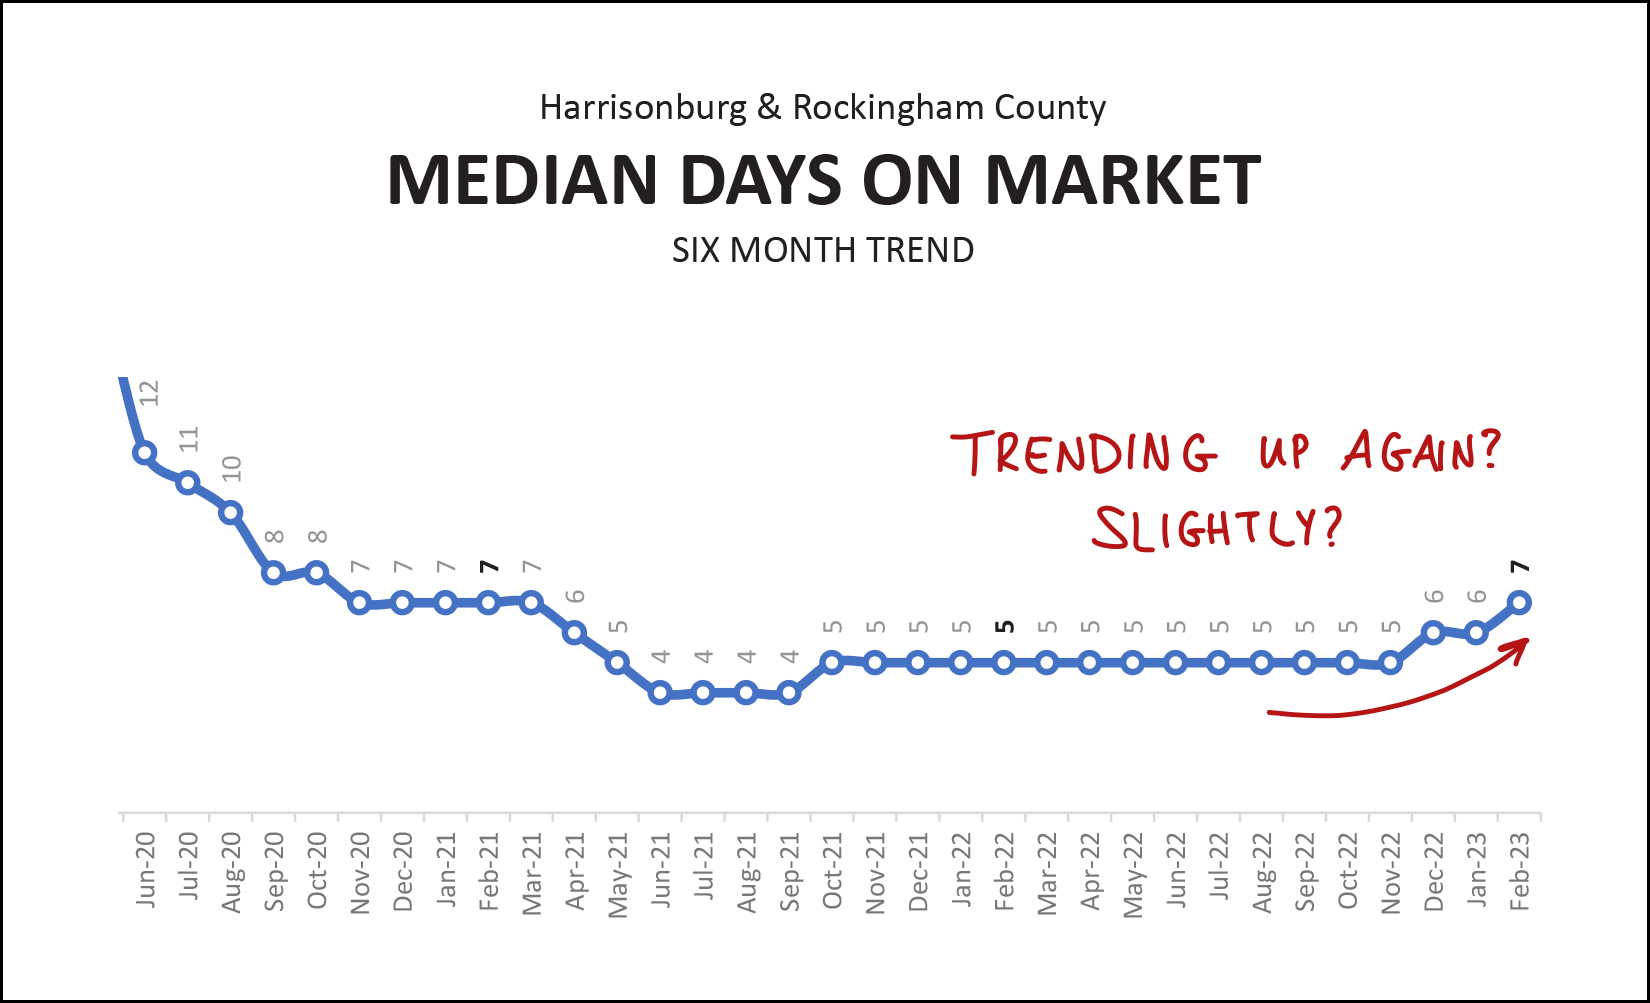 The median "days on market" figure has started to trend upwards over the past few months. For over a year, the median number of days it took for a home to go under contract was only five days. That has now drifted slightly upward to seven days. This means something... but maybe not much. Homes are going under contract *slightly* more slowly now than they were over the past few years. It is now taking them (as per the median calculation) about seven days to go under contract, instead of only five days. I'll continue to monitor this over the coming months to see if this trend continues when we get into the thick of the spring market. And one last graph... that looks like it had one too many cups of coffee this morning with all of its jittering all over the place... 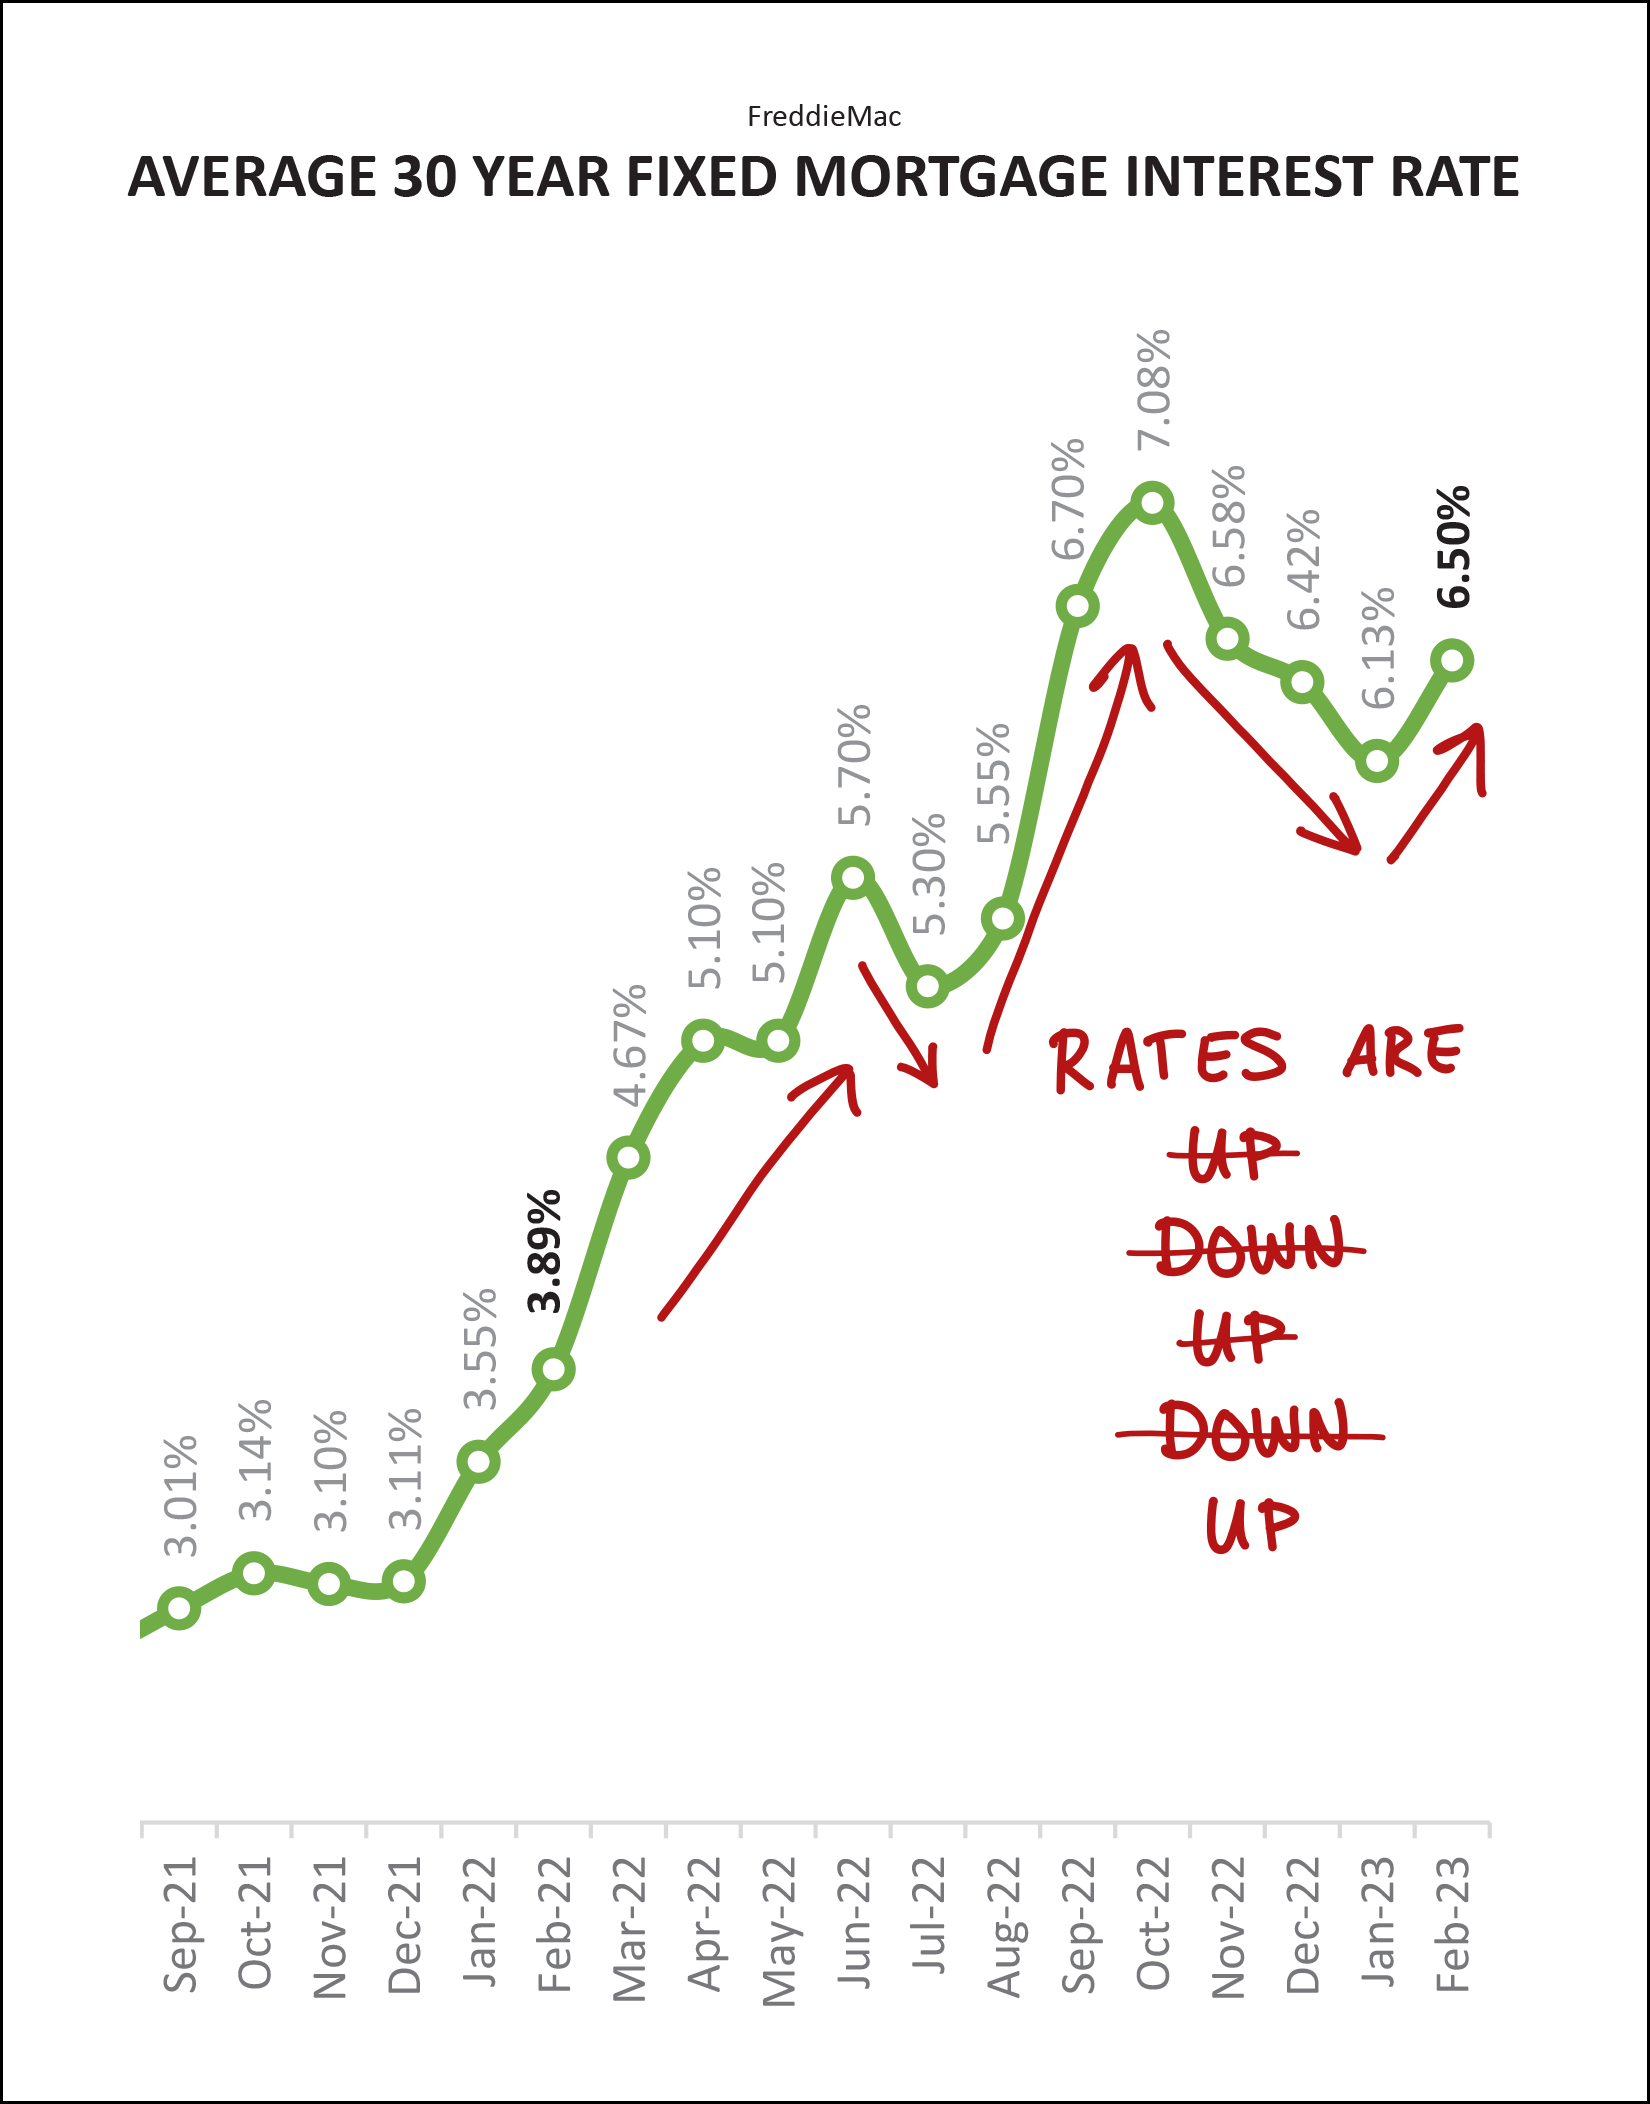 Mortgage interest rates have been all over the place over the past year. A year ago the average 30 year mortgage interest rate was 4%, and now it's 6.5%. But during the past year we have seen multiple months of increases and some decreases. It's hard to say what will happen next with mortgage interest rates. Perhaps the only reasonable prediction is that rates will go up and go down in the next six months. ;-) So... if you're looking to buy or sell a house in Harrisonburg or Rockingham County this spring, what should you conclude based on all of the data above? If you will be selling... [1] The market is still very favorable for home sellers. [2] Home prices have never been higher. [3] Half (or more) of homes that well are still going under contract in a week or less. [4] Diligent preparations, proper pricing and thorough marketing will likely still result in a speedy and favorable home sale for most sellers of most homes in most price ranges and locations. If you will be buying... [1] The market is still very competitive in most price ranges and for most property types. [2] It is still important to be pre-approved and to go see homes within the first day or two that they are on the market. [3] There will likely be fewer options for buying this year than last as fewer home sellers are seeming willing to sell. There's plenty more that we can discuss about your particular scenario if you are thinking of selling or buying, so feel free to reach out (call or text me at 540-578-0102 or email me here) if you'd like to chat or find a time to meet. If you're not quite ready to sell or buy yet, but have questions about the market or the process, I'd also be delighted to hear from you. Touch base anytime. That's all for today, folks. I hope that March treats you well and that you enjoy the suspense of not knowing whether we'll get that surprise March snowfall that we sometimes see in the Valley. ;-) Regardless of whether we get some snow or not, I hope you enjoy the changing of the seasons as we move through March. It is certainly a beautiful time in the Shenandoah Valley! P.S. If you want even more charts and graphs than I have included above, you'll find them here. | |
Home Sales Still Slowing, Home Prices Still Rising, In Harrisonburg, Rockingham County |
|
 Happy Friday morning, friends! We're about halfway through February, so it's time to take a moment to look back and see what we can learn about our local real estate market based on January's data. Thanks for joining me as I break things down so that we can all better understand the data and trends.  I hope you have had a fun start to your year. Some fun on our end included a quick extended weekend trip to the beach for Shaena, Luke, Emily and I a few weeks ago. I was reminded anew of the value of disconnecting (at least partially) from work for a bit, and spending time with loved ones. Whether it is the beach, the mountains, a long walk on an unusually warm February day, or relaxing on your back porch, I hope you find some time to disconnect from the busyness of life and spend time with those who you love in the coming days or weeks. Before I get into the market data, I also want to encourage you to check out my featured listing of the month, a newly renovated in downtown Harrisonburg pictured above and located at 142 Broad Street. Find out all about it at 142BroadStreet.com. Finally, a fun giveaway, just for you... Each month I offer a giveaway, of sorts, for readers of this market report, highlighting some of my favorite places, things or events in Harrisonburg. Recent highlights have included a Steel Wheels concert, Grilled Cheese Mania, and Walkabout Outfitter. This month... I'm giving away a $50 gift card to one of my favorite local restaurants, A Bowl of Good. If you haven't checked out A Bowl of Good yourself, make plans to do so - they have a delicious menu of comfort foods and many items with an international flair. Click here to enter for a chance to win the $50 gift card! And now, let's move on along to the most recent data on our local real estate market... 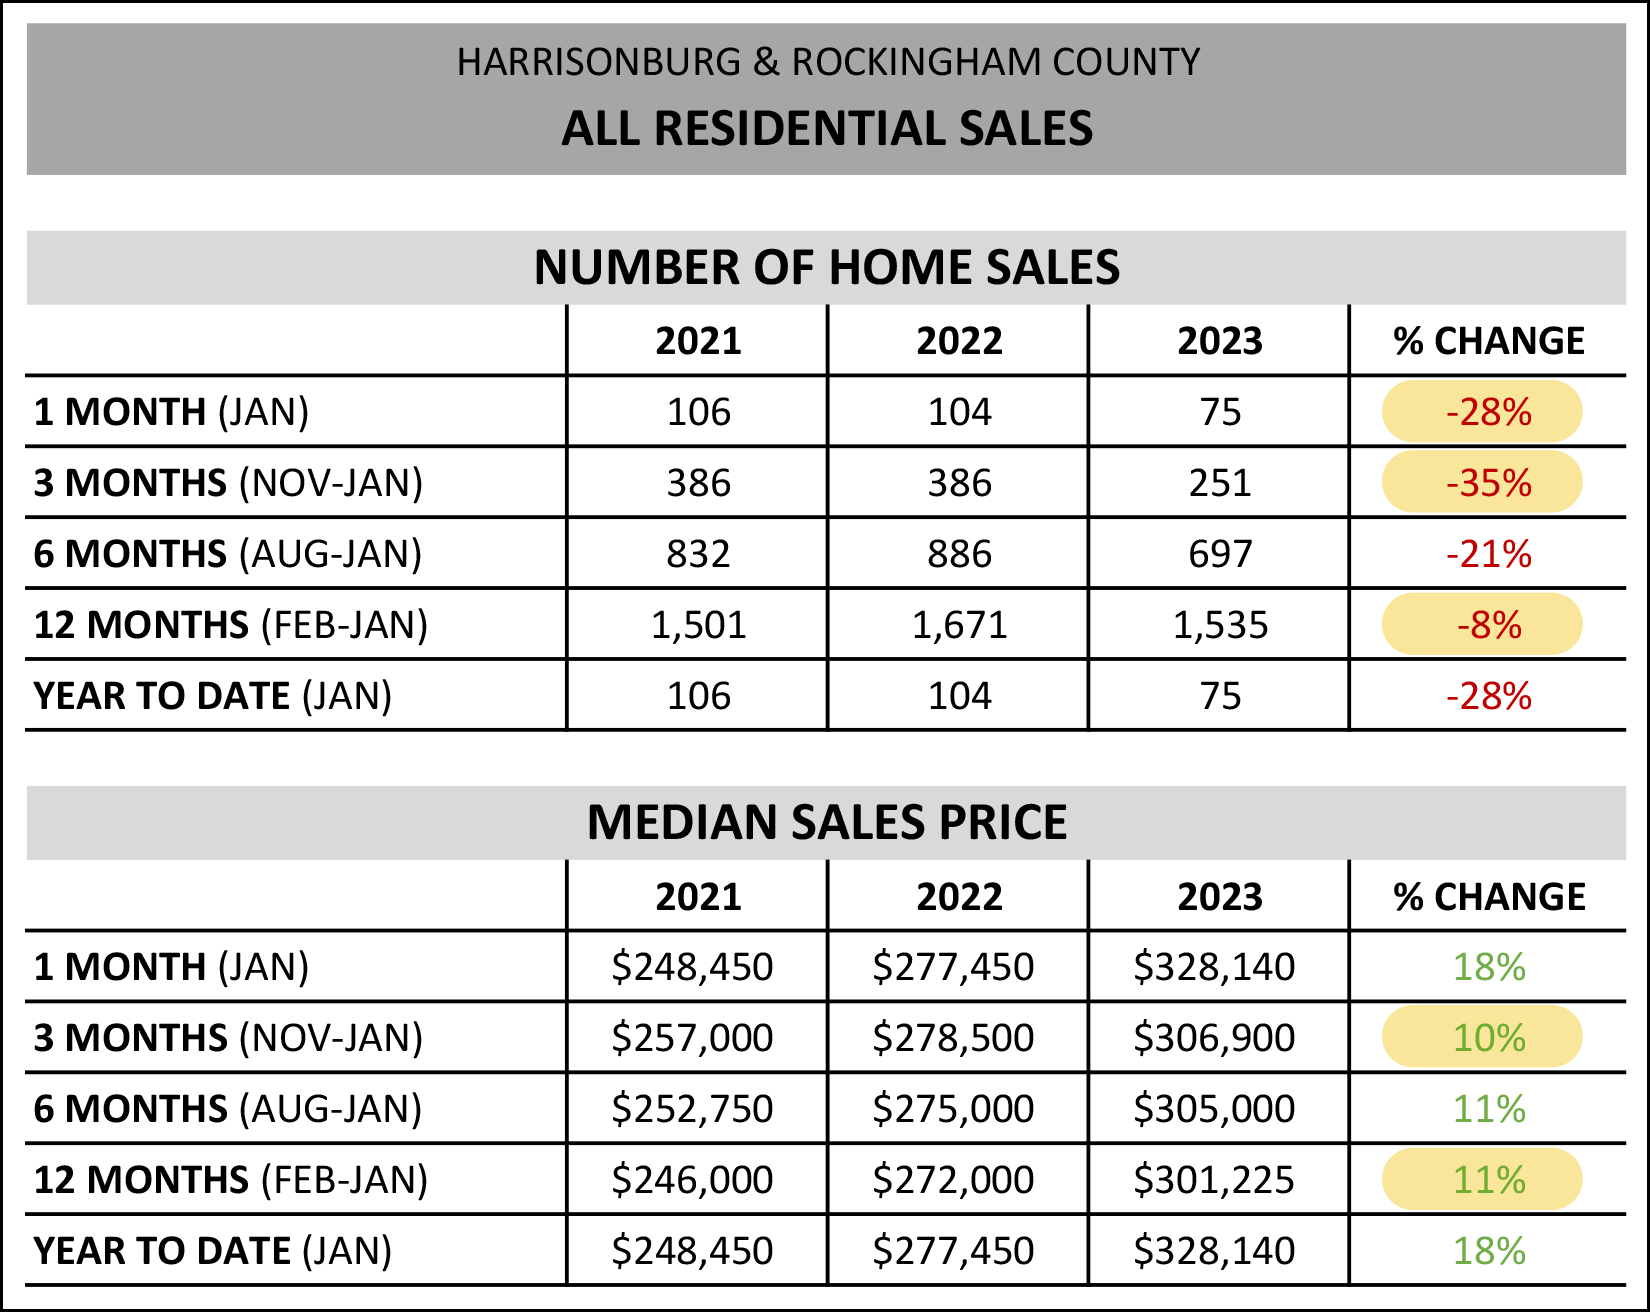 Looking first at the overall home sales data above, I'm noting a few things of interest... [1] Home sales are still slowing. We saw a 28% decline in home sales this January, with only 75 home sales as compared to 104 last January. When we stretch the window out a bit further to three months (November through January) we see an even larger, 35% decline in the number of homes selling in Harrisonburg and Rockingham County. [2] When we look at a full year of data (February through January) we see a smaller, 8%, decline in the number of homes selling in our market, though this may become a larger decline as we continue through the year. [3] Despite fewer homes selling, home prices keep on rising! The median sales price has risen 11% over the past year, and even if you narrow the focus down to the past three months (when home sales were slower) the median sales price was 10% higher than during the same three months one year prior. So, home sales are definitely slowing, but home prices are definitely still rising. Now let's start to slide into some graphs to further understand these most recent trends... 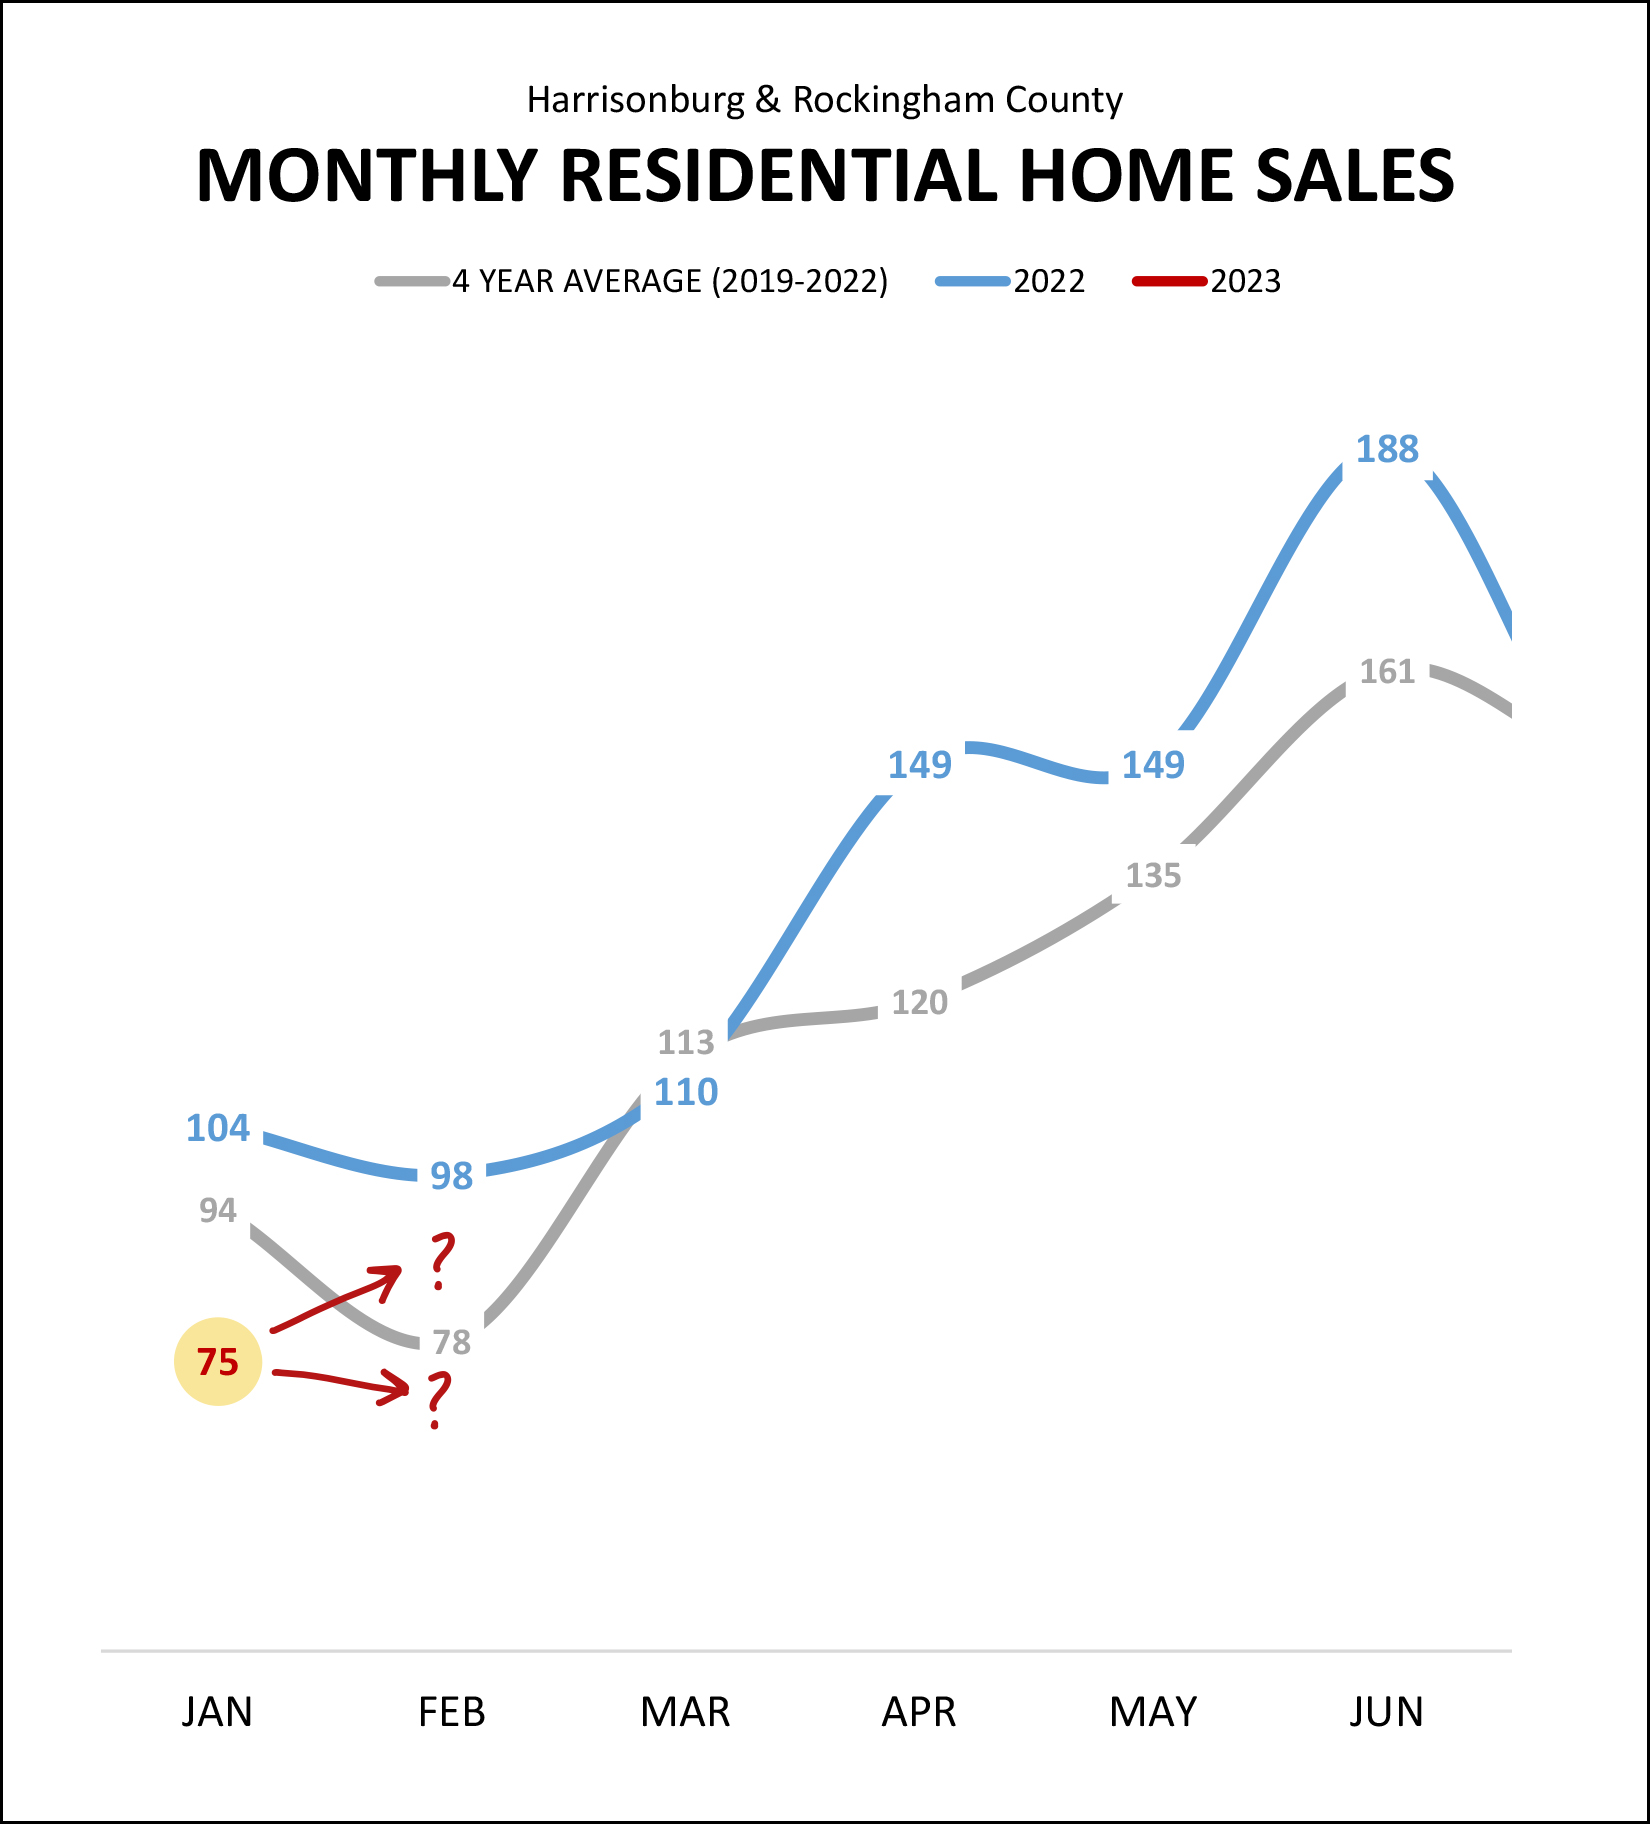 The 75 home sales seen in January 2023 (the red "75" above) marked a significant decline from last year's 104 January home sales. If we look back a bit further, and average out the number of January home sales between 2019 and 2022 we find an average of 94 home sales in January... and we also fell short of that bar in January 2023. Where do we go from here? Interestingly, we usually see a decline in home sales between January and February... so will we see fewer than 75 home sales in February 2023? Or will we see a reversal of that trend and see more than 75 home sales this month? Stay tuned! Here's a visual reminder of how much things have changed over the past two years... 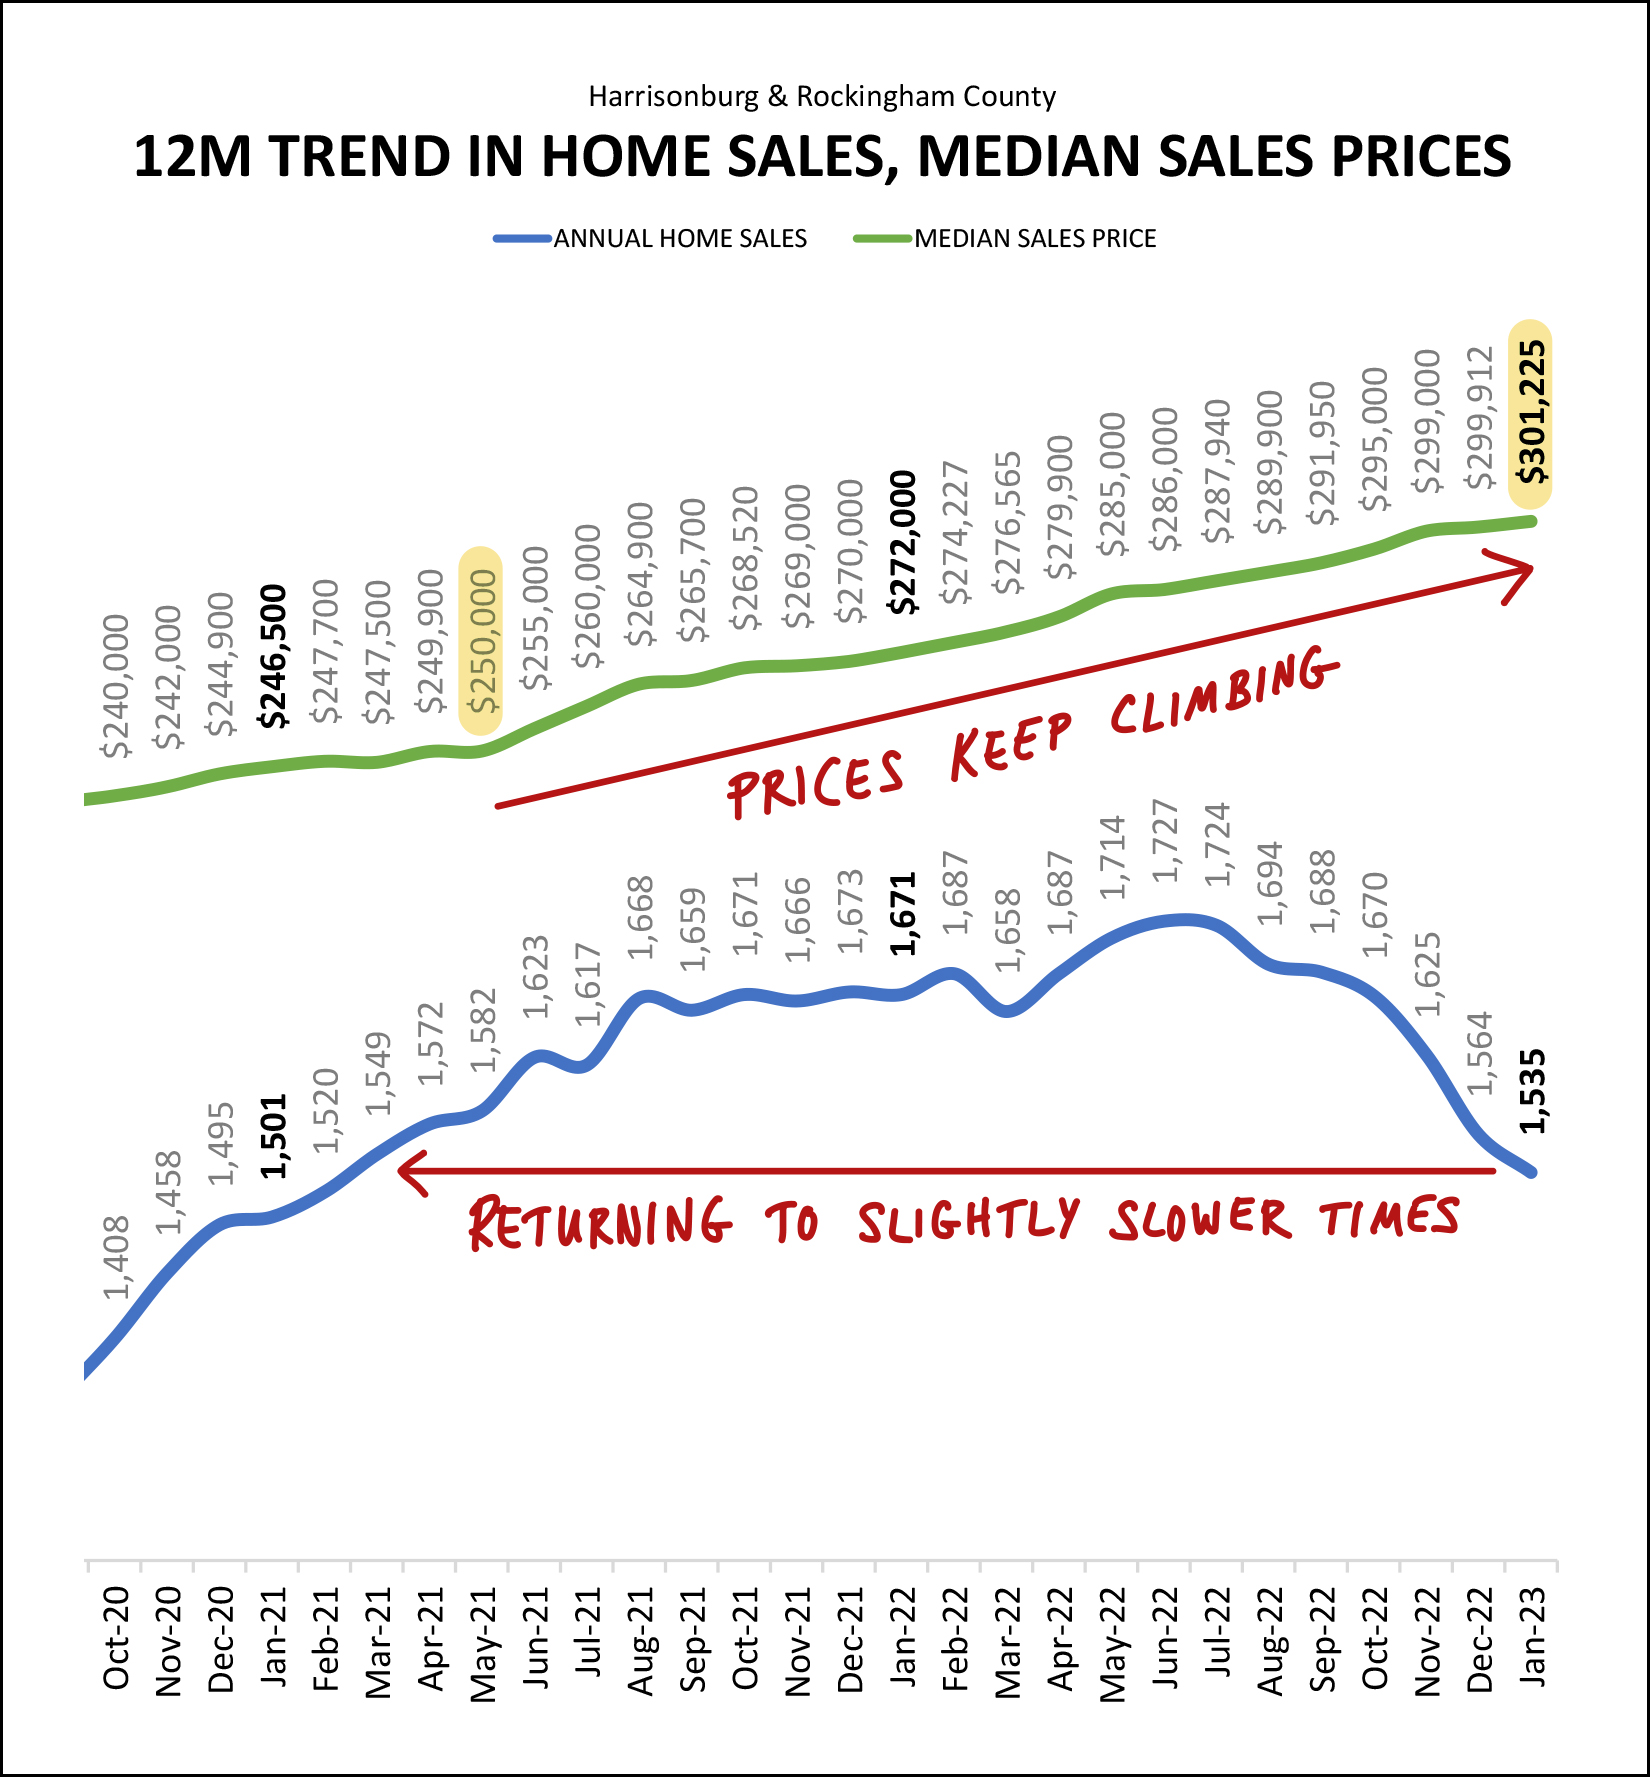 A little less than two years ago, the median sales price in Harrisonburg and Rockingham County was only $250,000. Now, less than two years later, it has just surpassed $300,000! But yet, despite the steady increases in the price of homes in our area, we have seen significant ups and downs relative to how many homes are selling. As per the blue line above, we flew past 1,500 home sales a year about two years ago -- saw that annual pace of home sales climb all the way up to 1,727 home sales per year -- before declining even more rapidly to the current annual pace of 1,535 home sales per year. What does the rest of 2023 have in store for us? I'm predicting that we'll see continued (slower) increases in the median sales price -- and continued (slower) decreases in the number of homes selling in Harrisonburg and Rockingham County. One interesting dynamic to watch in 2023 seems to be the mix between new home sales and existing home sales... 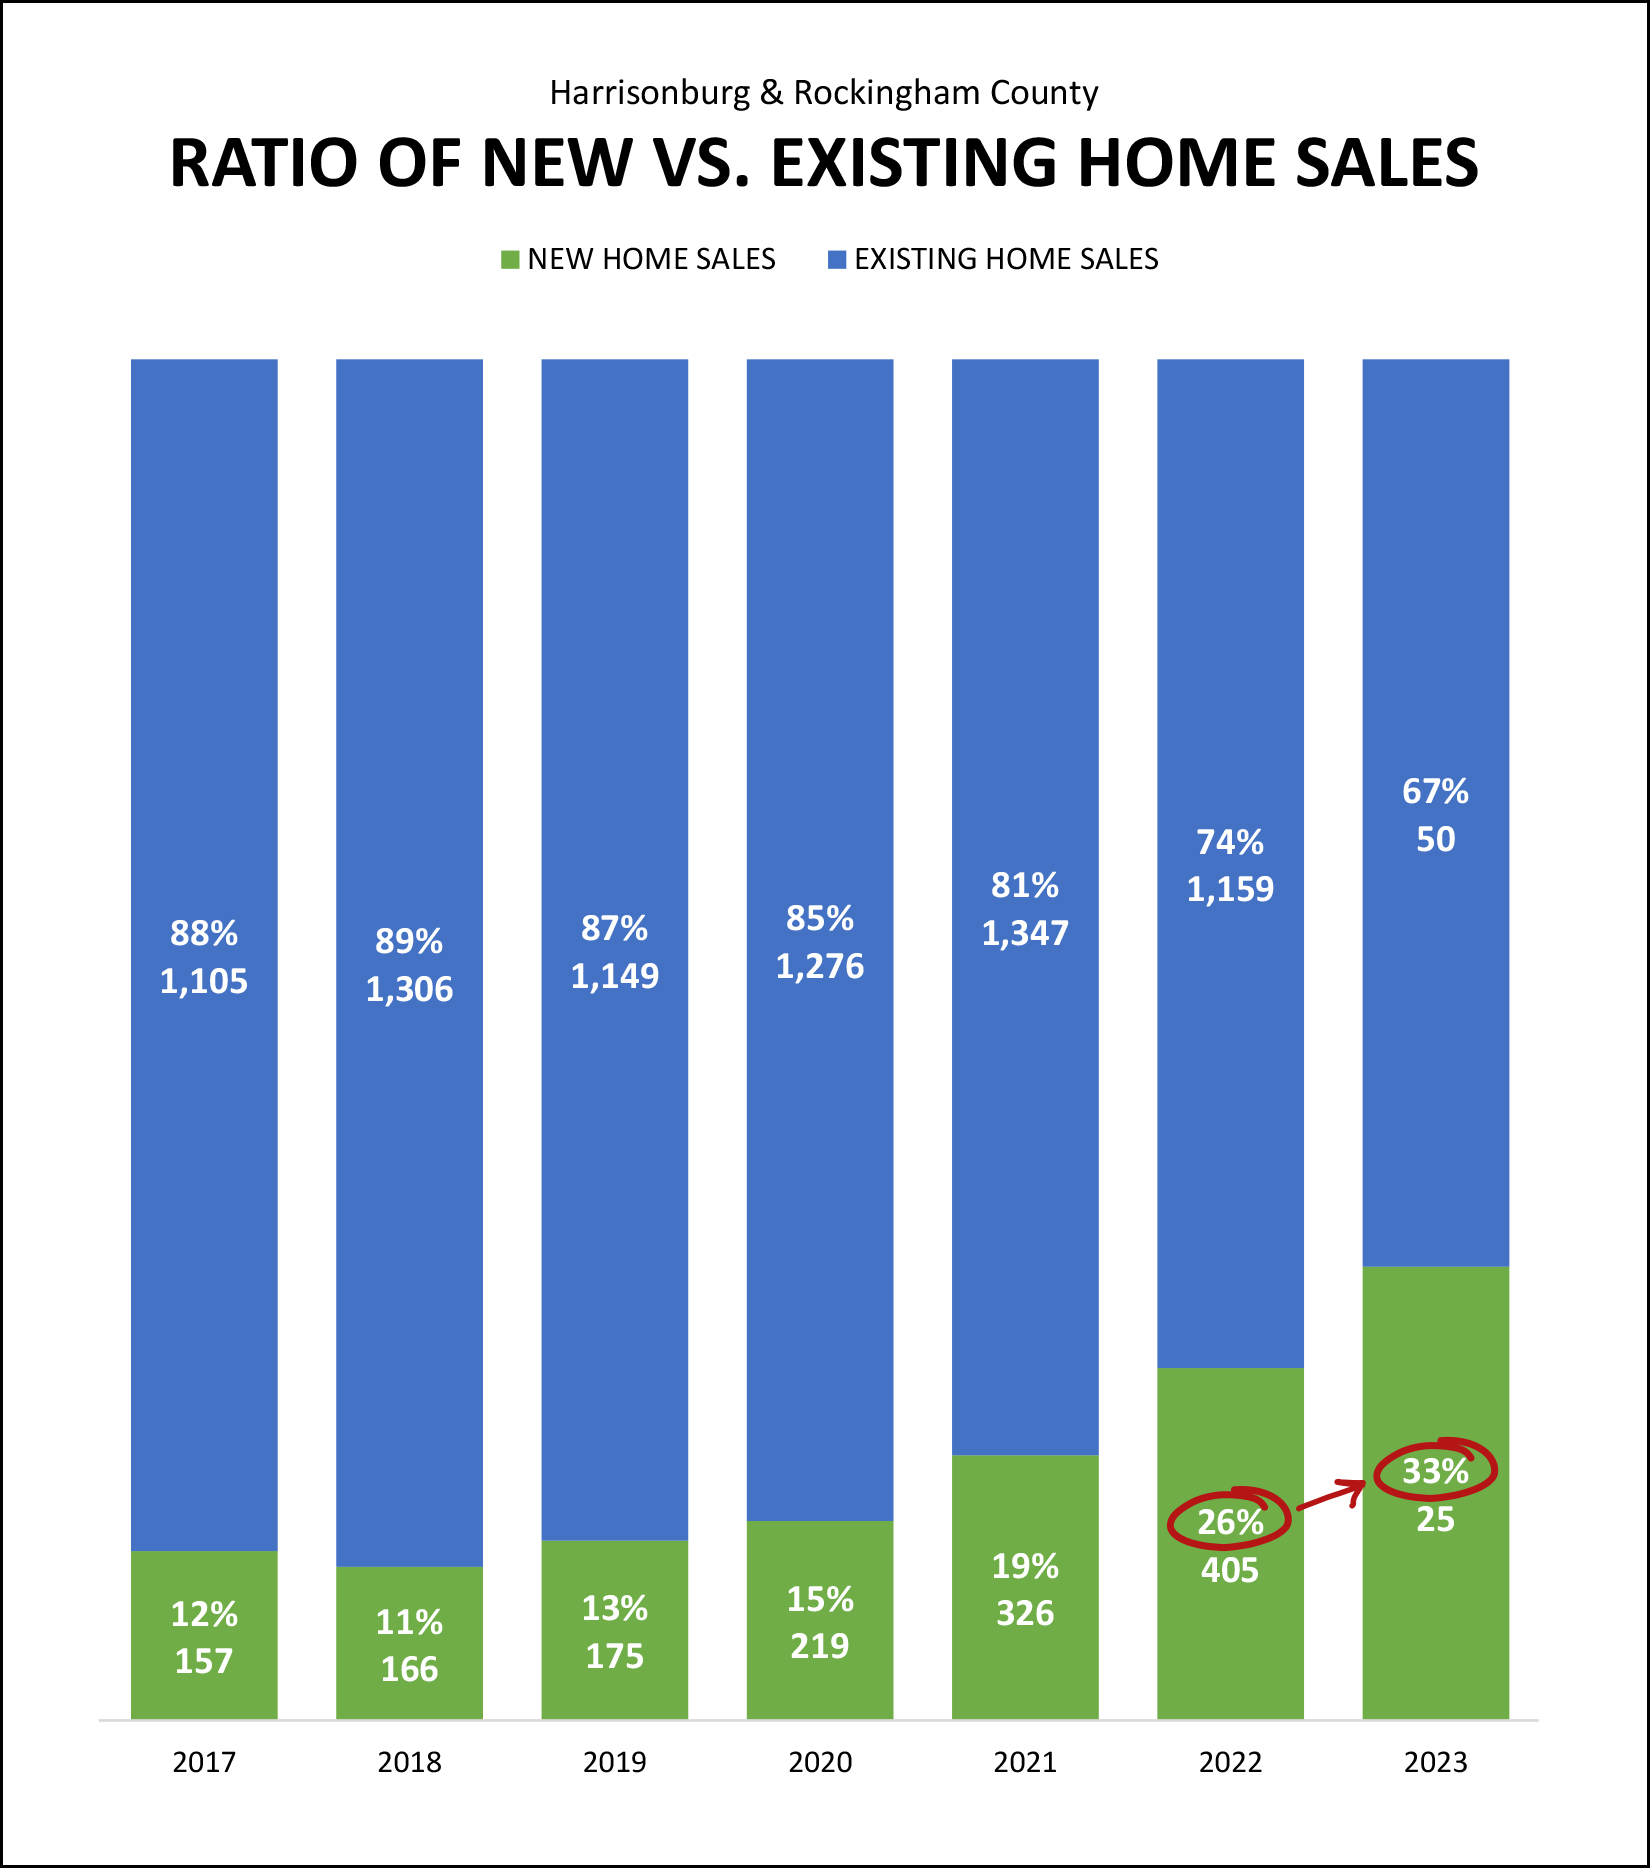 For each of the past four years we have seen an increase in the share of new home sales in Harrisonburg and Rockingham County. Back in 2018, only 11% of the homes that sold were new homes -- but last year (2022) that rose all the way up to 26% of home sales being new homes. With only one month of data thus far it is probably too early to draw any significant conclusions yet about 2023, but in January 33% of the homes that sold were new homes. To get some glimpse of what the next few months might look like for how many homes are selling, we can take a peek at contract activity... 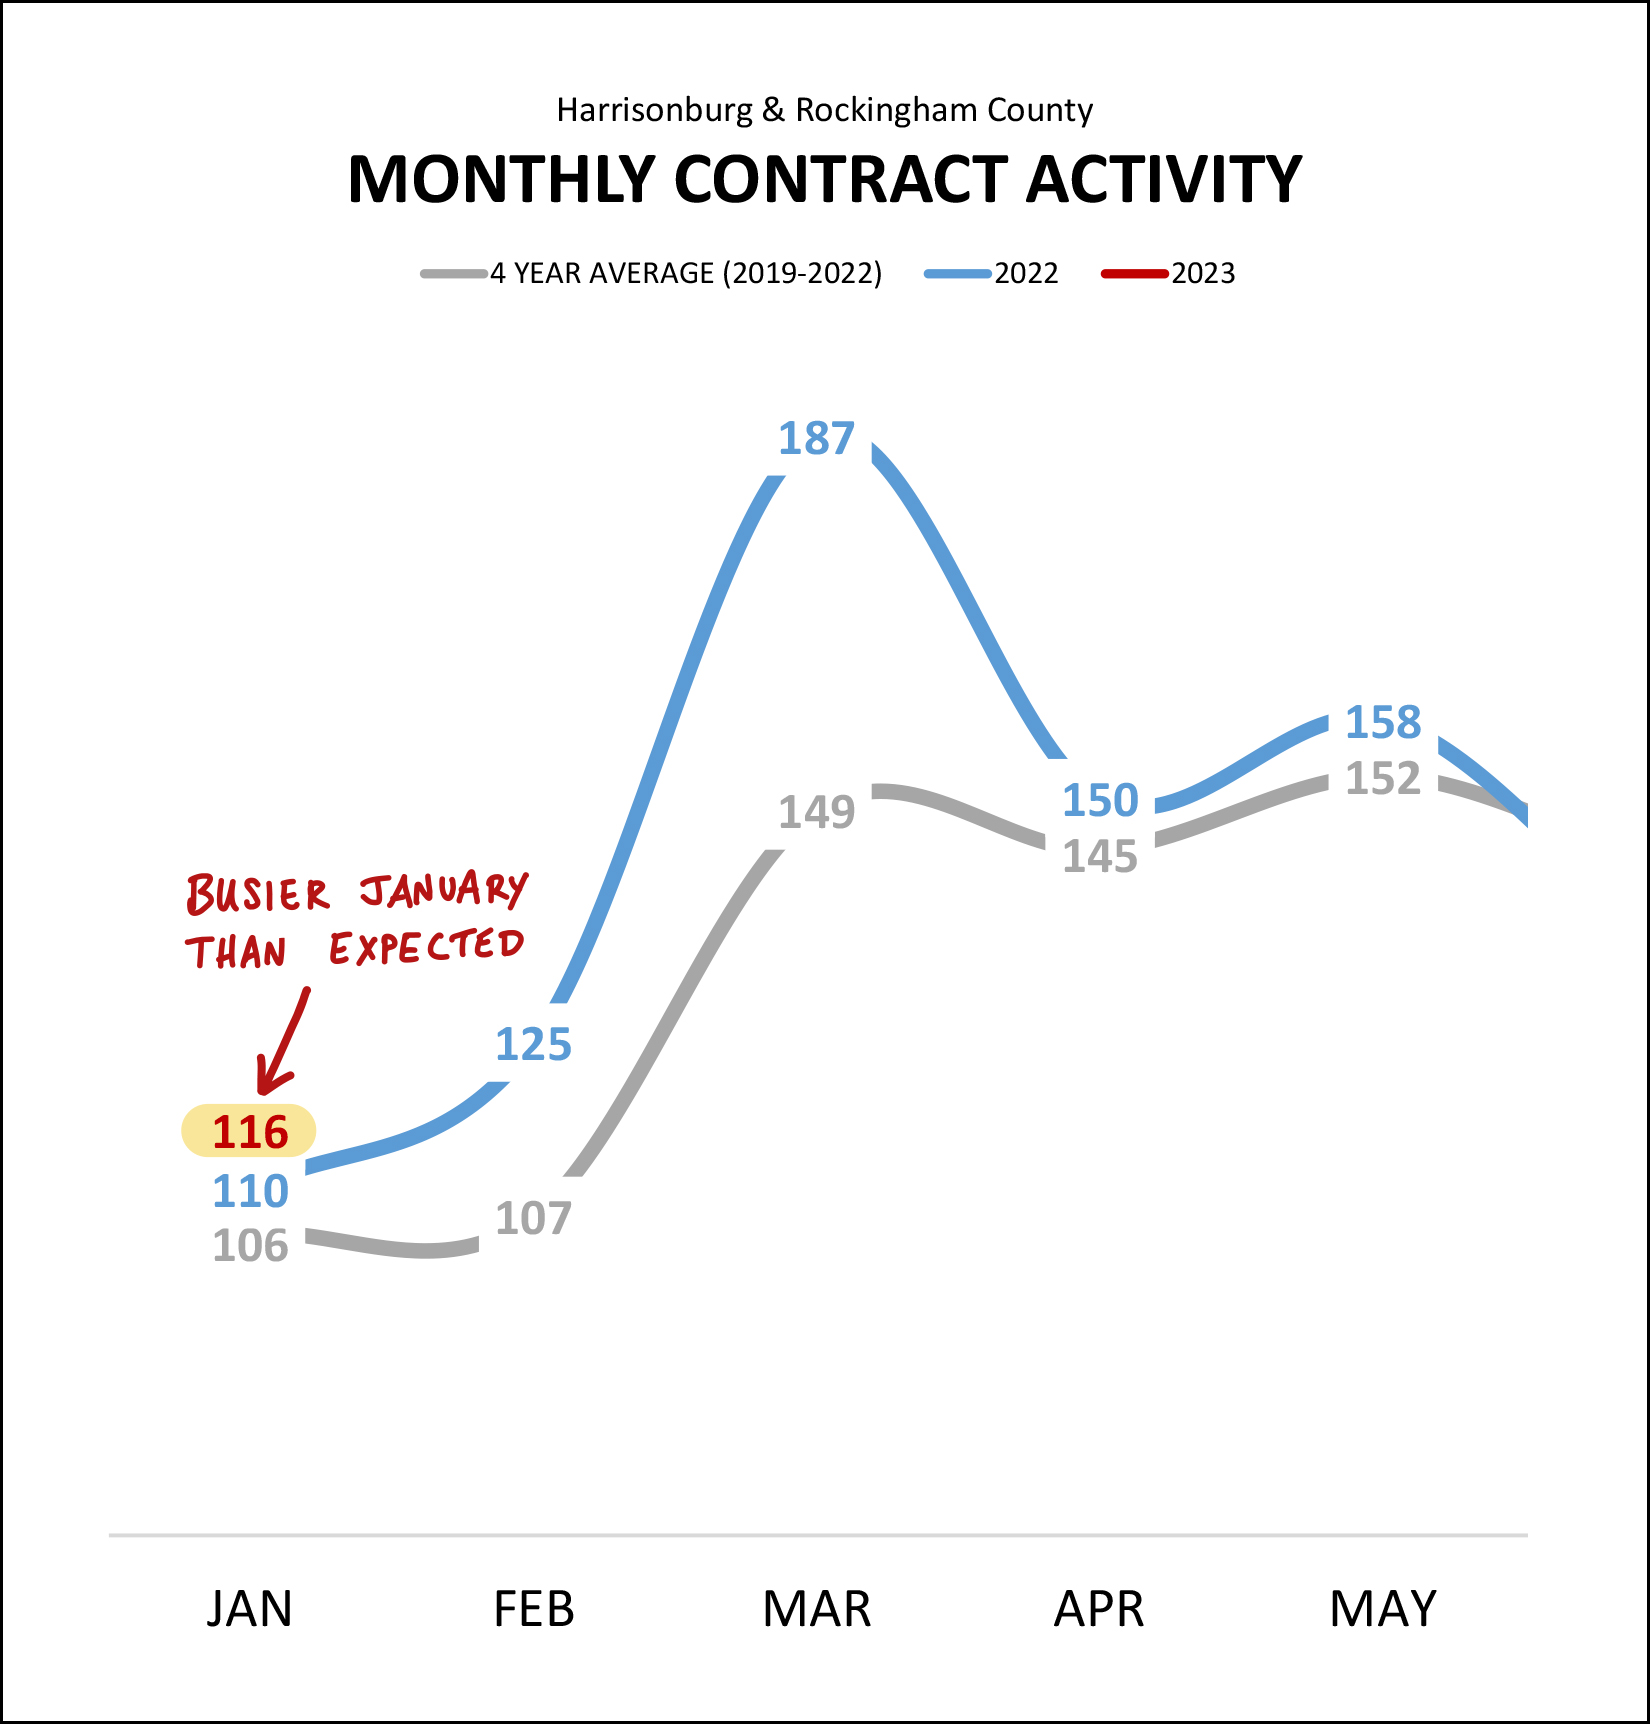 And... surprise! :-) Despite lower than expected home sales activity in January... we saw higher than expected contract activity! Over the past four years (2019-2022) we have seen an average of 106 contracts per month signed in January. Last January (2022) we saw 110 contracts signed. This January that monthly contract figure rose to 116, making it a busier January (for contract signing) than we might have otherwise expected. It's possible that declines in mortgage interest rates (referenced again later on) helped spur on some of that January contract activity. Another interesting trend to watch is the number of pending sales at any given time... 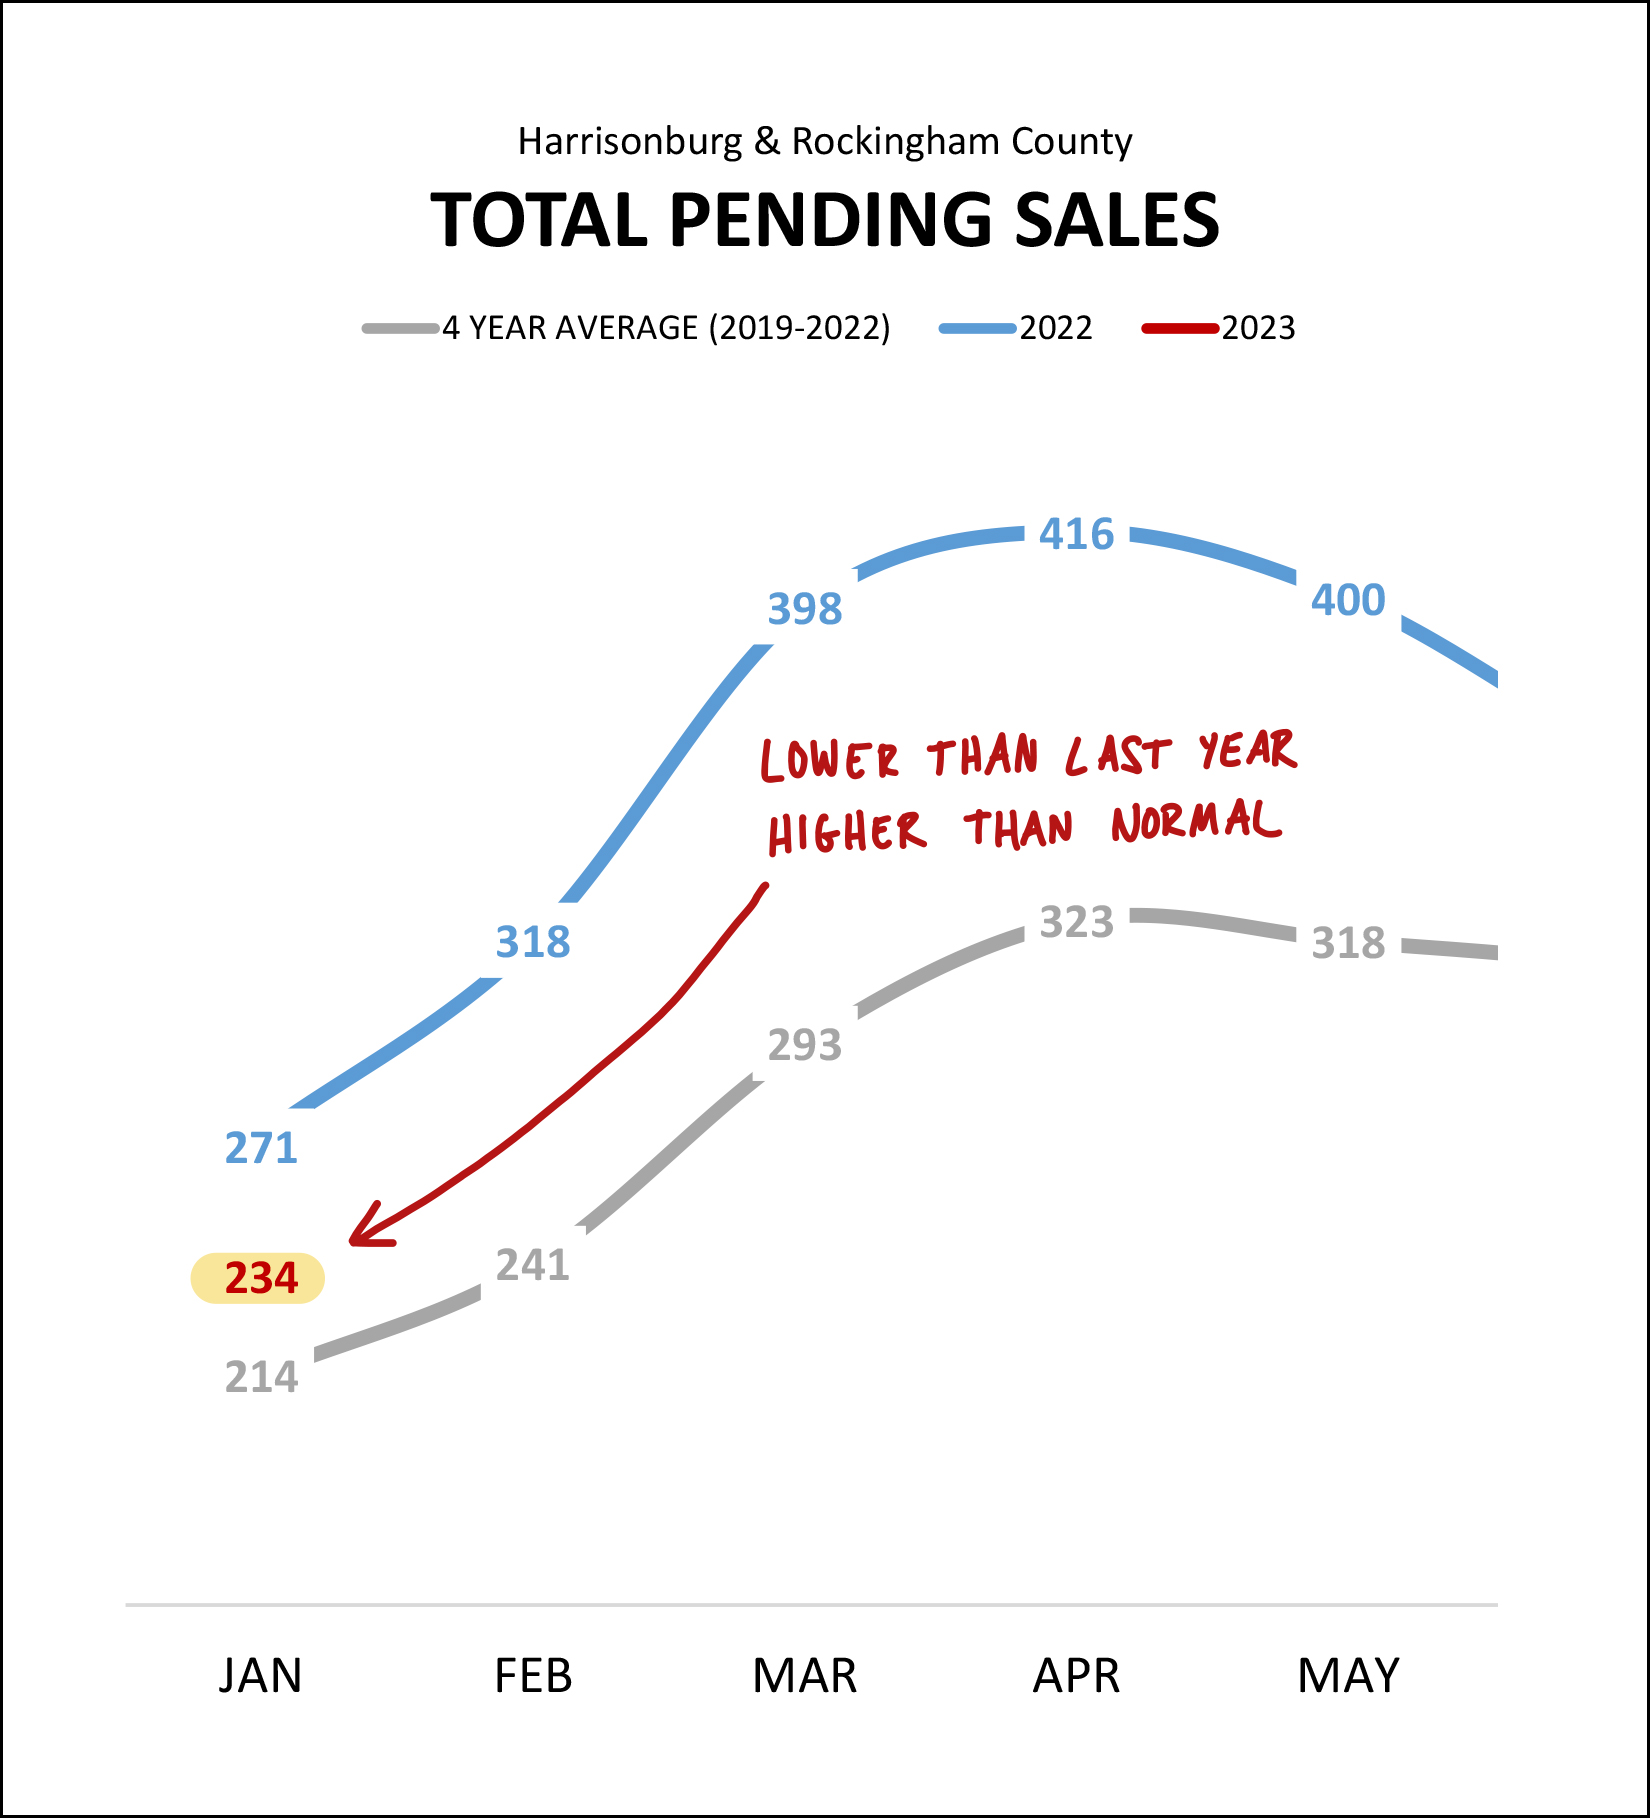 A "pending sale" is a house that is under contract, waiting to get to closing to become a home sale. One year ago there were 271 pending sales in Harrisonburg and Rockingham County. Today there are only 234 pending sales -- which is lower than where we were last year -- but is higher than the average January pending sales figure over the past four years. So, to roughly extrapolate from the past two data sets, home sales in 2023 seem likely to be lower than in 2022, but higher than the average of the past few years. But to be clear, in order for homes to sell, they need to be for sale... 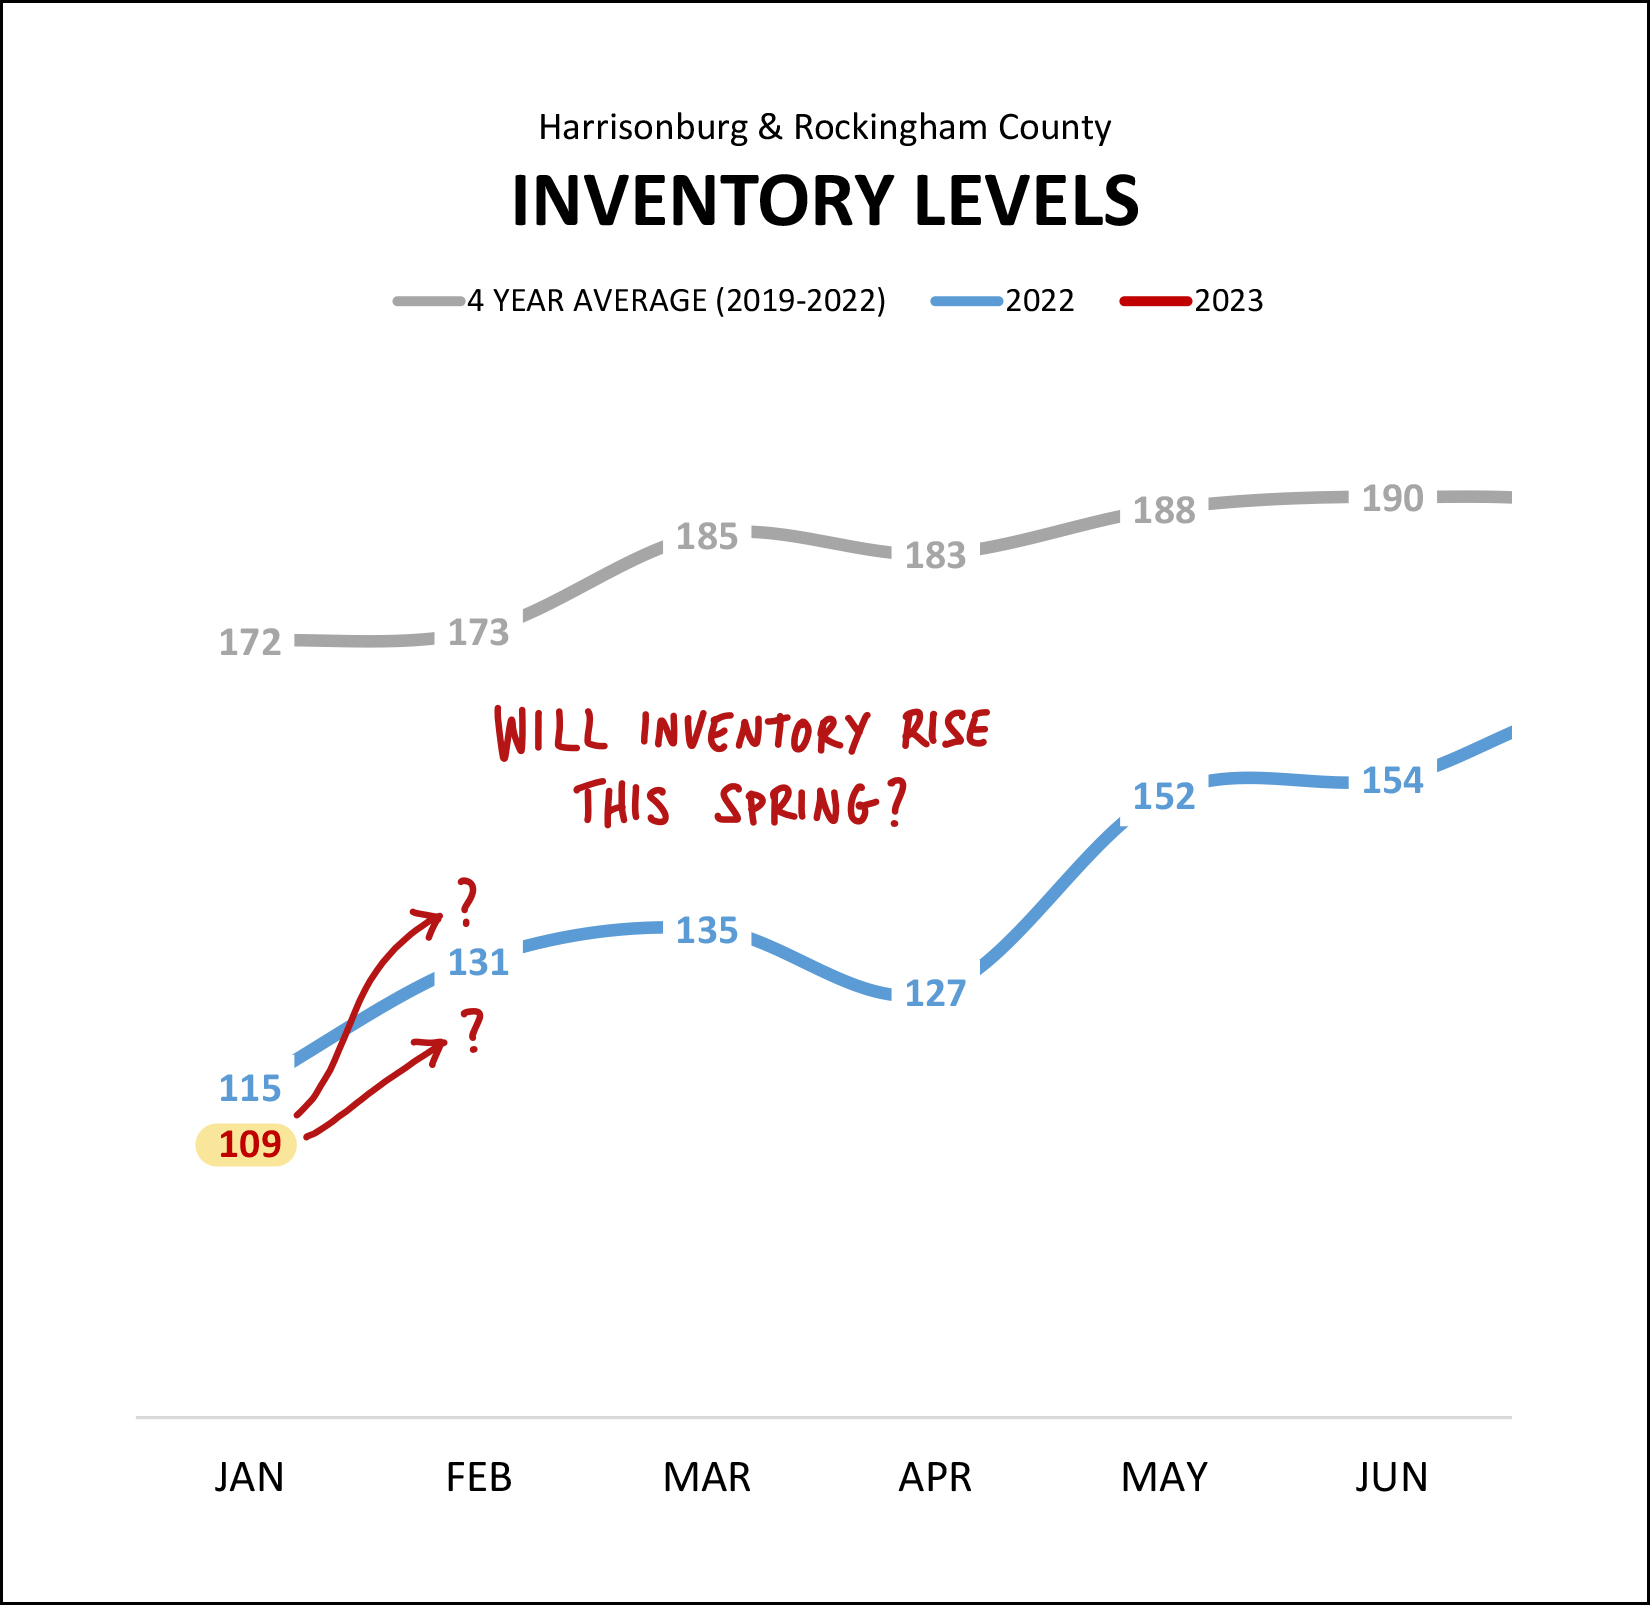 Some folks might observe a decline in sales activity and assume that inventory levels are starting to climb -- with sellers wanting to sell but buyers not wanting to buy. That is not what we are currently observing in the Harrisonburg and Rockingham County real estate market. Fewer sales may very well be equally caused by fewer buyers buying AND fewer sellers selling. There are currently 109 homes on the market for sale (not under contract) which is slightly less than a year ago (115) and much (!) much less than the average over the past four years of 172 homes being listed for sale at this time of year. The big questions for just about every buyer is whether we will start to see meaningful increases in inventory levels as we move into the spring months. Buyers should be encouraged to know that we typically see lots of new listings hitting the market in March, April and May -- but if there are still lots of buyers waiting in the wings for those new listings we may not see inventory levels rise all that much. Lots of new listings plus lots of new contracts will still equate to rather low inventory levels. I mentioned earlier that a slightly higher than expected number of contracts in January might have been related to mortgage interest rates. Take a look at why I'm guessing that might have been the case... 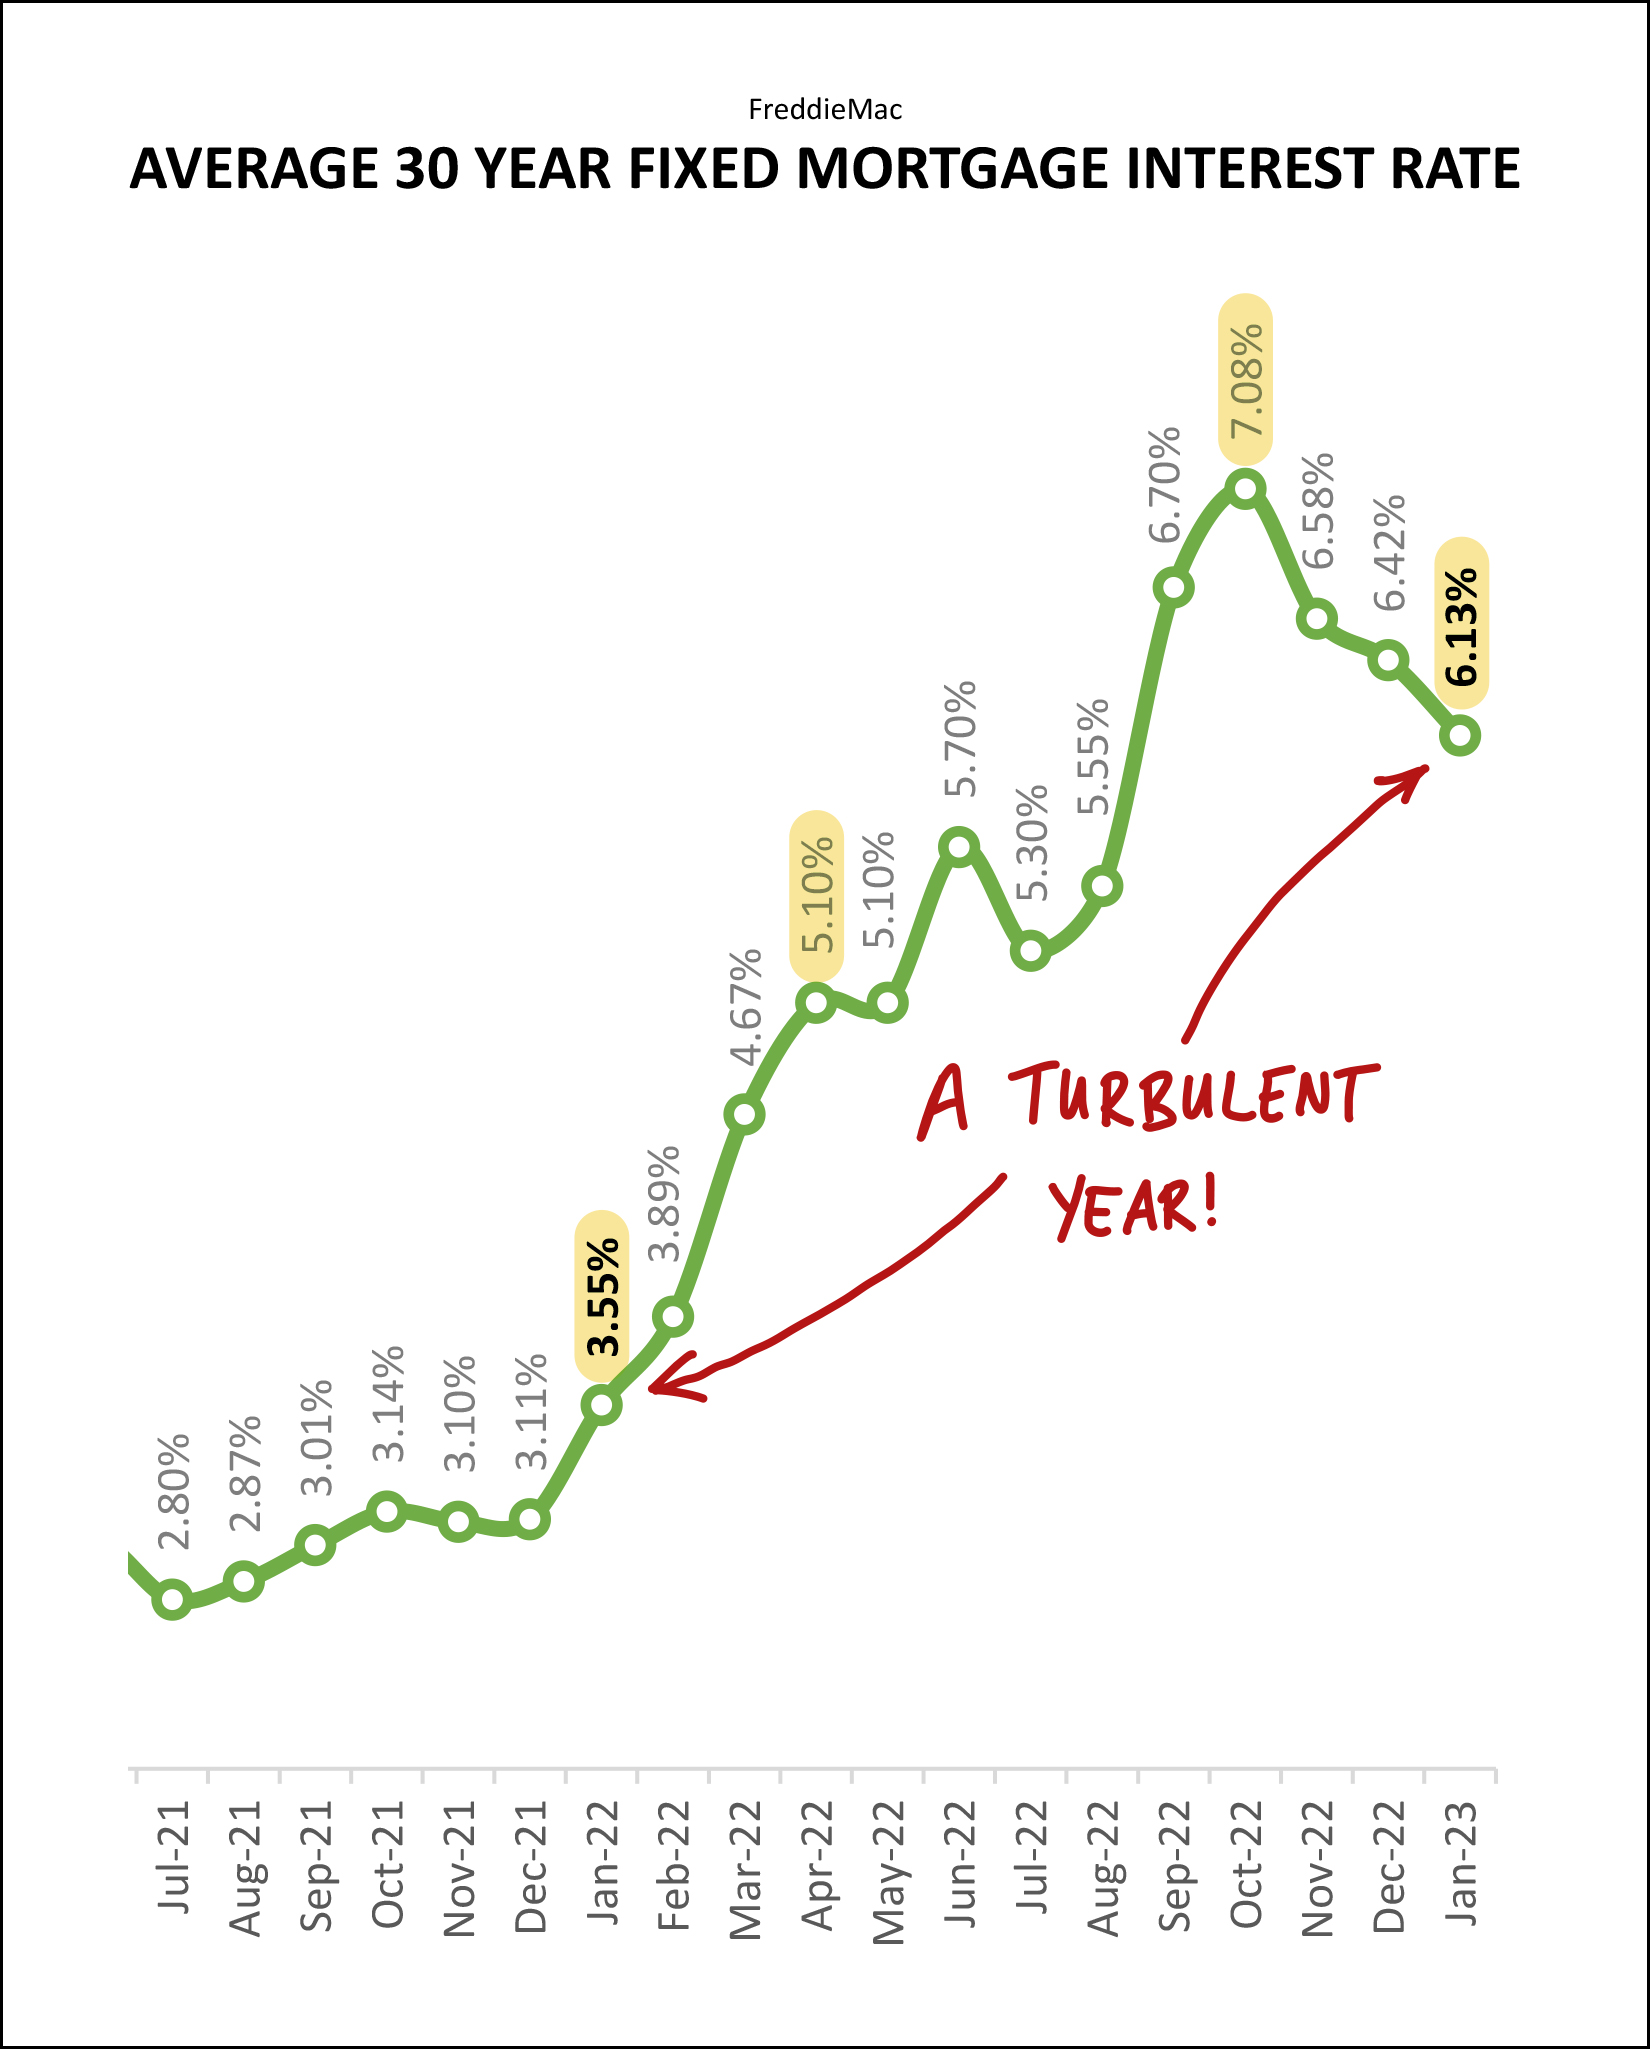 It has been a wild and crazy year with mortgage interest rates. Just a year ago, interest rates were below 4%, then climbed all the way up above 7% and have now decline back towards 6%. Those highest months of interest rates in September, October, November and December almost certainly contributed to the much slower (-35%) months of home sales in November, December and January. The decline over the past three months may have contributed to the increase in contract activity in January 2023. Where will mortgage interest rates be headed in 2023? Probably not above 7%. Probably not below 5%. Probably not anywhere for more than a few weeks in a row. Does that help? Probably not. ;-) Given all of the market data above, when I look ahead to the remainder of 2023, I believe the following will likely be true: [1] We will see fewer home sales than in 2022. [2] Home prices will likely be higher than in 2022. [3] Inventory levels will likely remain low most or all year. [4] The decline in the number of existing home sales will likely be larger than the decline in the total number of existing and new home sales. [5] Mortgage interest rates will likely close out the year lower than where they started the year. As you look ahead to 2023... do you hope to buy a home... or do you plan to sell your current home? If you are thinking about heading down either path, let's find a time to connect soon to talk about your hopes and plans and dreams and how they will be best accomplished amidst the market trends outlined above. Feel free to reach out to start that conversation by emailing me or texting or calling me at 540-578-0102. If you don't plan to buy or sell a home this year, but want to learn more about our local housing market... [1] You can review even more charts and graphs with further analysis of our local housing market here. [2] I publish a variety of articles about the market, new housing developments, and more over on my blog several times a week here. And that's a wrap, folks! I hope you have a wonderful Friday and weekend ahead. Please be in touch if I can be of any help to you -- with real estate or otherwise! | |
| Older Posts |
Scott Rogers
Funkhouser Real
Estate Group
540-578-0102
scott@funkhousergroup.com
Licensed in the
Commonwealth of Virginia
Home Search
Housing Market Report
Harrisonburg Townhouses
Walk Through This Home
Investment Properties
Harrisonburg Foreclosures
Property Transfers
New Listings

